Memorandum - · - 1 - Memorandum TO: WTP 2035 Project Team FROM: Cambridge Systematics DATE:...
25
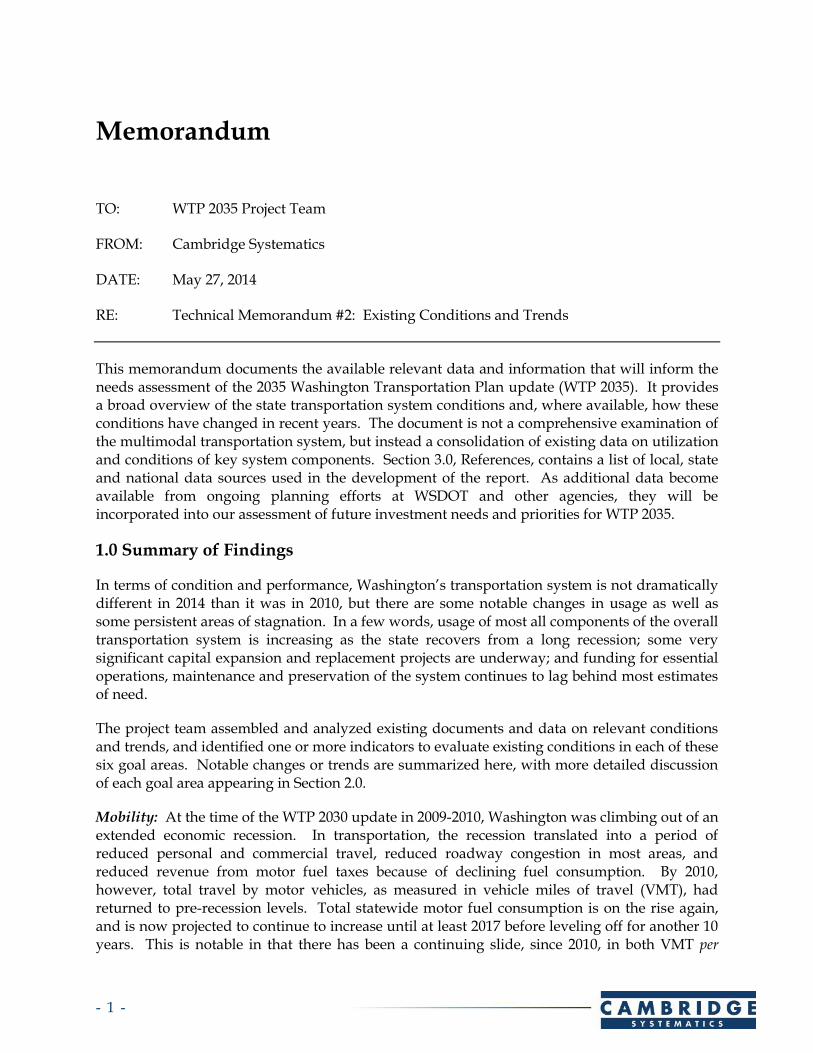
- 1 - Memorandum TO: WTP 2035 Project Team FROM: Cambridge Systematics DATE: May 27, 2014 RE: Technical Memorandum #2: Existing Conditions and Trends This memorandum documents the available relevant data and information that will inform the needs assessment of the 2035 Washington Transportation Plan update (WTP 2035). It provides a broad overview of the state transportation system conditions and, where available, how these conditions have changed in recent years. The document is not a comprehensive examination of the multimodal transportation system, but instead a consolidation of existing data on utilization and conditions of key system components. Section 3.0, References, contains a list of local, state and national data sources used in the development of the report. As additional data become available from ongoing planning efforts at WSDOT and other agencies, they will be incorporated into our assessment of future investment needs and priorities for WTP 2035. 1.0 Summary of Findings In terms of condition and performance, Washington’s transportation system is not dramatically different in 2014 than it was in 2010, but there are some notable changes in usage as well as some persistent areas of stagnation. In a few words, usage of most all components of the overall transportation system is increasing as the state recovers from a long recession; some very significant capital expansion and replacement projects are underway; and funding for essential operations, maintenance and preservation of the system continues to lag behind most estimates of need. The project team assembled and analyzed existing documents and data on relevant conditions and trends, and identified one or more indicators to evaluate existing conditions in each of these six goal areas. Notable changes or trends are summarized here, with more detailed discussion of each goal area appearing in Section 2.0. Mobility: At the time of the WTP 2030 update in 2009-2010, Washington was climbing out of an extended economic recession. In transportation, the recession translated into a period of reduced personal and commercial travel, reduced roadway congestion in most areas, and reduced revenue from motor fuel taxes because of declining fuel consumption. By 2010, however, total travel by motor vehicles, as measured in vehicle miles of travel (VMT), had returned to pre-recession levels. Total statewide motor fuel consumption is on the rise again, and is now projected to continue to increase until at least 2017 before leveling off for another 10 years. This is notable in that there has been a continuing slide, since 2010, in both VMT per
Transcript of Memorandum - · - 1 - Memorandum TO: WTP 2035 Project Team FROM: Cambridge Systematics DATE:...
- 1 -
Memorandum
TO: WTP 2035 Project Team
FROM: Cambridge Systematics
DATE: May 27, 2014
RE: Technical Memorandum #2: Existing Conditions and Trends
This memorandum documents the available relevant data and information that will inform the needs assessment of the 2035 Washington Transportation Plan update (WTP 2035). It provides a broad overview of the state transportation system conditions and, where available, how these conditions have changed in recent years. The document is not a comprehensive examination of the multimodal transportation system, but instead a consolidation of existing data on utilization and conditions of key system components. Section 3.0, References, contains a list of local, state and national data sources used in the development of the report. As additional data become available from ongoing planning efforts at WSDOT and other agencies, they will be incorporated into our assessment of future investment needs and priorities for WTP 2035.
1.0 Summary of Findings
In terms of condition and performance, Washington’s transportation system is not dramatically different in 2014 than it was in 2010, but there are some notable changes in usage as well as some persistent areas of stagnation. In a few words, usage of most all components of the overall transportation system is increasing as the state recovers from a long recession; some very significant capital expansion and replacement projects are underway; and funding for essential operations, maintenance and preservation of the system continues to lag behind most estimates of need.
The project team assembled and analyzed existing documents and data on relevant conditions and trends, and identified one or more indicators to evaluate existing conditions in each of these six goal areas. Notable changes or trends are summarized here, with more detailed discussion of each goal area appearing in Section 2.0.
Mobility: At the time of the WTP 2030 update in 2009-2010, Washington was climbing out of an extended economic recession. In transportation, the recession translated into a period of reduced personal and commercial travel, reduced roadway congestion in most areas, and reduced revenue from motor fuel taxes because of declining fuel consumption. By 2010, however, total travel by motor vehicles, as measured in vehicle miles of travel (VMT), had returned to pre-recession levels. Total statewide motor fuel consumption is on the rise again, and is now projected to continue to increase until at least 2017 before leveling off for another 10 years. This is notable in that there has been a continuing slide, since 2010, in both VMT per
- 2 -
capita and motor vehicle fuel consumption per capita. This suggests that the amount of travel, and motor fuel consumption, by each individual will continue to decline, but that decline is offset by population growth.
Although travel by other modes is up sharply in some areas, auto trips still represent about 83% of all commute trips across the state (2012) down about 1 percentage point from 2008. Public transit and non-motorized travel make up another 12% of commute trips statewide, although this percentage is of course higher in urban areas where most bus and rail transit service is concentrated. Light rail transit trips for example more than doubled in the period 2009-2012 due to service extension, and commuter rail ridership was up 12% in the same period. Traditional urban bus transit, which carries about 87% of all public transit trips, saw no growth in ridership between 2009 and 2012. More recent data suggests that ridership in select areas and routes is up significantly since 2012. Coupled with the decline in VMT per capita, these data do suggest an ongoing shift to alternative modes and shorter trips overall in some areas of the state.
These changing trends in personal travel choices are evident but not yet quite clear in terms of net impact on system demands, nor in terms of their durability over time. Regardless, personal travel trends will vary by region in the state, and long range investment plans will need to reflect the different regions, traveler groups and other factors that cause variation.
Economic Vitality: The Washington State economy is closely linked to the movement of all kinds of freight, including natural resources, agricultural products, and manufactured goods. Annual growth of employment in the state’s freight-dependent industries was back in positive territory in 2011 after three successive years of decline; earnings from those same industries was strongly positive in 2010-11 after several years of flat or negative growth. Exports, an important part of the state economy, are up over 50% since 2010; notably, Washington generated more than 50% of the total U.S. exports of civilian aircraft, engines and parts.
Preservation: Despite a reduction in VMT during the period 2007-2008, physical roadway condition deteriorated somewhat overall in the state, due likely to reduced maintenance and preservation spending. The percentage of state-managed roads with pavement quality rated “good or very good” fell from 83% to 76% over the period 2008-2012. County arterials saw a similar drop, from 94% to 89% rated “fair or better.” City roads held constant at about 81% fair or better. Bridge conditions were more constant over the same period, in part due to more stringent regulations for bridge inspection and maintenance. Both state- and county-maintained bridges were essentially unchanged over the period 2008-2012, at 87% and 84% in good condition, respectively. Statewide, 5% of Washington’s bridges are considered “structurally deficient.”
Safety: Overall, traffic-related fatalities declined since 2005, reflecting most likely a combination of positive impacts from aggressive and multi-faceted highway safety programs, and reduced VMT of the recessionary period. That said, fatalities increased slightly from 2012 to 2013. From 2006 to 2013, there were declines in the percentages of fatal crashes involving drivers under the age of 25, impaired drivers, speeding, and running off the road. Offsetting to some degree these noteworthy improvements in street and highway safety is an increase in
- 3 -
fatalities involving motorcyclists and pedestrians, reflecting the growing popularity of motorcycles and walking as modes of utility (as opposed to recreational) transportation.
Environment: The transportation sector continues to be Washington’s largest consumer of energy, accounting for 44% of total annual energy usage (2009.) Perhaps even more concerning, transportation accounts for 55% of the state’s waste energy, reflecting the overall relative energy inefficiency of internal combustion engines. Transportation is also the largest sector producer of greenhouse gas emissions (GHG) at 32% of total state GHG emissions.
Stewardship: While stewardship addresses maintaining the overall quality, effectiveness and efficiency of the transportation system, funding of transportation operations, maintenance and preservation efforts is perhaps the most significant area of concern for the WTP. Since the WTP 2030 update, there has been little change in the composition of state and local revenue sources. Motor fuel taxes still account for about 53% of direct state transportation revenues, with license, permit, and driver-related fees making up another 28%. All remaining sources account for less than 20% of funding for the state system in 2013, as they did in 2009. At the county and city level, local sources including the property tax make up a much larger percentage of funding.
Public transportation revenues are up about 18% overall since 2008, despite a 6% decline in combined federal and state revenues for transit. Local sources including fares increased by 23% over the same period and now account for 85% of public transit funding. The state contributes about 1% of transit revenues, half its contribution in 2008.
2.0 Existing Conditions by Policy Goal
Economic Vitality
The following indicators are intended to provide insight into transportation system conditions and trends related to the economic vitality statutory transportation policy goal, “to promote and develop transportation systems that stimulate, support, and enhance the movement of people and goods to ensure a prosperous economy”:
Freight-Dependent Jobs – offers an indication of trends regarding the critical link between goods movement and employment in the state, and insight into industry demands on transportation infrastructure.
Washington Exports – provides an indication of the degree to which the state economy is dependent upon access to roadways, seaports, and air terminals, and trends in goods movement-related demands on transportation infrastructure.
Commercial Airport Passenger Enplanements – offers an indication of trends in commercial activity linked to air travel and demands on state commercial airports.
Commodity Flows by Mode – provides an assessment of industry reliance on state transportation infrastructure, by mode.
- 4 -
Freight-Dependent jobs, 2006-2011
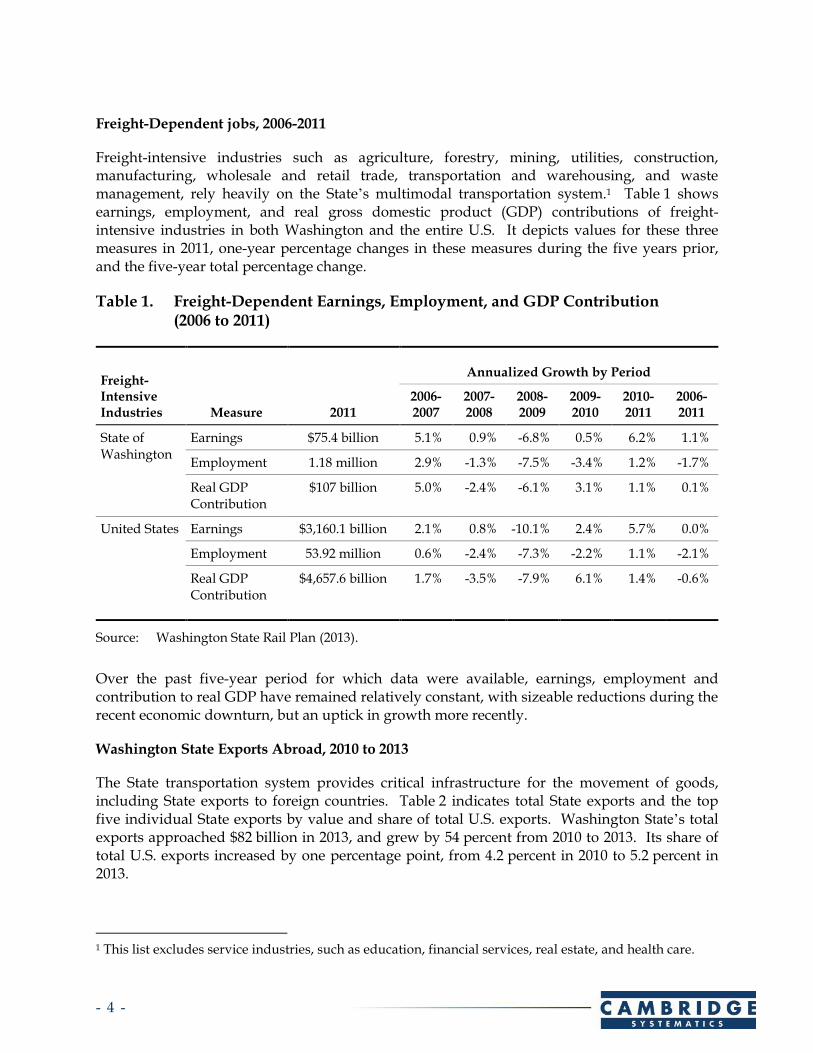
Freight-intensive industries such as agriculture, forestry, mining, utilities, construction, manufacturing, wholesale and retail trade, transportation and warehousing, and waste management, rely heavily on the State’s multimodal transportation system.1 Table 1 shows earnings, employment, and real gross domestic product (GDP) contributions of freight-intensive industries in both Washington and the entire U.S. It depicts values for these three measures in 2011, one-year percentage changes in these measures during the five years prior, and the five-year total percentage change.
Table 1. Freight-Dependent Earnings, Employment, and GDP Contribution (2006 to 2011)
Freight-Intensive Industries Measure 2011
Annualized Growth by Period
2006-2007
2007-2008
2008-2009
2009-2010
2010-2011
2006-2011
State of Washington
Earnings $75.4 billion 5.1% 0.9% -6.8% 0.5% 6.2% 1.1%
Employment 1.18 million 2.9% -1.3% -7.5% -3.4% 1.2% -1.7%
Real GDP Contribution
$107 billion 5.0% -2.4% -6.1% 3.1% 1.1% 0.1%
United States Earnings $3,160.1 billion 2.1% 0.8% -10.1% 2.4% 5.7% 0.0%
Employment 53.92 million 0.6% -2.4% -7.3% -2.2% 1.1% -2.1%
Real GDP Contribution
$4,657.6 billion 1.7% -3.5% -7.9% 6.1% 1.4% -0.6%
Source: Washington State Rail Plan (2013).
Over the past five-year period for which data were available, earnings, employment and contribution to real GDP have remained relatively constant, with sizeable reductions during the recent economic downturn, but an uptick in growth more recently.
Washington State Exports Abroad, 2010 to 2013
The State transportation system provides critical infrastructure for the movement of goods, including State exports to foreign countries. Table 2 indicates total State exports and the top five individual State exports by value and share of total U.S. exports. Washington State’s total exports approached $82 billion in 2013, and grew by 54 percent from 2010 to 2013. Its share of total U.S. exports increased by one percentage point, from 4.2 percent in 2010 to 5.2 percent in 2013.
1 This list excludes service industries, such as education, financial services, real estate, and health care.

- 5 -
Table 2. Washington State Aggregated and Top Five Individual Exports Abroad, by Value and Share of U.S. Total, 2010 to 2013 Values in Millions of 2013 Dollars
Export 2010 2011 2012 2013
Total Washington Exports $53,345 $64,774 $75,619 $81,939
% Share of U.S. Total 4.2% 4.4% 4.9% 5.2%
Civilian Aircraft, Engines, and Parts $23,199 $27,083 $36,724 $43,068
% Share of U.S. Total 43.5% 41.8% 48.6% 52.6%
Soybeans – – $5,478 $4,599
% Share of U.S. Total – – 7.2% 5.6%
Petroleum oils and oils obtained from Bituminous Minerals (not Crude)
$1,154 $2,443 $2,300 $3,267
% Share of U.S. Total 2.2% 3.8% 3.0% 4.0%
Wheat and Meslin – – $2,534 $2,434
% Share of U.S. Total – – 3.4% 3.0%
Untreated Coniferous Wood $680 $990 $732 $1,078
% Share of U.S. Total 1.3% 1.5% 1.0% 1.3%
Source: United States Census, Foreign Trade, State by 6-Digit Harmonized Commodity Description and Coding System (HS) Code.

- 6 -
Commercial Airport Passenger Enplanements, 2011 to 2012
Table 3 indicates Washington airport passenger enplanements in 2011 and 2012. Airplane passenger enplanements from commercial airports within Washington State rose slightly from 2011 to 2012. Seattle-Tacoma leads the state in commercial enplanements with over 16.1 million in 2012, followed distantly by Spokane (1.5 million).
Table 3. Washington Commercial Airport Passenger Enplanements, 2011 to 2012
City Airport Name 2011
Enplanements 2012
Enplanements %
Change National
Rank
All Washington Airports 18,598,422 18,745,231 0.79% –
Seattle Seattle-Tacoma International 15,971,676 16,121,123 0.94% 15
Spokane Spokane International 1,487,913 1,456,279 -2.13% 72
Bellingham Bellingham International 515,402 577,028 11.96% 113
Pasco Tri-Cities 327,008 329,833 0.86% 144
Yakima Yakima Air Terminal/McAllister Field
55,902 57,673 3.17% 261
Source: United States Federal Aviation Administration, Calendar Year Passenger Enplanements at All U.S. Airports, by State.
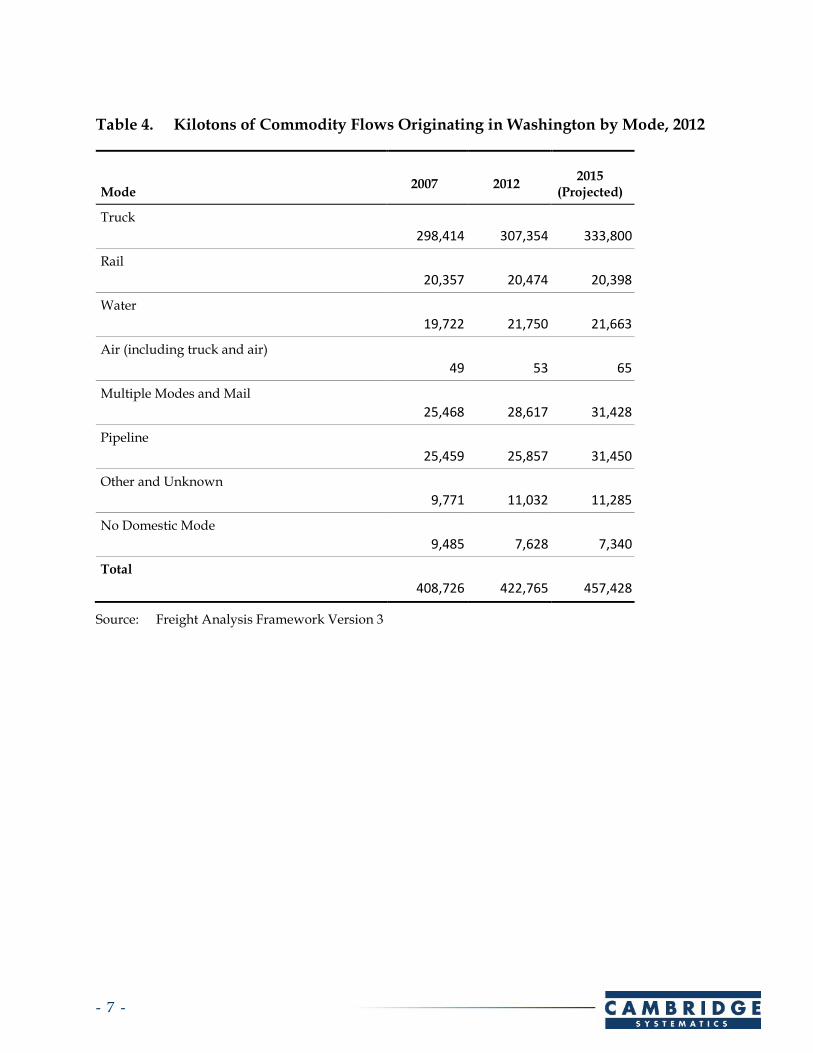
Commodity Flows Originating in Washington by Mode, 2012
Table 4 disaggregates the weights, in kilotons, of commodity flows by mode of transportation. It includes only commodities originating in Washington State.2 Total tonnage increased 3% from 2007 to 2012, and is expected to grow 12% from 2007 to 2015.
Figure 1 (following Table 4) depicts Washington’s strategic freight corridors, which carry a substantial portion of its commodity flows. The Washington State Freight Mobility Strategic Investment Board (FMSIB) oversees freight movement in the state and designates strategic freight corridors. T-1 Freight Corridors carry more than 10 million tons per year, and T-2 Freight Corridors carry 4 million to 10 million tons per year.
2 Note that preliminary 2012 Commodity Flow Survey data was unavailable when this memorandum was
finalized, but is expected in late 2014.
- 7 -
Table 4. Kilotons of Commodity Flows Originating in Washington by Mode, 2012
Mode 2007 2012
2015 (Projected)
Truck 298,414
307,354
333,800
Rail 20,357
20,474
20,398
Water 19,722
21,750
21,663
Air (including truck and air) 49
53
65
Multiple Modes and Mail 25,468
28,617
31,428
Pipeline 25,459
25,857
31,450
Other and Unknown 9,771
11,032
11,285
No Domestic Mode 9,485
7,628
7,340
Total 408,726
422,765
457,428
Source: Freight Analysis Framework Version 3

- 8 -
Figure 1 State Strategic Freight Corridors
Source: 2013 Update of Washington State Freight Mobility Strategic Investment Board Strategic Freight Corridors. T-1 Freight Corridors carry more than 10 million tons per year, and T-2 Freight Corridors carry 4 million to 10 million tons per year.
- 9 -
Preservation
The following indicators are intended to provide insight into transportation system conditions and trends related to the preservation statutory planning goal, “to maintain, preserve, and extend the life and utility of prior investments in transportation systems and services”:
Roadway Lane and Centerline Miles – provides an overview of the size and scope of the existing roadway network maintenance burden in the state.
Road and Bridge Conditions – offers insight into the backlog of roadway-related maintenance and preservation needs in the state
Roadway Lane and Centerline Miles, 2012
Table 5 conveys the overall size of the road network and share of total by jurisdiction. Centerline miles aggregate all roads equally; whereas lane miles weigh roads based on number of lanes. Counties oversee the most roadways in terms of centerline (46.9 percent) and lane miles (45.3 percent). The State manages 8.4 percent of centerline miles and 10.7 percent of its lane miles.
Table 5. Washington State Roadway Centerline and Lane Miles, 2012
Jurisdiction Level Centerline Miles Lane Miles
State Totala 7,054 8.4% 18,659 10.7%
(Interstate) (764) (0.9%) (4,029) (2.3%)
City 18,525 22.1% 38,598 22.2%
County 39,336 46.9% 78,898 45.3%
Otherb 18,962 22.6% 37,927 21.8%
Total 83,878 100.0% 174,082 100.0%
a Interstate figures are also included in the state total.
b Other jurisdictions include state parks, other state, port districts, tribal governments, U.S. forest, and national parks.
Source: WSDOT 2012 Annual Mileage and Travel Information.
Road and Bridge Conditions
The percentage of roadways in good/very good condition, a commonly used transportation engineering metric, approximates the proportion of roads that do not currently need more than routine maintenance (i.e., do not yet require pavement rehabilitation or replacement.) Figure 2 indicates that the percentage of state-managed roadways in good/very good condition fell from 83 percent in 2008 to 76 percent in 2012. By 2018, WSDOT forecasts that a majority of state-managed roadways will be in need of rehabilitation or replacement.

- 10 -
Figure 2. Percentage of State Roadways with Pavement in Good/Very Good Condition, 2008 to 2018
Source: WSDOT Gray Notebook, December 2012 and December 2013.
County-managed pavement conditions have declined slightly over the same time frame. The proportion of county-managed pavement in fair or better condition was 92 percent on county collectors and 89 percent for county arterials in 2012, down from 96 percent and 94 percent, respectively, in 2008.
City-managed pavement conditions have remained relatively consistent. The proportion of city-managed pavement in fair or better condition was 76 percent for collectors and 81 percent for arterials in 20103, compared to 75 percent and 82 percent in 2008 (WSDOT Gray Notebook, December 2012 and December 2013).
The percentage of bridges in good condition has been relatively consistent. As of 2012, 87 percent of state bridges and 84 percent of county bridges were in good condition. As of 2010, 76 percent of city bridges were in good condition. In 2008, 88 percent of state bridges, 85 percent of county bridges, and 78 percent of city bridges were in good condition. In 2013, 366, or 5 percent, of Washington’s bridges were structurally deficient (WSDOT Gray Notebook, June 2008 & June 2013).
The American Society of Civil Engineers (ASCE) assigns infrastructure grades to the United States and, more recently, to individual states.4 In 2013, ASCE rated WA’s overall infrastructure
3 Data on city-managed roads was incomplete for year 2012. 4 For information on the ASCE grading scale, please see Section 3.0 References.
0
10
20
30
40
50
60
70
80
90
100
2008 2012 2018 (Projected)
Pe
rce
nta
ge

- 11 -
a “C” and the U.S. overall infrastructure a “D+.” Overall infrastructure includes energy, water, waste, and school infrastructure, as well as the transportation network. According to ASCE, Washington’s lowest grades came in Roads and Transit, similar to 2009, the year of the previous such report, when the State’s top three concerns were roads, bridges, and mass transit. In 2013, Washington rated lower than the U.S. average in Bridges and Rail. ASCE attributed the below-average rail grade to congestion in specific corridors and conditions on some of the short-line railroads, despite the system’s adequate overall capacity. ASCE’s 2013 Report Card for America’s Infrastructure grades for Washington were:
Overall infrastructure (including non-transportation): C;
Aviation: C;
Bridges: C-;
Rail: C-;
Roads: D+; and
Transit: D+.
Safety
The following indicator is intended to provide insight into transportation system conditions and trends related to the safety statutory planning goal, “to provide for and improve the safety and security of transportation customers and the transportation system”:
Motor vehicle fatalities – indicates broad trends in roadway system safety over time, and the major causes of motor vehicle fatalities in the state.
Motor Vehicle Fatalities, 2002 to 2011
Target Zero is the State’s goal of lowering fatalities resulting from motor vehicle collisions to zero by 2030. Figure 3 indicates the trend in traffic fatalities from 2005 to 2011. While state fatalities from traffic collisions declined steadily from 2005 to 2012, preliminary data indicate that fatalities increased from 438 in 2012 to 440 in 2013 (Washington Traffic Safety Commission Crash Data). Meeting the Target Zero goal by 2030 will require an average incremental reduction of 24 fewer fatalities per year from the most recent five-year average of fatalities.

- 12 -
Figure 3. Washington Fatalities from Traffic Collisions, 2002 to 2011
Source: WA State Strategic Highway Safety Plan, 2013.
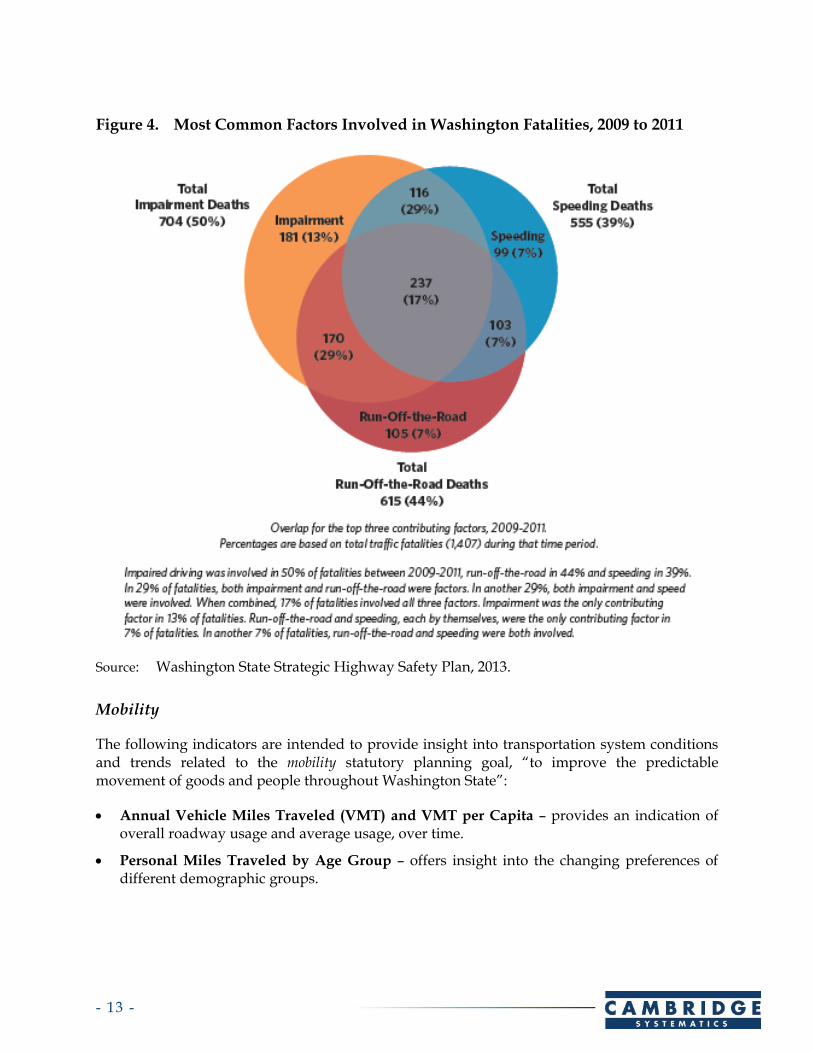
The 2013 State Strategic Highway Safety Plan identified the most common factors associated with fatal collisions (see Figure 4). According to recent Washington Traffic Safety Commission Crash Data, impairment (44 percent), speeding (38 percent), and running off the road (40 percent) remain the three most common factors associated with highway traffic fatalities in Washington State, though these three percentages have decreased in recent years. Other notable trends from recent roadway fatalities include:
A larger share of fatalities have involved motorcyclists and pedestrians. Motorcyclists were involved in 17 percent of fatalities in 2011 to 2013, up from 13 percent in 2006 to 2008. Pedestrians were involved 14 percent of fatalities, an increase from 12 percent in 2006 to 2008.
The proportion of fatal crashes involving young drivers (ages 16 to 24) has declined from 38 percent from 2006 to 2008, to 32 percent from 2011 to 2013.
- 13 -
Figure 4. Most Common Factors Involved in Washington Fatalities, 2009 to 2011
Source: Washington State Strategic Highway Safety Plan, 2013.
Mobility
The following indicators are intended to provide insight into transportation system conditions and trends related to the mobility statutory planning goal, “to improve the predictable movement of goods and people throughout Washington State”:
Annual Vehicle Miles Traveled (VMT) and VMT per Capita – provides an indication of overall roadway usage and average usage, over time.
Personal Miles Traveled by Age Group – offers insight into the changing preferences of different demographic groups.
- 14 -
Statewide Public Transit Trips, Expenses, and Revenue by Mode – provides an overview of transit system demand and costs over time.
Statewide Commute Mode Choice – offers a high-level snapshot of commute travel mode preferences in the state.
Annual Hours of Per Person Delay – reveals average per-capita congestion impacts on the state-operated highway system.
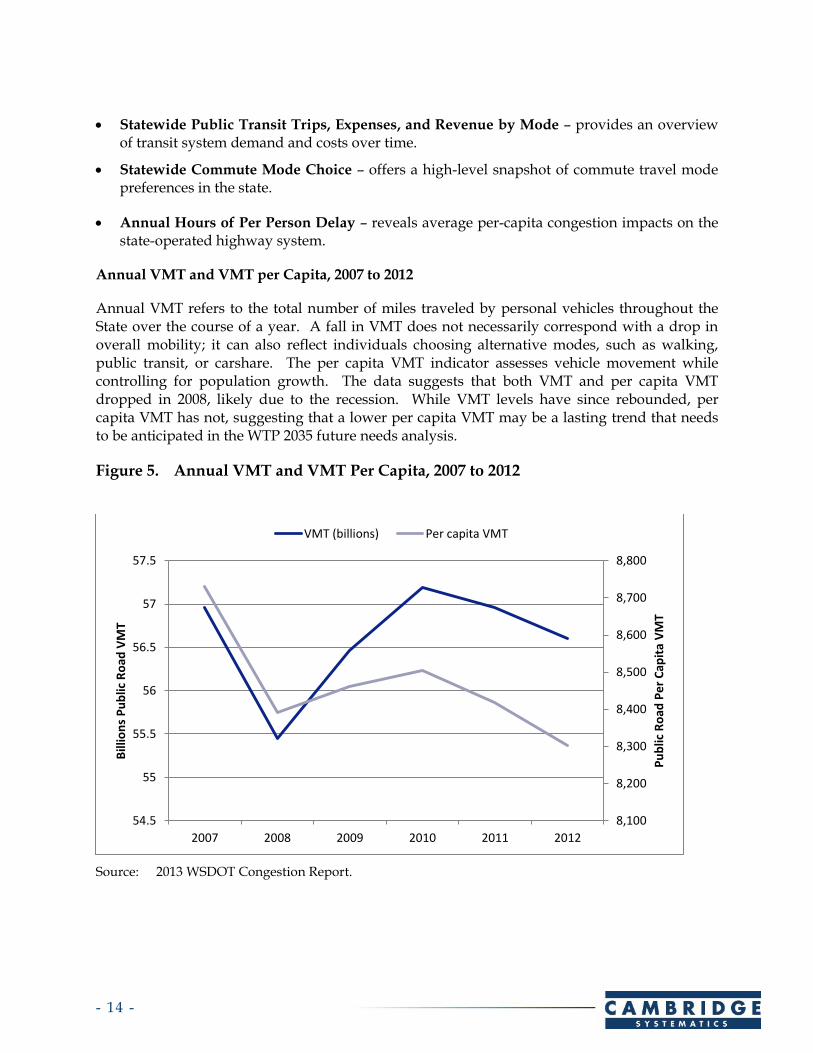
Annual VMT and VMT per Capita, 2007 to 2012
Annual VMT refers to the total number of miles traveled by personal vehicles throughout the State over the course of a year. A fall in VMT does not necessarily correspond with a drop in overall mobility; it can also reflect individuals choosing alternative modes, such as walking, public transit, or carshare. The per capita VMT indicator assesses vehicle movement while controlling for population growth. The data suggests that both VMT and per capita VMT dropped in 2008, likely due to the recession. While VMT levels have since rebounded, per capita VMT has not, suggesting that a lower per capita VMT may be a lasting trend that needs to be anticipated in the WTP 2035 future needs analysis.
Figure 5. Annual VMT and VMT Per Capita, 2007 to 2012
Source: 2013 WSDOT Congestion Report.
8,100
8,200
8,300
8,400
8,500
8,600
8,700
8,800
54.5
55
55.5
56
56.5
57
57.5
2007 2008 2009 2010 2011 2012
Pu
blic
Ro
ad P
er
Cap
ita
VM
T
Bill
ion
s P
ub
lic R
oad
VM
T
VMT (billions) Per capita VMT
- 15 -
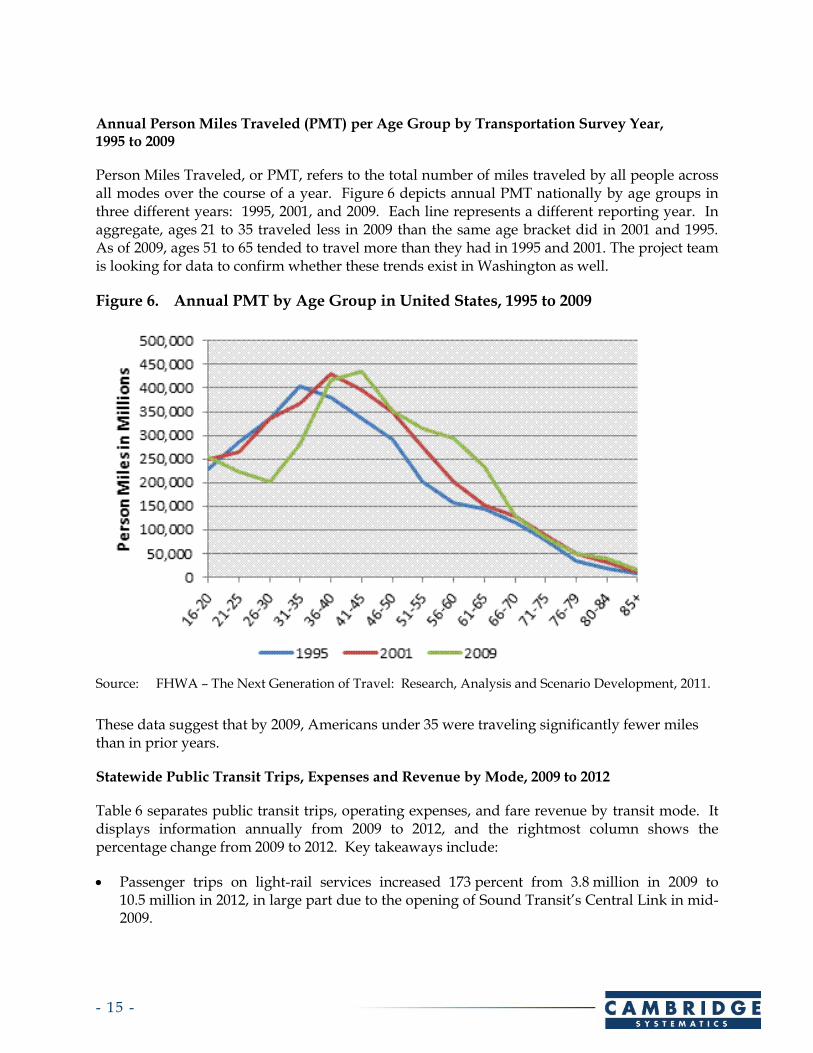
Annual Person Miles Traveled (PMT) per Age Group by Transportation Survey Year, 1995 to 2009
Person Miles Traveled, or PMT, refers to the total number of miles traveled by all people across all modes over the course of a year. Figure 6 depicts annual PMT nationally by age groups in three different years: 1995, 2001, and 2009. Each line represents a different reporting year. In aggregate, ages 21 to 35 traveled less in 2009 than the same age bracket did in 2001 and 1995. As of 2009, ages 51 to 65 tended to travel more than they had in 1995 and 2001. The project team is looking for data to confirm whether these trends exist in Washington as well.
Figure 6. Annual PMT by Age Group in United States, 1995 to 2009
Source: FHWA – The Next Generation of Travel: Research, Analysis and Scenario Development, 2011.
These data suggest that by 2009, Americans under 35 were traveling significantly fewer miles than in prior years.
Statewide Public Transit Trips, Expenses and Revenue by Mode, 2009 to 2012
Table 6 separates public transit trips, operating expenses, and fare revenue by transit mode. It displays information annually from 2009 to 2012, and the rightmost column shows the percentage change from 2009 to 2012. Key takeaways include:
Passenger trips on light-rail services increased 173 percent from 3.8 million in 2009 to 10.5 million in 2012, in large part due to the opening of Sound Transit’s Central Link in mid-2009.

- 16 -
Trips on most other transit modes remained relatively constant. The only other mode that changed more than 10 percent was commuter rail, where passenger trips increased 12 percent.
About 87 percent of transit passenger trips occurred on bus services, the most traveled public transit mode for each of the four years.
In most transit modes, the annual percent growth in farebox revenue exceeded annual percent growth in operating expenses, although expenses exceeded farebox revenue in all cases.
Table 6. Statewide Public Transit Trips, Expenses, and Revenue by Mode, 2009 to 2012
2009 2010 2011 2012
Percentage of Change
from 2009-2012
Bus Services (Fixed Route, Bus Rapid Transit, Commuter Bus, and Trolleybus)
Passenger Trips 192,035,613 186,970,986 190,234,530 191,966,046 0%
Operating Expenses $842,185,902 $876,183,083 $887,963,545 $910,806,249 8%
Farebox Revenue $181,344,304 $201,646,312 $214,667,118 $230,892,916 27%
Commuter Rail Services
Passenger Trips 2,492,362 2,480,052 2,626,711 2,803,123 12%
Operating Expenses $34,020,024 $32,459,887 $31,681,841 $36,762,712 8%
Farebox Revenue $7,766,691 $7,134,458 $8,336,093 $9,480,587 22%
Light-Rail Services (Includes Streetcar Rail)
Passenger Trips 3,841,974 8,352,838 9,546,221 10,476,045 173%
Operating Expenses $23,105,329 $46,744,774 $50,887,173 $58,334,340 152%
Farebox Revenue $2,714,803 $9,897,480 $12,440,918 $14,518,341 435%
Route Deviated Services
Passenger Trips 2,282,664 2,161,333 2,157,594 2,388,370 5%
Operating Expenses $17,971,813 $19,794,234 $19,430,641 $19,038,768 6%
Farebox Revenue $739,072 $760,983 $827,461 $858,608 16%
Demand Response Services (Includes Paratransit Services for Elderly and Disabled)
Passenger Trips 4,799,152 4,674,872 4,557,744 4,427,943 -8%
Operating Expenses $153,512,114 $158,000,012 $163,859,042 $167,405,793 9%
Farebox Revenue $3,625,137 $3,649,091 $4,498,174 $4,936,121 36%

- 17 -
Vanpooling Services
Passenger Trips 8,083,452 7,745,157 8,289,335 8,635,720 7%
Operating Expenses $25,958,491 $27,242,437 $30,199,321 $29,060,325 12%
Farebox Revenue $22,000,021 $21,107,839 $22,832,696 $23,541,041 7%
Source: 2013 WSDOT Washington State Summary of Public Transportation.
Commute Mode Choice, 2012
Figure 7 indicates statewide commute choice by transportation mode in 2012. The largest share of Washington State residents drove alone to work (72 percent), followed by carpooling (11 percent), and public transportation (6 percent). Commute mode share varies by region. In King County, where one-third of the State’s workforce lives, 18 percent of workers walk, bicycle, or ride public transit.
Figure 7. Statewide Commute Choice, 2012
Source: 2012 U.S. Census American Community Survey.
Annual Hours of Per Person Delay on State Highways, 2012
The 2013 WSDOT Congestion Report reports the per capita annual number of delay hours on Washington’s state-operated highways. The average person experienced 4.5 hours of delay on the state highways in 2012, down 4.3% from 4.7 in 2010. Per capita delay hours dropped significantly from 2007 to 2009, in part due to the economic recession, and then increased to 4.8 in 2011.
Environment
The following indicators are intended to provide insight into transportation system conditions and trends related to the environment statutory planning goal, “to enhance Washington’s quality
- 18 -
of life through transportation investments that promote energy conservation, enhance healthy communities, and protect the environment”:
Transportation Energy Consumption – indicates the share of total statewide energy consumption attributable to the transportation sector.
Transportation Share of Statewide Greenhouse Gas (GHG) Emissions – indicates the share of total statewide GHG emissions attributable to the transportation sector.
Air Quality Index by County – indicates trends in air quality by county from 2009 to 2013.
Stormwater Management Facilities Constructed – indicates the number of newly constructed WSDOT facilities applying stormwater best management practices
Transportation Energy Consumption, 2009
As of 2009, Washington’s transportation sector was the State’s largest consumer of energy, using 609 trillion of 1,543 trillion British thermal units (BTU) of energy annually, 44 percent of the total consumption. The transportation sector was responsible for 457 trillion of the State’s 833 trillion BTUs of waste energy, or 55% (Washington State Energy Strategy, 2012).
Transportation Share of Statewide GHG Emissions, 2009
Transportation, particularly personal vehicle travel, contributes 6.8 megatons of the 21.4 megatons of annual carbon-dioxide equivalent GHG emissions per capita per year, the largest share of any sector (31.8 percent). GHG emissions have been shown to contribute to global climate change. Transportation contributes a comparatively larger share of per capita emissions in Washington than in the United States overall, due largely to the relatively higher percentage of clean power generation in the State (WSDOT, 2014).
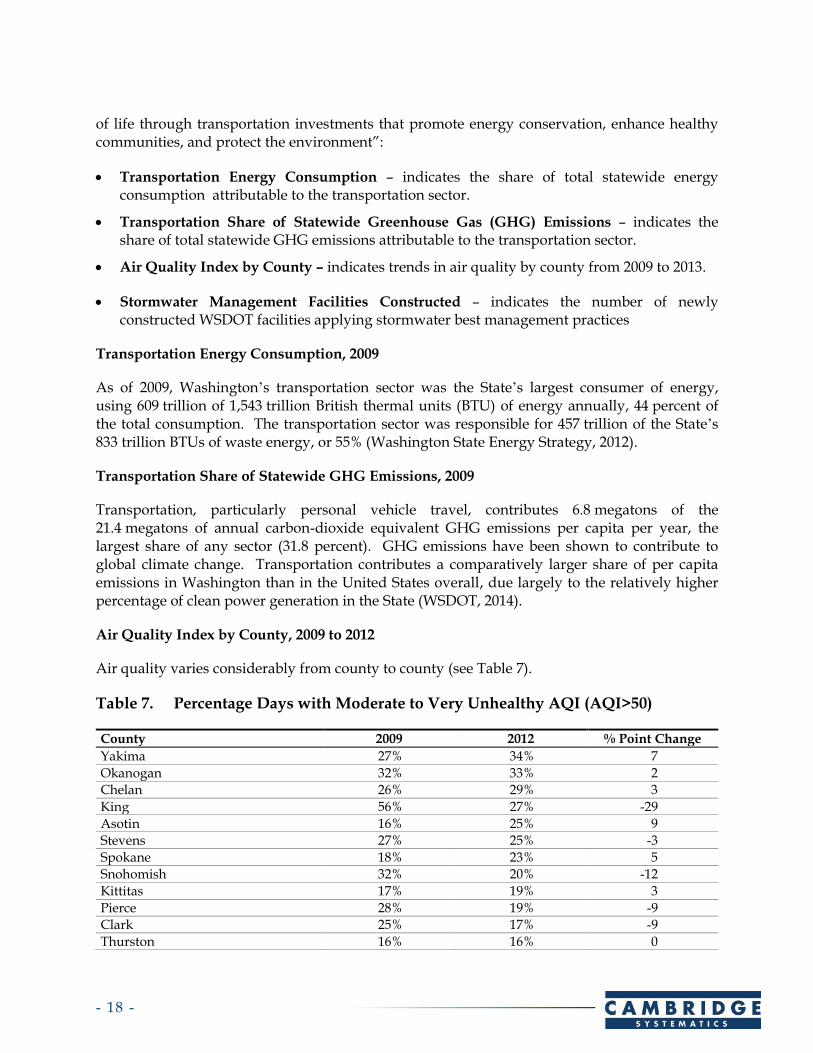
Air Quality Index by County, 2009 to 2012
Air quality varies considerably from county to county (see Table 7).
Table 7. Percentage Days with Moderate to Very Unhealthy AQI (AQI>50)
County 2009 2012 % Point Change
Yakima 27% 34% 7
Okanogan 32% 33% 2
Chelan 26% 29% 3
King 56% 27% -29
Asotin 16% 25% 9
Stevens 27% 25% -3
Spokane 18% 23% 5
Snohomish 32% 20% -12
Kittitas 17% 19% 3
Pierce 28% 19% -9
Clark 25% 17% -9
Thurston 16% 16% 0
- 19 -
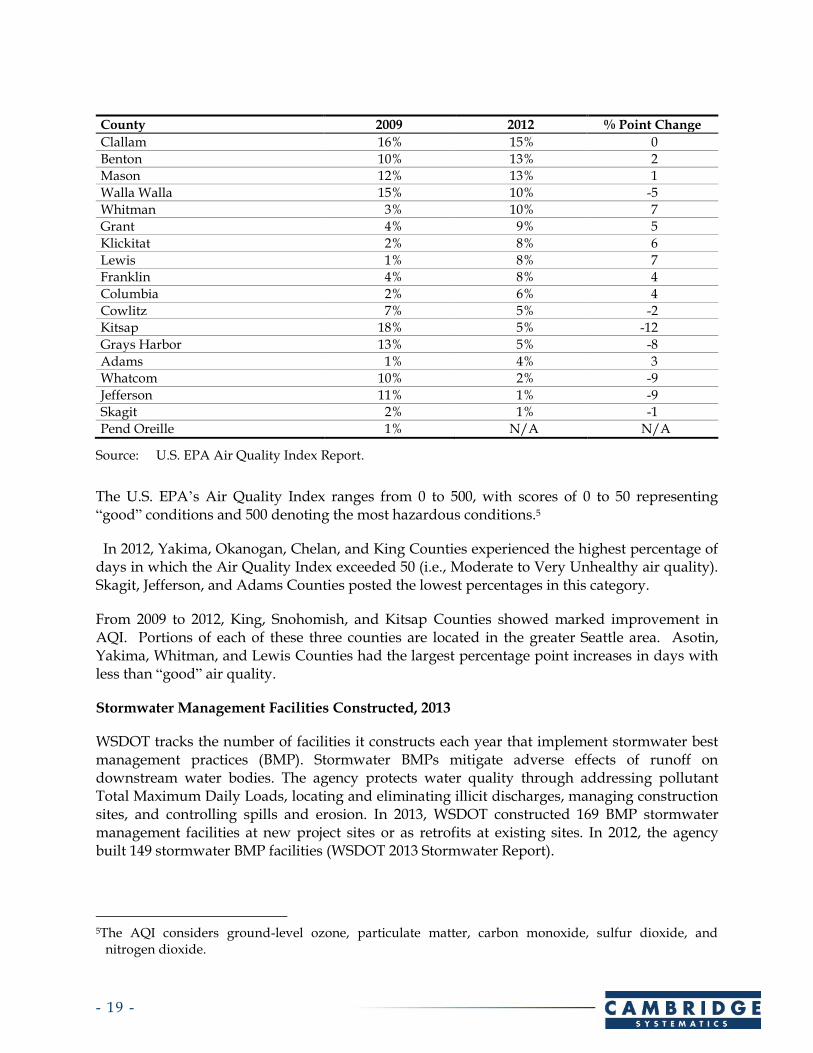
County 2009 2012 % Point Change
Clallam 16% 15% 0
Benton 10% 13% 2
Mason 12% 13% 1
Walla Walla 15% 10% -5
Whitman 3% 10% 7
Grant 4% 9% 5
Klickitat 2% 8% 6
Lewis 1% 8% 7
Franklin 4% 8% 4
Columbia 2% 6% 4
Cowlitz 7% 5% -2
Kitsap 18% 5% -12
Grays Harbor 13% 5% -8
Adams 1% 4% 3
Whatcom 10% 2% -9
Jefferson 11% 1% -9
Skagit 2% 1% -1
Pend Oreille 1% N/A N/A
Source: U.S. EPA Air Quality Index Report.
The U.S. EPA’s Air Quality Index ranges from 0 to 500, with scores of 0 to 50 representing “good” conditions and 500 denoting the most hazardous conditions.5
In 2012, Yakima, Okanogan, Chelan, and King Counties experienced the highest percentage of days in which the Air Quality Index exceeded 50 (i.e., Moderate to Very Unhealthy air quality). Skagit, Jefferson, and Adams Counties posted the lowest percentages in this category.
From 2009 to 2012, King, Snohomish, and Kitsap Counties showed marked improvement in AQI. Portions of each of these three counties are located in the greater Seattle area. Asotin, Yakima, Whitman, and Lewis Counties had the largest percentage point increases in days with less than “good” air quality.
Stormwater Management Facilities Constructed, 2013
WSDOT tracks the number of facilities it constructs each year that implement stormwater best management practices (BMP). Stormwater BMPs mitigate adverse effects of runoff on downstream water bodies. The agency protects water quality through addressing pollutant Total Maximum Daily Loads, locating and eliminating illicit discharges, managing construction sites, and controlling spills and erosion. In 2013, WSDOT constructed 169 BMP stormwater management facilities at new project sites or as retrofits at existing sites. In 2012, the agency built 149 stormwater BMP facilities (WSDOT 2013 Stormwater Report).
5The AQI considers ground-level ozone, particulate matter, carbon monoxide, sulfur dioxide, and
nitrogen dioxide.
- 20 -
Stewardship
Stewardship refers to our ability to maintain the overall quality of the transportation system, with particular focus on the system’s financial conditions and outlook. The following indicators are intended to provide insight into transportation system conditions and trends related to the stewardship statutory planning goal, “to continuously improve the quality, effectiveness, and efficiency of the transportation system”:
Forecasted State Revenues – indicates the projected revenues available to maintain and improve the State-managed transportation system.
Forecasted County Road Fund Revenues – indicates the projected revenues available to maintain and improve county-managed transportation infrastructure.
City Revenues – indicates the revenues available to maintain and improve city-managed transportation infrastructure.
Projected Motor Vehicle Fuel Consumption – provides insight into our ability to maintain and improve the State transportation system using motor vehicle fuel tax revenues.
Public Transit Revenue by Source – indicates changing trends regarding the burden of funding public transit in Washington State.
Public Perceptions of Alternative Funding Sources – provides insight into changing public opinion regarding transportation revenue options.
Forecasted Direct State Revenue Funding Sources, Percentage Breakdown, 2013-2023
The Washington State Office of Financial Management published a recent 10-fiscal year forecast of expected direct state transportation revenues by source (See Figure 8). These figures apply only to those portions of the transportation system under the State’s jurisdiction. State transportation revenue is projected to be $14.9 billion total from the 10-fiscal year period spanning 2013 to 2023. Motor vehicle fuel taxes comprise a majority (53 percent) of state transportation revenues, followed distantly by licenses, permits and fees (22 percent), ferry revenues (8 percent) and toll revenues (7 percent). Direct revenues exclude federal funding and bond sales.

- 21 -
Figure 8. 10-Fiscal Year Direct State Revenue Sources by Percentage, 2013 to 2023
Source: Washington State Office of Financial Management, February 2014 Transportation Revenue Forecast.
Forecasted County Road Fund Revenues, 2013
The Washington State County Road Administration Board (CRAB) compiled a 2013 Annual Report that anticipated county road fund revenues for the fiscal year. CRAB expects $1.16 billion of total funding for county roads and bridges in 2013. Property taxes are the largest projected revenue stream, accounting for 36.2% of funds. Motor vehicle fuel tax revenues account for approximately 20% of revenues. The road fund’s starting balance contributes 20% to the 2013 fund. Federal revenues provide less than 12% of the fund’s revenue.
City Transportation Revenues, 2010
Cities provide the majority of funding for city-owned roads and bridges. In 2010, municipalities generated approximately $1.3 billion in revenue. The Association of Washington Cities’ 2013 City Transportation Overview reports the breakdown of city transportation infrastructure revenues by source. Local sources account for 79% of funding. The federal government provides 9% of revenues, and Washington state covers 12%, split between the motor vehicle fuel tax (7%) and the Transportation Improvement Board (5%).
Projected Motor Vehicle Fuel Consumption, 2013 to 2027
Washington’s transportation system continues to rely heavily on vehicle fuel tax revenues. Gas tax revenues have been on a downward trajectory nationwide, as widespread increases in fuel efficiency and a general decline in vehicle miles traveled per capita reduce demand for vehicle fuels. Figure 9 indicates annual statewide motor vehicle fuel consumption in total gallons and gallons per capita.

- 22 -
According to the Washington State Office of Financial Management, total consumption of vehicle fuels in the state is expected to rise steadily over the next several years, peaking at roughly 3.4 billion gallons in 2017 and remaining relatively flat through 2027. Total consumption rose 0.5% from 2010 to 2013. The amount of motor vehicle fuel gallons consumed per capita is projected to fall from 480 gallons per capita in 2014 to 420 gallons per capita in 2027.
Figure 9. Projected State Motor Fuel Consumption, Total Gallons and Gallons per Capita, 2013 to 2027
Source: Calculated using data from Washington State Office of Financial Management, February 2014 Transportation Revenue Forecast and U.S. Census.
Public Transit Revenue by Source, 2008 to 2012
Public transit presents a cross-jurisdictional funding challenge. Table 8 shows public transit revenues by source. Overall, public transportation revenue from all sources grew almost 20 percent from 2008 to 2012. Local governments shoulder a higher proportion of the funding responsibilities now than in the past (85 percent in 2012 versus 81 percent in 2008), as federal and state contributions to public transportation have fallen.
Table 8. Public Transit Revenues by Source, 2008 to 2012
2008 2012
Operating Capital Total % Operating Capital Total %
Local $1,484,129,643 $47,303,438 $1,531,433,081 81% $1,874,207,290 $22,784,261 $1,896,991,551 85%
State $19,186,918 $23,440,696 $42,627,614 2% $18,292,249 $7,913,035 $26,205,284 1%
Federal $103,331,429 $224,894,612 $328,226,041 17% $102,420,887 $219,204,137 $321,625,024 14%
380
400
420
440
460
480
500
3,100
3,150
3,200
3,250
3,300
3,350
3,400
3,450
3,500
Gal
lon
s C
on
sum
ed
Pe
r C
apit
a
Tota
l Gal
lon
s C
on
sum
ed
(M
illio
ns)
Total Gallons (Millions) Gallons per Capita

- 23 -
Total $1,606,647,990 $295,638,746 $1,902,286,736 100% $1,994,920,426 $249,901,433 $2,244,821,859 100%
Source: 2013 WA Summary of Public Transportation.
Public Perception of Revenue Sources, 2011-2013
In each of the last three years (2011 to 2013), WSTC has surveyed state residents regarding their perceptions of the transportation network, need for revenue, potential revenue sources, and priorities for the network. VOWS has provided key insights into public perceptions of transportation funding across the State, including the following:
In 2013, 59 percent of respondents agreed that the State “needs additional revenue to keep our transportation system safe, effective, and properly maintained,” down slightly from 62 percent in 2012 and even with 59 percent in 2011;
However, 60 percent of 2013 respondents supported “raising some taxes and frees to increase funding for those transportation elements they feel are important,” an increase from 51 percent in 2012; and
In 2013, respondents prioritized “preservation/maintenance” first for transportation investment, followed by “congestion reduction/increased capacity” and “expanding transit/travel options.”

- 24 -
3.0 References
The Existing Conditions and Trends report draws from the following list of local, state, and national data sources:
American Society of Civil Engineers – Report Card for America’s Infrastructure (2013);
Association of Washington Cities City Transportation Overview (2013)
Freight Analysis Framework Version 3 (2014)
Puget Sound Regional Council Transportation 2040 (2012 Update);
Skagit/Island Metropolitan and Regional Transportation Plan (2010);
Southwest Washington Regional Transportation Council Clark County Metropolitan Transportation Plan (2011 Update);
Spokane Regional Transportation Council Horizon 2040 Metropolitan Transportation Plan (2013);
Thurston Regional Planning Council 2025 Regional Transportation Plan (2010 Update);
United States Census American Community Survey (2012);
United States Census Commodity Flow Survey (2007, 2012);
United States Census, Foreign Trade, State by 6-Digit HS Code (2014);
United States Environmental Protection Agency (EPA) Air Quality Index Report (2013);
United States Federal Aviation Administration, Calendar Year Passenger Enplanements at all U.S. Airports, by State (2013);
United States Federal Highway Administration (FHWA) – The Next Generation of Travel: Research, Analysis and Scenario Development (2011);
Washington State County Road Administration Board Annual Report (2013);
Washington State Energy Strategy (2012);
Washington State Office of Financial Management, Transportation Revenue Forecast (February 2014);
Washington State Strategic Highway Safety Plan (2013);
Washington Traffic Safety Commission Crash Data (2014);
Washington Tribal/State Transportation Conference Report (2012);
Washington State Department of Transportation (WSDOT) Annual Mileage and Travel Information (2012);
WSDOT Congestion Report (2013);
- 25 -
WSDOT Gray Notebook;
WSDOT Stormwater Report (2013);
WSDOT Update of Washington State Freight Mobility Strategic Investment Board Strategic Freight Corridors (2013);
WSDOT Washington State Rail Plan (2013);
WSDOT Washington State Summary of Public Transportation (2013);
Washington State Transportation Commission (WSTC) Connecting Washington Report (2012);
WSTC Voice of Washington State (VOWS) Statewide Transportation System Survey (2011 to 2013); and
WSTC Washington Transportation Plan 2030 (2010).
The project team has requested additional data on conditions and system needs from WSDOT, metropolitan planning organizations (MPOs)/Regional Transportation Planning Organization (RTPOs), and tribal governments.
ASCE Infrastructure Grade Scale
The following is the ASCE’s definition for infrastructure grades reported in the Preservation portion of Section 2.0:
A Generally in excellent condition, typically new or recently rehabilitated, and meets capacity needs for the future. A few elements show signs of general deterioration that require attention. Facilities meet modern standards for functionality and resilient to withstand most disasters and severe weather events.
B Good to excellent condition; some elements show signs of general deterioration that require attention. A few elements exhibit significant deficiencies. Safe and reliable with minimal capacity issues and minimal risk.
C Fair to good condition, showing general signs of deterioration and requires attention. Some elements exhibit significant deficiencies in conditions and functionality, with increasing vulnerability to risk.
D Poor to fair condition and mostly below standard, with many elements approaching the end of their service life. A large portion of the system exhibits significant deterioration. Condition and capacity are of significant concern with strong risk of failure.
F Unacceptable condition with widespread advanced signs of deterioration. Many of the components of the system exhibit signs of imminent failure.