Membrane Potential and Surface Potential in Mitochondria
11
THE JOURNAL OF BIOLOGICAL CHEMISTRY Vol. 258, No. 18, Issue of September 25, pp. 11039-11048,1983 Printed in (I. S. A. Membrane Potential and Surface Potential in Mitochondria FLUORESCENCE AND BINDING OF 1-ANILINONAPHTHALENE-€”LFONATE* (Received for publication, October 12, 1982) Dan E. Robertson$ and Hagai RottenbergQ From the Department of Pathology, Hahnemann University, School of Medicine, Philadelphia, Pennsylvania 19102 The effects of surface potential and transmembrane potential on the binding and fluorescence of 1-anili- nonaphthalene-8-sulfonate (ANS) in suspensions of rat liver mitochondria was investigated. The binding of ANS is characterized by two classes of binding site: a high affinity (Kd = 10-50 @M), low capacity (n = 3-8 nmol/mg of protein) class in which bound ANS flu- oresces strongly, and a low affinity (>500 pM), high capacity (>50 nmol/mg of protein) class with little fluorescence. The dissociation constant, Kd, of the high affinity site strongly depends on the surface potential of theexternalsurface of theinner mitochondrial membrane. Hence, the binding and fluorescence of ANS can be usedto estimate the surface potential. The dependence of ANS binding on the medium salt concen- tration is compatible with the Gouy-Chapman theory and allows accurate determination of surface potential and surface charge. The generation of transmembrane potential, either by oxidizable substrates, ATP, or PO- tassium gradient leads to a decrease in the fluores- cence. This decrease is the result of reduced ANS bind- ing. However, the external surface potential as esti- mated from the charge screening effect of salt solutions is unchanged in energized membranes. The extent of decreased fluorescence correlates reasonably well with the magnitude of the transmembrane potential. The potential-induced quenching depends on pre-equilibra- tion of ANS with the mitochondria, suggesting that the response is due to extrusion of ANS from the mitochon- drial matrix. These findings do not support the sugges- tion that ANS quenching in energized mitochondria is due to an increase in the negative surface charge of the cytosolic surface of the inner membrane. The results are compatible with the suggestion that the response to energization is largely due to the formation of A$. However, because of the complex nature of the ANS response, it isconcluded that neither the magnitude of surface potential nor the magnitude of membrane po- tential can be determined from the ANS response in energized mitochondria. Substrate-induced “energization” of mitochondria induces the quenching of fluorescence of the anionic fluorescent probe * This study was supported by National Institutes of Health Grants GM 28173 and AA 3442. The costs of publication of this article were defrayed in part by the payment of page charges. This article must therefore be hereby marked “advertisemnt” in accordance with 18 U.S.C. Section 1734 solely to indicate this fact. $ Present address, Department of Biophysics and Biochemistry, University of Pennsylvania Medical School, Philadelphia, PA 19104. To whom all correspondence should be addressed at Department of Pathology, Hanemann University, Broad and Vine Sts., Philadel- phia, PA 19102. ANSI (1). This discovery, over 13 years ago, was followed by a rapid spread of the use of ANS as a probe for energization in mitochondria and in many other membrane systems (for review, see Ref. 2). However, the mechanism as well as the direct cause of the quenching is still controversial (3). It is well recognized now that in coupled mitochondria substrate oxidation or ATP hydrolysis is associated with the formation of a large negative transmembrane potential (4). Conse- quently, it has been suggested that the negatively charged ANS responds to the formation of membrane potential by diffusing across the membrane to reach a new electrochemical equilibrium (5). This equilibration, it was suggeted, led to quenching of the fluorescence in mitochondria as a result of the depletion of the matrix ANS. In submitochondrial parti- cles, chromatophores, and other vesicles which generate pos- itive membrane potential, ANS is believed to accumulate internally which leads to enhancement of the fluorescence. This interpretation is supported by the demonstration that ANS is a permeable anion (6) and by qualitative analysis of binding parameters of ANS to mitochondria and submito- chondrial particles (7). An alternative model, first described by Azzi et al. (8) assumed that ANS only binds to the external membrane surface. The ANS binding, in this model, depends on the surface potential which modulates the apparent bind- ing constant of ANS to themembrane. This interpretation is supported by the demonstration that the binding and the fluorescence of ANS in various membrane preparations are determined by the surface potential (9-11). Measurements of < potential in mitochondria appear to confirm this interpre- tation and suggest that energization is associated with an increase in the mitochondrial surface charge (12, 13). In this study, we attempt to resolve these contrasting interpretations by comparing the predictions of the two models in relation to ANS fluorescence both in energized and nonenergized mito- chondria. The data are best fit by a model which includes the effects of both surface potential and transmembrane poten- tial. It is demonstrated that while ANS binding and fluores- cence strongly respond to modulation of surface potential, the energy-dependent quenching is largely due to the generation of A$ and can be accounted for by the movement of the anion across the membrane and from intramembrane sites in re- sponse to membrane potential. Hence, the ANS fluorescence quenching does not provide evidence to the claims that the mitochondrial surface charge becomes more negative when energized (12, 14-17). EXPERIMENTAL PROCEDURES Preparation of Mitochondria, Mitophts, and Submitochondrial Particles-Mitochondria from male Wistar albino rats, 150-250 g, The abbreviations used are: ANS, 1-anilinonaphthalene-8-sulfo- nate; CCCP, carbonylcyanide m-chlorophenylhydrazone; HEPES, 4- (2-hydroxyethy1)-1-piperazineethanesulfonic acid MES, 4-morpho- lineethanesulfonic acid; PIPES, 1,4-piperazinediethanesulfonic acid. 11039 by guest on February 20, 2018 http://www.jbc.org/ Downloaded from
-
Upload
duongkhanh -
Category
Documents
-
view
217 -
download
1
Transcript of Membrane Potential and Surface Potential in Mitochondria

THE JOURNAL OF BIOLOGICAL CHEMISTRY Vol. 258, No. 18, Issue of September 25, pp. 11039-11048,1983 Printed in (I. S. A.
Membrane Potential and Surface Potential in Mitochondria FLUORESCENCE AND BINDING OF 1-ANILINONAPHTHALENE-€”LFONATE*
(Received for publication, October 12, 1982)
Dan E. Robertson$ and Hagai RottenbergQ From the Department of Pathology, Hahnemann University, School of Medicine, Philadelphia, Pennsylvania 19102
The effects of surface potential and transmembrane potential on the binding and fluorescence of 1-anili- nonaphthalene-8-sulfonate (ANS) in suspensions of rat liver mitochondria was investigated. The binding of ANS is characterized by two classes of binding site: a high affinity (Kd = 10-50 @M), low capacity (n = 3-8 nmol/mg of protein) class in which bound ANS flu- oresces strongly, and a low affinity (>500 pM), high capacity (>50 nmol/mg of protein) class with little fluorescence. The dissociation constant, Kd, of the high affinity site strongly depends on the surface potential of the external surface of the inner mitochondrial membrane. Hence, the binding and fluorescence of ANS can be used to estimate the surface potential. The dependence of ANS binding on the medium salt concen- tration is compatible with the Gouy-Chapman theory and allows accurate determination of surface potential and surface charge. The generation of transmembrane potential, either by oxidizable substrates, ATP, or PO- tassium gradient leads to a decrease in the fluores- cence. This decrease is the result of reduced ANS bind- ing. However, the external surface potential as esti- mated from the charge screening effect of salt solutions is unchanged in energized membranes. The extent of decreased fluorescence correlates reasonably well with the magnitude of the transmembrane potential. The potential-induced quenching depends on pre-equilibra- tion of ANS with the mitochondria, suggesting that the response is due to extrusion of ANS from the mitochon- drial matrix. These findings do not support the sugges- tion that ANS quenching in energized mitochondria is due to an increase in the negative surface charge of the cytosolic surface of the inner membrane. The results are compatible with the suggestion that the response to energization is largely due to the formation of A$. However, because of the complex nature of the ANS response, it is concluded that neither the magnitude of surface potential nor the magnitude of membrane po- tential can be determined from the ANS response in energized mitochondria.
Substrate-induced “energization” of mitochondria induces the quenching of fluorescence of the anionic fluorescent probe
* This study was supported by National Institutes of Health Grants GM 28173 and AA 3442. The costs of publication of this article were defrayed in part by the payment of page charges. This article must therefore be hereby marked “advertisemnt” in accordance with 18 U.S.C. Section 1734 solely to indicate this fact.
$ Present address, Department of Biophysics and Biochemistry, University of Pennsylvania Medical School, Philadelphia, PA 19104.
To whom all correspondence should be addressed at Department of Pathology, Hanemann University, Broad and Vine Sts., Philadel- phia, PA 19102.
ANSI (1). This discovery, over 13 years ago, was followed by a rapid spread of the use of ANS as a probe for energization in mitochondria and in many other membrane systems (for review, see Ref. 2). However, the mechanism as well as the direct cause of the quenching is still controversial (3). It is well recognized now that in coupled mitochondria substrate oxidation or ATP hydrolysis is associated with the formation of a large negative transmembrane potential (4). Conse- quently, it has been suggested that the negatively charged ANS responds to the formation of membrane potential by diffusing across the membrane to reach a new electrochemical equilibrium (5). This equilibration, it was suggeted, led to quenching of the fluorescence in mitochondria as a result of the depletion of the matrix ANS. In submitochondrial parti- cles, chromatophores, and other vesicles which generate pos- itive membrane potential, ANS is believed to accumulate internally which leads to enhancement of the fluorescence. This interpretation is supported by the demonstration that ANS is a permeable anion (6) and by qualitative analysis of binding parameters of ANS to mitochondria and submito- chondrial particles (7). An alternative model, first described by Azzi et al. (8) assumed that ANS only binds to the external membrane surface. The ANS binding, in this model, depends on the surface potential which modulates the apparent bind- ing constant of ANS to the membrane. This interpretation is supported by the demonstration that the binding and the fluorescence of ANS in various membrane preparations are determined by the surface potential (9-11). Measurements of < potential in mitochondria appear to confirm this interpre- tation and suggest that energization is associated with an increase in the mitochondrial surface charge (12, 13). In this study, we attempt to resolve these contrasting interpretations by comparing the predictions of the two models in relation to ANS fluorescence both in energized and nonenergized mito- chondria. The data are best fit by a model which includes the effects of both surface potential and transmembrane poten- tial. It is demonstrated that while ANS binding and fluores- cence strongly respond to modulation of surface potential, the energy-dependent quenching is largely due to the generation of A$ and can be accounted for by the movement of the anion across the membrane and from intramembrane sites in re- sponse to membrane potential. Hence, the ANS fluorescence quenching does not provide evidence to the claims that the mitochondrial surface charge becomes more negative when energized (12, 14-17).
EXPERIMENTAL PROCEDURES
Preparation of Mitochondria, Mitophts, and Submitochondrial Particles-Mitochondria from male Wistar albino rats, 150-250 g,
The abbreviations used are: ANS, 1-anilinonaphthalene-8-sulfo- nate; CCCP, carbonylcyanide m-chlorophenylhydrazone; HEPES, 4- (2-hydroxyethy1)-1-piperazineethanesulfonic acid MES, 4-morpho- lineethanesulfonic acid; PIPES, 1,4-piperazinediethanesulfonic acid.
11039
by guest on February 20, 2018http://w
ww
.jbc.org/D
ownloaded from

11040 ANS Fluorescence in Mitochondria
were prepared by differential centrifugation as previously described (18). Mitoplasts were prepared according to Greenawalt (19) and submitochondrial particles by the method of Lindsay et al. (20). A Yeda press was used in both preparations. Bulk membrane potential (A$) was determined by the distribution of 86Rb in the presence of valinomycin as measured by rapid centrifugation (21).
Fluorescence Measurements-All measurements of ANS fluores- cence were made in an Eppendorf l lOlM photometer with a front surface fluorescence attachment. Measurements were made at a 35” angle normal to the excitation beam. Excitation light was provided by a mercury lamp with a 408-nm primary interference filter for excitation. A 430-470-nm secondary window was used for emission. All measurements are expressed in arbitrary fluorescence units.
Measurement of Kd and n from ANS by Fluorescence Emission- The approach used to determine the dissociation constant, Kd, and n, the number of binding sites, from fluorescence yield was based upon the formalism of the Lineweaver-Burk derivation as outlined in detail by Wang and Edelman (22). Briefly, Kd may be determined from a titration of particles with ANS and a treatment of the data using the relationship
l/f = 1/fmaz + K d f m a x X 1/(ANS) (1)
where f is fluorescence in arbitrary units, fma. is the fluorescence of excess ANS and (ANS) is the free ANS Concentration. Plotting l/f uersus l/(ANS) allows determination of fma. from the y intercept and Kd from the slope. Free ANS concentration is determined by the procedure outlined below. To determine the number of ANS-binding sites (n), a series of titrations is performed at fixed (ANS) with varying particle concentration (Cm). Using the previously determined value of Kd, substituting into the law of mass action and rearranging gives,
(ANS)/f = 1/9 + Kd/qnC, (2)
where 9 is a proportionality constant related to the quantum efficiency and determined from the y intercept. n may be estimated from a plot of (ANS)/f versus l/(C,,,).
Values for all slopes and intercepts were estimated using a regres- sion curve-fit program on a Hewlett-Packard HP-85 personal com- puter. Values for the correlation coefficient in all cases were greater than 0.98.
ANS Binding to Mitochondria and Submitochondrial Particles- Direct measurement of ANS binding to mitochondria was made by centrifugation of the mitochondria and a subsequent quantitative estimation of mitochondrial bound ANS by fluorescence emission. Samples to be assayed were placed in 400.~1 tubes and spun at 9300 X g in a Beckman Microfuge B for 3 min. Tubes were removed and immediately placed in liquid nitrogen. Pellets were removed by cut- ting the plastic tube and were placed in 1 ml of 1% Triton X-100, 10% NaCl both to dissolve the pellet and enhance ANS fluorescence. Triton-mitochondrial suspensions were vortexed until clear and read in a Perkin-Elmer MPF 44B spectrofluorometer (excitation, 390 nm; emission, 480 nm). A standard curve was constructed by centrifuga- tion of mitochondrial suspensions without added ANS, dissolving the pellets in Triton X-lOO/NaCI and subsequently adding known amounts of ANS. In all cases, a mitochondria/Triton X-lOO/NaCI blank was used to correct for background fluorescence. For measure- ment of binding to submitochondrial particles, a similar procedure was employed. However, the centrifugation step was performed in a Beckman Airfuge in 175-pl tubes at 175,000 X g. To avoid difficulties with pellet removal with submitochondrial particles, supernatants were assayed for ANS content. Aliquots of supernatant were placed in 1% Triton X-lOO/NaCl and assayed fluorometrically. Standard curves were constructed by centrifugation of ANS-free particles, transferring an aliquot of supernatant and adding known amounts of ANS. Supernatants of Triton X-lOO/NaCl blanks were subtracted from all assay values.
Materials-Bis-free ANS was purchased from Molecular Probes, Inc. Valinomycin was obtained from Calbiochem. 86Rb was purchased from Amersham-Searle, Inc. All other chemicals were reagent grade and were purchased from commercial sources.
RESULTS
Fluorescence and Binding of ANS in Nonenergized Mito- chondria-The fluorescence yield of 1,8-ANS in water is very low and exhibits an emission maximum at 520 nm. Binding to protein or lipids results in a large increase in the quantum yield and a blue shift in the emission (2). It is apparent, however, that the relationship between probe binding and
ANS, p M I /Protein rnl / mg Bound ANS ~ nmol/mg protein
FIG. 1. Binding and Fluorescence of ANS in rat liver mitochondria. A , fluorescence of mitochondria- ANS solutions was determined as a function of free ANS concentration at a constant value of mitochondrial protein. For fluorescence measurements, mitochondria were added to a final concentration of 1.9 mg of protein/ ml of 0.2 M sucrose, 10 mM Tris-C1, 5 mM MgC12, pH 7.1, containing 2 p~ rotenone in 3 ml. ANS was added and the solution was allowed to incubate for 10 min. Fluorescence, measured in arbitrary units (A), was determined in the front surface fluorescence mode of the Eppendorf photometer as outlined under “Experimental Procedures.” For determination of bound ANS, two 400-pl aliquots were withdrawn from the cuvette and each was centrifuged (see text). Bound ANS (0) was measured and averaged. Free ANS was determined from the difference between total and bound ANS. B, fluorescence of ANS versus mitochondrial protein concentration. Fluorescence was measured as outlined in A, however, at a fixed total ANS concentration (8.3 pM) and variable mitochondrial protein Concentration. Data were plotted in the double reciprocal form (22). The number of binding sites was estimated after determination of Kd (see Fig. 2). C, Scatchard treatment of binding and fluorescence data. Direct binding data (0) were analyzed to derive two classes of binding site (-) and compared to binding data derived from a fluorescence determination of Kd and n (A).
by guest on February 20, 2018http://w
ww
.jbc.org/D
ownloaded from

ANS Fluorescence in Mitochondria 11041
fluorescence yield in mitochondrial membranes is a complex one.
Fig. 1A shows the binding and the fluorescence of ANS as function of the free ANS concentration. Unlike previous studies with mitochondria, the free ANS concentration was calculated from the amount of total bound ANS (see “Exper- imental Procedures”) and not from the fluorescence of bound ANS. As the figure clearly shows, only at very low ANS concentration is there a correspondence between bound ANS and ANS fluorescence. At high concentration, there is exten- sive binding of ANS which does not contribute measurably to the fluorescence at short wavelength (<470 nm). Plotting the fluorescence intensity uersus free ANS concentration in a double reciprocal plot (as in Fig. 2A) yields an estimate of the apparent dissociation constant (&) of the site with a high quantum yield. The Kd estimated by this method lies in the range of 25-50 p ~ . This value is considerably lower than previous estimates (7). We attribute this difference to the fact that other investigators calculate the free ANS from the fluorescence of bound ANS, whereas we have corrected for total bound ANS.
By measuring the fluorescence of a fixed quantity of ANS as a function of mitochondrial content, it is possible to obtain an estimate of the number of binding sites ( n ) which have a high quantum yield. The value for n falls within a range of 3- 8 nmol/mg of protein. The data shown in Fig. l B , a double reciprocal treatment of the fluorescence data obtained in a typical titration, give a value for n of 6.6 nmol/mg of protein. This value is 1 order of magnitude smaller than previous estimates (7) which do not distinguish between fluorescent and nonfluorescent bound ANS. The combination of the two titrations allows a quantitative estimate of the binding param- eters which relate to ANS fluorescence in mitochondria.
The results of the direct binding determination are plotted in a Scatchard analysis as shown in Fig. 1C. The curue obtained in C may be resolved into two straight lines by an iteration procedure which relates the total amount of probe bound to two classes of binding sites of apparent dissociation constants Kd’ and Kd2 and capacities nl and n2 (23). The resulting lines are shown in Fig. 1C. The class of “high affinity” sites resolved by this treatment have an apparent Kd of 25 p~ and a value for n of 4 nmol/mg of protein.
A “low affinity” class has a Kd of 550 pM and a value for n of 68 nmol/mg of protein. For comparison, the parameters derived from the fluorescence in Fig. 1, A and B, were used to construct a binding curve which agrees within experimental error with the curve relating to the high affinity class of sites as determined from direct binding. Clearly, previous investi- gators failed to distinguish between the high affinity site, which has high quantum yield and is blue-shifted and the low affinity site which has low quantum yield. This may be the source of the early controversy regarding the characteristic of ANS binding to mitochondria and submitochondrial particles (see “Discussion”). ANS fluorescence in biological membranes is affected by the ionic composition of the surrounding me- dium (10-12). The addition of salts to suspensions of mito- chondria and ANS increases fluorescence in a concentration- dependent manner. The enhancement can be shown to be the result of a decrease of the apparent dissociation constant ( K d ) for ANS. Fig. 2A is a double reciprocal plot of fluorescence as a function of free ANS concentration in low salt medium and in a medium containing 0.25 mM CaC12. From the slope and intercept, a value for Kd of 27 p~ was obtained for ANS in low salt medium. Addition of CaClz caused a drop in the value of Kd to 16 p ~ , indicating a higher affinity for ANS. The number of available sites for fluorescent ANS in low and high salt medium (Fig. 2B) is constant within experimental error,
0 0 2 0 4 1
I /ANS. pM”
0 2 4 6 8 1 0 1 2 14
I / Protem,ml/mg
0 01 0 2 0 3 0 4 0 5 06 0 6 0 5 IO 15 20 25 30 I /ANS. pM-’ I /Prole~n.ml/mg
FIG. 2. Salt Effect on K,, and n for ANS in mitochondria and submitochondrial particles. A , the Kd for ANS binding was measured by titrating mitochondria with ANS. The medium was 250 mM sucrose, 10 mM Tris, pH 7.2, and 2 p M rotenone. The mitochon- drial concentration was 1.9 mg of protein/ml. Free ANS concentration was determined by measuring the amount of bound ANS by the centrifugation assay outlined under “Experimental Procedures” and subtracting from the total added ANS. Data are plotted as l/f uersus l/[ANS]; Kd = slope X fm.. 0, no salt; A, with 0.25 mM CaHP04. B, the number of binding sites for ANS was determined by titration of a fixed concentration of ANS with mitochondria as outlined in the text. Titrations were performed in 250 mM sucrose, 10 mM Tris, pH 7.2, with 3 PM rotenone to prevent endogenous respiration. The ANS concentration was 8.3 PM. n was determined at low salt (0) and with 0.25 mM Capo4 (A). C, submitochondrial particles were prepared as described in the text. Particles (0.8 mg/ml) were added to 3 ml of 250 mM sucrose, 10 mM Tris, pH 7.2 (0) or 0.25 mM sucrose, 10 mM Tris, 100 mM KCl, 5 mM MgC12,0.2 mM Capo,, pH 7.2 (0). After correction for background fluorescence and light scattering, particles were ti- trated with ANS over a concentration range of 2-150 WM. At each ANS concentration, particles were withdrawn and centrifuged in a Beckman Airfuge and subsequent determination of free ANS concen- tration was made as described in the text. Data were treated by a double reciprocal method to determine the dissociation constant for ANS. D, determination of the number of binding sites in submito- chondrial particles was done by titration of a fixed ANS concentration (8.3 p ~ ) with particles as outlined in the text. Titrations were performed in 0.25 M sucrose, IO mM Tris, pH 7.2 (O), or 0.25 M sucrose, 10 mM Tris, 100 mM KCl, 5 mM MgC12, 0.2 mM CaC12, pH 7.2 (0).
i.e. 3 nmol/mg of protein. The increase in ANS fluorescence intensity in the case of Caz+ addition, therefore, seems to be due entirely to an increase in the affinity of the membrane for the probe. A similar analysis was carried out with inverted submitochondrial particles to determine binding parameters for ANS in association with the inner membrane. As shown in Fig. 2, C and D, the binding of ANS is similar to that in mitochondria in low salt and in medium containing 0.25 mM CaC12. The values for K,, and n in low salt were 25 p~ and 13 nmol/mg of protein, respectively, while in 0.25 mM CaC1, the apparent binding constant was 17 p~ and n equal 13 nmol/ mg of protein. The increase in the value of n can be fully explained by the loss of soluble protein and outer membranes in the preparation and the enrichment of inner membranes
by guest on February 20, 2018http://w
ww
.jbc.org/D
ownloaded from

11042 ANS Fluorescence in Mitochondria
as reflected by a 2- to %fold increase in cytochrome oxidase content of these particles.
The fluorescence of an ANS mitochondrial suspension is enhanced by the addition of all salts. This enhancement depends on the cation concentration and valence and is sat- urated at high salt concentration. The results of typical titra- tions with salts of mono- and divalent cations are shown in Fig. 3A. Titrations with salts of monovalent cations such as NaCl or KC1 show fluorescence saturation behavior at con- centrations 2 orders of magnitude higher than MgS04 or CaHP04. Mg2+ salts enhance the fluorescence little more than monovalent cations but Ca2+ enhancement is three times as large. It is well known that the binding of ions to phospho- lipids or biological membranes depends upon the surface potential of the membrane (24). The dependence of the sur- face potential ($J on the membrane surface charge and the
Monovolent Cotton Conc.. mM (o.d
- a!
a! 0
60 W
f 40
20
0 0 I 2 3
Dlvolenl Cation Conc .mM (a,.) NoCl.mM
12
IO” IO“ 1 0 - 5 1 0 ‘ 10-1 100 Cotcon. M
FIG. 3. Salts enhancement of ANS fluorescence in rat liver mitochondria. A , fluorescence was determined in 3 ml of medium containing 0.25 M sucrose, 10 mM Tris, pH 7.2, 8.3 p M ANS, 2 p M rotenone, 1.9 mg of protein/ml, and the indicated concentration of salt. Salt titrations were performed by additions of small aliquots of concentrated salt solution. The steady state fluorescence level was measured after each sequential addition of NaCl (0), KC1 (O), MgS04 (A), or Capo4 (A). B, null point salt titration for Go determination. Mitochondrial ANS suspensions were titrated with NaCl before (0) and after (0) addition of 0.25 mM CaC12. C, effect of cations on the mitochondrial surface potential. Values for +. calculated as described in the text (Equation 2) were plotted from a titration of the fluores- cence as a function of cation concentration as in A. The value for $0
was calculated by a null point fluorescence titration and this value was used as a reference for calculation of +. values after incremental salt additions. The value of +. for the particular mitochondrial prep- aration used was -11 mV. Titration curves are shown for La3+ (A), Caz+ (O), Mg2+ (O), Na+ (0), and K+ (A). The theoretical change in
with cation concentration was derived from the Guoy-Chapman theory as outlined in Appendix 11. In each case, the initial concentra- tion of divalent salt was assumed to be 10 p~ and monovalent salt was 3 mM.
ionic composition of the medium is described by the Guoy- Chapman theory (24, 25). The binding of a charged molecule like ANS to a negatively charged mitochondrial membrane is determined by two factors: the affinity of ligand for the binding site and the concentration of ligand in the .double layer which is determined by the surface potential. Thus, the binding constant is an apparent constant which depends upon the surface potential.
Kd = Kdo exp(-F+.,/RT) (3)
At low probe concentration ([ANSI << &), the fluorescence is proportional to the binding constant, hence (see Appendix 1)
A+* = 59 log F/Fo (mV) (4)
where A$. is the difference in surface potential between two membrane states with fluorescence F and Fo. In general, this method only gives the difference of qS between two states. However, if we know Fo, where $s = 0 we can calculate the absolute values of $.. We have developed a procedure to determine Fo which is based on the fact that increased ionic strength reduces $s. This is shown in Fig. 3B where the effect of KC1 on ANS fluorescence in a suspension of rat liver mitochondria is shown. Thus, as the KC1 concentration in- creases, & approaches zero. Fig. 3A indicates that in addition to its charge screening effect Caf binds to the mitochondrial surface. When mitochondria strongly bind cations to the surface, the surface charge can become positive. In this case, the ANS fluorescence, which is initially very high, would decrease with increased salt concentration, because the net positive charge is also screened at high ionic strength. As shown in Fig. 3B, mitochondria were first allowed to bind calcium, which increased ANS fluorescence almost 2-fold. However, the addition of KC1 (or any other salt) decreases the fluorescence. Therefore, the asymptotic approach of the two lines ( S a ” ) represents the fluorescence, FO, where i L S = 0, and allows a calculation of the absolute value of the surface
. E 0.6 - 2 a rn 0.5- E
O 0.4 -
-
\ -
E ln z 0.3- a 0
0.2 - 0 m
0.1 1
-120 - - 100 :
W - 80 0) U In - 60 3
L -
- 40
1 *O 01 ‘ - 1 0
4 5 6 7 8 9
PH FIG. 4. Mitochondrial binding of ANS and fluorescence as
function of pH. The medium was 0.25 M sucrose, 2 p M rotenone, and 10 mM buffer. Buffers were 10 mM MES, pH 5.5-6.0, 10 mM PIPES, pH 6.6-7.0, 10 mM HEPES, pH 7.3-7.5, 10 mM Tris, pH 7.8- 8.3. The mitochondrial protein concentration in each experiment was 1.4 mg/ml. Binding was measured as described under “Experimental Procedures.” 0, fluorescence in low salt medium. 0, fluorescence in high salt medium (150 mM KCl).
by guest on February 20, 2018http://w
ww
.jbc.org/D
ownloaded from
ANS Fluorescence in Mitochondria 11043
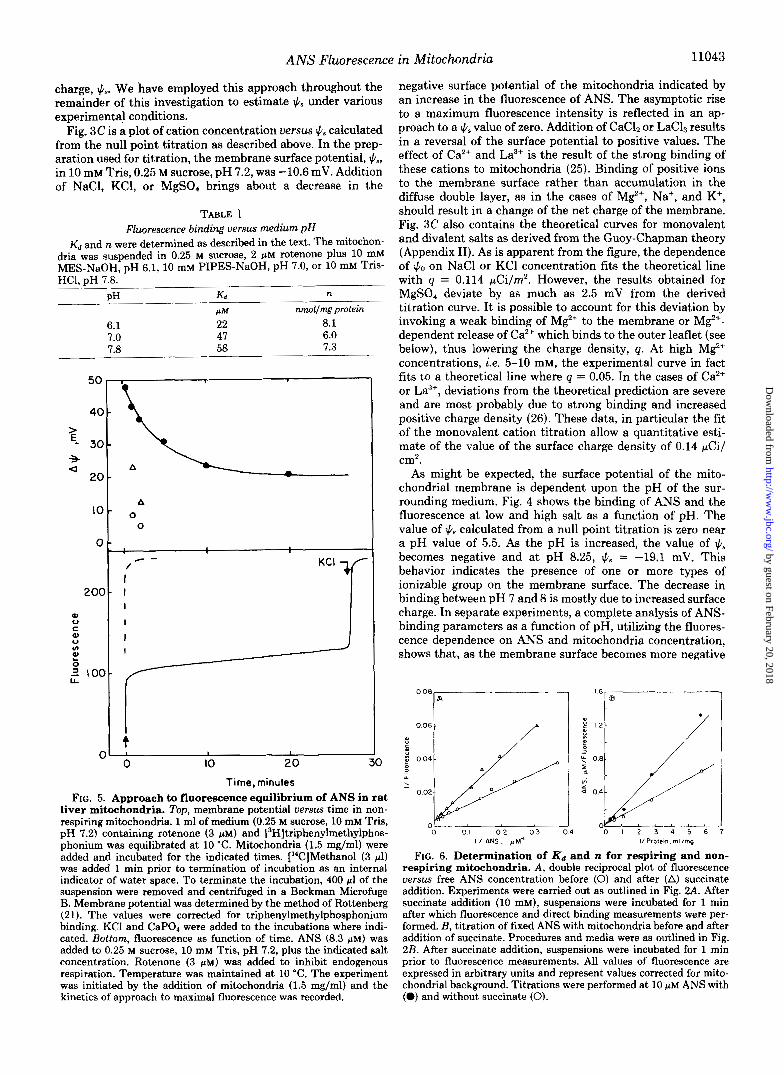
charge, h . We have employed this approach throughout the remainder of this investigation to estimate 1c.9 under various experimental conditions.
Fig. 3C is a plot of cation concentration versus qS calculated from the null point titration as described above. In the prep- aration used for titration, the membrane surface potential, qS, in 10 mM Tris, 0.25 M sucrose, pH 7.2, was -10.6 mV. Addition of NaCl, KC1, or MgS04 brings about a decrease in the
TABLE I Fluorescence binding versus medium pH
Kd and n were determined as described in the text. The mitochon- dria was suspended in 0.25 M sucrose, 2 p M rotenone plus 10 mM MES-NaOH, pH 6.1, 10 mM PIPES-NaOH, pH 7.0, or 10 rnM Tris- HC1, pH 7.8.
pH K d
6.1 22 8.1 7.0 47 6.0 7.8 58 7.3
n
@M nmollmg protein
40 - > '- 30 3
- a
20 -
10 -
Or
i _ _ : A
0 0
200 -I"-- al
u al / I
/ "
I 200- I
I
I al 0 c al u I
I t I 01 ' I 1
0 IO 2 0 30 Time,minutes
FIG. 5. Approach to fluorescence equilibrium of ANS in rat liver mitochondria. Top, membrane potential versus time in non- respiring mitochondria. 1 ml of medium (0.25 M sucrose, 10 mM Tris, pH 7.2) containing rotenone (3 PM) and [3H]triphenylmethylphos- phonium was equilibrated at 10 "C. Mitochondria (1.5 mg/ml) were added and incubated for the indicated times. ["CIMethanol (3 ~ 1 ) was added I min prior to termination of incubation as an internal indicator of water space. To terminate the incubation, 400 pl of the suspension were removed and centrifuged in a Beckrnan Microfuge B. Membrane potential was determined by the method of Rottenberg (21). The values were corrected for triphenylmethylphosphonium binding. KC1 and CaPO, were added to the incubations where indi- cated. Bottom, fluorescence as function of time. ANS (8.3 FM) was added to 0.25 M sucrose, 10 mM Tris, pH 7.2, plus the indicated salt concentration. Rotenone (3 p ~ ) was added to inhibit endogenous respiration. Temperature was maintained at 10 "C. The experiment was initiated by the addition of mitochondria (1.5 mg/rnl) and the kinetics of approach to maximal fluorescence was recorded.
negative surface potential of the mitochondria indicated by an increase in the fluorescence of ANS. The asymptotic rise to a maximum fluorescence intensity is reflected in an ap- proach to a qS value of zero. Addition of CaCh or Lac& results in a reversal of the surface potential to positive values. The effect of Ca2+ and La3+ is the result of the strong binding of these cations to mitochondria (25). Binding of positive ions to the membrane surface rather than accumulation in the diffuse double layer, as in the cases of Mp", Na+, and K', should result in a change of the net charge of the membrane. Fig. 3C also contains the theoretical curves for monovalent and divalent salts as derived from the Guoy-Chapman theory (Appendix 11). As is apparent from the figure, the dependence of q0 on NaCl or KC1 concentration fits the theoretical line with q = 0.114 pCi/rn2. However, the results obtained for MgSO, deviate by as much as 2.5 mV from the derived titration curve. It is possible to account for this deviation by invoking a weak binding of Mg2' to the membrane or M P - dependent release of Caz+ which binds to the outer leaflet (see below), thus lowering the charge density, q. At high M e concentrations, i.e. 5-10 mM, the experimental curve in fact fits to a theoretical line where q = 0.05. In the cases of Ca2+ or La", deviations from the theoretical prediction are severe and are most probably due to strong binding and increased positive charge density (26). These data, in particular the fit of the monovalent cation titration allow a quantitative esti- mate of the value of the surface charge density of 0.14 pCi/ cm2.
As might be expected, the surface potential of the mito- chondrial membrane is dependent upon the pH of the sur- rounding medium. Fig. 4 shows the binding of ANS and the fluorescence at low and high salt as a function of pH. The value of fis calculated from a null point titration is zero near a pH value of 5.5. As the pH is increased, the value of qS becomes negative and at pH 8.25, fi6 = -19.1 mV. This behavior indicates the presence of one or more types of ionizable group on the membrane surface. The decrease in binding between pH 7 and 8 is mostly due to increased surface charge. In separate experiments, a complete analysis of ANS- binding parameters as a function of pH, utilizing the fluores- cence dependence on ANS and mitochondria concentration, shows that, as the membrane surface becomes more negative
FIG. 6. Determination of K d and n for respiring and non- respiring mitochondria. A , double reciprocal plot of fluorescence versus free ANS concentration before (0) and after (A) succinate addition. Experiments were carried out as outlined in Fig. 2.4. After succinate addition (10 mM), suspensions were incubated for 1 min after which fluorescence and direct binding measurements were per- formed. B, titration of fixed ANS with mitochondria before and after addition of succinate. Procedures and media were as outlined in Fig. 2B. After succinate addition, suspensions were incubated for 1 min prior to fluorescence measurements. All values of fluorescence are expressed in arbitrary units and represent values corrected for mito- chondrial background. Titrations were performed at 10 p~ ANS with (0) and without succinate (0).
by guest on February 20, 2018http://w
ww
.jbc.org/D
ownloaded from
11044 ANS Fluorescence in Mitochondria
L
5
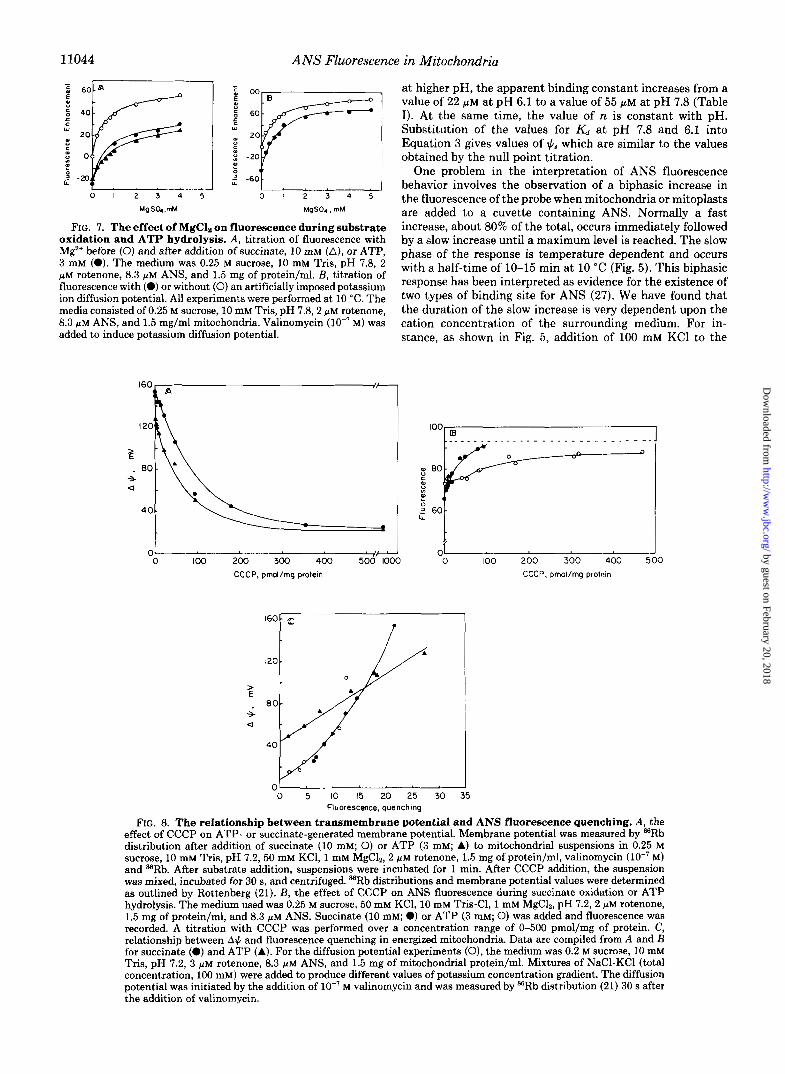
FIG. 7. The effect of MgCl
1
MgSOs , m M
Nn fluorescence during substral ~ a - te
oxidation and ATP hydrolysis. A , titration of fluorescence with M e before (0) and after addition of succinate, 10 mM (A), or ATP, 3 mM (0). The medium was 0.25 M sucrose, 10 mM Tris, pH 7.8, 2 p~ rotenone, 8.3 PM ANS, and 1.5 mg of protein/ml. E , titration of fluorescence with (0) or without (0) an artificially imposed potassium ion diffusion potential. All experiments were performed at 10 "C. The media consisted of 0.25 M sucrose, 10 mM Tris, pH 7.8,2 p M rotenone, 8.3 WM ANS, and 1.5 mg/ml mitochondria. Valinomycin (lo-' M) was added to induce potassium diffusion potential.
3t higher pH, the apparent binding constant increases from a talue of 22 PM at pH 6.1 to a value of 55 PM at pH 7.8 (Table [). At the same time, the value of n is constant with pH. Substitution of the values for K , at pH 7.8 and 6.1 into Equation 3 gives values of lClg which are similar to the values 3btained by the null point titration.
One problem in the interpretation of ANS fluorescence 3ehavior involves the observation of a biphasic increase in ;he fluorescence of the probe when mitochondria or mitoplasts are added to a cuvette containing ANS. Normally a fast .ncrease, about 80% of the total, occurs immediately followed 3y a slow increase until a maximum level is reached. The slow Dhase of the response is temperature dependent and occurs with a half-time of 10-15 min a t 10 "C (Fig. 5 ) . This biphasic response has been interpreted as evidence for the existence of ;wo types of binding site for ANS (27). We have found that ;he duration of the slow increase is very dependent upon the :ation concentration of the surrounding medium. For in- stance, as shown in Fig. 5 , addition of 100 mM KC1 to the
0 1 0 0 200 300 400 5 0 0 1000 CCCP. pmol/mg protein
J - 0 100 200 3 0 0 400 500
CCCP. pmol/mg proteln
J 0 5 10 I5 20 2 5 30 35
Fluorescace. quenching
FIG. 8. The relationship between transmembrane potential and ANS fluorescence quenching. A, the effect of CCCP on ATP- or succinate-generated membrane potential. Membrane potential was measured by 8BRb distribution after addition of succinate (10 mM; 0) or ATP (3 mM; A) to mitochondrial suspensions in 0.25 M sucrose, 10 mM Tris, pH 7.2,50 mM KCl, 1 mM MgC12, 2 p M rotenone, 1.5 mg of protein/ml, valinomycin (lo-' M ) and sBRb. After substrate addition, suspensions were incubated for 1 min. After CCCP addition, the suspension was mixed, incubated for 30 s, and centrifuged. ffiRb distributions and membrane potential values were determined as outlined by Rottenberg (21). E , the effect of CCCP on ANS fluorescence during succinate oxidation or ATP hydrolysis. The medium used was 0.25 M sucrose, 50 mM KCI, 10 mM Tris-C1, 1 mM MgC12, pH 7.2, 2 p M rotenone, 1.5 mg of protein/ml, and 8.3 p~ ANS. Succinate (10 mM; 0) or ATP (3 mM; 0) was added and fluorescence was recorded. A titration with CCCP was performed over a concentration range of 0-500 pmol/mg of protein. C, relationship between A$ and fluorescence quenching in energized mitochondria. Data are compiled from A and B for succinate (0) and ATP (A). For the diffusion potential experiments (0), the medium was 0.2 M sucrose, 10 mM Tris, pH 7.2, 3 p~ rotenone, 8.3 PM ANS, and 1.5 mg of mitochondrial protein/ml. Mixtures of NaC1-KC1 (total concentration, 100 mM) were added to produce different values of potassium concentration gradient. The diffusion potential was initiated by the addition of lo-' M valinomycin and was measured by =Rb distribution (21) 30 s after the addition of valinomycin.
by guest on February 20, 2018http://w
ww
.jbc.org/D
ownloaded from
ANS Fluorescence in
medium prior to mitochondrial addition ends the slow phase and results in a fluorescence value which is equal to that at 100 mM KC1 when added near the end of the slow increase. This result led to the supposition that the slow change may in fact be due to a potassium diffusion potential which is generated by leaking potassium and which would eventually collapse. In fact, when membrane potential was estimated from triphenylmethylphosphonium distribution under paral- lel experimental conditions (Fig. 5), it was found that A+ drops from a value of -46 mV immediately upon mitochon- drial dilution to a value near -20 mV after 20 min. Addition of either 100 mM KC1 or 0.2 mM CaC12 near the beginning the experiment, i.e. soon after dilution, results in immediate collapse of the potential. If the addition of ANS is delayed for 30 min after the mitochondrial dilution the slow phase be- comes much faster, equilibrating in several minutes (not shown). These data point to a simplified interpretation of the biphasic fluorescence event. The ion diffusion potential ini- tiated upon dilution of the mitochondria inhibits the rate of transport of ANS across the membrane and thus reduces the binding of ANS inside the mitochondrial matrix.
Energy-dependent Quenching of ANS Fluorescence-Upon generation of a membrane potential in mitochondria, quench- ing of ANS fluorescence is observed. Using the double recip- rocal treatment of fluorescence titration data (Fig. 6A) , it is apparent that the addition of succinate to mitochondria re- duces the apparent affinity of the mitochondrial membrane for ANS. In a nonenergized state, the apparent K d measured for ANS is 22 PM. Addition of succinate increased the appar- ent K d to 47 PM. An analysis of the number of binding sites at two different ANS concentrations is shown in Fig. 6B. The data suggest only a small decrease from 3.9 to 3.3 in the number of binding sites upon the generation of membrane potential. To test the hypothesis that the increase in the apparent Kd of the ANS-binding sites is due to an increase in surface potential (12, 16) we have investigated the effect of salts on ANS fluorescence in energized mitochondria. Fig. 7A shows a titration of ANS fluorescence with MgS04 before and after the addition of succinate or ATP. Fig. 7 B shows a similar titration before and after generation of a diffusion potential. In all cases Mg+ enhances the fluorescence by a similar magnitude in energized and nonenergized mitochondria. Hence, the surface charge if calculated for each case from the difference f MgS04 is nearly identical in energized and non- energized mitochondria. This indicates that the change in Kd observed upon energization cannot be attributed to change in external surface potential but rather to a change in the apparent affinity or the number of binding sites for ANS.
It seems clear that a relationship exists between A#, the membrane potential, and ANS fluorescence quenching in rat liver mitochondria. Using KC1 to clamp the value of A+ in a valinomycin-induced potassium diffusion potential or by ti- tration with uncoupler of the ATP- and succinate-induced potentials, it is possible to correlate A$ with quenching. Fig. 8 shows the results of an experiment where A# (as measured by "jRb distribution) was generated by ATP or succinate and collapsed by CCCP. Titration with the uncoupler CCCP re- duces the membrane potential (Fig. 8 A ) and in parallel en- hances ANS fluorescence (I?). Since ATP addition enhances the fluorescence when ATP hydrolysis is blocked by oligo- mycin, the quenching is calculated from the difference k oligomycin. The results of these experiments and the data of a similar experiment for potassium diffusion potentials are compared in Fig. 8C showing the relationship between fluo- rescence and A#. While in each experiment the extent of fluorescence quenching is correlated with A$, these relation- ships are not completely linear with succinate or diffusion-
Mitochondria 11045
I'
t t t t s CCCP s CCCP " "
" n a! L
f u.
0 ~ ~ " ' " ~ " ' " 0 2 4 6 8 IO 12 14 16 18 20 22 24
Time, rntnules
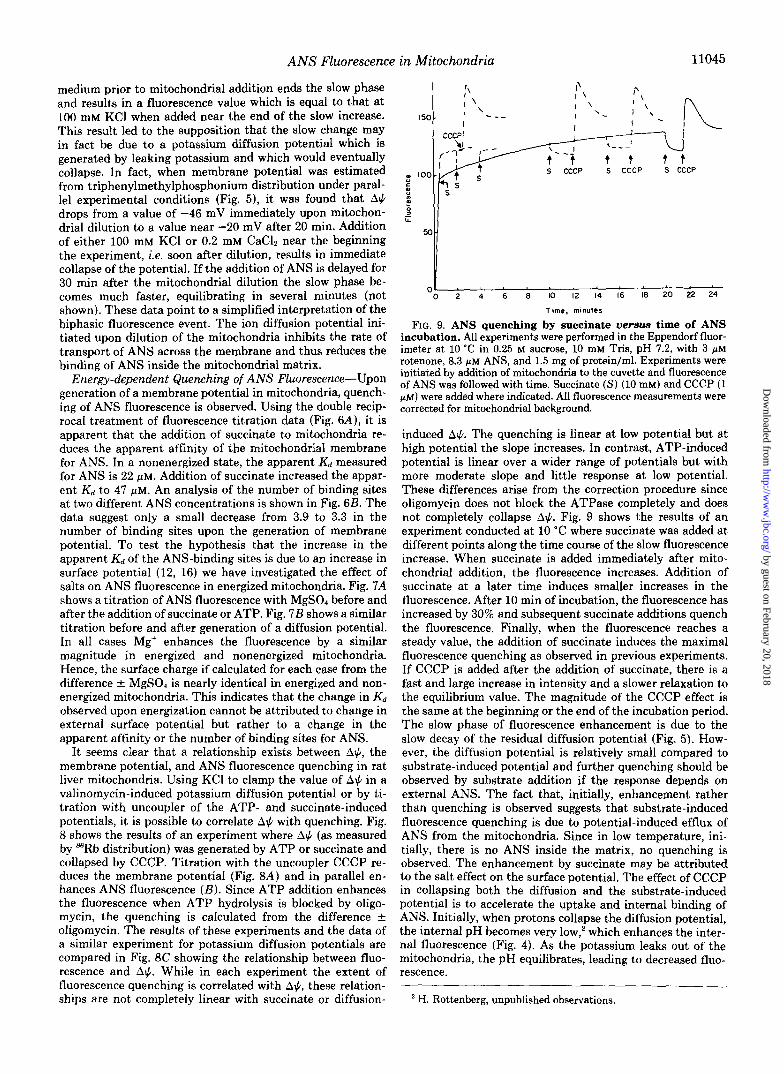
FIG. 9. ANS quenching by succinate versus time of ANS incubation. All experiments were performed in the Eppendorf fluor- imeter at 10 "C in 0.25 M sucrose, 10 mM Tris, pH 7.2, with 3 /LM rotenone, 8.3 @M ANS, and 1.5 mg of protein/ml. Experiments were initiated by addition of mitochondria to the cuvette and fluorescence of ANS was followed with time. Succinate ( S ) (10 mM) and CCCP (1 /LM) were added where indicated. All fluorescence measurements were corrected for mitochondrial background.
induced A+. The quenching is linear at low potential but at high potential the slope increases. In contrast, ATP-induced potential is linear over a wider range of potentials but with more moderate slope and little response at low potential. These differences arise from the correction procedure since oligomycin does not block the ATPase completely and does not completely collapse A#. Fig. 9 shows the results of an experiment conducted at 10 "C where succinate was added at different points along the time course of the slow fluorescence increase. When succinate is added immediately after mito- chondrial addition, the fluorescence increases. Addition of succinate at a later time induces smaller increases in the fluorescence. After 10 min of incubation, the fluorescence has increased by 30% and subsequent succinate additions quench the fluorescence. Finally, when the fluorescence reaches a steady value, the addition of succinate induces the maximal fluorescence quenching as observed in previous experiments. If CCCP is added after the addition of succinate, there is a fast and large increase in intensity and a slower relaxation to the equilibrium value. The magnitude of the CCCP effect is the same at the beginning or the end of the incubation period. The slow phase of fluorescence enhancement is due to the slow decay of the residual diffusion potential (Fig. 5). How- ever, the diffusion potential is relatively small compared to substrate-induced potential and further quenching should be observed by substrate addition if the response depends on external ANS. The fact that, initially, enhancement rather than quenching is observed suggests that substrate-induced fluorescence quenching is due to potential-induced efflux of ANS from the mitochondria. Since in low temperature, ini- tially, there is no ANS inside the matrix, no quenching is observed. The enhancement by succinate may be attributed to the salt effect on the surface potential. The effect of CCCP in collapsing both the diffusion and the substrate-induced potential is to accelerate the uptake and internal binding of ANS. Initially, when protons collapse the diffusion potential, the internal pH becomes very low,' which enhances the inter- nal fluorescence (Fig. 4). As the potassium leaks out of the mitochondria, the pH equilibrates, leading to decreased fluo- rescence.
H. Rottenberg, unpublished observations.
by guest on February 20, 2018http://w
ww
.jbc.org/D
ownloaded from

11046 ANS Fluorescence in Mitochondria
DISCUSSION
Analysis of Binding and Fluorescence in Nonenergized Mi- tochondria-Since ANS has very low quantum efficiency in a polar medium such as water (2, 27), there is little doubt that the enhanced fluorescence and the blue shift in the emission spectra which is observed on addition of membranes or pro- teins to ANS solution is due to ANS binding to proteins and/ or lipids in the membrane. However, since in biological mem- branes there are possibly more than one class of binding sites with different binding parameters and quantum efficiencies and since these parameters may be dependent on the meta- bolic state of the system, the analysis of fluorescence changes may become quite difficult. Earlier attempts to characterize the binding parameters in mitochondria and submitochon- drial particles have resulted in conflicting results (7, 27-29). We believe that some of the earlier data reflect the presence of significant contamination of bis-ANS in most commercial preparations. A more important source of ambiguity in pre- vious studies was the implicit assumption that all bound ANS has high (and equal) quantum efficiency. The binding of ANS was usually estimated by a fluorescence assay without inde- pendent measurement of total binding. In a recent study, Williams et al. (7) used the centrifugation assay to measure total binding independent of the fluorescence. However, even though their Scatchard plots indicate a low affinity, high capacity class of binding sites which do not appear in the fluorescence assay, they did not correct their estimated free concentration for this bound nonfluorescent fraction. As a result, theirs as well as previous estimates include both types of binding sites, hence grossly overestimating both the value of Kd and of n of the fluorescent site. As discussed in detail in previous sections, in all our analyses of binding data, the free ANS concentration was always determined, for each experimental point. In each case after reading of the fluores- cence, the mitochondria were pelleted, and the total bound dye was determined. We believe that this procedure is neces- sary to get reliable estimates of binding parameters in mito- chondria. The weak binding class with low fluorescence and large number of sites is probably due to nonspecific absorption to membrane and protein surfaces. Because of the strong effect of salts on the fluorescence both in mitochondria and in submitochondrial particles, it appears that the high affinity sites are distributed both on the matrix and cytosolic face of the membrane.
Mitochondrial Surface Charge and ANS Binding-The salt dependence of ANS binding and fluorescence in mitochondria suggests that, similar to other membrane systems (9-11, 26), the surface charge of the membrane determines the ANS concentration in the double layer adjacent to the membrane surface and, hence, the apparent dissociation constant. Our data fully support this explanation by the demonstration that salt affects the dissociation constant but not the number of binding sites. The dependence of the salt effect on the cation valence and concentration is in good agreement with Guoy- Chapman theory, provided that allowances are made for the binding of cations to the mitochondrial surface. The effect of pH is also due to an increased apparent dissociation constant and is reversed by salt, indicating that this is largely an effect on the surface charge of the mitochondrial membrane. These results justify the use of ANS fluorescence for the estimation of surface potential in nonenergized mitochondria. For accu- rate estimates of the value of surface potential, it was neces- sary to determine the fluorescence of ANS when the surface potential is zero. For that purpose, we have developed a null point fluorescence titration which approaches the zero value by screening the charges of both negative and positive (Ca2+-
treated) membranes. It must be stressed that for reliable estimates the ANS concentration must be well below the Kd; we used routinely 8 p ~ . Our results indicate a surface potential of up to -20 mV a t high pH and low salt. However, the binding of small amounts of Ca’ or other cations effectively reduces the potential and may even result in a positive surface potential.
Energization of Mitochondria and ANS Binding and Fluo- rescence-There are currently three different interpretations for the effect of energization on ANS fluorescence and bind- ing. According to the explanation advanced by Jasaitis et al. ( 5 ) , the quenching in mitochondria is the result of ANS extrusion from the matrix driven by A$. An alternative inter- pretation, first outlined by Azzi et al. (8) and recently advo- cated by Aiuchi et al. (12) and Wojtczak and Nalecz (17) is that energization results in an increase in the negative value of the surface charge, hence the reduction of external binding and fluorescence of ANS. The third hypothesis is that the energy-induced changes in fluorescence intensity are due to changes in quantum yield associated with the energized state of the membrane (30-32). The main purpose of the present study was to test the validity of the first two explanations. While the results are not equivocal, we feel that they do not support the surface charge hypothesis whereas they add fur- ther evidence to the membrane potential hypothesis. As for the membrane “state” hypothesis, our data indicate that the energy-induced quenching is mostly a result of decreased binding (of both fluorescent and nonfluorescent dye) as ex- pressed in the change of the apparent Kd. While the analysis indicates a small change in the extrapolated n value, which cannot be distinguished from decreased quantum efficiency, the major change is due to a decreased amount of bound ANS. If one does not distinguish between the two classes of binding sites, a decrease in binding of the low capacity site may appear as an overall decrease in quantum efficiency a t high ANS concentrations.
The most striking evidence against the surface charge hy- pothesis is that the quenching due to energization is com- pletely insensitive to salt effects. This is in contrast to the pH effect and to the general behavior of nonenergized mem- branes. Even in energized membranes, the salt response of the unquenched fluorescence is identical with that of the nonenergized system. Hence, if the quenching was induced by increased surface charge, salt should have enhanced the flu- orescence to its original level. The other evidence against the surface charge hypothesis which at the same time supports the membrane potential hypothesis is the response at low temperature immediately after the addition of ANS. Succinate does not induce any quenching but CCCP causes normal enhancement. This observation suggests that the succinate- induced quenching and the subsequent enhancement by CCCP requires transport of ANS across the membrane. In this respect, we have also compared the energy-induced ANS response to the 6-p-toluidino-2-naphthalenesulf0ni~ acid re- sponse. The results confirm earlier observations that while the magnitude of the response is the same the kinetics is much slower with 6-p-toluidino-2-naphthalenesulfonic acid (8). Since 6-p-toluidino-2-naphthalenesulfonic acid is known to be much less permeable than ANS ( l l ) , this difference in kinetics indicates that the response depends on ANS trans- port into and across the membrane. In addition, the correla- tion between ANS quenching and A$ while not perfect sug- gests a close causal relationship between membrane potential and the ANS response. The only evidence that appears to support the surface charge hypothesis and is difficult to explain by the membrane potential hypothesis is the obser- vation that the quenching is mostly the result of increased
by guest on February 20, 2018http://w
ww
.jbc.org/D
ownloaded from

ANS Fluorescence in Mitochondria 11047
Kd. Despite our more sophisticated binding analysis and vastly different binding parameter, this conclusion is the same as that of Williams et al. (7). This is precisely what the surface charge hypothesis predicts. However, since the change in K d
is not salt sensitive, it must be concluded that this change in binding affinity is independent of the external surface charge. The difficulty in explaining this observation may arise from the unreasonable implicit assumption that all the fluorescent ANS-binding sites have the same intrinsic K d and are located exactly at the plane of the phospholipid head groups on both sides of the membrane lipid bilayer. However, since it is likely that the fluorescent ANS is bound to various proteins, it may be located at various distances from the phospholipid head group projecting into and out of the membranes. Hence, the measured Kd probably represents a weighted average of these binding sites, which are different from each other both in their intrinsic Kd and the free ANS concentration in their vicinity. The generation of membrane potential in energized mitochondria would increase the apparent K d values of sites in the matrix and also in the membrane by driving the free ANS out. Because of the composite nature of this parameter, it would appear simply as higher average Kd.
Effect of Energization on Mitochondrial Surface Chnrge- The evidence for a change in the surface charge due to energization of mitochondria depends on four experimental findings: (i) { potential, as measured by the electrophoretic mobility of the mitochondria becoming slightly more negative in energized membrane (12, 13, 16); (ii) the apparent Kd for various charged substrates in energized mitochondria is dif- ferent in nonenergized mitochondria (17); (iii) the free form of a positively charged spin-probe decrease on energization (34); and (iv) the binding of ANS is reduced. As discussed above, the latter observation is not compatible with the sur- face charge hypothesis and appears to result from the gener- ation of A$. However, it is not possible to conclude from the ANS results alone that there is no change in surface charge; only that the effect of A$ on ANS fluorescence would obscure a change of surface charge if it indeed exists. We have recently examined the binding of the positively charged spin-probe 4-(dodecyldimethylammonium)-l-oxyl-2,2,6,6-tetramethylpi- peridine bromide (Cat,,) in mitochondria and concluded that the disappearance of the external free form is due to potential driven uptake and internal interaction of the probe.3 As for the changes in the apparent Kd of membrane enzymes, these may result also from potential-induced transport or possibly potential-induced activation of the enzymes. Finally, the { potential measurement may reflect both electrogenic trans- port, deformation of the organelles, or changes in orientation and position of charge carrying groups. It should be stressed that the < potential change is also insensitive to the ionic strength of the medium (12) suggesting that it is not due to changes in surface charge. Recent studies on the binding affinity of Tb3+ to mitochondrial membranes do not indicate a significant change in surface charge on energization. Since Tb"+ is not transported by mitochondria these results appear unequi~ocal.~ In summary, we believe that there is no une- quivocal evidence for an increase in surface charge on ener- gization of mitochondrial membranes. Most of the quoted evidence appears on closer examination to reflect the large increase in A$ in energized mitochondria.
Correlation of ANS Quenching and A$-ANS fluorescence has been used extensively as a quantitative estimate of changes in membrane potential, particularly in particles in
H. Rottenberg, P. Angiolillo, and K. Hashimoto, unpublished. K. Hashimoto and H. Rottenberg, manuscript submitted for
publication.
which the potential is positive. In most cases, the signal is calibrated by the imposition of a potassium diffusion poten- tial. Fig. 8C summarizes the correlation between the potential (measured by =Rb distribution) and ANS quenching. Note that even for the potential generated by potassium gradient we actually measured the resulting potential rather than estimate it from the potassium gradient. The results indicate that in succinate-energized system and as a result of the generation of a diffusion potential the signal is a linear function of the potential at low potential but the sensitivity of response to the potential decreases at very high potential. This is expected from the model which assumes extrusion of ANS as a basis for quenching since the fluorescence due to internal binding should be already negligible at moderate potential. This also explains why the ANS fluorescence does not respond to the reduction of A$ on transition from state 4 to state 3 since both potentials (-150 and -130 mV, respec- tively) are above the responsive range. However, when ener- gized by ATP, the fluorescence appears linear over almost the entire range. This is mostly due to the lower potential gener- ated by ATP. The small nonlinear portion at low potential is probably due to an overcorrection of the direct ATP effect on ANS fluorescence from using oligomycin as a reference point. Considering the complexity of ANS binding and fluorescence in mitochondria, such small discrepancies are not unexpected. Even though ANS fluorescence in mitochondria appears to correlate with A$, the lack of sensitivity of the response at high potential together with the relatively small changes in fluorescence and its response to surface potential prohibit the use of ANS as a probe for A$ in mitochondria.
APPENDIX I
The Relation between ANS Fluorescence and the Surface Potential-To derive the relation between ANS binding and the surface potential, A$s, we start from the Gibbs free energy of the dissociation reaction for ions
Kd = exp(A€/RT) (1)
where K d is the dissociation constant, R the gas constant, and T the absolute temperature. A€ is the apparent Gibbs free energy of the dissociation which is a function of the surface potential. Hence
A€ = AGO + zFAJ., (2)
where z is the charge of the ion and F is the Faraday constant. Substitution of Equation 2 in 1 gives
Kd = exp(AG"/RT)exp(zFA$,/RT) (3)
and rearrangement
&/a = exp(zFA+dRT) (4)
where K: is the true dissociation constant. Thus, measure- ment of K$ and the apparent K d allow calculation of J / 8 from Equation 4 since
A$8 = (RT/ZF)ln(Kd/K% (5)
when concentration of the ligand is well below Kd the binding, b, is proportional to Kd. In general,
b = n[cl/(Kd + [ c ] ) (6)
where n is the binding capacity and [ e ] is the concentration of the ligand. However, when [ c ] << K d , Equation 6 is reduced to
b = n[C]/Kd (7)
Therefore, when [ c ] << K d , the fluorescence of ANS is pro- portional to the binding,
by guest on February 20, 2018http://w
ww
.jbc.org/D
ownloaded from

11048 ANS Fluorescence in Mitochondria
Bwchim. Bwphys. Acta 234, 177-181 6. Jasaitis. A. A.. Chu. L. V.. and Skulachev, V. P. (1973) FEES
where q is the quantum efficiency of bound ANS. If we measure the fluorescence, of membrane-bound ANS, at the same ANS concentration in the presence and absence of surface charge, it follows from Equation 8 that
FIFO = K!/Kd (9)
hence from Equations 9 and 4 we get
A$. = -(2.3RT/F)log(F/FQ) (10)
APPENDIX I1
Surface Potential as Function of Salt Concentration-The relation between surface potential, +., surface charge, q, and the ionic strength, [c]('"), is derived from the Poisson-Boltz- mann expression (25). For z-z electrolytes, the integration yields the following relationship (at 25 "C) (35)
q = 11.74[c]"*sinh(z~./51.7) (1)
when the solution contains both mono, [C'], and divalent, [C"], salts the following quadratic equation was obtained (35) 2[Cz']cosh'(F$./RT~ + [C]cosh(F$./RT)
(2) - (2[C2'] + [C'] + q2/2A2) = 0
112 ,~
where A = - ( R T t ) (e is the permativity of water). To solve 2r
Equation 2 numerically, we define X cosh 0.0387 (at 25 "C) and get the simplified expression
2[C2']X2 + [C'IX - (2[C2+] + [C'] + q 2 / z A 2 ) = 0 (3)
in order to fit the salt titration, we start by guessing a value for q that will satisfy Equation 3 when the initial measured value of +s is inserted in the expression. This procedure is reiterated to arrive at the best guess. Then we solve Equation 3 for different salt concentrations to arrive at the calculated dependence of +s on salt concentration.
REFERENCES 1. Azzi, A., Chance, B., Radda, G. K., and Lee, C . P. (1969) Proc.
Natl. Acad. Sci. U. S. A. 62, 612-619 2. Azzi, A. (1975) Q. Reu. Biophys. 8, 236-316 3. Njus, D., Ferguson, S. J., Sorgato, M. C., and Radda, G. K. (1977)
in Structure and Function of Energy Transducing Membranes (Van-Dam, K., and Van Gelder, B. F., eds) pp, 237-250, Elsev- ier/North-Holland Biomedical Press, Amsterdam
4. Rottenberg, H. (1975) J. Bioenerg. 7,63-76 5. Jasaitis, A. A,, Kuliene, V. V., and Skulachev, V. P. (1971)
Lett. 31,241-245 7. Williams. W. P.. Lavton. D. G.. and Johnston. C. (1977) J. , . .
Membr. Bioil. 33, i l - 4 0 8. Azzi, A., Gherardini, P., and Santato, M. (1971) J. Biol. Chem.
9. Kamo, N., Aiuchi, T., Kurihara, K., and Kobatako, Y. (1978) 246,2035-2042
Colloid Polym. Sci. 2 5 6 , 31-36 10. Haynes, D. H. (1974) J. Membr. Biol. 1 7 , 341-366 11. McLaughlin, S., and Harary, H. (1976) Biochemistry 15, 1941-
12. Aiuchi, T., Kamo, N., Kurihara, K., and Kobatake, Y. (1977) 1948
Biochemistry 16,1626-1630 13. Kamo, N., Muratsugu, M., Kurhara, K., and Kobatake, Y. (1976)
FEES Lett. 72,247-250 14. Melhorn, R. J., and Packer, L. (1976) Biochim. Biophys. Acta
15. Schafer, G., and Rowohl-Quisthoudt, G. (1976) J. Bioenerg. 8,
16. Archbald, G. P. R., Farrington, C. L., Lappin, S. A., McKay, A. M., and Malpress, F. H. (1980) Biochem. Znt. 1 , 422-427
17. Wojtczak, L., and Ndpcz, M. J . (1979) Eur. J. Biochem. 9 4 , 9 9 - 107
18. Rottenberg, H., Robertson, D., and Rubin, E. (1980) Lab. Znuest.
19. Greenawalt, J. W. (1979) Methods Enzymol. 55,88-98 20. Lindsay, J. G., Dutton, P. L., and Wilson, D. F. (1972) Biochem-
21. Rottenberg, H. (1979) Methods Enzymol. 55, 547-569 22. Wang, J. L., and Edelman, G. M. (1971) J. Bid. Chem. 2 4 6 ,
23. Rosenthal, H. E. (1967) Anal. Biochem. 20,525-532 24. McLaughlin, S. (1977) Curr. Top. Membr. Trans. 9, 71-144 25. Aveyrad, R., and Haydon, D. A. (1973) A n Introduction to the
Principle of Surface Chemistry, Cambridge University Press, London
26. Scarpa, A. (1979) in Membrane Transport in Biology (Giebisch, G., Tosteson, D. C., and Ussing, H. H., eds) Vol. 11, pp. 263- 354, Springer-Verlag, Berlin
423,382-397
73-81
42,318-326
istry 11, 1937-1943
1185-1191
27. Slavic, J. (1982) Biochim. Biophys. Acta 694, 1-25 28. Nordenbrand, K., and Ernster, L. (1971) Eur. J . Biochem. 18,
29. Lavton. D. G.. Svmmons, P.. and Williams. W. P. (1974) FEES 258-273
ie t t . 4 1 , l - 7 - . .
30. Radda, G. K., and Vanderkooi, J . (1972) Biochim. Biophys. Acta 265,509-549
31. Ferguson, S. J., Lloyd, W. J., and Radda, G. K. (1976) Biochim.
32. Gains, N., and Dawson, A. P. (1979) Eur. J. Biochem. 1 0 2 , 4 8 3 -
33. Bakker, E. P., and Van Dam, K. (1974) Biochim. Biophys. Acta
34. Quintanilha, A. T., and Packer, L. (1977) FEES Lett. 7 8 , 161-
35. Barber, J., Mills, J., and Love, A. (1977) FEES Lett. 7 4 , 174-
Biophys. Acta 423, 174-188
487
339, 157-163
165
181
by guest on February 20, 2018http://w
ww
.jbc.org/D
ownloaded from
D E Robertson and H Rottenbergbinding of 1-anilinonaphthalene-8-sulfonate.
Membrane potential and surface potential in mitochondria. Fluorescence and
1983, 258:11039-11048.J. Biol. Chem.
http://www.jbc.org/content/258/18/11039Access the most updated version of this article at
Alerts:
When a correction for this article is posted•
When this article is cited•
to choose from all of JBC's e-mail alertsClick here
http://www.jbc.org/content/258/18/11039.full.html#ref-list-1
This article cites 0 references, 0 of which can be accessed free at
by guest on February 20, 2018http://w
ww
.jbc.org/D
ownloaded from