Membrane and Desalination Technologies - Wang, Chen, Hung, Shammas

SMTC
Membrane & Desalination Research - Singapore Membrane Technology
Centre
Tony FANE and Ziggy CHONG
Singapore Membrane Technology Centre
Member of
the NEWRI Ecosystem

2
SMTC Singapore Membrane
Technology Centre

SMTC
3
Singapore - a world leader in membranes
& the water industry
Water 274ML/d
Desalination 455
NeWater 500
Wastewater MBR 23
> Megaton per day passing through membranes
Barrage 700 km2
4.7 m pop.
SMTC

SMTC
4
SMTC Overview
• Research & development
~ Membranes. Fundamental & applied research.
Environmental & Water Technologies.
• Education & Training
~ Manpower.
~ Outreach to the region.
• Industry & Application
~ Incubator for novel technology applications in EWT.
Full-time (equivalent) > 85 researchers
Funded by EDB/NTU/EWI (NRF)/Industry ~S$38m

SMTC
5
• Membranes
• Modules
• Fouling
• Processes
• Characterization
• Modeling etc
6 Themes
• Water Production
• Water Reclamation
• Wastewater MBRs
• Energy Issues
• Sensors & Monitoring
• Special Needs
Fundamental Generic Topics

SMTC
6
• Reverse Osmosis
- Novel membanes/modules
- Cascade design
- Biofouling
• Forward Osmosis
- Novel membranes/modules
- PRO (osmotic power)
• Membrane Distillation - Novel membranes/modules
- MDC
• Sensors & Monitoring
Outline

SMTC
7
• Low Pressure (MF,UF, NF)
- Novel membanes
- Fouling control
- Bubbles/vibrations/ultrasound
- Gravity driven (low energy)
• Membrane Bioreactors
- MBR fouling control
- High retention MBRs (FOMBR, MDBR)
- Extractive MBR
- Anaerobic fluidized bed MBR
• Membranes for Special Needs
- Hydrogel/cryogel „integral‟ membranes for WT
• Life Cycle Assessment
- RO desalination options
SMTC Research not on today‟s Agenda

SMTC
8 Pendergast & Hoek, Energy & Env.Sci. (2011), 4, 1946-1971
The Quest for „Super flux‟ RO membranes

SMTC
9
Biomimetic RO Membranes
Water
channels
Aquaporin Aquaporin
Tetramer
Aquaporins are pore-forming membrane proteins.
High water permeability- low salt transmission.
Basis for desalination membranes ?
M.Kumar et al., PNAS (2007), 104, p 20719-

SMTC
10
Y Zhao et al., Synthesis of Robust & High-performance AqP-based RO, J Memb. Sci. ( 2012)
Biomimetic RO Membrane
- TFC incorporating AqP vescicles
CY Tang et al., AqP-based TFC membrane. US Provisional Patent (2011)
CY Tang et al. Desalination by biomimetic AqP: Review of status. Desalination,308 (2013)
[EWI project 0804-IRIS-02]

SMTC
11
Biomimetic RO Membranes with Aquaporin incorporated
Water flux Rejection
RO with Aqp Z wild type has higher flux and similar rejection.

SMTC
12
Aquaporin InsideTM RO/FO Membranes - patent pending
Commercialization through Aquaporin Asia P L.
Biomimetic RO Membranes with Aquaporin incorporated
@ 5 bar
~ 50%
improvement.
Future work to
increase Aqp
content.
ABM-wt superior based on t-Test analysis (>99% confidence). Based on 4-8 independent samples
[EWI project 0804-IRIS-02]

SMTC
13
Improving the efficiency of membranes in the Water Industry
(EWI RPC 0901)
The quest for „new generation‟ high performance membranes will come to
nothing unless we can develop new paradigms for control of CP and fouling
SMTC
14
1.0
1.1
1.2
1.3
1.4
1.5
0 5 10 15 20 25
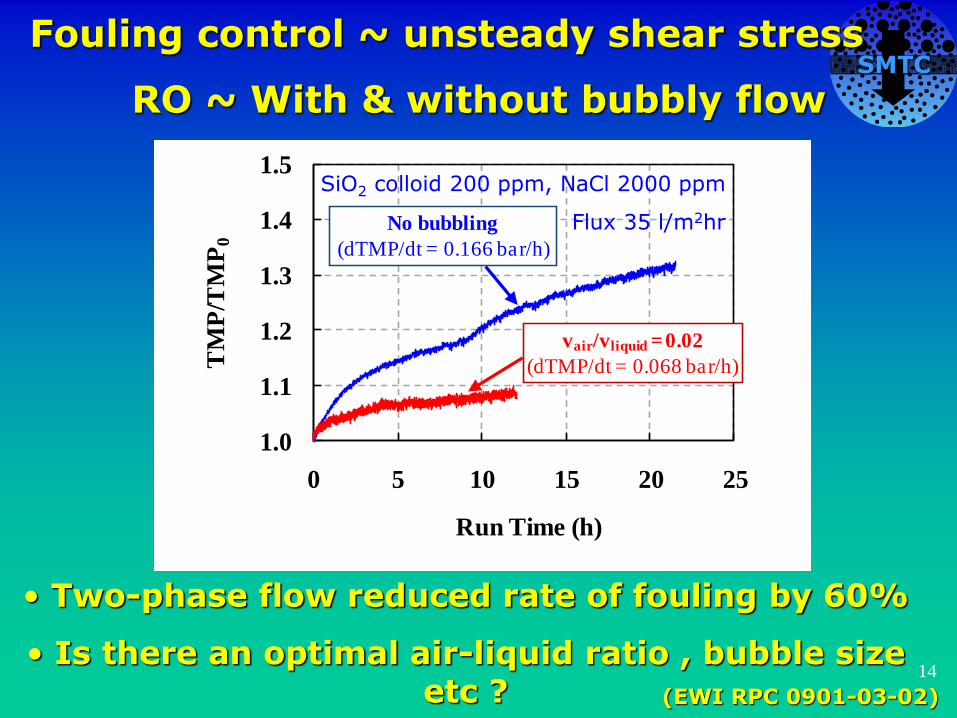
No bubbling
(dTMP/dt = 0.166 bar/h)
vair/vliquid = 0.02
(dTMP/dt = 0.068 bar/h)
Run Time (h)
TM
P/T
MP
0
RO ~ With & without bubbly flow
• Two-phase flow reduced rate of fouling by 60%
• Is there an optimal air-liquid ratio , bubble size etc ? (EWI RPC 0901-03-02)
SiO2 colloid 200 ppm, NaCl 2000 ppm
Flux 35 l/m2hr
Fouling control ~ unsteady shear stress

SMTC
15
• Reverse Osmosis
- Novel membanes/modules
- Cascade design
- Biofouling
• Forward Osmosis
- Novel membranes/modules
- PRO (osmotic power)
• Membrane Distillation - Novel membranes/modules
- MDC
• Sensors & Monitoring
Outline

SMTC
16
Forward Osmosis
Membrane Distillation
• Atmospheric pressure membrane processes.
• Can use waste or solar heat (low GHG options).
• Osmotic gradients (FO)
Needs:
• Specialized membranes.
• Optimization of module design and operation.

SMTC
17
FO Thin Film Composite Hollow Fibers by Interfacial Polymerization
Polyethersulfone (PES) used for tailored substrate.
Interfacial polymerization chemistry (MPD+TMC-> RO skin).
Wang,R. et al. J.Memb.Sci., 355, (2010)
Chou,S. et al. Desal., 261, (2010)
Shi,L. et al. J.Memb.Sci., 382 (2011)
Qiu,C. et al. Desal, 287 (2012)
Setawan,L. et al. J.Memb. Sci, 394 (2012)
EWI Project
0801-IRIS-05
• Need RO-like skin on a thin and porous substrate

18
#A
#B
RO-like skin layer
RO-like skin layer
Thin Film Composite FO Hollow Fibers
(RO-like skin layer + UF-like skin layer)
#C
RO-like skin layer
Desalination, 61 (2010) 365–372
JMS, 355
(2010) , 158–
167
Sample Water flux
(L/m2.hr)
Solute flux /water
flux (g/L) Draw solution feed
#A-FO hollow fiber 12.9 0.39 0.5 M NaCl DI water
#B-FO hollow fiber 32.2 0.11 0.5 M NaCl DI water
#C-FO hollow fiber 42.6 0.094 0.5 M NaCl DI water
18

SMTC
19
HTI FO membrane
Commercial TFC flat-sheet FO membrane
SMTC
TFC hollow fiber FO membrane
SMTC
Performance of SMTC FO membranes
Better membrane (high water flux, low
salt/water ratio)
Membranes developed in SMTC have substantially better performance than available commercial FO membranes.
Hollow Fibres and Flat Sheets

SMTC
20
RO-like
skin
layer
Novel Hollow Fibre FO Membrane Performance
Wang Rong
et al. SMTC
RO
FO

SMTC
21
Applications Potential Benefits Needs
Immediate applications if FO membrane is available
Pressure Retarded
Osmosis (PRO)
Power generation Membrane
Draw (brine, seawater)
FO concentration
/dewatering
(food, pharmaceutical
processing)
Low energy process
No temperature
detrimental effect
Membrane
Draw (brine, seawater)
Applications if FO membrane & draw solute are available
FO desalination Lower energy
desalination
Membrane
Draw solution
regeneration
FO bioreactor High quality product
water
Membrane
Bioreactor
Draw solution
regeneration
Potential Applications of FO

SMTC
22
Pressure-retarded Osmosis
Bench mark
is 5W/m2 Statkraft
Chou, Wang
et al., (2012),
JMS, 389
SMTC
23
0 10 20 30 40 500
20
40
60
0.5M
0.75M
1.0M
Computed
Ideal
Pow
er d
ensi
ty W
(W
/m2)
Hydrostatic pressure difference P (bar)
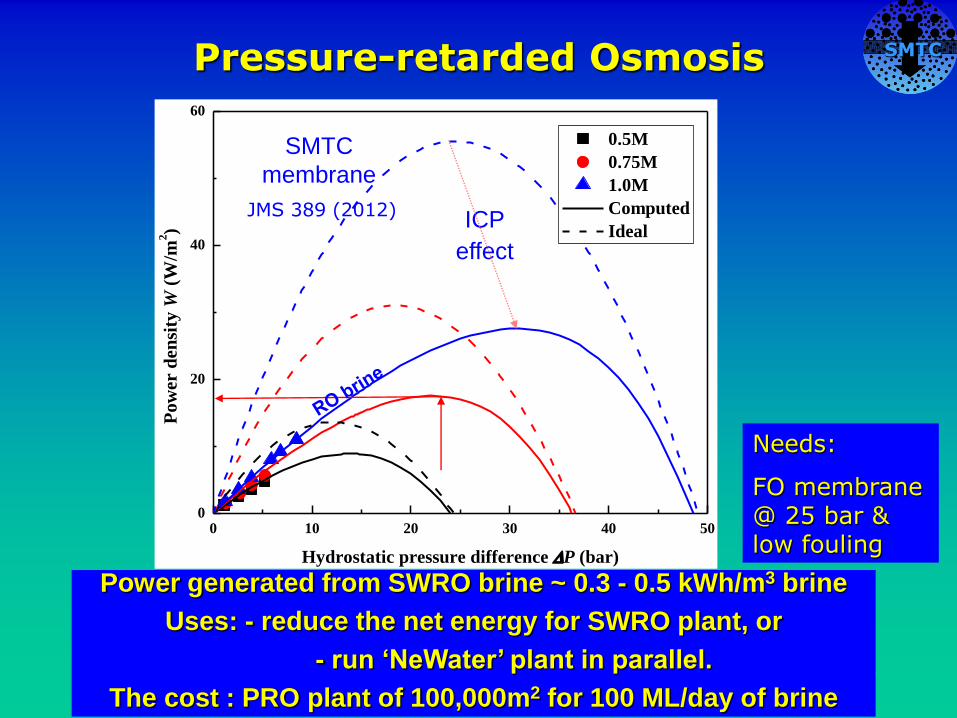
Pressure-retarded Osmosis
Power generated from SWRO brine ~ 0.3 - 0.5 kWh/m3 brine
Uses: - reduce the net energy for SWRO plant, or
- run ‘NeWater’ plant in parallel.
The cost : PRO plant of 100,000m2 for 100 ML/day of brine
SMTC
membrane
Needs:
FO membrane @ 25 bar & low fouling
ICP
effect
JMS 389 (2012)

SMTC
24
• Reverse Osmosis
- Novel membanes/modules
- Cascade design
- Biofouling
• Forward Osmosis
- Novel membranes/modules
- PRO (osmotic power)
• Membrane Distillation - Novel membranes/modules
- MDC
• Sensors & Monitoring
Outline

SMTC
25
0.05 0.10 0.15 0.20 0.25 0.30
0
2
4
6
8
10
12
14
16
18
Flux
NaCl mass fraction in the feed
Flu
x(L
/m2/H
ou
r)
0
20
40
60
80
100
Conductivity of permeate
Co
nd
uctiv
ity o
f pe
rme
ate
(us)
Membrane Distillation (Water vapour transport through hydrophobic membrane)
RO MD MD
Crystallization
water recovery cumulative (%)
50 ~90 ~100
3.5 % S 7.0 % S 25 % S S
Heated Feed
Cool Permeate
membrane
Vapour presure profile
Pf
Pp
EWI Project 0901-02-03
Good flux @ high salt (25%)
Osmotic P > 200 bar
VP lowering not fouling

SMTC
26
PVDF nanofiber
Nanoparticle coating
b
a
1
0 2 4 6 8
0
20
40
Flu
x (K
gm-2h
r-1)
Time (hr)
0
10
20
30
40
50 PVDF
S-PVDF
I-PVDF
Per
mea
te C
ond
uct
ivit
y (
S)
Novel MD Membranes
Liao et al. JMS 425 (2013)
0 2 4 6 8
0
20
40
Flu
x (
Kgm
-2h
r-1)
Time (hr)
0
10
20
30
40
50 PVDF
S-PVDF
I-PVDF
Commerical PVDF
Per
mea
te C
on
du
ctiv
ity (
S)
Electrospun with nanoparticle coating is super hydrophobic (Contact angle = 153 deg),with
good flux and no wetting.
EWI Project 0901-02-03

SMTC
27
Counter-current with improved shell-side flow
Fibre packing can be optimized to enhance flow
distribution & flux (200% improvement vs random)
Yang Xing et al. JMS 384 (2011)
Flux enhancement in MD module
Novel shell-side packing
3.5% NaCl: 0
4
8
12
16
20
0 1000 2000 3000N
/ (
kg
·m-2
·h-1
) Ref
curly fibercentral tubingspacer wrapped fiberspacer knitted fiberstraight fiber (structured)
3.5% NaCl: Tf = 500C
Re (Feed side)

SMTC
28
Counter-current with improved shell-side flow
Fibre packing can be optimized to enhance flow
distribution & flux (200% improvement vs random)
Yang Xing et al. JMS 384 (2011)
Flux enhancement in MD module
Novel shell-side packing
3.5% NaCl: 0
4
8
12
16
20
0 1000 2000 3000N
/ (
kg
·m-2
·h-1
) Ref
curly fibercentral tubingspacer wrapped fiberspacer knitted fiberstraight fiber (structured)
3.5% NaCl: Tf = 500C
Re (Feed side)
NMR Flow
Imaging
SMTC
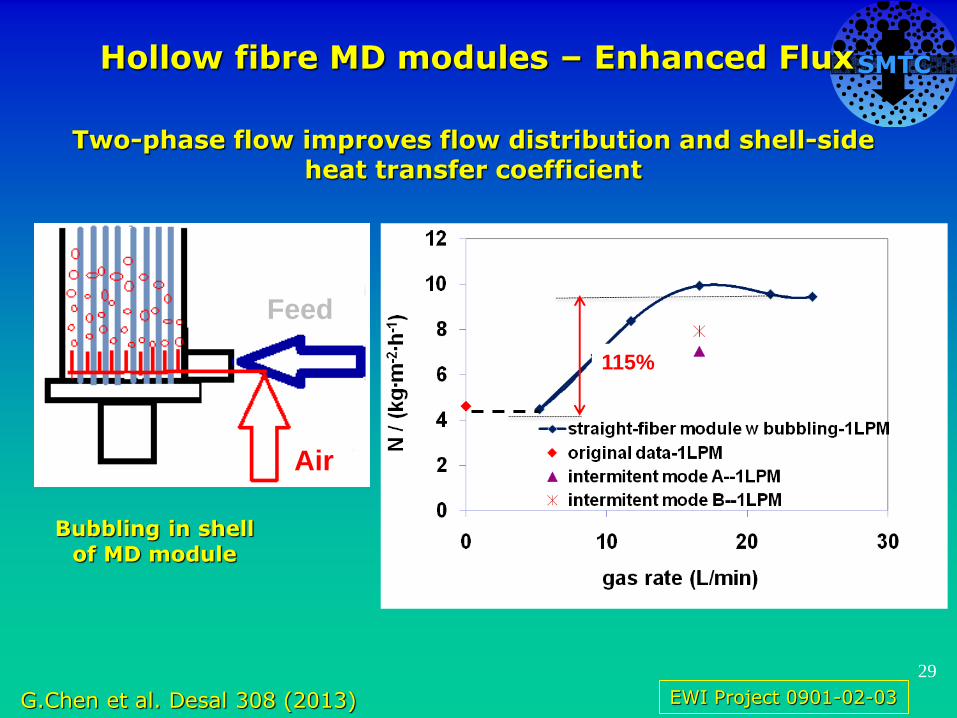
29
Air
Feed
Bubbling in shell of MD module
Two-phase flow improves flow distribution and shell-side heat transfer coefficient
115%
G.Chen et al. Desal 308 (2013)
Hollow fibre MD modules – Enhanced Flux
EWI Project 0901-02-03

SMTC
30
Modelling MD Energy Efficiency.
Factors influencing GOR.
[GOR = kg distillate per kg steam (equivalent)]
Effects of membrane area and feed temperature on the GOR
(feed velocity: 0.04m/s, feed concentration: 3.0wt%,
permeate velocity: 0.48m/s, permeate temperature: 25 ºC)
30
Flux
6.9
6.5
5.9
4.9
3.6
membrane ‘coefficient’,doubled
GOR increases with feed temps, fluid velocities, module length etc.
GOR increases with membrane ‘coefficient’, and is f (module design, MD mode etc)
Cross flow module
G Zuo et al. Desalination 283 (2011)

SMTC
31
Continuous MD crystallization (CMDC) process with zero discharge
Experimental set-up for the continuous membrane distillation crystallization
EWI Project 0901-02-03
Osmotic pressure > 200 bar
28%
No wetting
VP lowering
- not fouling
Counter current module
0
2
4
6
8
10
12
1 10 100 1000 10000
Volume percentage (%)
Crystal size (µm)
sample 7sample 8sample 9sample 10sample 11
Salt product from MDC
EWI 0901-IRIS-02-03

SMTC
32
• Reverse Osmosis
- Novel membanes/modules
- Cascade design
- Biofouling
• Forward Osmosis
- Novel membranes/modules
- PRO (osmotic power)
• Membrane Distillation - Novel membranes/modules
- MDC
• Sensors & Monitoring
Outline

SMTC
33 33 33
Sensors for Fouling Control in RO
Feed Fouling Monitor –
state of the feed
Canary Cells , monitor
– state of the process - EIS and UTDR
RO Train
System Optimization
(EWI RPC 0901-03)

SMTC
34
Membrane
fouled by
BSA
Unfouled
membranes
20ppm BSA + 2000ppm NaCl
EIS Analysis of different foulants
Gskin
Cskin
Gsub
Csub
Membrane
Gsol
Gdif
Cdif
Silica fouled
Membrane and foulant layers represented as capacitance and conductance elements. (Maxwell
Wagner Elements)
Feed Reten
tate Perme
ate
Voltage
electrodes
Membrane
Current
injecting
plate
electrodes
Insulating plates (plastic
gasket)
InphazeTM Impedance
Spectrometer
V
+
V- I
+
I
-
Hans Coster et al. (EWI RPC 0901-03)

35
BSA (100 ppm) Silica (200 ppm)
BSA „film‟
Silica „cake‟
Biofilms ?
Silica
EIS signal preempts
the TMP rise
Nyquist Plots

SMTC
36
Ultrasonic Time Domain Reflectometry Fouling Monitor
• Scale, Organics (Greenberg, Krantz et al.)
• Colloids (SMTC)
Foulant
Thickness
Time (hr)
Cross flow velocity

SMTC
37
UTDR
measures 8- 10
microns TMP/TMP0
Confocal thickness of
8 -10 μm.
Thickness
TMP/TMP0
Ultrasonic Time Domain Reflectometry Fouling Monitor
• Scale, Organics (Greenberg, Krantz et al.)
• Colloids, Biofilms using Acoustic Enhancer (SMTC)
Biofilm thickness vs
Sim et al. Pat. Pending

SMTC
38
Feed Fouling Monitor & UTDR
200ppm silica and 2g/L NaCl; Crossflow velocity = 0.1m/s
Feed Fouling Monitor (FFM) measures fouling propensity
of feed. Estimate of RF vs time.
UTDR measures fouling thickness trends, to
estimate CEOP
measured estimated
TMP Estimation : (RF and CEOP) Colloidal fouling
Flux

SMTC
39
• Reverse Osmosis
- Novel membanes/modules
- Cascade design
- Biofouling
• Forward Osmosis
- Novel membranes/modules
- PRO (osmotic power)
• Membrane Distillation - Novel membranes/modules
- MDC
• Sensors & Monitoring
Outline

SMTC
40 40
Biofouling in RO
• Biofilm formation on membrane - Biofilm enhanced osmotic pressure (BEOP)
ΠMRJRJTMP fm
kJCCM bw exp
cakecake Dk

SMTC
41 41
Biofouling in RO
• Biofilm formation on spacer - Channel pressure drop Pch
Work by Vrouwenvelder et al.
Biofilm preferentially form on spacer,
„blocking‟ flow path increase in P
Biofouling is a spacer problem, membrane
flux does not play a role
Crossflow increases nutrient supply at the
boundary layer greater fouling
Biofouling rate increase with crossflow
through the increase in Channel Pressure
Drop, P = f(va)
Exp Conditions:
No Flux No
BEOP Effect, M
= exp (J/k)
Low Salinity
Negligible BEOP
Effect
Contrast to BEOP model for biofouling:
(i) flux is important (ii) crossflow decreases fouling
through M = exp (J/k)

SMTC
42 42
Biofouling in RO
• Effect of flux - Greater fouling rate, non linear exp (J/k)
35 LMH
20 LMH
flow

SMTC
43 43
Biofouling in RO
• Effect of nutrient - Fouling rate is nutrient dependent
- Fouling rate is a function of M = Cw/Cb = exp (J/k)
control nutrient level at membrane surface (nutrient polarization)
Nutrient
Concentration
R² = 0.9435
0.0
0.2
0.4
0.6
0.8
1.0
6.5 7.0 7.5 8.0 8.5 9.0
dT
MP
/dT
(B
ar/d
ay
)
Cw,N (mg/L TOC)

SMTC
44 44
Biofouling in RO
• Role of spacer - No spacer: more uniform but thicker
- With spacer: local shear local flux patchy biofilm
Spacer
(diamond) Diamond
(inverted 45o)
diamond
No Spacer

SMTC
45 45
Biofouling in RO
• Effect of crossflow - Reduce fouling rate, lower exp (J/k) since k ~ u1/3
- Increase channel pressure drop, Pch ~ u2
- Membrane (flux & crossflow is important) vs. spacer (only crossflow is important) problem
- dTMP/dt >> dPch/dt
crossflow

SMTC
46 46
Biofouling in RO
• Control strategies - Even flux – internal hybridization
- Crossflow – lower exp (J/k)
- Nutrient removal, far more effective than control “number” of bacteria
- Spacer design
less permeable More permeable

SMTC
47
ACKNOWLEDGEMENTS
EDB Singapore and Environment and Water Industry Programme Office (EWI) under National
Research Foundation (NRF) for supporting the Singapore Membrane Technology Centre.
The SMTC Family
http://smtc.ntu.edu.sg

SMTC
49
Supplementary Information

SMTC
50
Osmotic Pressr
Feed side Pressr
„Close to Osmotic Pressure Strategy‟
25 bar
50 bar
stages
30
35
40
45
50
„Super flux‟ membranes could save ~30% desalination energy.
Reverse Osmosis
Energy usage is ~ 2 x the theoretical minimum
65

SMTC
51
Aquaporin Characterization
Stopped-flow measurement of water
permeability
Aquaporin Z wild type permeability ~ 10x that of Aqp Z R189 mutant
K=190 s-1
K=20 s-1

SMTC
52
0
5
10
15
20
25
197
6
197
8
197
9
198
1
198
2
199
0
199
2
199
7
199
8
199
9
200
5
200
6
200
7
200
8
200
9
201
0
201
1
201
2
Num
ber
of
arti
cle
on F
O p
ubli
shed
in J
MS
Year
Publications of FO papers in JMS up to June 2012 Distribution of FO publications in each section
JMS 1st issue
in1976
Journal of Membrane Science: Virtual Special Issue
Forward Osmosis: Current Status and Perspectives
Editors: Rong Wang, Laurentia Setiawan, Anthony G. Fane
Resurgence of Interest in Various Osmotic Processes

SMTC
53
High Retention MBRs
M
W/W
S A
M
W/W
S A
X H2O
H2O
QH
QH
Membrane Distillation Bioreactor (MDBR)
Forward Osmosis Bioreactor (FOMBR)
Driving force : waste or solar
heat
(ORT = HRT , to improve permeate quality)

SMTC
54
Membranes for Special Needs
Applications in Myanma &
Indonesia (Adrian Yeo et al.)
Decision tree for process selection (Loo et al. Water Res, 46 (2012) )

55
Cryogels as integral membranes for
emergency water treatment
55
(a) Dried/deswollen PSA cryogel
(b) Swelling in
contaminated water
(c) Water recovery by
manual compression
PSA cryogel
Raw water
Treated water
H2O
0
20
40
60
80
100
120
1 2 3 4 5
Pe
rce
nta
ge
(%
)
Operational cycles
Turbidity removal
Water recovery
Loo et al., Soft Matter, 9 (2013))

SMTC
56
Membrane Integrity Sensor (MIS)
Label:
1 Spring 2 O-Ring 3 Membrane 4 Lever 5 Pressure Transducer 6 Feed (Inlet) 7 Backwash 8Tuning Valve

SMTC
57
0.001% compromised (1 in 105 fibres) Change in water quality equivalent to 1 in
100,000 broken fibers
Particle Counter
Turbidity Meter
MIS
No change detected
No change detected
Change detected in 10 mins

58
Life Cycle Assessment (LCA)
LCA is a technique to assess environmental impacts associated with all the
stages of a product's life from-cradle-to-grave.
Advantages:
(1) Holistic evaluation
upstream + usage + downstream
(2) Wide application
industry + government
(2) Top research area
publications + special issue

59
LCA research in SMTC NTU
LCA fundamental study: Singapore life cycle Inventories [1], Customization of
system boundary & impact indicators to local context [2, 4]; Improvement of impact
assessment models for brine disposal [3]
LCA applications: Desalination [1], Wastewater management [5]; Disinfection
process [6], Water supply plans [under development]; Innovative membrane
technologies [under development]
LCA for decision making: Integration with economic & social impact analysis [4],
normalization and weighting system for Singapore [under development]
1) Jin Zhou, Victor W.C. Chang, Anthony G. Fane (2011a). "Environmental LCA of Brackish Water Reverse Osmosis Desalination for Different Electricity Production Models", Energy and Environmental Science, Vol. 4, No. 6, pp. 2267-2278.
2) Jin Zhou, Victor W.C. Chang, Anthony G. Fane (2011b). "Environmental LCA of RO Desalination: The Influence of Different LCIA on the Characterization Results", Desalination, Vol. 283, pp. 227-236.
3) Jin Zhou, Victor W.C. Chang, Anthony G. Fane (2013). "An Improved LCIA Approach for Assessing Aquatic Eco-toxic Impact of Brine Disposal from Seawater Desalination Plants", Desalination, Vol. 308, pp. 233-241.
4) Jin Zhou, Victor W.C. Chang, Anthony G. Fane (2013). “Issues of Applying LCA to Desalination: Feasibility, Reliability, and the Potential to Use LCA for Decision Making”, submitted to Water Research
5) Bernard J.H. Ng, Jin Zhou, Victor W.C. Chang, et.al. (2013). “Environmental Life Cycle Assessment of Municipal Wastewater Streams in Conventional Activated Sludge System”, submitted to International Journal of Life Cycle Assessment.
6) Jin Zhou, Victor W.-C. Chang, Christian Zwiener, et.al.(2013). “Health Risk Evaluation of Disinfection By-Products (DBPs) for Indoor Swimming Pool Users via LCIA Approach”, in preparation.

1
Desalination in Singapore –
Current Status & A Peek into the Future
Puah Aik Num
Technology Department
PUB Singapore

2
To ensure a sustainable quality environment in Singapore
To ensure an efficient, adequate and sustainable supply of water
To deliver and sustain a clean and healthy environment and water resources for all in Singapore.
PUB : Part of Singapore’s MEWR Family
Clean Land
Clean Air
Public Health
Water Supply
Used Water
Drainage
Background of PUB

3
SINGAPORE WATER SCENES
THEN AND NOW

4
40 years ago…
What we were like
in the Sixties
Singapore River
Singapore River

5
Water resources were scarce…
1960’s
Last water rationing in 1963
water rationing

6
Public Health Concerns
1960’s
• Public Health Conditions were poor…
• Proper sanitary facilities were lacking…
Street hawkers
Night soil buckets Outdoor Latrines
Squatters

7
Our rivers were polluted…
1960’s
Kallang River Singapore River
Kallang River

8
Clean Rivers 80’s and 90’s
Singapore River Singapore River
Singapore River

9
Pristine reservoirs…
Before 1960’s: Reservoirs in Protected Catchments
1970’s: Estuarine Reservoirs
1980’s: Reservoirs in Urbanised Catchments
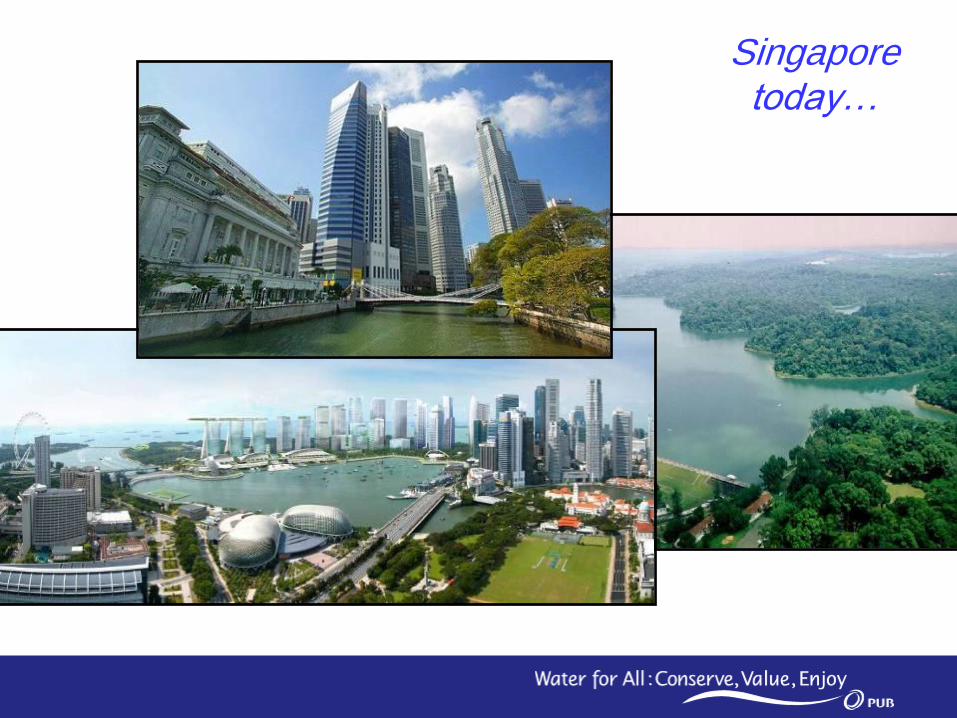
10
Singapore today…

11

12
SINGAPORE WATER CHALLENGES

13
Singapore’s Water Challenges
Singapore
• Land Area: 710 km2
• Population: 5.18 million people • Water Demand: 1.8 million m3/day
• Rainfall: 2.4 m/year • Catchment areas: 66%
Lack of Storage
Competing Land Use

14
Rising Energy Prices
Stringent Regulations
& Public Expectations
Prices set to
increase in
the long run
Population Growth
Rise of Megacities
Climate Change
No Pristine
Water
Sources
Challenges Ahead

15
2012 water demand = 1.8 million m3/day
2060 water demand = almost double that of today

16
INTEGRATED WATER MANAGEMENT

17
sea rain stormwater
management
collection
of rainfall
in drains &
reservoirs
treatment of
raw to potable
water
reclamation
of
used water
collection
of used water
in sewers supply of
water to the
population &
industries
treatment
of
used water
desalination
Closing the Water Loop
Natural Water Cycle:
New drop NEWater:
2nd drop
Desalination:
New drop

18

19
LEVERAGING ON TECHNOLOGY

20
Reduce Production and Distribution Cost
Enhance Water Quality and Security
Increase Water Resources
Chemical Usage
Waste
Energy
Objectives
Drivers
Leveraging Technological Innovations R&D to achieve water sustainability
21
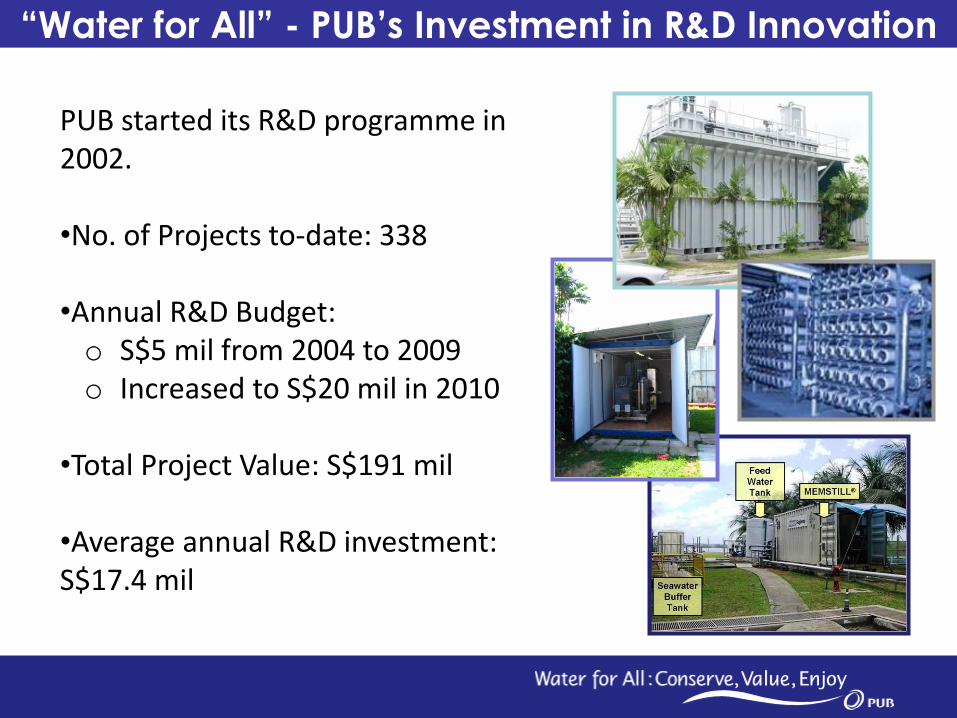
PUB started its R&D programme in 2002. •No. of Projects to-date: 338
•Annual R&D Budget: o S$5 mil from 2004 to 2009 o Increased to S$20 mil in 2010
•Total Project Value: S$191 mil
•Average annual R&D investment: S$17.4 mil
“Water for All” - PUB’s Investment in R&D Innovation

22
Upstream
fundamental
research* * Usually carried out in laboratory scale in tertiary and research institutes
Pilot-plant
studies
Demonstration
-plant studies
Technology &
Water Quality Office
PDIKM Teams
Water Supply Network
Water Supply Plants
Water Reclamation Plants
Water Reclamation Network
Catchment & Waterways
InfoComm
PUB’s Role in R&D

23
sea
R&D Projects across the Water Loop
rain stormwater
management
collection
of rainfall
in drains &
reservoirs
treatment of
raw to potable
water
reclamation
of
used water
collection
of used water
in sewers supply of
water to the
population &
industries
treatment
of
used water
desalination
Variable
Salinity
Process
Low
Energy
MBR
Water Quality
Modelling and
Prediction
Integrated
Anaerobic &
Aerobic
Treatment
Real-Time Water
Quality Monitoring
and Analysis Regenerative
Photocatalysts
Biomimetic
Techniques
Microbial
Fuel Cell
Sensor
Capacitive
Deionisation
Source
Control
Reducing
Evaporation
Membrane
Distillation
DOHS
Backwash
Membrane
Integrity
Sensors
Rainfall
Prediction
Smart
water
grid
Microbial
Source
Tracking
Contaminants
of Emerging
Concerns
Electrochemical
desalination
Pressure
Retarded
Osmosis

24
Revised Technology Roadmap
Biological Processes
• UASB-MBR
• Anaerobic / Anammox Systems
• Biogas production
• Energy recovery systems
Chemical Redox
• Advanced oxidation technologies
• Disinfection technologies
Membranes for Desal & NW
• Ceramic Membranes
• Electrochemical desalting
• Biomimetics / Biomimicry
• Membrane fouling control
• Process improvements
• Membrane improvements
Sludge and Brine Management
(EWW Nexus)
• Osmotic power PRO/RED
• Sludge-to-energy conversion
• Resource recovery from residues
• Sludge management
Sensors and Instrumentation
• Rapid detection of emerging
pollutants, PPCPs, nanoparticles
• Fish biosensors
• Rapid microbial detection
• Sensors for membrane systems
Improve
and Protect
Water Quality Reduce
Energy Consumption
Increase
Water
Resources
Minimize
Waste Generation
Lower
Chemical Usage
Decrease
Water Production
Costs
Technically Feasible and
Economically Viable Water Solutions New Ideas and Innovations
Water Distribution
•WQ sensor development
•Smart grid development (data mining
and data analytics)
•Network Modelling / Cloud computing
Watershed Management and Flood
Management
• WQ sensor development
• Intelligent watershed management
(data mining and analytics)
• Climate change modelling
• Phytoremediative treatment of water
Groundwater / Underground Caverns
• Geophysical/geotechnical surveys
• Water quality
management/treatment
• Sustainable water extraction and
use
• Energy recovery Decentralised Water Treatment
Technologies
•Small-scale point of use technologies
•Greywater Recycling
•Stormwater technologies
Industrial Water Technologies
• Industrial wastewater treatment
• Membrane distillation
• Seawater cooling
• Adsorption chillers
• Novel heat exchangers
• Reduction in evaporative loss
25
Desalination in Singapore

26
• Infinite resource
• Readily available
• Enable water self-sufficiency in Singapore
Desalination in Singapore
By 2060, desalinated water will
contribute 30% of Singapore’s
water demand, increase from 10%
currently
BUT…
Energy consumption is high
(about 3.5 kWh/m3 with RO)

SWRO Current 3.5 kWh/m3
Short-term < 1.5 kWh/m3
– Variable Salinity Process : 1.7 kWh/m3
– Memstill (with waste heat): 1.0 kWh/m3
Breakthrough
R&D
Biomimetic Membranes ; Biomimicry of Natural Desalination Processes
Mangrove
Long- term < 0.75 kWh/m3
Aquaporins
R&D Approach – Journey to Low Energy
Seawater Desalination

28
Desalination – Current Status

29
Membrane Distillation for Desalination
• Heat recovery process to produce distilled water for drinking
/ process water
• Uses low-grade waste heat from industries
Using waste heat as a resource
Potential to recover 40 – 160 MGD of water from
JI industries
• Energy consumption < 1 kWh/m3 obtained
through pilot-scale studies
• Water quality is better than NEWater
Memstill module

30
• To tap the small canals in the fringe catchment to augment Singapore’s water
supply
• Able to treat canal water and seawater interchangeably
• Developed from Pilot to Demo-scale in 2-3 years.
• VSP Demo plant completed in July 2007.
• Demo plant allowed for the testing of assumptions and predictions
• Achieved mode of operations: 60% freshwater and 40% seawater
Variable Salinity Process
Benefits:
Lower energy consumption:
3.5kWh/m3 to 1.7kWh/m3
Increase catchment area from two-thirds to 90% of Singapore’s land area

31
Novel Electrochemical Desalination Technology
• Project awarded under EWI’s challenge call in 2007
to reduce energy consumption for desalination to
<1.5 kWh/m3
• 50 m3/day ED/CEDI system commissioned in Feb
2011 in VSP at Tampines
• Energy consumption: 1.4 – 1.8 kWh/m3
• Recovery of 20 – 35%
• Optimisation of operating conditions ongoing
• Commercial unit currently being designed
• Further demonstration studies to be carried
out in PUB’s installations

32
Desalination – Peek into the Future

33
Potential Applications:
1. Seawater desalination membrane
3.5kWh/m3 to 0.75kWh/m3
2. RO membrane for NEWater
production
0.8kWh/m3 to 0.3kWh/m3
Aquaporin:
High water flux
Quantitative
rejection of Na+
and Cl- ions
Cell Membrane Cell Membrane
Aquaporin
Water Channel
Biomimetic Membranes – Inspiration from Human Kidney

34
High Salinity Water
Brackish
Water Fish
Marine Fish
Mangrove Marine
Algae
Biomimicry of Natural Desalination Processes

35
Global Water Players & Utilities
Access to Ideas and Expertise through Partnerships
Overseas Institutions
Local Water Companies Local Academic Institutions
AEBC

36
• Seawater desalination is critical for water sustainability in Singapore
• Continuous R&D is important to overcome water challenges through
Pilot-testing in PUB’s installations
Demonstration testing for operational experience & validation
testing
Collaborations with various partners
• Technologies developed locally can be adopted by water-stressed
coastal countries
Concluding Remarks

37
Thank You