Member States’ Energy Dependence: An Indicator-based ...
270
EUROPEAN ECONOMY Occasional Papers 145 | April 2013 Member States’ Energy Dependence: An Indicator-Based Assessment Economic and Financial Affairs ISSN 1725-3209
Transcript of Member States’ Energy Dependence: An Indicator-based ...

EUROPEAN ECONOMY
Occasional Papers 145 | April 2013
Member States’ Energy Dependence: An Indicator-Based Assessment
Economic and Financial Aff airs
ISSN 1725-3209

Occasional Papers are written by the Staff of the Directorate-General for Economic and Financial Affairs, or by experts working in association with them. The “Papers” are intended to increase awareness of the technical work being done by the staff and cover a wide spectrum of subjects. Views expressed do not necessarily reflect the official views of the European Commission. Comments and enquiries should be addressed to: European Commission Directorate-General for Economic and Financial Affairs Publications B-1049 Brussels Belgium E-mail: mailto:[email protected] Legal notice Neither the European Commission nor any person acting on its behalf may be held responsible for the use which may be made of the information contained in this publication, or for any errors which, despite careful preparation and checking, may appear. This paper exists in English only and can be downloaded from the website ec.europa.eu/economy_finance/publications A great deal of additional information is available on the Internet. It can be accessed through the Europa server (ec.europa.eu ) KC-AH-13-145-EN-N ISBN 978-92-79-28559-2 doi: 10.2765/41957 © European Union, 2013 Reproduction is authorised provided the source is acknowledged.

European Commission
Directorate-General for Economic and Financial Affairs
Member States' Energy Dependence: An Indicator-Based Assessment
EUROPEAN ECONOMY Occasional Papers 145

ABBREVIATIONS
ii
COUNTRIES
AT Austria BE Belgium BG Bulgaria CY Cyprus CZ Czech Republic CIS Commonwealth of Independent States DE Germany DK Denmark EE Estonia EL Greece ES Spain FI Finland FR France HU Hungary IE Ireland IT Italy LT Lithuania LU Luxembourg LV Latvia MT Malta NL Netherlands NO Norway PL Poland PT Portugal RO Romania RU Russia SE Sweden SI Slovenia SK Slovakia TR Turkey UA Ukraine UK United Kingdom US United States
OTHERS
AAU Assigned Amount Units bn Billion CA Current account CER Commission for Energy Regulation CHP Combined heat and power DG ENER Directorate-General for Energy DSO Distribution system operator EBRD European Bank for Reconstruction and Development EDI Energy dependence indicators EEPR European Energy Programme for Recovery EC European Commission EEA European Economic Area ERGEG European Regulators' Group for Gas and Electricity ESO Electricity system operator

iii
ETS Emission Trading Scheme EU European Union EUR Euro Euratom European Atomic Energy Community FEC Final energy consumption GDP Gross domestic product GIC Gross inland consumption GIS Green Investment Scheme GHG Greenhouse gas GME Gestore Mercati Elettrici GVA Gross value added GWh Gigawatt hour HHI Herfindahl-Hirschman index HICP Harmonized index of consumer prices IEA International Energy Agency ILUC Indirect land use change ITO Independent transmission system operator JRC Joint Research Center LNG Liquefied natural gas LPG Liquefied petroleum gas LTC Long-term gas contract LULUCF Land use, land use change and forestry kcal Kilocalories kg Kilogram km Kilometre ktoe Kilo tonnes of oil equivalent kV Kilo volt kWh Kilowatt hour MS Member State Mt Million tonnes Mtoe Million tonnes of oil equivalent MW Megawatt MWe Megawatt electrical NEEAP National Energy Efficiency Action Plan NREAP National Renewable Energy Action Plan NTC Net transfer capacity OPEC Organization of the Petroleum Exporting Countries PJ Petajoule PPS Purchasing power standard p.p. Percentage points PSO Public sector obligation PV Photovoltaic REFIT Renewable energy feed-in tariff RES Renewable energy sources SEAI Sustainable Energy Authority of Ireland SEM Single electricity market tCO2-eq Tonnes of carbon dioxide equivalent TSO Transmission system operator TJ Terajoule tU Tonnes uranium TLT Lithuanian litai TWh Terawatt hour

ACKNOWLEDGEMENTS
iv
This report was prepared in the Directorate-General for Economic and Financial Affairs under the direction of Marco Buti, Director-General, Servaas Deroose, Deputy Director-General, and Anne Bucher, Director of the Directorate for Structural Reforms and Competitiveness.
Nathalie Darnaut (Head of Unit, Directorate-General for Economic and Financial Affairs) coordinated and supervised the production of the report. The main contributors were Joan Canton, Mirco Tomasi, Paul Arnoldus, Jerzy Pienkowski, Nathalie Darnaut, Emmanuelle Maincent, Andras Rezessy, Magdalena Spooner and Arthika Sripathy.
Statistical support was provided by Andras Rezessy and Vittorio Gargaro. George Alexakis and Vittorio Gargaro were responsible for the lay-out of the report.
Comments and suggestions by colleagues in the Directorate-General for Economic and Financial Affairs and the Directorate-General for Energy as well as by members of the Economic Policy Committee (EPC) Working Group on Energy and Climate Change are gratefully acknowledged.
Comments on the report would be gratefully received and should be sent to:
Directorate-General for Economic and Financial Affairs Unit B4: Economic Analysis of Energy, Transport, Climate Change and Cohesion Policies European Commission BE-1049 Brussels
or by e-mail to [email protected]
The cut-off date for this report was 30 November 2012.

CONTENTS
v
Executive Summary 1
Part I: 3
1. Energy dependence: Concept and relevance 5 2. Literature review 7 3. Member States' performance in terms of security of energy supply 11
3.1. Energy security and its indicators 11 3.2. Oil 13 3.3. Gas 14 3.4. Solid fuels 18 3.5. Nuclear energy 18 3.6. Renewable energy 21 3.7. Electricity 23 3.8. Aggregated ranking of Member States for security of energy supply 26
4. Member States' performance in terms of energy and carbon intensity 29 4.1. Energy intensity 31 4.2. Carbon intensity 35 4.3. Aggregated ranking of Member States for energy and carbon intensity 36
5. member States' performance in terms of the contribution of energy products to trade 39 5.1. Net energy trade balance 42 5.2. Factors underlying the net energy trade balance 44 5.3. Overall ranking of Member States as regards the external dimesion of energy
dependency 45 6. Conclusions 49 7. Recommendations 51 A.1. Definition of indicators used in the EDI 53
A1.1. Security of Energy Supply 53 A1.2. Energy and Carbon Intensity of the Economy 55 A1.3. Contribution of Energy Products to Trade Balance 59
A.2. Composite Indicator to assess Member States 63 A.3. Energy dependence indicators for 2006 and 2010 67 References 75
Part II: Individual Country Files 79
Introduction to the Country Fiches 81 1. Bulgaria 83
1.1. Security of Energy Supply 83 1.2. Energy and Carbon Intensity 88 1.3. Contribution of energy products to trade 91 1.4. References 93
2. Czech Republic 95 2.1. Security of Energy Supply 95

vi
2.2. Secondary Energy Sources 99 2.3. Energy and Carbon Intensity 100 2.4. Contribution of Energy Products to Trade 103 2.5. References 104
3. Estonia 107 3.1. Security of Energy Supply 107 3.2. Energy and Carbon Intensity 111 3.3. Contribution of energy products to trade 115 3.4. References 116
4. Greece 117 4.1. Security of Energy Supply 117 4.2. Energy and Carbon Intensity 123 4.3. Contribution of Energy Products to Trade 125 4.4. References 126
5. Ireland 127 5.1. Security of Energy Supply 127 5.2. Energy and Carbon Intensity 131 5.3. Contribution of Energy Products to Trade 134 5.4. References 135
6. Italy 137 6.1. Security of energy supply 137 6.2. Energy and Carbon Intensity 142 6.3. Contribution of energy products to trade 145 6.4. References 146
7. Cyprus 147 7.1. Security of Energy Supply 147 7.2. Energy and Carbon intensity 150 7.3. Contribution of energy products to trade 154 7.4. References 155
8. Latvia 157 8.1. Security of Energy supply 157 8.2. Energy and Carbon Intensity 161 8.3. Contribution of energy products to trade 164 8.4. References 165
9. Lithuania 167 9.1. Security of energy supply 167 9.2. Energy and Carbon intensity 172 9.3. Contribution of energy products to trade 175 9.4. References 176
10. Luxembourg 177 10.1. Security of Energy Supply 177 10.2. Energy and Carbon Intensity 180 10.3. Contribution of energy products to trade 184 10.4. References 185
11. Hungary 187 11.1. Security of Energy Supply 187 11.2. Energy and Carbon Intensity 191 11.3. Contribution of Energy Products to Trade 194

vii
11.4. References 195 12. Malta 197
12.1. Security of Energy Supply 197 12.2. Energy and Carbon Intensity 200 12.3. Contribution of Energy Products to Trade 203 12.4. References 203
13. Poland 205 13.1. Security of energy supply 205 13.2. Energy and Carbon Intensity 210 13.3. Contribution of Energy Products to Trade 213 13.4. References 214
14. Portugal 215 14.1. Security of Energy Supply 215 14.2. Energy and Carbon Intensity 219 14.3. Contribution of energy products to trade 222 14.4. References 223
15. Romania 225 15.1. Security of Energy Supply 225 15.2. Energy and Carbon Intensity 230 15.3. Contribution of energy products to trade 232 15.4. References 233
16. Slovenia 235 16.1. Security of Energy Supply 235 16.2. Energy and Carbon Intensity 239 16.3. Contribution of Energy Products to Trade 242 16.4. References 243
17. Slovakia 245 17.1. Security of energy supply 245 17.2. Energy and Carbon Intensity 250 17.3. Contribution of energy products to trade 254 17.4. References 255
LIST OF TABLES I.3.1. Energy dependence indicators related to the security of energy supply
dimension 12 I.3.2. Electricity mix in the EU 24 I.4.1. Energy dependence indicators related to the energy and carbon intensity
dimension 31 I.4.2. Energy intensity of some industrial sectors (2009) (energy consumption/gross
value added) 33 I.5.1. Energy dependence indicators related to the trade dimension 41 II.1.1. Energy and carbon intensity 88 II.1.2. Decomposition of Energy Trade Balance 92 II.2.1. Energy and carbon intensity 100 II.2.2. Decomposition of Energy Trade Balance 104 II.3.1. Energy and carbon intensity 111 II.3.2. Decomposition of Energy Trade Balance 116

viii
II.4.1. Energy and carbon intensity 123 II.4.2. Decomposition of Energy Trade Balance 126 II.5.1. Energy and carbon intensity 131 II.5.2. Decomposition of Energy Trade Balance 134 II.6.1. Energy and carbon intensity 142 II.6.2. Decomposition of Energy Trade Balance 145 II.7.1. Energy and carbon intensity 151 II.7.2. Decomposition of Energy Trade Balance 155 II.8.1. Energy and carbon intensity 161 II.8.2. Decomposition of Energy Trade Balance 165 II.9.1. Energy and carbon intensity 172 II.9.2. Decomposition of Energy Trade Balance 175 II.10.1. Energy and carbon intensity 180 II.10.2. Decomposition of Energy Trade Balance 184 II.11.1. Energy and carbon intensity 191 II.11.2. Decomposition of Energy Trade Balance 194 II.12.1. Energy and carbon intensity 200 II.12.2. Decomposition of Energy Trade Balance 203 II.13.1. Energy and carbon intensity 210 II.13.2. Decomposition of Energy Trade Balance 213 II.14.1. Energy and carbon intensity 219 II.14.2. Decomposition of Energy Trade Balance 223 II.15.1. Energy and carbon intensity 230 II.15.2. Decomposition of Energy Trade Balance 233 II.16.1. Energy and carbon intensity 239 II.16.2. Decomposition of Energy Trade Balance 243 II.17.1. Energy and carbon intensity 250 II.17.2. Decomposition of Energy Trade Balance 254
LIST OF GRAPHS I.3.1. Technical Storage Capacity in some Member States (2009) 16 I.3.2a. Exposure to gas pipeline cuts 18 I.3.2b. Resilience of the gas sector to disruption (2012) 18 I.3.3. Electricity Network Interconnections 25 I.3.4. Security of energy supply, aggregated score 26 I.4.1. Energy and carbon intensity, aggregated score 36 I.5.1. Energy trade and current account balances in the EU, 2007-2011 average 42 I.5.2. Trade balance for energy products 46 II.1.1. Bulgaria - Import dependence 83 II.1.2. Bulgaria - Energy mix 84 II.1.3. Bulgaria - HHI index energy imports 84 II.1.4. Bulgaria - Non-EEA share of imports 84 II.1.5. Bulgaria - Renewable mix 86 II.1.6. Bulgaria - Electricity mix 87 II.1.7. Bulgaria - Energy and carbon intensity of the economy 88 II.1.8. Bulgaria - Energy intensity of industry, carbon intensity of energy use 89 II.1.9. Bulgaria - Energy and carbon intensity of transport 90 II.1.10. Bulgaria - Energy and carbon intensity of households 91 II.1.11. Bulgaria - Trade balance of energy products and CA 92 II.2.1. Czech Republic - Import dependence 95

ix
II.2.2. Czech Republic - Energy mix 96 II.2.3. Czech Republic - HHI index energy imports 96 II.2.4. Czech Republic - Non-EEA share of imports 97 II.2.5. Czech Republic - Renewable mix 98 II.2.6. Czech republic - Electricity mix 99 II.2.7. Czech Republic - Energy and carbon intensity of the economy 101 II.2.8. Czech Republic - Energy intensity of industry, carbon intensity of energy use 101 II.2.9. Czech Republic - Energy and carbon intensity of transport 102 II.2.10. Czech Republic - Energy and carbon intensity of households 103 II.2.11. Czech Republic - Trade balance of energy products and CA 104 II.3.1. Estonia - Import dependence 107 II.3.2. Estonia - Energy mix 108 II.3.3. Estonia - Renewable mix 108 II.3.4. Estonia - HHI index energy imports 109 II.3.5. Estonia - Non-EEA share of imports 109 II.3.6. Estonia - Electricity mix 110 II.3.7. Estonia - Energy and carbon intensity of the economy 112 II.3.8. Estonia - Energy intensity of industry, carbon intensity of energy use 113 II.3.9. Estonia - Energy and carbon intensity of transport 113 II.3.10. Estonia - Energy and carbon intensity of households 114 II.3.11. Estonia - Trade balance of energy products and CA 115 II.4.1. Greece - Import dependence 117 II.4.2. Greece - Energy mix 118 II.4.3. Greece - HHI index energy imports 119 II.4.4. Greece - Non-EEA share of imports 119 II.4.5. Greece - Renewable mix 120 II.4.6. Greece - Electricity mix 121 II.4.7. Greece - Energy and carbon intensity of the economy 123 II.4.8. Greece - Energy intensity of industry, carbon intensity of energy use 124 II.4.9. Greece - Energy and carbon intensity of transport 124 II.4.10. Greece - Energy and carbon intensity of households 125 II.4.11. Greece - Trade balance of energy products and CA 125 II.5.1. Ireland - Import dependence 127 II.5.2. Ireland - Energy mix 128 II.5.3. Ireland - HHI index energy imports 128 II.5.4. Ireland - Non-EEA share of imports 129 II.5.5. Ireland - Renewable mix 129 II.5.6. Ireland - Electricity mix 130 II.5.7. Ireland - Energy and carbon intensity of the economy 132 II.5.8. Ireland - Energy intensity of industry, carbon intensity of energy use 132 II.5.9. Ireland - Energy and carbon intensity of households 133 II.5.10. Ireland - Trade balance of energy products and CA 134 II.6.1. Italy - Import dependence 137 II.6.2. Italy - Energy mix 138 II.6.3. Italy - HHI index energy imports 138 II.6.4. Italy - Non-EEA share of imports 139 II.6.5. Italy - Renewable mix 140 II.6.6. Italy - Electricity mix 141 II.6.7. Italy - Energy and carbon intensity of the economy 143 II.6.8. Italy - Energy intensity of industry, carbon intensity of energy use 143 II.6.9. Italy - Energy and carbon intensity of transport 144 II.6.10. Italy - Energy and carbon intensity of households 144 II.6.11. Italy - Trade balance of energy products and CA 145

x
II.7.1. Cyprus - Import dependence 147 II.7.2. Cyprus - Energy mix 148 II.7.3. Cyprus - Non-EEA share of imports 148 II.7.4. Cyprus - Renewable mix 149 II.7.5. Cyprus - HHI index energy imports 149 II.7.6. Cyprus - Electricity mix 149 II.7.7. Cyprus - Energy and carbon intensity of the economy 151 II.7.8. Cyprus - Energy intensity of industry, carbon intensity of energy use 152 II.7.9. Cyprus - Energy and carbon intensity of transport 152 II.7.10. Cyprus - Energy and carbon intensity of households 153 II.7.11. Cyprus - Trade balance of energy products and CA 154 II.8.1. Latvia - Import dependence 157 II.8.2. Latvia - Renewable mix 158 II.8.3. Latvia - Energy mix 158 II.8.4. Latvia - HHI index energy imports 159 II.8.5. Latvia - Non-EEA share of imports 160 II.8.6. Latvia - Electricity mix 160 II.8.7. Latvia - Energy and carbon intensity of the economy 162 II.8.8. Latvia - Energy intensity of industry, carbon intensity of energy use 163 II.8.9. Latvia - Energy and carbon intensity of transport 163 II.8.10. Latvia - Energy and carbon intensity of households 164 II.8.11. Latvia - Trade balance of energy products and CA 165 II.9.1. Lithuania - Import dependence 167 II.9.2. Lithuania - HHI index energy imports 168 II.9.3. Lithuania - HHI index energy imports 168 II.9.4. Lithuania - Non-EEA share of imports 169 II.9.5. Lithuania - Renewable mix 170 II.9.6. Lithuania - Electricity mix 171 II.9.7. Lithuania - Energy and carbon intensity of the economy 172 II.9.8. Lithuania - Energy intensity of industry, carbon intensity of energy use 173 II.9.9. Lithuania - Energy and carbon intensity of transport 173 II.9.10. Lithuania - Energy and carbon intensity of households 174 II.9.11. Lithuania - Trade balance of energy products and CA 175 II.10.1. Luxembourg - Import dependence 177 II.10.2. Luxembourg - Energy mix 178 II.10.3. Luxembourg - HHI index energy imports 178 II.10.4. Luxembourg - Non-EEA share of imports 179 II.10.5. Luxembourg - Renewable mix 179 II.10.6. Luxembourg - Electricity mix 180 II.10.7. Luxembourg - Energy and carbon intensity of the economy 181 II.10.8. Luxembourg - Energy intensity of industry, carbon intensity of energy use 182 II.10.9. Luxembourg - Energy and carbon intensity of transport 182 II.10.10. Luxembourg - Energy and carbon intensity of households 183 II.10.11. Luxembourg - Trade balance of energy products and CA 184 II.11.1. Hungary - Import dependence 187 II.11.2. Hungary - Energy mix 188 II.11.3. Hungary - HHI index energy imports 188 II.11.4. Hungary - Non-EEA share of imports 189 II.11.5. Hungary - Renewable mix 190 II.11.6. Hungary - Electricity mix 190 II.11.7. Hungary - Energy and carbon intensity of the economy 191 II.11.8. Hungary - Energy intensity of industry, carbon intensity of energy use 192 II.11.9. Hungary - Energy and carbon intensity of transport 193

xi
II.11.10. Hungary - Energy and carbon intensity of households 193 II.11.11. Hungary - Trade balance of energy products and CA 194 II.12.1. Malta - Import dependence 197 II.12.2. Malta - Energy mix 198 II.12.3. Malta - Electricity mix 199 II.12.4. Malta - Energy and carbon intensity of the economy 201 II.12.5. Malta - Energy and carbon intensity of households 202 II.12.6. Malta - Trade balance of energy products and CA 203 II.13.1. Poland - Import dependence 205 II.13.2. Poland - Energy mix 206 II.13.3. Poland - HHI index energy imports 206 II.13.4. Poland - Non-EEA share of imports 207 II.13.5. Poland - Renewable mix 208 II.13.6. Poland - Electricity mix 209 II.13.7. Poland - Energy and carbon intensity of the economy 210 II.13.8. Poland - Energy intensity of industry, carbon intensity of energy use 211 II.13.9. Poland - Energy and carbon intensity of transport 211 II.13.10. Poland - Energy and carbon intensity of households 212 II.13.11. Poland - Trade balance of energy products and CA 213 II.14.1. Portugal - Import dependence 215 II.14.2. Portugal - Energy mix 216 II.14.3. Portugal - HHI index energy imports 216 II.14.4. Portugal - Non-EEA share of imports 217 II.14.5. Portugal - Renewable mix 217 II.14.6. Portugal - Electricity mix 218 II.14.7. Portugal - Energy and carbon intensity of the economy 219 II.14.8. Portugal - Energy intensity of industry, carbon intensity of energy use 220 II.14.9. Portugal - Energy and carbon intensity of transport 220 II.14.10. Portugal - Energy and carbon intensity of households 221 II.14.11. Portugal - Trade balance of energy products and CA 222 II.15.1. Romania - Import dependence 225 II.15.2. Romania - Energy mix 226 II.15.3. Romania - HHI index energy imports 226 II.15.4. Romania - Non-EEA share of imports 227 II.15.5. Romania - Renewable mix 228 II.15.6. Romania - Electricity mix 229 II.15.7. Romania - Energy and carbon intensity of the economy 230 II.15.8. Romania - Energy intensity of industry, carbon intensity of energy use 231 II.15.9. Romania - Energy and carbon intensity of transport 231 II.15.10. Romania - Energy and carbon intensity of households 232 II.15.11. Romania - Trade balance of energy products and CA 232 II.16.1. Slovenia - Import dependence 235 II.16.2. Slovenia - Energy mix 236 II.16.3. Slovenia - HHI index energy imports 236 II.16.4. Slovenia - Non-EEA share of imports 236 II.16.5. Slovenia - Renewable mix 237 II.16.6. Slovenia - Electricity mix 238 II.16.7. Slovenia - Energy and carbon intensity of the economy 240 II.16.8. Slovenia - Energy intensity of industry, carbon intensity of energy use 240 II.16.9. Slovenia - Energy and carbon intensity of transport 241 II.16.10. Slovenia - Energy and carbon intensity of households 241 II.16.11. Slovenia - Trade balance of energy products and CA 242 II.17.1. Slovakia - Import dependence 245

xii
II.17.2. Slovakia - Energy mix 246 II.17.3. Slovakia - HHI index energy imports 246 II.17.4. Slovakia - Non-EEA share of imports 247 II.17.5. Slovakia - Renewable mix 248 II.17.6. Slovakia - Electricity mix 249 II.17.7. Slovakia - Energy and carbon intensity of the economy 251 II.17.8. Slovakia - Energy intensity of industry, carbon intensity of energy use 252 II.17.9. Slovakia - Energy and carbon intensity of transport 252 II.17.10. Slovakia - Energy and carbon intensity of households 253 II.17.11. Slovakia - Trade balance of energy products and CA 254
LIST OF BOXES I.3.1. Security of oil supply in the EU 14 I.3.2. Gas trading in the EU 15 I.3.3. Security of gas supply in the EU 17 I.3.4. Euratom Treaty 19 I.3.5. Variability of renewables 20 I.3.6. EU Renewable Energy Policy 22 I.3.7. Security of supply of electricity 25 I.4.1. Energy efficiency in the EU 30 I.4.2. Limiting the risk of carbon leakage 35 I.5.1. Decomposition of the net energy trade balance 40

EXECUTIVE SUMMARY
1
Over recent years, EU economies have been exposed to energy price increases leading to adverse effects on consumers and industries. Some economies have also been confronted with disruptions to gas supply, affecting gas-dependent industrial activities and households. Arguably, the EU economy will continue to be exposed to serious risks related to energy prices, including potential oil shocks or gas shortages.
Important policy developments are taking place, which affect the cost of energy supply and substantially modify Member States’ energy mix, therefore influencing their competitiveness. The ambitious EU climate policy calls for a revolution in the energy sector: by 2050, the production of electricity will have to be decarbonised, industrial sectors will have to drastically reduce their greenhouse gas (GHG) emissions and the transport sector will have to implement significant structural changes, to achieve a 60% reduction in the sector´s GHG emissions by 2050(1). The Commission made legislative proposals in key areas which aim to foster the transition to a low carbon economy and reduced energy use: the third energy internal market package for electricity and gas markets, the Renewable Energy Directive(2), the recently adopted Directive on Energy Efficiency(3) and the Energy Infrastructure Package(4).
The main objective of this report is to assess whether and how Member States are energy dependent and potentially vulnerable to any energy price and/or supply shocks. The analysis is based on energy dependence indicators (hereafter EDI) which are proposed and used to analyse Member States’ energy dependence. Three dimensions of energy dependence are considered for this analysis: (1) security of energy supply, (2) energy and carbon intensity, and (3) contribution of energy products to trade. The performance of each of the 27 Member States is analysed and compared along each of these three dimensions. The most problematic performances are identified in the framework of the relevant EU legislation.
The main horizontal conclusions from this report can be summarised as follows.
• Regarding the security of energy supply, the combination of import dependency, geographical diversification of energy imports (risk of dependence on one country), and diversification of energy sources in the energy mix helps assess the extent to which a country is vulnerable. Measured by an aggregate indicator combining factors related to energy security, MT and CY are the most vulnerable countries, followed by LU, IE, EE, LT and EL. Member States, especially the vulnerable ones, should improve their security of energy supply as a matter of priority. Depending on country-specific circumstances, this should be done by developing domestic energy sources, especially renewables, and their optimal use by increased energy efficiency, shifting to a more balanced energy mix, in particular in countries highly dependent on oil, increasing the geographical diversification of energy import sources and avoiding a single supplier of oil or gas, improving the level of integration within the EU gas and electricity markets, developing cross-border interconnections with neighbouring countries, as well as the storage capacity for oil and gas reserves.
• Regarding the energy and carbon intensity of Member States’ economies, vulnerability can be assessed by a combination of elements including energy and carbon intensities in the whole economy and in its main sectors, the share of energy-intensive sectors in the economy and the share of energy in households' expenditures. A ranking of Member States based on an aggregation of these elements indicates that the most vulnerable country is BG, followed by EE, RO, SK, CZ and PL. Nevertheless, substantial progress was achieved in recent years in the majority of these countries. Energy and carbon intensity can be further reduced thanks to improvements made by energy users, in particular in sectors like buildings, transport and industry, and also thanks to improved efficiency in the energy sector.
(1) European Commission (2011g) (2) Both adopted by the Council in 2009. (3) European Commission (2011c) (4) European Commission (2011d)

European Commission Member States’ Energy Dependence
2
• Finally, the analysis provided in this report has shown that energy products can be significant contributors to current account imbalances and that this channel may negatively affect competitiveness. Measured by the net energy trade balance in terms of GDP, this negative contribution is the highest in BG, CY, LT, SK, HU, SI and LV, and to a lesser extent BE, PT and EL. However, when assessed against the background of the current account performance, CY seems to be the biggest concern followed by LT, BG, SK, HU, SI and LV, and then also EL and PT (in view of their corresponding current account problems). For the EU-12 countries just mentioned, and perhaps also BE, the large energy trade deficit, although counterbalanced by surpluses in other trade categories (except in the case of CY), may serve as a channel through which an energy price shock hits the economy. It would now be important to consider this issue in the broader context of the monitoring of macroeconomic imbalances and their impact on EU stability and prosperity.

Part I


1. ENERGY DEPENDENCE: CONCEPT AND RELEVANCE
5
Energy is a key variable for growth and competitiveness. For business, energy is a key resource and a cost element. For consumers, energy bills represent an important item in the household budget and a particular challenge for low-income households.
Over the recent years, EU economies have been exposed to energy price increases which may have led to adverse effects on consumers and industries(5). Some economies have also been confronted with disruptions to gas supply, hitting gas-dependent industrial activities and households. Arguably, the EU economy will continue to be exposed to serious risks related to energy prices, including potential oil shocks or gas shortages. The EU has also set ambitious climate policies, which call for significant structural changes in the energy sector, as energy-related activities are by far the main contributors to the EU’s greenhouse gas (GHG) emissions.
In this note, by energy dependence, we mean the vulnerability of a given Member State(6) to energy price shocks or energy supply disruptions, which may translate into significant losses to competitiveness and GDP, inflationary pressures and trade balance deterioration(7). The purpose of the Energy Dependence Indicators (EDI) is to identify the main dimensions of energy dependence, not to quantify its possible consequences.
Three broad dimensions of energy dependence have been identified as relevant:
1. Security of energy supply: Energy security means uninterrupted availability of energy sources at an affordable price while respecting environmental concerns(8). The uneven
(5) Eurostat data show that between 2005 and 2008 EU energy
prices have increased on average by 7.14% compared to an overall inflation rate of 2.34%.
(6) World Energy Council (2008) also assesses energy vulnerability.
(7) This approach is broader than the one used by EUROSTAT which defines the energy dependency rate as net imports divided by gross inland consumption plus international bunkers. This corresponds to our 'import dependency' indicator.
(8) European Commission (2000). This definition is also used by the International Energy Agency (IEA). UNDP (2000) and World Energy Council (2008) have used similar definitions but without reference to the environment.
distribution of energy supplies among countries has led to significant dependencies. Threats to energy security include the reliance on imported and insufficiently diversified energy sources, the political instability of several energy-producing and transit countries, global competition over energy sources, as well as accidents, natural disasters and terrorism. A diversified energy mix(9) and diversified sources of imports for energy products strengthen the resilience of Member States to supply shocks and consequently reduce their energy dependence.
2. Energy and carbon intensity: Energy intensity is the amount of energy used per unit of GDP. It is one of the best ways to measure energy efficiency from a macroeconomic perspective, as it offers a comprehensive picture regarding the link between energy and economy and allows for the separation of the changes in energy use per unit of GDP from the changes in GDP. Improved energy efficiency reduces energy dependence whilst bringing additional economic and environmental benefits. Energy efficiency has been closely looked at in many Member States during the 2012 European Semester, triggering country-specific recommendations in BG, EE, LT, LV, MT and PL. Energy intensity issues are also strongly correlated with carbon intensity challenges. The ambitious EU climate policy calls for a revolution in the energy sector: by 2050, the production of electricity will have to be decarbonised, industrial sectors will have to drastically reduce their GHG emissions and the transport sector will have to implement significant structural changes to achieve a 60% reduction in its GHG emissions by 2050(10). Such ambitious objectives could make energy more expensive, again with consequences for competitiveness and inflationary pressures(11).
(9) i.e. the range of energy sources of a country. (10) European Commission (2011g) (11) The size of these effects depends on multiple, interrelated
factors, such as the capacity to cushion or pass through energy price increases or to improve energy efficiency. Assessing these effects would require a macroeconomic model. The EDI does not aim to quantify and compare these final effects, only to identify the dependency dimensions and resulting vulnerabilities.

European Commission Member States’ Energy Dependence
6
3. Contribution of energy products to trade: The EU’s strong external dependence for its energy needs implies that an analysis of energy dependence must assess the contribution of energy products to trade, in view of the potential consequences on current account imbalances. The potential vulnerability of a country will not be the same if the country displays both an energy trade deficit and a current account deficit.
For each dimension of energy dependence, a set of indicators has been compiled at Member State and EU level. Each indicator is presented and defined in Annex 1 of this note. No exogenous threshold has been considered to define low or high performance. Member States' performance is analysed on the basis of the average values of the indicators over the period 2006-2010 for the first two dimensions(12) and those over 2007-2011 for the trade dimension. An analysis based on an average over 5 years rather than on a single year prevents the analysis from being biased by specific circumstances of a given year, for instance resulting from the business cycle. In addition to the
(12) Please note that for some indicators in energy and carbon
intensity dimension the presented average period is 2005-2009 or 2004-2008.
set of average indicators for 2006-2010 (2007-2011 for the trade dimension), the sets of indicators for the first and the last years are given in Annex 3.
For each dimension – security of supply, energy and carbon intensity and contribution of energy products to trade - Member States are ranked on the basis of a composite indicator (see Annex 2 for the methodology of this indicator). For comparison purposes, scoring for the first and the last years are also given in the graphs presenting the aggregated scoring. However, while the composite indicator can alert about a country's vulnerability in any dimension of energy dependence, it needs to be qualified with additional information in terms of changes, country-specific circumstances and policy developments. We have included some elements concerning the changes in the text of this note. Moreover, in complement to this note, we have produced country fiches. They analyse in more detail the performance of the most vulnerable countries and their country-specific circumstances.

2. LITERATURE REVIEW
7
The indicator-based assessment presented in this note builds on a few predecessors in the literature. As already indicated in the previous section, the energy security definition used here is consistent with those used in major publications from the Commission and international organisations active in the field of energy policy. In order to put the methodology of the current study in perspective, this section briefly discusses previous studies which have tried to compare the energy security and energy dependence(13) of various countries on the basis of an indicator-based assessment.
This study's focus on energy dependence, as defined as vulnerability to energy supply or price shocks, has a clear link with the risk assessment literature. The relation between vulnerability and risk is best explained by the well-known short-hand formula from the security risk assessment approach: "risk = threat x vulnerability x impact"(14). This method compares risks through a scoring of three multiplicative factors, namely: (i) the nature and likelihood of the threat; (ii) the susceptibility of an energy system to incur damage when the threat materialises (vulnerability); and (iii) the actual impacts. This formula helps to put the scope of this study into perspective: it addresses neither the origin nor the occurrence of energy price and supply shocks nor their actual impacts(15), but rather the susceptibility of economies to incur damage from such shocks. Hence, one can also see the approach as a comparison of “resilience” to such shocks, i.e. the capacity to weather and absorb shocks without damage.
The choice of an indicator-based assessment method is in line with the focus on vulnerability, since the susceptibility of a national economy to shocks depends to an important extent on several
(13) The definition of these concepts differs somewhat over the
cited studies, a complication which does not affect the main issues discussed in this sub-section.
(14) See for instance Harnser Group (2010), p3. (15) There are many studies on the threats to energy security
and the impacts of energy price. See for examples of the former group IEA (2011) which through an indicator approach separates risk and resilience factors, both domestic and external; and Winzer (2012) which reports on sophisticated work to classify various energy shocks and how to distinguish them from usual volatility and pervasive trends; and see for the latter group the in-house studies ECFIN (2011a) and ECFIN (2011b), an econometric and model exercise on the impacts of energy price increases.
characteristics of its energy usage, rather than solely on (exogenous) supply(16). A targeted set of indicators is a good way of capturing and focusing on the different major dimensions, surpassing a (macroeconomic and / or energy) model in these aspects. However, like in almost all indicator-based assessments from preceding studies, the selected indicators are not explicitly linked, rendering the method less suitable for studying cause and effect relationships. The strength of the indicator-based assessment method is in the identification of vulnerability issues. Hence, the method is a good starting point for more in-depth analysis.
The specific choices underlying the indicator-based assessment of this study can be put in perspective when compared with recent similar assessments in terms of scope, choice of indicators and methodology. The studies considered are those by the WEC (World Energy Council, 2008), S&B (Sovavool and Brown, 2009), the IEA (namely their short-term energy security model called MOSES (Jewell, 2011)), and the Institute of Energy of the JRC (see Badea, 2010 and Badea et al., 2011). All these studies compare various countries on energy security and / or dependence. This does not mean that there are no national studies(17).
As regards the scope, except for the IEA, the studies take a macro approach, more or less similar to the one chosen here. The IEA has chosen an "energy systems approach," hence opting for a rather more classical choice of scope. While the IEA compares its members (28 countries including
(16) See for this recent "evolution in the energy security
concept", Brown (2011). (17) See as a high-profile counterexample the longstanding
"index of US energy security risk" (US Chamber of Commerce, 2011). It is doubtful whether the US index could be used for international comparisons on vulnerability, because it tackles threats and vulnerability and because the supply disruption risk element is hard to differentiate over different user countries.
Members of the EPC WG on Energy and Climate Change also pointed to national monitoring studies (see for instance those for Germany, BMWi (2010, 2011) and Bundesnetzagentur (2012)) and national statistical overviews (such as for Ireland and the UK; see SEAI (2011) and UK DECC (2011) respectively). Like an indicator-base framework, they stress the multi-faceted nature of energy security / dependence, but the main difference is that they do not arrive at an integrative and comparative framework.

European Commission Member States’ Energy Dependence
8
19 EU countries(18) and S&B study 22 out of the current 34 OECD member countries(19), the WEC and JRC exclusively focus on the EU countries(20). As regards the time dimension, most studies are static: while the IEA and WEC have chosen an unspecified recent year, the JRC reports on the situation in 2010(21). S&B compare countries on the progress they have made in energy security over the long period of 1970 – 2007. Consequently, the current study appears distinct in taking average values of the indicators over a recent period.
In their choice of indicators, the studies have been led by their emphasis on vulnerability and consequently they have focused on the various dimensions of the countries in their capacity as energy users. The IEA model strongly deviates from the other studies because of its "energy systems approach," leading it to consider 8 energy sources in separation, assembling for each of them indicators(22) such as import dependency, political stability of supplier countries, the quantity and quality of interconnections, the volatility of domestic production and average stocks.
The macro orientation of the other studies means their indicator sets are conceptually not too different from the one in this note: they all include import dependency and energy and carbon intensity. However, they vary strongly on the sectoral indicators, and the geopolitical dimension of foreign supply is not taken on board(23). The WEC study is the clearest example because it uses only 5 indicators, namely one import dependency
(18) Apart from Poland, the Czech and Slovak Republics and
Hungary, the EU-12 countries are not IEA members. (19) Apart from Iceland and Luxemburg, the missing countries
joined the OECD in the 1990s or later. The sample thus includes the EU 15 (except Luxembourg), Japan and the US.
(20) The WEC also includes Norway and Switzerland in their sample.
(21) However, JRC's study can be described as forward looking as it is based on the energy model PRIMES baseline (2005 – 2030); this implies also that, like here, it can take the average over recent years as base for comparison.
(22) The number of indicators per energy source varies widely, namely from one to nine.
(23) Costescu Badea (2010) suggests correcting diversity measures on the number of (foreign) energy supply sources but this is not followed up in the construction of JRC's composite index. The same applies for "reserve-to-production ratios," presumably because these supplier country features do not affect user countries but through the latter's energy mix.
measure for oil and gas combined, energy and carbon intensity at the macro level, a composite index measuring the vulnerability of the power system (combining inter alia import dependency and the primary energy mix of electricity generation), and the energy mix of transport. S&B construct an "energy security index" based on the four dimensions of availability (the import dependence of oil, gas and transport fuels), affordability (two energy retail prices), efficiency (macro and sectoral energy intensity), and environmental stewardship (carbon and sulphur emissions). JRC presents a set of 8 indicators quite similar to those included in the first two dimensions of this study: import dependency for oil, gas and coal; the energy mix of primary energy production, electricity and transport; and the energy and carbon intensities.
The studies differ in key methodological choices, namely in the bundling of the various indicators into an aggregate, a comparable measure on energy security / dependence for each country. Obviously, the IEA's different scope has also produced a distinctive methodology; in particular, it is the only study where the scoring of individual indicators depends on the scores of other included indicators, and hence where links between indicators are modelled, albeit incompletely. WEC largely refrains from aggregation, made possible only because of the modest number of indicators used. It uses cobweb diagrams to report on individual countries and even to compare across countries.
S&B and JRC aggregate over individual indicators, but in a different way than in this study(24). S&B focus on the change in the summation over the set of normalised indicators(25) over the period under consideration (1970 – 2007). Consequently, they rank countries on the "progress" they made in improving energy dependence / security over time, in their own terms rather than as compared to other countries(26). This
(24) Namely the one used in earlier indicator-based assessment
frameworks developed by DG ECFIN (see Annex 2). (25) The indicator normalisation is in essence the same as the
one carried out in this study (see Annex 2). (26) Hence S&B can be said to rank countries on their change in
energy security / dependence, rather than to map the change in country ranking. Brown (2011) presents an alternative for the z-scores, namely assigning values -1, 0, +1 for worsening, remaining steady, improving individual indicators, this in order to prevent large changes in any one indicator from dominating the aggregate measure.

Part I
9
eliminates the effect of initial variation in production structure, but likely at the expense of ignoring differences in potential for improvement. Some countries may therefore rank high simply because they caught up with other countries with a similar profile.
JRC constructs a "family of composite indicators", through the ranking method of an "ordered weighted average" of the ranking of the individual indicators. This method allows the degree to which low scores on one indicator can be compensated by high scores on other indicators to be set (and varied) according to preferences. JRC associates this varying degree with the level of risk aversion of the policy makers they aim to inform(27). JRC argues that the open-ended nature of this composite indicator allows policy makers to arrive at their own conclusions depending on their preferences.
JRC's attempt to interact with policy makers is not all too different from this study's approach, namely to aggregate over the three dimensions but to leave the overall conclusions to the users of the tool.
(27) See Badea et al. (2011), section 2 for more details.
JRC's approach has the advantage of being more explicit. However, its sophisticated method may be less suitable for a country comparison for three related reasons: first, differences in energy dependence over countries may be partly informed by differences in risk aversion of policy makers; second, it is not clear what one should do in the likely case of heterogeneity in risk aversion over policy makers of different countries; third, while in theory policy makers are supposed to indicate their risk preference before the calculation of the composite indicator, in practice they may very well shop for the degree of risk aversion pertaining to an acceptable aggregate ranking.
To conclude, while similar to earlier cross-country studies as regards the focus on the vulnerability of countries as energy users and the choice of some indicators, this study is somewhat different as regards the aggregation of indicators into three main dimensions of energy dependence, the stronger focus on (macro)-economic effects, such as the trade balance(28), and the attempt to find the structural state of play by taking the average of recent indicator values.
(28) For sure, the "index of US energy security risk" (US
Chambre of Commerce, 2011) includes an indicator on the energy trade balance.


3. MEMBER STATES' PERFORMANCE IN TERMS OF SECURITY OF ENERGY SUPPLY
11
3.1. ENERGY SECURITY AND ITS INDICATORS
Energy security – defined as the uninterrupted availability of energy sources at an affordable price while respecting environmental concerns − has many aspects. Short-term energy security focuses on the ability of the energy system to react promptly to sudden changes in the supply-demand balance, while long-term energy security is linked to timely investments in energy supply and infrastructure.
In our EDI set we focus on three indicators of energy security, that measure energy import dependency, the degree of geographical diversification of energy import sources and the degree of diversification in the energy mix. We analyse these indicators (where it is appropriate) first for all energy products together, and, in the subsequent sections, for each of the following energy products: natural gas, crude oil, solid fuels. We also analyse the contribution of renewables and nuclear to energy security, as well as that of electricity – a secondary energy source.
The first indicator is energy import dependence, i.e. the extent to which a country depends on imports to meet its energy needs(29). All things being equal, the higher the share of imported energy, the more vulnerable a Member State is to price increases, supply disruptions or to foreign political decisions.
In 2006-2010, 54% of energy consumed in the EU-27 came from imports. This dependence on imports varied between 53% and 55% between 2006 and 2010, but was substantially higher than a decade earlier (45% in 1999). This was due to a substantial reduction in EU production of primary energy, especially of oil and hard coal, which was not matched by an increasing production of renewable energy.
MT, CY and LU are almost fully dependent on imported energy (in 97-100%), followed by IE, IT, PT and ES with import dependence ratios between 80% and 90% (see Table I.3.1). The reason for this
(29) Annex 1 gives a precise definition of each indicator used in
the EDI set.
is the absence of any significant local energy resources. On the other hand, DK produced 24% more energy than it used; five other countries (UK, EE, PL, CZ and RO) had import dependence ratios between 20 and 30%. These countries have substantial domestic production of oil, gas or solid fuels.
Yet, high import dependency becomes more problematic when it is associated with low levels of diversification, by country of origin and/or by energy source. Therefore, our indicators cover the degree of geographical diversification of energy import sources. All things being equal, the more diversified energy import sources are, the less vulnerable a Member State is to a single country’s decisions and potential problems.
To measure it, we have developed Herfindahl indexes to assess the degree of concentration of import sources by country, in relation to total imports of energy products - gas, oil, solid fuels and electricity (see HHI energy imports in table I.3.1). A score of 1 means that all imports come from the same country. The lower the Herfindahl index, the more diversified the energy import sources. We have also included in the table the share of gas, oil and solid fuel imports from non-EEA countries.
Another indicator measures the degree of diversification of energy sources. All things being equal, the more diversified is the energy mix, the less vulnerable a Member State is to shocks affecting a specific energy source. To measure this diversity, another Herfindahl index has been developed. A score of 1 would mean that a Member State uses only one source of energy.
Table I.3.1 shows that MT uses almost only oil in its energy mix, and in the case of CY oil satisfies 96% of its energy needs. Other Member States with a high Herfindahl index and hence poorly diversified energy sources include LU, EL and IE (with a very high share of oil), and EE and PL (with a high share of solid fuels). The EU as a whole has a well balanced energy mix and is not reliant on any particular energy source.

European Commission Member States’ Energy Dependence
12
We acknowledge that some important elements of energy supply security(30) – such as the political stability of energy suppliers and the level of network interconnections with neighbouring countries − remain outside our set of Energy Dependence Indicators because they are too difficult to quantify, although they are described in the text. Also, we have not included an indicator of the storage capacities for oil and gas because minimum levels or conditions are now required by EU legislation (see sections 3.2 and 3.3, and Boxes I.3.1 and I.3.3).
As regards the political stability risk, the share of gas, oil and solid fuel imports from non-EEA (30) See also Jewell (2011) on the IEA Model of Short-term
Energy Security (MOSES).
countries, can be considered as a proxy. Countries of the European Economic Area (EEA), including Norway, are already part of the EU internal market, and there are ongoing negotiations with them aiming at full integration of electricity markets and in some other key areas. The degree of political risk associated with non-EEA countries varies from one country to another. However, there are no objective, quantified indicators of political risk, which we could apply in our EDI set. Moreover, re-exports of energy sources on a large scale may lead to misjudgements about the origin of fuels. As regards the mitigation of political risk, the 2011 Communication on security of energy supply and international cooperation(31) proposes several actions, thanks to which the EU and (31) European Commission (2011e)
Table I.3.1:
Energy dependence indicators related to the security of energy supply dimension*
Gas (%) Oil (%) Solid fuels (%)
Total Primary
(%)
Gas Oil Solid fuels
Gas (%) Oil (%) Solid fuels (%)
Gas (%)
Oil (%)
Nuc- lear (%)
Rene- wables
(%)
Solid fuels (%)
HHI energy sources
2006-2010
2006-2010
2006-2010
2006-2010
2006-2010
2006-2010
2006-2010
2006-2010
2006-2010
2006-2010
2006-2010
2006-2010
2006-2010
2006-2010
2006-2010
2006-2010
AT 83 92 97 67 0.40 0.13 0.37 86 54 10 22 40 0 25 11 0.28
BE 100 98 96 78 0.28 0.17 0.22 25 56 90 26 41 21 3 7 0.29
BG 94 100 34 47 1.00 0.46 0.42 100 87 98 14 24 22 6 37 0.27
CY 101 95 99 0.11 0.94 52 100 0 96 0 3 1 0.92
CZ 97 97 -16 27 0.66 0.29 0.72 78 72 8 16 22 15 5 44 0.29
DE 84 95 38 60 0.32 0.13 0.13 45 56 82 23 34 11 8 24 0.24
DK -97 -64 94 -24 0.18 0.24 21 90 21 39 0 17 22 0.27
EE 100 66 0 22 1.00 0.28 0.91 100 55 100 12 19 0 12 59 0.42
ES 100 100 78 80 0.20 0.07 0.19 92 81 99 23 48 11 8 10 0.31
FI 100 95 65 53 1.00 0.54 0.42 100 79 91 10 29 16 24 17 0.21
FR 98 98 100 51 0.18 0.07 0.15 52 72 84 15 33 42 7 5 0.31
EL 100 100 4 71 0.52 0.16 0.44 100 90 85 10 55 0 6 27 0.39
HU 83 81 42 61 0.61 0.67 0.27 93 85 57 39 28 15 6 11 0.27
IE 92 99 63 88 1.00 0.49 0.32 0 7 86 28 53 0 4 15 0.38
IT 90 92 100 85 0.23 0.13 0.18 82 94 95 38 43 0 8 9 0.34
LT 100 95 91 63 1.00 0.88 0.81 100 98 97 30 32 23 12 3 0.28
LU 100 100 100 97 0.25 0.57 0.38 50 0 100 25 63 0 3 2 0.46
LV 93 98 100 57 1.00 0.26 0.88 100 48 97 30 32 0 32 2 0.29
MT 100 100 0 100 0 0 0 1.00
NL -64 95 112 36 0.35 0.08 0.20 18 63 94 42 42 1 3 9 0.36
PL 69 99 -11 28 0.62 0.60 0.40 91 83 76 13 26 0 6 56 0.39
PT 100 99 100 81 0.47 0.07 0.35 100 80 95 16 52 0 18 10 0.35
RO 25 50 24 26 0.92 0.31 0.22 100 91 72 32 26 7 14 23 0.24
SE 100 99 89 37 1.00 0.23 0.19 0 37 83 2 28 32 32 5 0.28
SI 100 99 21 51 0.37 0.23 0.56 81 11 80 12 36 20 12 21 0.25
SK 100 91 84 65 0.99 0.67 0.29 100 84 41 28 20 23 6 22 0.23
UK 25 8 70 24 0.44 0.22 0.27 16 34 97 38 36 8 3 16 0.30
EA 24 39 15 8 13 0.26
EU27 62 83 41 54 0.18 0.09 0.13 60 66 86 24 36 14 8 17 0.25
**Total import dependency does not include electricity. Data for import dependence in solid fuels come from DG ENER's Country Factsheets, while all the other data come from Eurostat.
Import dependency HHI energy imports Non-EEA share of imports Gross inland energy consumption, shares by fuel
*For sources and indicators, see Annex 1. Please note that colours only indicate top and bottom values and have no qualitative assessment attached.

Part I
13
Member States can improve the security of their energy supplies. These include energy partnerships with the main importers of energy and the implementation of large-scale gas transport projects involving third countries.
3.2. OIL
Oil made up 36 % of the EU’s energy consumption in 2006-2010. Given the EU's strong external dependence for supply of oil and the geopolitical uncertainty in many producer regions, it is vital to guarantee consumers continuous access to oil.
The increases in the trend component of oil prices suggest that their global market has entered a period of increased scarcity. The analysis of demand and supply prospects for oil suggests that the increased scarcity arises from continued tension between rapid growth in demand in emerging market economies and a likely downshift in supply trend growth. If the tension intensifies, whether from stronger demand, traditional supply disruptions, or setbacks to capacity growth, market clearing could force price spikes. Another issue is the concentration of oil supplies in a limited number of countries. Half of global oil is supplied by OPEC members; OPEC acts as a cartel which controls international oil prices through production quotas and other measures. Moreover, many of the oil producing countries face political instability.
As experienced in the 70s and early 80s, oil price shocks can lead to deep recessions, reduced competitiveness and rising unemployment(32). Household incomes and transport-dependent industries will suffer from increasing oil prices, resulting in inflation as well as fiscal and trade deficits.
The first indicator being monitored in the EDI is oil import dependency. It measures the share of net imports of oil in gross inland energy consumption, taking account of consumption by international bunkers. The EU-27 average oil import dependency is 83% and has increased from 73% in 1999. This can be explained mainly by the
(32) See ECFIN (2011c). According to some authors (Hamilton,
2009), the 2007-2008 oil price shock has contributed to the recent recession.
fact that EU domestic oil production decreased by 42% between 1999 and 2009.
20 Member States import 95% or more of their oil needs. By contrast, DK is a net exporter, while UK's dependency is 8% only.
The five highest "geographical" Herfindahl indexes for oil imports are found in LT, HU, SK, PL and LU. All these countries, apart from LU, rely very much on imports from Russia. In many cases, this is the result of existing infrastructures (pipelines) which do not allow easily achievable alternatives. LT, IT, RO and EL have the highest shares of oil imports sourced from non-EEA countries (above 90%).
Finally, in MT, CY, LU, EL, IE and PT, oil has the highest share in the energy mix, ranging from 100% (MT) and 96% (CY) to 50-65% for the other mentioned countries.

European Commission Member States’ Energy Dependence
14
3.3. GAS
Natural gas made up 24% of the EU’s energy consumption in 2006-2010 and was fuel for 25% of electricity generated. Gas demand has shown solid growth in the last 15 years; the share of natural gas in the European energy mix rose from 20% in 1995 to 25% in 2010. It is likely to rise because of its relatively low CO2 emission characteristics and its flexibility, which helps to balance intermittent renewable electricity generation.
Overall, the EU imported 62% of its energy needs in gas in 2006-2010. As in the case of oil, EU dependence on imported gas has increased from 48% in 1999. This can be explained by a decrease in EU gas production by 25% over the last decade, while the overall EU consumption for gas has increased by 10%.
Natural gas imports reach the EU either via pipelines or tankers. The pipeline system is made up of interconnected high-pressure transmission systems and local distribution grids, through which the gas reaches the customers. Tankers deliver liquefied natural gas (LNG) to a re-gasification
terminal, where the LNG is reheated and turned into gas.
The main risk factor to security of supply associated with gas is the limited number of suppliers, as well as the risk of supply disruptions due to political conflicts. For instance, the Russia–Ukraine gas disputes over natural gas supplies, prices, and debts have threatened natural gas supplies in numerous European countries dependent on imports from Russian suppliers, transported through Ukraine. In January 2009, eighteen European countries reported major drops in or complete cut-offs of their gas supplies. 34% of natural gas imported to the EU originated from Russia, 30% from Norway, 14% from Algeria, 5% from Qatar and the remaining 17% from the other countries.
Many Member States import all or almost all their gas needs. The list includes: LV, SK, CZ, FR, PT, EE, FI, EL, ES, LT, LU, SI, BE, BG and SE. On the other hand, DK and NL were net gas exporters, and UK and RO gas production covered around 75% of their needs.
Box I.3.1: Security of oil supply in the EU
EU legislation imposes an obligation on Member States to maintain minimum stocks of oil. A supply crisis caused by our supply of petroleum from third countries being unexpectedly interrupted would most likely have a serious impact on the European economic activity. Breaks in supply could also occur within the EU. It is in order to ensure the security of its oil supply that the EU obliges Member States to guarantee minimum stocks of oil that can be used in the event of a supply crisis to replace all or part of the shortfall. Council Directive 2006/67/EC required Member States to build up and constantly maintain minimum stocks of oil equal to at least 90 days of the average daily internal consumption during the previous calendar year. However, this Directive was repealed by Council Directive 2009/119/EC with effect from 31 December 2012. The new directive aligns the stockholding obligation with that of the International Energy Agency (IEA). This means that from 2013, for most Member States, the overall obligation is the same as the one set by the IEA: 90 days of net imports. However, the obligation of major producing countries will continue to be based on consumption. Accordingly, even net exporting countries like Denmark will continue to have a stockholding obligation under EU law. Furthermore, Member States have to hold at least one third of their obligation in the form of finished products. Emergency stocks have to meet strict requirements. In particular, they have to be available and physically accessible, so Member States can react immediately in the event of a supply crisis. The stocks may be held outside the national territory in another Member State.
The obligation of the Member States to build up and maintain a minimum oil reserve guarantees the security of oil resource supplies to the EU. However, options are limited on the supply side. Therefore, demand-side measures, leading to more energy efficiency or an adequate taxation of the environmental externalities associated with oil consumption have to be considered.

Part I
15
Box I.3.2: Gas trading in the EU
The way gas is traded can have deep repercussions on the security of supply of the Member States. Broadly speaking two main systems are currently in place: Long Term Contracts (LTC) and spot markets.
Long Term Contracts are the result of bilateral negotiations between two actors; they are normally oil-indexed and have a take-or-pay clause which imposes to the buyer, the purchase of a determined quantity of gas regardless of the actual demand. Spot markets enable demand and supply of gas to meet on a virtual or physical trading floor and they are generally participated by a wide range of players. They are flexible and can adjust more easily to variations both on the demand and the supply side.
The most important gas trading platforms in the EU are located in Northern Western Europe with APX UK, APX NL, Powernext, EEX. Southern Europe has much less developed gas trading platforms, for instance the Italian national gas exchange is still embryonic and only 10% of total Italian gas imports come from spot contracts. In central and eastern Europe there are so far no active trading platforms and gas prices are completely oil indexed. Overall in 2009, some 24% of the gas supplies came from spot market contracts, the remaining was LTCs (1).
The following map (2) illustrates the level of gas spot market development in the European Union.
Map 1: The status of European Gas Hub development
Average spot market prices have demonstrated to be in the last five years constantly below Long Term Contracts' prices, albeit subject to ampler fluctuations (3). Reportedly, Member States which make wider use of market-based instruments are also generally better insulated from supply disruptions. This was for instance the case of Germany during the gas supply shortage of the beginning of 2012 (4).
(1) Melling (2010) (2) Melling (2010) (3) ENER (2012) (4) Westphal (2012)
(Continued on the next page)

European Commission Member States’ Energy Dependence
16
It is in the NL, HU, IT, UK and RO that gas has the highest share in final energy consumption. While NL, UK and RO depend mainly on domestic gas and IT seems to have diversified gas supply, in HU the security of gas supply is a potential issue to monitor due to the combination of a high share of gas in the energy mix and its rather poor geographical diversification.
Moreover, BG, SE, LV, EE, FI, IE, LT and SK import gas from a single country. Apart from IE (which imports gas from the UK) and SE (which imports gas from DK), all the other countries mentioned above rely exclusively on Russia for their gas supply. Table I.3.1 confirms that BG, LV, EE, FI, LT and SK, as well as PT and RO, have a 100% share of non-EEA countries in their gas imports.
The Herfindahl index measuring the geographical diversification of energy import sources is much lower for the EU than for the majority of individual Member States. This shows that the risks related to dependence on a single country for gas supplies can be mitigated by the integration of national gas markets with the EU internal gas market.
In addition to these indicators, there are a number of factors which mitigate the risks related to security of gas supply but which could not be included in our EDI set because they are too difficult to quantify, or no relevant data exist. They include, in particular, the level of development and integration of gas markets, gas storage capacity, and the number and capacity of entry points for gas, such as pipelines and ports for liquefied natural gas (LNG).
The development of liquid and transparent wholesale gas markets promotes security of supply. Traded volumes of gas, which have grown more than tenfold between 2003 and 2011, provide fairer, more open and transparent pricing and volume information. Markets with liquid gas hubs
have been able to benefit to a much greater extent from decreasing global LNG prices. In the period of cold spell in February 2012, when exceptionally high demand for gas was combined with reduced gas supplies from the main gas exporting country, short-term price signals at the main EU gas hubs attracted gas to where it was valued most, keeping secure energy supplies to businesses and households intact. This clearly illustrates that the market can play an important role in delivering security of supply.
Storage capacity can contribute to mitigating the exposure to gas supply disruption as it contributes to meeting base load and foreseeable seasonal swing requirements(33). In general, underground storage involves increased storage during spring and summer in order to respond to increased demand in winter. For example, Spain and Italy require shippers to maintain a certain level of gas volume at the beginning of the winter season. In other cases, storage can also play a role in balancing markets (UK, FR, DE). Graph I.3.1 shows that the storage capacity varies across Member States and is mostly concentrated in the western part of the EU (Germany, France and Italy, and to a lesser extent Spain).
0
5,000
10,000
15,000
20,000
25,000
AT BE BG CZ DE DK EL ES FR UK HU IE IT NL PL PT RO SE SK
bcmGraph I.3.1:Technical Storage Capacity in some Member
States (2009)*
Source: ERGEG (2010)*includes underground and LNG storage.
(33) ACER/CEER (2012).
Box (continued)
Further integrating the European gas spot markets remains a challenge that could deliver safer and cheaper gas supply to Member States. It would help to increase the competition among players and reduce the market dominance of the incumbents. At the same time it could decouple gas prices from oil price fluctuations and from the energy policy of foreign suppliers.

Part I
17
In addition, the risk of supply disruption depends on the import capacity of pipelines and ports for liquefied natural gas (LNG). According to the ERGEG (2010), the majority of countries is heavily dependent on imports and could be vulnerable to any supply disruption, especially when they do not have any domestic production and storage capacity (see Graph I.3.2a for BG, EE, FI, LT, LU, SE, and SI). Therefore, raising the interconnection capacity of pipelines and LNG ports must be considered as a priority. For instance, Spain leads in gas diversification and LNG development in Europe. Gas supplies are more diversified and secure, thanks to heavy investment in LNG but also to the obligation imposed by Spain's Energy Regulator.
Overall, the resilience of the gas sector is measured by the ability of countries to meet infrastructure during a day of exceptionally high gas demand occurring with a statistical probability of once in 20 years (Regulation 994/2010, see Box I.3.3). In 2012, only fourteen countries report an ability to be resilient to potential gas disruptions (see Graph I.3.2b).
Production of shale gas can also reduce gas import dependence in the future. A massive development of shale gas production in the US over the last years has also an impact on Europe: new LNG supplies originally intended for the US market have reached European markets, breaking the link between spot gas prices and long-term oil indexed gas prices(34). Some European countries are thought to have large-scale shale gas reserves. Member States' attitudes towards shale gas differ from one country to another. Poland granted over 100 shale gas exploration licences to international and domestic firms, and strongly encourages investment. Most of the other countries are more cautious due to environmental concerns; France, for instance, has banned shale gas exploration through hydraulic fracturing.
(34) De Jong (2012)
Box I.3.3: Security of gas supply in the EU
Regulation (EU) No 994/2010 concerning measures to safeguard security of gas supply and repealing Council Directive 2004/67/EC entered into force on 2 December 2010. Based on the lessons drawn from the Russian-Ukrainian gas crisis of January 2009 the legislation strengthens the prevention and crisis response mechanisms.
In the framework of the internal energy market, the Regulation ensures that Member States and gas market participants take well in advance effective action to prevent and mitigate the potential disruptions to gas supplies through new rules to: i/ identify risks to security of gas supply through the establishment of a risk assessment framework; ii/ establish preventive action plans and emergency plans to address the risks identified; iii/ ensure gas supplies to households and a range of protected customers for at least 30 days under severe conditions; iv/ ensure a European approach with a well defined role of the Commission and of the Gas Coordination Group, including mechanisms for Member States' cooperation, in a spirit of solidarity under EU law, to deal effectively with any major gas disruption; v/ enhance flexibility of the gas infrastructure to cope with the disruption of the single largest gas infrastructure (N-1), including enabling bi-directional physical capacity on cross-border interconnections where this enhances security of gas supply.
The realization of projects which can substantially enhance the flexibility and security of gas supply and better interconnect all EU Member States, in particular the isolated systems, has already started. Launched in 2010 the European Energy Programme for Recovery (EEPR) supports the construction of 31 gas infrastructure projects with EUR 1.39 billion. Learning the lessons from the January 2009 gas crisis, the EEPR importantly supports projects for reverse flow in 9 Member States with around EUR 80 million and gas interconnectors with around EUR 1.3 billion, including new import pipelines.

European Commission Member States’ Energy Dependence
18
0
50
100
150
200
250
300
CZ DE SK BE NL AT LV FR DK UK ES IT HU FI PL EL SI PT IE BG EE LU LT SE
Graph I.3.2b:Resilience of the gas sector to disruption (2012)
Source: DG ENER. Resilience of the gas sector based on Article 9 of Regulation 994/2010.
Graph I.3.2a:Exposure to gas pipeline cuts
Source: ERGEG (2010)
Note: The N – 1 formula describes the ability of the technical capacity of the gas infrastructure to satisfy total gas demand in the calculated area in the event of disruption of the single largest gas infrastructure during a day of exceptionally high gas demand occurring with a statistical probability of once in 20 years. Gas infrastructure includes the gas transmission network including interconnectors as well as production, LNG and storage facilities connected to the calculated area. The technical capacity of all remaining available gas infrastructure in the event of disruption of the single largest gas infrastructure should be at least equal to the sum of the total daily gas demand of the calculated area during a day of exceptionally high gas demand occurring with a statistical probability of once in 20 years. The results of the N – 1 formula, as calculated below, should at least equal 100% .
3.4. SOLID FUELS
Solid fuels, which include coal, lignite and derivate products, make up 17% of the EU’s energy consumption. Solid fuels remain an important component of Europe's domestic energy supply. They are available in large quantities from numerous suppliers both within the EU and around the world, and it can be relatively easily stored. However, they have also many drawbacks: high CO2 emissions and other negative environmental impacts, high transport costs of imported coal, low competitiveness of European hard coal producers which require public support (apart from PL and
CZ). For these reasons, EU consumption of hard coal decreased by 20% over the last decade, although the consumption of lignite has hardly changed.
The EU's import dependency for solid fuels is lower than for oil and gas and amounts to 41%(35). This is due to the significant level of domestic resources as well as to the relative cost disadvantage when it comes to international trade for such heavy and low-caloric energy products. The main countries of origin of coal imported to the EU are Russia (30%), Colombia (18%), South Africa (16%), USA (13%) and Australia (8%).
FR, LU, LV, NL, PT and IT have the highest solid fuels import dependency, with imports covering their entire solid fuels needs. In AT, BE, CY, DK and LT, imports cover between 90% and 97% of their consumption. The lowest geographical diversification of energy import sources is found in CY, EE, LV and LT. Apart from CY, where the main import source is Ukraine, all other Member States showing very high HHI almost exclusively import solid fuels from Russia.
Finally, in EE, PL, CZ, BG and EL the share of solid fuels is the highest in the energy mix. The main reason is that such countries can rely on domestic resources, as shown by their low import dependency. However, the widespread use of solid fuels implies other issues, as solid fuels have a low caloric value and emit relatively more GHG emissions than alternative fuel sources. This will translate into low performance in terms of energy and carbon intensity and put pressure on these countries to cost-effectively comply with stringent climate change mitigation policies.
3.5. NUCLEAR ENERGY
Nuclear energy makes up 14% of EU energy consumption, but accounted for 28% of electricity generation in the EU. Nuclear generation has gradually decreased in recent years and in 2009 was 10% lower than its peak in 2004.
(35) Graphs for import dependence in solid fuels, published by
Eurostat, refer to hard coal and derivatives.

Part I
19
Table I.3.1 indicates that 15 Member States use nuclear energy. The share of nuclear energy in the energy mix was the highest in FR (42%), SE (33%) and LT (30%)(36); four more Member States (SK, BG, BE and SI) have a share above 20%.
Nuclear energy can be an effective way to improve energy security, while it has also many risks and challenges. The main advantage is that it displaces fossil fuels and mitigates the risks related to oil and gas price hikes and supply disruptions. Nuclear energy represents a low carbon source, which makes it attractive in the context of the climate change challenges.
Nuclear power is largely domestically produced (although it uses imported uranium). The supplies of uranium to EU utilities originate from Russia (25%), Canada (19%), Kazakhstan (15%), Niger and other African countries (16%), Australia (10%) and other countries. European uranium originated from the Czech Republic and Romania and covered approximately 3% of the EU’s total requirements. Worldwide uranium resources are generally considered sufficient for at least several decades, but require long-term investment in mining(37). Moreover, uranium price volatility does not affect the cost of nuclear power generation at the same rate as fossil fuels because the share of uranium in operational costs is much lower in nuclear power plants than the respective
(36) However, the last functioning nuclear power plant in LT
was closed at the end of 2009. In 2010, the share of nuclear energy in LT energy mix was 0%.
(37) Euratom Supply Agency (2012)
share of fuel in fossil fuel-fired power plants. Therefore nuclear energy reduces in general EU dependence on imported fuels and its energy trade deficit.
The main risks to the security of nuclear energy supply include accidents in nuclear power plants, which lead to shut-downs of long duration, as well as the limited possibilities and locations to dispose of nuclear waste from the plants. These elements not only induce supply disruptions but also affect public acceptance and trigger political reactions, which can modify at short notice the energy mix of a given Member State and have consequences in neighbouring countries. For instance, Japan’s nuclear crisis at the Fukushima plant in 2011 led to Germany’s exit from nuclear power by 2022.
Box I.3.4: Euratom Treaty
The Treaty establishing the European Atomic Energy Community (Euratom) was signed in Rome in March 1957, at the same time as the Treaty establishing a European Economic Community. The objective was to jointly develop European nuclear industries, and in this way to contribute to energy independence. According to the Treaty, the main specific tasks of Euratom include promoting nuclear research, establishing safety standards, facilitating investment in nuclear energy, ensuring regular supply of ores as well as safeguards against diverting nuclear materials from civil use.
Unlike the EC Treaty, no major changes have ever been made to the Euratom Treaty, which remains in force. In March 2007 the Commission reviewed and assessed the outlook for the Euratom Treaty. The result was generally positive, particularly in the areas of research, health protection, monitoring of the peaceful use of nuclear material, and international relations. In future, the application of the Euratom Treaty will need to continue focusing on the security and safety of nuclear materials.

European Commission Member States’ Energy Dependence
20
Box I.3.5: Variability of renewables
Wind power is considered as the most variable renewable energy technology, and the most difficult to foresee. The amount of energy that can be produced is directly dependent on the wind speed. This results in seasonal variations of wind electricity production in winter or summer depending on the region, as well as in diurnal and hourly changes. The degree of variations is also site dependent, as for example sea breezes are more constant than land breezes1.
The amount of energy produced by solar photovoltaic installations is directly dependent on sunshine intensity. Natural cycles in the context of PV cells have three dimensions: a seasonal variation with the peak in summer, variation each day from dawn to dusk peaking during mid-day, and fluctuations depending on clouds and rain fall.
The capacity of hydropower plants depends on the water level, which depends on rain and runoff from snow pack, and varies between two main types of plants: run-of-river plants and dams. Drought periods become a problem especially in the southern Europe. In addition to seasonal variability, there are annual differences depending on annual rainfalls. For instance, in Norway, where the electricity system depends in 99% on hydro power, annual hydroelectricity production levels vary by 10-15% from one year to another.
Graph 1 shows the shares of each technology in electricity generation. The share of the most variable technologies – wind and solar – is on average 5% in the EU, but is much higher – between 17 and 20% − in three Member States: DK, PT and ES.
There are several ways in which the variability of renewables can be mitigated:
- Geographical aggregation of wind turbines or other generators, which reduces the volatility of output.
- Using back-up power plants, mainly gas turbines, for balancing wind and solar plants. Gas turbines are flexible and have short response times.
- Developing hydro storage facilities. Their advantages are the potential for large-scale electricity storage (>1000MW), fast response times and relatively low operating costs. The main challenges are high capital costs and appropriate geographical factors: a large water body or a large variation in height. Beyond hydro storage, there is hardly any commercially available storage technology on today's electricity grids.
1 Gul, Stenzel (2005)
(Continued on the next page)

Part I
21
3.6. RENEWABLE ENERGY
Renewable Energy Sources (RES) accounted for 8% of EU energy consumption(38) in 2006-2010, but for 18% of electricity generation in the EU. This share has increased fast over the recent years, thanks to massive deployment of wind, solar energy and biomass. In 2006, RES represented 7% of EU gross energy consumption and 15% of electricity generation, compared to 10% and 21%, respectively, in 2010. Renewable energy is the only type of primary energy, the production of which increased systematically in the EU over the last decade; the production of RES was 60% higher in 2009 than in 1999.
The EDI scoreboard shows that LV, SE, AT, FI and PT have the highest share of renewables in their energy mix, between 18% and 32%. AT, LV and SE produce more than half of their electricity from RES. Conversely, BE, CY, IE, LU, NL and the UK have the lowest share of renewables in energy consumption (3-4%), while it is 0% for MT.
(38) By the share of renewables in the energy consumption, we
mean the share of renewable energy in gross inland energy consumption. We use this denominator consequently in the note to assess the share of each energy source in the energy mix. On the other hand, EU and Member States' renewable targets for 2020 are expressed as a share of renewable sources in gross final energy consumption, i.e. excluding transmission, distribution and transformation losses.
In order to have a clearer picture of the situation, it is worthwhile to look at growth trends of renewables in the different Member States. Some countries had already good starting points due to favourable natural endowments. For instance, LV, SE and FI have very high overall shares of renewables, but their growth rates between 2001 and 2009 were low: 16% for LV, 22% for SE and only 4% for FI. Other Member States starting from a lower base have had to put in extraordinary efforts to reduce the initial gap. Remarkably, over the same period, DE's share grew by 207%, UK by 200%, IE by 178% and HU by 118%.
The development of renewable energies is an effective way to enhance energy security in electricity generation, heat/cool supply, and transport. Renewables reduce risks associated with dependency on imported fossil fuels and their scarcity. Being largely domestically produced, they can help to shelter countries from energy supply shortages and price shocks, as well as to reduce their energy trade deficit. They reduce geopolitical security risks by contributing to fuel mix diversification; their risks are completely different from those of fossil fuel supply risks(39). In transport, biofuels represent a key source of diversification from petroleum products. As current biofuels' environmental impact and CO2 savings benefits are doubtful if the impact of indirect land use change (ILUC) is taken into
(39) Olz (2007)
Box (continued)
- Using grid interconnections. For instance, Denmark, which has the highest share of wind in electricity generation, uses high capacity interconnectors with neighbouring countries to smooth variations in wind generation.
- Introducing “smart grids” and demand side management.
The variability of electricity from renewable sources has an impact on electricity prices. Strong winds reduce wholesale spot prices due to low marginal costs of wind energy (merit order), especially in the periods of high demand for electricity1. On the other hand, if the wind is weaker than forecast, the use of back-up high-cost coal and gas fired plants leads to increased spot prices. There are also seasonal price variations caused by variations in renewable energy supply. For instance, in the whole 1st half of 2012 the level of hydro reserves in the Scandinavian countries was permanently higher than average, which led to very low power prices in the Nordic markets in this period2.
1 Pöyry (2010) 2 ENER (2012b)

European Commission Member States’ Energy Dependence
22
account, greater efforts are required to develop second generation biofuel technologies.
The main challenge for energy supply is related to variability of electricity generated from renewable energy sources, over different time scales. The resulting fluctuations of electricity supply can pose important challenges for energy systems (see Box I.3.5).
RES development requires also investment in the electricity grid to transport and balance electricity generated from renewable sources, which is expected to more than double in the period 2007-2020. A significant share of generation capacities will be concentrated in locations further away from the major centres of consumption or storage. For instance, in Italy, most solar installations are in the south of the country, while the largest consumers are in the north, and high-voltage lines in the north-south directions are frequently congested(40). Up to 12% of renewable generation in 2020 is expected to come from offshore installations, (40) Stagnaro (2012)
notably in the Northern Sea; significant shares will also come from solar and wind parks in Southern Europe or biomass installations in Central and Eastern Europe(41).
Finally, development of the majority of renewable energies depends on support schemes. Member States apply various support instruments to renewable energy, such as feed-in tariffs, feed-in premiums received on top of the market price for electricity and/or quota obligations. In many countries, rigid support schemes and overly generous support levels in the past (especially for solar photovoltaic) combined with rapidly decreasing costs have led to overcompensation and generated unsustainable support, which were passed on to electricity consumers. Consequently, most of the Member States have already or are currently reforming their support schemes to improve their cost-effectiveness. While these revisions are necessary, it is crucial to ensure a transparent and predictable support in order to
(41) European Commission (2010a)
Box I.3.6: EU Renewable Energy Policy
The European Council of March 2007 endorsed mandatory targets of a 20 % share of energy from renewable sources in overall EU energy consumption by 2020 and a 10 % target for each Member State regarding the share of renewable energy consumption in transport by 2020.
Directive 2009/28/EC on the promotion of the use of energy from renewable sources renewable energy established mandatory national targets, consistent with the 20% EU target. The directive provided that Member States may operate support schemes and may apply cooperation mechanisms to help achieve the targets cost effectively. It also improved the legal framework for promoting renewable energy, requested Member States to prepare national action plans for the development of renewable energy sources, as well as established the sustainability criteria for biofuels. The adoption of the Directive 2009/28/EC was driven by the unsatisfying deployment of renewable energy under the previous regulatory framework, which set non binding targets in electricity and transport to be reached by 2010.
The 2011 communication "Renewable Energy: Progressing towards the 2020 target" welcomed the national measures envisaged in the National Renewable Energy Action Plans and estimated that, in order to meet the 2020 targets, EU-wide annual investments of about EUR 70bn would be needed, that is roughly double the current level. The communication stresses the need for cooperation between Member States and a better integration of renewable energy into the single European market. In June 2012, the Commission adopted a new communication "Renewable energy – a major player in the EU energy market"1. The communication indicates four main areas where efforts should be stepped up to achieve our renewable energy goals: completion of the internal energy market and smooth integration of renewables into the market, cost-efficient and stable support schemes, increased use of the cooperation mechanisms contained in the Renewable Energy Directive, and developing a broad portfolio of new technologies.
1 European Commission (2012)

Part I
23
maintain a sound environment for investments and supply of renewables.
The EU legislation sets ambitious EU and national targets for renewable energies, in order to reach an overall 20% share of energy from renewable sources in gross final consumption by 2020 and a 10% share of renewable energy specifically in the transport sector. Member States have adopted National Renewable Energy Action Plans where more specific goals are set and the initiatives to meet them are presented (See Box I.3.6).
3.7. ELECTRICITY
Electricity is a secondary energy source, which, however, is very important for energy security. Therefore, we present the indicators related to electricity in a separate table (Table I.3.2).
The EU does not trade a lot of electricity with the rest of the world; net electricity imports to the EU-27 represented in 2011 less than 0.1% of EU electricity consumption. Electricity grids are such that the vast majority of trade in electricity is intra-EU. Therefore, security of energy supply as usually understood – the EU relying on foreign energy sources – does not apply directly to electricity (only indirectly, as a big part of fuels for electricity generation is imported). However, there is important electricity trade between Member States. The EDI results show that CZ, BG, EE, SI and FR are the biggest net exporters. Conversely, LU, LV, HU, FI and IT are the major net importers, importing between 14% and 59% of their electricity consumption.
The EU as a whole has a well balanced electricity mix and is not relying on any particular fuel for electricity generation. Nuclear power is the most important technology for electricity generation in the EU (28% of total electricity generation). Solid fuels have almost the same share (27%), followed by gas (23%) and renewables (18%). The situation varies, however, across Member States. Some of them have a very high share of one fuel (MT 100% and CY 99% oil, EE and PL 90% solid fuels, FR and LT(42) 70-77% nuclear); these
(42) However, the last functioning nuclear power plant in LT
was closed at the end of 2009 and the share of nuclear power in electricity generation dropped to 0% in 2010.
countries have the highest Herfindahl index (last column in Table I.3.2). On the other hand, ES, FI, RO, DE and PT have the most balanced energy mix, measured by the lowest Herfindahl index.
There are also further factors which mitigate the risks related to security of electricity supply, but which could not be included in our set of indicators because they are too difficult to quantify. They include, first of all, the level of integration and development of electricity markets, and the level of interconnection of national electricity grids.
The transition to the internal market for electricity has a substantial impact on energy dependency in the EU. Cross-border electricity trade flows between Member States become more important, which points to an increasing interdependence of the European power markets(43).
National markets were further integrated through the principle of 'market coupling', which allows for power exchanges to combine their order books with the aim of automatically linking buyers and sellers of electricity across borders. Market coupling has been spreading from the North-West of the EU to other regions. It allows for an optimal use of interconnection capacity and ensures that electricity flows from low price to high price areas, creating economic stimuli for improved energy security.
As a result of enhanced competition, energy prices for companies and households are expected to converge and possibly decrease (although they depend also on other factors, like global energy prices and taxation level), and in this way energy dependency would be reduced. In order to fully reap these benefits, the implementation of the third legislative energy package is crucial. At this stage, price convergence is still high in both electricity and gas segments(44).
(43) The recent data of the Market Observatory for Energy
show that for instance cross border physical flows were up by 13% in the 4th quarter of 2011 compared to the 4th quarter of 2010, while during the same period traded power volumes on the European markets decreased (-0.7%), and power demand decreased as well (-3.8%).
(44) European Commission (2013).

European Commission Member States’ Energy Dependence
24
Table I.3.2:
Import dependencyElectricity (%) Gas (%) Oil
(%)Nuclear (%) Rene-
wables (%)Solid fuels
(%)HHI
electricity generation
2006-2010 2006-2010 2006-2010 2006-2010 2006-2010 2006-2010 2006-2010AT 7 19 2 0 70 8 0.53BE 6 32 1 53 7 6 0.39BG -23 5 1 36 10 48 0.38CY 0 0 99 0 0 0 0.99CZ -24 5 0 32 6 58 0.44DE -3 14 1 23 15 43 0.29DK -4 19 3 0 27 49 0.35EE -21 6 0 0 4 90 0.81ES -3 34 6 19 24 16 0.25FI 14 15 1 29 31 24 0.26FR -10 5 1 77 13 4 0.61EL 9 19 14 0 13 54 0.37HU 15 35 1 39 6 18 0.31IE 4 56 6 0 13 26 0.40IT 15 54 10 0 21 14 0.37LT 1 24 5 56 12 0 0.50LU 59 0 0 0 29 0LV 33 41 0 0 59 0 0.52MT 0 0 100 0 0 0 1.00NL 12 62 2 4 9 22 0.45PL -4 4 2 0 5 89 0.80PT 12 29 8 0 38 24 0.30RO -7 16 2 16 29 38 0.28SE 2 1 1 42 54 1 0.47SI -11 3 0 36 27 34 0.32SK 2 8 2 55 19 16 0.37UK 2 43 1 17 7 32 0.32EA 1
EU27 0 23 3 28 18 27 0.24
Share electricity generation by fuelElectricity mix in the EU*
* For sources and indicators, see Annex 1

Part I
25
An important indicator of the security of electricity supply is the capacity in power generation to meet peak load demand. A report from ERGEG (European energy regulators)(45) shows that maximum net generating capacity increased in most Member States in 2009. The overall increase in the EU-27 and Norway was 28 GW or around 3.5% (22.9 GW in 2008). Most Member States managed to satisfy their peak load. All countries with the exception of FI and LU had surplus generating capacity to meet their peak load demand. However, even though some countries had an immense surplus of generating capacity (e.g. DE, ES and IT), it should be noted that total installed capacity does not reflect available capacity during peak times. This is mostly due to the proliferation of renewables power plants and their intermittent nature(46). Therefore, active energy demand-side management would have an increasing role in reducing peak loads and the full implementation of the relevant provisions of the Energy Efficiency Directive would be an important step to this end.
Cross-border interconnections provide additional generation capacity at peak load times and help mitigate the risk of system imbalances due to intermittency of generation from renewable sources. In general, small countries with good (45) ERGEG (2010) (46) In addition, ERGEG collected data on reliably available
net generating capacity that takes into account unavailable capacity due to mothballing, maintenance and overhauls, outages and system services reserve. The graphs provided suggest that the actual surplus capacity available in 2009 was much lower than previously estimated. Nevertheless, only three countries (out of the 22 that responded) – BE, FI and LU – did not have enough reliably available generating capacity to meet their peak load demands. Hence, overall generating capacity still seems to be sufficient in the EU.
interconnections display high import flows compared to their domestic demand. For instance, LV, LT and LU maintained the highest proportion of Net Transfer Capacity (NTC) vis-à-vis peak load demand (207%, 141% and 93%, respectively). By contrast, geographically isolated countries (islands) have lower interconnections (MT, CY, and to a lesser extent, UK and IE). In general, in most countries, import capacities can only meet 30% of the maximum peak load demands (see Graph I.3.3). However, this is not always a good indicator of security of supply and market integration. Two countries with the highest values, LV and LT, do not have interconnections with other Member States; their import capacity still relies on sources outside the European Economic Area(47).
0
40
80
120
160
200
240
0
20
40
60
80
100
AT BEBGCYCZDEDKEE EL ES FI FRHU IE IT LT LU LV MTNL PL PTROSE SI SKUK
%GW
Graph I.3.3:Electricity Network Interconnections
Peak load in the system of TSONTC as a percentage of peak load
Source: ERGEG (2010).
(47) ERGEG (2010)
Box I.3.7: Security of supply of electricity
Directive 2005/89/EC establishes measures aimed at safeguarding security of electricity supply so as to ensure the proper functioning of the EU internal market for electricity, an adequate level of interconnection between Member States, an adequate level of generation capacity and balance between supply and demand. Member States must define general, transparent and non-discriminatory policies on security of electricity supply compatible with the requirements of a competitive single market for electricity. They must define and publish the role and responsibilities of competent authorities and different players in the market. Transmission network operators must set minimum rules and obligations to ensure continuous operation of the transmission and, where appropriate, the distribution network under foreseeable circumstances. Investment is crucial for competition and the future security of electricity supply in the EU. Member States must lay down a framework for providing information to network operators which facilitates investment.

European Commission Member States’ Energy Dependence
26
3.8. AGGREGATED RANKING OF MEMBER STATES FOR SECURITY OF ENERGY SUPPLY
The aggregation of the factors related to energy security of supply shows that MT and CY are the most vulnerable countries, followed by LU, IE, EE, LT and EL.
ATBEBG
CY
CZ
DE
DK
EE
ESFI
FR
ELHU
IE
IT
LTLU
LV
MT
NL
PLPT
ROSE SI
SK
UK
-50
-40
-30
-20
-10
0
10
20Graph I.3.4:Security of energy supply,
aggregated score
2006-2010 average 2010 2006See Annex 2 for the methodology of aggregate score, High score indicates good performance. Any score below -4 is a priori considered to represent underperformance; any score between +4 and -4 is a priori considered to represent a neutral performance; any score above +4 is a priori considered to represent over-performance.
MT is the most vulnerable country from the point of view of energy security. It is fully dependent on imported energy supplies and has also a non-diversified energy mix, relying exclusively on oil (except for a negligible share of renewable energy, below 1%). Therefore, MT should reduce its nearly complete dependence on oil imports through the development of an efficient domestic RES sector. Over the long term, MT should further diversify its energy mix and hence study the viability and efficiency of energy connections with other (EU) countries, in particular through (i) the electricity connection with Sicily and (ii) import facilities of LNG / LPG (regasification plant).
CY is also more vulnerable to energy security risks than other EU countries (with the exception of MT) since its energy consumption depends almost fully on imported oil products. The share of oil in CY's energy mix is 96% and even electricity generation relies for 99% on petrol inputs. Moreover, there is no oil refinery in the country, so all refined products need to be imported. The other major risk for energy security lies in the isolation of CY's electricity network, as illustrated by the electricity supply reduction following the accident in the largest power plant in 2011. These risks for energy supply security are somewhat mitigated by the strong diversification of oil suppliers and by an
increasing share of renewable energy in the energy mix.
LU has no domestic energy sources (apart from minor RES generation), hence it is almost fully dependent on imports for all its energy needs. Moreover, the diversification of primary energy sources is very limited as the country uses only two sources of energy: oil and gas. In addition, LU imports 59% of its electricity needs. However, the country imports this electricity and the majority of its energy needs from other EU Member States, which partially mitigates security of supply risks.
IE has the 3rd highest energy import dependency in the EU; it imports all oil products, 96% of solid fuels and 92% of its gas needs. In addition, IE has one of the highest shares of oil in the energy mix, while it has one of the lowest shares of renewable energies. IE has only one source of import for gas, which is the UK, and all the gas connections linking IE with UK transit through a single point in Scotland. A more diversified pool of gas sources, a higher number of interconnections and enhancing gas storage capacity would be desirable to better insulate the country from potential supply disruptions; in this context Ireland considers the construction of an LNG terminal and a connection with an offshore gas field. This is important also for the electricity sector, as some two-thirds of Ireland’s electricity comes from gas-fired generation. It would also be useful to further diversify the energy mix, in particular by promoting more renewable energies.
EE appears from the aggregated scoring as one of the most vulnerable countries because it has no domestic production of gas and it imports all its gas needs from one single supplier. Furthermore, it does not have a well-diversified energy mix, relying mostly on solid fuels. However, EE is a major producer of oil shale, which accounts for 59% of its energy mix and 90% of electricity generation. It also has a much higher share of renewables than the EU average. As a result, EE energy import dependency was only 22% on average in the period 2006-2010 (and decreased to 13% in 2010), one of the lowest in the EU. EE is also a major electricity exporter. Reliance on a single supplier for gas matters less in EE due to the very low share of gas in its energy mix. Therefore, the actual energy security situation in EE seems

Part I
27
better than that implied by its scoring, as long as the current production of shale oil is maintained.
LT is fully dependent on gas imports and is almost entirely dependent on imports (above 95%) for oil and solid fuels as well. Moreover, its imports of energy sources are not well diversified geographically, deriving mainly from Russia. Energy security risks have been aggravated by the closure of the Ignalina nuclear power plant in 2009, which has turned LT from a net exporter of electricity into a major net importer. On a more
positive note, the share of renewable energy in LT is well above the EU average.
EL is fully dependent on imports for gas and oil and imports over 90% of its coal needs, although its energy supply sources, especially for oil, are well diversified geographically. The energy mix is not as well balanced, as EL relies on oil for more than 56% of its energy mix. While domestically mined lignite plays an important role in electricity generation, the share of renewables is still low, albeit growing.
Criteria assessing the security of energy supply
In our EDI set we focus on four indicators of energy security: energy import dependency, the degree of geographical diversification of energy import sources, the share of imports coming from non-EEA countries, and the degree of diversification of energy products in the energy mix. We analyse the first three of these indicators for all energy products together, as well as for each of the following energy products: natural gas, crude oil, solid fuels. We also analyse import dependency and the diversification by fuel in generation of electricity, which is a secondary source of energy. The indicators have been aggregated into a composite indicator, but they are also individually important in themselves.
While we have tried to cover the most important elements of security of energy supply, some important issues remain outside the scope of the EDI as they are too difficult to quantify, although they are largely described in the note and in the country fiches. They include, for instance, the level of integration of a given country within the EU gas and electricity markets, the adequacy of interconnections and entry points for oil, gas and electricity, and the level of storage capacity for oil and gas.


4. MEMBER STATES' PERFORMANCE IN TERMS OF ENERGY AND CARBON INTENSITY
29
Energy intensity indicates how much energy, measured in tonnes of oil equivalent (toe), is consumed to produce each unit of GDP. Decreasing energy intensity indicates decoupling between energy use and GDP. Low energy intensity means low energy use per unit of GDP, implying that the economy is less influenced by changes in energy prices.
While energy intensity is the ratio of energy consumed to GDP, energy efficiency is measured in the EU legislation as a decrease in primary energy use, as compared to projections. The EU made the objective of a 20 % reduction in primary energy use by 2020 one of the headline targets of the Europe 2020 Strategy (see Box I.4.1). Reaching this target would undoubtedly lead to reduced energy dependence and would support EU's social, economic and environmental agendas. From the perspective of this note, a focus on energy intensity rather than overall energy savings seems appropriate, as it allows us to separate the changes in energy use per unit of GDP from the changes in GDP. On the other hand, energy intensity also depends on factors not related to energy efficiency, such as climate, population density or the size of GDP.
In addition, it is important to note that the changes in energy intensity and energy savings may indicate not only improvements in energy efficiency, but also structural changes in the economy, such as a transition from industry towards services and, within industry, a shift to less energy-intensive processes or relocation of energy-intensive activities abroad. Therefore, it is necessary to analyse energy intensity in detail. In our note, in addition to the overall energy intensity in the economy, we look at the energy intensity of the main end-users of energy: industry (including some industrial sectors), transport and households. In order to give special emphasis to energy poverty and the impact of energy shocks on households, the share of energy in households’ consumption has been included among the EDI indicators.
This dimension of the EDI also covers indicators related to the carbon intensity of the economy. Energy-related activities are by far the main contributors to the EU’s GHG emissions.
Important policy developments are taking place, which affect the cost of energy supply, therefore influencing Member States’ competitiveness and their ability to adapt. A new phase of the EU Emissions Trading Scheme, the main EU instrument to reduce GHG emissions, will start in 2013. This new phase will mean in particular that more polluting permits (EU allowances) will be auctioned instead of being given for free. Potential impacts on energy prices are expected if energy utilities are to pass through these extra costs onto their final energy prices. This could indirectly affect EU industries and final consumers.
Consequently, the concept of energy and carbon intensity has been approached taking account of the following dimensions:
Energy intensity: all things being equal, the higher the energy intensity of the economy, the more vulnerable a Member State is to energy price shocks and the more prone it is to face negative consequences in terms of GDP loss. Moreover, the more energy intensive the industrial and the transport sectors are, the more vulnerable a Member State is to competitiveness loss. The higher the share of energy in households' consumption, the more significant the impact of energy policies on households’ overall consumption patterns.
Carbon intensity: all things being equal, the higher the carbon intensity of the energy sector, the more vulnerable a Member State is to more stringent climate change mitigation policies and the more inclined it is to face negative consequences in terms of inflationary pressures and competitiveness loss. Moreover, the higher the share of energy intensive industries and the more carbon intensive the transport sector, the more potentially vulnerable the Member State to competitiveness loss and the risk of carbon leakage.

European Commission Member States’ Energy Dependence
30
Box I.4.1: Energy efficiency in the EU
Energy efficiency has been closely looked at in many Member States during the 2012 European Semester, triggering country-specific recommendations in BG, EE, LT, LV, MT and PL. It is also likely to remain high on the political agenda for at least two reasons. First, a new Directive on Energy Efficiency was adopted by the Council and the Parliament in October 2012, and should be implemented by Member States by June 2014. Second, analyses show that the energy efficiency target – a 20% decrease in primary energy use by 2020 compared to projections made in 2007 – as defined in the Climate and Energy package and reaffirmed under the Europe 2020 Strategy, is the least likely to be achieved under current conditions among the climate and energy targets. Member States are therefore expected to speed up reforms to ensure that EU commitments are to be achieved in the most cost-effective way.
The new Directive on Energy Efficiency establishes a common framework for promoting energy efficiency in the Union so as to ensure the target of 20 % primary energy savings by 2020 is met and to pave the way for further energy efficiency afterwards. It lays down rules designed to remove barriers and overcome some of the market failures that impede efficiency in the supply and use of energy. It further reinforces the already existing legislation on buildings (i.e. the Energy Performance of Buildings Directive 2010/31/EU) and energy-related products (i.e. the Energy Labelling Directive 2010/30/EU and Ecodesign Directive 2009/125/EC).
For end-use sectors, the new Directive focuses on measures that lay down requirements on the public sector, both as regards renovating central government buildings (a 3% mandatory annual renovation rate) and applying high energy efficiency standards to the purchase of buildings, products and services. The Directive requires Member States to establish national energy efficiency obligation schemes, or alternative policy measures, which should achieve a cumulative target of new savings each year equal to at least 1.5% of the annual energy sales to final consumers (with possible exclusion of energy used in the transport sector) over the 2014-2020 period. It requires regular mandatory energy audits for large companies and lays down a series of requirements on energy companies regarding metering and billing.
For the energy supply sector, the Directive requires Member States to assess the potential for high-efficiency generation and efficient district heating and cooling, to translate the results of the assessment into adequate measures and to require that energy generation installations above 20 MW also assess the possibilities for the use of cogeneration. Both assessments have to be based on a cost-benefit analysis. If the results prove to be positive, Member States will have to require installations to recover waste heat through cogeneration or district heating and cooling networks.
Other measures include efficiency requirements for national energy regulators, awareness-raising actions, requirements on the availability of certification schemes, promotion of energy services, and an obligation to remove obstacles to energy efficiency, such as the split of incentives between the owner and the tenant. Finally, the Directive provides for the establishment of national indicative energy efficiency targets for 2020 and requires the Commission to assess in 2014 whether the Union can achieve its target of 20 % primary energy savings by 2020. The assessment of the Commission will be submitted to the European Parliament and the Council, followed, if appropriate, by proposals for further measures.

Part I
31
4.1. ENERGY INTENSITY
4.1.1. Energy intensity of the economy
The energy intensity of an economy – the amount of energy used in the whole economy per unit of GDP – is the highest in BG, EE, RO, SK and CZ(48). Member States with much higher energy intensity than the EU average also include LT, PL, LV and HU. Hence, a pattern can be established between EU-12 and EU-15 Member States. Higher energy intensity partially results from lower GDP in the EU-15, but also from inefficiencies in industry, transport, housing and other energy uses.
(48) If calculations were made using GDP in PPP and not
nominal GDP, the ranking of the worst performing Member States in 2009 would be: EE, BG, CZ and LT. However, we are not in position to make such a comparison for 2005-2009 period chosen for our analysis.
A catching-up effect is taking place where the more energy-intensive countries are also the ones where energy use per unit of GDP is decreasing more rapidly. While in the EU on average energy intensity decreased between 2006 and 2011 by 5%, it decreased by 16-19% in most of the countries with the highest energy intensity – BG, RO and SK. This is partly due to economy restructuring (including decline of industries and shift to services) and to improvements in the use of energy, in part influenced by the implementation of the EU environmental and energy acquis. Yet, a significant gap persists and additional reductions in energy intensity should be a priority in most EU-12 Member States.
4.1.2. Energy intensity of industry
Industry accounts for 24% of final energy use in the EU. Average energy intensity of industry
Energy dependence indicators related to the energy and carbon intensity dimension*
2006-2010 2006-2010 2005-2009 2006-2010 2006-2010 2006-2010 2005-2009 2005-2009 2004-2008 2006-2010AT 130 162 602 47 0.3 1.9 10.7 1.6 0.13 8BE 185 218 448 54 0.4 1.8 10.5 1.1 0.19 11BG 731 608 1209 116 2.5 2.5 3.3 0.30 14CY 184 200 942 30 0.8 2.7 5.6 2.1 0.16 11CZ 383 263 627 112 1.2 2.6 14.5 1.8 0.21 14DE 144 115 499 50 0.4 2.3 9.2 1.3 0.15 11DK 95 76 359 44 0.3 2.6 7.9 0.9 0.09 11EE 478 296 664 147 1.6 2.9 9.9 1.9 0.23 12ES 144 175 677 29 0.4 2.2 9.2 1.7 0.14 10FI 220 303 403 63 0.4 1.6 12.0 1.1 0.09 7FR 151 481 43 0.3 1.4 6.7 1.3 0.13 9EL 151 189 434 36 0.6 3.3 6.9 1.2 0.13 7HU 293 152 750 122 0.8 2.0 11.0 2.1 0.28 14IE 91 59 40 0.4 2.8 14.1 0.19 9IT 124 134 451 34 0.4 2.4 9.4 1.3 0.12 8LT 365 187 582 103 1.0 1.5 8.6 1.7 0.24 13LU 139 304 997 45 0.4 2.3 5.9 2.4 0.17 11LV 327 404 708 159 0.8 1.8 6.5 1.9 0.15 12MT 178 23 0.6 2.9 6.6 0.11 6NL 153 149 446 41 0.4 2.0 11.6 1.0 0.15 10PL 344 246 859 110 1.4 3.3 7.2 2.4 0.25 14PT 160 228 31 0.5 2.2 2.0 0.10 10RO 422 370 541 117 1.5 2.5 13.7 1.5 0.22 18SE 157 200 419 47 0.2 1.0 11.4 1.0 0.08 12SI 232 196 804 69 0.6 2.2 13.3 2.4 0.28 13SK 391 325 793 88 1.0 1.8 15.8 2.0 0.14 17UK 114 115 464 36 0.3 2.4 1.1 0.12 8EA 146 145 515 9.4 10
EU27 153 150 512 0.4 2.2 9.6 1.3 10
* For sources and indicators, see Annex 1. Energy intensities are expressed in kgoe/1000 EUR, carbon intensities in tonnes of CO2 eq./1000 EUR. Please note that colours only indicate top and bottom values and have no qualitative assessment attached.
Table I.4.1:
Energy intensity of households (kgoe/1000
EUR)
CO2 intensity of households (ton CO2 eq./1000
EUR)
CO2 intensity of the
economy (ton CO2 eq./1000
EUR)
Weight of energy in
HICP basket (%)
Energy intensity of
the economy (kgoe/1000
EUR)
Energy intensity of
industry (kgoe/1000
EUR)
Energy intensity of transport
(kgoe/1000 EUR)
CO2 intensity of energy use (ton CO2 eq./1000
EUR)
Share of energy
intensive sectors in total GVA
(%)
CO2 intensity of transport sector (ton
CO2 eq./1000 EUR)

European Commission Member States’ Energy Dependence
32
was the highest in BG, LV, RO, SK, LU and FI in 2006-2010, at least twice as high as the EU average. In the case of BG, RO and SK, the high energy intensity of industry is combined with very high energy intensity of the economy as a whole and a high share of energy-intensive industries. In SK, CZ, RO and BG, energy-intensive sectors represent the highest share of total gross value-added, and contribute to high energy intensity of industry in these countries. However, IE is an example of a country where energy-intensive sectors represent a high share of total gross value-added but the industry as a whole has very low energy-intensity (in fact the smallest in the EU).
In the majority of the new Member States, but also to a lower extent in the other Member States, the energy intensity of industry decreased over the past years, on average by 5% between 2006 and 2010. The situation in the countries with the highest industrial energy intensity differed from one to another – it decreased by 39% in BG, by 36% in RO and by 7% in FI, but increased by 24% in LU, by 13% in LV and by 7% in SK. Decreasing energy intensity in the industry is mainly the result of structural adjustments in their economic activities. However, if more energy savings are to be achieved, improving efficiency at sectoral level is also necessary. In this sense, price signals are important as energy prices are a key determinant of energy use practices in any industrial sector. Note for instance that electricity and gas prices are among the lowest in the EU in BG(49), EE, FI and LV(50).
The International Energy Agency analyses energy end-use trends by distinguishing between three main components affecting energy use: activity levels, structure (the mix of activities within a sector) and energy intensities (energy use per unit of a sub-sectoral activity). The separation of energy use per unit (which is more relevant for energy efficiency and competitiveness) from changes in activity, structure and intensity is critical for policy analysis. Most energy-related policies target energy intensities and efficiencies, often by promoting energy audits and management
(49) However in PPS, Bulgarian prices are actually substantially
higher than the EU average. (Commission Staff Working Paper, 9/06/2011, "2009/2010 Report on Progress in creating the internal gas and electricity market")
(50) Which is also due to price regulations, at least for BG, EE and LV.
systems to minimise the wasteful practices and new technologies. Accurately tracking changes in intensities helps measure the effects of these new technologies.
Disaggregated data are available regarding the energy intensity of some industrial sectors. Results are presented in Table I.4.2 but should be handled with caution, as they may have been influenced by a relatively low number of firms per sub-sector in some Member States. In the case of SK, high energy intensity of industry seems to be influenced by poor performance in the iron and steel, chemical, non-metallic minerals and pulp and paper industries. Low performance in EE can be explained by the performance of the chemical industry and of the non-metallic minerals and pulp and paper industrial sectors. Low performance in FI is clearly influenced by the pulp and paper but also iron and steel industries. Finally, low performance in LU is explained by the low performance of the iron and steel industry. There are no sectoral data available for BG, LV and RO which are also among the worst performers. The cost-effective final energy saving potential expected in the EU industry is around 21% in 2030 when compared to a reference scenario. The most promising in that respect seem to be cross-cutting technologies that are available in all industrial sectors(51).
4.1.3. Energy intensity of transport
The transport sector uses around one third of the EU final energy consumption. The energy intensity of this sector depends on many factors: modal split between various transport modes at Member State level, relative energy efficiency of the transport fleet depending largely on the age of the fleet, availability and prices of public transport, etc. Transport fuel taxes are another important determinant of this indicator. Low fuel taxes stimulate passenger and freight transport demand and road transport in particular, contribute to very high car density and can even induce tank tourism, as is the case for LU.
(51) Fraunhofer Institute for Systems and Innovation Research
(2012)

Part I
33
The highest energy intensities for the transport sector are found in BG, LU, CY, PL and SI, closely followed by SK, PT, LV and ES. In the majority of the most exposed countries, transport
energy intensity decreased in the last years (2006-2009): in LU and SK by 16%, in CY by 5% and in BG by 4%. However, it increased in PL (by 13%) and in SI (by 7%). On average, energy intensity of
Table I.4.2:
Industry Iron and Steel and non-
ferrous metals
Chemical and Petrochemical
Non-Metallic Minerals
Mining and Quarrying
Paper, Pulp and Print
2009 2009 2009 2009 2009 2009AT 161 336 186 397 112 376
BE 193 293 381 452 217
BG 463
CY 194
CZ 248 656 1234 658 73 390
DE 115 122
DK 72 29 41 623 64
EE 294 13 776 1693 91 396
ES 182 252 310 748 169 205
FI 286 361 407 361 86 1132
FR 139 219 293 439 92 133
GR 159 341 119 885 107 84
HU 142 500 336 716 91 151
IE 54
IT 129 168 266 629 34 189
LT 175 18 770 1191 49 138
LU 310 823 305 772 80 77
LV 431 88
MTNL 153 331 505 358 11 106
PL 216
PT 222
RO 285 2
SE 211 294 112 345 363 1054
SI 183 208 165 914 123 451
SK 351 1218 1008 800 42 1198
UK 112
EA 137 248 271 569 60 242
EU27 146 268 290 565 35 245
Energy intensity of some industrial sectors (2009)(energy consumption/gross value added)*
* Please note that colours only indicate top values and have no qualitative assessment attached. For sources and indicators, see Annex 1.

European Commission Member States’ Energy Dependence
34
transport decreased by 3% between 2006 and 2009, less than average energy intensity in the economy.
At EU level, the cost-effective final energy saving potential for transport was estimated to be about 30% in 2030 compared to a reference scenario(52). Looking at data at Member State level, it seems that BE, DE, FR, PT and NL have the most significant saving potential for transport, although variations are somehow limited compared to the EU average. Regarding goods road transport, the Baltic States, PT and UK seem to have the greatest saving potential.
4.1.4. Energy intensity of households and energy prices
Households consume 26% of final energy consumption. Space heating represented 68% of total household consumption in 2009, electricity for lighting and appliances 15% and water heating 12%.
Energy intensity of households is measured by final energy consumption of households divided by their total expenditure (in EUR). Table I.4.1 shows that the average value of this indicator is the highest in LV, EE, HU, RO and BG. This reflects the existing inefficiencies in energy use by households and in the insulation of houses, but it is also strongly influenced by lower levels of household expenditure in the new MS. The value of this indicator increased between 2006 and 2010 in the majority of Member States. Among the countries with the highest intensity, EE and LV recorded substantial increases while RO and BG recorded some reduction. Annual differences may, however, be influenced by weather conditions.
Another indicator of households energy use, measuring energy consumption per dwelling, shows the highest value in FI, IE, BE, AT and LT(53). Over the period 1990-2009, energy consumption per dwelling decreased on average by 1.4% per year. The most substantial decreases were recorded in CZ, LT and EE, while in MT, CY, EL, FI and ES energy consumption per dwelling has increased. Part of the improvements
(52) Fraunhofer Institute for Systems and Innovation Research
(2012) (53) EEA (2012)
occurred in the area of space heating, due to better thermal performance of buildings encouraged by mandatory efficiency standards for new and retrofitted buildings following the implementation of the Energy Performance of Buildings Directive (of 2002 and its recast in 2010), and a larger penetration of high efficiency boilers. For the EU-27 as a whole, new dwellings built in 2009 consumed about 40% less energy than dwellings built in 1990. The other factors contributing to the decrease per consumption unit were the retrofitting of existing dwellings and the introduction of new more efficient household appliances, as well as behavioural savings, triggered also by the Energy Labelling Directives of 1990s and their following updates.
Another way to assess the potential impact of energy shocks on households is to look at the relative weight of energy in total consumption. A symmetric rise in energy inflation would affect the overall HICP and households differently due to the different weight of energy in the HICP consumption basket. A look at the respective weights of energy items in the HICP basket reveals that the share of household expenditure dedicated to these items varies across the EU.
Households in RO, SK, HU, BG and CZ proportionally spend the highest shares of their budgets on energy, between 14 and 18% in 2006-2010 period. This share decreased between 2006 and 2010 in the majority of the most vulnerable countries; for instance, in SK it decreased from 19% to 16%, and in RO from 18% to 17%. On average, European households dedicated around 10% of their spending to energy items. This share was the same in 2006 and in 2010. The major part of this is spent on fuels for personal transport, followed by electricity and gas.
Note as well that the pass-through from oil prices to energy inflation is quite different across Member States both in terms of size and speed. Changes in oil prices have contemporaneous as well as lagged effects on energy inflation. For euro-area Member States, the analysis has shown that energy inflation is still affected up to four quarters after the initial oil price change. If we apply the weights of energy inflation in the HICP to the estimated pass-through from oil prices to energy inflation, we can assess the overall impact of oil price changes to headline inflation. This was

Part I
35
recently done for the euro area and results suggested that an increase in the oil price by one euro increases headline inflation directly by an average of 6 basis points. The impact ranges from 3 basis points in MT to 17 basis points in BE.
4.2. CARBON INTENSITY
The carbon intensity of an economy depends on the emissions produced by the economy, but also on the energy intensity of the economy. At EU level, energy-related emissions account for almost 80% of the EU’s total greenhouse gas emissions, with the energy sector representing 31%, transport 19%, industry 13%, households 9% and others 7%.
EU climate policies may translate into higher energy prices. The exact magnitude of the price increases depends on the carbon price resulting from the EU carbon market, as well as on the ability of energy utilities to passthrough their cost increases. The hike could coincide with the start of the third phase of the EU ETS, as all emissions permits (EU allowances) of the power sector will have to be auctioned as of 2013. Some Member States were actually eligible for derogation. They had until the end of September 2011 to apply to the Commission for derogation. BG, CY, CZ, EE, HU, LT, PL and RO submitted an application. LV and MT did not apply.
The first indicator monitored is the carbon intensity of the economy. The worst performing countries in this regard are BG, RO, EE, PL and CZ. There appears to be a strong correlation between the performance of these countries and the high shares of solid fuels in their energy mix, which are the highest in the EU for PL, EE, CZ
and BG. The high carbon intensity of RO's economy seems influenced by a combination of other factors, such as high carbon intensity of households and of energy use, and a high share of energy intensive industries in value added.
Another indicator relates to the carbon intensity of the transport sector. It is the highest in BG, LU, PL, SI and CY. It must be noted that its performance is very strongly correlated to the energy intensity of the transport sector indicator. In fact, oil represents the main energy input in the transport sector, which means that high energy intensity automatically translates into high carbon intensity.
As regards the quantity of emissions per unit of energy used, various energy sources can be used to produce electricity, and their carbon content differs significantly. Currently, the most carbon intensive energy sectors are found in EL, PL, IE, MT and EE. MT relies heavily on oil to produce their electricity. In EE, EL and PL, it is the widespread use of solid fuels which is responsible for the high carbon intensity of the sector.
Finally, energy-intensive industry sectors use large amounts of heat and energy to physically or chemically transform materials. When facing international competition, they could be substantially disadvantaged in case a carbon constraint is imposed unilaterally on EU industries. In developing its climate change package the Commission explored its overall economic impacts as well as that on European energy-intensive industries. While overall costs for the entire EU economy appear to be manageable – a reduction of GDP by 0.35% to 0.5% in 2020 depending on the allocation of allowances could be expected – the
Box I.4.2: Limiting the risk of carbon leakage
By Directive 2009/29/EC, two mechanisms were incorporated into the ETS Directive in order to protect EU sectors and subsectors at significant risk of carbon leakage. The first mechanism cushions the impact of ETS-induced costs linked to the sectors' or subsectors' use of fossil in their own production processes (“direct CO2 costs”). The compensation takes the form of free EU allowances to emit CO2 for firms belonging to such sectors and subsectors. The second mechanism introduced into the ETS Directive explicitly envisages that Member States may decide to grant State aid to firms within sectors and subsectors at significant risk of carbon leakage due to the higher CO2 costs (it being assumed that these costs are passed on by electricity producers in their prices) (“indirect CO2 costs”). The Commission will adopt State aid guidelines in the context of the ETS framework.

European Commission Member States’ Energy Dependence
36
situation for certain energy-intensive industries could be more dramatic. One of the adverse effects is "carbon leakage", i.e. the delocalisation of industrial production and emissions to countries outside the European Union due to increased production costs in Europe.
In SK, CZ, SI, BG, IE and RO energy-intensive sectors represent the highest share of total gross value-added. These shares remained more or less stable over time, due to the fact that they are determined by the long-term specialisation of industrial activities. Therefore, in those countries in particular, the potentially negative impact on firms’ competitiveness from climate policies could have significant macroeconomic consequences.
4.3. AGGREGATED RANKING OF MEMBER STATES FOR ENERGY AND CARBON INTENSITY
Member States ranking resulting from the aggregation of the elements related to energy and carbon intensity indicates that the most vulnerable country is BG, followed by EE, PL, CZ, SK and SI.
ATBE
BG
CY
CZ
DE
DK
EE
ESFI
FR
EL
HU
IEIT
LTLU
LV
MT
NL
PL
PT
RO
SE
SI
SK
UK
-50
-40
-30
-20
-10
0
10
20Graph I.4.1:Energy and carbon intensity,
aggregated score
2006-2010 average 2010 2006
See Annex 2 for the aggregate score. High score indicates good performance. Any score below -4 is a priori considered to represent underperformance; any score between +4 and -4 is a priori considered to represent a neutral performance; any score above +4 is a priori considered to represent over-performance.
BG is the most vulnerable country in terms of energy and carbon intensity; the aggregate score of BG is well below that of all other Member States. One of the reasons for this is excessive reliance on solid fuels (lignite in particular, the least efficient type of coal) and the country's specialization in energy-intensive industries. BG´s performance is particularly poor in the transport sector. This is
influenced by a range of factors: the modal shift from rail to road transport, poor energy efficiency and high average age of the transport fleet, and very low transport fuel prices. Nevertheless, BG recorded substantial progress between 2006 and 2010: overall energy intensity of the economy fell by 19%, and carbon intensity by 15%.
EE is the second most energy- and carbon-intensive economy in the EU. The performance of EE is particularly bad as regards energy intensity of households and some industries, such as minerals and chemicals. The main reason seems to be the reliance of its energy mix on oil shale, a low-caloric fuel emitting high quantities of CO2. Between 2006 and 2010, energy intensity of the economy increased by 24%, along with a marginal rise in carbon intensity, which may be related to an increased share of oil shale in the energy mix. Energy efficiency measures, especially in the household and transport sectors, need to be strengthened in EE.
RO also has a very high energy and carbon intensity. This is related to its high share of energy intensive sectors in GVA and poor performance of some industries, especially of the chemical and petrochemical sectors. Energy intensity of households is also one of the highest in the EU. However, between 2006 and 2010, energy intensity of the economy fell by 16% and carbon intensity by even more. Substantial improvements took place in industry, due to both energy efficiency gains and structural effects, and in the household sector, while the performance of the transport sector deteriorated. A consistent modal shift has been taking place in RO over the last decade: the share of road transport both for passengers and goods has increased significantly, combined with a sharp decrease in the railway share. Increasing motorisation in RO also contributes to its growing carbon footprint.
SK has the highest share of energy-intensive sectors in total GVA among all Member States. Some of its industrial sectors, especially the iron, steel, chemical and paper industries, are also very energy-intensive. SK has one of the highest shares of hard coal in its energy mix. It also has an energy- and carbon-intensive transport sector, which is explained partially by the dramatic shift from railways to road transport. As in the majority of the new Member States, energy intensity of the

Part I
37
economy improved in SK over recent years, namely by 18% between 2006 and 2010. Energy intensities of households and transport improved over this period, while it deteriorated in industry.
CZ is another country with a very energy- and carbon-intensive economy. This feature may be explained by CZ's energy mix heavily reliant on domestically produced lignite and hard coal, combined with the second highest share of energy-intensive industries in total GVA. Some sectors in CZ are also very energy-intensive in comparison to other EU countries, especially the chemical and steel industries, as well as the household sector. Energy intensity of the economy has improved, however, by 10% over the 2006-2010 period. The most significant improvements took place in industry, while the performance of the transport and household sectors has not changed much.
PL also relies massively on solid fuels (coal and lignite) and as a consequence it performs particularly poorly in terms of CO2 intensity. While carbon intensity is high in all the sectors analysed, it is carbon intensity of energy use which in PL (and in EL) is the highest in EU. This shows a need for decarbonisation of the energy generation sector, and economic risks for PL's power sector related to the next phase of the ETS when more carbon allowances will be auctioned rather than provided for free. Energy intensity is high, but it is particularly problematic in the transport sector − 80% above EU average. While energy intensity in the economy and especially in industry has substantially decreased in recent years, energy intensity in transport has further increased by 13% since 2006.
Criteria for assessing the energy and carbon intensity of the economy
Our EDI set uses the following indicators: energy and CO2 intensity in the economy as a whole, energy and CO2 intensity in the main end-users of energy: industry, transport and households, CO2 intensity of energy use, share of energy intensive sectors in GVA, and weight of energy in the HICP basket. The indicators have been aggregated into a composite indicator, but they are also individually important in themselves. In a separate table, we analyse energy intensity of some of the energy-intensive industrial sectors.
In our analysis we focus on energy and carbon intensities, which allow separating the changes in energy use per unit of output from the changes in output levels. This is a different – and complementary − approach to the headline targets in the Europe 2020 strategy, which define energy efficiency and climate goals as achieving 20% reduction in primary energy use (compared to projections) and 20% reduction in greenhouse gas emissions (i.e. not per unit of output).


5. MEMBER STATES' PERFORMANCE IN TERMS OF THE CONTRIBUTION OF ENERGY PRODUCTS TO TRADE
39
The EU Member States’ strong external dependence for their energy needs calls for an analysis of the trade dimension of energy. The objective of this section is to identify the Member States which in terms of energy trade deficits and current account imbalances appear to be the most vulnerable to energy price shocks(54). Generally, an increase in energy prices would induce a transfer of income from energy-importing to energy-exporting countries through a shift in terms of trade, having as immediate effect the deterioration in the current account of the net importing countries, which together with the price shock can exacerbate its macroeconomic imbalances.
The analysis of the contribution of energy products to trade has been organised around one key indicator and three indicators which result from a decomposition of the key indicator (see Box I.5.1).
The (net) energy trade balance expressed as a percentage of GDP. This main indicator is presented in Table I.5.1 for the total of energy products, as well as for oil and gas. All other things being equal, the more negative this balance, the higher the likelihood that the current account is vulnerable to energy price shocks, and hence the bigger the contribution of trade in energy products to an external imbalance. The indicator is expressed as a percentage of GDP in order to make it readily comparable with the current account as a percentage of GDP.
(54) The indicator-based comparison over countries includes
only the "direct trade effect" of an energy price increase on an energy-importing country (i.e. the terms of trade effect mentioned in the text). This method cannot consider any "indirect trade effect," such as for instance the positive effects on the current account of energy-exporting countries that boost demand for the products of the energy-importing countries. See for this the ECB's Structural Issues Report "Energy markets and the Euro area macro economy" (June 2010; Box 10) where it is mentioned that in most cases the "indirect trade effect" only partly compensates for the current account deterioration from the "direct trade effect" and that this compensatory effect is larger for countries with a larger export activity to energy-exporting countries or with a comparative advantage in capital goods. As indicated by the QUEST model exercise reported in ECFIN (2011a), if the price shock is caused by high energy demand from the emerging economies rather than by a supply distortion, further compensation to the "direct trade effect" may take place.
Section 5.1 presents a comparison of the energy trade balance and current account based on the averages of the indicators over the period 2007-2011. This period is one year later than for the other two dimensions (namely 2006-2010), because of the availability of more recent data for this dimensions and their relevance, both as compared to the average over a longer period and in their own right. For this reason, the comparison on the basis of the last available year 2011 is also discussed there.
Relative energy trade balance, i.e. in terms of the size of total cross-border energy trade (i.e. the sum of energy exports and imports). All other things being equal, the more energy imports outstrip energy exports relative to total trade in energy, the larger the energy trade deficit becomes and hence the more vulnerable the country is to energy shocks related to trade. Note that this indicator is tied to the energy trade balance as regards the transmission of energy prices and supply shocks. The energy trade balance in GDP terms expresses the importance of the energy trade deficit for the macroeconomy, whereas the relative energy trade balance captures the importance of the deficit relative to the total volume of energy trade.
Share of energy trade in total trade: all other things being equal, the larger the share of energy in a country's international trade, the larger the impact of the relative energy trade balance on the net energy trade balance.
Macro trade openness: the relative size of a country's international trade vis-à-vis the size of its economy. Note that this indicator is not energy-related. It expresses the notion that a higher macro trade openness amplifies the effects of the previous two factors.
The focus on the net energy trade balance in GDP terms is justified because this main indicator neatly encapsulates other major energy trade indicators, since it is the product of two other key energy trade indicators - the relative energy trade balance and the share of energy trade in total trade - and a macro trade openness indicator (see Box I.5.1).

European Commission Member States’ Energy Dependence
40
Box I.5.1: Decomposition of the net energy trade balance
The net energy trade balance in GDP terms can be seen as pivotal for the trade dimension of energy dependency because it is the product of the following three factors, two of which are key indicators of energy trade of their own. Consequently, they should not graph next to the energy trade balance in the analysis, but as contributing factors. A decomposition of the energy trade balance allows us to distinguish the following factors.1
(XE-ME) / GDP = (XE-ME)/(XE+ME) * (XE+ME)/(XT+MT) * (XT+MT)/GDP
Net energy Relative energy share of energy trade macro trade openness
trade balance trade balance in total trade
The decomposition can be easily adapted to a study of the trade balance of a specific energy product category. The simplest way to do so is to express the relative energy trade balance for this energy product category in terms of overall energy trade and to keep the other factors as described above. Alternatively, the relative energy trade balance is expressed in terms of the trade in this specific energy product category; the second factor then becomes the product of two shares: the share of the trade in this energy product category in total energy trade and, as before, the share of trade in all energy products in total trade. In this note, the decomposition of the trade balance of specific energy product categories will not be further discussed
1 Due to data availability problems for smaller energy products categories, the product of the three factors does not
match the net energy trade balance in GDP terms for a small number of countries.

Part I
41
This decomposition is used in section 5.2 to study some of the various forces underlying the main indicator and to compare them across EU countries. It is based on values for the year 2011 rather than the averages over 2007-2011, as taking the decomposition relationship does not hold for averages.
However, as will be further worked out in section 5.1, one cannot compare the Member States' performance solely on the basis of their ranking on the size of the net energy trade balance. One needs to consider the energy trade balance against the background of the country's current account and also take into account how much the energy trade
Table I.5.1:
Current account
Petro- leum products
Gas Total balance (% of GDP)
Relative energy trade
balance (%)
Share of energy in total trade
(%)
Macro trade openness
(% of GDP)
2007-2011 2007-2011 2007-2011 2007-2011 2011 2011 2011AT -2.2 -0.6 -3.1 3.2 -57.3 7.5 88.2BE -2.7 -1.2 -4.2 -0.2 -19.3 13.7 182.2BG -4.5 -2.2 -6.8 -11.5 -32.0 18.7 113.2CY -6.2 -0.2 -6.4 -11.7 -72.7 24.4 42.2CZ -2.8 -1.5 -3.6 -3.1 -42.2 6.7 145.5DE -2.0 -0.9 -3.0 6.3 -66.1 7.4 75.5DK 1.0 0.4 1.2 3.9 11.2 9.6 63.4EE -2.4 -1.2 -2.6 -3.0 -4.7 17.2 154.6ES -2.2 -0.8 -3.2 -6.5 -54.4 14.6 46.0FI -1.9 -0.6 -3.1 1.9 -39.6 16.1 61.9FR -1.9 -0.6 -2.6 -1.6 -60.1 10.9 47.1EL -3.1 -0.4 -3.6 -12.1 -27.2 28.4 30.9HU -2.5 -2.5 -5.4 -2.4 -51.3 7.7 153.5IE -2.1 -0.7 -2.9 -2.7 -69.1 5.8 88.8IT -1.7 -0.8 -2.8 -2.8 -60.9 12.7 49.1LT -3.2 -2.4 -5.8 -4.6 -18.8 29.6 139.4LU -3.8 0.0 -3.7 7.3 -89.7 5.1 84.7LV -3.2 -1.8 -5.0 -5.0 -42.8 12.0 104.4MT -1.0 -0.2 -1.2 -5.8 -9.0 28.3 118.0NL -2.3 -0.1 -2.5 6.3 -14.4 17.5 150.3PL -2.9 -0.3 -2.8 -5.1 -48.4 9.0 76.7PT -2.8 -0.7 -3.8 -10.0 -53.9 13.4 58.6RO -1.6 -0.6 -2.4 -7.6 -42.7 8.7 73.2SE -1.3 -0.2 -1.7 7.8 -25.6 11.0 67.3SI -4.3 -1.0 -5.3 -3.0 -47.0 9.7 139.5SK -2.0 -2.5 -5.6 -3.5 -38.2 10.4 162.9UK -0.2 -0.2 -0.6 -2.1 -15.9 13.3 48.4EA -2.1 -0.8 -3.0 -1.0
EU27 -1.8 -0.7 -2.6 -1.0 -39.6 8.8 93.4
DECOMPOSITION (related to total energy trade)
Energy dependence indicators related to the trade dimension*Trade balance of energy products (% of
GDP)
* Please note that colours only indicate top and bottom values and have no qualitative assessment attached. For sources and indicators, see Annex 1.

European Commission Member States’ Energy Dependence
42
balance has changed in recent years. The current account matters as this is the main channel through which the energy trade balance affects any external imbalance of an economy.
5.1. NET ENERGY TRADE BALANCE(55)
With the exception of DK, all EU countries have a deficit on their energy trade balance, even those with substantial energy exports, such as the UK, FR and NL. For the EU as a whole, the deficit amounts to 2.4% of GDP over the period 2007-2011(56). The size of the deficit has not varied much over the period; for the last year 2010, it amounted to 2.6% of GDP. It has, however, been consistently higher than earlier in the decade.
As can be seen in Table I.5.1, the EU-12 countries tend to have a larger energy trade deficit than the EU-15 countries: 7 EU-12 countries have an average deficit larger than or equal to 5% of GDP (BG, CY, LT, SK, HU, SI and LV), whereas none of the EU-15 countries exceeds this threshold. However, for a few countries the deficit varies considerably over the period, either due to changes in energy prices or other transient causes (as in the cases of CY, EL and BG) and for structural reasons (such as the shutdown of a nuclear power plant which caused a severe deterioration of the energy trade deficit for LT after 2009 and, even more dramatically, a shift from a modest surplus to a big deficit in 2007 for BG).
The national energy trade deficits differ in urgency across the Member States due to a large spread in the size and sign of the corresponding current account balances: 20 Member States have an overall deficit on their current account, four Member States (SE, LU, DE, and NL) have an average surplus larger than 6% of GDP, while four Member States (EL, CY, BG, and PT) have an average deficit larger than 10% of GDP. The state of the current account matters since it is the key indicator for an external (macroeconomic) imbalance.
(55) Due to data confidentiality some of the statistics might be
not complete for some Member States. This calls for caution when interpreting the results.
(56) 20 Member States have a larger average energy trade deficit, because the EU average masks the intra-EU trade in energy products.
- 15
- 10
- 5
0
5
10
SE LU DE NL DK AT FI BE EU FR UKHU IE IT SI EE CZ SK LT LV PL MT ESRO PT BGCY EL
% of GDP
Graph I.5.1:Energy trade and current account balances in the EU, 2007-2011 average
Energy trade balance CA balance
Source: Eurostat
Unfortunately, the variation in sign and size of the current accounts makes it impossible to combine it with the energy trade balance into a single quantitative indicator.
Moreover, over the period under consideration, all Member States display a much bigger variation in their current account than in their energy trade balance(57). LV and BG, and to a lesser extent EE and LT constitute the most spectacular examples, since these countries managed to turn their huge current account deficits in 2007 into small deficits (LT and LV) or a surplus (EE and BG) in 2011. This difference in variability suggests that energy trade is just one of the drivers of changes in the current account balance.
The varying direct relevance of the size of the (average) energy trade deficit for the (average) current account balance can be illustrated with the EU-12 countries mentioned above. When looking at the average deficits over the period, it is worth noting that all the EU-12 countries with a large energy trade deficit, as identified above, also have an above average current account deficit (with the exception of HU), but however with a much larger spread in size. It should also be noted that the reverse does not apply: in general, a relatively low (average) energy trade deficit does not tend to correspond to an on average modest current account deficit: this holds true for EE and CZ but not MT, RO and PL.
(57) Variability is here measured as the standard deviation over
the sample of annual values.

Part I
43
The EU-15 countries tend to have a much lower energy trade deficit than the EU-12 countries. As regards the average deficit size, the first EU-15 country (BE) has only the 8th rank overall (with a value just over 4% of GDP). In contrast with the EU-12 countries, there appears to be no clear correspondence with the current account balance, judging from the four EU-15 countries with the highest energy trade deficit (of about the same size in GDP terms). On average, BE has a current account balance and LU a big surplus, whereas EL and PT have a stubbornly high deficit (of over 10% of GDP on average).
As shown above, the inspection of the average values of the energy trade and current account balances over the period 2007-2011 reveals a few interesting structural trends, but at the same time averages risk masking the actual situation, relevant for evaluating macroeconomic imbalances. This is because taking the average over the whole period implies a certain loss of information on the actual changes over the period and in particular on the current state of play and hence the challenges to macroeconomic stabilisation.
This point can be illustrated with the EU-12 countries with a large average energy trade deficit (BG, CY, LT, SK, HU, SI and LV). For most of them their 2011 deficits are not radically different from the average value, except for LT which has experienced a remarkable deterioration (related to the close-down of two nuclear power plants in 2004 and 2009, respectively). However, apart from CY, these countries have had in the years 2010 and 2011 either a modest current account surplus or deficit, with a notable improvement for SK and BG and a deterioration for LV and LT. By and large, this means that they have succeeded in securing a trade surplus for other product categories which in a sense compensates for (a substantial part of) the energy trade deficit. On the other hand, CY's huge energy trade deficit appears stubborn in both absolute and relative size; it amounts to almost three quarters of the current account deficit. This share is so substantial that it would arguably constitute a macroeconomic imbalance on its own(58).
(58) This picture for CY seems prone to a substantial change in
the medium to long term in view of the prospects of exploiting a large domestic offshore gas field.
Of course, all these countries still face the risk of (future) current account problems if their non-energy export performance worsens. In particular, upward pressures on energy prices can trigger competitiveness erosion depending on the energy intensity and energy efficiency performance of the non-energy tradable sectors(59). For instance, BG and SK appear to run that risk as they are among the most energy-intensive economies in the EU, and, together with LV, among the countries with the most energy-intensive industrial sector. However, other factors play an important role, since the current accounts of BG and SK significantly improved in 2011 as compared to the preceding year, whereas it substantially deteriorated for LV. IT and BE appear to provide examples of such potential competitiveness problems in the EU-15. Both countries have relatively high energy prices; IT's energy trade and current account deficits have been of a similar size in recent years(60); whereas BE has experienced a persistently large energy trade deficit and a loss of export market shares for goods exports(61).
It is worth recalling that not only countries with a substantial energy trade deficit face challenges to macroeconomic stabilisation. All countries must take account of the inflationary pressures originating from energy price shocks (see ECFIN, 2011a). Countries with substantial energy exports should beware of the potential deterioration of their non-energy tradeable sector, stemming from the domestic spending of energy revenues ("Dutch disease" effects). Note that the latter problem is
(59) Other factors include the relative size and the composition
of the manufacturing industry (with the latter captured by the share of the "energy-intensive industries,"
(60) However, the energy intensity indicators of the scoreboard point to the need for a more in-depth look into the case of Italy: the share of "energy-intensive industries" in the Italian economy is close to the EU average, while the energy intensity of its industry as a whole is one of the lowest in the EU. Consequently, it is not clear to which extent Italy has already adapted its production structure to better cope with its energy dependency and which industries would still be vulnerable to further price competitiveness erosion.
(61) The macroeconomic effects of this loss in competitiveness in Belgium's manufacturing industry appear for now to have been kept in check thanks to the good performance of Belgium's services exports. Note also the substantial energy trade deficit is remarkable in view of Belgium reliance on domestic nuclear power (on average over 20% in recent years). Hence the recent problems in the nuclear power sector could worsen both the energy trade deficit and electricity price problems.

European Commission Member States’ Energy Dependence
44
more related to the size of energy exports rather than the energy trade balance.
The energy-trade related imbalance cannot be fully captured by the "share" of the energy trade deficit in the current account deficit. While EL and PT have had relatively low values for such a share (namely around 30 to 40%), their sizeable energy trade deficits remain a matter of concern simply because their current account deficits have been unsustainably high. Interestingly, the picture for these two countries seems to diverge in 2011: EL's current account deficit has failed to go down, while the contribution of the energy trade deficit displays a remarkably steep fall; in contrast, PT's current account deficit has fallen sharply, with the energy trade accounting for almost two thirds of it. In comparison to EL and PT, FR's share has been well over 100% in recent years, but this appears much less of a concern, since both the energy trade and current account deficits are much smaller in GDP terms and also relatively stable (although both have lately increased). Finally, the case of DE illustrates that energy is just one of the many factors affecting competitiveness: while its energy trade deficit has been over the period somewhat higher than that of FR in GDP terms, it has always had a large current account surplus.
The major driver of the overall energy trade balance is oil. For only 4 Member States(62), the oil trade balance has constituted on average less than 60% of the overall energy trade balance. However, the relation with the score on oil import dependency is not straightforward: it is true that countries which have the highest oil trade deficit score high on oil import dependency as well but the reverse is not true. For example, MT, SE, FR and FI almost entirely depend on imports for their oil consumption but have a relatively modest oil trade deficit. DK, UK and RO have low scores for both oil import dependency and oil trade deficit because of their domestic oil production, part of which is exported.
The gas trade balance plays a lesser role in the overall energy trade balance, as in GDP terms it is on average smaller than the oil trade balance for almost all countries (except for SK and UK).
(62) Namely, the UK, SK, LT and HU; in 2010 it also concerns
IT.
The countries with the highest gas trade deficits tend to be fully or nearly fully gas import dependent (with the exception of HU). Nevertheless, as for oil, the relation is not always straightforward. For instance PL and SE have a similar gas trade deficit (among the lowest in the EU). However, PL has a modest import dependency, whereas SE is relying almost fully on imports. Another example is that of DK and NL, both substantial gas exporters. While DK achieves a sizeable gas trade surplus, in the NL the gas trade balance has on average been close to zero in recent years. Some explanatory factors are the national energy mix (hence the share of gas in total energy consumption), the proportion of domestic gas used locally versus that exported and price differences between gas imports and gas exports.
Finally, for the majority of countries, gas and oil account for most of the overall energy trade balance. The exceptions include PL, CZ, and to a lesser extent LV and EE, which export coal, and BG and SK, and to a lesser extent FI and RO, which have substantial coal imports.
5.2. FACTORS UNDERLYING THE NET ENERGY TRADE BALANCE
This section aims to look at the interaction between some of the underlying drivers in more detail based on the indicator values for 2011. The "share of energy trade in total trade" and "macro trade openness" should be interpreted as "correction factors", that is they translate the relative energy trade balance into the net energy trade balance in GDP terms.
The right-hand side of Table I.5.1 shows that countries tend to rank rather differently for the decomposition indicators and the net energy trade balance. One can see this by looking at the countries which are marked as having a top score or a bottom score in Table I.5.1 (green and orange, respectively) (63). CY is the only country which is in the bottom group for both relative and net energy trade balance. In the case of CY, the low macro trade openness does not have a sufficiently (63) The differences in ranking between the average value of
the energy trade deficit and those for 2011 are limited: the bottom 5 countries are the same but one (HU and SI switching 5th and 6th rank); the respective groups of the top 5 countries have 3 countries in common.

Part I
45
mitigating effect on the relative trade balance performance, also because it is counteracted upon by the very large share of energy in total trade. The other worst performing countries in terms of the relative trade balance (LU, IE, DE and IT) are outside of the group of worst performers for the net energy trade balance. This can be explained by their low scores for the share of energy in total trade (except IT) and also because of their values for macro trade openness which are smaller than 100%. For LU, IE and DE, this seems to reflect their broad export success (hence a lower share of energy in overall trade). The outcome for DE is remarkable since its macro openness is much larger than for the other four big EU countries (UK, FR, ES, IT). In fact, IT's far below EU average openness to trade seems to explain much of why it is not among the worst performers on the energy trade deficit.
Other countries with some of the worst net energy trade balances (for 2011 LT, BG, SK, SI, HU and LV) do not stand out in the ranking of the relative energy trade deficit. For LT and BG, the relatively high energy trade shares seem to matter much; for SK, HU, SI and LT the relatively high macro trade openness matters. For LV, the three constituting elements appear to explain jointly the relatively poor performance of the energy trade balance.
DK can be seen as an outlier as it is the only country with an energy trade surplus. One can interpret this as DK ranking best on the trade dimension of energy dependency (of course in the strict sense of its link with the macroeconomic imbalances of current account deficits and related loss of competitiveness). The UK's and EE's low relative trade energy deficits translate into low energy trade deficit in GDP terms as well. EL ends up among those with the lowest deficits mainly because it has the lowest macro trade openness in the EU.
As final observations, it is worth mentioning the cases of PT and MT. PT's 2011 scores place it in the broad middle category for all the trade indicators, but it still seems vulnerable as energy explains energy trade contributing almost for two thirds of a still unsustainably high current account deficit (as noted also in the previous sub-section). This should serve as a reminder that the energy trade indicators and the related decomposition do not capture all effects.
Despite its island status and complete oil import dependence, MT has one of lowest energy trade deficits, yet the third highest share of energy in total trade. The low deficit sharply contrasts with CY which is similar in the other trade indicators. Transit trade must play a large part since MT does not have domestic energy sources. The importance of transit trade is, however, hard to distil from the trade statistics; arguably a country's vulnerability to fluctuations in this type of trade is subsumed in the more general indicator of import dependency (see section 3).
In conclusion, energy products have in some Member States a very significant influence on trade and the trade balance. Further analysis of the consequences of energy price shocks on current account imbalances in such Member States seems necessary to assess when and how the various vulnerability aspects become a macro imbalance and a major drag on growth and competiveness.
5.3. OVERALL RANKING OF MEMBER STATES AS REGARDS THE EXTERNAL DIMESION OF ENERGY DEPENDENCY
Graph I.5.2 presents the scores for Member States based on their ranking on the size of their energy trade deficit. As explained in the introduction of this chapter and in section 5.1, these scores should be used as a starting point for arriving at an overall ranking as one should also consider the current account and the changes in the energy trade balance over the period.
Considering only the scoring based on the average size of the energy trade deficit over 2007-2011, the most vulnerable Member States are in descending order BG, CY, LT, SK, HU, SI and LV, whereas BE would be the most vulnerable EU 15 country. Graph I.5.2 also shows that the developments in the energy trade matter for evaluating the relative performance of Member States. For instance, the score for BG reflects that its energy trade deficit became smaller, in absolute terms and compared to the other EU countries, whereas the score for LT reflects a serious deterioration of the energy trade deficit, surpassing in size the one for BG. In contrast, the energy trade deficit for CY appears stubborn vis-à-vis those of other countries.

European Commission Member States’ Energy Dependence
46
AT
BE
BG
CY
CZDE
DK
EE
ES FI
FREL
HU
IE IT
LT
LULV
MT
NLPL
PT
ROSE
SI SK
UK
-60
-40
-20
0
20
40 Graph I.5.2:Trade balance for energy products
2007-2011 average 2011 2007
See Annex 2 for the aggregate score. High score indicates good performance. Any score below – 4 is a priori considered to represent underperformance; any score between +4 and -4 is a priori considered to represent a neutral performance; any score above +4 is a priori considered to represent over-performance.
Moreover, the national energy trade deficits differ in urgency since they occur against the backdrop of a strong spread in the size and sign of the corresponding current account balance. This is not expressed in the scores from Graph I.5.2, but vividly displayed in Graph I.5.1 in section 5.1.
Taking account of these additional factors leads to a change in the ranking presented above:
CY can be characterised as the most vulnerable country in this dimension, as it combines the second highest energy trade deficit with the second highest current account deficit; moreover, the current account deficit has been stubborn, in contrast to other countries with a rather stubborn energy trade deficit (such as LV for example).
LT can be considered the second most vulnerable country, because of its strongly deteriorating energy trade deficit. While its energy trade deficit
is now a bit higher than the one for CY, its current account balance has been more or less restored.
BG's energy deficit has been somewhat smaller than those for CY and BG and, like LT, it has more or less restored balance to its current account over the period under review (2007-2011). The same applies for the other EU-12 countries with slightly smaller energy deficits (SK, HU, SI and LV). This suggests that for all the countries mentioned (except CY), other non-energy trade sectors were "paying" for (most of) its significant energy bill. Often, in recent years, this bill seems to be higher than before (in particular for LT). The indicator-based assessment cannot measure, however, to what extent the improved current accounts are still vulnerable to a deterioration due to energy price shocks.
Whilst not among the worst performers in the whole of the EU, BE seems worth mentioning as it stands out among the EU-15 countries.
The analysis of the state of play in 2011 has, however, also pointed to actual problems, arising from current account problems. Next to the example of CY (and perhaps LT), EL and PT could be problematic in this regards. For EL, it remains to be seen whether the very recent sharp reduction in the energy trade deficit will persist, which would be welcome in view of the unsustainably high current account deficit. The problem for PT seems rather to reduce the energy trade deficit, which has sharply increased as a share in the persistently high current account deficit.

Part I
47
Criteria for assessing the external dimension of energy dependency
While the net energy trade balance is the main indicator in the EDI for the external dimension of energy dependency, it is not used in isolation. First, the energy trade balance can be split into the balances of the major energy product categories (oil, natural gas, solid fuels, electricity). Second, the net energy trade balance is related to other major energy trade indicators: it is the product of two other key energy trade indicators − the relative energy trade balance and the share of energy trade in total trade − and an indicator of the macro openness to trade. This decomposition can be used to assess the causes for the differences over countries and time. Third, the energy trade balance needs to be seen against the background of the current account balance, because this is the generally recognised main indicator for external imbalances of an economy. Unfortunately, due to the change in sign of the current account both over countries and over time, it is not possible to combine the energy trade balance and current account into one simple indicator suitable for ranking the EU countries. Finally, because of the link with macroeconomic imbalances, one should not only consider a country's ranking in the net energy trade balance for a specific year or period, but also consider whether an energy trade deficit has been persistent and whether it has recently deteriorated.
It is important to note that some key issues of the external dimension are outside the scope of the EDI because they would require an assessment of the impacts of energy price and supply shocks. It concerns the extent to which the current account, more specifically its non-energy parts, are affected by energy price shocks. Upward pressures on energy prices can trigger competitiveness erosion depending on the energy intensity and energy efficiency performance of a country's non-energy tradable sectors. The EDI informs about the energy intensity and import dependency, but does not combine them into a model relation which can predict changes in macro exports and imports.


6. CONCLUSIONS
49
The EU and its Member States have high but varying levels of energy dependence, which means that they are vulnerable to energy price shocks or energy supply disruptions. These shocks would translate into significant GDP and competitiveness loss, inflationary pressures and a deterioration of the trade balance. This concerns especially the Member States identified as the most vulnerable in the three domains dealt with in our note: security of energy supply, energy and carbon intensity and energy trade balance.
Regarding the security of energy supply, the combination of import dependency, geographical diversification of energy imports (risk of dependence on one country), and diversification of energy sources in the energy mix helps us to assess the extent to which a country is vulnerable. Measured by an aggregated indicator combining factors related to energy security, MT and CY are the most vulnerable countries, followed by LU, IE, EE, LT and EL. More detailed indicators show that MT, LU, CY, IE and IT have the highest share of imported energy products in their energy consumption. BG, EE, FI, IE, LT, LV and SE depend on one country for gas supplies, while CY, MT and to a lesser extent LU, EL and IE depend very much on oil in their energy mix. These indicators should be considered together with the factors which mitigate the risks related to security of energy supply, but which could not be included in our EDI set because they are too difficult to quantify, or no sufficiently robust data exist. These factors include, in particular, the level of integration and development of national energy markets, the capacity and number of interconnections of national energy infrastructure with the other Member States and non-EU countries, such as gas and oil pipelines, energy grid interconnections and ports, as well as the storage capacity for gas and oil reserves.
Regarding the energy and carbon intensity of Member States’ economies, vulnerability can be assessed by a combination of elements including energy and carbon intensities in the whole economy and in its main sectors, as well as the share of energy-intensive sectors in the economy. A ranking of Member States based on an aggregation of these elements indicates that the most vulnerable country is BG, followed by EE, RO, SK, CZ and PL. The indicators put the
emphasis on the significant interactions between both dimensions and on the risks of price increases and competitiveness loss for Member States with higher energy and carbon intensities. Member States with the highest energy intensity per unit of output include BG, EE, RO, CZ and SK. A more detailed assessment of energy intensity performance must differentiate between industry specialisation and efficiency in energy use within sectors. In line with this differentiation, SK, CZ, BG, IE and RO have the highest share of energy-intensive sectors in their economy. The most carbon-intensive economies are found in BG, EE, RO, PL and CZ. Performance in this dimension can be greatly influenced by EU decisions and by how EU legislation is implemented at national level. In addition to energy performance, these EU decisions may also have an impact on carbon leakage.
Regarding the contribution of energy products to trade balance, the analysis provided in this note has shown that energy products can be significant contributors to current account imbalances and that this channel may negatively affect competitiveness. Ranked by the average value of the net energy trade balance in terms of GDP, but "corrected" for any deterioration or persistence of the energy trade deficit and the size and changes in the current account, CY seems to be the biggest concern followed by LT, BG, SK, HU, SI and LV, and then also EL and PT (in view of their corresponding current account problems). For the EU-12 countries just mentioned, and perhaps BE, the large energy trade deficit, although counterbalanced by surpluses in other trade categories, may serve as a channel through which an energy price shock hits the economy. It would now be important to consider this issue in the broader context of the monitoring of macroeconomic imbalances and their impact on EU stability and prosperity.


7. RECOMMENDATIONS
51
This note provides a broad set of both aggregated and plain indicators regarding security of energy supply, energy and carbon intensity and energy trade balance. Therefore our first recommendation for Member States is to use these indicators to consider their performance against the other countries on the whole range of issues covered by this note, and to address as a matter of priority the issues for which Member States have been identified as vulnerable.
There are several policy recommendations which can help Member States substantially improve their performance on energy dependence. Some of these issues are part of the European energy policy agenda with binding EU legislation. Other issues are in the competence of Member States. Based on the note, we recommend Member States to:
1. Reduce energy intensity and improve energy efficiency. Energy savings allow progress in all three dimensions analysed in our note: security of energy supply, energy intensity and energy trade balance. Energy savings can be achieved through improvements made by energy users, in particular in sectors like buildings, transport and industry, but also through improved efficiency in the energy sector. The recently adopted Directive on Energy Efficiency establishes a common framework for promoting energy efficiency in the EU.
2. Diversify the energy mix, in particular, where possible, by replacing imported fossil fuels by domestic energy sources, in particular renewables. This is of particular importance for countries which depend disproportionately on a single fuel, especially oil.
3. Increase the geographical diversification of energy import sources, in particular if there are potential geopolitical risks related to these imports. More diversified energy import sources make Member States less vulnerable to the political decisions and potential problems of their main suppliers. Another way to reduce geopolitical supply risk is to develop the infrastructure necessary for importing fuels, such as pipelines and port terminals.
4. Develop electricity, gas and oil interconnections with neighbouring countries and speed up the creation of the energy internal market. The lack of interconnections increases the risk of energy supply disruption and makes necessary additional costly back-up and balancing generation investments.
5. Reduce carbon intensity, in particular of energy generation, which makes Member State more vulnerable to more stringent climate change mitigation policies and competitiveness loss.
The composite and detailed indicators developed in this note could be used in the context of the European Semester as an analytical tool contributing to the identification of the most vulnerable Member States from the point of view of energy dependence. Obviously, the results cannot be applied in a mechanical way. They need to be qualified with additional information in terms of changes, country-specific circumstances, policy developments and other indicators. The country fiches, produced in complement to this note, analyse in more detail the performance of the most vulnerable countries and their specific circumstances. The note could be also used as a complementary tool in the Macroeconomic Imbalance Procedure.


ANNEX 1 Definition of indicators used in the EDI
53
A1.1. SECURITY OF ENERGY SUPPLY
A1.1.1. Import dependency - Primary sources
Import dependency shows the extent to which a country relies upon imports in order to meet its energy needs. It is calculated using the following formula:
Import dependency jj
jj
BunkGICXM
+
−
X= export
M = Import
j= energy product
GIC = Gross Inland Consumption
Bunk = Consumption of International Bunkers
Unit = %
Source: own calculations from EUROSTAT (energy statistics)
Import dependency has been calculated for the following energy products: natural gas, crude oil, solid fuels (hard coal and derivatives, and lignite and derivatives) plus the total that is all of the above products together.
HHI energy imports
This indicator is a measure of the degree of concentration of import sources, by country, in relation to total imports of an energy product. It has been calculated for each category of energy products mentioned above and for each Member State, using the following formula:
HHI energy imports ∑=
N
ijiIS
1
2,
IS = import share per source country
i = source country
N = total number of source country
j = energy product
Unit of imports: terajoules (gas), 1000 tonnes (solid fuels, petroleum products)
Source: EUROSTAT (COMEXT)

European Commission Member States’ Energy Dependence
54
Gross inland energy consumption by fuel
This indicator measures the share of each energy source in gross inland consumption. Gross Inland energy Consumption corresponds to the sum of final consumption, distribution losses, transformation losses and statistical differences minus exports and consumption of international bunkers.
Gross inland energy consumption by fuel
GICGIC j
j = energy product
GIC: Gross Inland Consumption
Unit: %
Source: EUROSTAT, Energy pocketbook 2010
HHI energy mix
This indicator measures the degree of concentration of the energy mix of Member States. It is calculated as follows:
HHI energy mix ∑=
J
jjs
1
2
s = share of energy product in gross inland consumption
j = energy product
J = total energy products
Unit of gross inland consumption: 1000 tonnes of oil equivalent
Source: EUROSTAT energy statistics)
A1.1.2. Import dependency – Secondary sources To avoid double counting, electricity shall be treated differently given its nature of secondary source produced with primary energy sources. In the context of this note electricity import dependency is therefore calculated as follows:
Electricity import dependency e
ee
FinCXM −
e
ee
FinCXM −
M= imports
X = exports
e = electricity
FinC= final energy consumption
Source: Eurostat (energy statistics)

Part I
55
Electricity mix
This indicator shows the share of each energy source in electricity generation in a country.
Electricity mix
TEGGEGj
TEGGEGj
GEG= gross electricity generation;
j= energy product;
TEG= total electricity generation;
Unit: %
Source: DG ENER, Country Factsheets.
HHI Electricity mix
This Herfindahl Index indicates the degree of diversification of energy sources in electricity generation for any given country. It is calculated in the same way as the HHI for the energy mix, using the share of each energy product in gross electricity generation. The closer the value is to 1 the less the mix is diversified.
A1.2. ENERGY AND CARBON INTENSITY OF THE ECONOMY
Energy intensity of the economy
Energy Intensity gives an indication of the effectiveness with which energy is being used to produce added value. It measures the energy consumption of an economy and its overall energy efficiency. Its formula is:
Energy intensity of the economy GDPGIC
GIC = Gross Inland Consumption
GDP = Gross Domestic Product in constant prices (2005)
Unit = KG of oil equivalent per 1000 euros Source: EUROSTAT

European Commission Member States’ Energy Dependence
56
Energy intensity of industry
This indicator gives an indication of the effectiveness with which energy is being used to produce added value in the industrial sector. It is calculated as follows:
Energy intensity of industry IND
IND
GVAFinC
FinC = Final energy consumption
IND = Industry (manufacturing, mining and quarrying and constructions)
GVA = gross value added
Unit: KG of oil equivalent per 1000 euros
Source: EUROSTAT (energy statistics and SBI).
Energy intensity of transport
This indicator gives an indication of the effectiveness with which energy is being used to produce added value in the transport sector. It is the ratio between the final energy consumption of energy in transport and the gross value added of the transport, storage and communication sector.
Energy Intensity of transport TS
TRAN
GVAFinC
FinC = Final energy consumption
TRAN = transport sector (rail, road, international and domestic air transport and inland navigation/coastal shipping, with the exception of maritime shipping);
TS = Transport and Storage
Unit: KG of oil equivalent per 1000 euros
Source: EUROSTAT (energy statistics, national accounts)
Energy Intensity of households
This indicator gives an indication of the effectiveness with which energy is being used by households. It is the ratio between the final energy consumption and the final consumption expenditures of households.

Part I
57
Energy Intensity of households House
House
FCEFinC
FinC = Final energy consumption
House = households;
FCE= Final consumption expenditures;
Unit: KG of oil equivalent per 1000 euros
Source: EUROSTAT
Carbon intensity of the economy
This indicator measures the average amount of GHG emissions associated with each unit of gross domestic product.
Carbon intensity of the economy GDPCO2
CO2 = GHG emissions of the whole economy
GDP = Gross Domestic Product in constant prices (2005).)
Unit: 1000 tonnes of CO2 equivalent per million euros
Source: EUROSTAT (environment statistics, national accounts) on EEA data.
Carbon intensity of the transport sector
This indicator measures the average amount of GHG emissions associated with each unit of gross value added produced by the transport, storage and communication sector.
Carbon intensity of the transport sector
ts
tran
GVACO2
CO2tran = GHG emissions of the transport sector (road, rail, inland navigation and domestic aviation).
GVA = Gross Value Added
TS = Transport and Storage.
Unit: 1000 tonnes of CO2 equivalent per million euros
Source: EUROSTAT

European Commission Member States’ Energy Dependence
58
(environment statistics) on EEA data
Carbon intensity of energy use
This indicator measures the amount of GHG emissions associated with gross inland consumption of energy. It is calculated as follows:
Carbon intensity of energy use GICCO ENER2
CO2 = GHG emissions
ENER = energy sector
GIC = Gross Inland Consumption
Unit: tons of CO2 / tons of oil equivalent
Source: Energy Pocket Book
Carbon Intensity of households
This indicator measures the average amount of GHG emissions associated with each unit of energy consumed by households.
Carbon intensity of households House
House
FCECO2
CO2 = GHG emissions
House= households;
FCE= Final Consumption expenditures
Unit: 1000 tonnes of CO2 equivalent per million euros
Source: EUROSTAT
Share of energy-intensive sectors in total gross value added
This indicator is a measure of the weight of energy-intensive sectors in total economic activity. Energy-intensive sectors are defined at NACE_R1 level and include: Mining and quarrying; Manufacture of pulp, paper and paper products; publishing and printing; Manufacture of coke, refined petroleum products and nuclear fuel; Manufacture of chemicals, chemical products and man-made fibres; Manufacture of other non-metallic mineral products; Manufacture of basic metals and fabricated metal products; and Electricity, gas and water supply.

Part I
59
Share of energy-intensive sectors in total gross value added GVA
EIIva
EIIva = energy-intensive sectors value added
GVA = total gross value added of the economy
Unit: %
Source: EUROSTAT (structural business indicators)
Weight of energy in HICP basket
The HICP is calculated as a weighted average of price changes for a wide range of product groups, using the respective share of each group in the total expenditure of all households for the goods and services covered by the index. The product group weights are representative of the average household consumption expenditure at national level. Energy includes: electricity, gas, liquid fuels, solid fuels, heat energy and fuels and lubricants for personal transport equipment.
Weight of energy in HICP basket T
E
HICPHICP
HICP = Harmonized Index of Consumer Prices
E = electricity, gas, liquid fuels, solid fuels, heat energy and fuels and lubricants for personal transport equipment
T = all product categories included in HICP
Unit: %
Source: EUROSTAT
A1.3. CONTRIBUTION OF ENERGY PRODUCTS TO TRADE BALANCE
Net trade balance of energy products as % of GDP
This indicator measures the trade balance as a percentage of GDP for the following categories of products: coal, coke and briquettes; petroleum, petroleum products and related materials; gas, natural and manufactured; electric current; and for the total. It is calculated as the ratio between net exports (i.e. exports minus imports) of the energy product category in question or the total, and GDP.
Trade balance of energy products as % of GDP GDP
MX jj −
j = reference energy product
X = export; M = import

European Commission Member States’ Energy Dependence
60
GDP = gross domestic product
Unit: %
Source: EUROSTAT (COMEXT and national account)
Decomposition of the net trade balance of energy products
Relative trade balance for energy products
This indicator is defined as the share of the net exports in energy products (total of specific product group) in total cross-border energy trade.
EE
jj
MXMX
+
−
j = reference energy product (coal, coke and briquettes; petroleum, petroleum products and related materials; gas, natural and manufactured; electric current)
X = export; M = import
E = all energy products
Unit: %
Source: EUROSTAT COMEXT
Share of the energy trade balance in total trade
This indicator is defined as the share of the total trade in energy products (i.e. the sum of exports and imports) in the total trade of a country.
TT
EE
MXMX
++
X = export; M = import
E = all energy products
T = total trade
Unit: %
Source: EUROSTAT COMEXT
Macro trade openness
This indicator expresses the relative size of a country's international trade vis-à-vis the size of its economy. It is defined as the ratio between total trade (i.e. the sum of exports and imports) and GDP. Note that this indicator is not energy-related.

Part I
61
GDPMX TT +
X = export; M = import
T = total trade
GDP: gross domestic product
Unit: %
Source: EUROSTAT (COMEXT and national account)


ANNEX 2 Composite Indicator to assess Member States
63
The indicators of each of the three pillars of the scoreboard – i.e. Security of energy supply, Energy and carbon intensity of the economy, Contribution of energy products to trade balance – are aggregated into a composite indicator, i.e. one aggregate composite indicator for each pillar. This makes cross-country comparison easier and allows ranking of countries along the three pillars.
The aggregation is carried out using the same methodology as the one applied for the iGrowGreen indicator-based assessment framework, which in turn has been developed in close cooperation with Member States through the Lisbon Methodology (LIME) Working Group. This ensures that the methodology is consistent with previous composite indicators developed at EU level and provides a widely accepted aggregation method.
The analysis is based on data for the years 2005 to 2010. The latest available year for each indicator is used except in a few cases where the scarcity of data available for the latest years advocates the use of earlier years.
Following the LIME Assessment Framework (LAF) methodology, a standardised continuous scoring system is applied to assess performance levels. It simply consists in standardising the value of the considered indicator by the mean and the standardised deviation and multiplying it by ten. More formally, it can be expressed as
Score = [(Indicator – EU27 average)/Standard deviation] *10
A score of 0 implies the indicator in question is the same as the EU-27 weighted average, whereas a score of -10 implies the indicator is 1 standard deviation below the EU-27 average. The choice of benchmarks was discussed on several occasions, within the LIME group or between Commission services. As a result, the EU-27 weighted average (based on GDP) is used as the benchmark for all indicators.
The indicators are defined so that a + sign indicates good performance in any given pillar, while a – sign indicates bad performance. The standardised indicators are then aggregated into one composite indicator for each pillar through taking weighted averages. The assessment of performance is made on the basis of the three scores revealing the distance to the EU-27 GDP weighted average. That is, for each of the three areas, we aggregate the scores obtained by Member States for each indicator in relation to the EU average value of this indicator.
To evaluate the scores, standardised thresholds have been identified to determine categories of performance. Any score below – 4 is a priori considered to represent underperformance with respect to the EU average; any score between -4 and +4 is a priori considered to represent a neutral performance; any score above +4 is a priori considered to represent over-performance. These thresholds have been chosen because, assuming a normal distribution of results, one third of outcomes should be found in each of the categories. This arbitrary choice gives a sensible sense of areas where some Member States have to catch-up with the pace of reforms that matters at EU level. It would not be meaningful to prepare country-specific recommendations on the basis of a finer differentiation into more groups of performance given the diversity of national contexts.
Weighting
As regards the weights used in the aggregation, it is considered a priori that the dimensions identified in the different areas are of equal importance, in line with LAF, because alternative assumptions would not be better justified in the absence of a corresponding multi-variate growth decomposition analysis and they would be less transparent. In order to ensure a correct treatment of indicators measuring total and their respective components, only the totals are included in the composite indicator. In addition, following the LAF methodology the equal weighting method is complemented with a redundancy/correlation analysis

European Commission Member States’ Energy Dependence
64
in which the weights of highly correlated indicators are adjusted downwards to correct for the problem of redundancy. Table I shows the weights applied for the different indicators.
Table I: Weights applied in constructing the composite indicators
1. Security of energy supply
Import dependency, Total 1
HHI energy imports (gas, petrol, solid fuels)
Country-specific weights based on the share of the three sub-indicators in gross inland consumption, normalised to sum up to 1 for each country
HHI energy sources 1
2. Energy and carbon intensity of the economy
Energy intensity of the economy 1
Energy intensity of industry 0
Energy intensity of transport 0.5
Energy intensity of households 0
CO2 intensity of the economy 0
CO2 intensity of energy use 1
Share of energy intensive sectors in total GVA 0.5
CO2 intensity of transport sector 0
CO2 intensity of households 0
Weight of energy in HICP basket 0
3. Contribution of energy products to trade balance
Trade balance of energy products as % of GDP, Total 1
Regarding the first pillar – Security of energy supply – the correlation analysis did not find any indicator to be redundant. Due to the absence of an indicator of totals for "HHI on energy imports (gas, petrol, solid fuels)", we applied country-specific weights based on the shares of the three sub-indicators in gross inland consumption, which we then normalised to ensure that they sum up to 1 for each country. The shares of gross inland consumption themselves were not included in the composite indicator as it is not possible to determine good vs. bad performance in this respect.

Part I
65
In the second pillar – Energy and carbon intensity of the economy – several indicators were found to be redundant. "Energy intensity of the economy" and "Energy intensity of the industry" are highly correlated, only the former is kept in the composite indicator. "Energy intensity of transport" shows a moderate correlation with energy intensity indicators, therefore its weight is reduced. "Energy intensity of households" and "CO2 intensity of the economy" are both highly correlated with "Energy intensity of the economy", therefore they are excluded. "Share of energy intensive sectors in total GVA" is also moderately correlated with energy intensities, and therefore its weight is reduced. "CO2 intensity of transport sector" is highly correlated with "Energy intensity of transport", therefore it is excluded from the analysis. "CO2 intensity of households" is highly correlated with "Energy intensity of the economy", therefore it is excluded. The "Weight of energy in HICP basket" in turn is highly correlated with "Energy intensity of the economy", therefore it is excluded from the analysis.
Finally, in the third pillar – Contribution of energy products to trade balance – only the indicator on "Trade balance of energy products as % of GDP, Total" is included as the inclusion of the variables of the decomposition would not be appropriate. Therefore, the final score in this pillar is not a true composite indicator, it is a normalised indicator measuring performance in the field of energy trade balance with respect to the EU average.
Value-added and caveats of the composite indicator approach
Composite indicators represent a widely used tool to assist policy discussions because they can express a wide range of information in a concise and easily understandable manner. This is useful for comparing country performance in a given policy area and the indicators can also be used to provide rankings of countries. However, a word of caution is necessary as there are several caveats that need to be taken into account. These indicators do not provide more information than the components that are used in constructing the composites, but rather they show an aggregated viewpoint. As such, the choice of the components is a crucial issue. In our case the indicators have been chosen to capture the most important factors of the three pillars as much as possible while taking into account data limitations. A further caveat concerns the second pillar, where data limitations does not allow us to compare all indicators of the same year. This however should not pose a great problem as the indicators concerned usually show a slow speed of evolution through time. Furthermore, a caveat that applies to all composite indicators is that the choice of weighting may influence the final results to some extent. The weighting methodology we applied is transparent and follows the LIME Assessment Framework which provides a sound basis for our analysis.


ANNEX 3 Energy dependence indicators for 2006 and 2010
67
Energy dependence indicators for 2006
−
Gas (%)
Oil (%)
Solid fuels (%)
Total Primary
(%)
Gas Oil Solid fuels
Gas (%)
Oil (%)
Solid fuels (%)
Gas (%)
Oil (%)
Nuc- lear (%)
Rene- w ables
(%)
Solid fuels (%)
HHI energy sources
2006 2006 2006 2006 2006 2006 2006 2006 2006 2006 2006 2006 2006 2006 2006 2006AT 87 95 93 72 0.34 0.13 0.41 88 53 6 22 41 0 22 12 0.28BE 100 101 96 80 0.26 0.18 0.20 30 54 90 26 41 21 2 8 0.28BG 90 99 35 46 1.00 0.54 0.30 100 86 99 14 25 24 6 34 0.26CY 104 117 102 0.16 0.97 62 100 0 96 0 2 1 0.93CZ 104 97 -16 28 0.62 0.30 0.88 74 74 3 16 22 15 4 45 0.30DE 84 95 35 61 0.32 0.13 0.15 46 54 75 23 36 12 6 24 0.25DK -103 -86 94 -36 0.23 0.22 15 90 21 40 0 14 26 0.29EE 100 75 0 28 1.00 0.31 1.00 100 64 100 15 21 0 10 56 0.39ES 101 101 74 81 0.20 0.07 0.20 94 81 98 22 49 11 6 13 0.31FI 100 98 61 54 1.00 0.39 0.30 100 67 87 10 30 15 23 19 0.21FR 100 98 105 51 0.17 0.06 0.13 53 68 85 15 34 43 6 5 0.32EL 99 101 3 72 0.69 0.18 0.41 100 95 80 9 58 0 6 27 0.42HU 82 79 41 63 0.66 0.67 0.26 90 84 48 42 27 13 4 11 0.28IE 90 101 70 90 1.00 0.49 0.27 0 6 96 26 54 0 3 16 0.39IT 91 93 100 87 0.24 0.12 0.19 79 93 99 37 45 0 7 9 0.35LT 101 97 95 62 1.00 0.87 0.80 100 98 98 28 32 26 11 3 0.26LU 100 101 100 98 0.58 0.38 100 0 100 26 63 0 2 2 0.47LV 109 102 120 66 1.00 0.28 0.99 100 49 100 30 32 0 31 2 0.29MT 100 100 0 100 0 0 0 1.00NL -62 96 102 37 0.37 0.08 0.17 20 62 96 43 40 1 3 10 0.36PL 71 99 -22 20 0.53 0.61 0.48 92 85 69 13 24 0 5 58 0.42PT 101 98 106 83 0.50 0.06 0.41 100 79 97 14 54 0 16 13 0.36RO 33 44 29 29 0.89 0.30 0.20 100 94 79 35 27 4 12 23 0.27SE 100 99 87 38 1.00 0.23 0.21 0 35 80 2 28 34 29 5 0.28SI 100 98 20 52 0.39 0.24 0.68 84 21 88 12 36 20 10 21 0.24SK 97 95 81 64 1.00 0.66 0.30 100 85 32 28 20 25 4 24 0.24UK 12 9 76 21 0.45 0.21 0.28 15 30 96 35 36 8 2 18 0.29EA 23 40 16 7 14 0.26
EU27 61 83 41 54 0.19 0.09 0.13 62 65 85 24 37 14 7 18 0.25
Energy dependence indicators related to the security of energy supply dimensionImport dependency HHI energy imports Non-EEA share of
importsGross inland energy consumption, by fuel - %

European Commission Member States’ Energy Dependence
68
Import dependency
Electricity (%) Gas (%)
Oil (%)
Nuclear (%)
Rene-w ables
(%)
Solid fuels (%)
HHI electricity generation
2006 2006 2006 2006 2006 2006 2006AT 11 19 3 0 67 11 50BE 12 30 2 54 5 8 39BG -29 5 1 43 10 42 37CY 0 0 100 0 0 0 100CZ -22 5 0 31 5 59 45DE -3 13 1 26 12 46 31DK -21 21 4 0 20 54 38EE -12 8 0 0 1 90 82ES -1 31 8 20 19 22 23FI 13 16 1 28 27 28 26FR -15 4 1 78 12 4 63EL 8 17 16 0 14 53 36HU 22 37 1 38 4 20 32IE 7 50 10 0 10 29 36IT 15 52 15 0 18 14 35LT -5 20 3 69 7 0 52LU 54 0 0 0 24 0LV 41 43 0 0 57 0 51MT 0 0 100 0 0 0 100NL 20 60 2 4 8 24 43PL -10 4 2 0 3 91 83PT 11 25 11 0 33 31 28RO -10 19 3 9 29 40 29SE 5 1 1 47 50 1 46SI 0 2 0 37 24 36 32SK -10 7 2 57 16 17 39UK 2 36 2 19 6 37 31EA 1
EU27 0 21 4 30 15 29 24
Share electricity generation by fuelElectricity mix in the EU

Part I
69
2006 2006 2006 2006 2006 2006 2006 2006 2006 2006AT 136 167 602 48 0.4 2.0 10.8 1.6 0.13 8BE 187 236 422 57 0.4 1.9 11.0 1.1 0.19 10BG 833 780 1229 125 2.7 2.4 14.8 3.3 0.32 15CY 185 208 960 32 0.8 2.8 5.8 2.1 0.16 11CZ 414 302 611 122 1.3 2.6 14.7 1.8 0.20 14DE 151 115 518 50 0.4 2.4 10.7 1.3 0.16 11DK 99 81 345 44 0.3 2.8 7.4 0.9 0.09 11EE 441 293 633 128 1.5 2.8 9.8 1.9 0.23 13ES 153 171 702 29 0.5 2.3 9.5 1.8 0.14 9FI 233 334 416 64 0.5 1.7 12.8 1.2 0.09 7FR 155 153 485 45 0.3 1.4 7.0 1.3 0.13 9EL 155 199 454 40 0.6 3.3 6.8 1.2 0.13 8HU 298 166 735 129 0.8 2.1 11.0 2.0 0.29 13IE 90 75 40 0.4 2.9 12.8 0.19 9IT 127 140 463 34 0.4 2.5 9.6 1.3 0.12 7LT 382 205 587 106 1.0 1.5 8.6 1.8 0.24 13LU 149 292 1038 49 0.4 2.4 5.8 2.6 0.17 12LV 322 393 696 153 0.8 1.8 6.3 2.0 0.15 12MT 183 25 0.6 3.0 6.7 0.11 6NL 151 154 457 41 0.4 2.1 11.8 1.1 0.15 10PL 377 291 811 120 1.6 3.3 5.9 2.3 0.27 16PT 164 237 781 33 0.5 2.3 8.8 2.1 0.11 9RO 474 459 502 128 1.8 2.7 10.4 1.4 0.24 18SE 162 199 422 49 0.2 1.0 11.5 1.0 0.08 13SI 241 230 764 73 0.7 2.2 14.0 2.3 0.28 13SK 454 347 867 100 1.2 1.8 17.5 2.2 0.15 19UK 122 117 475 37 0.3 2.4 1.1 0.13 7EA 150 151 9.6 9
EU27 160 156 523 0.4 2.2 9.8 1.3 10
Weight of energy in
HICP basket
(%)
Energy intensity of
the economy
(kgoe/1000 EUR)
Energy intensity of
industry (kgoe/1000
EUR)
Energy intensity of transport
(kgoe/1000 EUR)
Energy dependence indicators related to the energy and carbon intensity dimensionEnergy
intensity of households (kgoe/1000
EUR)
CO2 intensity of
the economy (ton CO2 eq./1000
EUR)
CO2 intensity of energy use (ton CO2 eq./1000
EUR)
Share of energy
intensive sectors in total GVA
(%)
CO2 intensity of transport sector (ton
CO2 eq./1000
EUR)
CO2 intensity of households
(ton CO2 eq./1000
EUR)

European Commission Member States’ Energy Dependence
70
Current account
Petro- leum
products
Gas Total balance (% of GDP)
Relative energy trade
balance (%)
Share of energy in total trade
(%)
Macro trade
openness (% of GDP)
2007 2007 2007 2007 2007 2007 2007AT -2.1 -0.4 -2.9 3.5 -55.3 6.0 87.0BE -2.4 -1.1 -3.7 1.6 -22.1 9.2 183.1BG -5.0 -2.2 -7.5 -25.2 -36.9 17.8 115.0CY -5.5 -0.2 -5.7 -11.7 -72.8 16.9 45.9CZ -2.9 -1.2 -3.3 -4.3 -48.0 5.2 133.1DE -1.6 -0.8 -2.4 7.4 -56.7 6.0 71.4DK 1.5 0.5 1.9 1.4 36.9 7.8 64.5EE -3.1 -1.1 -3.5 -15.9 -22.1 13.2 121.2ES -2.2 -0.7 -3.1 -10.0 -61.3 11.2 44.5FI -1.7 -0.4 -2.6 4.3 -39.6 9.4 69.7FR -1.8 -0.5 -2.3 -1.0 -55.9 8.9 46.0EL -3.1 -0.3 -3.5 -14.6 -65.0 16.1 33.4HU -2.1 -2.3 -4.6 -7.3 -54.6 6.1 140.1IE -1.8 -0.5 -2.4 -5.3 -77.2 4.0 78.9IT -1.6 0.0 -1.9 -2.4 -50.8 7.9 47.5LT -2.6 -1.7 -4.2 -14.4 -26.5 15.1 105.5LU -3.9 0.0 -3.7 10.1 -88.6 4.2 99.2LV -3.4 -1.1 -4.6 -22.4 -69.0 8.2 82.0MT -1.4 -0.1 -1.5 -6.3 -12.7 11.0 109.9NL -2.0 -0.1 -2.1 6.7 -12.7 12.6 133.1PL -2.8 -0.3 -2.6 -6.2 -51.0 7.1 71.8PT -2.8 -0.6 -3.7 -10.1 -64.7 10.0 58.0RO -1.5 -0.8 -2.6 -13.4 -42.4 9.5 64.8SE -1.4 -0.2 -1.7 9.2 -29.9 8.1 69.5SI -3.6 -0.9 -4.7 -4.8 -65.7 5.6 130.1SK -2.0 -2.1 -5.0 -5.3 -40.7 7.7 158.6UK -0.2 -0.1 -0.4 -2.5 -11.5 9.8 38.2EA -1.9 -0.5 -2.6
EU27 -1.6 -0.4 -2.1 -1.0 -38.9 6.5 88.9
Energy dependence indicators related to the trade dimensionTrade balance of energy
products (% of GDP)DECOMPOSITION (related to total
energy trade)

Part I
71
Energy dependence indicators for 2010
Gas (%)
Oil (%)
Solid fuels (%)
Total Primary
(%)
Gas Oil Solid fuels
Gas (%)
Oil (%)
Solid fuels (%)
Gas (%)
Oil (%)
Nuc- lear (%)
Rene- w ables
(%)
Solid fuels (%)
HHI energy sources
2010 2010 2010 2010 2010 2010 2010 2010 2010 2010 2010 2010 2010 2010 2010 2010AT 74 89 88 62 0.47 0.13 0.34 85 50 14 24 38 0 26 10 0.28BE 99 98 98 77 0.25 0.17 0.24 26 58 88 28 42 20 4 5 0.29BG 95 101 25 40 1.00 0.58 0.57 100 84 97 13 23 22 8 39 0.27CY 104 66 101 0.05 0.90 48 100 0 95 0 4 1 0.91CZ 85 96 -16 26 0.78 0.29 0.52 88 75 18 18 21 16 6 41 0.28DE 82 96 41 60 0.30 0.13 0.13 42 57 82 22 34 11 10 23 0.24DK -68 -52 69 -18 0.12 0.22 27 83 23 36 0 20 20 0.26EE 100 56 -1 13 1.00 0.26 1.00 100 32 100 9 17 0 14 64 0.47ES 99 100 86 77 0.20 0.06 0.17 90 82 99 24 47 12 12 6 0.31FI 100 87 58 48 1.00 0.67 0.38 100 87 92 10 28 16 25 19 0.21FR 93 98 101 49 0.17 0.08 0.14 53 75 83 16 31 41 8 4 0.30EL 100 99 5 69 0.40 0.16 0.41 100 89 87 11 52 0 7 27 0.37HU 79 84 42 58 0.50 0.70 0.30 94 86 57 38 26 16 8 11 0.25IE 93 98 50 86 1.00 0.50 0.58 0 8 79 31 50 0 4 14 0.37IT 91 93 101 84 0.20 0.11 0.18 85 96 92 39 40 0 10 8 0.33LT 100 99 88 82 1.00 0.91 0.87 100 98 99 36 38 0 16 3 0.30LU 100 99 100 97 0.34 0.56 0.45 35 0 100 26 62 0 3 1 0.45LV 62 94 103 42 1.00 0.17 0.65 100 50 97 32 28 0 35 2 0.31MT 101 101 0 100 0 0 0 1.00NL -62 93 121 31 0.35 0.08 0.25 16 58 94 45 40 1 3 9 0.38PL 69 97 -5 32 0.81 0.64 0.40 90 83 82 13 26 0 7 54 0.38PT 100 98 98 75 0.42 0.07 0.34 100 80 92 18 51 0 22 7 0.35RO 17 51 18 22 0.96 0.27 0.31 98 84 53 30 26 8 16 20 0.23SE 100 94 102 37 1.00 0.25 0.20 0 39 83 3 28 29 34 5 0.28SI 99 101 19 49 0.35 0.21 0.57 80 8 83 12 35 20 15 20 0.24SK 100 89 76 63 1.00 0.66 0.27 100 82 37 28 21 21 8 22 0.22UK 38 15 52 28 0.33 0.23 0.24 33 34 96 40 35 8 3 14 0.31EA 25 37 15 10 12 0.25
EU27 62 84 39 53 0.16 0.09 0.13 60 66 84 25 35 13 10 16 0.24
Energy dependence indicators related to the security of energy supply dimensionImport dependency HHI energy imports Non-EEA share of
importsGross inland energy consumption, by fuel - %

European Commission Member States’ Energy Dependence
72
Import dependencyElectricity (%) Gas
(%)Oil (%)
Nuclear (%)
Rene-w ables
(%)
Solid fuels (%)
HHI electricity generation
2010 2010 2010 2010 2010 2010 2010AT 4 23 2 0 68 7 0.52BE 1 35 0 50 8 4 0.38BG -31 4 1 33 14 48 0.36CY 0 0 98 0 1 0 0.96CZ -26 5 0 33 8 55 0.41DE -3 15 1 22 18 42 0.28DK -4 20 2 0 32 44 0.34EE -47 5 0 0 8 86 0.75ES -3 32 5 20 33 8 0.27FI 13 15 1 28 30 26 0.26FR -7 5 1 75 15 4 0.59EL 11 17 11 0 18 54 0.36HU 15 31 1 42 8 17 0.31IE 2 62 2 0 14 22 0.45IT 15 52 7 0 27 13 0.36LT 72 55 11 0 29 0 0.40LU 62 0 0 0 35 0 0.13LV 14 45 0 0 55 0 0.50MT 0 0 100 0 0 0 1.00NL 3 66 1 3 9 19 0.48PL -1 4 2 0 7 87 0.76PT 5 28 6 0 53 13 0.38RO -6 12 1 19 33 34 0.28SE 2 3 1 39 55 1 0.46SI -18 3 0 34 30 32 0.31SK 4 10 2 52 23 13 0.35UK 1 46 1 16 8 28 0.33EA 1
EU27 0 24 3 27 21 25 0.24
Share electricity generation by fuel - %Electricity mix in the EU

Part I
73
2010 2010 2009 2010 2010 2010 2009 2009 2008 2010AT 132 163 613 50 0.3 1.9 10.3 1.5 0.12 8BE 191 216 491 54 0.4 1.7 9.6 1.2 0.20 11BG 671 473 1175 124 2.3 2.6 3.3 0.28 14CY 178 177 912 29 0.7 2.8 5.2 2.0 0.15 11CZ 375 249 608 116 1.2 2.6 13.9 1.7 0.20 13DE 142 122 502 48 0.4 2.3 3.1 1.2 0.15 12DK 94 74 387 48 0.3 2.5 6.5 1.0 0.08 11EE 546 262 717 178 1.8 3.0 9.9 2.1 0.21 13ES 137 176 634 31 0.4 2.1 8.5 1.6 0.13 10FI 225 309 413 68 0.5 1.6 10.6 1.1 0.08 8FR 152 476 44 0.3 1.4 6.1 1.2 0.13 8EL 147 180 481 33 0.6 3.2 6.9 1.3 0.11 7HU 295 142 803 129 0.8 1.9 11.2 2.1 0.24 15IE 93 42 44 0.4 2.7 16.0 0.19 9IT 124 129 439 37 0.4 2.4 8.4 1.2 0.11 8LT 311 181 521 117 0.9 1.9 8.1 1.5 0.22 14LU 140 361 867 42 0.4 2.3 4.9 2.1 0.16 11LV 363 446 661 185 1.0 1.9 7.1 1.8 0.14 14MT 169 19 0.6 2.9 6.8 0.10 6NL 158 158 439 47 0.4 2.0 10.8 1.0 0.15 10PL 331 207 917 112 1.3 3.2 5.9 2.5 0.24 13PT 155 225 734 29 0.4 2.0 1.9 0.10 12RO 396 292 622 121 1.3 2.4 27.2 1.7 0.20 17SE 159 207 415 49 0.2 1.0 10.7 1.0 0.07 11SI 231 179 819 74 0.6 2.2 12.1 2.5 0.29 14SK 371 370 731 89 1.0 1.8 13.3 1.9 0.12 16UK 112 113 450 39 0.3 2.4 1.0 0.12 9EA 146 146 8.7 10
EU27 152 149 508 0.4 2.1 8.9 1.3 10
Weight of energy in
HICP basket
(%)
Energy intensity of
the economy
(kgoe/1000 EUR)
Energy intensity of
industry (kgoe/1000
EUR)
Energy intensity of transport
(kgoe/1000 EUR)
Energy dependence indicators related to the energy and carbon intensity dimensionEnergy
intensity of households (kgoe/1000
EUR)
CO2 intensity of
the economy (ton CO2 eq./1000
EUR)
CO2 intensity of energy use (ton CO2 eq./1000
EUR)
Share of energy
intensive sectors in total GVA
(%)
CO2 intensity of transport sector (ton
CO2 eq./1000
EUR)
CO2 intensity of households
(ton CO2 eq./1000
EUR)

European Commission Member States’ Energy Dependence
74
Current account
Petro- leum
products
Gas Total balance (% of GDP)
Relative energy trade
balance (%)
Share of energy in total trade
(%)
Macro trade
openness (% of GDP)
2011 2011 2011 2011 2011 2011 2011AT -2.6 -0.8 -3.8 2.0 -57.3 7.5 88.2BE -3.2 -1.4 -4.8 -0.8 -19.3 13.7 182.2BG -4.6 -2.4 -6.8 0.9 -32.0 18.7 113.2CY -7.3 -0.2 -7.5 -10.4 -72.7 24.4 42.2CZ -3.1 -1.6 -4.1 -2.9 -42.2 6.7 145.5DE -2.5 -1.0 -3.7 5.7 -66.1 7.4 75.5DK 0.8 0.2 0.7 6.5 11.2 9.6 63.4EE -1.5 -1.1 -1.3 3.2 -4.7 17.2 154.6ES -2.6 -0.9 -3.6 -3.5 -54.4 14.6 46.0FI -2.5 -0.7 -3.9 -0.7 -39.6 16.1 61.9FR -2.4 -0.7 -3.1 -2.2 -60.1 10.9 47.1EL -1.8 -0.6 -2.4 -9.8 -27.2 28.4 30.9HU -3.2 -2.3 -6.0 1.4 -51.3 7.7 153.5IE -2.6 -0.8 -3.6 0.1 -69.1 5.8 88.8IT -2.0 -1.4 -3.8 -3.2 -60.9 12.7 49.1LT -3.6 -3.3 -7.8 -1.6 -18.8 29.6 139.4LU -4.0 0.0 -3.9 7.1 -89.7 5.1 84.7LV -3.5 -2.0 -5.4 -1.2 -42.8 12.0 104.4MT -2.7 -0.3 -3.0 -3.1 -9.0 28.3 118.0NL -3.3 -0.3 -3.8 9.2 -14.4 17.5 150.3PL -3.5 -0.3 -3.3 -4.3 -48.4 9.0 76.7PT -3.1 -0.9 -4.2 -6.4 -53.9 13.4 58.6RO -1.9 -0.6 -2.7 -4.4 -42.7 8.7 73.2SE -1.5 -0.3 -1.9 7.2 -25.6 11.0 67.3SI -5.4 -1.1 -6.3 -1.1 -47.0 9.7 139.5SK -2.5 -2.8 -6.5 0.1 -38.2 10.4 162.9UK -0.5 -0.3 -1.0 -1.9 -15.9 13.3 48.4EA -2.5 -0.9 -3.6
EU27 -2.2 -0.8 -3.2 -0.6 -39.6 8.8 93.4
Energy dependence indicators related to the trade dimensionTrade balance of energy
products (% of GDP)DECOMPOSITION (related to total
energy trade)
−

REFERENCES
75
ACER/CEER (2012), Annual report on the results of monitoring the internal electricity and natural gas markets in 2011.
BMWi (2010), "Analyse und Bewertung der Versorgungssicherkeit in der Elektrizitätsversorgung," Abschlussbericht der Untersuchung von Consentec & IAEW & EWI im Auftrag des Bundesministeriums für Wirtschaft und Technologie, Bundesrepublik Deutschland, 30 September 2010.
BMWi (2011), "Monitoring-Bericht nach § 51 EnWG zur Versorgungssicherkeit bei Erdgas," Bundesministerium für Wirtschaft und Technologie, Bundesrepublik Deutschland, July 2011.
Bundesnetzagentur (2012), "Bericht zum Zustand der leitungsgebundenen Energieversorgung im Winter 2011/12," Bundesrepublik Deutschland, 3 Mai 2012.
Brown, M. (2011), "Competing dimensions of Energy Security," presentation to POLINARES Workshop "The Energy Security Issue", Paris School of International Affairs, 31 May 2011.
Badea, A. C. (2010),"Energy Security Indicators," presentation at conference in Belgrade, 19-21 May 2010, on behalf of Institute of Energy, Joint Research Centre, European Commission.
Badea, A. C., C. M. Rocco, S. Tarantola and R. Bolado (2011), “Composite indicators for security of energy supply using ordered weighted averaging”, Reliability Engineering and System Safety, Vol.96, Issue 6, June 2011, pp.651-662.
De Jong, J. , J.-M. Glachant, M. Hafner, N. Ahner and S. Tagliapietra (2012), A New EU Gas Security of supply Architecture?, European Energy Journal, July 2012.
ECFIN (2011a), "Inflation differentials across Member States and the role of energy prices", European Commission, Directorate-General for Economic and Financial Affairs, Note to the Eurogroup Working Group, 17 March 2011.
ECFIN (2011b), Quarterly Report on the Euro Area, European Commission, Directorate-General for Economic and Financial Affairs, Volume 10, No. 2, July 2011.
ECFIN (2011c), Quarterly Report on the Euro Area, European Commission, Directorate-General for Economic and Financial Affairs, Volume 10, No. 4, December 2011.
Ecofys (2011), Financing Renewable Energy in the European Energy Market, final report for the European Commission, Directorate-General for Energy.
EEA (2012), Energy efficiency and energy consumption in the household sector, European Environment Agency, April 2012
ERGEG (2010), ERGEG 2010 Status Review of the Liberalisation and Implementation of the Energy Regulatory Framework, Council of European Energy Regulators.
ENER (2011), Quarterly Report on European Electricity Markets, European Commission, Directorate-General for Energy, Volume 4, Issue 1, January 2011 – March 2011.
ENER (2012a), Quarterly Report on European Gas Markets, European Commission, Directorate-General for Energy, Volume 5, Issue 1: Jan 2012 – Mar 2012.
ENER (2012b), Quarterly Report on European Electricity Markets, European Commission, Directorate-General for Energy, Volume 5, Issue 2: Apr 2012 – Jun 2012.

European Commission Member States’ Energy Dependence
76
Eurelectric (2010), Integrating intermittent renewables sources into the EU electricity system by 2020: challenges and solutions.
Euratom Supply Agency (2012), Annual Report 2011.
European Central Bank (2010), Structural Issues Report: Energy markets and the Euro area macro economy.
European Commission (2000), Towards a European Strategy for the security of energy supply, Commission Green Paper, COM(2000) 769, 29 November 2000.
European Commission (2010a), Energy infrastructure priorities for 2020, Commission Communication, COM(2011) 677, 24 November 2011.
European Commission (2010b), Europe's Energy Position – 2010 Annual Report.
European Commission (2011a), 2009/2010 Report on progress in creating the internal gas and electricity market, Commission Staff Working Paper, 9 June 2011.
European Commission (2011b), Impact Assessment accompanying the Proposal for a Regulation of the European Parliament and of the Council on guidelines for trans-European energy infrastructure and repealing Decision No 1364/2006/EC, SEC(2011) 1233, 19 October 2011.
European Commission (2011c), Proposal for a Directive of the European Parliament and of the Council on energy efficiency and repealing Directives 2004/8/EC and 2006/32/EC, COM(2011) 370, 22 June 2011.
European Commission (2011d), Proposal for a Regulation on guidelines for trans-European energy infrastructure and repealing Decision No 1364/2006/EC, COM(2011) 658, 19 October 2011.
European Commission (2011e), On security of energy supply and international cooperation - "The EU Energy Policy: Engaging with Partners beyond Our Borders", Commission Communication, COM(2011) 539, 7 September 2011.
European Commission (2011f), Renewable Energy: Progressing towards the 2020 target, Commission Communication, COM(2011) 31, 31 January 2011.
European Commission (2011g), Roadmap to a Single European Transport Area – Towards a competitive and resource efficient transport system, Commission White Paper, COM(2011) 144, 28 March 2011.
European Commission (2012), Renewable energy – a major player in the EU energy market, ards a competitive and resource efficient transport system, Commission Communication, COM(2012) 271, 6 June 2012.
European Commission (2013), Market functioning in network industries – electronic communications, energy and transport, European Economy, Occasional Papers, N° 129.
Fraunhofer Institute for Systems and Innovation Research (2012), Contribution of Energy Efficiency Measures to Climate Protection within the European Union.
Gul, T. and T. Stenzel (2005), Variability of Wind Power and other Renewables: Management Options and Strategies, International Energy Agency.

Part I
77
Harnser Group (2010), A Reference Security Management Plan for Energy Infrastructure, report prepared for the European Commission, DG TREN, summer 2010.
Jewell, J. (2011), "The IEA model of short-term energy security (MOSES); primary energy sources and secondary fuels", International Energy Agency Working Paper, OECD/IEA.
Melling, A. (2010), Natural Gas Pricing and its future, Carnegie Endowment for International Peace.
Olz, S. (2007), Contribution of renewables to energy security, International Energy Agency, Paris.
Pöyry (2010) for the European Wind Energy Association, Wind Energy and Electricity Prices. Exploring the ‘merit order effect’
SEAI (2011), Energy security in Ireland: A statistical overview, 2011 Report, Sustainable Energy Authority of Ireland.
Sovacool, B. and M. Brown (2009), Competing Dimensions of Energy Security: An International Perspective. Measuring energy security performance in the OECD, Georgia Institute of Technology Working Paper 45.
Stagnaro, S. (2012), "How solar subsidies can distort the power market", European Energy Review, 5 July 2012.
UK DECC (2011), UK Energy Sector Indicators 2011, Department of Energy and Climate Change, United Kingdom.
UNDP (2000), World Energy Assessment - Energy and the Challenge of Sustainability.
US Chamber of Commerce (2011), "Index of US energy security risk; assessing America's vulnerabilities in a global energy market," 2011 edition, Institute for 21st Century Energy, US Chamber of Commerce.
Westphal, K. (2012), "The four great challenges for the European gas market", European Energy Review, 2 July 2012
Winzer, C. (2012), "Conceptualising Energy Security," presentation at DECC Seminar, Department of Energy and Climate Change (DECC), London, UK, 7 March 2012.
World Energy Council (2008), Europe's vulnerability to energy crises, London, World Energy Council.


Part II Individual Country Files


INTRODUCTION TO THE COUNTRY FICHES
81
This part presents country fiches for the Member States which, in line with the results of the analysis presented in Part I, can be considered as vulnerable from an energy dependence point of view. More specifically, 17 Member States underperform under at least one of the dimensions analysed above, i.e. energy security, energy and carbon intensity, or energy trade balance (64).
These countries are Bulgaria, Cyprus, the Czech Republic, Estonia, Greece, Hungary, Ireland, Italy, Lithuania, Luxembourg, Latvia, Malta, Poland, Portugal, Romania, Slovenia and Slovakia.
(64) I.e. these countries have received an aggregate scoring
below -4. For the methodology underlying the aggregation, see Annex A2 in Part I.
Each of the fiches has been divided into three chapters mirroring the three broad dimensions of energy dependence as assessed in Part I. The assessment endeavours to identify the main drivers behind the performances of the Member States in each dimension with a view to framing the vulnerability profile of the countries in a broader context, taking into account mitigating factors or the lack thereof, structural features of their economy and national policy orientations.
The cut-off date for the information and the data collection is November 2012.


1. BULGARIA
83
1.1. SECURITY OF ENERGY SUPPLY
Bulgaria's energy mix appears well diversified since the country uses a wide variety of energy sources as testified by the low Herfindahl-Hirschman index of concentration (HHI). Moreover, around 60 % of Bulgaria's energy needs are covered by sources that are almost entirely domestic: solid fuels, renewables and nuclear. Bulgaria's total primary energy sources import dependency is therefore below the EU average and it was overall on a declining path between 2006 and 2010. However, from the local resources, the high reliance on lignite coal and the need of uranium imports for the nuclear fission could pose further environmental and security of supply concerns, respectively.
0
20
40
60
80
100
2006 2007 2008 2009 2010
%Graph II.1.1:Bulgaria - Import dependence
Gas Oil Solid fuels Total
Source: Eurostat
Key Insights
Security of Energy supply
- A low import dependency and a well-diversified energy mix suggest that Bulgaria is relatively less vulnerable than the EU average to security of supply shocks. However, the lack of geographical diversification of import sources may be a matter of concern.
- The low share of gas in the energy mix, combined with the lack of competition and of diversification of import sources in the gas sector may prove problematic in the medium term if the country reduces its consumption of other more carbon-intensive sources.
- There is a severe lack of competition in the electricity market. In addition, regulated prices might not give the correct price signals to consumers for an efficient use of resources.
Energy and Carbon Intensity
- Bulgaria is the most vulnerable Member State as far as energy and carbon intensities are concerned. Performances are worrying across all segments of the economy. In addition, the country reports the highest share of energy loss in the EU.
- The high share of energy-intensive industrial activities in the economy and the high share of energy products in the consumers' basket are a fundamental feature of the country that should be taken into account when assessing energy and carbon intensities.
Trade balance for energy products:
- Bulgaria is among the most vulnerable Member States in relation to the external dimension of energy dependence. It has one of the largest energy trade deficits in the EU, but this should be seen against the background of achieving a modest current account surplus in 2011, after huge deficits in the recent past. However, Bulgaria's energy trade deficit remains worryingly high in spite of some modest improvements since 2007.
- The significant share of energy trade in total trade confirms the importance of energy trade and, more generally, the energy sector for the Bulgarian economy. Together with the relative importance of energy-intensive activities, this suggests that particular attention should be paid to the trade dimension.

European Commission Member States’ Energy Dependence
84
1.1.1. Primary Energy Sources
1.1.1.1. Solid fuels
Solid fuels are the most used energy source in Bulgaria, covering some 39 % of its consumption in 2010 (a 5 points increase compared to 2006). It represents one of the highest shares in the EU. The most common solid fuel in Bulgaria is lignite, which is considered a low-rank coal because of its low calorific value(65) and associated high greenhouse gas and ash and sulphur emissions.
0
20
40
60
80
100
2006 2007 2008 2009 2010
%Graph II.1.2:Bulgaria - Energy mix
Gas Oil Nuclear Renewables Solid fuels
Source: Eurostat
Domestic production was almost constant between 1990 and 2009, hovering around 5 Mtoe per year. However, due to the overall decrease in total gross inland consumption of energy products, the country's import dependency of solid fuels sharply decreased from 41 % in 1990 to 25 % in 2010. At the same time, Bulgaria imports almost all its solid fuels needs from non-EEA (European Economic Area), namely Russia and Ukraine. To date, the country reportedly has solid fuel reserves of about 3 bn tonnes(66).
(65) Calorific value of lignite is in the range of 1 200 –
1 8001200 - 1800 kcal/kg. Anthracite and bituminous coal have calorific values in the range of 5 000 – 7 000 5000 - 7000 kcal/kg.
(66) Eurocoal (2012): Bulgaria’s solid fuel reserves amount to some 3 billion tonnes, comprising 88.7 % lignite, 10.9 % brown coal and 0.4 % hard coal.
0.0
0.2
0.4
0.6
0.8
1.0
2006 2007 2008 2009 2010
Graph II.1.3:Bulgaria - HHI index energy imports
Gas Oil Solid fuels
Source: Eurostat
Bulgaria was allowed by the Commission to finance the environmental clean-up of former mining sites with a total of EUR 19 million in the period 2008-2012(67).
1.1.1.2. Oil
The second source of energy used is oil, which accounted for 23 % of its energy mix in 2010 (a 2 points decrease since 2006). This share is among the lowest ones in the EU. Bulgaria is entirely dependent on imports for the supply of oil and the major trading partners are Russia and Ukraine, which combined amount to more than 90 % of the country's total imports. Therefore, geographical diversification is rather limited.
80
85
90
95
100
2006 2007 2008 2009 2010
%
Graph II.1.4:Bulgaria - Non-EEA share of imports
Gas Oil Solid fuels
Source: Eurostat
In 2010, the country's gross inland consumption of petroleum products was 4.9 Mtoe which equals to a little less than half of its total imports of oil(68). (67) European Commission (2008) (68) European Commission, DG Energy (2012a)

Part II Individual Country Files
85
The rest is refined and exported. Luckoil Neftochim Burgas is the only refinery in Bulgaria and it is the largest refinery in the Balkan peninsula with a crude oil capacity of 9.5 million tonnes per year(69).
1.1.1.3. Nuclear
The third energy source used is nuclear; the 22 % share in the energy mix in 2010 was amongst the highest in the EU. Bulgaria has two active nuclear reactors generating about 35 % of the country's electricity.
Production of nuclear energy suffered a severe contraction between 2006 and 2007, decreasing by 25 %. As a matter of fact two reactors had to be shut down for non-compliance with the EU safety standards(70). As compensation, the country has received a total of EUR 867 million in decommissioning aid from the European Commission until 2013. In November 2011 an additional package of EUR 185 million was adopted by the Commission to run from 2014 to 2020(71). The closure of the nuclear units created energy deficits not only for Bulgaria but also for the neighbouring countries which were importing electricity from Bulgaria(72).
The Bulgarian government has decided to undertake investments for reinforcing the nuclear power generation capacity by completing the construction of two reactors at Belene site (initially started in the 1980s but stopped in 1990 for lack of funding) with a programmed capacity of 2000 MWe. The Belene project was revived in 2002 and the plan was approved in 2003. The Bulgarian National Electricity Company (NEC) signed a procurement contract with the Russian Atomstroyexport. The first reactor was expected to be operating by the end of 2013, and the second by the end of 2014. However, the project was stalled again in 2011 and officially terminated in March 2012(73). In April 2012, the Bulgarian government also decided to
(69) Lukoil Neftochim Bourgas (2011) (70) This measure followed the closure of two more units in
2002 as part of the accession negotiation. (71) European Commission ( 2011b) (72) International Atomic Energy Agency (2009) (73) Following this, the Russian Atomstroyexport has made a
claim in court against the Bulgarian government for compensations amounting to EUR 1 billion.
launch the procurement procedure for an additional reactor at Kozloduy site. The Bulgarian government is to hold a referendum on 27 January 2013 to ask the populations whether new nuclear power facilities are to be constructed.
1.1.1.4. Gas
Natural gas is the fourth source of the country's energy mix, with a 13 % share in 2010 (well below the EU average). Bulgaria imports all its gas needs and it does so via one single supplier, namely Russia. Gas is mainly used for heating purposes, rather than for electricity generation where it constitutes only 4 % of the generation mix.
A well-functioning and interconnected gas market with competitive and market-based prices should provide the correct incentives for further investments and signals to consumers for an efficient and sustainable use of resources. Both elements are conducive to reduce the vulnerability of the country to energy-related shocks. Currently Bulgaria functions as a gas transit country for Greece, Turkey and Former Yugoslavian Republic of Macedonia and it also has interconnections with Romania. However the only import route is the Ukrainian-Western Balkan.
Security of gas supply could be improved with the completion of two big gas pipelines that should pass through Bulgaria. However, their construction is continuously hampered by political tensions. One is the Nabucco pipeline that will run from Turkey via Bulgaria, Romania and Hungary ending up in Austria close to the Gas Hub in Baumgarten. It is expected to pump 20-30 bn cubic meters of gas annually. It is a EU-backed project in direct competition with another one, backed by Russia but also by ENI, an Italian Gas Company: South Stream pipeline. The 900 km long offshore section will run from the Beregovaya compressor station on the Black Sea coast to Bulgaria's city of Varna, then a southwest route would take gas to Greece and south of Italy and a northwest route would reach Hungary, Austria, Slovenia and the North of Italy. It is expected to carry some 60 bn cubic meters of gas per year. The construction phase of both projects has not yet started, hindered by political fights between various public and private actors. The latest developments foresee that

European Commission Member States’ Energy Dependence
86
Nabucco construction should start in 2013 and end in 2017, while South Stream's construction should begin at the end of 2012 and be concluded in 2015.
In addition, a project has been launched for expanding the only existing gas storage facility which has currently very limited capacity(74) (650 million m3, or 26 % of the annual national consumption).
In compliance with the EU legislation(75), the Bulgarian retail gas market has been liberalized. However, gas prices are still regulated by the State Energy and Water Regulatory Commission. Currently the incumbent wholesaler still covers 100 % of the market either via imports (98 %) or via domestic extraction (2 %). In gas retail the five biggest companies have a share of close to 70 %(76). In absolute terms Bulgarian final gas prices are very low both for industries and for households, ranking among the five lowest ones in the EU. However, in PPS (purchasing power standard) terms the situation changes dramatically with Bulgarian gas prices for industrial consumers being the highest in the EU and among the highest ones in the case of households.
The disaggregation of the tax and wholesale components shows that the main determinant of the high price level is the latter, while taxes and levies only play a very marginal role. Some possible underlying drivers of this phenomenon are (i) the lack of a spot market for gas, which means that all the gas contracts are negotiated bilaterally with the suppliers on a "take or pay" and oil-indexed basis, and (ii) the lack of competition on the supply side due to complete reliance on Russian imports(77).
1.1.1.5. Renewables
Renewable energy is the fifth energy source in Bulgaria. It accounts for 6% of its energy mix, (74) European Commission (2012a) (75) Directive 2003/55/EC (76) Gas transmission network is owned and managed by
Bulgartransgaz EAD. The main wholesale operator is Bulgargaz EAD. The two companies belong to the same public holding, the Bulgarian Energy Holding EAD created in 2008. The unbundling model adopted is the Independent Transmission Operator.
(77) State Energy and Water Regulatory Commission of Bulgaria (2010)
or 13.8% of Bulgaria's gross final energy consumption(78). Bulgaria has substantially increased its share of renewables in gross final energy consumption over the last years, from 9% in 2006, and is not far away from reaching its binding target of 16% by 2020, as stipulated in the renewables directive.
0
20
40
60
80
100
2006 2007 2008 2009 2010
%Graph II.1.5:Bulgaria - Renewable mix
Hydro Biomass Wind Solar Geothermal
Source: Eurostat
Most of the renewable energy in Bulgaria comes from biomass used for heating, but renewable electricity develops as well. The share of RES in heating was 21% according to the latest statistics, much above EU average of 13%(79). In electricity, Bulgaria reached a RES share of 14%, exceeding the country's interim target of 11% for 2010, but much below EU average of 19%. Hydro power still represents almost over 90% of renewable electricity, but wind power expands rapidly since 2009. In transport, the current share of RES is 0.6%, much below the EU average of 4.2%. In order to come closer to the binding target of 10% share of RES in transport by 2020, requirements for biofuels have been introduced from 2012.(80)
Bulgaria applies feed-in tariffs and other support measures to renewables, such as subsidies and credit lines from EU funds, EBRD (European Bank for Reconstruction and
(78) The share of renewables in the energy mix means the share
of renewable energy in gross inland energy consumption. Consequently we use this denominator in the EDI to assess the share of each energy source in the energy mix. On the other hand, Member States' renewable targets for 2020 are expressed as a share of renewable sources in gross final energy consumption, i.e. excluding transmission, distribution and transformation losses. This explains the difference between the two figures.
(79) European Commission, DG Energy (2012b) (80) Republic of Bulgaria (2011b)

Part II Individual Country Files
87
Development) and other sources are available. The level of support to renewable electricity has been estimated to be below EU average, but in principle in line with average generation costs(81). The support, functioning for a few years now, has led, after many smaller wind farms in the early years, to the first large scale wind energy projects, as well as to a surge in the connection of medium and large size solar PV (photovoltaic) farms. One of the main barriers to their deployment is insufficient grid connection capacity. To solve this issue, Bulgaria plans substantial investment by 2015 to connect renewables to the country’s transmission grid. Moreover, the investors raise concerns about lack of predictability and retroactive changes in business conditions. For instance, in September 2012 Bulgaria introduced temporary grid access tariffs for renewables, which substantially reduce the revenues from renewables and may discriminate renewable electricity against other power plants.
1.1.2. Secondary Energy Sources
In 2010, Bulgaria was the second biggest net exporter of electricity in the EU. Electricity in Bulgaria is mainly generated using solid fuels and nuclear. The main importers of its electricity are Greece and Romania. Bulgaria also imports electricity from Romania and to a much lesser extent from Serbia.
Good electricity interconnections and adequate domestic infrastructure capacity are important to shelter the country from supply shocks and to enable a proper absorption of renewables. A competitive and dynamic electricity market should cater the necessary investment incentives and provide the right price signals to consumers.
(81) Steinhilber S., Ragwitz M., Rathmann M, Klessmann C.
and Noothout, P. (2011)
0
20
40
60
80
100
2006 2007 2008 2009 2010
%Graph II.1.6:Bulgaria - Electricity mix
Gas Oil Nuclear Renewables Solid fuels
Source: Eurostat
Despite the liberalization process initiated in 2007, the electricity market remains still somewhat dysfunctional. In 2010 only 18 % of the electricity was traded on the free market, a reduction of 6 p.p. with respect to the previous year. The share of the three largest wholesale traders is 48 %, which suggests a relatively non-concentrated market. However, the country does not yet have an Electricity Exchange; contracts are therefore only signed bilaterally.
Electricity prices are regulated. Final electricity prices are the lowest in the EU in absolute terms for both households and industrial users. Unlike for gas, a comparison in PPS terms for electricity does not change substantially the situation: Bulgaria's prices for electricity in PPS are still much lower than the EU average for industrial consumers, while for households they are in line with the EU average.
The Regulator's report suggests that Bulgaria's current equipment is sufficient to cope with the level of electricity demand: in 2010, total installed capacity was 12 072 MW, while the peak load in the same year was 7 270 MW. The Electricity System Operator (ESO EAD) is part of the vertically integrated enterprise Public Provider NEK EAD(82). The ESO EAD prepared an investment plan for the period 2010-2020 to strengthen the country's infrastructure capacity mainly in the sectors of nuclear, wind, hydro and (82) The State Regulator claims that the company has legal and
organizational independence; it also has separate accounting practices and an autonomous decision-making process. The model chosen for the unbundling, which became effective in May 2011, is the Independent Transmission Operator.

European Commission Member States’ Energy Dependence
88
photovoltaic energy. Better interconnections with neighbouring countries would also be needed to fully exploit the export capacity.
1.1.3. Conclusions
Thanks to the relatively low import dependency and the diversification of energy and import sources, Bulgaria is relatively less vulnerable than the EU average in terms of security of supply. The lack of competition and diversification of import sources in the gas sector may, however, pose a threat in the medium term as the country will have to reduce its consumption of more polluting and less efficient sources such as solid fuels and oil if it wants to respect its climate change commitments.
The reinforcement of the gas storage capacity, the improvement of gas import infrastructures and the creation of a functioning gas spot market will become more and more a priority in the future energy policies of Bulgaria. Closing the renewable energy gap with the best performing countries in the EU could also be key to developing a more sustainable energy system. Finally, more vibrant competition in the electricity market should also be pursued, limiting the perimeter of the regulated prices only to the most vulnerable consumers.
1.2. ENERGY AND CARBON INTENSITY
Despite significant improvements over the last ten years, Bulgaria still has very high energy and carbon intensity.
Bulgaria's economy was the most energy-intensive of the EU in 2010, while there was a remarkable reduction in energy intensity compared to 2006.
Table II.1.1:Energy and carbon intensity
Energy intensity of the economy 1) 671 -19.5CO2 intensity of the economy 2) 2.31 -15.0Share of energy intensive sectors in Gross Value Added 3) #N/A #N/A
Energy intensity of the economy 1) 152 -4.7CO2 intensity of the economy 2) 0.41 -9.1Share of energy intensive sectors in Gross Value Added 3) 8.9 -0.9Source: Eurostat
2010 percentage change2006 - 2010
memo items: EU27
Notes: 1) Kg of oil equivalent per 1000 EUR, changes in percent; 2) Tonnes of CO2 equivalent per 1000 EUR, changes in percent; 3) percent of total gross value added, changes in percentage points, latest data refer to the year 2009.
The National Energy Efficiency Action Plan (NEEAP) runs for the period 2008-2016. The
savings target to be reached by 2016 is an overall decrease in final energy consumption (FEC) by 9 % compared to the baseline level(83). According to the second NEEAP(84), savings in 2010 were equal to 6.3 % of the baseline, almost double the Bulgarian interim target. The second NEEAP envisages reaching savings of 7.3 % by 2013 and a significant 16.6 % of savings by 2016. That is, the government expects to achieve almost double its savings target by 2016. These measures would need to be further developed in the light of the newly adopted energy Efficiency Directive, the slow progress in the uptake of energy efficiency measures and the improvement of energy intensity.
Bulgaria recorded the highest carbon intensity of the economy in the EU in 2010. This appears to be the result of the combination of several factors, mainly the high share of energy-intensive industries in the country and the over-reliance on solid fuels(85) in the energy mix. As a matter of fact, "energy supply" accounts for almost half of the total GHG (greenhouse gas) emissions in Bulgaria.
1.70
2.00
2.30
2.60
2.90
500
600
700
800
900
2006 2007 2008 2009 2010
Graph II.1.7:Bulgaria - Energy and carbon intensity of the economy
Energy intensity (lhs) CO2 intensity (rhs)
kgoe/1000 EUR ton CO2 eq./1000EUR
Source: Eurostat
However, since the beginning of the 1990s Bulgaria has undertaken a catching-up process. The country sharply decreased its GHG emission as a consequence of industrial reorganization: it went down to 73 MT CO2-eq in 2008 from
(83) Republic of Bulgaria (2007): the baseline energy
consumption level against which savings are compared, is the average consumption over the period 2001 - 2005.
(84) Republic of Bulgaria (2011a) (85) The country's share of solid fuels in the energy mix is more
than double the EU average. Its electricity generation depends for 48 % on solid fuels, again double the EU average.

Part II Individual Country Files
89
117 MT CO2-eq in 1990. Emissions per capita went down from 13 to 8 tCO2-eq between 1990 and 2010. The overall emission intensity of the country decreased by 62 %, one of the biggest decreases in the EU(86).
It is important to underline that while between 1990 and 2009 almost all sectors recorded a constantly decreasing trend in terms of GHG emission, there are two noticeable exceptions, namely the energy supply and the transport sector. Both sectors reduced their level of emissions compared to 1990, however in recent years this level has started to increase again mainly due to two factors: the partial shift from nuclear to fossil fuels (following the country's accession to the EU) and the sharp decline of railway services in favour of road transportation.
According to the European Environment Agency, Bulgaria has over-achieved its Kyoto target,(87) as it had already reduced emissions by 44.6 % in 2008 compared to the base-year level (1988), while it has a Kyoto target of emission reductions of 8 % over the period 2008-2012.
In the context of the Effort Sharing Decision(88), Bulgaria has to limit its emissions in the non-ETS sectors to an increase of 20% compared to 2005 by 2020. Current projections show that the actual level of emissions by 2020 might be 8 % lower than the baseline year hence the country would substantially over deliver on its targets(89).
With regard to the ETS (Emissions Trading Scheme) sectors, Bulgaria's share of GHG emissions covered by the ETS is equal to 55.4 % well above an EU average of 40%. Latest emission reporting shows that Bulgaria has exceeded its emission cap in 2011 by 5%. As of 2013 there will be an EU-wide emission cap and the level of allowances to be auctioned in the EU will be increased in a linear manner. In the new phase of the ETS the largest industrial emitters which constitute the backbone of the country's industrial structure might incur additional costs; however, the Bulgarian power sector will be granted additional free allowances under the
(86) European Commission (2012b) (87) European Environment Agency (2010) (88) Decision No 406/2009/EC (89) European Commission (2011a)
derogation mechanisms foreseen by Article 10c of the ETS Directive. In addition some of the industrial sectors will fall under the derogation foreseen for the sectors at risk of carbon leakage(90).
1.2.1. Industry
Bulgaria's industrial sector is characterized by energy-intensive activities. Despite the progress made in the past decade, energy intensity of industry was the highest in the EU in 2010. The share of energy-intensive sectors in total GVA (Gross Value Added) is also one of the highest in the EU.
The industrial sector was severely hit by the crisis of 2008/2009(91), reducing its output by almost 20 % in a year. Consequently its final energy consumption decreased significantly by about a third between 2007 and 2009, falling behind the transport sector(92).
2.30
2.40
2.50
2.60
2.70
150
350
550
750
950
2006 2007 2008 2009 2010
Graph II.1.8:Bulgaria - Energy intensity of industry, carbon intensity of energy use
Energy intensity of industry (lhs)CO2 intensity of energy use (rhs)
kgoe/1000 EUR ton CO2 eq./1000EUR
Source: Eurostat
The Bulgarian industrial structure has a high proportion of metallurgical industries which represent 1.5 % of the GVA (double that of the EU27 average(93) and of chemical and petrochemical sectors(94) representing 1.2 % of the country's GVA (four times the EU27 average). This characterization, combined with the significant role of the electricity generation
(90) European Commission (2012c) (91) The Sofia Echo, 12 May 2009. (92) Republic of Bulgaria (2011a) (93) Eurostat (2012) (94) Eurostat (2012)

European Commission Member States’ Energy Dependence
90
sector(95), is behind the outstanding performances in terms of energy intensity.
Furthermore the power sector shows worrying performances in terms of efficient energy use. In Bulgaria, almost 50 % of primary energy inputs do not reach the final consumer (compared to the EU average of 30 %). The main portion of losses is suffered during transformation (40 % of energy loss compared to the EU average of 25 %)(96).
As a consequence of the industrial structure based on high energy-intensive sectors and of the poor performances of the power sector, the carbon intensity of energy use was above the EU average in 2010 and has shown a little increase compared to 2006. As mentioned above, ETS verified emissions for 2011 were 5 % above the cap level. This may become relevant during the third phase of the ETS as allowances will have to be auctioned. While the power sector will be still granted free allocation, this will not happen to all the other sectors (excluding those exposed to carbon leakage). Unless the carbon intensity is further reduced, industries could therefore incur additional costs, which can translate into a less competitive industrial sector, considering that Bulgaria is only one of the two countries in the EU where verified emissions in 2011 exceeded the national cap.
The 2016 FEC savings target for the industrial sector amounts to 23 % of the total target savings. However, through a set of measures laid out in the second NEEAP combining energy saving obligations, mandatory audits and energy management, the Bulgarian government envisages to reach annual savings in the industrial sector that are more than double the absolute value of this initial target. It is also important to note that large combustion plans falling under the ETS Directive have been excluded from this calculation.
1.2.2. Transport
The energy intensity of Bulgarian transport sector was the highest in the EU in 2010 despite notable reductions compared to the 2006 level. This performance is partly explained by the sharp
(95) Bulgaria exported nearly 20% of its electricity production
in 2010. (96) European Environment Agency (2008)
decline of railway transport in the country modal split. The share of railway passenger services went down from 7.7% in 2000 to 4% to 2008; the freight railway services shrunk even more dramatically from 45.2% in 2000 to 11% in 2008(97). In addition, even the energy efficiency of the railway sector has declined between 2007 and 2009, contributing further to the deterioration of the performance of the transport sector.
3.00
3.15
3.30
3.45
3.60
1100
1150
1200
1250
1300
2006 2007 2008 2009 2010
Graph II.1.9:Bulgaria - Energy and carbon intensity of transport
Energy intensity (lhs) CO2 intensity (rhs)
kgoe/1000 EUR ton CO2 eq./1000EUR
Source: Eurostat
The transport sector should account for 30% of the total FEC savings target by 2016, but the government expects to substantially exceed this − currently projected savings in 2016 are more than 2.5 times the initial target value. The NEEAP envisages a wide range of measures to promote more energy efficient transport, from a renovated development of railway infrastructures to an improvement of the public transportation network, from training for truck drivers to requirements for the public sector to purchase cleaner vehicles.
The Bulgarian transport sector was the most carbon-intensive in the EU in 2010 and its level has remained stable since 2006. Bad performance in the transport sector is driven by old and inefficient transport equipment and by the very low fuel prices which does not give incentives to shift to cleaner vehicles/transport modes. In Bulgaria, more than 90% of passengers' cars are over 10 years old and fuel pump prices are among the lowest in the EU: the second lowest for gasoline and the tenth lowest for diesel. In addition, as mentioned in section 1.1.1.5, the share (97) Eurostat (2011)

Part II Individual Country Files
91
of renewables in transport is extremely low, around 1%.
1.2.3. Households
Households' energy intensity was one of the highest in the EU in 2010. Households' energy consumption increased between 2007 and 2009(98), inverting the trend between 1997 and 2007 when there had been an average reduction per year in households' energy consumption of about 1%(99). The main drivers of this recent growth in consumption levels seem to be the increased size of the dwellings and the more widespread use of electric and electronic equipment. Between 2007 and 2009, households' electricity consumption increased by 10%(100).
0.22
0.25
0.28
0.31
0.34
90
100
110
120
130
2006 2007 2008 2009 2010
Graph II.1.10:Bulgaria - Energy and carbon intensity of households
Energy intensity (lhs) CO2 intensity (rhs)
kgoe/1000 EUR ton CO2 eq./1000EUR
Source: Eurostat
The target annual savings for the household sector by 2016 was around 29% of the total FEC savings target. However, the absolute value of these savings are now expected to be 24% lower than the initial target. Measures foreseen to improve the energy efficiency of Bulgaria's households include financial support for energy audits and mandatory efficiency standards for lighting and other appliances.
Finally, the heavy weight of energy products in the HICP (harmonized index of consumer prices) basket, 14%, i.e. the fourth highest in the EU, suggests that any increase in fuel prices would affect Bulgaria's households relatively more than in other EU countries.
(98) Republic of Bulgaria (2011a) (99) Energy efficiency Agency (2009) (100) Energy efficiency Agency (2009)
1.2.4. Conclusions
Bulgaria is the most vulnerable Member State as far as energy and carbon intensities are concerned. The country clearly needs to make further efforts to reduce both its energy and carbon intensity. Complete implementation of the EU acquis on energy efficiency could bring strong impetus for intensifying the uptake of energy efficiency measures.
However, Bulgaria's economic structure has specificities that must be taken into account when designing climate change policies. Any sudden surge in energy prices caused by rapid shifts towards less polluting but more costly sources could adversely affect Bulgaria's industries heavily dependent on energy and consumers which spend more that their European neighbours on energy products.
One of the priorities should be boosting RES in the transport sector, for which the 5.75 % target seems still far away. In addition, great improvements could be unleashed through better performing energy transformation processes and reducing the amount of energy loss which is currently unsustainably high.
1.3. CONTRIBUTION OF ENERGY PRODUCTS TO TRADE
1.3.1. Net energy trade balance
In 2011, Bulgaria had one of the highest energy trade deficits in the EU, at 6.8% of GDP, a modest improvement compared to the deficits recorded in 2007 and 2008 which amounted to 7.5% and 8.4% of GDP respectively, the largest deficit in the EU at the time. In fact, Bulgaria had the largest average energy trade deficit over the period 2007-2011.

European Commission Member States’ Energy Dependence
92
-10
-8
-6
-4
-2
0
-35
-25
-15
-5
5
2007 2008 2009 2010 2011
% of GDP% of GDP
Graph II.1.11:Bulgaria - Trade balance of energy products and CA
CA (lhs) Oil (rhs)Gas (rhs) Total (rhs)
Source: Eurostat
Remarkably, Bulgaria had an energy trade surplus in the years before 2007. The deterioration can be linked to the shut-down of the two nuclear power plants at the end of 2006. As a consequence, the country has relied more heavily on imported oil and, to a lesser extent, on imported gas. Between 2006 and 2007, Bulgaria changed from the biggest net exporter of oil in the EU (with an oil trade surplus of 4% of GDP) to one of the largest net importers of oil (with a deficit of 5% of GDP). The deterioration of the gas trade balance has been much less pronounced: from a deficit of 0.5% of GDP in 2006 to one of 2.2% of GDP a year later, one of the largest in the EU. In 2011, both energy product categories had a trade deficit of more or less the same order of magnitude as in 2007. However, at the same time Bulgaria has become the largest (net) exporter in the EU of energy relative to its economic size: since 2007 its electricity trade surplus varies around 0.75% to 1% of GDP.
The size of the energy trade deficit should be seen against the background of the country's current account, and more generally against that of an economic recovery after a sharp and deep recession which followed a financially imbued boom. Bulgaria's current account balance has improved at an impressive pace, contracting from a deficit of 25.2% in 2007 to a surplus of 0.9% of GDP in 2011. The relative stability of the energy trade deficit suggests that it is rather stubborn. In the current situation, the balance for the other product categories (including electricity) can be seen as compensating for the trade deficit for (primary) energy. This is remarkable in view of the
fact that Bulgaria appears specialized in energy-intensive activities.
1.3.2. Decomposition of the net energy trade balance
The energy trade balance can be decomposed into three multiplicative factors, namely the relative energy trade balance (i.e. the share of net exports in energy products in total cross-border energy trade), the share of energy in total trade and macro openness to trade (i.e. the ratio of total trade to GDP).
Table II.1.2:Decomposition of Energy Trade Balance
2007 2008 2009 2010 2011Energy trade balance (% GDP) -7.5 -8.4 -5.3 -6.1 -6.8Relative trade balance (%) -36.9 -37.3 -38.1 -34.2 -32.0Share of energy in total trade (%) 17.8 19.8 17.1 18.3 18.7Macro trade openness (% GDP) 115.0 113.7 81.8 96.5 113.2Source: Eurostat
As regards the size of the deficit on the relative energy trade balance in the year 2011, Bulgaria does not stand out. However, Bulgaria has one of the highest shares of energy trade in total trade in the EU, reflecting its relative specialisation in energy trade, while the macro openness is clearly above EU average. While this specialization is not per se problematic, it puts the country in a rather delicate position with respect to fluctuations in the energy products' terms of trade, supply disruptions or a sudden surge in energy prices.
1.3.3. Conclusions
Bulgaria is the one of the most vulnerable Member States for the external dimension of energy dependency as it has the highest average energy trade deficit over the period 2007-2011, which also appears rather stubborn over time. However, this should be seen against the background of the complete disappearance over the period of what was in 2007 a huge current account deficit.
Despite the modest current account surplus reported for 2011, the significant size of Bulgaria's energy trade deficit deserves to be carefully monitored as a sudden surge in oil or gas prices could have serious repercussions on the country's trade performance and its economy. Given the importance of energy trade and energy-intensive activities for the country, any shift in the terms of trade for energy products could adversely affect also the non-energy components of Bulgaria's

Part II Individual Country Files
93
trade balance. The trade dimension reinforces the case for further promoting (domestically produced) renewables, an electricity exchange and gas (spot) market, as more competitive gas and electricity markets would likely result in lower supply prices.
1.4. REFERENCES
Energy Efficiency Agency (2009), Energy Efficiency Policies and Measures in Bulgaria.
Eurocoal (2012), Country Profiles: Bulgaria, available from: http://www.euracoal.be/pages/layout1sp.php?idpage=80
European Commission (2008), Press Release IP/08/498, 2 April, 2008
European Commission (2011a), Annual Growth Survey 2012, Europe 2020 targets: climate change and energy, COM (2011) 815 of 23 November
European Commission ( 2011b), Proposal for a Council Regulation on Union support for the nuclear decommissioning assistance programmes in Bulgaria, Lithuania and Slovakia, COM (2011) 783 of 24 November.
European Commission (2012a), Making the Internal Energy Market Work, COM (2012) 663, SWD (2012) 367 and 368.
European Commission (2012b), Progress towards achieving the Kyoto Objectives, COM (2012) 626 of 24 October.
European Commission (2012c), Decision amending Decisions 2010/2/EU and 2011/278/EU on the sectors and subsectors which are deemed to be exposed to a significant risk of carbon leakage, COM (2012) 5715 of 17 August.
European Commission, Directorate-General for Energy (2012a), Country Factsheets, available from: http://ec.europa.eu/energy/observatory/countries/countries_en.htm
European Commission, Directorate-General for Energy (2012b), EU Energy in Figures, Statistical Pocketbook 2012
European Environment Agency (2008), Energy and Environment Report.
European Environment Agency (2010), GHG trends and projections in Bulgaria.
Eurostat (2011),Transport Pocketbook Statistics.
Eurostat (2012), National Accounts, available from: http://epp.eurostat.ec.europa.eu/portal/page/portal/national_accounts/data/main_tables
International Atomic Energy Agency (2009), Country Profiles: Bulgaria, available from: http://www-pub.iaea.org/MTCD/publications/PDF/cnpp2009/countryprofiles/Bulgaria/Bulgaria2004.htm
Republic of Bulgaria (2007), First National Energy Efficiency Action Plan, available from: http://ec.europa.eu/energy/efficiency/end-use_en.htm
Republic of Bulgaria (2011a), Second National Energy Efficiency Action Plan
Republic of Bulgaria (2011b), National Renewable Energy Action Plan 2010-2020, available from: http://ec.europa.eu/energy/renewables/action_plan_en.htm
State Energy and Water Regulatory Commission of Bulgaria (2011), 2010 Annual Report to the European Commission.
Steinhilber S., Ragwitz M., Rathmann M, Klessmann C. and Noothout P. (2011), Indicators assessing the performance of renewable energy support policies in 27 Member States, D17 Report of RE-Shaping project.
World Nuclear Association (2012), Nuclear Power in Bulgaria, available from: http://www.world-nuclear.org
Lukoil Neftochim Bourgas (2011), www.neftochim.bg


2. CZECH REPUBLIC
95
2.1. SECURITY OF ENERGY SUPPLY
The country's energy mix appears rather well diversified. The HHI is lower than in the most of the EU countries and it has improved over the past five years. In addition, the country has a national policy, outlined in the so-called State Energy Concept, by which the share of one single source cannot exceed 65 % of the total energy mix. This was introduced to prevent overreliance on imports from third countries and to fully exploit domestic sources(101). Import dependency is also very low; with 26 % in the 2010 it counts among the lowest ones in the EU.
(101) International Energy Agency
-20
0
20
40
60
80
100
120
2006 2007 2008 2009 2010
%Graph II.2.1:Czech Republic - Import
dependence
Gas Oil Solid fuels Total
Source: Eurostat
2.1.1. Primary Energy Sources
2.1.1.1. Solid fuels
The first sources of energy used in the Czech Republic are solid fuels with 41 % of the energy mix in 2010. This share has been substantially reduced since 1990 when it was 63 %. Yet the
Key Insights
Security of energy supply:
- The Czech Republic's import dependency was only 26 % in 2010, one of the lowest in the EU; hence the country seems to be relatively insulated from security of supply shocks.
- Out-dated electricity transmission infrastructures appear to be the main bottleneck in achieving better performance in the renewable energy sector. Electricity prices are still higher than the EU average, mainly due to the very high network costs.
Energy and Carbon Intensity:
- The Czech Republic appears to be one of the most vulnerable countries in the EU as far as carbon and energy intensities are concerned.
- The high share of energy-intensive industrial activities in the economy and the high share of energy products in the consumers' basket are a fundamental feature of the country that should be taken into account when assessing energy and carbon intensities.
- The households and transport sectors appear to be particularly underperforming in terms of energy savings and reduction of CO2 emissions.
Trade balance for energy products
- The Czech Republic does not seem particularly vulnerable as regards the external dimension of energy dependency, in view of its relatively moderate energy trade deficit combined with a small current account deficit.
- The share of energy in total trade is very small; together with the low energy dependency, this suggests that a deterioration of the energy trade balance would not have large effects on the current account and the rest of the economy.

European Commission Member States’ Energy Dependence
96
country is one of the largest consumers of solid fuels in the EU. It not only covers all its solid fuels needs with domestic production but it is also the biggest net exporter in the EU. The main destination countries for Czech exports are Poland, Slovakia and Austria. At the same time, it imports small amounts of solid fuels from Poland while non-EEA countries have only a little share in solid fuels imports (one of the lowest in the EU).
0
20
40
60
80
100
2006 2007 2008 2009 2010
%Graph II.2.2:Czech Republic - Energy mix
Gas Oil Nuclear Renewables Solid fuels
Source: EurostatNote: Non-renewable waste and electricity are excluded
However, total production of solid fuels has been constantly decreasing since 1990, especially that of hard coal which was reduced by 50 % (while the output of all solid fuels combined decreased by more than 40 %). The country's resources of solid fuels are estimated at around 2.4 billion tonnes and they are composed mainly of brown coal(102). Some coal sites are expected to last until 2050, while others should be depleted sooner, by 2020. There are four main mining companies in the Czech Republic: three of them have been privatized, while one (Severoceske Doly, which has a market share of almost 50 % in brown coal production) is still partly owned by the Czech government.
2.1.1.2. Oil
The second source of energy used by the country is oil. It accounted for about 21 % of the country's energy mix in 2010 (one of the lowest shares in the EU) and this share has been virtually stable over the past 20 years. The Czech Republic is dependent on imports for almost all of its
(102) Eurocoal (2012)
consumption, although there is a minor domestic production of about 0.2 Mtoe of crude oil and 0.3 Mtoe of refined products. Oil imports are rather diversified, around 75 % of them are sourced outside the EEA and the main trading partners are Azerbaijan and Russia.
0.0
0.2
0.4
0.6
0.8
1.0
2006 2007 2008 2009 2010
Graph II.2.3:Czech Republic - HHI index energy imports
Gas Oil Solid fuels
Source: Eurostat
There are three oil refineries in the Czech Republic. One of them has recently reported a production halt due to weak oil demand(103). The combined annual capacity of the refineries is about 5.5 million tonnes(104).
2.1.1.3. Gas
Gas is the third source of energy used in the Czech Republic. It accounted for 18 % of the country's energy mix in 2010, 2p.p. higher compared to 2006, while at the same time still below the EU average. The country is almost completely dependent on imports for its supply with nearly 90 % of imports coming from Russia and the remainder from Norway. Therefore, the diversification of import sources is rather limited although the country is not among the worst performers in the EU.
Domestic gas production is marginal and in 2009 accounted for 1 % of the gross inland consumption. Gas consumption amounted to 8,980 billion of cubic meters in 2010, an increase of 10 % compared to the previous year(105). To some extent, the Czech Republic is also a transit
(103) The Prague Post (2012) (104) Unipetrol (2012) (105) National Energy Regulatory Office of the Czech Republic
(2011)

Part II Individual Country Files
97
country for gas coming from either Russia or Norway. In 2009 about 1 Mtoe out of the imported 8 Mtoe was exported towards neighbouring countries.
A well-functioning and interconnected gas market with competitive and market-based prices should provide the correct incentives for further investments and signals to consumers for an efficient and sustainable use of resources. Both elements are conducive to reduce the vulnerability of the country to energy-related shocks.
0
20
40
60
80
100
2006 2007 2008 2009 2010
%
Graph II.2.4:Czech Republic - Non-EEA share of imports
Gas Oil Solid fuels
Source: Eurostat
Gas infrastructures need to be strengthened and gas storage facilities should be expanded. For these reasons, several new infrastructures for gas imports are being developed. The main project started in 2010 is called Gazelle; it will provide further interconnections with Russia via the North Route(106). Another interconnection currently under construction is with the Polish gas networks. Under the umbrella of the European Energy Programme for Recovery, four projects have been financed: one regarding the expansion of the storage capacity of the Gas Storage s.r.o. of an additional working volume of 450 million cubic meters. The remaining three concern the Transmission System Operator and the reverse flow of gas from west to east, to ease the dependence of the Eastern European countries on Russia. Finally, a collaboration agreement was signed in June 2011 between the operators of the Hungarian, Czech and Slovak market areas with the aim to couple the day-ahead spot electricity (106) The North Route comprises the Nord Stream from Russia
to Greifswald in Germany.
markets of the three countries by the end of 2012(107).
The Czech gas market is concentrated, especially at wholesale level and to a minor extent at retail level. RWE Transgas is the main gas importer and trader. In 2010, its market share accounted for 72 % of the Czech wholesale market. The concentration index (HHI) was about 0.53, signalling a high degree of market concentration, although on a downward trend (it was 0.70 in 2009). The total number of importers was 19 in 2010, an increase of 7 compared to 2009.
RWE GasNet is the main regional gas distributor with a market share of just below 30 % in 2010. There are five other regional distributors, three of which belong to the same holding of RWE GasNet(108). In 2010, there were a total of 71 licenced small local distribution operators(109). RWE is the biggest operator on the retail market with a share of 62 % in 2010. The second company on the retail market has market share of 12.5 %.
RWE also operates the transmission system with NET4GAS, s.r.o.(110) which is the Independent Transmission System operator (ITO) of the Czech Republic. RWE is also active in the gas storage business with RWE Gas Storage being the dominant player, owning six out of eight gas storage facilities (i.e. 75 % of the total storage capacity which is around 2.5 bcm(111).
Final consumers' prices are unregulated and are based mainly on long-term supply contracts but also increasingly on short-term spot market prices(112). The price level for industrial users is in line with the EU average, while households
(107) The Czech Republic's market operator OTE a.s. (108) RWE GasNet is a legally unbundled entity of one of the
biggest gas and electricity company in Europe (RWE). (109) Czech Republic (2010): Note that in 2009 this number was
73 (110) Until 3 March 2010 operating under the name RWE
Transgas Net, s. r. o. (111) European Commission (2012a) (112) A total of 189 GWh of gas was traded on the intra-day gas
market in 2011, which was more than triple the volume of gas treaded in 2010 on the intra-day market (OTE's Annual Report 2011). However, this figure is still substantially lower than the amount of gas supplied through bilateral contracts (82,412 GWh).

European Commission Member States’ Energy Dependence
98
consumers' prices expressed in PPS are the sixth highest, significantly above the EU average(113).
2.1.1.4. Nuclear
The fourth energy source used is nuclear which accounted for 16 % of the country's energy mix in 2010, a 10p.p. increase compared to 1990. The Czech Republic has six active nuclear reactors providing currently about one third of the country's electricity. Generation capacity of the six reactors combined is 3,764 net MWe.
The company running the reactors is ČEZ, a 70 % state-owned enterprise. Some EUR 560 million are currently planned to be spent by ČEZ in order to expand the life span of Dukovany reactors. Further investments are also foreseen at Temelin 1&2 reactors to bring their gross capacity from 981 MWe to 1,050 MWe. The construction of two new reactors at Temelin with total estimated output of 2,400 MWe as well as the possibility of building an additional reactor at Dukovany site is currently under discussion. Completion of the projects, if ever started, is foreseen by 2024/2025(114).
Uranium mining, once flourishing in the Czech Republic, is now a residual activity accounting for some 254 tU in 2010 (it used to be 2,500 tU per year until 1990). Some mines' rehabilitation attempts are currently underway; however, for the time being, the largest part of the uranium needs are covered by the Russian company TVEL.
2.1.1.5. Renewables
0
20
40
60
80
100
2006 2007 2008 2009 2010
%Graph II.2.5:Czech Republic - Renewable
mix
Hydro Biomass Wind Solar Geothermal
Source: Eurostat (113) European Commission (2011a) (114) World Nuclear Association (2012)
Renewable energy is the least used source of energy in Czech Republic. It accounts for 6% of its energy mix, or 9.2% of Czech Republic's gross final energy consumption(115). Czech Republic has gradually increased its share of renewables in its gross final energy consumption over the last years, from 6% in 2006. Its binding target for 2020, stipulated in the renewables directive, is 13% share of renewables in final energy consumption.(116)
The fastest rise in renewable energy generation over the last years took place in the electricity sector. In particular, remarkable increases have been recorded in the photovoltaic sector. The installed electricity capacity developed from virtually zero in 2007 to 2 GW, or 8% of total country's electricity generation in 2010. Solar PV generation capacity increased by a factor of 5-10 each year 2008-2010; wind generation capacity also increased, although not so fast, by 15-30% each year. Nevertheless, the share of solar and wind power in total electricity generation remains low, amounted to 0.7% and 0.3% respectively in 2010(117). The total share of renewables in electricity generation amounted to 7%, and hydro power accounted for more than half of it. However, the main source of renewable energy remains biomass used for heating. The share of renewables in heat production amounted to 12%, in transport to 3%.
The Czech Republic has applied generous feed-in tariffs, especially to solar power; they led to a massive deployment of solar PV installations, but also to substantial increase in the costs of support to renewables from 2010. Therefore in 2010 the government introduced a temporary (for 3 years) 26% tax on revenues from solar PV. According to the regulator, without this tax the surcharge on electricity price paid by consumers would have amounted to some 15-20% of electricity price. However, this tax has been
(115) The share of renewables in the energy mix means the share
of renewable energy in gross inland energy consumption. We use this denominator consequently in the EDI to assess the share of each energy source in the energy mix. On the other hand, Member States' renewable targets for 2020 are expressed as a share of renewable sources in final energy consumption, i.e. excluding transmission, distribution and transformation losses. This explains the difference between the two figures.
(116) Czech Republic (2011b) (117) European Commission, DG Energy (2012)

Part II Individual Country Files
99
criticised by investors as retroactively changing the rates of return(118). Following these changes, the support levels in 2011 have been assessed to be slightly below generation costs; for the other RES sources, it seems to be above the average generation costs(119). Given the high costs of support to renewables, there are discussions about its discontinuation for new power plants(120). Renewables in heat are supported mainly through investment incentives and grants and indirectly by incentives to cogeneration. Renewables in transport are promoted through a mandatory share of biofuels and excise duty exemptions. In addition, a specific aid is provided for cultivation of energy crops.
2.2. SECONDARY ENERGY SOURCES
In 2010, the Czech Republic was one of the biggest net exporters of electricity in the EU. On average over the past 5 years it was actually the first net exporter of the EU. The main recipients of its electricity are Slovakia, Germany and Austria.
0
20
40
60
80
100
2006 2007 2008 2009 2010
%Graph II.2.6:Czech republic - Electricity mix
Gas Oil Nuclear Renewables Solid fuels
Source: Eurostat
The electricity mix is heavily dependent on solid fuels. However, the share of solid fuels in electricity production has declined from 70 % in
(118) Kubat, J. and Kennedy, A. (2011) (119) Steinhilber S., Ragwitz M., Rathmann M, Klessmann C.,
Noothout. (2011) (120) Ceska Pozice (2012): In April 2012 the chairwoman of the
Energy Regulator pledged for a complete stop to renewables support schemes in electricity by 2014. She argued that with current trends, the Czech Republic should be able to reach its 2020 targets already in 2013 so the support would no longer be justified after the achievement of the target.
2001 to 55 % in 2010. The country has moved significantly towards nuclear energy (the share of which increased from 20 % to 33 %) and to a lesser extent towards renewables (from 4 % to 8 %). The share of gas in electricity generation is very low (only 5 %) and it did not vary over the past ten years. Interestingly, the country does not use any oil for producing electricity. Total electricity generation was some 71 TWh in 2010, more than 40 % of which came from combined heat and power (CHP), making the Czech Republic one of the largest CHP producers in the EU(121).
Good electricity interconnections and adequate domestic infrastructure capacity are important to shelter the country from supply shocks and to enable a proper absorption of renewables. A competitive and dynamic electricity market should cater the necessary investment incentives and provide the right price signals to consumers.
The country's current grid seems to be able to cope with the highest demand peaks. In 2010, total installed capacity in the Czech electricity grid was 19,034 MW while the peak load was 11,204 MW. However, an issue of electricity intermittence arose reportedly from the increased share of wind power in the generation mix which has affected the capability of the transmission system operator to guarantee a continuous flow of power(122). For this reasons, technical adaptation measures have been undertaken on the grid, especially to strengthen the transit flows with Germany and Austria.
Competition in the electricity wholesale market is improving. In 2010, ČEZ, the main electricity generator, accounted for some 71 % of total generation(123). The Czech transmission system is integrated with those of all the neighbouring countries and electricity is traded cross-border mainly with Poland, Germany and Slovakia within the so-called CEE (Central and Eastern Europe Region). Inbound and outbound capacity is basically equal in the Czech Republic and amounts to some 25/26 TWh in both directions. However, the country does not exploit to the full its import capacity as it has already domestic generation in excess. OTE is an electricity spot-market operator which covers some 10 % of the country's demand.
(121) International Energy Agency. (122) Czech Republic (2010) (123) There is a lack of information on the other generators.

European Commission Member States’ Energy Dependence
100
Electricity is also traded in the Power Exchange Central Europe and through OTC bilateral contracts(124). ČEZ Distribuce is the main distribution system operator which, together with other two companies (E.On and Pre Group), holds more than 90 % of the retail market. However, the degree of competition is slowly improving and there are currently 20 licenced traders in the households and small business sectors.
Competition in electricity retail remains limited. The three main companies supplied almost 90 % of the market in 2010(125).
Final consumers' prices for households are high, well above the EU average(126), while they are much lower for industrial consumers (slightly below the EU average). Network costs account for the bulk of the end-user's prices with a share of 62 % of the final price (taxes excluded), the highest in the EU and the second highest in absolute terms. The main factors behind such high costs are the need to cover the energy loss (for which the Czech Republic was one of the five worst performing Member States in 2005(127) and the costs for connecting renewable energies which have increased four times between 2010 and 2011(128).
2.2.1. Conclusions
The Czech Republic seems to be relatively insulated from security of supply shocks. It has a well-diversified pool of import sources and a rather diversified energy mix. In addition, the overall import dependency of the country was only 26 % in 2010, one of the lowest in the EU.
The Czech Republic, however, could do more to improve the competition in the gas and electricity markets where the incumbents are dominant. (124) "In 2010, 106,169.6 GWh were traded under bilateral
domestic contracts, 22.8 GWh were traded on the block market, 5,786.7 GWh were traded on the coupled day-ahead Czech-Slovak market in the Czech Republic (the total liquidity of both markets was 7,082.1 GWh) and 172.9 GWh were traded on the intra-day market" (the Czech Republic’s National Report on the Electricity and Gas Industries for 2010).
(125) National Energy Regulatory Office of the Czech Republic (2011)
(126) Expressed in PPS; European Commission (2011a) (127) European Environment Agency (2008) (128) National Energy Regulatory Office of the Czech Republic
(2011)
Electricity prices are still higher than the EU average, mainly due to the very high network costs; hence the Czech Republic should pursue with determination projects to upgrade the electricity network in order to reduce energy losses and to shelter it from intermittences caused by renewables. Finally, projects to improve the regional integration of the networks which help ensure the long-term sustainability of the gas and electricity supply, should be pursued.
2.3. ENERGY AND CARBON INTENSITY
The Czech Republic was one of the most energy-intensive economies in the EU in 2010. However, the country has been reducing substantially its energy intensity since 2001 despite the overall increase in energy consumption. This suggests that energy efficiency measures have been successful in decoupling GDP growth from energy use.
Table II.2.1:Energy and carbon intensity
Energy intensity of the economy 1) 375 -9.5CO2 intensity of the economy 2) 1.16 -12.2Share of energy intensive sectors in Gross Value Added 3) 13.9 -0.8
Energy intensity of the economy 1) 152 -4.7CO2 intensity of the economy 2) 0.41 -9.1Share of energy intensive sectors in Gross Value Added 3) 8.9 -0.9Source: Eurostat
2010 percentage change2006 - 2010
memo items: EU27
Notes: 1) Kg of oil equivalent per 1000 EUR, changes in percent; 2) Tonnes of CO2 equivalent per 1000 EUR, changes in percent; 3) percent of total gross value added, changes in percentage points, latest data refer to the year 2009.
The National Energy Efficiency Action Plan (NEEAP) runs for the period 2008-2016. The savings target to be reached by 2016 is an overall decrease in final energy consumption (FEC) by 9 % compared to the baseline level(129). The second National Energy Efficiency Plan (NEEAP) of the Czech Republic shows that the energy saving target for 2010 (1.6 % of the baseline) has been exceeded by almost a third; however the target for 2016 (9 %) will not be met unless additional measures are taken.
The NEEAP lays out several initiatives mainly in the field of cogeneration to bring about the expected savings, partly through the introduction of mandatory requirements for heat and electricity generators and partly through the application of
(129) The baseline is the average annual final energy
consumption over the period 2002-2006.

Part II Individual Country Files
101
feed-in tariffs for electricity produced via cogeneration.
The carbon intensity of the Czech economy is among the highest in the EU. However, it has been on a clearly declining trend since 2001, dropping by almost 50 %.
1.10
1.20
1.30
1.40
350
375
400
425
450
2006 2007 2008 2009 2010
Graph II.2.7:Czech Republic - Energy and carbon intensity of the economy
Energy intensity (lhs) CO2 intensity (rhs)
kgoe/1000 EUR ton CO2 eq./1000EUR
Source: Eurostat
The high percentage of solid fuels in the energy mix is likely to be the main driver behind this bad performance. Solid fuels are heavily used in both electricity and heat generation. In 2009, they were used for 55 % of electricity and 66 % of heat generation (the EU average was only 26 % and 30 %, respectively). Conversely, the share of renewables in both sectors is low: in 2009 they accounted for some 8 % in electricity, compared to an EU average of 18 %, and for 3 % in heat compared to an EU average of 14 %. In addition, this is combined with a characterization of the country's industry in high energy-intensive sectors (see section 2.3.1).
Total GHG emissions have been significantly falling, in 2010 they were 28 % lower than the base year (1995) for the Kyoto protocol. Emissions per capita have also been reduced, from 19 to 13 tCO2-eq.
The Czech Republic seems on the right track to meet its Kyoto Protocol's obligations for 2008-2012.(130) According to the European Environment Agency, the country over-achieved its 2009 target for GHG emissions by 4.4 %.
(130) European Commission (2012b)
In the context of the Effort Sharing Decision(131), the Czech Republic has to limit its emissions in the non-ETS sectors to an increase of 9% by 2020 compared to 2005. Current projections show that the actual level of emissions by 2020 might be between 16 % and 18 % lower than the base year, hence the country would substantially over-deliver on its targets(132).
With regards to the ETS sectors, the Czech Republic's share of GHG emissions covered by the ETS is equal to 54 % well above the EU average of 40 %. Latest reporting shows that the Czech Republic's emissions in 2011 were 14 % below the national cap. As of 2013 there will be an EU-wide emission cap and the level of allowances to be auctioned in the EU will be increased in a linear manner. The Czech Republic has received the authorization to grant free allowances to its power sector during the third phase of the ETS (under article 10c of the ETS directive). The power sector accounts for 88% of the country's total GHG emissions. Factoring in also the current low carbon prices the impacts of the auctioning mechanism on the energy prices is expected to be very limited.
2.3.1. Industry
The energy intensity of the industrial sector is above the EU average however it is not among the worst performers, despite the fact that the Czech Republic's share of energy-intensive sectors in total gross value added is the third highest.
2.30
2.40
2.50
2.60
2.70
150
350
550
750
950
2006 2007 2008 2009 2010
Graph II.2.8:Czech Republic - Energy intensity of industry, carbon intensity of
energy use
Energy intensity of industry (lhs)CO2 intensity of energy use (rhs)
kgoe/1000 EUR ton CO2 eq./1000EUR
Source: Eurostat
(131) Decision No 406/2009/EC (132) European Commission (2011b)

European Commission Member States’ Energy Dependence
102
Industries still account for the largest share of the final energy consumption of the country(133). This share has been decreasing both in absolute and relative terms. The FEC of industries halved between 1990 and 2010, and its share of the total FEC dropped from 1/2 of to 1/3 at present (34 %). However, it is still somewhat higher that the EU average (about 28 %). Despite their weight in total national FEC, Czech industries enjoy a disproportionately lower share in the total FEC savings target for 2016 (accounting for around 24.5 %).
The latest NEEAP expects that industries will miss their original 2016 target by more than a half, and should account for just 11 % of total expected savings in 2016. Metallurgy and chemicals are the two sectors which account of the biggest amount of energy consumption. These sectors have a GVA of significant size and well above the EU average. The energy intensity of the metallurgy sector was increasing over the past ten years while on the other hand the chemical sector's performance improved. The total energy consumption of industries decreased between 2000 and 2010(134); however, the sector's savings accounted for only 9 % of total FEC savings in 2010. This was 45 % less than the absolute value of the 2010 interim target set for industries, and only 10 % of the sector's 2016 target.
It is interesting to note that the carbon intensity of the energy sector remained more or less constant over the past 10 years. As regards the industrial sector, its GHG emissions decreased sharply - many heavy industries have been closed as a result of industrial restructuring.
2.3.2. Transport
The energy intensity of the transport sector is somewhat above the EU average, while still far from the highest levels in the EU. However, unlike the industrial sector, the transport sector experienced an increase in energy intensity over the past 10 years. Furthermore its share in the final energy consumption of the country has soared since 1990 (from 8 % in 1990 to 25 % in 2010(135). The segment mostly responsible for this increase is
(133) European Commission, DG Energy (2012) (134) Czech Republic (2011a) (135) European Commission, DG Energy (2012)
the road transport sector which more than doubled its energy consumption in the past twenty years. Energy consumption of railways on the other hand was and remains negligible.
1.60
1.70
1.80
1.90
2.00
600
605
610
615
620
2006 2007 2008 2009 2010
Graph II.2.9:Czech Republic - Energy and carbon intensity of transport
Energy intensity (lhs) CO2 intensity (rhs)
kgoe/1000 EUR ton CO2 eq./1000EUR
Source: Eurostat
The transport sector is the worst performer in terms of expected savings relative to the original target. The 2016 savings target amounts to 23.3 % of total target savings, as specified in the first NEEAP.(136) However, due to a correction in the calculations of expected savings in the second NEEAP, to account for certain overlapping effects among various energy efficiency measures(137), the expected savings in the transport sector for 2016 fell dramatically to just 853 GWh, which amounts to only 5 % of total expected savings(138). The projected savings up to 2016 will be achieved mainly by tapping the saving potential in the passenger vehicles' segment and by promoting shared and public transport modes.
Carbon intensity of the transport sector has remained fairly stable between 2006 and 2009. It is slightly above EU average but not among the worst performers. However looking at a longer time-span and at the absolute amount of GHG emission, the sector's emissions more than doubled between 1990 and 2009, increasing by 140 %(139).
(136) Czech Republic (2007) (137) (138) Total FEC savings are also expected to fall short of the
original 2016 target (by 9%). (139) European Environment Agency (2010)

Part II Individual Country Files
103
2.3.3. Households
Households' energy intensity in the Czech Republic was substantially higher than the EU average in 2010. Its trend was declining from 2000 until 2009 while in 2010 it almost returned to its 2006 level. As for the transport sector, also the households' final energy consumption increased between 2009 and 2010, albeit moderately, from 6 Mtoe in 2000 to 6.6 Mtoe in 2010.
0.15
0.18
0.20
0.23
0.25
100
105
110
115
120
125
2006 2007 2008 2009 2010
Graph II.2.10:Czech Republic - Energy and carbon intensity of households
Energy intensity (lhs) CO2 intensity (rhs)
kgoe/1000 EUR ton CO2 eq./1000EUR
Source: Eurostat
Households' expenditures on energy products are among the highest in the EU with 13 % in 2010. However, the household sector has been allocated the largest share of the total target FEC savings for 2016. Measures so far implemented have allowed the Czech Republic to achieve savings in the households sector of about 1,300 GWh, exceeding its 2010 interim target by around 46 %, while additional efforts should yield more than 4 times this level of savings by 2016.
According to the second NEEAP, the household sector is the best performer in terms of expected savings relative to the original target for 2016. The main instrument that will be used to achieve the expected results is the Green Saving Programme through which incentives will be provided for renovation of existing buildings or construction of nearly zero-energy buildings. The programme is financed by the sales of the GHG emission allowances.
Carbon intensity of households is somewhat higher than the EU average although not among the highest levels. The absolute amount of
households GHG emissions remained very stable over the past ten years.
2.3.4. Conclusions
The Czech Republic appears to be one of the most vulnerable countries in the EU as far as carbon and energy intensities are concerned. This is due to the fact that both carbon and energy intensities are high albeit on a downward trend. Given the high share of energy-intensive industries in its economy, the country will be relatively more exposed to more stringent climate change policies which might increase energy costs. At the same time the high weight of energy in the HICP basket suggests that citizens would also be hit relatively more than in other Member States.
The Czech Republic has ample margins to improve its performance. While the industrial sector seems to be performing rather well in terms of carbon intensity, more savings and more efficiency could be achieved in the households and transport sectors, by gradually shifting away from solid fuels to less carbon-intensive sources, by supporting a stronger penetration of renewables and by providing the correct price signals to promote a more efficient use of resources.
2.4. CONTRIBUTION OF ENERGY PRODUCTS TO TRADE
2.4.1. Net energy trade balance
The Czech Republic's energy trade deficit which stood at 4.1 % of GDP in 2011 is among the ten highest deficits in the EU. The deficit has slightly increased over the last five years, with some variations probably due to oil price hikes (such as the surge in the deficit in 2008).

European Commission Member States’ Energy Dependence
104
-6
-4
-2
0
-6
-4
-2
0
2007 2008 2009 2010 2011
% of GDP% of GDP
Graph II.2.11:Czech Republic - Trade balance of energy products and CA
CA (lhs) Oil (rhs)Gas (rhs) Total (rhs)
Source: Eurostat
Concerning the two main energy sources, the Czech Republic recorded a trade deficit for oil products of 3 % of GDP in 2011 and a trade deficit for gas of 1.6 % of GDP in 2011 which is relatively large as only five countries have a larger deficit.
The energy trade deficit of the Czech Republic occurs against the background of a rather small current account deficit which in the past five years has varied between 1 % and 3 % of GDP. Hence, the trade surplus for the other product categories can be seen as compensating for the energy trade deficit
2.4.2. Decomposition of the net energy trade balance
The energy trade balance can be decomposed in three multiplicative factors, namely the relative energy trade balance (i.e. the share of net exports in energy products in total cross-border energy trade), the share of energy in total trade and the macro openness to trade (i.e. the ratio of total trade to GDP).
Table II.2.2:Decomposition of Energy Trade Balance
2007 2008 2009 2010 2011Energy trade balance (% GDP) -3.3 -4.3 -2.9 -3.4 -4.1Relative trade balance (%) -48.0 -49.5 -42.7 -41.4 -42.2Share of energy in total trade (%) 5.2 6.8 6.1 6.3 6.7Macro trade openness (% GDP) 133.1 127.3 110.5 131.2 145.5Source: Eurostat
The Czech Republic does not stand out as regards the relative energy trade either. The relative trade balance for electricity is actually positive since the country is a net exporter. The relative trade balance for gas reached an all-time low in 2010
while the one for oil has been steady at around -70 % for the past five years.
As the Czech Republic has a very open and diversified economy, its macro openness to trade ranks among the highest in the EU, while the share of energy in total trade is one of the lowest. These two factors have opposite effects in the translation from the relative energy deficit to the one in GDP terms (and vice versa).
The low share of energy products in total trade together with the low energy import dependency suggests certain robustness in the external dimension of energy dependency. As witnessed in the changes from 2007 to 2008, a sharp increase in the energy trade deficit can go along with a marked improvement of the current account.
2.4.3. Conclusions
The Czech Republic does not seem particularly vulnerable in terms of the external dimension of energy dependency. The energy trade deficit albeit sizeable is combined with a modest and manageable current account deficit. In addition, the significance of energy in total trade is very small suggesting that a deterioration of the energy trade balance may have limited impacts on the current account. Finally, the low import dependency of the country further mitigates the risks related to possible shocks in the energy terms of trade.
2.5. REFERENCES
Ceska Pozice (2012), "Czech power regulator seeks to stamp out renewables support", Ceska Pozice, 25 April, available from: http://www.ceskapozice.cz/en/business/energy-green-biz/czech-power-regulator-seeks-stamp-out-renewables-support
Czech Republic (2007), First National Energy Efficiency Action Plan, available from: http://ec.europa.eu/energy/efficiency/end-use_en.htm
Czech Republic (2010), National Report on the Electricity and Gas Industries.
Czech Republic (2011a), Second National Energy Efficiency Action Plan, available from: http://ec.europa.eu/energy/efficiency/end-use_en.htm
Czech Republic (2011b), National Renewable Energy Action Plan 2010-2020, available from: http://ec.europa.eu/energy/renewables/action_plan_en.htm
Eurocoal (2012), Country Profile: Czech Republic, available from: http://www.euracoal.be/pages/layout1sp.php?idpage=80

Part II Individual Country Files
105
European Commission (2011a), 2009-2010 Report of Progress in creating the internal gas and electricity market.
European Commission (2011b), Annual Growth Survey 2012, Europe 2020 targets: climate change and energy, COM (2011) 815 of 23 November
European Commission, Directorate-General for Energy (2012), Country Factsheets, available from: http://ec.europa.eu/energy/observatory/countries/countries_en.htm
European Commission (2012a), Making the Internal Energy Market Work, COM (2012) 663, SWD (2012) 367 and 368.
European Commission (2012b), Progress towards achieving the Kyoto Objectives, COM (2012) 626 of 24 October.
European Environment Agency (2008), Energy and Environment Report.
European Environment Agency (2010), GHG trends and projections in the Czech Republic.
Eurostat (2012), Energy Statistics, available from: http://epp.eurostat.ec.europa.eu/portal/page/portal/energy/data/main_tables
International Energy Agency, 2009 Energy balance for the Czech Republic, available from: https://www.iea.org/stats/balancetable.asp?COUNTRY_CODE=CZ
Kubat, J. and Kennedy, A. (2011), Feed in tariffs in selected EU countries, Energy Prices and Taxes, International Energy Agency.
National Energy Regulatory Office of the Czech Republic (2011), Annual Report.
The Prague Post (2012), "Weak fuel demand shuts Pardubice oil refinery", The Prague Post, 30 May, available from: http://www.praguepost.com/business/13284-weak-fuel-demand-shuts-pardubice-oil-refinery.html
Steinhilber S., Ragwitz M., Rathmann M, Klessmann C. and Noothout P (2011), Indicators assessing the performance of renewable energy support policies in 27 Member States, D17 Report of RE-Shaping project.
Unipetrol (2012), Unipetrol Group website: http://www.unipetrol.cz/en/about_us/
World Nuclear Association (2012), Nuclear Power in the Czech Republic, available from: http://www.world-nuclear.org


3. ESTONIA
107
3.1. SECURITY OF ENERGY SUPPLY
Estonia's import dependency is one of the lowest in the EU. It stood at 13 % in 2010 compared to 28 % in 2006.
At the same time the country's energy mix is one of the least diversified in the EU. In 2010 the HHI equalled 0.47, denoting deterioration from 2006 when it was 0.39.
3.1.1. Primary Energy Sources
3.1.1.1. Solid fuels
Oil shale is the largest source of primary energy in Estonia, accounting for more than 60 % of Estonia’s primary energy supply in 2010 (compared to 50 % in 2006). This is the largest
Key Insights
Security of Energy Supply:
- The very limited import dependency of Estonia acts as a mitigating factor to security of supply risks. However, the country appears as one of the most vulnerable Member States for this dimension because it relies almost exclusively on solid fuels in its energy and electricity mix. In addition, gas, one of the main alternative sources to solid fuels, is essentially imported through one supplier outside the EEA area.
- Domestic production of solid fuels helps shelter Estonia from supply shocks. A reduction in solid fuel consumption due to depletion of resources or due to climate change policies could potentially increase Estonia's vulnerability profile.
Energy and Carbon Intensity:
- Estonia is one of the worst performing countries in the EU in terms of energy and carbon intensity.
- The position of the country significantly deteriorated between 2006 and 2010. All sectors, excluding industries, deteriorated their performances in terms of energy intensity. The transport and energy sectors also increased their carbon footprint.
- Energy and climate change policies could provide more price signals to Estonian citizens to induce them to consume energy more efficiently.
Trade balance for energy products:
- Estonia is one of the best performers in the EU in terms of the trade balance for energy products. The situation significantly improved between 2007 and 2011.
- The good record is the result of an improved current account balance and of a good performance of the oil trade which has led to a significant reduction of the total energy trade deficit.

European Commission Member States’ Energy Dependence
108
share for solid fuels in the EU and translates into one of the least diversified energy mixes in the EU.
Yet, all solid fuels (except hard coal) consumed in Estonia are based on domestic resources. As a matter of fact, Estonia was a net exporter in 2009 and 2010. Therefore, the combination of a high share of solid fuels in the energy mix and the exclusive use of domestic solid fuel resources translates into the third lowest import dependency ratio in the EU. Importantly, it has not been possible to find any evidence on the state of oil-shale resources in Estonia, i.e. on whether oil-shale resources are expected to be depleted in the near future.
3.1.1.2. Oil
The second source of energy used in Estonia is oil. It accounted for 17 % of gross inland consumption in 2010 compared to 21 % in 2006. In 2010 Estonia imported 56 % of all the oil used domestically. The situation has significantly improved in recent years as oil import dependency was 75 % in 2006. Import sources are quite diversified and most importantly nearly 70 % of all imports come from EEA countries, an element which helps to mitigate potential supply risks.
3.1.1.3. Renewables
Renewable energy is the third energy source in Estonia. It accounts for 14% of its energy mix, or 24.3% of Estonia's gross final energy
consumption(140). Estonia has substantially increased its share of renewables in gross final energy consumption over the last years, from 16% in 2006, and is very close to reaching its binding target of 25% by 2020,(141) as required by the renewables directive.
This high share of renewables is mainly due to the widespread use of biomass for heating purposes. Biomass heat is the main source of renewable heating is Estonia, and a variety of domestic firewood products is being used to this end (including wood waste, briquettes, and pellets). The share of RES in heating is 43%, one of the highest in the EU. In electricity, Estonia reached a RES share of 8%, a major increase from 1% in 2006. Biomass and biogas still represents almost 70% of renewable electricity, but wind power expands rapidly since 2008. In transport, the share of RES is 0.2% according to the latest statistics, the lowest in the EU.
The key support instrument for renewable production is feed-in premium. Its level is the same for all the technologies and amounts to 53.7 €/MWh(142). The level of support was reduced in 2010, when the previously feed-in tariff was
(140) The share of renewables in the energy mix means the share
of renewable energy in gross inland energy consumption. We use this denominator consequently in the EDI to assess the share of each energy source in the energy mix. On the other hand, Member States' renewable targets for 2020 are expressed as a share of renewable sources in final energy consumption, i.e. excluding transmission, distribution and transformation losses. This explains the difference between the two figures.
(141) Republic of Estonia (2011b) (142) Winkel T. et al (2011)

Part II Individual Country Files
109
revoked. The main reason for this change was that the cost of renewable energy for consumers was too high; according to an assessment made by the Estonian Competition Authority in 2009, electricity price increased due to support to renewables by 10.4%. Nevertheless, the current support level seems still too high in comparison to electricity generation costs(143). Therefore the Estonian Ministry of Economy intends to reduce renewable energy subsidies starting 2013 and to set a ceiling on renewable energy generation. There is no support to renewables in heat and transport, apart from heat produced in an efficient cogeneration regime.
3.1.1.4. Gas
The fourth energy source used in Estonia is gas. In 2010, it represented 9 % of Estonia’s gross inland energy consumption, down from 15 % in 2006, one of the lowest shares among the Member States. Estonia imports all gas that is locally consumed and relies exclusively on Russia for its imports. Although Estonia is less dependent on total energy imports than other Member States, it was nonetheless significantly affected by the Russia–Ukraine gas crisis of 2009.
A well-functioning and interconnected gas market with competitive and market-based prices should provide the correct incentives for further investments and signals to consumers for an efficient and sustainable use of the resources. Both elements are conducive to reduce
(143) Steinhilber S., Ragwitz M., Rathmann M, Klessmann C.
and Noothout. (2011)
the vulnerability of the country to energy-related shocks.
Currently, Estonia's gas grid has connections only with Russia and Latvia while it is isolated from the rest of the EU. In addition, Estonia does not have gas storage capacity at present(144). AS Eesti Gaas, the only gas importing firm, has concluded a contract with Gazprom for the supply of gas until the end of 2015, with a daily volume of 7 million m³. Such a gas quantity is sufficient for securing strategic supply of gas to Estonia. Yet, according to the Estonian Competition Authority (which is also the energy regulator), in order to improve security of supply, construction of a connection between Estonia and Finland would be important(145). There is a plan for the construction of the Balticconnector gas pipeline connecting Finland, Estonia and Latvia. The project has not yet received final approval and according to the latest information available, the construction of the gas pipeline will not start before 2013. Several investors have indicated an interest in building a liquefied natural gas (LNG) terminal in the northern shores of Estonia. The Competition Authority considers that an LNG terminal in conjunction with the Balticconector would improve security of supply both in Estonia and Finland and would also activate competition in the wholesale market.
Preconditions for emerging of competition in the gas wholesale market are practically non-existent under the current circumstances. The
(144) European Commission (2012) (145) Estonian Competition Authority (2012)

European Commission Member States’ Energy Dependence
110
gas supply network historically formed part of the Soviet gas supply system. Estonia therefore has only cross-border connections with Russia and Latvia and the only source of supply is Russia. The Estonian gas market is small, with the largest share of gas being used for industrial purposes and heating and only a small amount for electricity generation. As mentioned above, Eesti Gaas is the only importer of gas in Estonia and therefore has a dominant position in the market.
Contrary to the wholesale market competition in the retail market has been activated. Various gas sellers buy gas from Eesti Gaas and are competing in its reselling. Wholesale prices and retail prices for eligible customers are no longer regulated. Gas prices for household consumers are the third lowest in the EU. Even considering gas prices in PPS, they still remain below the EU average. Gas prices for industrial customers are slightly below the EU average.
3.1.2. Secondary Energy Sources
Estonia has been for several years (except in 2009) a net electricity exporter. In 2010, it was the biggest exporter in the EU. More than 90 % of the electricity is generated in oil shale based power plants.
Good electricity interconnections and adequate domestic infrastructure capacity are important to shelter the country from supply shocks and to enable a proper absorption of renewables. A competitive and dynamic electricity market should cater the necessary investment incentives and provide the right price signals to consumers.
At present, the Estonian electricity system is primarily connected with other former Soviet states and has interconnections with the EU electricity markets through Estlink1. It also recently joined the Nordpool electricity exchange. However there remains limited interconnection capacity between Estonia and Latvia which creates bottleneck on the electricity market of the area hampering its liquidity. Estonia is part of the Baltic Energy Market Interconnection Plan (BEMIP) that provides a comprehensive Action Plan on energy interconnections and market improvement in the Baltic Sea Region, both for electricity and gas. The main objective is to end the relative "energy isolation" of the Baltic States and integrate them into the wider EU energy market. Internal market barriers had to be cleared in order to make investments viable and attractive. This involved aligning regulatory frameworks to lay the foundation for the calculation of a fair allocation of costs and benefits, thus moving towards the "beneficiaries pay" principle. The European Energy Programme for Recovery (EEPR) was a clear driver for timely implementation of infrastructure projects.
The EU's Strategy for the Baltic Sea Region has also provided a bigger framework for the energy infrastructure priority. The strategy already proposed a framework to focus existing financing from structural and other funds into the areas identified by the strategy as priority areas. In case of an unexpected and sudden loss of production capacity from existing power plants, Elering, the Estonian electricity transmission system operator, and Wärtsilä, a Finnish supplier of power plants, have signed a contract to build two complete reserve power plants in Estonia. The total value of the project is EUR 129 million, which is about 0.9 % of Estonian GDP in 2010. The project will be completed in two stages, by spring 2013 and by autumn 2014. At the moment, Estonia does not have reserve power plants and reserve supply is bought from Latvenergo on the basis of a contract that expires in 2013. The new station will be able to operate on two different fuels, gas and diesel, and will have an on-site storage facility. According to Elering, in recent years Estonia has needed to call on the emergency reserve for about 200 hours per year.
The electricity production in Estonia is controlled by the largest energy company Eesti

Part II Individual Country Files
111
Energia which has 91 % of the installed net capacity and in 2009 produced 92 % of the total generation. More than 90 % of electricity was produced from oil shale. By 2013 Estonia has to fully open its electricity market. In 2010 the main retailer had a market share of 88 % while the second and third operators had market shares around 5 %, signalling a very limited competition. Besides, eligible customers may buy electricity at regulated price but can also choose to buy it in an open market instead; however, so far only 33 % of consumers are "eligible" and can switch supplier.
Electricity prices in Estonia are the third lowest among Member States for households and the fourth lowest for industrial consumers, and remain below the EU average when considered in PPS. In 2009 the Estonian Competition Authority provided an assessment of the Estonian support schemes for renewable electricity and its impact on electricity prices(146). According to the analysis, the electricity price increase induced by this support scheme was about 10.4 % in 2009. With the latest amendment to the support scheme this share is now expected to be around 20 % (see section 3.1.1.3).
Climate policies aimed at reducing the carbon footprint of the country could also have an impact on electricity prices. According to the Estonian energy regulator, the production of 1 MWh of electrical energy from oil shale is accompanied by approximately 1 ton of CO2 emissions. Thus, if all needed CO2 quantity should be bought at the market price this could increase the electricity price. For more climate policies see section 3.2.
3.1.3. Conclusions
Estonia appears as one of the most vulnerable Member States in terms of security of energy supply. The main reasons behind the concern are the facts that the country relies almost exclusively on solid fuels in its energy and electricity mix and that gas, one of the main alternative sources to solid fuels, is only imported through one supplier outside the EEA area. The very limited import dependency of the country is, however, a mitigating factor to be taken into account. The domestic production of solid fuels shelters Estonia from external shocks. At the same time, the state (146) Estonian Competition Authority (2010), pages 56-58
of the current reserves of oil shale needs to be better assessed. In any case, even in the presence of sufficient reserves, solid fuels represent one of the most carbon-intensive energy sources and their consumption will have to be progressively reduced in order to meet the climate change targets. Once such a reduction has taken place, the country could potentially be more exposed to energy supply shocks than others.
Diversifying the energy mix as early as possible and continuing the efforts to integrate the gas and electricity networks with other Member States would contribute to reducing further the exposure to supply or price shocks. Given the high share of renewables in electricity that Estonia has to achieve, it will also be fundamental to adapt the electricity network in order to absorb the increasing renewable energy generation.
3.2. ENERGY AND CARBON INTENSITY
In 2010 Estonia had one of the most energy-intensive economies in the EU. Its position has further deteriorated since 2006. Overall, in the period 1996-2009, the energy efficiency improvement was substantial as energy intensity of the economy decreased by 37 % (i.e. a reduction of 3.5 % per year). Since 2000 the overall energy efficiency improvement was more modest, and almost negligible since 2005. Final consumption of energy increased by 8.7 % between 2001 and 2005, largely driven by consumption growth in the transport sector. In the end, energy intensity in Estonia remains more than 3 times higher than the EU average.
The dependence on oil shale for power generation seems to be an important factor behind the high energy intensity of Estonia’s economy.

European Commission Member States’ Energy Dependence
112
The National Energy Action Plan (NEEAP) runs for the period 2008-2016.(147) The savings target to be reached by 2016 is an overall decrease in final energy consumption (FEC) by 9 % compared to the baseline level(148). The second NEEAP of Estonia states that the interim energy saving target for 2010 was reached (3 % of the baseline).(149) The target for 2016 is also expected to be met, and most likely exceeded.
The carbon intensities of Estonian economy and of its energy sector are among the highest in the EU. This is not surprising given the use of oil shale, a solid fuel, as its primary energy source. Carbon intensity levels have actually increased between 2006 and 2010.
However, GHG emissions have been steadily declining since 1995, reducing by almost a half. In terms of reduction of GHG emissions per capita, Estonia has been one of the best performers in the EU going from 26 tCO2-eq in 1990 to 15 tCO2-eq. Estonia has hence overachieved by almost 40 % its Kyoto target obligation for the period 2008-2012.(150) Despite this drastic decrease, the country still has one of the highest shares of GHG emissions per capita in the EU.
(147) Republic of Estonia (2007) (148) The baseline is the average annual final energy
consumption over the period 2001-2005. (149) Republic of Estonia (2011a):The measured level of energy
savings (equivalent to 2.88 PJ) was taken from 2009; although this falls short of the 2010 target of 3.3 PJ, the government expects this gap to have been closed in 2010. At the time of reporting, the government lacked sufficient data to calculate energy efficiency gains made in 2010.
(150) European Commission (2012)
In the context of the Effort Sharing Decision(151), Estonia has to limit its emissions in the non-ETS sectors to an increase of 11 % by 2020 compared to 2005 levels. Current projections estimate that the country should be able to reach its targets with the existing measures and if additional initiatives were undertaken it could actually decrease by 2% its emissions compared to 2005(152).
With regards to the ETS sectors, the share of emissions falling under the ETS is very high in Estonia, accounting in 2010 for 70 %, the highest share in the EU. In addition, these sectors have been emitting substantially more than their 2008-2012 cap exceeding by more than 20 % the cap in both 2010 and 2011. To date, most allowances in the EU ETS have been allocated free of charge but during the third phase of the ETS starting in 2013 more and the level of emissions to be auctioned will increase in a linear manner. The impact of such auctioning on the Estonian economy might, however, be limited given that 99 % of Estonian emissions originate from the power sector which will keep receiving free allowances due to the derogation granted to Estonia pursuant to Article 10c of the ETS Directive.
3.2.1. Industry
In 2010, the energy intensity of industry in Estonia was significantly higher than the EU average. The share of energy-intensive sectors in total economic activity in Estonia is also above the EU average. Important improvements in energy intensity have been achieved since 2006 despite the fact that this share remained stable. Industry made a major contribution to the increase of aggregated efficiency: over the period 1996-2009 there was a reduction of energy intensity of industry by 72 % (i.e. a reduction by 9.4 % per year). During 2000-2009 the efficiency increase was slower but still high: energy intensity decreased by 6.8 % per year. The share of energy-intensive industries in total gross value added is a little higher than the EU average, yet much lower than in the other EU-12 Member States.
(151) Decision 406/2009/EC (152) European Commission (2011)

Part II Individual Country Files
113
Assessing the performances of the various sectors of Estonian industries, some conclusions can be drawn: energy intensity of manufacturing industry is more or less in line with the EU average; energy intensity of mining and quarrying sector, an important sector in Estonia’s economic activities, significantly improved over the last five years but remains above the EU average; a particularly fast improvement took place in the chemical industry, mainly due to the reorganisation of oil shale processing. However, Estonia's chemicals industry and the non-metallic mineral sector remain among the most energy-intensive industries of the EU. In part the energy efficiency improvements in industry have been triggered by policy measures; in particular the National Programme for Abatement of Greenhouse Gases for 2003-2012 as well as obligations of the European Emission Trade System may have played a role.
Accounting for around a fifth of total FEC in Estonia in 2005, the industrial sector had a higher than proportional share of the total target energy savings for 2016: 27 %. The absolute value of this target is likely to be met by 2016, although this is expected to represent a smaller share of total energy savings due to a forecasted outperformance in the transport sector.
According to the Second NEEAP, the bulk of the energy savings in the industrial sector by 2020 should come from a reduction in the use of ordinary fuel and from a reduction of electricity consumption. Measures to achieve these targets include encouragement to perform energy audits in industries and small enterprises, better financing
opportunities for energy conservation measures in industries and small enterprises, and development of databases and methods for the benchmarking of companies.
3.2.2. Transport
The energy intensity of the transport sector is significantly above the EU average and has actually increased compared to 2006. Considering results per transport mode, it seems that road transportation is relatively energy-inefficient due to one of the oldest car fleet in the EU which is less fuel efficient than the EU average. Moreover, the share of rail and inland waterways freight transport in total freight transport as well as the share of public transport in total passenger transport steadily decreased over the last ten years. At the same time, the energy intensity of the aviation sector is well below the EU average.
The savings target for the transport sector by 2016 represents around a fifth of total target savings, roughly in proportion to the sector's share of total FEC in the economy in 2005. Some energy efficiency-related measures are planned in the Transport Development Programme for the years 2006–2013. The main objective is to stabilize the absolute amounts of GHG emissions from transport. Increasing the share of public transport has been foreseen as a key measure to reach this target. Estonia has a surplus (85 million units) of Kyoto Protocol assigned amount units (AAU). Part of the revenues from sales of surplus AAUs will be used for investments in electric road transport. Nevertheless, the main energy conservation

European Commission Member States’ Energy Dependence
114
measure in the transport sector is expected to be excise duties on motor fuels.
The excise duties on unleaded petrol and diesel were increased to the EU minimum levels as of 1 January 2008, two years earlier than the transition periods granted to Estonia would require, and are regularly adjusted. The excise duty on light heating oil, which already exceeded the EU minimum level, was also increased, and taxes on natural gas (at the EU minimum level) and electricity (well above the EU minimum level) were introduced as part of the green tax reform. Finally, the tax exemption of shale-driven fuel has been abolished in 2008.
Given calculations of the energy saving potential of these implemented and planned measures for the sector over the period 2008-2016, the second NEEAP foresees the transport sector to exceed its absolute savings target for 2016 by almost 30 %, outperforming both the household and industrial sectors.
The carbon intensity of the transport sector has increased between 2006 and 2010 and is among the highest in the EU. GHG emissions from transport – as compared to the value added of the sector – are above the EU average, but decreased significantly over the last ten years. However, GHG emissions from transport, in absolute terms, are high and rising. The number of road vehicles – passenger cars, trucks, buses and motorcycles – has increased considerably since 1990 while the use of public transport has decreased over the same period.
3.2.3. Households
Households' energy intensity was one of the highest in the EU in 2010 and, as for transport, it increased between 2006 and 2010. Electricity consumption for lighting and electric appliances has increased at a faster rate than in the EU as a whole. Moreover, consumption per dwelling for space heating has decreased at a slower rate than the EU average. Finally, consumption per dwelling scaled to the EU average climate is below average but decreasing at a slower rate than in the rest of the EU.
The issue of absorption of the structural funds for renovation of buildings and infrastructure remains key. Estonia is running into capacity constraints, which could endanger progress in this area. Some progress has already been achieved, and an important factor has been the introduction of heat metering (including hot water meters in apartments). The specific heat consumption in new dwelling houses is lower due to stricter thermal standards in building codes. At the same time, there is an opposite trend – new dwellings are larger and higher living standards need more energy.
In 2003, Estonia started to support the refurbishment of apartment buildings built before 1990. The assistance covers 10 % of the renovation costs. To conduct inspection and energy audits, the apartment association may apply for a subsidy in the amount of 50 % of the inspection or audit cost. A regulation of the government from December 2008 stipulates stricter minimum requirements for the energy performance of buildings. Tallinn University of Technology has started training courses for energy auditors. The energy efficiency certificates for buildings are issued since January 2009. Starting from the end of 2010, Estonia has successfully sold a great amount of AAUs. The revenues from the sales are used according to the relevant Green Investment Scheme (GIS). According to current plans of GIS, almost 500 buildings in the public sector will be refurbished into more energy efficient ones.
Households were allocated around 38 % of the total savings target for 2016, in proportion to

Part II Individual Country Files
115
their share of total FEC in 2005. However, the sector has lagged behind the industrial and transport sectors in meeting its interim 2010 target; actual consumption of heat and electricity by households were higher than forecasted for 2010 (13 % and 8 % higher, respectively).(153) Nevertheless, the second NEEAP's calculations of expected energy savings from buildings and appliances, which roughly proxy for household consumption, suggest that the overall 2016 target for the sector will be met.
Households' carbon intensity is also one of the highest in the EU but has slightly decreased between 2006 and 2008. The weight of energy in the HICP basket in Estonia is 13.3 %, 3.3p.p. above the EU average. Electricity, gas and other fuels accounted for 4.8 % of final consumption expenditures in 2009, compared to an EU average of 4.2 %. Therefore any variation in energy prices could affect Estonian consumers proportionally more than the citizens of other EU Member States.
3.2.4. Conclusions
Estonia is one of the worst performing countries in the EU in terms of energy and carbon intensity. The situation of the country significantly deteriorated between 2006 and 2010 suggesting that efforts undertaken to reduce the energy use and to limit carbon emissions were not sufficient. Energy efficiency measures, especially for households and transport, need to be strengthened and better implemented.
The main issue also for this dimension is the overreliance of the Estonian economy on solid fuels. Any attempt to adopt more stringent climate policies reducing the consumption of solid fuels could lead to higher energy prices. This may provide price signals to Estonian households to make better use of energy resources. Impacts on industry might be instead rather limited due to the better energy efficiency performance of the sector and to the relatively lower amount of energy-intensive sectors in the country.
The situation of the transport sector appears particularly problematic both in terms of energy and carbon intensity and it should be addressed
(153) The opposite trend was observed in the transport sector,
where changes were more favourable than expected.
with stronger determination by the government by promoting public transportation, a wider use of renewables and introducing fuel taxes able to provide correct price signals to consumers.
3.3. CONTRIBUTION OF ENERGY PRODUCTS TO TRADE
3.3.1. Net energy trade balance
The energy trade deficit of Estonia was quite small in 2011 (1.3 % of GDP), one of the smallest in the EU. Over the past four years, the deficit has been steadily decreasing.
In terms of trade deficit for the different product categories, it is interesting to observe that while the gas deficit remained stable at 1.1 % of GDP between 2007 and 2011, the oil deficit decreased markedly, from 3.1 % in 2007 to 1.5 % of GDP in 2011, contributing to the overall reduction of Estonia's energy trade deficit. The reduction in import dependency for oil, the diversification of import sources and the increase in exports of oil products have contributed to the oil trade deficit reduction.
The size of the energy trade deficit should be seen against the background of the country's current account balance. The current account has recorded a sharp improvement, even more remarkable than that of the energy trade balance: Estonia's current account turned from a deficit of15.9 % in 2007 into a surplus of 3.2 % of GDP in 2011.

European Commission Member States’ Energy Dependence
116
3.3.2. Decomposition of the net energy trade balance
The energy trade balance can be decomposed into three multiplicative factors, namely the relative energy trade balance (i.e. the share of net exports in energy products in total cross-border energy trade), the share of energy in total trade, and the ratio of total trade to GDP (macro openness to trade).
Estonia has currently one of the highest shares of energy trade in total trade in the EU. The country reduced its energy trade deficit between 2007 and 2011 in spite of the fact that the share of energy trade in total trade increased over the same period from 13 % to 17 %, thanks to the simultaneous drastic reduction of the relative trade balance for energy products.
Estonia’s relative trade deficit for energy products decreased from 22 % to 4 % between 2007 and 2011. Petroleum products represent the vast majority of trade in energy products (85 % of imports and 85 % of exports. The relative trade deficit for petroleum products went down from 83 % in 2001 to only 11 % in 2011. This is mainly explained by the sudden increase in exports of petroleum, petroleum products and related materials. The reason seems to be that Estonia's port of Tallinn is increasing in importance as a transit centre for oil product exports from Russia to Europe.
Unsurprisingly, the relative trade balance is strongly negative for gas products, as we have seen already that Estonia imports almost all its energy needs in gas. Conversely, Estonia is a significant relative net exporter of solid fuels, although the size of trade in solid fuels represents only about 10 % of the size of trade in petroleum products.
3.3.3. Conclusions
Estonia is one of the best performers in the EU in terms of trade balance for energy products. The performance seems to be due to the combination of a strong change in size and sign of
the current account balance and of the good performance of the oil trade which has led a significant reduction of the total energy trade deficit. Given the importance of energy items in the total trade of the country it will be important for Estonia to maintain such an external position in order to avoid potential negative spill overs on the current account. Improvements in cross-border trade with other EU countries for electricity and gas and a more efficient use of energy should contribute to preserving the country trade performance and to insulating it further from potential energy shocks and macroeconomic imbalances.
3.4. REFERENCES
Estonian Competition Authority (2010), Estonian Electricity and Gas Market Report 2009, available from: http://www.konkurentsiamet.ee/?id=14463
Estonian Competition Authority (2012), Estonian Electricity and Gas Market Report 2011, available from: http://www.konkurentsiamet.ee/?id=14463
European Commission (2011a), Annual Growth Survey 2012, Europe 2020 targets: climate change and energy, COM (2011) 815 of 23 November
European Commission (2012), Progress towards achieving the Kyoto Objectives, COM (2012) 626 of 24 October.
Republic of Estonia (2007), First National Energy Efficiency Action Plan, available from: http://ec.europa.eu/energy/efficiency/end-use_en.htm
Republic of Estonia (2011a), Second National Energy Efficiency Action Plan, available from: http://ec.europa.eu/energy/efficiency/end-use_en.htm
Republic of Estonia (2011b), National Renewable Energy Action Plan 2010-2020, available from: http://ec.europa.eu/energy/renewables/action_plan_en.htm
Steinhilber S., Ragwitz M., Rathmann M, Klessmann C. and Noothout P (2011), Indicators assessing the performance of renewable energy support policies in 27 Member States, D17 Report of RE-Shaping project.
Winkel, T. et al (2011), Renewable Energy Policy Country Profiles, RE-Shaping project, Intelligent Energy Europe

4. GREECE
117
4.1. SECURITY OF ENERGY SUPPLY
0
20
40
60
80
100
2006 2007 2008 2009 2010
%Graph II.4.1:Greece - Import dependence
Gas Oil Solid fuels Total
Source: Eurostat
4.1.1. Primary Energy Sources
Greece has a high energy import dependency as it sources almost all its oil and gas from abroad, amounting to almost two thirds of its gross inland
energy consumption. Overall the diversification of the energy mix is rather limited in comparison with other EU Member States.
4.1.1.1. Oil
For more than half of its energy consumption, Greece has depended on imported oil. On average, the share of oil and oil products in gross inland consumption has been 55% in the period 2006 – 2010. Almost all of it is imported as domestic production of crude oil is very small. Therefore, the small variation around the average value of 100% mainly reflects variations in storage.
Key Insights
Security of Energy Supply:
- For over half of its energy consumption Greece depends on imported oil. This makes the country one of the most vulnerable in the EU in terms of security of energy supply, also because the oil comes from outside the EEA.
- The ensuing risks for the security of energy supply are diminished by the strong diversification of oil suppliers and diversification over the other energy sources as testified by the on-going increase in the use of gas and renewables.
- The on-going restructuring of the energy sector has been complicated by the effects of the economic recession, as illustrated by the increases in electricity prices necessary to recover costs and phase-out price regulation. In particular, the dominance of the incumbent electricity company, the lack of effective competition and the debts accumulated in the sector require a comprehensive policy follow-up.
Energy and Carbon Intensity
- Greece does not stand out in the EU as regards the energy and carbon intensity of the whole economy. However, the carbon intensity of its energy production is among the highest in the EU due to its reliance on lignite. Policy actions aimed at reducing the carbon emission in the energy sector render further electricity price increases quite likely. While Greece has met its Kyoto targets partly because of the economic recession, recent projections have identified a shortfall to the 2020 target for the Greek non-ETS sector.
Trade balance for energy products
- Greece's energy trade deficit was one of the lowest in the EU in 2011 but it remains a concern because of the stubbornly high current account deficit. This is also because the recent fall in the energy trade deficit may be temporary, as it is related to the very deep recession.

European Commission Member States’ Energy Dependence
118
0
20
40
60
80
100
2006 2007 2008 2009 2010
%Graph II.4.2:Greece - Energy mix
Gas Oil Nuclear Renewables Solid fuels
Source: Eurostat
The high dependence on oil presents a significant security of supply risk also because 90% of the oil is sourced from outside of the EEA area. Russia, Saudi Arabia and Iran all used to supply almost one third of the oil imports. In recent years, Saudi Arabia and Iran's share have been falling, the latter one must have fallen to zero after 2010 (the last year of observation of the trade data indicating country of origin), in view of the EU's oil boycott which fully entered into force July 2012. Other countries have been stepping into the void, such as Libya, Iraq and Kazakhstan. The diversification over various supplying countries helps to limit the risk of supply disruptions. The HHI of oil imports is fairly low, but not among the lowest in the EU.
Greece's oil refinery capacity is one of the largest in the region which may help to somewhat reduce the supply risk since it arguably attracts crude oil supply. However, one could also interpret it as a further exposure as it constitutes an important economic activity for the country. Roughly one third of the produced oil products are exported and one third is used in the domestic transport sector(154). The refinery market is heavily regulated and highly concentrated as two firms, Hellenic Petroleum (partly owned by the government) and Motor Oil Hellas, own all the domestic refinery capacity and have 70% of the wholesale market. Both domestic and EU
(154) In caloric terms, the source is the IEA's 2009 energy
balance (IEA, 2011). In terms of the sum of imports and refinery output (the more correct measure), exports and domestic transport have a respective share of 28 and 29%.
regulators have noted a basic lack of competition on these domestic markets.
Greece reportedly has a good but currently largely unexplored potential for finding and exploiting domestic off-shore oil. Hence the uncertainties are currently far too large for changing the energy policy priorities. While Energean Oil & Gas (a.k.a. Aegean Energy), the dominant player in oil and gas exploration and exploitation, has recently significantly increased the production from the offshore fields in operation and its exploration activities in the same zones, the Greek government has reportedly put a first series of licenses on offer for hydrocarbon exploration in three offshore zones(155).
4.1.1.2. Solid fuels
Solid fuels are the second energy source used in Greece as they account for a solid quarter of gross inland consumption. With this share, Greece belongs to the countries in the EU which rely the most on solid fuels, specifically on lignite. However, there is no import dependence since the lignite comes almost exclusively from domestic mines whereas Greece is only second to Germany in the EU for lignite production. Hence, this energy source counterbalances the import dependency of oil and gas. Remarkably, there is no export of lignite.
Almost all of the lignite is used for electricity production (including co-generated heat). While domestic production has been partly opened to private companies, the state-owned energy company PPC(156) remains the largest producer with the right to exploit almost two thirds of the known reserves.
4.1.1.3. Gas
The third energy source used in Greece is natural gas, accounting for 10% of gross inland consumption in the period 2006 – 2010 (including the negligible domestic production). The recent
(155) Significantly, the zones in question appear rather free from
geo-political issues such as the lack of agreement with Turkey on the sovereignty demarcations in the Aegean Sea.
(156) PPC stands for Public Power Corporation S.A.; the government had a 51% stake in the company, but in September 2012 a 17% stake was handed over to a privatisation company.

Part II Individual Country Files
119
growth in this share has been less marked than earlier in the decade.
The gas comes from a rather limited number of non-EEA countries, giving rise to some security of supply concerns. Russia's once dominant share (of over 80% in 2005) has now been reduced to about half, whereas the other two main suppliers have expanded their share (in 2010 about 30 and 15% for Algeria and Turkey respectively). About two thirds of the gas arrives in Greece by pipeline, but this is falling in line with the LNG supply from Algeria and some other countries. There is currently one LNG terminal (west of Athens), with plans to expand its capacity and to build another terminal at Crete (both foreseen for 2015). Currently, Greece does not have any storage capacity, but one facility in the north of the country (at Kavala).
0.0
0.2
0.4
0.6
0.8
2006 2007 2008 2009 2010
Graph II.4.3:Greece - HHI index energy imports
Gas Oil Solid fuels
Source: Eurostat
A well-functioning and interconnected gas market with competitive and market-based prices should provide the correct incentives for further investments and signals to consumers for an efficient and sustainable use of the resources. Both elements are conducive to reduce the vulnerability of the country to energy-related shocks. As for oil, there are good prospects for finding and exploiting off-shore gas fields, but the development of this sector is at its very first stage.
Competition has been successfully introduced on the gas markets in 2010 and unbundling of the gas TSO is on-going, but somewhat complicated by the current privatisation plans. DEFSA is the Transmission System Operation for gas in Greece; the 2011 energy law initially foresaw its ownership
unbundling from the incumbent, vertically-integrated gas company DEPA, but the law has been subsequently amended to allow for the ITO option. The final outcome on the unbundling options (ITO or ownership unbundling) is dependent on the outcome of the privatization of DEPA.
The government still has a two-third stake in the gas company DEPA(157), but the company is expected to be privatised in the first half of next year. One of the bigger challenges to privatisation has been removed with PPC's waiving of its buy-option of 30% of DEPA(158). However, DEPA's €300 mln debt, due to unpaid bills, still poses a serious hurdle to a successful sale.
75
80
85
90
95
100
2006 2007 2008 2009 2010
%
Graph II.4.4:Greece - Non-EEA share of imports
Gas Oil Solid fuels
Source: Eurostat
4.1.1.4. Renewables
Renewable energy sources (RES) account for 6% of gross inland consumption in the period 2006 – 2010, all from domestic sources. Only the last two years of observation show a clear increase in this share.
(157) Hellenic Petroleum is the owner of the remaining third. (158) In the same package deal, PPC has renewed its supply
contract with DEPA and received about €80 mln from the stare.

European Commission Member States’ Energy Dependence
120
0
20
40
60
80
100
2006 2007 2008 2009 2010
%Graph II.4.5:Greece - Renewable mix
Hydro Biomass Wind Solar Geothermal
Source: Eurostat
Currently, more than half of the renewable energy supply is energy generated with biomass use; with bio-fuels and –gas the share is roughly 60%. Hydropower has a share of almost 20%, while wind and solar power both take up about 10% each(159). The bio-based energy sources are mainly used outside of the electricity sector, whereas the other sources are used to generate electricity, yet roughly half of it outside of the electricity sector, mainly in the residential sector (such as through solar boilers).
As reported in the (revised) National Renewable Energy Action Plan (NREAP), the overall 2020 target is an 20% share in total final energy consumption(160), roughly a doubling of the current share. This is translated in the sectoral targets of almost 20 and 40 % for heating & cooling and electricity respectively, and 10% for transport, corresponding to a disproportionate share increase in the latter two sectors and a relatively modest one in the first.
Greece has a strong comparative advantage in solar and wind energy which until now has been under-exploited. Consequently, Greece's NREAP(161) foresees a fivefold increase in wind power and tenfold increase in solar power. As a result, wind power would remain the dominant RES in electricity production with a share of about
(159) According to the figures for 2008 provided in the revised
National Renewable Energy Action Plan (Greece, 2012). The emerging picture is roughly confirmed in the 2009 energy balance for Greece from the IEA.
(160) This national RES target for RES is deliberately set 2% above the mandatory level of 18% set by the RES Directive (2009/28/EC).
(161) Revised NREAP (Greece, 2012), Figures 5 and 6.
three quarters of total production while the solar power share would increase to about one fifth. Bio-mass would remain the dominant RES in heating and cooling and transport. The potential of hydro power seems to be largely exploited.
The NREAP points to the uncertainties related to the on-going economic reforms and restructuring. A stronger economic recovery than currently projected would imply a higher energy consumption and thus the need for a stronger increase in RES capacity and energy efficiency measures. However, it would also imply more (public and private) means available for RES investments and efficiency measures.
RES use for electricity production has been stimulated through feed-in tariffs but in the context of the on-going fiscal consolidation and structural reforms the feed-in tariffs for solar power were reduced in August 2012 (for new contracts only) and Parliament voted to impose a temporary tax on all RES revenues November 2012. Before these measures, the Greek feed-in tariffs on solar power were among the highest in the EU. This rationalisation is meant to skim off excessive profits and provide incentives for productivity improvements either by existing suppliers or by the entry of more efficient suppliers(162).
Various companies and EU countries are exploring the possibilities to "statistically buy" the so- called surplus RES production through the "cooperating mechanisms" allowed by the RES Directive.
4.1.2. Secondary Energy Sources
Electricity accounts for almost a quarter of final energy consumption in Greece. The mix of electricity production appears relatively well diversified despite the large share of lignite as primary energy source (with a share well over 50%). This is because the remaining part is fairly equally divided over the other primary energy sources. Moreover, Greece has a non-negligible structural import of electricity, as imports amounted to about 15% of final consumption in
(162) It is also meant to avoid contingent fiscal liabilities related
to the accumulation of debt in the RES account.

Part II Individual Country Files
121
2009, whereas exports for only 5%.(163) Further diversification seems possible when lignite would be gradually substituted by RES and gas.
The increase in the use of gas as energy input seems directly related to the loss of market share of the (partly) state-owned incumbent electricity company PPC. Its production share fell from a near 100% before 2009 to 75% currently. Independent producers achieved a share of 20 %, mostly from the use of gas-fired power generation. However, in combination with the fall in electricity demand, the increasing penetration of renewables has curtailed gas –fired generation, even to an extent that the take-or-pay penalties in the gas-supply contracts need to be invoked.
0
20
40
60
80
100
2006 2007 2008 2009 2010
%Graph II.4.6:Greece - Electricity mix
Gas Oil Nuclear Renewables Solid fuels
Source: Eurostat
Good electricity interconnections and adequate domestic infrastructure capacity are important to shelter the country from supply shocks and to enable a proper absorption of renewables. A competitive and dynamic electricity market should cater the necessary investment incentives and provide the right price signals to consumers However, the incumbent's dominance is a bottleneck for effective competition which is being tackled as part of the on-going economic reforms.
Next to the current capacity surplus due to low demand (deterring entrants), the long-standing issue remains the privileged, if not exclusive access, to the cheap lignite(164) and hydro
(163) In caloric terms. Data are from to the 2009 energy balance
for Greece from the IEA (164) Next to the low cost price due to location advantages, it is
not clear whether currently lignite is sourced against competitive market price levels.
resources, which in combination with a dominant position on the retail market, leading to the threat of "double marginalisation" of the entrants by the incumbent. Moreover, under the current adverse economic conditions, the depressed wholesale market prices may not adequately reflect the long-term production costs, due to the large share of compulsory volumes on the market (from hydro, solar and wind power in particular). This gives the incumbent an additional edge over entrants.
The incumbent's position has also been weakened in a number of significant aspects. It has accumulated a debt of unpaid electricity bills to the estimated amount of € 1.4 bn at the end of 2011(165). Together with the current uncertain future of the company and the sector, this hinders investments in improving the efficiency and environmental record of the sector (see section 4.2 below).
There is also a debt issue for the Market Operator (technically part of the incumbent). It faces a sizeable debt on its "special renewables account," caused by the sustained gap between the (depressed) market prices and high feed-in tariff levels, especially for solar power, insufficiently covered by the revenues of the "special RES levy" on consumer prices(166). This has now led to three increases in this levy in less than two years' time, after an apparent freeze in the levy between 2006 and 2010.
More generally, the government and regulator have taken in the second half of 2012 a series of measures to enhance competition in and the efficiency of the sector, but also to have the sector contributing to the need for government revenues.
(165) In 2012 PPC has stepped up efforts to recover unpaid bills,
including cutting electricity supply to non-compliant customers
(166) See RAE annual report 2012, pp29-31: The budgeting of the revenues to this account appears to have been consistently too optimistic. This is because apparently both the price gap and the increase in RES production have been underestimated and the set of revenue arrangements have made the relation between the levy and the price gap to be covered too complicated. The latter is for two reasons: first, the levy has been differentiated over consumer categories (since June 2010); second, there are other finance sources (including the auction revenues of unused carbon permits and incidental revenues collected through the electricity bill such as part of the TV license fee) the revenues of which have been much less than budgeted.

European Commission Member States’ Energy Dependence
122
First, at a difficult economic juncture, electricity prices for both for households and industrial users have been increased due to the RES levy and VAT increases and the changes in the regulated retail tariffs aimed at achieving a better match with costs and hence preparing for the on-going phase-out of price regulation.(167) For industry users, the series of price increases in the period 2008 -2011 have led to electricity prices rising to over the EU average, while for consumers prices are still below EU average. Further price increases seem likely as the price regulation for domestic and small industrial is currently phased out (with end mid 2013) and in view of the remarkably low network cost share in the price (compared to other shares in the EU) and the requirement on power plants to purchase carbon permits from 2013 onwards.
Second, with the transposition of the Third Energy Package through the 2011 Energy law and subsequent implementation actions, unbundling has been achieved in the electricity sector on the basis of the ITO (Independent Transmission Operator) model. The TSO and market operator functions are now brought under different daughter companies of the incumbent PPC(168) and the DSO (Distributor System Operator) has now become a fully separately operating PPC daughter.
However, the dominance of the incumbent electricity company and its accumulated debts still require a comprehensive policy follow-up, including allowing pricing to adequately reflecting the costs and a restructuring of the company through a partial privatisation or sale of assets, such as the company's disentanglement of the lignite mines.
The energy regulator RAE also points to the need for further work in shaping the regulatory framework to arrive at competitive and open wholesale and retail markets. This includes the gas markets, a sound functioning of which is crucial for a shift away from lignite in electricity generation (167) While end user prices for the high and medium voltage
categories have been fully liberalised already, those for the low voltage category are still regulated until 1 July 2013. The latter were last adapted on 1 January 2012, with an average increase amounting to 3%, rather than the 12% hike as recommended by the regulator RAE. A new revision of the regulated prices is expected by the end of the year.
(168) The respective companies are called ADMIE and LAGIE.
Interestingly, RAE recalls the medium and long term interest of the expansion projects of the power transmission grid to the Aegean islands, which will improve the security of supply to the currently isolated, and often quite small systems and will allow for an increasing penetration of RES projects on the islands and reducing PSO (Public Service Obligation) costs(169). It should be noted that the same logic applies for better interconnections of Greece's power grid and gas networks with that of other EU countries.
4.1.3. Conclusions
Greece has strong dependence on imported oil, as this energy source constitutes over half of its energy consumption. This implies a security of supply risk as nearly all of the oil is sourced from outside the EEA. This risk is partly countered by a marked diversification both over oil supplying countries and over the other primary energy sources for the lesser half of energy consumption. Domestically won lignite is the most important but one energy source, accounting for about a quarter of Greece's energy consumption and over half of the energy input to its electricity production. The state-owned energy company PPC remains the largest producer with the right to exploit almost two thirds of the known reserves.
The third and fourth energy source used in Greece are (imported) natural gas and (domestically produced) renewables (RES) currently accounting for 10 and 6% of energy consumption respectively. Both shares have increased over the last decade and are expected to grow further. For an important part, this because of the developments in the electricity sector, where the state-owned energy company PPC has lost market share to entrants using gas-fuelled electricity plants and the commitment to produce in 2020 40% of energy consumption with renewables has spurred investments mostly in solar and wind power.
The on-going restructuring of the energy sector has been complicated by the effects of the economic recession, as illustrated by the increases in electricity prices necessary to recover costs and phase-put price regulation. In particular, the dominance of the incumbent electricity company,
(169) The higher costs of electricity generation on the islands are
recovered through a PSO levy on retail tariffs.

Part II Individual Country Files
123
the lack of effective competition and the debts accumulated in the sector require a comprehensive policy follow-up.
4.2. ENERGY AND CARBON INTENSITY
Table II.4.1:Energy and carbon intensity
Energy intensity of the economy 1) 152 -4.7CO2 intensity of the economy 2) 0.41 -9.1Share of energy intensive sectors in Gross Value Added 3) 8.9 -0.9
Energy intensity of the economy 1) 152 -4.7CO2 intensity of the economy 2) 0.41 -9.1Share of energy intensive sectors in Gross Value Added 3) 8.9 -0.9Source: Eurostat
2010 percentage change2006 - 2010
memo items: EU27
Notes: 1) Kg of oil equivalent per 1000 EUR, changes in percent; 2) Tonnes of CO2 equivalent per 1000 EUR, changes in percent; 3) percent of total gross value added, changes in percentage points, latest data refer to the year 2009.
Greece does not stand out in the EU as regards the energy intensity of the whole economy. Neither in the current level nor in the pace of the secular downward trend over the last decade does Greece differ much from the EU as a whole. While at the beginning of the decade Greece's energy intensity was still somewhat above the average EU level, in 2010 it had fallen below the EU average, reflecting a higher percentage reduction than for the EU as a whole. However, the differences are not big.
To a large extent, the various sectors do not deviate much from the overall picture. However, over the last decade Greece has booked the strongest reduction in the energy intensity of its transport sector in the EU.
The second National Energy Efficiency Action Plan (NEEAP) reports that Greece has exceeded its intermediary energy savings target for 2010 (2.8% compared to the average final energy consumption in 2000-2005), but it acknowledges that this success is more due to the economic recession than to the implementation of the measures specified in the first NEEAP. However, the recession has brought about a behavioural change in energy use on which the second NEEAP aims to build through deepening the measures of the first NEEAP.
The final target for 2016 is 9% energy savings. One should note that with a stronger than foreseen economic recovery meeting this target will become a bigger challenge.
0.55
0.60
0.65
0.70
140
145
150
155
160
2006 2007 2008 2009 2010
Graph II.4.7:Greece - Energy and carbon intensity of the economy
Energy intensity (lhs) CO2 intensity (rhs)
kgoe/1000 EUR ton CO2 eq./1000EUR
Source: Eurostat
Greece does not stand out in the EU as regards the carbon intensity of the whole economy. While its current level appears to be above the EU average, it has fallen in the last decade more than in most other EU countries. The overall performance is reflected in the carbon intensity of the household and transport sector, while Greece has a highly carbon intensive energy production, because of the strong reliance on lignite as primary energy source for electricity.
Greece has over-achieved its Kyoto targets but it is partly due to the economic recession. As reported by the European Environmental Agency(170), the average emissions in Greece over the 2008-2011 period were 15.2% higher than the base-year, well below Kyoto's burden-sharing target of a maximum of 25% emission increase for this period. While in 2008 the amount of GHG emissions was quite close to the target, in 2010 and 2011 the GHG emissions were 10% lower, undoubtedly related to the recession.
In the context of the Effort Sharing Decision,(171) Greece needs to reduce its emissions in the non-ETS sectors in the year 2020 by 4% compared to those in 2005. However, recent projections(172) have identified a shortfall to this 2020 target and hence the need for additional measures in the non-ETS sectors, in particular for transport.
Greece's share of GHG emissions covered by the ETS is equal to 51.1%, well above the EU (170) European Environmental Agency (2010) (171) Decision No 406/2009/EC (172) European Commission (2011)

European Commission Member States’ Energy Dependence
124
average of 40.4%. Latest emission reporting shows that Greece has stayed under its ETS emission cap in 2011 by almost 14%. As of 2013, there will be an EU-wide emission cap and the level of allowances to be auctioned in the EU will be increased in a linear manner. In particular, the auctioning of carbon permits to the electricity plants from 2013 onwards will contribute to the upwards pressures on electricity prices. This underlines the importance of correct pricing of this domestic energy source and the disinvestment of the incumbent electricity company in the lignite mines. Next to the foreseen strong increase in the RES-share in electricity production, carbon capture and storage may be part of the longer term policy response, as long as their additional costs do not render gas-fuelled electricity production more efficient. It is of note that the combination of these measures will render further increases in electricity prices quite likely.
4.2.1. Industry
Just as for the whole economy, the energy intensity of Greek industry does not stand out in the EU. Throughout the decade it has remained well above the EU average, despite a more pronounced downward trend than for the EU as a whole. In this, it resembles very closely the development of industry's energy intensity in Lithuania.
3.20
3.25
3.30
3.35
3.40
3.45
155
170
185
200
215
2006 2007 2008 2009 2010
Graph II.4.8:Greece - Energy intensity of industry, carbon intensity of energy use
Energy intensity of industry (lhs)CO2 intensity of energy use (rhs)
kgoe/1000 EUR ton CO2 eq./1000EUR
Source: Eurostat
The NEEAP reports than over the decade industry's final energy consumption has remained more or less constant in absolute terms whereas its share in overall final consumption has steadily
fallen over the period, probably largely due to the ascendance of services in Greece's production structure and in the last years also the deep recession.
Consequently, the NEEAP does not report specific savings measures for industry except for the establishment of a few "green business parks".
4.2.2. Transport
Over the last decade Greece has booked the strongest reduction in the energy intensity of transport in the EU. Most of this reduction took place in the early years of the decade. While in 2000 Greece's energy intensity of transport was among the highest in the EU, in 2006 it had fallen well under the EU average. Since then, the indicator has shown an erratic trend which may be partly due to statistical problems and partly due to the recession.
0.95
1.05
1.15
1.25
1.35
370
393
415
438
460
483
2006 2007 2008 2009 2010
Graph II.4.9:Greece - Energy and carbon intensity of transport
Energy intensity (lhs) CO2 intensity (rhs)
kgoe/1000 EUR ton CO2 eq./1000EUR
Source: Eurostat
The NEEAP foresees the transport sector to make the largest contribution in energy savings. Measures include the development of urban mobility plans; the strong promotion of public transport (raising its share from one quarter to one third of overall transport); price incentives for the replacement of old vehicles, preferably with gas-, RES-fuelled or hybrid cars; and, significantly, varying vehicle taxation with energy efficiency and carbon emission levels. The promotion of RES-use in transport appears a priority as the current 2% share of RES in transport is still far off from the 2020 target of 10%. However the carbon intensity of the transport sector for 2010 was in line with the EU average.

Part II Individual Country Files
125
4.2.3. Households
The energy and carbon intensities of households are relatively low in Greece, reflecting the impact of the Mediterranean climate. Still, the percentage reduction over the last decade does not fall behind most of the other EU countries.
0.09
0.11
0.12
0.14
0.15
30
33
36
39
42
2006 2007 2008 2009 2010
Graph II.4.10:Greece - Energy and carbon intensity of households
Energy intensity (lhs) CO2 intensity (rhs)
kgoe/1000 EUR ton CO2 eq./1000EUR
Source: Eurostat
According to the NEAP, the residential sector should provide the second largest savings contribution. Measures include financial incentives to improve the thermal isolation of the buildings from before 1980 and subsidies for replacing old air-conditioners.
4.2.4. Conclusions
Greece does not stand out in the EU as regards the energy and carbon intensity of the whole economy. While most sectors follow the macro pattern of level and change in energy and carbon intensity, over the last decade Greece has booked the strongest reduction in the energy intensity of its transport sector in the EU and the carbon intensity of its energy production is among the highest in the EU due to its reliance on lignite.
Policy actions aimed at reducing the carbon emission in the energy sector render further electricity price increases quite likely. While Greece has met its Kyoto targets partly because of the economic recession, recent projections have identified a shortfall to the 2020 target for the Greek non-ETS sector.
4.3. CONTRIBUTION OF ENERGY PRODUCTS TO TRADE
4.3.1. Net energy trade balance
Greece's energy trade deficit was one of the lowest in the EU in 2011 (2.4% of GDP) showing a remarkable improvement as compared to previous years, when its deficits were invariably larger than 3% of GDP and hence Greece did not belong to the group of countries with the lowest deficits. In 2008, the deficit peaked to almost 5% of GDP, probably reflecting the peak in oil prices.
-6
-4
-2
0
-25
-15
-5
5
2007 2008 2009 2010 2011
% of GDP% of GDP
Graph II.4.11:Greece - Trade balance of energy products and CA
CA (lhs) Oil (rhs)Gas (rhs) Total (rhs)
Source: Eurostat
However, the developments and current size of the energy trade deficit should be seen against the background of the country's current account balance. Greece has had a persistently high current account deficit, always among the highest in the EU in the period under consideration; in 2011 it had the largest but one current account deficit in the EU. Unlike most other countries with a very high deficit at the start of the period under consideration, Greece has not managed to bring the level of its current account deficit significantly down: after a fall from about 15% of GDP, Greece's deficit has been close to 10 % of GDP in the last three years(173).
Because of Greece's large current account deficit, the energy trade deficit remains a matter of concern, even when in absolute size and as percentage contribution to the current account
(173) Note however that after subtraction of the energy trade
balance and the net general-government interest payments, the remainder of the current account is (close to) surplus.

European Commission Member States’ Energy Dependence
126
deficit it is quite low when compared to previous years. In case the recent fall in energy trade deficit will not persist, it will hinder the efforts to reduce the current account deficit.
The fall in the energy trade deficit trade is mainly due to the reduction in the trade deficit for oil and oil products. The trade deficit for gas, the other energy source sourced from abroad, has only slightly increased.
4.3.2. Decomposition of the net energy trade balance
The energy trade balance can be decomposed in three multiplicative factors, namely the relative energy trade balance (i.e. the share of net exports in energy products in total cross-border energy trade), the share of energy in total trade and the ratio of total trade to GDP (macro openness to trade).
Table II.4.2:Decomposition of Energy Trade Balance
2007 2008 2009 2010 2011Energy trade balance (% GDP) -3.5 -4.9 -3.0 -4.3 -2.4Relative trade balance (%) -65.0 -73.5 -72.0 -73.0 -27.2Share of energy in total trade (%) 16.1 19.2 15.1 20.9 28.4Macro trade openness (% GDP) 33.4 34.7 27.8 28.4 30.9Source: Eurostat
The recent sharp fall in Greece's energy trade deficit both in absolute terms and relative to that of other EU countries can be attributed to a spectacular change in the relative energy balance, namely in one year from one among the highest deficits in the EU to a relatively small deficit. The change in the relative trade balance is not translated into a correspondingly drastic change because the share of energy in total trade has sharply increased over the last two years ending up with the highest but one level in 2011. The rise in this share probably reflects the collapse in international trade in tandem with the shrinking of the Greek economy. Changes in the macro trade openness over the period do not matter much. It is of note that Greece has the lowest trade openness in the EU throughout the period.
4.3.3. Conclusions
Greece's energy trade deficit was one of the lowest in the EU in 2011 but it remains a concern because of the stubbornly high current account deficit. This is also because the recent fall in the energy trade deficit may be temporary, as it is related to the
very deep recession. The historically low contribution of the energy trade deficit in the current account deficit also points in this direction.
4.4. REFERENCES
European Commission (2011), Annual Growth Survey 2012, Europe 2020 targets: climate change and energy, COM (2011) 815 of 23 November.
European Environment Agency (2010), GHG trends and projections in Greece.
IEA (2011), 2009 Energy Balance for Greece (in thousand tonnes of oil equivalent (ktoe) on a net calorific value basis), International Energy Agency / OECD, 2011, available from: http://www.iea.org/stats/balancetable.asp?COUNTRY_CODE=GR.
Greece (2011), Second National Energy Efficiency Action Plan , available from: http://ec.europa.eu/energy/efficiency/end-use_en.htm
Greece (2012), revised National Renewable Energy Action Plan 2010-2020, available from: http://ec.europa.eu/energy/renewables/action_plan_en.htm
RAE (2012), "2012 National Report to the European Commission (Covering the period 01.01.2011 – 31.12.2011)", Regulatory Authority for Energy, Athens, October 2012.

5. IRELAND
127
5.1. SECURITY OF ENERGY SUPPLY
Ireland has one of the highest import dependencies in the EU, as 88% of its energy consumption is sourced from foreign suppliers. Its energy mix is significantly less diversified than the EU average as it is heavily unbalanced towards oil.
40
60
80
100
120
2006 2007 2008 2009 2010
%Graph II.5.1:Ireland - Import dependence
Gas Oil Solid fuels Total
Source: Eurostat
5.1.1. Primary Energy Sources
5.1.1.1. Oil
Oil accounted in 2010 for 50% of the country's energy mix. Ireland imports all its oil consumption(174). There are few import sources and the diversification of oil imports is consequently limited, but most imports (92% in 2010) come from EEA countries which partially mitigates the risks linked to the lack of diversification. In 2009, the main suppliers were Norway, Denmark and, to a lesser extent, Libya.
(174) 98% in 2010 compared to 101% in 2006.
Key Insights
Security of Energy Supply
- Ireland is among the five potentially most vulnerable countries of the EU in terms of security of energy supply. The country's vulnerability originates from the very high import dependency, the limited diversification of the energy mix that heavily relies on oil, and a very low share of renewable energies.
- A number of mitigating factors are, however, also present: the gas imports are coming entirely from another EU Member State and most of the oil imports are also sourced from within the EEA.
Energy and Carbon Intensity
- While normally being characterized by high energy consuming sectors, the industrial sector has been able to reduce its energy intensity over the years to become one of the most efficient in the EU.
- The carbon intensity of the energy sector is very high, mainly as a consequence of the widespread use of fossil and solid fuels and as a side effect of the high share of energy losses in the transformation process.
- The size of the initial support scheme for renewables appears rather limited and generally not sufficient to stimulate adequate private investments in some technologies (except wind). Recent amendments to the renewable energy policy are expected to help the country meet its targets.
Trade balance for energy products
- The current energy trade deficit of Ireland does not seem to indicate a major vulnerability concern; it is not large as compared to other EU countries and it is combined with a small current account surplus, indicating that the trade balance for the other product categories compensates for this deficit.
- However, the country has a significant trade deficit for oil and it is still heavily reliant on oil in the energy mix. These two aspects could trigger adverse competitiveness shocks in the event of sudden price surges or supply shortages.

European Commission Member States’ Energy Dependence
128
0
20
40
60
80
100
2006 2007 2008 2009 2010
%Graph II.5.2:Ireland - Energy mix
Gas Oil Nuclear Renewables Solid fuels
Source: EurostatNote: Non-renewable waste and electricity are excluded
There is one oil refinery located at Whitegate, Cork County, with a capacity of about 75,000 barrels/day. There is also a deep-water crude oil and oil products storage facility at Bantry Bay (Whiddy Island), Cork County(175). Ireland's imports of oil amounted to 8.68 Mtoe in 2009, while the Gross Inland Consumption was 7.69 Mtoe. In May 2012 the first domestic oil well was discovered in the Celtic Sea by the company Providence Resources. The firm claims to be able to extracts about 100,000 barrels per day. This is potentially positive news for the reduction of the country's energy dependence as Ireland consumed 142,000 barrels of oil a day in 2011.
5.1.1.2. Gas
Gas is the second source of energy used and in 2010 it accounted for nearly 31% of the country's energy mix, slightly higher than the EU average. Unlike oil, the share of gas has increased over the past decade by almost 10 percentage points. Domestic production, coming mainly from the Kinsale Gas Field, has been declining over recent years falling from 1.87 Mtoe in 2001 to 0.32 Mtoe in 2009(176). Currently Kinsale supplies some 5% of the country's gas consumption. However, another gas field (Corrib) has started operating in 2009 with an estimated reserve of 1 trillion cubic feet. It will be able to supply up to 60% of the country's gas needs according to Shell, the managing company.
(175) www.hydrocarbons-technology.com (176) European Commission, DG Energy (2012)
0.0
0.2
0.4
0.6
0.8
1.0
2006 2007 2008 2009 2010
Graph II.5.3:Ireland - HHI index energy imports
Gas Oil Solid fuels
Source: Eurostat
Ireland imports more than 90% of the gas it consumes(177). The only supplier is the UK. There is only one entry point that connects the UK pipelines and the Irish network, located at Moffat. A proposal to build a LNG terminal at the Shannon Estuary is currently being discussed and it has sparked a lively debate between supporters and opponents. The terminal would provide further supply possibilities for the country. For the time being, however, the country remains interconnected only with the UK.
A well-functioning and interconnected gas market with competitive and market-based prices should provide the correct incentives for further investments and signals to consumers of an efficient and sustainable use of the resources. Both elements are conducive to reduce the vulnerability of the country to energy-related shocks.
The gas market in Ireland is undergoing reforms to improve the degree of liberalization and competition. Bord Gais Eireann (BGE) is the state-owned holding company dealing with the supply of gas and the development and operation of the gas network. It is also involved in electricity generation and infrastructure management through its subsidiary companies(178). The network in
(177) 90% in 2006 as compared to 93% in 2010. (178) The activities (supply, network, etc.) are operated by its
subsidiaries, not by BGE itself, each of which is fully separated and independent entity. In 2010 the Irish Government decided to further implement the unbundling model set out by the Third Energy Package. The model chosen for Gaslink, the infrastructure manager currently ITO, is the Ownership Unbundling, the certification

Part II Individual Country Files
129
Ireland consists of 2.368 km of high-pressure transmission pipelines and 10.782 km of low-pressure distribution pipelines. They are owned by BGE which is currently undertaking investment to develop the first gas storage facility of the country.
0
20
40
60
80
100
2006 2007 2008 2009 2010
%
Graph II.5.4:Ireland - Non-EEA share of imports
Gas Oil Solid fuels
Source: Eurostat
The retail gas market in Ireland has been fully liberalized since 2007 and the degree of competition appears to be increasing at a fast pace(179). However, the incumbent still has a market share of 71%(180) across households and small businesses and only one other supplier has a market share above 10%. Competition is more vibrant in the large industrial consumers sector where the market share of BGE is below 40%(181). The Commission for Energy regulation (CER) has prepared a roadmap for complete price deregulation in the gas market which will be enacted once the main supplier reduces its share below 60%.
For the time being, however, end-user's prices are regulated by CER, while price setting is free for large industrial operators. Prices for households are more or less in line with the euro area average, while prices for industrial consumers are the fifth highest in the EU(182).
procedure is currently underway. See also Gaslink Operational Review 2010.
(179) The switching rate increased from 14% in 2010 to 18% in 2012.
(180) Irish Commission for Energy Regulation (2012) (181) Irish Ministry of Finance (2011) (182) European Commission (2011a)
5.1.1.3. Solid fuels
Solid fuels are the third energy source used in Ireland. The share of solid fuels in the energy mix decreased from 16% in 2006 to 14% in 2010, 2 percentage points below the EU average. Part of the solid fuel needs are covered by domestic production (mainly smokeless peat briquettes), yet the country depends on imports for 49% of its consumption.
Nevertheless, the share of imports has been on a declining trend since 2006. The main suppliers are outside the EEA, namely South Africa and Colombia, but about 20% of imports also come from within the EU, namely from Germany and Poland
5.1.1.4. Renewables
The fourth source of energy used in Ireland is renewable energy. It accounts for 4% of its energy mix, or 5.5% of Ireland's gross final energy consumption(183). The trend regarding the share of renewables in gross final energy consumption has been positive, from 3% in 2006. However, Ireland needs substantial efforts to reach its binding target for 2020, which is 16%.(184)
0
20
40
60
80
100
2006 2007 2008 2009 2010
%Graph II.5.5:Ireland - Renewable mix
Hydro Biomass Wind Solar Geothermal
Source: Eurostat
(183) The share of renewables in the energy mix means the share
of renewable energy in gross inland energy consumption. We use this denominator consequently in the EDI to assess the share of each energy source in the energy mix. On the other hand, Member States' renewable targets for 2020 are expressed as a share of renewable sources in final energy consumption, i.e. excluding transmission, distribution and transformation losses. This explains the difference between the two figures.
(184) Republic of Ireland (2011b)

European Commission Member States’ Energy Dependence
130
Ireland's geographical location makes it attractive to develop wind energy, providing significant potential for using these resources to generate renewable electricity for the island of Ireland, and potentially to export electricity to Great Britain and even continental Europe. For this reason, the main source of renewable energy developed in Ireland is wind power, which accounted for 10% of all electricity generation and for 1264 MW of installed capacity out of a total of 1441 MW of renewables capacity in 2010(185). Ireland has the fourth highest share of wind energy in the EU, after Denmark, Portugal and Spain. The shares of renewables in heat and transport are smaller than in electricity, 5% and 2% respectively.
Renewables are supported in Ireland mainly through feed-in tariffs. The Irish tariffs in terms of EUR/MWh have always been rather low in comparison to the other EU countries, but in principle in line with average generation costs(186); this low support is partially compensated by very good wind conditions. New tariffs, REFIT 2 for wind and hydro and REFIT 3 for biomass, were envisaged in Ireland's Renewable Energy Strategy and came into force in the 1st quarter of 2012. In order to increase the share of biofuels, the government has introduced an obligation for all suppliers to include 4% of biofuels in their fuel mix. There are certificates for suppliers of biofuels, which can be traded on the market; there are also penalties for non-compliance with the scheme.
5.1.2. Secondary Energy Sources
Electricity imports in Ireland are marginal. In 2010, only 2% of the country's consumption came from a foreign supplier, the UK, against 7% in 2006. Electricity generation in 2010 increased compared to the previous year, but it is still nearly 5% below the pre-crisis level of 2008. The country's electricity mix depends largely on gas (62%) and to a smaller extent on solid fuels (22%) and renewables (14%). The share of oil in electricity generation has been constantly declining over the past decade, accounting for only 2% of the total in 2010.
(185) International Energy Agency (2012) (186) Steinhilber S., Ragwitz M., Rathmann M, Klessmann C.
and Noothout P (2011)
0
20
40
60
80
100
2006 2007 2008 2009 2010
%Graph II.5.6:Ireland - Electricity mix
Gas Oil Nuclear Renewables Solid fuels
Source: Eurostat
Good electricity interconnections and adequate domestic infrastructure capacity are important to shelter the country from supply shocks and to enable a proper absorption of renewables. A competitive and dynamic electricity market should cater the necessary investment incentives and provide the right price signals to consumers.
Ireland does not appear to have an electricity capacity shortage. Peak demand reached around 3500 MW in 2012, with available capacity at dispatchable plants exceeding that at around 5400 MW-6200 MW. Total generation capacity should increase further by 2015, thanks mainly to new wind power plants which could reach more than 6000 MW of installed capacity(187). The TSO has prepared a EUR 4 billion investment plan over 17 years. This should upgrade the electricity grid in order to enable the achievement of the Government's targets of having 40% renewables in electricity generation by 2025 and to increase the interconnectivity with Ireland's neighbours.
Two main interconnection projects are currently underway, one with the UK, which will provide additional capacity of 500 MW, and one between the Republic of Ireland and Northern Ireland, with voltage level of 400 kV(188).
Competition in the electricity market has improved recently. The main electricity generator in Ireland had a market share of 43% in 2009 on the island electricity wholesale market, the Single
(187) Irish Commission for Energy Regulation (2011) (188) Irish Ministry of Finance (2011)

Part II Individual Country Files
131
Electricity Market (SEM)(189). The retail electricity market is characterized by a rather high level of competition. The incumbent had a market share of about 50% in 2010, albeit on a continuously declining path.
Competition is monitored by CER which used to set final electricity prices. However, this price regulation has been progressively abandoned since 2011 because of the increased level of competition in the wholesale market(190). End-user prices for households appear in line with the EU average, while for industrial consumers they are the fourth highest(191).
5.1.3. Conclusions
Ireland is among the five potentially most vulnerable countries of the EU in terms of security of energy supply. The country's vulnerability originates from the very high import dependency, from the limited diversification of the energy mix that heavily relies on oil, and from the very low share of renewable energies. A number of mitigating factors are, however, also present: the gas imports are coming entirely from another EU Member State and most of the oil imports are also sourced from within the EEA.
In order to better shelter the country from potential price or supply shocks, it would be useful to further diversify the energy mix, in particular by promoting more renewable energies especially in the transport and heating sectors. At the same time, the growing share of solid fuels in domestic production, while contributing to reducing the country's import dependency, could lead to increased GHGs emissions. Hence the country should pursue the exploitation of cleaner energy sources. Finally, promoting the diversification of import sources for gas supply could also prove beneficial; Ireland could consider further enhancing its gas storage capacity and its LNG terminal, as well as further exploring its domestic gas fields.
(189) The SEM is a unified wholesale electricity market which is
operative in both the Republic of Ireland and Ulster. (190) International Energy Agency (2012) (191) Eurostat (2012)
5.2. ENERGY AND CARBON INTENSITY
Ireland had the least energy-intensive economy in the EU in 2010. Ireland appears to have succeeded in decoupling GDP growth from energy consumption. As a matter of fact, GDP grew by 2.4% per year on average between 2000 and 2010, while electricity output increased only by 1.8% per year(192).
Table II.5.1:Energy and carbon intensity
Energy intensity of the economy 1) 93 2.9CO2 intensity of the economy 2) 0.38 -5.8Share of energy intensive sectors in Gross Value Added 3) 16.0 3.2
Energy intensity of the economy 1) 152 -4.7CO2 intensity of the economy 2) 0.41 -9.1Share of energy intensive sectors in Gross Value Added 3) 8.9 -0.9Source: Eurostat
2010 percentage change2006 - 2010
memo items: EU27
Notes: 1) Kg of oil equivalent per 1000 EUR, changes in percent; 2) Tonnes of CO2 equivalent per 1000 EUR, changes in percent; 3) percent of total gross value added, changes in percentage points, latest data refer to the year 2009.
The National Energy Efficiency Action Plan (NEEAP) runs for the period 2008-2016. The savings target to be reached by 2016, in line with Directive 2006/32/EC, is an overall decrease in final energy consumption (FEC) by 9% compared to the baseline level(193). A further National Target constitutes a 20% decrease in FEC relative to the baseline by 2020.(194)
Irish annual savings in 2020 are projected to exceed the initial target by around 6.5%, conditional on all additional measures specified in the second NEEAP being implemented.(195)
Despite the low energy intensity, the carbon intensity of the Irish economy is in line with the EU average. This is likely to be a consequence of the high share of oil in the country's energy mix (more than 50% in 2009). Furthermore, the NEEAP reports that there is a high share of energy loss in the transformation process (between 50% and 65% of the energy inputs).
(192) International Energy Agency (2012) (193) Republic of Ireland (2007): The baseline is the average
annual final energy consumption over the period 2001-2005.
(194) The 2016 ESD target is calculated differently to the 2020 National Target, which accounts for the seemingly disproportionate difference; the EU Emissions Trading sectors are excluded from the ESD analysis, whereas the whole economy is included in calculating the National Target.
(195) Republic of Ireland (2011a)

European Commission Member States’ Energy Dependence
132
0.35
0.38
0.40
0.43
0.45
80
84
88
92
96
2006 2007 2008 2009 2010
Graph II.5.7:Ireland - Energy and carbon intensity of the economy
Energy intensity (lhs) CO2 intensity (rhs)
kgoe/1000 EUR ton CO2 eq./1000EUR
Source: Eurostat
GHG emissions have increased by 10% between 1990 and 2010 however the country is on track to meet its Kyoto obligations which foresaw an increase of 13% by 2012 compared to 1990. In addition recent developments show that GHG emissions have been steadily declining since 2008.(196). Emissions per capita have also been reduced by 12% between 1990 and 2010.
More problematic appears for Ireland to meet its obligations in the framework of the EU climate agenda. In the context of the Effort Sharing Decision(197), Ireland should reduce by 20% its emissions in the non-ETS sector by 2020 compared to 2005 levels. According to the latest projection Ireland will be able to reach only half of this target, conditional to the adoption of additional policy measures. In this sense, Ireland is one of the Member States with the largest gap vis-à-vis its targets(198).
The share of GHG emissions falling under the ETS is 34%, six points below the EU average. As the third phase of the scheme will start in 2013, allowances previously granted for free will have to be auctioned. This might imply higher energy costs as the power sector constitute more than 85% of total emissions and it is heavily dependent on fossil fuels. However two elements should be considered, on one side the currently low carbon prices and on the other side the level of emissions of the power sector has been steadily declining since 2005.
(196) European Environment Agency (2010) (197) Decision 406/2009/EC (198) European Commission (2012)
5.2.1. Industry
The low energy intensity of Irish industries is particularly impressive, especially in view of the high share of the chemicals(199) and paper and pulp industries in GVA. Despite this manufacturing structure, which generally tends to imply high energy consumption, Ireland had by far the least energy-intensive industry in the EU in 2010.
2.60
2.70
2.80
2.90
3.00
40
50
60
70
80
2006 2007 2008 2009 2010
Graph II.5.8:Ireland - Energy intensity of industry, carbon intensity of energy use
Energy intensity of industry (lhs)CO2 intensity of energy use (rhs)
kgoe/1000 EUR ton CO2 eq./1000EUR
Source: Eurostat
According to the SEAI (Sustainable Energy Authority of Ireland), this successful exploitation of resources reflects the high energy standards of firms, combined with the good level of the energy audits. SEAI estimates that since the start of the first energy management programme in 2005, Irish companies have been able to save up to EUR 150 million on their energy bills.
The performance of the industrial sector has been outstanding relative to households and transport, which fell short of their respective projections for 2010, according to the second NEEAP. Industries over-delivered on their 2010 interim target by 90%.
Industries are expected to account for around 17% of total savings in 2020. Further savings in the sector will be achieved through measures in support of large industries to improve their energy management. Specific support for SMEs' energy savings are also envisaged, as well as tax breaks to
(199) This sector's GVA is almost ten times greater than the EU
average (Eurostat, nama_nace31_c).

Part II Individual Country Files
133
promote the deployment of the most energy-efficient technologies.
The carbon intensity of the energy use was among the highest in the EU in 2010. However as mentioned above, the CO2 intensity of energy use and its level of emissions have been on a constantly declining path from 2000 onwards, which suggests that adaptation measures towards less polluting energy sources are being implemented.
5.2.2. Transport(200)
According to the NEEAP, the relatively low level of savings achieved so far (only 12% of the sector's target for 2020) suggests that there is ample scope for improvements in the sector.
In some respects, the transport sector has been lagging behind, for instance in the deployment of electric vehicles, which according to the NEEAP has not yielded savings. This is also the case in the area of efficient road traffic movements.
Other areas, such as aviation, seem to have reached the target level of savings foreseen by the NEEAP, while in terms of fuel efficiency there are still considerable efforts to be made to achieve the expected targets.
According to the latest NEEAP, Transport is expected to account for around 16% of total savings in 2020. Policies laid out in the NEEAP include the improvement of the internal combustion engines, differentiated tax regimes to promote the purchase of less energy-consuming vehicles, a more widespread deployment of electric cars and the introduction of energy-saving driving requirements in licencing tests.
5.2.3. Households
The energy intensity of households in Ireland is one of the lowest in the EU. It has been on a downward trend since the beginning of last decade but has started picking up again in 2009 and 2010, bringing the level just above the 2000 level. However, if one takes into consideration a longer
(200) There is lack of data on both energy and carbon intensity in
transport.
time span (1990-2010) the overall energy intensity of households has decreased markedly by 11%.
0.15
0.16
0.18
0.19
0.20
35
38
40
43
45
2006 2007 2008 2009 2010
Graph II.5.9:Ireland - Energy and carbon intensity of households
Energy intensity (lhs) CO2 intensity (rhs)
kgoe/1000 EUR ton CO2 eq./1000EUR
Source: Eurostat
Overall savings for the building sector should account for 45% of total expected savings in 2020; this is ambitious given that only around 14% of the sector's 2020 target had been achieved by 2010.
The 2020 target of the NEEAP foresees that all new Irish houses should be nearly-zero-energy. Further saving potential will be harvested through the deployment of more energy-efficient boilers and domestic lighting. Significant improvements should also come from the roll-out of smart meters and residential retrofitting. Finally, to help the low-income households a programme called Affordable Energy Strategy will be implemented composed of several actions to tackle the issue of energy poverty.
Carbon intensity in households is close to the EU average and it has remained constant between 2009 and 2009.
5.2.4. Conclusions
Ireland is performing well in terms of energy intensity. While normally being characterized by high energy consuming sectors, the industrial sector has been able to reduce its energy intensity over the past years to become one of the most energy-efficient in the EU. However, margins for improvement still exist in the transport sector where clean transport modes and less polluting fuels should be further promoted.

European Commission Member States’ Energy Dependence
134
In terms of carbon intensity, it seems that Ireland could do more to boost its renewable sector. The size and impact of the support scheme appear rather limited and generally not sufficient to stimulate adequate private investments in the sector, except for wind power. However, the latest measures introduced by the Government are expected to yield good results and to help the country meet its ambitious targets. At the same time the rather high GHG emission levels suggest that the current pattern will be unsustainable in the long term and the country might face increasing costs for climate protection measures. Shifting away from the most polluting energy sources and reducing the energy loss in the transformation process could help reduce the CO2 intensity of the energy sector.
5.3. CONTRIBUTION OF ENERGY PRODUCTS TO TRADE
5.3.1. Net energy trade balance
Ireland's net energy trade deficit is not among the largest ones in the EU. While it was 3.6% of GDP in 2011, it fluctuated in the range of roughly -2% and -3% of GDP in the preceding years.
-4
-3
-2
-1
0
-10
-5
0
5
2007 2008 2009 2010 2011
% of GDP% of GDP
Graph II.5.10:Ireland - Trade balance of energy products and CA
CA (lhs) Oil (rhs)Gas (rhs) Total (rhs)
Source: Eurostat
The size of the energy trade deficit should be seen against the background of the country's current account balance. Since Ireland has recently managed to arrive at a more or less balanced current account, the trade surplus for the other product categories can be seen as compensating for the energy trade deficit. It should be noted
however that Ireland has implemented drastic structural adjustment and austerity measures over the past years, therefore the improvement in the current account balance (Ireland recorded a current account deficit of 5.7% of GDP in 2007) could be the consequence of the decrease in domestic demand which has in turn driven down imports, including energy imports. The long-term sustainability of the Irish energy trade deficit will therefore need to be monitored against the recovery of the Irish economy.
Looking at product categories, most of Ireland's energy trade deficit derives from the trade deficit of oil (products) which stood at -2.6% of GDP in 2011, and varied between -1.5% and -2.5 in the preceding years. The variation seems related with fluctuations in oil prices. The gas trade deficit grew in size between 2007 and 2011 but still remains modest (-0.8% of GDP).
5.3.2. Decomposition of the net energy trade balance
The energy trade balance can be decomposed in three multiplicative factors, namely the relative energy trade balance, the share of energy in total trade and the ratio of total trade to GDP (macro openness to trade). As regards the relative energy trade balance (i.e. the share of net exports in energy products in total cross-border energy trade), Ireland has a deficit among the five largest ones in the EU. This may be explained by the combination of a high import dependency and the absence of significant energy exports. However, this relative energy trade deficit does not translate into a deficit in GDP terms because of the quite low share of energy in total trade, actually the second lowest in the EU in 2011. This suggests that energy products, in terms of imports and exports combined do not constitute a major trading category for Ireland.
Table II.5.2:Decomposition of Energy Trade Balance
2007 2008 2009 2010 2011Energy trade balance (% GDP) -2.4 -3.2 -2.4 -3.0 -3.6Relative trade balance (%) -77.2 -77.5 -76.3 -73.2 -69.1Share of energy in total trade (%) 4.0 5.2 3.9 4.9 5.8Macro trade openness (% GDP) 78.9 79.2 79.7 85.5 88.8Source: Eurostat
The only exported energy goods of significance are peat briquettes, a solid fuel domestically produced in Ireland and sold exclusively to the UK, and refined oil products (about 1 Mtoe per

Part II Individual Country Files
135
year). In 2009, for the first time, the country also exported a marginal quantity of crude oil to the UK.
5.3.3. Conclusions
The current energy trade deficit of Ireland does not seem to indicate a major vulnerability concern, as it is not large as compared to other EU countries and as it is combined with a small current account surplus indicating that the trade balance for the other product categories compensates for this deficit. Moreover, the overall share of energy in total trade is quite small for Ireland. It should be noted, however, that the country has a significant trade deficit for oil and that it is still heavily reliant on oil in the energy mix. These two aspects could trigger adverse competitiveness shocks in the event of sudden price surges or supply shortages.
It is therefore important for Ireland to keep strengthening its resilience by further diversifying the energy mix and by pursuing its ambitious energy saving targets which will help further reduce the energy bills of its most energy-intensive industries.
5.4. REFERENCES
European Commission (2011a), 2009-2010 Report of Progress in creating the internal gas and electricity market.
European Commission (2011b), Annual Growth Survey 2012, Europe 2020 targets: climate change and energy, COM (2011) 815 of 23 November
European Commission (2012), Progress towards achieving the Kyoto Objectives, COM (2012) 626 of 24 October.
European Commission, Directorate-General for Energy (2012), Country Factsheets, available from: http://ec.europa.eu/energy/observatory/countries/countries_en.htm
Eurostat (2012), Energy statistics – Prices, available from: http://epp.eurostat.ec.europa.eu/portal/page/portal/energy/data/main_tables
European Environment Agency (2010), GHG trends and projections in Ireland.
International Energy Agency (2012), Ireland Review, Energy Policies of IEA Countries
Irish Commission for Energy Regulation (2012), Competition review in the Gas Market Q1 2012.
Irish Commission for Energy Regulation (2011), Annual Report to the European Commission
Irish Ministry of Finance (2011), Report of the Review Group on State Assets and Liabilities, April 2011
Republic of Ireland (2007), First National Energy Efficiency Action Plan, available from: http://ec.europa.eu/energy/efficiency/end-use_en.htm
Republic of Ireland (2011a), Second National Energy Efficiency Action Plan, available from: http://ec.europa.eu/energy/efficiency/end-use_en.htm
Republic of Ireland (2011b), National Renewable Energy Action Plan 2010-2020, available from: http://ec.europa.eu/energy/renewables/action_plan_en.htm
Steinhilber S., Ragwitz M., Rathmann M, Klessmann C. and Noothout P (2011), Indicators assessing the performance of renewable energy support policies in 27 Member States, D17 Report of RE-Shaping project.


6. ITALY
137
6.1. SECURITY OF ENERGY SUPPLY
Italy's import dependence is among the highest in the EU. 84% of its energy needs was covered by imports in 2010. Only four other EU countries have higher scores. This rate has been fairly constant over the past ten years and it reached its peak in 2007 when it was 87%. A new "National Energy Strategy" is currently under preparation and its main aim should be to achieve a more secure and cheaper energy supply stimulating investments and environmental sustainability(201).
(201) Government of Italy (2011)
80
85
90
95
100
105
2006 2007 2008 2009 2010
%Graph II.6.1:Italy - Import dependence
Gas Oil Solid fuels Total
Source: Eurostat
The energy mix is not among the most problematic ones but, since Italy does not produce nuclear energy, the shares of oil and gas are higher than the EU average.
Key Insights
Security of Energy supply:
- Despite its high energy dependence, Italy displays a number of mitigating factors: a wide range of trading partners and a well-diversified energy mix.
- Italy could be exposed to price shocks given its high reliance on non-EEA countries, especially for oil and solid fuels.
- High electricity and gas prices for households and industrial consumers are mainly caused by infrastructure bottlenecks, different degrees of competition across regions and a still relatively concentrated gas market.
Energy and carbon intensity:
- Italy displays good performance in terms of energy intensity in the main economic sectors.
- Considerable efforts are still needed to meet the emissions reduction target of 20% by 2020; renewable energy should be further promoted and significant energy efficiency improvements are required particularly in the transport sector.
Trade balance for energy products:
- Italy energy trade deficit does not stand out among those of the EU countries, because of the moderate share of energy in total trade and the low macro trade openness, typical for large countries.
- However, developments in the country's current account appear to correspond with those of the energy trade balance. Therefore energy price shocks could expose the country to a deterioration of its external position and erosion of competitiveness.

European Commission Member States’ Energy Dependence
138
6.1.1. Primary energy sources
6.1.1.1. Oil
The first source of energy used in Italy is oil. Oil share in the energy mix was 40% in 2010, 5 percentage points higher than the EU average. Oil consumption has been steadily decreasing over the last ten years as well as its share in the energy mix(202). Oil went from accounting for nearly 50% of the energy mix to the current 40%.
0
20
40
60
80
100
2006 2007 2008 2009 2010
%Graph II.6.2:Italy - Energy mix
Gas Oil Nuclear Renewables Solid fuels
Source: Eurostat
Italy imports almost all its oil needs, the share has been constant over the years around 93%, almost 10 points higher that the EU average. Imports come via a well-diversified range of countries(203): the main trading partners in 2010 were Libya, Russia, Iran, Azerbaijan, Iraq and Saudi Arabia. Italy imports 96% of its oil and petroleum products via non-EEA countries. Extraction activities started in Italy in the 1960s. Although drilling has not progressed much lately, domestic production of crude oil has remained almost constant from the end of the 1980s until now and it fluctuates between 4 and 6 million tonnes per year serving some 6% of domestic consumption in 2009. ENI is the leader of the sector, accounting for more than 50% of total crude oil production(204). In 2010, refinery capacity was equal to 106 million tonnes. Italy is a
(202) In 2000, Italy consumed 90 million tonnes of oil compared
to 73 million tonnes of 2009. Total consumption decreased of a further 1.9% in 2010.
(203) HHI for oil is 152, which is among the lowest in the EU. (204) Italy has 2618 km of pipelines for oil, divided into 41
sections of which ENI owns 15 and 17 refineries, 7 of which belong to ENI.
net exporter of finished products with a positive trade balance position in 2009 of EUR 3.4 bn(205). However, the exports of refined products have decreased by 11% between 2004 and 2009.
6.1.1.2. Gas
The second source of energy used in Italy is gas. In 2010 it accounted for 39% of the energy mix, 15 percentage points higher than the EU average. Only the UK and the Netherlands have a higher share of gas in their mix. Unlike the Netherlands, however, Italy has few national gas fields. 90% of domestic consumption is covered by direct imports, while the remaining 10% come from domestic production.
0.1
0.2
0.2
0.3
2006 2007 2008 2009 2010
Graph II.6.3:Italy - HHI index energy imports
Gas Oil Solid fuels
Source: Eurostat
Imports' sources are relatively diversified: the HHI for gas is the third lowest in the EU after Spain and France. The main suppliers in 2010 were Algeria (37%), Russia (29%) and Libya (12.5%). Nearly all the gas supply comes through pipelines. Only 2 LNG terminals are currently active in Italy and they cover some 10% of the country needs.
A well-functioning and interconnected gas market with competitive and market-based prices should provide the correct incentives for further investments and signals to consumers for an efficient and sustainable use of resources. Both elements are conducive to reducing the vulnerability of the country to energy-related shocks.
(205) Unione Petrolifera Italiana

Part II Individual Country Files
139
Security of gas supply suffers from lack of adequate infrastructures, but many projects are underway. Two recent events have caused problems in gas supply: a landslide on the Transitgas pipeline which temporarily stopped imports from Norway, and the Libyan crisis. Five new pipelines projects for an additional capacity of 39.5 G(m3)/year are currently under construction to reinforce interconnections with southeast Europe and Central-Asia, with northern neighbours such as Austria and Germany and with the Mediterranean countries. Also, 12 new LNG regasification terminals are under construction(206). According to the Italian Energy Regulator, this should bring additional import capacity of around 20 M(m3), "enough to offset potential import shortage from unstable neighbouring countries"(207). Finally, storage capacity is also expected to increase further: 14 storing facilities are currently being developed.
The Italian gas market remains relatively concentrated, albeit less so than many other Member States, especially in the import and generation segments. The first three companies account for 73.4% of total imports. The same three companies hold 42.3% of the wholesale market. Among the three ENI has a particularly dominant position(208). ENI also controls the gas transportation infrastructures through the ownership of the Independent Transmission Operator, Snam Rete Gas(209); it is also the first operator per distribution capacity with a share of 22% and it owns 8 out of the 10 storage facilities of the country(210). Italy is the second country in the EU for gas storage capacity.
(206) However due to burdensome authorization procedures only
2 of them should be up and running by the second half of 2012
(207) Autorità per l'Energia e il Gas (2011), page 98. (208) In 2011 ENI accounted for 83% of domestic production (a
reduction of 2 points with respect to 2010); 41.4% of total imports.
(209) Snam Rete Gas owns 31,000 out of 33,000 km of the gas transportation grid.
(210) Recent government decrees lay out measures to separate SNAM and ENI through the model of the Ownership Unbundling. The separation should be completed by September 2013 and it should contribute to improving the competition level of the market.
75
80
85
90
95
100
2006 2007 2008 2009 2010
%
Graph II.6.4:Italy - Non-EEA share of imports
Gas Oil Solid fuels
Source: Eurostat
Gas is traded by wholesalers mainly on the basis of bilateral "take-or-pay" contracts. From December 2010 the Gas Exchange became operational; however, its functioning remains still embryonic. The volume of spot imports has actually slightly decreased (from 10.6 % in 2010 to 9.5 % in 2011). Therefore price formation in the gas market is still highly dependent on the oil indexation. Because of this, the Italian wholesale prices have significantly distanced themselves from those of other EU markets, where the prices are less dependent on the oil indexation.
Market concentration in gas retail is not among the highest of the EU although one operator accounts for almost 50% of the market. 370 operators are active in the gas retail market, and the market shares vary substantially across regions. In the more competitive regions, Veneto and Lombardy, the first three companies have a market share of 47%, while in the least competitive regions, Lazio and Calabria, the first three companies cover more than 90% of the market.
Market concentration combined with an underdeveloped spot market is responsible for gas prices higher than the EU average, which also affect electricity prices. For medium-sized household consumers, gas prices during the second semester of 2011 were the highest in Sweden, Denmark, and in Italy. However for industrial consumers, Italian prices are below the EU average(211).
(211) Eurostat (2012)

European Commission Member States’ Energy Dependence
140
6.1.1.3. Renewables
The third source of energy used comes from renewables. At 10%, the share of renewables in the Italian energy mix is in line with the EU average. The share of renewables has been steadily increasing over recent years. The progress of Italy towards the 2020 targets for renewables seems to be in line with the expectations of the National Renewable Energy Action Plan (NREAP).(212) Its binding RES target for 2020, stipulated in the renewables directive, is 17%.
0
20
40
60
80
100
2006 2007 2008 2009 2010
%Graph II.6.5:Italy - Renewable mix
Hydro Biomass Wind Solar Geothermal
Source: Eurostat
Renewables play a central role in electricity generation where they account for 27% of total generation. In particular, over the last years there was a dynamic growth in solar power, whose contribution to electricity production increased from almost zero in 2007 to 10.7 TWh in 2011. At the end of 2011, the amount of installed PV capacity in Italy was 12.8 GW, out of 69.7 GW installed worldwide(213). Wind power also reported a major jump over the same period going from 2.9 TWh to 10.1 TWh. Total generation of renewable energy increased from 57 TWh to 84 TWh in 2011, with hydro power slightly increased over this period and remaining the most important technology for renewable electricity generation. The role of renewables in heat and transport is less important than in electricity, with 8% and 4% market share respectively.
Support measures included a mix of a feed-in premium mechanism (“Conto Energia”) for solar power, tradable feed--in tariffs for small
(212) Republic of Italy (2011b) (213) Stagnaro, S. (2012)
installations and green certificates with technology banding, and as well as tax rebates for biofuel producers. In addition, distributors were required to accept and dispatch "green" energy with top priority, regardless of the volumes offered. Financial support to solar power projects was estimated at €5 billion in 2011. Italy's support scheme for renewables affects electricity prices as it is included in the final consumers' bills under the title "general management charges"; it accounts for some 11% of the final consumer's bill(214). Among the charges generated by the support scheme, there are those of the so-called CIP6 scheme which has been in place since 1992 but should now be phased out as it covers sources not considered "renewables" by the community legislation.
According to a study based on 2011 data, the levels of support for solar, wind and biomass were among the highest in Europe, significantly above the average production costs(215). Incentives for solar power were, however, significantly decreased from May 2011 in order to adjust to falling production costs. A recent modification of the support scheme introduced a new element of uncertainty for the operators that is the adoption of the Dutch Auctioning system to determine the amount of the subsidies. The auctioning is per se unpredictable and therefore its outcome is difficult to predetermine.
6.1.1.4. Solid fuels
The fourth source of energy used is solid fuels which account for 8% of the energy mix(216), half of the EU average (16%). Italy imports 98% of its solid fuel needs; domestic coal production is negligible, while the production of coke is slightly more significant. The country was actually a net exporter of coke in 2009. Italy has a very high geographical diversification for solid fuel imports, but only 8% of solid fuels are imported from EEA countries. The main trading partners are Indonesia, South Africa and the United States.
(214) Autorità per l'Energia e Gas, (2011b) (215) Steinhilber S., Ragwitz M., Rathmann M, Klessmann C.
and Noothout P (2011) (216) It decreased by 1 p.p. compared to 2006.

Part II Individual Country Files
141
6.1.2. Secondary energy sources
In 2010, Italy was the third biggest importer of electricity in the EU, after Lithuania and Luxembourg. It imports every year around 15% of its electricity consumption. All its trading partners are EEA countries, with France and Switzerland as the main partners. From 1 January 2011, a market-coupling project on the Slovenia-Italy interconnection became operational.
Domestic electricity production is derived mainly from gas (52%, the fourth highest share in the EU), renewables (27%), solid fuels (13%) and oil (7%).
0
20
40
60
80
100
2006 2007 2008 2009 2010
%Graph II.6.6:Italy - Electricity mix
Gas Oil Nuclear Renewables Solid fuels
Source: Eurostat
Good electricity interconnections and adequate domestic infrastructure capacity are important to shelter the country from supply shocks and to enable a proper absorption of renewables. A competitive and dynamic electricity market should cater the necessary investment incentives and provide the right price signals to consumers.
Italy's electricity network is often at risk of congestion(217) and further infrastructures and interconnections would be needed to ensure its proper functioning. The TSO is in charge of developing the infrastructure network. Several billions of euros worth of projects are currently awaiting approval from local authorities. Authorization procedures are particularly long and can take up to 7-8 years.
The electricity network is characterized by fragmentation across regions, due to infrastructure bottlenecks which are particularly (217) Council of European Energy Regulators (2012)
evident in the case of Sicily and Sardinia. This translates into noticeable zone price differentials, which in turn affects final consumer prices. Electricity is exchanged on the Borsa Elettrica managed by the GME (Gestore Mercati Elettrici), which applied to sellers the System of Marginal Prices per zone(218) and to buyers an average price of the five zones(219).
In comparison to the main EU electricity exchanges, the Italian wholesale prices are significantly higher: in 2011 they have been between 25 and 20 euros/MWh higher(220). The electricity wholesale market is relatively concentrated although progress has been made over the last years. The aggregate share of the 5 main companies is above 60%(221).
The degree of competition in electricity distribution and retail is increasing. Distributor operators are mostly public utilities but the share of private entities is increasing. The number of active operators vary substantially across regions, from a minimum of one (Liguria, Molise, Basilicata, Calabria) to a maximum of 70 (Trentino-Alto Adige). The main distributor in Italy has a market share of 86%. In the retail market, in 2011 the incumbent had a market share of 37% of total sales while the second operator's share was 8%.
Final electricity prices are higher than the EU average both for households and for industrial users. The situation has slightly improved between 2010 and 2011. Prices for the median households still appear higher than the EU average and they are the 7th highest in the EU. The industrial consumers' prices used to be 40% higher than the EU average while in 2011 they were around 34% higher than the EU27 average making Italy the third most expensive country in the EU after
(218) For this purpose Italy is divided into 5 zones: North,
Center, South, Sicily and Sardinia. (219) The number of operators registered in the Energy
Exchange increased significantly between 2009 and 2010, from 116 to 134.
(220) Autorità per l'Energia e il Gas (2012),. (221) A Herfindahl index above 2,000 indicates high
concentration. The HHI index registered a decrease in concentration between 2010 and 2011 and it went from 1.119 to just below 1.000. However, market concentration varies across the country because of the differential in equipment capacity of the different areas of the country: In Sicily and Sardinia for instance the HHI is above 3.500.

European Commission Member States’ Energy Dependence
142
Cyprus and Malta. The tax component is around 30% of the final prices for both categories.
6.1.3. Conclusions
Despite its high energy dependence, Italy seems to present a number of mitigating factors such as the wide range of trading partners and the mix of energy sources which appear adequate to ensure the country's security of supply. However, Italy could suffer from price shocks given its high reliance on non-EEA countries, especially in the oil and solid fuels markets where domestic production is extremely low. Electricity imports are also very high despite being entirely intra-EU: any surge in import prices could therefore put additional pressure on the already high end-user's bills. Concentration in the gas sector and an underdeveloped spot market also constitute reasons for concern: limited competition implies inefficient allocation of resources in the economy and impacts negatively on the competitiveness of Italian companies.
Italy's priorities should be focused on reducing electricity and gas prices. A number of measures are already on the table and swift implementation is now required to speed up the uptake of most needed infrastructures and to ensure a better functioning of the gas market. Particularly important would be to even out the degree of efficiency of the electricity and gas networks across the country, to eliminate bottlenecks which increase costs and impede competition.
6.2. ENERGY AND CARBON INTENSITY
Italy's economy has one of the lowest energy intensity in the EU. However energy intensity decreased only by 3% between 2001 and 2010, which is a slow improvement, especially compared to progress in other EU countries such as the UK (-22%), Spain (-13%) and France and Germany (both -11%).
Table II.6.1:Energy and carbon intensity
Energy intensity of the economy 1) 124 -2.9CO2 intensity of the economy 2) 0.35 -8.1Share of energy intensive sectors in Gross Value Added 3) 8.4 -1.2
Energy intensity of the economy 1) 152 -4.7CO2 intensity of the economy 2) 0.41 -9.1Share of energy intensive sectors in Gross Value Added 3) 8.9 -0.9Source: Eurostat
2010 percentage change2006 - 2010
memo items: EU27
Notes: 1) Kg of oil equivalent per 1000 EUR, changes in percent; 2) Tonnes of CO2 equivalent per 1000 EUR, changes in percent; 3) percent of total gross value added, changes in percentage points, latest data refer to the year 2009.
Italy expects to exceed its overall savings target for 2016 by 0.6% of the baseline. The National Energy Efficiency Action Plan (NEEAP) runs for the period 2008-2016. The savings target to be reached by 2016 is an overall decrease in final energy consumption (FEC) by 9% relative to the baseline level.(222)The second NEEAP shows that Italy managed to exceed all its intermediate FEC savings targets for 2010, apart from in the Transport sector which fell marginally short of expectations.
A number of initiatives have already been implemented to ensure that these targets are met. A support scheme for energy efficiency measures with the use of "White certificates(223)" is in place since 2005. In addition, tax deductions of up to 55% of total costs are available for households and industries undertaking energy efficiency improvements in buildings(224).
The carbon intensity of the Italian economy as a whole is in line with the EU average. The situation has remained stable since 2006.
However total GHG emissions reduction has been very slow, only 3% between 1990 and 2010.(225) According to the latest projections, Italy is the only EU country which will miss its Kyoto targets by a gap of about 3%(226).
(222) Republic of Italy (2007): The baseline is the average
annual final energy consumption over the period 2001-2005.
(223) Italian Distribution System Operators (DSO) of gas and electricity with more than 50,000 customers are obliged to achieve energy savings not smaller than the target defined within the scheme. White certificates are documents certifying that a certain reduction of energy consumption has been attained.
(224) A recent law reduced these deductions to 36% after 30 June 2013.
(225) European Commission (2012) (226) European Environment Agency (2010): emissions in
carbon dioxide-equivalent (CO2-eq) terms increased from 517.05 million tonnes to 541.49 million tonnes during the

Part II Individual Country Files
143
0.30
0.33
0.35
0.38
0.40
120
123
125
128
130
2006 2007 2008 2009 2010
Graph II.6.7:Italy - Energy and carbon intensity of the economy
Energy intensity (lhs) CO2 intensity (rhs)
kgoe/1000 EUR ton CO2 eq./1000EUR
Source: Eurostat
Italy is also running the risk of not meeting its obligations in the framework of the EU climate agenda. According to the Effort Sharing Decision, emissions(227) for the non-ETS sectors should be reduced by 13% in 2020 compared to 2005 levels. The latest estimations show that even in the case of additional measures, Italy is likely to achieve a reduction of only 5%(228).
The share of GHG emissions falling under the ETS are 38% of the total, a couple of points below the EU average. From 2013 onwards there will be an EU-wide emission cap and the emission allowances will have to be auctioned and this will put further pressure on electricity prices which are already among the highest in the EU. The impact might be aggravated by the high carbon intensity of the power sector (see next paragraph). However the current low carbon prices would put the potential energy costs increase within a limited range.
6.2.1. Industry
Energy intensity in industry is among the lowest in the EU. However, as for the overall energy intensity of the economy, the rate of improvement has been less than half of that of the EU27, lower than that of Spain and the UK but higher than that of France and Germany. The share of energy-
period 1990-2008 - a growth of 4.7 % - whereas, according to the Kyoto Protocol, Italy should have reduced its emissions during the period 2008-2012 by 6.5 % relative to the 1990 level - down to 483.44 Mt CO2-eq.
(227) Decision 406/2009/EC (228) European Commission (2011)
intensive sectors in total gross value added of industry is somewhat lower than the EU average.
2.35
2.40
2.45
2.50
2.55
125
130
135
140
145
2006 2007 2008 2009 2010
Graph II.6.8:Italy - Energy intensity of industry, carbon intensity of energy use
Energy intensity of industry (lhs)CO2 intensity of energy use (rhs)
kgoe/1000 EUR ton CO2 eq./1000EUR
Source: Eurostat
As of 2009, good results have been achieved by the iron and steel industry and the chemical sector, while the worst performers have been the paper industry and the non-metallic minerals which remained at the level of 2000.
The second NEEAP forecasts that Industries will account for 17% of total expected savings in 2016. The sector had already achieved 38% of the absolute value of this share by 2010, having exceeded its intermediate savings forecast by almost a fifth. Good results were achieved through cogeneration installations which account for one fourth of total industry savings and through replacement of cooling systems and boilers. On the other hand, progress was disappointing in other areas, such as the substitution of low efficiency electric motors with high efficiency ones, application of inverters on electric motors and adoption of mechanic steam compressors(229). The largest potential for further savings is identified in efficient lighting and high-efficiency electric motors.
Italy's energy mix is heavily dependent on fossil fuels, which explains the high level of the carbon intensity of energy use: petroleum, gas and solid fuels account for 88% of gross inland energy consumption, compared to an EU average of 77%. This is explained by the fact that Italy does not have nuclear energy production and that (229) Republic of Italy (2011a)

European Commission Member States’ Energy Dependence
144
the share of renewables is still low. Italy could therefore be relatively more exposed to changes in carbon prices than other EU countries as a result of the implementation of climate change policies. The power sector represents around 60% of total emissions.
6.2.2. Transport
Energy intensity in transport is among the lowest in the EU and it has improved from 2006. The first NEEAP saving targets included only one measure for transport, i.e. the reduction of CO2 emissions. One additional measure has been added to the second NEEAP which also relates to CO2 emissions and is derived from the implementation of the EU Regulation 443/2009 on emission reduction requirements for light vehicles. Excise duties on petrol and gas oil have long been among the highest in the EU and recent Government measures have further increased them, making Italy the second most expensive country in the EU.
1.20
1.23
1.26
1.29
1.32
1.35
435
443
450
458
465
2006 2007 2008 2009 2010
Graph II.6.9:Italy - Energy and carbon intensity of transport
Energy intensity (lhs) CO2 intensity (rhs)
kgoe/1000 EUR ton CO2 eq./1000EUR
Source: Eurostat
According to the second NEEAP, the transport sector has been so far the worst performer in terms of energy savings, having missed its intermediate target by 15%. Overall, it is expected to account for 18% of total savings in 2016, although this seems ambitious in light of the sector's performance so far: by 2010, it had managed to achieve just 12% of the absolute value of its target for 2016.
The carbon intensity of the transport sector is in line with the EU average.
6.2.3. Households
Households' energy intensity was one of the lowest in the EU in 2010, although it has slightly deteriorated since 2006.
0.10
0.11
0.13
0.14
0.15
30
32
34
36
38
2006 2007 2008 2009 2010
Graph II.6.10:Italy - Energy and carbon intensity of households
Energy intensity (lhs) CO2 intensity (rhs)
kgoe/1000 EUR ton CO2 eq./1000EUR
Source: Eurostat
Italy's second NEEAP reveals that the Household sector has been the best performer in terms of the 2010 interim savings targets; the sector exceeded its target by almost 85%, and was the primary driver of the overall outperformance of the economy in FEC savings.
It is forecasted that households will account for around 45% of total expected savings in 2016, equivalent to almost double the sector's energy savings in 2010. The estimations were made on the basis of the current support scheme for energy efficiency in buildings (55% tax deductions on total costs and EUR 60.000 ceiling until the end of June 2013). A comparison at EU level shows that despite the relatively good results, improvements in Italy have been slower than in the rest of the EU. Between 2000 and 2008, the rate of savings was half that of the EU average, a third of that of Germany and a fifth of that of France. It was, however, higher than that of the UK and Spain.
Finally, Italy has one of the lowest weights of energy products in household expenditure in the EU. The potential increases of electricity prices due to either the RES support schemes or the ETS auctioning might therefore hit the Italian households relatively less than in other Member States.

Part II Individual Country Files
145
6.2.4. Conclusions
Italy has a good performance in terms of energy intensity. However, it still has considerable efforts to undertake in order to meet the emissions reduction target of 20% by 2020.
The development of renewable energies should be pursued to reduce the dependence on solid fuels and petroleum products and the relatively high carbon intensity of the energy sector to confine potential impacts of further hikes in electricity prices. Simultaneously, efforts in energy efficiency should continue especially in the transport sector where a more efficient use of railways could help reduce the carbon footprint. Cost-effectiveness of the renewable sources support scheme might be improved if some of the distortive subsidies currently in place (CIP 6, see section 6.1.1.3) were phased out and if the overall level of support remains within sustainable margins.
6.3. CONTRIBUTION OF ENERGY PRODUCTS TO TRADE
6.3.1. Net energy trade balance
Italy's energy trade deficit in 2011 of 3.8% of GDP is not among the largest ones in the EU. The energy trade deficit has deteriorated over the period under consideration, as in 2007 IT stood at 1.9% of GDP. The trade deficit for gas recorded a particularly sharp deterioration in the last 5 years going from 0.0% in 2007 to -1.4% in 2011. The trade balance for petroleum products also deteriorated from -1.6% to -2.2% of GDP.
-4
-3
-2
-1
0
-6
-4
-2
0
2
2007 2008 2009 2010 2011
% of GDP% of GDP
Graph II.6.11:Italy - Trade balance of energy products and CA
CA (lhs) Oil (rhs)Gas (rhs) Total (rhs)
Source: Eurostat
The size of the energy trade deficit should be seen against the background of the country's current account balance. The deterioration of the current account balance has been similar in size to the one of the energy trade balance. The current account deficit increased from -2.4% in 2007 to -3.2% of GDP in in 2011. The Bank of Italy claimed in a recent communication to the Italian Parliament that in 2011 the increase in the imports of energy products has doubled the country's trade deficit.
6.3.2. Decomposition of the net energy trade balance
The energy trade balance can be decomposed into three multiplicative factors, namely the relative energy trade balance (i.e. the share of net exports in energy products in total cross-border energy trade), the share of energy in total trade, and the ratio of total trade to GDP (macro openness to trade).
Table II.6.2:Decomposition of Energy Trade Balance
2007 2008 2009 2010 2011Energy trade balance (% GDP) -1.9 -2.2 -2.7 -3.3 -3.8Relative trade balance (%) -50.8 -49.0 -65.2 -61.0 -60.9Share of energy in total trade (%) 7.9 9.6 10.7 11.9 12.7Macro trade openness (% GDP) 47.5 47.7 38.8 45.4 49.1Source: Eurostat
Italy's relative energy deficit in 2011 is among the five largest ones in the EU: 61%. However, it is in line with that of the larger EU countries, except for the UK (DE -66%, FR -60% and ES -57%). The high relative deficit may be explained by the combination of a high import dependency and the absence of significant energy exports. However, it does not translate into a similarly high energy trade deficit in GDP terms because its share of energy trade in total trade does not stand out (in 2011 12 countries have a larger share) and its macro trade openness is among the lowest in the EU, together with other large countries (except Germany) and, for other reasons, Greece and Cyprus.
6.3.3. Conclusions
Italy's energy trade deficit appears moderate in size when compared to those of the other EU countries. Developments in the country's current account seem to correspond to those in the energy trade balance; arguably demonstrating the energy dependence of Italy's external balance. A shock in energy prices could erode its competitiveness and deteriorate its current account through its impact

European Commission Member States’ Energy Dependence
146
on domestic prices. However, this structural feature of the Italian economy cannot be expected to be altered in the short to medium term.
A reorientation towards more secure import sources and further efforts to reduce Italy's high energy dependency should be priorities for the country's energy policy.
6.4. REFERENCES
Autorità per l'Energia e il Gas (2011a), Annual Report to the European Commission, July 2011
Autorità per l'Energia e il Gas (2012), Annual report to the Agency for the Cooperation of Energy Regulators and to the European Commission, July 2012
Autirità per l'Energia e il Gas (2011b), Comunicato, 30 June 2011.
Council of European Energy Regulators (2012), Online Databases, Union of International Associations
European Commission (2011), Annual Growth Survey 2012, Europe 2020 targets: climate change and energy, COM (2011) 815 of 23 November
European Commission (2012), Progress towards achieving the Kyoto Objectives, COM (2012) 626 of 24 October.
Eurostat (2012), Energy statistics – Prices, available from: http://epp.eurostat.ec.europa.eu/portal/page/portal/energy/data/main_tables
Republic of Italy (2007), First National Energy Efficiency Action Plan, available from: http://ec.europa.eu/energy/efficiency/end-use_en.htm
Republic of Italy (2011a), Second National Energy Efficiency Action Plan, available from: http://ec.europa.eu/energy/efficiency/end-use_en.htm
Republic of Italy (2011b), National Renewable Energy Action Plan 2010-2020, available from: http://ec.europa.eu/energy/renewables/action_plan_en.htm
European Environment Agency (2010), GHG trends and projections in Italy.
Government of Italy (2011), Nuova Strategia Energetica Nazionale, August 2011
Stagnaro, S. (2012), "How solar subsidies can distort the power market", European Energy Review, 5 July 2012
Steinhilber S., Ragwitz M., Rathmann M, Klessmann C. and Noothout P (2011), Indicators assessing the performance of renewable energy support policies in 27 Member States, D17 Report of RE-Shaping project.
Unione Petrolifera Italiana, http://www.unionepetrolifera.it/

7. CYPRUS
147
7.1. SECURITY OF ENERGY SUPPLY
Cyprus was completely energy dependent in 2010, with no improvement recorded since 2006. Furthermore, its energy mix relies almost exclusively on oil with just a minor contribution from renewables and solid fuels.
60
70
80
90
100
110
120
2006 2007 2008 2009 2010
%Graph II.7.1:Cyprus - Import dependence
Oil Solid fuels Total
Source: Eurostat
7.1.1. Primary energy sources
7.1.1.1. Oil
Cyprus' energy consumption depends almost fully on imported refined oil products. The share of oil in the energy mix was 95% in 2010, one point less than in 2006. There is no domestic supply of crude oil or oil products; the national refinery plant was closed in 2004. The share in gross inland energy consumption is the highest in the EU except for Malta (which has a 100% share). This reflects of course the specific challenges posed by their geographical status as islands in the Mediterranean.
In Cyprus, about 42% of imported oil products go to electricity generation including CHP plants, another 42% to transport including bunkers for international maritime and aviation transport,
Key Insights
Security of Energy Supply:
- Cyprus’ energy consumption depends almost fully on imported oil products. This makes the country one of the most vulnerable in the EU in terms of security of energy supply. As electricity generation relies for 99% on oil inputs, all other sectors of the economy also depend indirectly very strongly on oil.
- The ensuing risks for the security of energy supply are diminished by the strong diversification of oil suppliers. The reliance on oil in combination with a cost-based price regulation of the state-owned electricity company has led to high and volatile electricity prices. The lack of interconnections with other countries compounds these risks to the security of supply.
Energy and Carbon Intensity:
- The Cypriot economy might be vulnerable to changes in energy prices as its energy intensity is above the EU average and overall it has high carbon intensity, especially in energy use.
- The transport sector is one of the major concerns as it has the third highest energy intensity in the EU.
- Policy initiatives to combat carbon emissions will have an upward effect on energy prices. However, the impact on industries and consumers is not expected to be disproportionally high, while the correct price signals could lead to a more efficient use of the resources.
Trade balance for energy products:
- Cyprus can be characterised as the most vulnerable country in terms of the external dimension of energy dependency because it had the second largest energy trade and current account deficits in 2011. The energy trade deficit has increased between 2007 and 2011 and varies with changes in the oil price, revealing its exposure to oil price shocks. The very high share of energy in total trade (currently almost a quarter) further illustrates the Cyprus's vulnerability to potential macroeconomic imbalances.

European Commission Member States’ Energy Dependence
148
6% to industry, 8% to other energy destinations and over 2% is for non-energy uses(230).
0
20
40
60
80
100
2006 2007 2008 2009 2010
%Graph II.7.2:Cyprus - Energy mix
Gas Oil Nuclear Renewables Solid fuels
Source: EurostatNote: Non-renewable waste and electricity are excluded
The energy dependence on imported oil products is overwhelmingly high as these products also constitute the dominant energy source for all sectors: electricity generation relies for 99.7% on petrol inputs and (inland) transport for 98%. Industry energy use directly depends on oil products for 70%; taking account of the petrol base of the electricity used this percentage becomes significantly higher (89%). This also holds for agriculture, which sources its energy from oil for 65% directly and for 97% in total. The impact of the indirect oil dependence is even more pronounced for the other sectors: the residential sector depends on oil for 33% directly and for 80% in total; for the services sector, the corresponding shares are 9% and 92%, respectively.
However, the risks for the security of energy supply from this huge reliance on oil products imports are mitigated by the strong diversification of the countries of origin. The HHI of oil imports is low at around 0.05. EU countries accounted for more than 50% of these imports in 2010. This share has substantially increased over the past years, with a notable surge in recorded deliveries from Malta and to a lesser extent from Member States in North-West Europe (among which the UK, Belgium, the Netherlands). Neighbouring Mediterranean Member States have maintained their substantial market shares. It seems that a
(230) These percentages and those in the next paragraphs are
derived from the IEA's 2009 Energy Balance for Cyprus, unless stated otherwise.
substantial part of the high EU market share should be attributed to trade in oil products rather than production. Malta is the most significant example.
40
50
60
70
80
90
100
2006 2007 2008 2009 2010
%
Graph II.7.3:Cyprus - Non-EEA share of imports
Oil Solid fuels
Source: Eurostat
7.1.1.2. Renewables
The second source of energy used in Cyprus is renewable energy. It accounts for 4% of its energy mix, or 4.9% of the gross final energy consumption (up from 2.5% in 2006)(231). By 2010 Cyprus has already achieved its interim target of 4.9% of gross final energy consumption, but the binding targets for 2020, at 13%, seems very ambitious but achievable.(232)
Around 60% of RES originate from solar energy and around 40% from waste and bio-fuels. Of the latter over 40% are imported, leading to a 20% import share for all RES used in Cyprus. The inland production of solar energy may be underestimated since it may not include all the energy from privately-owned solar panels used for powering own boilers. The key support instruments at national level are feed-in tariffs for large projects guaranteed for a 20 year period, and
(231) The share of renewables in the energy mix means the share
of renewable energy in gross inland energy consumption. We use this denominator consequently in the EDI to assess the share of each energy source in the energy mix. On the other hand, Member States' renewable targets for 2020 are expressed as a share of renewable sources in final energy consumption, i.e. excluding transmission, distribution and transformation losses. This explains the difference between the two figures.
(232) Republic of Cyprus (2011b)

Part II Individual Country Files
149
direct subsidies for small scale projects in electricity and heat generation.(233)
0
20
40
60
80
100
2006 2007 2008 2009 2010
%Graph II.7.4:Cyprus - Renewable mix
Hydro Biomass Wind Solar Geothermal
Source: Eurostat
7.1.1.3. Solid fuels
The third energy source used in Cyprus is solid fuels, constituting the remainder of gross inland consumption, less than 1% in 2010. This is the lowest solid fuel share among EU Member States. All solid fuels are imported. Almost all of it concerns hard coal; the rest is lignite. Ukraine is the major supplier and all the imports come from non-EEA countries. Industry is the sole sector using this energy source; it accounts for about 5% of its energy demand.
0.0
0.2
0.4
0.6
0.8
1.0
2006 2007 2008 2009 2010
Graph II.7.5:Cyprus - HHI index energy imports
Oil Solid fuels
Source: Eurostat
(233) Steinhilber S., Ragwitz M., Rathmann M, Klessmann C.
and Noothout P (2011)
7.1.1.4. Gas
Currently, Cyprus does not use natural gas as energy source. However, Cyprus has planned to start exploiting from 2018 onwards a very large natural gas field situated in its own coastal waters. Drilling has started at the end of 2010. In the meantime, Cyprus intends to use gas for electricity generation, to be sourced by imports of LNG. These developments hold the promise of a paradigm change in Cyprus’ energy sourcing and hence its security of supply profile.
7.1.2. Secondary energy sources
Cyprus does neither import nor export electricity, as there is no network connections to any neighbouring country on the mainland(234). The electricity mix relies exclusively on oil except for 1% of renewables in 2010.
0
20
40
60
80
100
2006 2007 2008 2009 2010
%Graph II.7.6:Cyprus - Electricity mix
Gas Oil Nuclear Renewables Solid fuels
Source: Eurostat
Adequate domestic infrastructure capacity is important to shelter the country from supply shocks and to enable a proper absorption of renewables. A competitive and dynamic electricity market should cater the necessary investment incentives and provide the right price signals to consumers. However Cyprus presents some physical limitations, due to its geographical position. Other bottlenecks are related to the market structure: the state-owned EAC is the only electricity company present on the Cyprus' electricity market. In line with Community legislation, it has unbundled its accounts for transmission and distribution activities. In
(234) Cyprus' network is connected with the network of the parts
of the island currently not under control of the republic.

European Commission Member States’ Energy Dependence
150
addition, the independent regulator CERA imposes price cap regulation on the basis of costs and acceptable profit margins on the different activities in the electricity supply chain. This regime reportedly complies with Community legislation as Cyprus has derogations on the basis of its status as small and isolated island and emerging market.
The shutdown of the largest power plant caused by the explosion at Vasilikos on 11 July 2011 poignantly illustrates the security of supply risks of the isolated nature of its electricity network. The extensive damage led to a full shut-down in the first weeks. The drastic immediate reduction in capacity (40% or more) led to several unplanned power outages in the first weeks after the explosion. The government responded with calls for voluntary energy savings and with identifying sectors (including tourism) which in view of their economic importance should get priority when demand exceeded the limited capacity.
Meanwhile, the capacity constraint has lessened as EAC has employed mobile generators while demand fell below the peak value of the tourism season. The challenge is now to structurally adapt to the current capacity constraints and to restore capacity in the longer term, through reparations and investments in new capacity. EAC expects to have 450 MW of production capacity already restored in 2012. The almost complete reliance on oil as energy source for electricity generation has also led to electricity prices belonging to the highest in the EU, both in pre and after tax terms, and together with the cost-based price regulation it implies high price volatility. In 2009, Cyprus recorded the steepest electricity price increase in the EU for both customer groups (namely falling in the range of 20 to 30%). Currently Cyprus has the highest electricity prices for industrial consumers and the third highest for households in the EU.(235)
It is important to put the emphasis on the potential impact of climate policies on the electricity price. There are two effects at play: first, the price of CO2 emissions as determined in the ETS; second, the (higher) costs of RES used for electricity generation (RES-E). These effects may to lead to an upward effect on electricity prices in the order of magnitude of, respectively, 5% to 6 ¼ % and of 20% or more (the latter (235) Eurostat (2012)
unavoidably includes the ETS effect). However, these effects would take place against the background of a general electricity price decrease because of the introduction of natural gas. In addition, as explained in paragraph 2, Cyprus' power sector will be entitled to free emissions allowances.
Regarding renewables, it appears that the RES support schemes have so far lifted final electricity prices by 2¾ to 3½% from the levels without a support scheme (the period 2007 – 2010 taken as basis). However, longer-term benefits are expected from renewables, which warrant their further development, namely a reduction of import dependency, and hence a more limited exposure to oil's price variations and the possibility of trading emission allowances in excess, with in addition the beneficial effects on the environment and air quality.
7.1.3. Conclusions
Cyprus’ energy consumption depends almost fully on imported refined oil products and this makes the country one of the most vulnerable in the EU in terms of security of energy supply. As electricity generation relies for 99% on petrol inputs, all other sectors of the economy also depend indirectly very strongly on oil. The ensuing risks for the security of energy supply are diminished by the strong diversification of the oil suppliers. The reliance on oil in combination with a cost-based price regulation of the state-owned electricity company has led to high and volatile electricity prices.
The other main risk for the security of energy supply lies in the isolated nature of its electricity network, as poignantly illustrated by the large explosion at the Vasilikos plant in July 2011. The development of the gas industry as foreseen by the government should be pursued with determination in order to diversify the country energy mix and hence to better insulate it from potential supply or price shocks.
7.2. ENERGY AND CARBON INTENSITY
In 2010, Cyprus’ energy intensity was higher than the EU average but not among the highest in the EU. Cyprus scores better on this aspect than other Member States which joined the EU in 2004

Part II Individual Country Files
151
or 2007. This is not surprising as the "mainland" EU-12 countries as a group have had a strong industrial specialisation in energy-intensive industries, whereas Cyprus had not.
Table II.7.1:Energy and carbon intensity
Energy intensity of the economy 1) 178 -3.9CO2 intensity of the economy 2) 0.71 -12.7Share of energy intensive sectors in Gross Value Added 3) 5.2 -0.6
Energy intensity of the economy 1) 152 -4.7CO2 intensity of the economy 2) 0.41 -9.1Share of energy intensive sectors in Gross Value Added 3) 8.9 -0.9Source: Eurostat
2010 percentage change2006 - 2010
memo items: EU27
Notes: 1) Kg of oil equivalent per 1000 EUR, changes in percent; 2) Tonnes of CO2 equivalent per 1000 EUR, changes in percent; 3) percent of total gross value added, changes in percentage points, latest data refer to the year 2009.
However, Cyprus’ level of energy intensity does not appear to converge towards the EU trend. In particular, the secular slow decline in energy intensity seems to have stalled in Cyprus after 2005, and consequently the distance to the EU average has been increasing. However, despite the slow pace, progress has been made in all relevant sectors: the energy intensities of industry, households and transport have fallen between 2006 and 2010 (for industry more than for the others), and also the share of the energy-intensive sectors in the economy has slightly decreased.
0.50
0.60
0.70
0.80
0.90
1.00
150
160
170
180
190
200
2006 2007 2008 2009 2010
Graph II.7.7:Cyprus - Energy and carbon intensity of the economy
Energy intensity (lhs) CO2 intensity (rhs)
kgoe/1000 EUR ton CO2 eq./1000EUR
Source: Eurostat
The second NEEAP reports that Cyprus has exceeded its intermediary final energy consumption (FEC) savings target for 2010(236) and is well on track to meet the one for 2016, i.e. savings of 3.3% and 10%, respectively, relative to the baseline.(237) The final savings target for 2016
(236) Republic of Cyprus (2011a) (237) Republic of Cyprus (2007): The National Energy
Efficiency Action Plan (NEEAP) runs for the period 2008-
is expected to be exceeded based solely on the energy efficiency measures already implemented over the period 2004-2010, with additional savings forecasted from further measures planned for the period 2010-1016. This development is remarkable in view of the strong economic boom in the period 2005-2008.
Cyprus had one of the ten highest carbon-intensive economies in the EU in 2010, albeit on a slowly downward trend compared to 2006. This is of course a direct consequence of its nearly complete dependence on oil as primary energy source.
Cyprus did not have targets under the Kyoto protocol. However Cyprus is one of the few Member States to have increased its emissions per capita between 1990 and 2010, by almost 20%.(238)
In the framework of the Effort Sharing Decision(239), Cyprus has committed to reduce its GHG emissions in the non-ETS sectors by 5% in 2020 compared to 2005 levels. Current projections show that the country will be likely to significantly over deliver, reducing its emissions by at least 14% in 2020.(240)
The share of GHG emissions falling under the ETS is equal to 64%, six points above the EU average. Most allowances in the EU ETS have so far been allocated free of charge. Therefore, the electricity company EAC does not need to buy permits on the carbon market and does not need to pass on the carbon price to final consumers. In the third phase of the ETS starting in 2013 there will be an EU-wide emission cap and emissions' allowances will have to be auctioned, however Cyprus has been granted a derogation, pursuant Art. 10c of the ETS Directive, until 2019. The country's power sector will hence be given free allowances.
While this is expected to limit substantially the impacts of the auctioning on the economy of the country as the power sector represents more than
2016. The baseline is the average annual final energy consumption over the period 2001-2005.
(238) European Commission (2012) (239) Decision 406/2009/EC (240) European Commission (2011)

European Commission Member States’ Energy Dependence
152
75% of Cyprus total emissions, the increasing trend of emissions from the combustion installations remains worrying as the level of verified emissions in 2008, 2009 and 2010 has consistently been above the amount of free allocations provided.
7.2.1. Industry
The energy intensity of the industry sector in Cyprus is a little higher than the EU average. However, Cyprus’ industry has achieved a significant improvement in energy efficiency: over the period 2001–2010 its energy intensity has nearly halved which amounts to an average annual reduction rate of 8%. The larger part of this reduction has been achieved in the first part of the decade with an average annual reduction rate of nearly 11%, the double of that recorded in the second half of the decade. The reduction has taken place despite a constant share of the energy-intensive industry in the Cypriot economy (this share has fallen after 2005).
2.50
2.60
2.70
2.80
160
180
200
220
2006 2007 2008 2009 2010
Graph II.7.8:Cyprus - Energy intensity of industry, carbon intensity of energy use
Energy intensity of industry (lhs)CO2 intensity of energy use (rhs)
kgoe/1000 EUR ton CO2 eq./1000EUR
Source: Eurostat
However, as explained in the second NEEAP, industry has contributed only modestly to the macro energy savings, namely a mere 2.5% in the period 2001-2009. This is a direct consequence of industry’s small share in the Cypriot economy coupled with an energy take-up already below average from the outset. The NEEAP reports that the bulk of the savings have come from measures to make industrial buildings more energy efficient, supported by a grant scheme; in contrast, the contribution of switching to RES has been very modest. The envisaged measures for the next
decade should lead to 5 times higher savings, over half of which through measures on industrial buildings and the rest through the promotion of heat and power cogeneration (CHP), both supported with grant schemes. Nevertheless, Industries are expected to account for less than 1% of total expected FEC savings in 2016.
Carbon intensity of energy use is among the highest in the EU and it did not change compared to 2006. The share of energy-intensive sectors is among the lowest in the EU. Hence, the negative consequences of energy price rises caused by more stringent climate policies do not disproportionally affect Cyprus' industry.
7.2.2. Transport
Despite some minor improvements over the years, transport in Cyprus is about 75% more energy-intensive than the EU average. In fact, Cyprus has one of the most energy-intensive transport sectors in the EU. Inland transport takes up about 40% of total final energy consumption, while the corresponding share for aviation is 15%. According to the second NEEAP, the contribution of transport to the overall energy savings so far (by 2010) is modest, namely about 6 ½ %. By 2016, transport is forecasted to account for only around 2% of total expected FEC savings.
2.00
2.03
2.05
2.08
2.10
900
915
930
945
960
2006 2007 2008 2009 2010
Graph II.7.9:Cyprus - Energy and carbon intensity of transport
Energy intensity (lhs) CO2 intensity (rhs)
kgoe/1000 EUR ton CO2 eq./1000EUR
Source: Eurostat
Cyprus’ inland passenger and freight transport relies almost exclusively on private road transport, firstly because there is no rail network and secondly because public transport is still underdeveloped. Public buses account for only 2%

Part II Individual Country Files
153
of daily trips(241) whereas private cars take up 85% of these trips and service taxis the remainder. In terms of passenger kilometres, cars take up 82%. The lack of alternatives and relatively low fuel taxes has boosted car ownership and use(242). In 2009, Cyprus had the third highest car density in the EU. This is remarkable in view of the Cypriots' average purchasing power which is close to the EU average(243).
The NEEAP reports that since 2004 a grant scheme supporting electric, hybrid or low-carbon vehicles has contributed for one third to the realised energy savings. The biggest impact has, however, come from the vehicle scrapping scheme of 2008 and 2009 which targeted cars older than 15 years(244) . For the next decade a similar absolute magnitude in energy savings is expected from a new scrapping scheme. This will be only 10% of the envisaged savings; the remaining 90% has to come from the new Public Transport Programme launched in July 2010, which aims to boost the use of public transport to at least 10% of total daily trips.
The energy savings in transport appear to be the main driver behind the decline of the share of transport in consumption since 2005. This fall matters as Cyprus used to have one of the highest consumption budget shares for transport. In 2010, the last observed year, the budget share had fallen below the EU average, but next to the structural improvements oil price volatility must also have played a role in this.
Carbon intensity of transport is among the highest in the EU and it did not change compared to 2006. Any analysis of the GHG emissions from transport is complicated by an unexplained increase between 2003 and 2004, caused by an upsurge of registered GHG emissions from the transport sector. The problem may be
(241) Republic of Cyprus (2011c) (242) European Commission, DG Move – Eurostat (2012) (243) Car density is even higher when considering all vehicles
(passenger cars, buses and trucks): 732 vehicles per thousand inhabitants which, apart from Luxemburg, is the highest in the EU. There is roughly one truck per four personal cars, which is about twice as high as the EU average, but of the same order of magnitude as for the other EU Mediterranean countries (except Italy).
(244) HIS Global Insight (2010) – Country Profile Annex
statistical(245). Policy steps have been taken to improve the carbon emission performance, through the promotion of public transport, a grant scheme supporting electric, hybrid or low-carbon vehicles, and car scrapping schemes. Furthermore, Cyprus has committed itself to a 10% contribution from RES (mainly bio-fuels) in the energy consumption of road transport. The latest figures (for 2009) show a share of 2%(246).
7.2.3. Households
Households' energy intensity was the lowest in the EU in 2010 and on a downward trend compared to 2006. While inland transport and industry account for 43% and 17% of total consumption, respectively, the residential sector represents a mere 18% and the tertiary services (including public services) 13%. Electricity is the dominant energy source, representing almost half of households' energy consumption.
0.10
0.13
0.15
0.18
0.20
25
28
30
33
35
2006 2007 2008 2009 2010
Graph II.7.10:Cyprus - Energy and carbon intensity of households
Energy intensity (lhs) CO2 intensity (rhs)
kgoe/1000 EUR ton CO2 eq./1000EUR
Source: Eurostat
Oil amounts to 33% of their energy consumption, presumably for heating purposes. Solar energy accounts for a remarkably large share of 16% of household's energy use (as compared to 4% for services). It may even be underestimated because of home boilers (partly) running on own solar panels. In view of the rise in average temperatures in summer, air conditioning has become a critically
(245) The reasons for this suspicion is that Cyprus has only been
a "non-Annex" Kyoto partner, formal commitments to reduce GHG emissions came only with Cyprus' entry into the EU in 2004.
(246) It should be noted that the indicated measures mostly concern the use of RES in transport rather than the supply of "RES-T". This matters as an important part of the current bio-fuels supply is imported.

European Commission Member States’ Energy Dependence
154
important electric appliance in many households and establishments. Increasing water use and recurrent droughts have necessitated the use of water desalination plants which are very energy-intensive. Hence, the critical importance attached to the energy efficiency of buildings in the NEEAP.
Despite the low share in domestic energy consumption, households appear to have a much larger energy saving potential than the other sectors. As a matter of fact, the second NEEAP reports that in 2004-2009 around 80% of total energy savings were achieved in the residential sector. About half of it concerns the energy efficiency of dwellings, realised through minimum energy efficiency requirements for new houses in force since 2008, and through insulation efforts of existing buildings, subsidised through grants. A quarter of the savings in this sector comes from the distribution of free fluorescent lamps, and another quarter from the use of solar panels. By 2016, the sector's share of total FEC savings is expected to rise to almost 90%.
The weight of energy in the HICP is in line with the EU average, suggesting that the impact of variation in energy prices on households would not be relatively higher than in other Member States.
7.2.4. Conclusions
The Cypriot economy might be vulnerable to changes in energy prices as its energy intensity is above the EU average and it has high carbon intensity, especially in energy use. The transport sector is one of the major concerns as it has the third highest energy intensity in the EU. Car ownership and use has been boosted by the lack of transport alternatives and relatively low fuel taxes.
Paradoxically, however, its energy savings potential seems modest, when compared to that of residential buildings. The policy initiatives to combat carbon emissions will have an upward effect on energy prices, the size of which is currently uncertain as it depends on policy choices and autonomous energy price trends. Moreover, the impacts of these upward price effects on industries and consumers should be seen as contributing to a more balanced and environment-friendly energy mix and also taking place against
the background of a general electricity price decrease because of the introduction of natural gas
7.3. CONTRIBUTION OF ENERGY PRODUCTS TO TRADE
7.3.1. Net energy trade balance
Cyprus' energy trade deficit was the second highest in the EU in 2011 (7.5% of GDP) and it has displayed a sharp deterioration over the period 2007–2011, namely by almost two percentage points. Moreover, the variations of this deficit over the period show the influence of changes in the oil price. This is not surprising in view of the absence of energy exports and the nearly full dependence on imported oil products.
-8
-6
-4
-2
0
-25
-15
-5
5
2007 2008 2009 2010 2011
% of GDP% of GDP
Graph II.7.11:Cyprus - Trade balance of energy products and CA
CA (lhs) Oil (rhs)Gas (rhs) Total (rhs)
Source: Eurostat
However, the developments and current size of the energy trade deficit should be seen against the background of the country's current account balance. In fact, the urgency of the high and deteriorating energy trade deficit is compounded by the simultaneous presence of a persistently very high current account deficit, standing at 10 % of GDP or higher in the period under consideration (10.4% in 2010).
Cyprus' energy trade deficit amounts to almost three quarters of the current account deficit. This share is so substantial that it would arguably constitute on its own a macroeconomic imbalance. This bleak outlook may change in the medium to long term if the prospects of exploiting a large domestic offshore gas field materialise.

Part II Individual Country Files
155
7.3.2. Decomposition of the net energy trade balance
The energy trade balance can be decomposed in three multiplicative factors, namely the relative energy trade balance (i.e. the share of net exports in energy products in total cross-border energy trade), the share of energy in total trade and the ratio of total trade to GDP (macro openness to trade).
Cyprus' very high energy trade deficit relative to other EU countries directly reflects its similarly very high relative energy trade balance and very high share of energy in total trade; the low macro trade openness does not have a sufficiently mitigating effect. The relative energy trade deficit was the second highest of the EU in 2011 (72%), and has not changed much over the period 2007-2011.
However, the energy share in total trade has significantly increased in this period, in particular from 2010 to 2011. It now represents a fourth of total trade which indicates the growing vulnerability of Cyprus' external balance on energy. An oil price shock could therefore impact Cyprus in a significant way and relatively much more than other Member States.
Table II.7.2:Decomposition of Energy Trade Balance
2007 2008 2009 2010 2011Energy trade balance (% GDP) -5.7 -7.1 -5.1 -6.6 -7.5Relative trade balance (%) -72.8 -72.6 -76.0 -78.0 -72.7Share of energy in total trade (%) 16.9 20.2 17.3 19.6 24.4Macro trade openness (% GDP) 45.9 48.7 38.7 43.4 42.2Source: Eurostat
7.3.3. Conclusions
Cyprus can be characterised as the most vulnerable country for the external dimension of energy dependency as it combines the second highest energy trade deficit with the second highest current account deficit in 2011; moreover, the energy trade deficit appears stubborn as it has increased between 2007 and 2011 and varies with changes in the oil price. The large share of energy in total trade (currently almost a quarter) also aptly indicates Cyprus' exposure to potential macroeconomic imbalances from further increases in oil prices and its effects on the trade balance and competitiveness.
The widespread use of natural gas would mean a radical improvement as regards Cyprus' energy
dependence profile, by balancing its energy mix and reducing its electricity price. In addition, any measure aimed at improving the energy and carbon intensity of the country would also contribute to reducing the risks related to the energy trade deficit.
7.4. REFERENCES
European Commission (2011), Annual Growth Survey 2012, Europe 2020 targets: climate change and energy, COM (2011) 815 of 23 November
European Commission (2012), Progress towards achieving the Kyoto Objectives, COM (2012) 626 of 24 October.
European Commission, Directorate-General for Movement – Eurostat (2012), EU Transport in Figures, Statistical Pocketbook 2012
Eurostat (2012), Energy statistics – Prices, available from: http://epp.eurostat.ec.europa.eu/portal/page/portal/energy/data/main_tables
HIS Global Insight (2010), Assessment of the effectiveness of scrapping schemes for vehicles, Cyprus Country Profile
International Energy Agency (2009), 2009 Energy Balance for Cyprus, IEA Energy Statistics by Country
Republic of Cyprus (2007), First National Energy Efficiency Action Plan, available from: http://ec.europa.eu/energy/efficiency/end-use_en.htm
Republic of Cyprus (2011a), Second National Energy Efficiency Action Plan, available from: http://ec.europa.eu/energy/efficiency/end-use_en.htm
Republic of Cyprus (2011b), National Renewable Energy Action Plan 2010-2020, available from: http://ec.europa.eu/energy/renewables/action_plan_en.htm
Republic of Cyprus (2011c), 2011 National Reform Programme, available from: http://ec.europa.eu/economy_finance/economic_governance/sgp/convergence/programmes/2011_en.htm
Steinhilber S., Ragwitz M., Rathmann M, Klessmann C. and Noothout P (2011), Indicators assessing the performance of renewable energy support policies in 27 Member States, D17 Report of RE-Shaping project.


8. LATVIA
157
8.1. SECURITY OF ENERGY SUPPLY
Latvia's import dependence was below the EU average in 2010 (42% in 2010 against 53% for the EU-27). However, this is mainly due to the use of a storage capacity. Between 2006 and 2011, import dependency was around 57% on average, hence a little higher than the EU average of 54%.
The country energy mix is quantitatively not particularly diversified, however it relies for more than 60% on low- or zero- carbon sources such as renewables and gas.
8.1.1. Primary energy sources
8.1.1.1. Renewables
The first source in the energy mix is renewables. Latvia has the largest share in the EU of renewable energy in the energy mix, 35%
Key Insights
Security of Energy Supply:
- Latvia displays a balanced energy mix and an overall import dependency slightly higher than the EU average. However, the country has a high import dependency for gas and oil and it still lacks sufficient interconnections with other EU Member States which would allow it to diversify its routes of supply for electricity and gas.
- The high concentration of gas imports makes Latvia vulnerable to any potential supply disruptions. For this reason, diversification of gas supply is crucial for Latvia's security of supply.
Energy and Carbon Intensity:
- Latvia's performance in terms of energy intensity is rather worrying as it seems that efforts made in recent years have only yielded limited results.
- Energy intensity in the industrial and household sectors has increased between 2006 and 2010, suggesting that the country did not successfully decouple its economic growth from the exploitation of energy sources.
- Carbon intensity is still quite high mainly because of the poor performance of the transport sector, while energy use and households display good results in terms of decarbonisation.
Trade balance for energy products:
- Latvia's rather high energy trade deficit in 2011 is compensated by a surplus on the balance for other product categories, resulting in a modest current account deficit.
- The increasing importance of energy trade in the economy could raise some concerns, as this means that shocks to Latvia´s energy trade would have a greater impact on the overall external position of the country and consequently on its overall economic performance.

European Commission Member States’ Energy Dependence
158
in 2010(247), equivalent to 32.6% of Latvia's gross final energy consumption(248). The country's binding target is 40% share of RES in final energy by 2020.(249)
Latvia has good natural conditions for the development of energy from biomass (half of Latvia's territory is covered by forests) and for hydropower (Daugava basin). Wood is used as fuel for district heating and for heating of individual households; 48% of heat is produced from wood and biomass, the highest share in the EU. Renewables account for 55% of electricity production, almost all of which comes from hydro power. However, hydropower generation is heavily dependent on weather conditions and has exhibited some notable fluctuations over the last decade, due to intermittence in the output of the hydro plants. Wind power, biogas and biomass are also used for electricity production, but their shares are very small in comparison to hydro power.
Renewable energy is promoted through support schemes as in the other Member States. The law on renewable energy came into force on 1 July 2011. In Latvia feed-in tariffs are in place but the support scheme also includes elements of a quota system and tenders. The producers of renewable (247
) Against 9% in the EU27. It was 31% in 2006. (248) The share of renewables in the energy mix means the share
of renewable energy in gross inland energy consumption. We use this denominator consequently in the EDI to assess the share of each energy source in the energy mix. On the other hand, Member States' renewable targets for 2020 are expressed as a share of renewable sources in final energy consumption, i.e. excluding transmission, distribution and transformation losses. This explains the difference between the two figures.
(249) Republic of Latvia (2011b)
electricity (apart from hydro) are obliged to participate in tenders to obtain the right to sell electricity at a guaranteed price until the percentage set by the government is reached. Most of the cost of this support scheme is borne by the consumers, but there are also some tax reductions and support from the Cohesion Fund(250).
8.1.1.2. Gas
The second source of energy is gas which in 2010 accounted for 32% of the energy mix, a slight increase compared to 2006. Latvia imports all its gas as it does not have any domestic resources.
A well-functioning and interconnected gas market with competitive and market-based prices should provide the correct incentives for further investments and signals to consumers for an efficient and sustainable use of resources. Both elements are conducive to reduce the vulnerability of the country to energy-related shocks. Latvia's gas imports are sourced only from Russia through long-term supply agreements with Gazprom and Itera-Latvija. The high concentration of gas imports makes the country vulnerable to any potential supply disruptions. At this stage, alternative gas supplies are not possible due to the lack of connections to other EU countries and Norway.
Gas import dependency in 2010 was 62%, a remarkable decrease compared to previous (250) Steinhilber S., Ragwitz M., Rathmann M, Klessmann C.
and Noothout P (2011)

Part II Individual Country Files
159
years, while gas consumption actually increased. However, this decrease is due to the use of gas previously stored in the storage facility managed by the same Russian importer under a long-term contract(251). Latvia displays favourable geological conditions for the expansion of a system of natural underground gas storages. Gas storage improves security of supply in case of high demand or major pipeline supply disruption. In comparison, countries such as Estonia, Finland, Lithuania, Luxembourg, Slovenia and Northern Ireland are vulnerable to pipeline import cuts as they do not have domestic production and/or national gas storage facilities(252). In Latvia, the total volume of gas storage is 4.4 bn m3, and the active volume 2.3 bn m3. Beyond the regional role of this reserve − gas from Russia is stored during the summer, and dispatched to Baltic countries and Russia during the heating season −, this allows Latvia to keep the domestic supply stable across seasons.
Diversification of gas supply is an objective shared by all Baltic countries. In order to improve security of supply, the interconnection of Baltic countries was identified as a priority in 2008. The BEMIP (Baltic Energy Market Interconnection Plan) was launched in 2009. It brings together projects involving all countries around the Baltic Sea – Finland, Estonia, Latvia, Lithuania, Poland, Germany, Denmark, Sweden and, as an observer, Norway. The objective is, among other things, to develop an internal market for electricity and gas, to improve electricity interconnections as well as gas diversification of routes and sources.
There are many common on-going projects that will be beneficial for the entire region once completed. There is a plan for construction of the Balticconnector gas pipeline connecting Finland and Estonia. In Estonia, the pipeline would be connected to the existing transmission pipeline from Latvia. The described project has not yet received a final approval according to estimation by the Estonian company and the construction of the gas pipeline will not be started before 2013.
(251) Negotiations are underway to either extend the contract or
transfer it back to State control. (252) ERGEG (2010)
The Baltic countries are also supposed to agree to build a new LNG terminal which would be located in Latvia. Until now, no agreement has been reached and, in November 2011, the three countries have asked the Commission to arbitrate and choose the location of the new terminal. The consultant hired by the Commission has concluded that the best option for the terminal would be Estonia if Finland also joins the project. This new terminal could contribute to diversifying the routes of supply of natural gas. The Commission has agreed to commit to a study to compare costs and different options of locations.
According to the Latvian energy regulator, all investments that are needed to diversify the gas market would not be cost-effective at the current level of total annual consumption of natural gas. Therefore, competition in the natural gas market is not likely to increase in the medium term. This also explains why the gas prices are still regulated in order to ensure stability. In accordance with Article 49.1 of the EU gas Directive (2009/73/EC), Latvia has derogation for opening the gas market until it is "directly connected to the interconnected system of any Member State other than Estonia, Lithuania and Finland".
This derogation is still in place as no on-going projects will enable Latvia to be interconnected to other EU Member States as requested. End-user's prices are among the lowest in the EU, both for industrial consumers and for households(253).
(253) Eurostat (2012)

European Commission Member States’ Energy Dependence
160
8.1.1.3. Oil
The third source of energy is oil. Its share in gross inland consumption is lower than the EU average (28% in 2010 against 35% in the EU-27, down from 32% in 2006). No data are available to estimate the degree of diversification of crude oil imports. According to different sources, Russia is the main oil source while imports of refined petroleum products appear to be sourced from a wide range of countries.
8.1.1.4. Other sources
As regards other energy sources, Latvia imports most of its solid fuels (coal) from Russia, but it is not in a situation of vulnerability as solid fuels only account for 2% of the energy mix.
Until now, no nuclear energy has been generated in Latvia. In 2006, Latvia, Lithuania and Estonia agreed to conduct a feasibility study for the construction of a joint nuclear power plant. The national energy companies of the three Baltic countries together with a Japanese company (Hitachi) are planning to build a nuclear power plant in Lithuania. The investment has been communicated in October 2011 to DG ENER.
8.1.2. Secondary energy sources
In 2010, Latvia was among the biggest importers of electricity in the EU, covering 14% of its consumption via imports. This share has sharply decreased since 2006 when it was 41%.
Good electricity interconnections and adequate domestic infrastructure capacity are important to shelter the country from supply shocks and to enable a proper absorption of renewables. A competitive and dynamic electricity market should cater the necessary investment incentives and provide the right price signals to consumers. Latvia's situation is specific and complex due to the historical background of the country. As mentioned above, Latvia is dependent on energy supply from Russia, but the country is also part of the IPS/UPS system (Integrated Power System of the CIS countries/Unified power system of Russia). The transposition of the Third Package and the integration into the EU energy market would require the Baltic States to join the European and Nordic electricity markets and develop their own internal electricity generation. The Prime Ministers of the three Baltic States have sent a letter to President Van Rompuy and President Barroso on 11 February 2011 stating the political strategic objective to become an integral part of the European Continental Power Network.
The Baltic countries need to find an agreement with Russia about electricity synchronisation. The Baltic states are synchronised with Russia and the synchronisation system is not based on market allocation. Changing these rules would entail to reach an agreement with Russia.
There are also other bottlenecks that limit the integration of Latvia into the EU market. The state-owned company Latvenergo controls more than 90% of installed capacity for the generation of electricity in Latvia. The unbundling is not done yet, which impedes the company from

Part II Individual Country Files
161
participating in the Nordic wholesale market, NordPool. This should presumably happen in 2013. Integration to NordPool should bring about a better alignment of Latvia's prices with market prices.
Due to the predominance of hydropower in its electricity generation, Latvia imports electricity during most of the year and exports during flooding in spring. In 2010, it seems that Latvia faced an increased hydro production due to warm temperatures and snow melting. For this reason, exports to Lithuania, Estonia, Finland and Russia have increased.
End-user's prices in Latvia are regulated. However, as from 1 November 2012, industrial prices will be liberalized. The price level is currently below the EU average for both industrial and households consumers(254).
8.1.3. Conclusions
Latvia displays a good energy mix and an import dependency slightly higher than the EU average. However, the country has a high import dependency for gas and oil. In addition, the country still lacks sufficient interconnections with other EU Member States which would allow it to diversify its routes of supply for electricity and gas. Moreover, it is still largely integrated into the Russian market and the on-going discussions on possible negotiations with Russia would need to be monitored closely. The high concentration of gas imports makes Latvia vulnerable to any potential supply disruptions. At this stage, alternative gas supplies are not possible due to the lack of connections to other EU countries and Norway. For this reason, diversification of gas supply is crucial for Latvia's security of supply. However, it has also to be borne in mind that Latvia displays an exceptional capacity for gas storage. This storage holds the gas reserves of Latvia, Lithuania, Estonia, and also Russia, which make it play a strategic role in the region. Another strong characteristic of Latvia's energy mix is the high share of renewables, which compensate somehow the import dependency risks.
(254) Eurostat (2012)
8.2. ENERGY AND CARBON INTENSITY
Latvia had one of the highest energy intensity in the EU in 2010. Between 2001 and 2009, energy intensity of the economy decreased by 20.5%. During 2001-2007, there was a strong decrease in energy intensity (-37%), followed by an upward trend between 2007 and 2009. As in most new Member States, this good performance can be explained by several factors, among which the process of industrial restructuring entailing a lower use of energy and the implementation of the EU environmental acquis. The economic crisis resulting in a significant decrease in GDP in 2009 had a negative effect on energy efficiency.
The savings target to be reached by 2016 is an overall decrease in final energy consumption (FEC) by 9% compared to the baseline level,(255) which for Latvia equalled 3483 GWh.
The second NEEAP reveals that energy savings achieved by 2010 amounted to almost 98% of this final target, highlighting that Latvia is well on its way to exceeding its FEC savings target for 2016.(256) In 2005, the government adopted Guidelines for Energy Sector Development for 2007-2016. The objectives for energy sector development include improvement of energy supply, increase in the effective use of renewable energy sources and cogeneration, market liberalization in the energy sector, ensuring environmental quality and complying with GHG emissions reduction commitments. These Guidelines also include a commitment to promote energy efficiency and they set a number of implementation benchmarks to be reached in the field of energy efficiency.
(255) Republic of Latvia (2007): The National Energy Efficiency
Acton Plan (NEEAP) runs for the period 2008-2016. The baseline is the average annual final energy consumption over the period 2001-2005.
(256) Republic of Latvia (2011a)

European Commission Member States’ Energy Dependence
162
Latvia benefits from the EU funds to support energy efficiency. Cohesion policy support to energy as a whole amounts to EUR 127.4 million, representing 2.8% of the Community amount allocated to Latvia under cohesion policy (EUR 4.5 billion). Renewable energy and energy efficiency benefit almost equally from these funds (53% and 47% respectively). Energy-related projects in Latvia are financed by the Cohesion Fund and implemented through one Operational Programme (Infrastructure and Services) covering the whole country which promotes (among others) environmentally friendly energy through the supply of centralised heat services.
Latvia's carbon intensity was among the highest in the EU in 2010 but this is mainly due to the high carbon intensity of the transport sector, while both households and energy use have very low carbon intensities.
In recent years, greenhouse gas emissions have started to increase again, following many years of decline after the country regained its independence. Latvia is anyway well on track to meet its Kyoto protocol's obligations: a reduction of 8% of emissions in 2012 compared to 1990 levels. So far a reduction of more than 50% has taken place.(257)
Although Latvia is expected to limit its emissions in the non-ETS sectors to an increase of 17% by 2020 compared to 2005 under the EU’s Effort Sharing Decision(258), policy should not lose sight
(257) European Commission (2012) (258) Decision 406/2009/EC
of the strong likelihood that in the longer term greenhouse gas emissions will have to fall substantially from their current levels, as part of global efforts to tackle climate change. Current projections show that Latvia is likely to miss its target, increasing its emissions by 20% even in case of adoption of additional measures(259).
The share of GHG emissions falling under the ETS is equal to only 26%, one of the lowest shares in the EU, almost 15 points below the EU average. From 2013, there will be an EU-wide emissions cap and most allowances will be auctioned. Although Latvia is eligible for derogation (Article 10(c) of the ETS directive) it did not apply for it. Auctioning will start from 2013, which will generate additional revenues for the Authority but also additional costs operators that are likely to pass them on to consumers. The impacts of the auctioning in Latvia may lead to an increase in electricity prices, as the power sector representing almost 70% of total emission will have to incur additional costs to purchase the allowances. The size of the impact will depend ultimately on the carbon prices and on the ability of the industries to reduce their carbon and energy intensity.
8.2.1. Industry
Latvia's industry is one of the most energy-intensive among the EU Member States. The intensity has increased by 13% compared to 2006. The high intensity is mostly explained by the energy intensity of steel industry and non-metallic products. However, over the past decade (2001-2009), industry reduced its energy consumption by 43%. This performance is mostly due to efficiency gains in some sectors rather than a structural effect.
The steel industry (which accounts for 1% of GVA) decreased its energy consumption per ton of steel produced (by 3.9% per year) over the past decade. By contrast, the share of energy-intensive industries remained quite stable during the same period (6.7% in 2000, 6.2% in 2005, and 7.1% in 2008). Compared to the EU average, the share of energy-intensive industries in Latvia is quite low (7.1% in 2009 against 8.9%).
(259) European Commission (2011)

Part II Individual Country Files
163
According to the second NEEAP, industries (and agriculture) account for 12% of the final 2016 energy savings target. The Latvian authorities have also taken measures to increase awareness among companies. Since the mid-1990s, energy audits have been introduced and aim to help the restructuring process of industries.
Latvia's carbon intensity of energy use was among the lowest of the EU in 2006 but it has slightly increased in 2010 leaving the club of the best performing countries. Still its value is below the EU average. This is mainly a consequence, as see in section 8.1, of the low-carbon resources used in the country's energy mix. Electricity generation is predominantly based on renewable sources (mainly hydro) and to a smaller degree on natural gas, resulting in low CO2 emissions and intensity.
8.2.2. Transport
Energy intensity in transport is above the EU average. Increasing levels of car ownership could exacerbate this situation in the coming years. Consideration should be given to making greater use of car and fuel taxation to steer consumers towards more energy-efficient transport choices. The Transport Development Strategy 2007 – 2013 sets the main policy trends for infrastructure quality, public transport development and safe sea transport.
A draft Action Plan for Government Declaration Implementation aims to take initiatives towards resource efficiency in the transport sector − electrification of railways, increasing low fuel consumption and low emissions vehicles, use of local natural resources, and developing ports’ infrastructure.
Energy consumption from transport –compared to the value added of the sector – is slightly above the EU average, but has decreased over the last ten years. The Transport sector accounts for only 6% of the final energy savings target for 2016. GHG emissions from transport in absolute terms were rising over the past years and have decreased with the economic crisis. The number of road vehicles has increased considerably since 1990. By contrast, the use of public transport has decreased (a trend that is observed in the EU12 Member States).(260)
Carbon intensity of transport was in 2009 above the EU average however its level has been reduced compared to 2006.
8.2.3. Households
In 2010, households' energy intensity was the highest in the EU. Energy intensity per dwelling has increased between 2006 and 2010. However, consumption per dwelling for space heating has decreased at a higher rate than the EU average, -1.5% from 2000 to 2008 versus -1.2% for the EU average.
(260) European Commission, DG Move – Eurostat (2012)
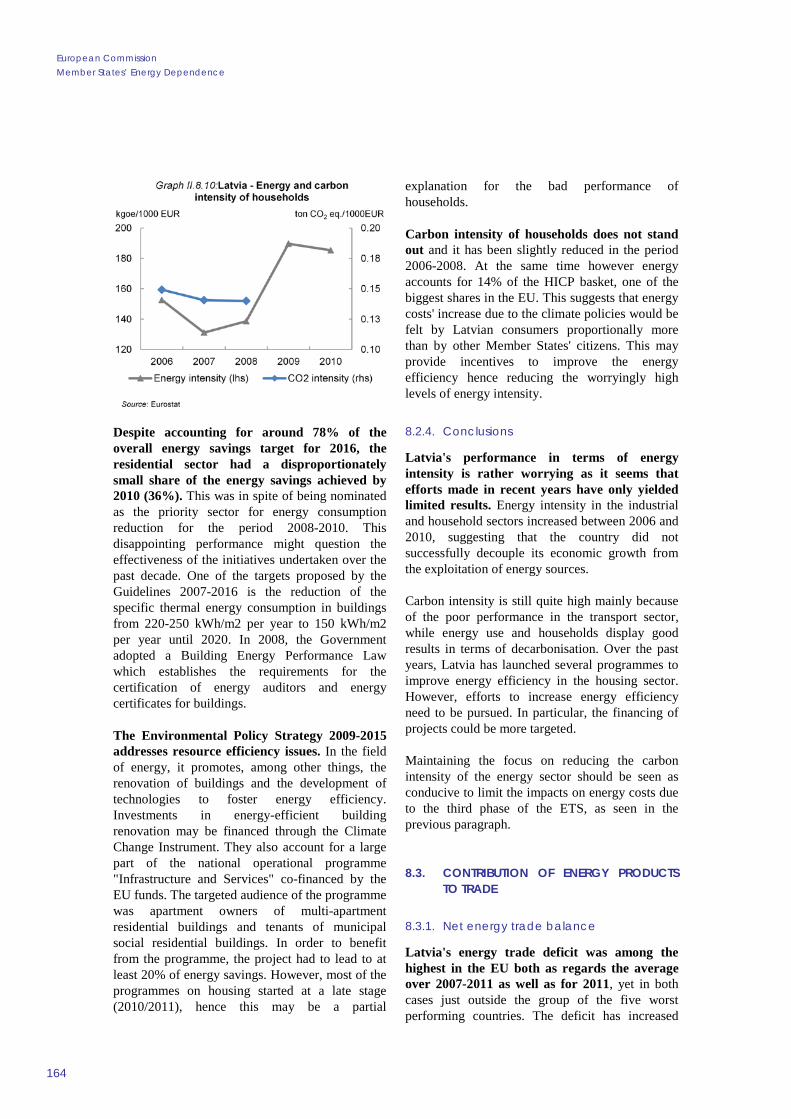
European Commission Member States’ Energy Dependence
164
Despite accounting for around 78% of the overall energy savings target for 2016, the residential sector had a disproportionately small share of the energy savings achieved by 2010 (36%). This was in spite of being nominated as the priority sector for energy consumption reduction for the period 2008-2010. This disappointing performance might question the effectiveness of the initiatives undertaken over the past decade. One of the targets proposed by the Guidelines 2007-2016 is the reduction of the specific thermal energy consumption in buildings from 220-250 kWh/m2 per year to 150 kWh/m2 per year until 2020. In 2008, the Government adopted a Building Energy Performance Law which establishes the requirements for the certification of energy auditors and energy certificates for buildings.
The Environmental Policy Strategy 2009-2015 addresses resource efficiency issues. In the field of energy, it promotes, among other things, the renovation of buildings and the development of technologies to foster energy efficiency. Investments in energy-efficient building renovation may be financed through the Climate Change Instrument. They also account for a large part of the national operational programme "Infrastructure and Services" co-financed by the EU funds. The targeted audience of the programme was apartment owners of multi-apartment residential buildings and tenants of municipal social residential buildings. In order to benefit from the programme, the project had to lead to at least 20% of energy savings. However, most of the programmes on housing started at a late stage (2010/2011), hence this may be a partial
explanation for the bad performance of households.
Carbon intensity of households does not stand out and it has been slightly reduced in the period 2006-2008. At the same time however energy accounts for 14% of the HICP basket, one of the biggest shares in the EU. This suggests that energy costs' increase due to the climate policies would be felt by Latvian consumers proportionally more than by other Member States' citizens. This may provide incentives to improve the energy efficiency hence reducing the worryingly high levels of energy intensity.
8.2.4. Conclusions
Latvia's performance in terms of energy intensity is rather worrying as it seems that efforts made in recent years have only yielded limited results. Energy intensity in the industrial and household sectors increased between 2006 and 2010, suggesting that the country did not successfully decouple its economic growth from the exploitation of energy sources.
Carbon intensity is still quite high mainly because of the poor performance in the transport sector, while energy use and households display good results in terms of decarbonisation. Over the past years, Latvia has launched several programmes to improve energy efficiency in the housing sector. However, efforts to increase energy efficiency need to be pursued. In particular, the financing of projects could be more targeted.
Maintaining the focus on reducing the carbon intensity of the energy sector should be seen as conducive to limit the impacts on energy costs due to the third phase of the ETS, as seen in the previous paragraph.
8.3. CONTRIBUTION OF ENERGY PRODUCTS TO TRADE
8.3.1. Net energy trade balance
Latvia's energy trade deficit was among the highest in the EU both as regards the average over 2007-2011 as well as for 2011, yet in both cases just outside the group of the five worst performing countries. The deficit has increased

Part II Individual Country Files
165
somewhat in the past five years as it went from -4.6% in 2007 to -5.4% of GDP in 2011. The trade deficit for oil has remained basically constant while the deficit for gas has deteriorated from -1% to -2% of GDP.
The size of the energy trade deficit should be seen against the background of the country's current account balance, and more generally against that of an economic recovery after a sharp and deep recession which followed a financially imbued boom. Latvia's current account balance has improved at an impressive pace, contracting from -22.4% in 2007 to a surplus of 8.6% in 2009 and then falling back to a relatively modest deficit of -2.4% of GDP in 2011. In the current situation, the balance for the other product categories can be seen as partly compensating for the energy trade deficit. The relative stability of the energy trade deficit suggests that it is rather stubborn.
8.3.2. Decomposition of the net energy trade balance
The energy trade balance can be decomposed in three multiplicative factors, namely the relative energy trade balance, the share of energy in total trade and the ratio of total trade to GDP (macro openness to trade).
As regards the size of the deficit on the relative energy trade balance (i.e. the share of net exports in energy products in total cross-border energy trade) in the year 2011, Latvia does not stand out. The same applies the other two factors. As the three factors all seem just a bit above the EU
average, it appears that they jointly explain the relatively poor performance of the energy trade balance in 2011.
Latvia’s relative trade balance for energy products has considerably improved in the last decade, mostly due to the improvement of the trade balance for oil products (the ratio of which went from -86% in 2001 to -42% in 2011). This has not translated into a corresponding improvement in the net energy trade balance, because of an increase over the decade in both the share of energy in trade and macro openness. Had these factors remained constant, the energy trade deficit in percentage of GDP would have been reduced by over 2 percentage points rather than increasing by 1 percentage point.
8.3.3. Conclusions
Latvia's rather high and stable energy trade deficit occurs against the background of a strongly varying but ultimately sharply reduced current account deficit. This suggests that the energy trade deficit is stubborn and that currently non-energy trade components are partly compensating for the energy trade deficit. However, the increasing importance of the energy trade in the economy could raise some concerns as this means a greater impact on the overall external position of the country from shocks in Latvia's energy trade and consequently on its overall economic performance.
8.4. REFERENCES
European Commission (2011), Annual Growth Survey 2012, Europe 2020 targets: climate change and energy, COM (2011) 815 of 23 November
European Commission (2012), Progress towards achieving the Kyoto Objectives, COM (2012) 626 of 24 October.
European Commission, Directorate-General for Mobility and Transport – Eurostat (2012), EU Transport in Figures, Statistical Pocketbook 2012
Eurostat (2012), Energy statistics – Prices, available from: http://epp.eurostat.ec.europa.eu/portal/page/portal/energy/data/main_tables.

European Commission Member States’ Energy Dependence
166
Republic of Latvia (2007), First National Energy Efficiency Action Plan, available from: http://ec.europa.eu/energy/efficiency/end-use_en.htm
Republic of Latvia (2011a), Second National Energy Efficiency Action Plan, available from: http://ec.europa.eu/energy/efficiency/end-use_en.htm
Republic of Latvia (2011b), National Renewable Energy Action Plan 2010-2020, available from: http://ec.europa.eu/energy/renewables/action_plan_en.htm
European Regulators Group for Electricity and Gas (2010), Status Review of the Liberalization and the Implementation of the Energy Regulatory Framework, December 2010
Steinhilber S., Ragwitz M., Rathmann M, Klessmann C. and Noothout P (2011), Indicators assessing the performance of renewable energy support policies in 27 Member States, D17 Report of RE-Shaping project.

9. LITHUANIA
167
9.1. SECURITY OF ENERGY SUPPLY
Lithuania's import dependency has been fairly limited between 2000 and 2009, fluctuating between 40% and 60%, more or less in line with the EU average of around 50%.
In 2010 due to the closure of the last functioning nuclear reactor, the import dependency jumped up to 81.9%. Virtually all energy imports come from non-EEA countries: 100% for gas, 98% for oil and petroleum products and 97% for solid fuels.
45
60
75
90
105
2006 2007 2008 2009 2010
%Graph II.9.1:Lithuania - Import dependence
Gas Oil Solid fuels Total
Source: Eurostat
The country has embarked on important energy policy reforms which, in line with the Government´s objective, should progressively reduce dependency on Russia. Reliance on Russia is to drop from the current 80% to 55% by 2016 and to 35% by 2020.
Key Insights
Security of Energy Supply:
- Lithuania is among the most vulnerable countries in the EU for security of energy supply. Its position has sharply deteriorated following the closure of the last nuclear plant which has turned the country from a net exporter of electricity to a net importer.
- Excessive reliance on one single foreign supplier for oil and gas, the absence of any domestic energy source, and the lack of interconnections with other EU countries has further worsened the exposure of Lithuania to potential security of supply risks and price shocks.
- The share of gas has increased strongly to compensate for the absence of nuclear power. In spite of this, the trading platform is still embryonic and the country relies mostly on long-term supply contracts.
Energy and Carbon Intensity:
- Lithuania has relatively high energy intensity, among the ten highest in the EU, but good progress has been made across all economic sectors.
- The performance of the household sector in terms of energy and carbon intensity still appears problematic, especially in view of the pessimistic projections for GHG reductions. The high share of energy expenditures in the consumers' basket suggests that any increase in energy prices might provide signals to Lithuania's citizens in order to promote a more efficient use of resources.
Trade balance for energy products:
- Lithuania is among the most vulnerable countries in the EU as regards the trade balance for energy products.
- The energy trade balance has deteriorated in the last five years as a consequence of the closure of the last nuclear reactor. At the same time, the relative importance of energy in the country's total trade has increased, putting additional pressure on the country´s trade performance.

European Commission Member States’ Energy Dependence
168
The degree diversification of the country's energy mix ranks somewhere in the middle of the EU, however it is heavily dependent on two sources, oil and gas, accounting for more than 70%.
0.7
0.8
0.9
1.0
1.1
2006 2007 2008 2009 2010
Graph II.9.2:Lithuania - HHI index energy imports
Gas Oil Solid fuels
Source: Eurostat
9.1.1. Primary energy sources
9.1.1.1. Nuclear
In 2009 the first source of energy used in Lithuania was nuclear (33%). However, the last functioning nuclear power plant was closed at the end of 2009. Consequently its share in 2010 dropped to 0. The country used to have two large Russian-built reactors (Ignalina), both with a net capacity of MW 1185, and the energy produced was also supplied to the neighbouring countries (Belarus, the Russian enclave of Kaliningrad, and Latvia). Due to EU safety requirements, Lithuania agreed to shut down its reactors; the first one in 2004 and the second one in 2009. The EU has been contributing with decommissioning funds, and will continue to do so at least until 2013 (the total contribution should be around EUR 1.367 million)(261).
Lithuania has recently commissioned the construction of a new nuclear power plant. This project has however been halted by a referendum in October 2012 where more than 60% of voters expressed their opposition to it. At the same time, the country has entered in a row with Russia and Belarus because of their respective plans to build
(261) World Nuclear Association (2012)
two nuclear reactors very close to the border with Lithuania.
0.7
0.8
0.9
1.0
1.1
2006 2007 2008 2009 2010
Graph II.9.3:Lithuania - HHI index energy imports
Gas Oil Solid fuels
Source: Eurostat
According to the Lithuanian government the environmental impact assessments of these projects do not match adequate safety standards.
9.1.1.2. Oil
The share of oil in Lithuania's energy mix was 38% in 2010, a significant increase from the previous years. The country imports 99% of its oil consumption. The diversification of import sources does not appear satisfactory, as Lithuania relies almost solely on Russia for crude oil. Domestic production is very limited, 0.1 Mtoe in 2010. Refined petroleum products, on the other hand, are imported from a wider spectrum of countries, but they amount to less than 10% of crude oil imports. Excessive reliance on Russia is an issue that Lithuania is trying to resolve.
Historically, oil imports were transported through the pipeline of Druzhba, but this access point was blocked by Russia in July 2006. All oil imports now come into the country from the Butinge terminal which also supplies the Mazeikiai refinery, the only refinery in the Baltic States. Mazikiai refinery has an annual capacity of around 8 million tons of refined products. Its production covers 84% of the country's consumption of petroleum products while the remaining 16% are imported.

Part II Individual Country Files
169
90
92
94
96
98
100
2006 2007 2008 2009 2010
%
Graph II.9.4:Lithuania - Non-EEA share of imports
Gas Oil Solid fuels
Source: Eurostat
9.1.1.3. Gas
Gas' share in the energy mix experienced a strong increase between 2006 and 2010, going from 28% to 36%. The country has always been completely dependent on foreign supply and it imports basically all its gas from one Russian supplier.
A well-functioning and interconnected gas market with competitive and market-based prices should provide the correct incentives for further investments and signals to consumers for an efficient and sustainable use of resources. Both elements are conducive to reduce the vulnerability of the country to energy-related shocks.
Currently the country has active interconnections only with Latvia, Russia and Belarus. Supply contracts are stipulated solely with Gazprom on a long-term basis (expiry date is 2015). The prices of these contracts are reportedly much higher than those that Gazprom has signed with other EU countries. Between 2010 and 2011, the average price of imported gas increased by 25% (from LTL 862 to LTL 1081(262). Data from 2010 show that there appears to be no risk of capacity overload. At their peak, gas import pipelines were used at 75% of their total capacity(263).
Between 2010 and 2011, infrastructure investments in distribution and transmission networks decreased by 46%, totalling around (262) LTL 1 = EUR 3 (c.a.) (263) National Control Commission for Prices and Energy (2010)
20 million euros. In order to diversify its import sources, and diminish the importance of Russian gas, the interconnection of Baltic countries was identified as a priority in 2008. The BEMIP (Baltic Energy Market Interconnection Plan) was launched in 2009. Lithuania is developing a series of projects, including an LNG terminal that should become operational in 2014, a gas storage facility (it would be the first of the country) that is currently under consideration, and an interconnection with Poland that is being built with the assistance of the EU TEN-E programme. Also, studies on the availability of shale gas reserves are being conducted by geologists promising to uncover some 120 billion cubic meters of exploitable gas.
The gas market in Lithuania is still very concentrated across all segments, while the gas exchange is not yet fully performing. Legislation was adopted by the Government in June 2011, with entry into force in August 2011, which establishes the legal unbundling of the holding company Lietuvos Dujos AB(264) that is currently involved in gas transmission, distribution and supply. According to the legislation, the unbundling should be completed by October 2014. The same legislation also provides for the deregulation of gas retail prices(265). However, the Energy Regulator (NCC)(266) maintains the right to intervene whenever it suspects that market abuses are artificially inflating end-users' prices.
A natural gas trading platform has been recently activated, run by the licenced operator Baltpool UAB. The volumes traded on the platform still remain negligible: according to the data made available by the NCC in 2011, only 0.4% of the gas supplies were sold on the Exchange. The country also joined the NordPool trade platform in early 2012. The full benefits of this move will be realised if and when links with Estonia, Finland and Sweden are completed. Between 2010 and 2011, the quantity of transmitted gas increased by 21% and at the same time, interestingly, the quantity of gas transit rose by 47% signalling improved interconnection capacity.
(264) The Lithuanian state owns around 18% of the company. (265) National Control Commission for Prices and Energy (2011) (266) National Control Commission for Prices and Energy

European Commission Member States’ Energy Dependence
170
The NCC claims that there exists no real competition in the wholesale segment where three companies cover the entire market spectrum. The retail segment is more dynamic with more than 60 suppliers, yet the three main companies still have more than 65% market share(267).
End-user prices are higher than the EU average for industrial users, while they are slightly below for households(268).
9.1.1.4. Renewables
Renewable energy is the third energy source in Lithuania. It accounts for 16% of its energy mix, or 19.7% of Lithuania's gross final energy consumption(269). Lithuania has increased its share of renewables in gross final energy consumption over the last years, from 14% in 2006, while its binding target by 2020 is 23%.(270)
0
20
40
60
80
100
2006 2007 2008 2009 2010
%Graph II.9.5:Lithuania - Renewable mix
Hydro Biomass Wind Solar Geothermal
Source: Eurostat
Biomass is the main renewable source used for energy generation: 30% of heat is produced from wood and biomass. The share of renewable electricity jumped from 9% in 2009 to 29% in
(267) In 2011, the two main gas importers covered some 99% of
the market. The two biggest retailers had 98% share of the market and there was no switching of operators.
(268) Eurostat (2012) (269) The share of renewables in the energy mix means the share
of renewable energy in gross inland energy consumption. We use this denominator consequently in the EDI to assess the share of each energy source in the energy mix. On the other hand, Member States' renewable targets for 2020 are expressed as a share of renewable sources in final energy consumption, i.e. excluding transmission, distribution and transformation losses. This explains the difference between the two figures.
(270) Republic of Lithuania (2011b)
2010, as Lithuania's electricity production fell by 2/3 after the closure of the Ignalina nuclear power plant. Most of renewable electricity comes from hydro, with a smaller share of wind power and biomass. The share of RES in transport is 3.6%.
Lithuania has a feed-in tariff for electricity produced from renewable energy sources, together with a purchase obligation and tenders for smaller plants. Other instruments are in place to support renewables in the heating and transport sector, including tax exemptions and soft loans(271). The support level per MWh in wind and solar power seems to be slightly above average generation costs(272), but in spite of it the uptake of these technologies has been quite limited so far.
9.1.1.5. Solid fuels
Solid fuels represented 2% of the country's energy mix in 2009. Historically solid fuels always made up a minor part of the energy input. They are mostly imported; domestic production is negligible and Russia supplies more than 93% of total solid fuel imports.
9.1.2. Secondary energy sources
Nuclear power used to represent the main source of electricity production (with shares which were above 80% in the 1990s). Up until the closure of the last nuclear power plant, Lithuania was a net electricity exporter. The situation reverted in 2010 when the country became a net importer for the first time since 1995. With an import dependency of 72% in 2010, it was the biggest importer of electricity in the EU. Main import sources were Belarus, Latvia and Russia. In 2010 the country electricity mix was composed of gas (55%), renewables (29%) and oil (11%).
Good electricity interconnections and adequate domestic infrastructure capacity are important to shelter the country from supply shocks and to enable a proper absorption of renewables. A competitive and dynamic electricity market should cater the necessary investment incentives and provide the right price signals to consumers. (271) However, RES-E projects are not granted priority in grid
connections, although discounts in connection charges are applied.
(272) Steinhilber S., Ragwitz M., Rathmann M, Klessmann C. and Noothout P (2011)

Part II Individual Country Files
171
0
20
40
60
80
100
2006 2007 2008 2009 2010
%Graph II.9.6:Lithuania - Electricity mix
Gas Oil Nuclear Renewables Solid fuels
Source: Eurostat
Total infrastructure investment in 2011, including interventions in the transmission network increased 37% compared to the previous year. Lithuania used to have generation overcapacity until the last nuclear reactor was shut down. For the first time in 2010 it registered a shortage of supply at peak demand of -226 MW. Projects to build a new nuclear plant should allow the country to recuperate its position as electricity exporter.
Other infrastructure investments are being undertaken to improve the country´s interconnections with other EU Member States. The NCC has recently approved a project to connect Lithuania with Sweden (NordBalt). Another two interconnection lines with Poland (LitPol 1 and 2) have been planned and should be built with the support of EU funds.
Lithuania recently adopted criteria for the unbundling of operations in the electricity sector. The operation should be concluded by October 2012.
In 2011 the electricity wholesale market remained concentrated, albeit less so than in 2010. The main 5 generators occupy some 90% of the market. One operator in particular is responsible for almost half the sales in the electricity exchange. The second biggest operator in 2010 had a market share of about 40%. However, in 2011 its share dropped to 17% and it was overtaken by another supplier. The wholesale market operator is Baltpool since 2010. Lesto is the public electricity supplier and the main electricity retailer covering over 50% of the market in 2011. Its market share has decreased by 12%
over the previous year while the number of active retailers grew from 20 to 27.
End-user prices are regulated. However, liberalization is underway and will become effective starting from 2013. Prices will remain regulated only for households which choose to remain with the public supplier. Consumer prices are below the EU average despite a sharp increase in recent years, mainly due to the phasing out of the nuclear plants. Between 2009 and 2010, households' prices increased by 20%, Industrial consumers' prices increased more modestly, by 7%.(273)
9.1.3. Conclusions
Lithuania is among the most vulnerable country in the EU for security of energy supply. The position of the country has sharply deteriorated following the closure of the last active nuclear plant which has turned Lithuania from a net exporter of electricity to a net importer. In addition, the historical reliance on a single foreign supplier (Russia) for oil and gas, the absence of any domestic energy source, and the lack of interconnections with other EU countries has further worsened the exposure of Lithuania to potential security of supply risks and price shocks. Reportedly, Lithuania has also been subject to discriminatory pricing practices from the gas supplier company which in turn has also negatively affected electricity prices due to the high share of gas in the electricity generation mix. Lithuania has planned several infrastructure projects which will progressively diversify its import sources. Furthermore, it is undertaking liberalization efforts in the gas and electricity markets to ensure a wider participation of suppliers and more market-based prices for consumers. These measures need to be implemented swiftly to mitigate the country's vulnerability. Furthermore, the still embryonic gas trading platform should be reinforced, as it could become an effective instrument to shelter from discriminatory long-term contracts and to limit the market power of the incumbent operator.
(273) Eurostat (2012)

European Commission Member States’ Energy Dependence
172
9.2. ENERGY AND CARBON INTENSITY
The energy intensity of the economy is among the highest in the EU. The trend is, however, positive, as it decreased by almost 40% between 2000 and 2010. Even more interestingly it appears that Lithuania has been able to decouple GDP growth from energy use. The country´s GDP increased continuously between 1992 and 2008 while, at the same time, gross inland consumption (GIC) of energy decreased sharply between 1992 and 2000 before starting to moderately increase again between 2000 and 2008.
The energy intensity of the economy was, however, always decreasing since 1992 despite the relapse in GIC started in 2000. In the last two years considered, 2009 and 2010, the country experienced both a reduction of GDP and a reduction of energy consumption as a consequence of the crisis, but the economy is now recovering(274).
Table II.9.1:Energy and carbon intensity
Energy intensity of the economy 1) 311 -18.5CO2 intensity of the economy 2) 0.94 -8.6Share of energy intensive sectors in Gross Value Added 3) 8.1 -0.5
Energy intensity of the economy 1) 152 -4.7CO2 intensity of the economy 2) 0.41 -9.1Share of energy intensive sectors in Gross Value Added 3) 8.9 -0.9Source: Eurostat
2010 percentage change2006 - 2010
memo items: EU27
Notes: 1) Kg of oil equivalent per 1000 EUR, changes in percent; 2) Tonnes of CO2 equivalent per 1000 EUR, changes in percent; 3) percent of total gross value added, changes in percentage points, latest data refer to the year 2009.
According to the first National Energy Efficiency Action Plan (NEEAP), the saving target for the period 2008-2016 equals 9% of the baseline(275), while the intermediate target for the period 2008-2010 is a saving of 1.5% relative to the baseline. In 2010, energy savings amounted to 1.8% of the baseline(276), hence the interim target appears to have been met and slightly exceeded. The main contributors to meeting the target were horizontal measures (accounting for 76% of total savings), the service sector (14%) and households (10%).
The carbon intensity of the Lithuanian economy is well above the EU average but it slightly decreased from 2006 to 2010.
(274) Real GDP 1.4% in 2010, 5.9% in 2011according to SF2012
(275) Republic of Lithuania (2007): The baseline is the average annual final energy consumption over the period 2001-2005.
(276) Republic of Lithuania (2011a)
0.90
0.95
1.00
1.05
300
325
350
375
400
2006 2007 2008 2009 2010
Graph II.9.7:Lithuania - Energy and carbon intensity of the economy
Energy intensity (lhs) CO2 intensity (rhs)
kgoe/1000 EUR ton CO2 eq./1000EUR
Source: Eurostat
Under the Kyoto Protocol, Lithuania has an obligation to reduce greenhouse gas emissions by 8 % against 1990 levels during the period 2008-2012(277). Between 1990 and 2009 GHG intensity decreased in all Member States and Lithuania experienced one of the largest decreases (-60%)(278). From 2005 onwards there was an insignificant growth in total emissions. Therefore, according to the projections, Lithuania will considerably over deliver on the requirements of the Kyoto Protocol.
The country appears to have made sufficient progress in the non-ETS sector. Under the Effort Sharing Decision(279), Lithuania has committed to limit its GHG emissions in non-ETS sectors to an increase of 15% (compared to 2005) by 2020. Latest projections show that, it will reach an increase of only 1% by 2020 or a decrease of 4% if additional measures are taken(280).
The share of GHG emissions falling under the ETS equals 30% of total emissions, significantly below the EU average of 40%. During the third phase of the scheme, starting in 2013 there will be an EU-wide emissions cap and emission allowances will have to be auctioned while so far they had been granted for free. This is expected to impact on the energy costs of industries which will likely pass them on to consumers. However the effects of the auctioning on the Lithuanian economy are expected to be limited, first because of the low share of emissions covered by the
(277) European Environment Agency (2010) (278) European Commission (2012) (279) Decision 406/2009/EC (280) European Commission (2011)

Part II Individual Country Files
173
scheme and second because the power sector, which account for 50% of the emissions, will be still granted free allocation until 2019 pursuant derogation foreseen by Article 10c of the ETS Directive.
9.2.1. Industry
Energy intensity of industry was slightly higher than the EU average in 2010 but it decreased by 13% between 2006 and 2010. According to Government sources, the energy intensity of industries between 2001 and 2008 successfully decoupled the use of energy from value added(281). While the value added increased by 65%, energy consumption increased only by 22%(282).
The share of energy-intensive sectors in total gross value added in Lithuania is around 8%; that is a little lower than the EU average in 2010. The sector share of total final energy consumption in 2010 equalled 18%. The consumption pattern of Lithuania´s industries followed the same fluctuations observed in the rest of the economy.
1.35
1.50
1.65
1.80
1.95
2.10
170
180
190
200
210
2006 2007 2008 2009 2010
Graph II.9.8:Lithuania - Energy intensity of industry, carbon intensity of energy use
Energy intensity of industry (lhs)CO2 intensity of energy use (rhs)
kgoe/1000 EUR ton CO2 eq./1000EUR
Source: Eurostat
The second NEEAP does not provide information on the interim savings reached by industries until 2010; it only foresees final energy savings of 565 GWh by 2016, which represents around 14% of the overall target, mainly through voluntary agreements with industries that should have started in 2012 targeting the sectors that do not fall within the scope of the ETS. (281) European Commission (2011) (282) European Commission (2011)
The carbon intensity of the energy sector has of course increased in recent years due to the halt of the nuclear plants, but it remained still below the EU average in 2010. Further fields to explore for the reduction of the carbon footprint are the development of CHP and a targeted taxation system which could incentivise the adoption of low carbon technologies. With regard to CHP, the country has made noticeable progress. The share of CHP in total electricity generation grew from 14% in 2006 to 34% in 2010. On the other hand, energy and environmental taxation is still relatively low.
9.2.2. Transport
Energy intensity of the transport sector is in line with the EU average and has decreased by 23% between 2000 and 2009. Value added of the transport sector grew by 92% over the same period while the increase in final energy consumption was only 48%, suggesting improved efficiency in the use of energy per unit of value added (yet it was the biggest increase among all Lithuanian sectors). In 2010, transport accounted for 33% of the total final energy consumption, second after households.
1.50
1.60
1.70
1.80
1.90
520
545
570
595
620
2006 2007 2008 2009 2010
Graph II.9.9:Lithuania - Energy and carbon intensity of transport
Energy intensity (lhs) CO2 intensity (rhs)
kgoe/1000 EUR ton CO2 eq./1000EUR
Source: Eurostat
The second NEEAP does not provide information on the interim savings achieved by transport until 2010; it lays down measures to achieve a projected level of savings of 472 GWh by 2016, which should account for around 12% of the total target. The largest share of the savings should be generated through the new National Strategy for Transport adopted in 2011, which should bring about changes in terms of taxation of polluting vehicles, awareness raising campaigns and

European Commission Member States’ Energy Dependence
174
promotion of public bikes and other forms of public transports (car-sharing, trains, etc). Starting in January 2011, a vehicle tax has been made dependent on the CO2 emitted, replacing a tax based on the price of the car.
The transport sector has reduced its carbon intensity over the years and it is now more or less in line with the EU average. This decrease happened despite the fact that transport taxes (excluding fuels) are the lowest in the EU(283). Fuel prices both for gasoline and diesel are among the lowest in the EU (21/27 for gasoline, 22/27 for diesel)(284).
9.2.3. Households
Energy intensity of household was among the highest in the EU in 2010 and increased between 2006 and 2010. The important share of energy expenses in Lithuanian households' budget (14%) is also among the highest in the EU. The recent increase in electricity prices might not yet been translated into changes in households' energy consumption pattern.
The households' share of final energy consumption is the highest of all sectors (34%). The final energy consumption of Lithuanian families was decreasing constantly, although very moderately, between 1992 and 2000, then it started to slowly increase until 2010 going back to its 1992 level.
0.20
0.21
0.22
0.23
0.24
0.25
80
90
100
110
120
2006 2007 2008 2009 2010
Graph II.9.10:Lithuania - Energy and carbon intensity of households
Energy intensity (lhs) CO2 intensity (rhs)
kgoe/1000 EUR ton CO2 eq./1000EUR
Source: Eurostat
(283) iGrowGreen (2011) (284) Europe's Energy Portal (2012)
The second NEEAP presents a series of measures to achieve further savings in the households sector. Relative to the transport and industrial sectors, household savings accounted for a larger share of total FEC savings up to 2010. Projections for savings by 2016 are 558 GWh, or roughly 14% of the overall savings target for Lithuania. This suggests that, given a relatively similar overall target, the household sector has performed better than industries over the period 2008-2010 in advancing towards its 2016 target. The bulk of the expected savings should be generated by renovation and upgrading of buildings followed by projects to equip buildings with renewable energy sources. Additional energy efficiency projects in housing are on-going under EIB JESSICA fund.
The carbon intensity of households is among the highest in the EU. The worrying performance of households could be explained by the high energy intensity of the sector combined with the high share of heat in their energy consumption.
9.2.4. Conclusions
Lithuania is among the worst performers in terms of energy and carbon intensity. The relatively high energy intensity of the economy combined with the worrying scores in terms of security of energy supply suggest that further improvements in energy efficiency will be necessary to insulate the country from shocks. Progress has been made across all sectors, especially industries, and it should be recognized. Lithuania appears to have successfully decoupled economic growth from energy use.
The performance in terms of energy and carbon intensity of the households sector, however, still appears problematic. In addition, given the pessimistic projections in terms of GHG reductions, further efforts are warranted. A series of events have shaped the energy position of Lithuania in recent years, first and foremost the closure of the last active nuclear power plant. This has put additional pressure on other conventional and more carbon intense energy sources and has further exacerbated the power struggle with Russia over gas imports inflating energy prices for consumers. The high share of energy expenditures in the consumers' basket suggests that such events are likely to affect Lithuanian citizens more than other EU countries.

Part II Individual Country Files
175
Any policy aiming at limiting CO2 emissions and improving energy efficiency should be therefore balanced against the need to preserve the country's competitiveness. In this sense, there appears to be room for manoeuvre in the field of energy and environmental taxation, shifting the burden away from labour taxes onto resources and fossil fuels. Moreover, the households sector should be the top priority of future energy efficiency measures as the margins for savings appear to be greater. Finally the cost-effectiveness of the renewable energy support scheme should be assessed to ensure the sustainable development of these technologies.
9.3. CONTRIBUTION OF ENERGY PRODUCTS TO TRADE
9.3.1. Net energy trade balance
In 2011, Lithuania had the highest overall energy trade deficit in the EU at -7.8% of GDP, while the deficit for oil was among the highest in the EU and the one for gas the highest. Lithuania's energy trade deficit has shown a striking deterioration in the last decade, both as regards its size and the comparison vis-à-vis the other Member States. The main reason has been the closure of two nuclear power plants. The first one was closed in 2004, bringing the country´s energy balance from a surplus to a deficit position. The second and last one was closed in 2009 causing a surge in the deficit in 2010. The substitution to imported gas and oil has caused the deficit to soar.
-10
-8
-6
-4
-2
0
-20
-15
-10
-5
0
5
2007 2008 2009 2010 2011
% of GDP% of GDP
Graph II.9.11:Lithuania - Trade balance of energy products and CA
CA (lhs) Oil (rhs)Gas (rhs) Total (rhs)
Source: Eurostat
However, the developments and current size of the energy trade deficit should be seen against the background of the country's current account balance, and more generally against that of an economic recovery after a sharp and deep recession which followed a financially imbued boom. Lithuania's current account balance has improved at an impressive pace, contracting from -14..4% in 2007 to a surplus of 4.4% in 2009 and then falling back to a relatively modest deficit of -1.5% of GDP in 2011. In the current situation, the balance for the other product categories can be seen as compensating for a large part of the energy trade deficit. While the deterioration of energy trade deficit has not prevented the radical improvement in the current account in the recent past, the recent sharp increase in the energy trade may pose a risk in the future for keeping the current account balanced.
9.3.2. Decomposition of the net energy trade balance
The energy trade balance can be decomposed into three multiplicative factors, namely the relative energy trade balance (i.e. the share of net exports in energy products in total cross-border energy trade), the share of energy in total trade and the macro openness to trade (i.e. the ratio of total trade to GDP). Lithuania does not stand out as regards the size of the deficit on the relative energy trade balance in the year 2011. However, Lithuania has the highest share of energy trade in total trade in the EU, while the macro openness is clearly above EU average.
Table II.9.2:Decomposition of Energy Trade Balance
2007 2008 2009 2010 2011Energy trade balance (% GDP) -4.2 -5.8 -4.2 -7.2 -7.8Relative trade balance (%) -26.5 -19.1 -18.1 -21.3 -18.8Share of energy in total trade (%) 15.1 26.3 24.6 28.0 29.6Macro trade openness (% GDP) 105.5 114.7 93.6 120.9 139.4Source: Eurostat
Significantly, the decomposition shows that in the period 2007-2011 the increase in the share of energy in total trade has contributed most to the deterioration of the energy trade deficit. Should this share have remained constant, the energy trade deficit would have remained of the same order of size in the period.
The reduction in the relative energy trade balance and the increase in the macro openness to trade have had opposing effects, largely cancelling each

European Commission Member States’ Energy Dependence
176
other. Paradoxically, it has not been the near doubling of the energy share in total trade from 2007 to 2008 which has had the greatest impact, as this has been offset by a parallel reduction in the relative energy trade deficit, reflecting the economic contraction. Rather the more modest increase from 2009 to 2010, coinciding with the nuclear plant shut-down, has had more impact as then the relative trade deficit increased as well.
9.3.3. Conclusions
Lithuania appears as one of the most vulnerable countries in the EU as regards the trade balance for energy products. Its energy trade deficit has clearly deteriorated in the last five years, in particular the last two ones, as a direct consequence of the closure of the last nuclear reactor (and possibly of the undue increase of gas prices). The big trade deficit may persist in the coming years since in the medium term the country needs to cover its lack of domestic energy production through imports and, at least until 2015, the long-term contracts with Gazprom will be the main source of imports.
Lithuania should continue its policy of progressively reducing its dependence on Russian gas through diversifying its energy mix including its import sources and through implementing a better-functioning gas exchange platform. At the same time, in the long run, the construction of new electricity and gas interconnections should also contribute to strengthening security of supply. The speed of implementation of the various measures that the Lithuanian Government has already proposed will determine the pace at which the country may gain a more competitive position in the European energy market. This will significantly contribute to restoring economic growth, given the high importance of energy items in the country's economy.
9.4. REFERENCES
European Commission (2011), Annual Growth Survey 2012, Europe 2020 targets: climate change and energy, COM (2011) 815 of 23 November
European Commission (2012), Progress towards achieving the Kyoto Objectives, COM (2012) 626 of 24 October.
Europe's Energy Portal (2012), Fuel Prices, available from: http://www.energy.eu/
European Environment Agency (2010), GHG trends and projections in Lithuania, GHG Country Profiles, October 2010
Eurostat (2012), Energy statistics – Prices, available from: http://epp.eurostat.ec.europa.eu/portal/page/portal/energy/data/main_tables
iGrowGreen (2011), Transport Taxes (excl. fuel)/GDP, IGG Online Database: List of Indicators, available from: http://ec.europa.eu/economy_finance/indicators/economic_reforms/Quantitative/byIndicatorList/index.cfm?appName=igg&appSid=5
National Control Commission for Prices and Energy (2010), 2010 Annual Report to the European Commission
National Control Commission for Prices and Energy (2011), 2011 Annual Report to the European Commission
Republic of Lithuania (2007), First National Energy Efficiency Action Plan, available from: http://ec.europa.eu/energy/efficiency/end-use_en.htm
Republic of Lithuania (2011a), Second National Energy Efficiency Action Plan, available from: http://ec.europa.eu/energy/efficiency/end-use_en.htm
Republic of Lithuania (2011b), National Renewable Energy Action Plan 2010-2020, available from: http://ec.europa.eu/energy/renewables/action_plan_en.htm
Steinhilber S., Ragwitz M., Rathmann M, Klessmann C. and Noothout P (2011), Indicators assessing the performance of renewable energy support policies in 27 Member States, D17 Report of RE-Shaping project.
World Nuclear Association (2012), Nuclear Power in Lithuania, Country Briefings, available from: http://www.world-nuclear.org/info/inf109.html

10. LUXEMBOURG
177
10.1. SECURITY OF ENERGY SUPPLY
Luxembourg's import dependency is one of the highest in the EU, reaching 96.8% in 2010. This share has been stable since 1999 as Luxembourg has very little domestic production and imports the vast majority of its energy sources.
90
95
100
105
2006 2007 2008 2009 2010
%Graph II.10.1:Luxembourg - Import
dependence
Gas Oil Solid fuels Total
Source: Eurostat
The diversification of primary energy sources is very limited as the country fundamentally uses only two sources of energy: oil and gas. Renewables and solid fuels account for a mere 3% and 2%, respectively, of Luxembourg's energy consumption. This is confirmed by the large concentration index (HHI), which is one of the highest in the EU.
10.1.1. Primary energy sources
10.1.1.1. Oil
Oil is the most important energy source in Luxembourg, covering 62% of the country's energy consumption in 2010. The share remained stable in the last decade and in 2010 represented one of the largest oil shares in the EU.
Key Insights
Security of Energy Supply:
- In 2010, Luxembourg was one of the most vulnerable countries in the EU regarding the security of energy supply. The lack of domestic sources of energy and the insufficient diversification of the energy mix are the main causes for concern.
- However, Luxembourg trades mainly with other EU Member States which mitigates the geo-political risks.
Energy and Carbon Intensity:
- Luxembourg is the most energy- and carbon-intensive country in the EU-15 but it performs better than most of the EU-12 Member States.
- The relatively low energy intensity of the economy masks the opposite performances of industry and transport, on the one hand, and of the household sector, on the other hand.
- Luxembourg is expected to face difficulties in reaching its 2020 target for greenhouse gas (GHG) emission reductions. The road sector represents the most significant source of emissions and has a large emission reduction potential.
Trade balance for energy products:
- Luxembourg appears relatively unproblematic with respect to the trade balance of energy products.
- Luxembourg's dependence on imports for oil, its main primary energy source, explains why its trade deficit for oil and relative energy trade deficit are relatively big. However, both factors are mitigated by the large and persistent current account surplus as well as by the small share of energy in total trade.

European Commission Member States’ Energy Dependence
178
0
20
40
60
80
100
2006 2007 2008 2009 2010
%Graph II.10.2:Luxembourg - Energy mix
Gas Oil Nuclear Renewables Solid fuels
Source: Eurostat
In the absence of a domestic refinery, all oil imports are in the form of refined products. Luxembourg imports oil products only from four countries, namely Belgium (with 73% of total oil imports in 2010), Germany, the Netherlands and France, which results in a concentration index among the highest in the EU. However, all these export countries are EU Member States and therefore there is only a limited geo-political risk attached (mainly with respect to the oil trade structure of these countries, which themselves import between 56% and 72% of crude oil from non-EEA region).
10.1.1.2. Gas
The second largest source of energy in Luxembourg's energy mix is gas, which accounted for 25.7% of energy consumption in 2010 (in line with the EU average). This share has remained broadly stable since 2002 when it increased by 7 p.p. mainly on the back of a decreasing share of solid fuels in the overall energy consumption.
As Luxembourg does not produce any natural gas, it solely relies on its imports. The HHI suggests a low concentration of gas imports, while Norway supplies roughly half of all gas imports to Luxembourg. Russia is the second main supplier, with almost one quarter of imports, followed by spot purchases at the Zeebrugge hub(285) in Belgium (12.4% in 2010).
(285) International Energy Agency (2010)
0.0
0.2
0.4
0.6
0.8
2007 2008 2009 2010
Graph II.10.3:Luxembourg - HHI index energy imports
Gas Oil Solid fuels
Source: Eurostat
A well-functioning and interconnected gas market with competitive and market-based prices should provide the correct incentives for further investments and signals to consumers for an efficient and sustainable use of resources. Both elements are conducive to reducing the vulnerability of the country to energy-related shocks. The country's natural gas pipelines are not designed for transit, i.e. they do not export gas to third countries and Luxembourg uses all its imports for consumption. There is also no natural gas storage available in Luxembourg(286).
The gas market is very concentrated, especially at wholesale level. After a restructuring in 2009, the company Enovos owns and operates the transmission system and supplies the majority of the market. The parent company, Enovos International S.A. has two main subsidiaries, Creos Luxembourg S.A. in charge of grid activities and Enovos Luxembourg S.A. dealing with energy generation, sales and trading activities. For the moment there is no competition in the wholesale market for gas as Enovos supplies all gas to the country’s four distribution system operators.
(286) International Energy Agency (2010). The natural gas
pipeline network consists of around 380 km of transmission system and some 2,300 km of distribution system network.

Part II Individual Country Files
179
30
50
70
90
110
2007 2008 2009 2010
%
Graph II.10.4:Luxembourg - Non-EEA share of imports
Gas Oil Solid fuels
Source: Eurostat
Regarding the retail market, there is some evidence of increasing concentration. The Enovos group took control of the suppliers Luxgas (2010) and Luxembourg Energy Office (2011), although the legal entities remain. At the same time, the first consumers were supplied with natural gas by new entrant alternative suppliers from 2010(287).
The price level for industrial users is in line with the EU average, while household consumers' prices expressed in PPS are one of the smallest in the EU, significantly below the EU average(288).
10.1.1.3. Renewables
Renewables accounted for 2.9% of the inland energy consumption in the country's energy mix in 2010. This share has increased substantially since 2002 when it was only 1.0% of the energy mix. The 2020 target for RES in gross final energy consumption is set at 11%(289) ,which implies another 8.1 p.p. increase for the remaining 8 years(290).
(287) Institut Luxembourgeois de Régulation (2011) (288) European Commission (2011a) (289) Directive 2009/28/EC, 23 April 2009 (290) Luxembourg (2011b)
0
20
40
60
80
100
2006 2007 2008 2009 2010
%Graph II.10.5:Luxembourg - Renewable mix
Hydro Biomass Wind Solar Geothermal
Source: Eurostat
The share of renewables is the highest in electricity generation – 35%. Almost all of this comes from hydro power, with marginal quantities of electricity produced from biomass, waste, wind and solar power. However, Luxembourg imports more than 60% of its electricity needs. The share of renewables in heat generation is 4% from biomass, wood and biogas, partially imported. The share of biofuels in transport fuels increased from almost zero to 2% after the introduction of mandatory biofuels quota in 2007, and remained at this level since then. However, biofuels are exclusively imported. Like other countries, Luxembourg uses support instruments for renewable energy, including a regressive feed-in tariff, investment incentives and tax deductions.
10.1.1.4. Solid fuels
Solid fuels represented 1.4% of the country's energy mix in 2010. The share was relatively low since the mid-1980s when restructuring in the iron and steel industry led to the virtual elimination of the solid fuels use(291) and has further decreased since 2006. Indeed, its average share in 2006-2010 was among the lowest in the EU. The main trading partner was South Africa from which originated more than 67% of total imports of solid fuels in 2010.
10.1.2. Secondary energy sources
Luxembourg is one of the biggest importers of electricity in the EU (56% over the period 2006-2010). There are only two sources of import of
(291) International Energy Agency (2010)

European Commission Member States’ Energy Dependence
180
electricity, namely Germany with almost 85% and Belgium with 15% of the market share.
0
20
40
60
80
100
2006 2007 2008 2009 2010
%Graph II.10.6:Luxembourg - Electricity mix
Gas Oil Nuclear Renewables Solid fuels
Source: EurostatNote: the remaining share is produced by other sources
Natural gas is the principal source of fuel for electricity generation in Luxembourg, which covered 70% of final energy consumption in 2010. Natural gas provides around 65% of total inputs to electricity generation, while the remaining 35% is covered by renewable sources.
Good electricity interconnections and adequate domestic infrastructure capacity are important to shelter the country from supply shocks and to enable a proper absorption of renewables. A competitive and dynamic electricity market should cater the necessary investment incentives and provide the right price signals to consumers.
Concerning the development of market concentration, 2010 showed a strong presence of alternative foreign electricity suppliers at national level, which testifies to the good integration of the country's transmission network in the German market(292). The electricity market has been completely open to competition since July 2007(293). Since then, there has been no regulated supply price.
Final consumers' prices stood below the EU average in the second half of 2011, both for households as well as for industrial consumers. While for households the shares of energy and supply costs on the one hand and network costs on the other hand contribute roughly in the same (292) International Energy Agency (2010) (293) Institut Luxembourgeois de Régulation (2011)
proportions to the final price (excluding taxes and levies)(294), for industrial consumers energy and supply costs account for the bulk of the end-user's prices with a share of 74%. The electricity prices for households increased by 1% in the last 4 years (but decreased by 4% when adjusting for purchasing power), while prices for industrial consumers increased by 2.5% in the same period. Both increases were among the smallest ones recorded in the EU.
10.1.3. Conclusions
In 2010, Luxembourg was one of the most vulnerable countries in the EU in terms of security of energy supply; this is an unchanged position compared to 2006. The lack of domestic sources of energy and therefore full dependence on imports from other countries together with the insufficient diversification of the energy mix are the main causes for concern.
However, Luxembourg trades mainly with other Member States which mitigates the geo-political risks. Also, its networks are sufficiently interconnected with the neighbouring countries and there are contracts in place to ensure the necessary supply in the case of disruption. At the same time, strengthening the current interconnections would bolster the security of energy supply.
10.2. ENERGY AND CARBON INTENSITY
The energy intensity of Luxembourg's economy is below the EU average and this has been the case over the whole past decade.
Table II.10.1:Energy and carbon intensity
Energy intensity of the economy 1) 140 -5.8CO2 intensity of the economy 2) 0.36 -9.7Share of energy intensive sectors in Gross Value Added 3) 4.9 -0.9
Energy intensity of the economy 1) 152 -4.7CO2 intensity of the economy 2) 0.41 -9.1Share of energy intensive sectors in Gross Value Added 3) 8.9 -0.9Source: Eurostat
2010 percentage change2006 - 2010
memo items: EU27
Notes: 1) Kg of oil equivalent per 1000 EUR, changes in percent; 2) Tonnes of CO2 equivalent per 1000 EUR, changes in percent; 3) percent of total gross value added, changes in percentage points, latest data refer to the year 2009.
(294) Electricity prices are decomposed into energy and supply
costs, network costs and taxes. Energy and supply costs are driven by electricity production conditions such as the energy mix and competition aspects. Network costs represent the costs of building and maintaining the network.

Part II Individual Country Files
181
According to the second National Energy Efficiency Action Plan (NEEAP) of Luxembourg, the final energy consumption (FEC) saving target for the period 2008-2016 is set at 9% of the baseline(295)(corresponding to a saving of 1,769 TWh), while the intermediate target for the end of 2010 was a FEC saving of 3% relative to the baseline. In 2010, savings amounted to 1,493 TWh, i.e. 7.59% compared to the reference period(296), easily meeting and exceeding the interim target.
The main contributors to achieving the target were the so-called early action measures(297) which were implemented in the period 1995-2007 and which started to take effect during these years.
There are in total three different groups of measures included in the Second NEEAP(298). The plan assumes that if all of them were successfully implemented, the 2016 target would be exceeded by more than 5 p.p. But even in the case of already implemented measures and measures under implementation, the saving would add up to almost 12%.
(295) Luxembourg (2007). The baseline is the average annual
final energy consumption over the period 2001-2005. (296) Luxembourg (2011a) (297) The Second NEEAP lists 6 'early action' measures by
sector of economy (Households: Thermal insulation of new and old buildings, Promotion of energy efficiency in new homes/efficient heating systems; Tertiary sector: Improvement of total energy efficiency for non-residential buildings; Renewables: Promotion of decentralised renewables; CHP: Promotion of decentralised CHP outside emissions trading; Industry: Voluntary agreement).
(298) Apart from the 'early action' measures, the plan includes 14 'new' measures (Households: Improvement in the overall energy efficiency of private dwellings, Promotion of old building upgrade programme, Promotion of energy-efficient new buildings, Promotion of efficiency labelling, Promotion of heating upgrade programme, Promotion of A++ refrigerators; Tertiary sector: Improvement in the overall energy efficiency of non-domestic buildings, Improvement in the overall energy efficiency of non-domestic buildings; Renewables: Promotion of decentralised renewables; Transport: Reduction in fuel consumption through the increase of fuel prices, CO2 dependant motor vehicle tax, Promotion of least-polluting cars; Industry: Voluntary agreement, Continuation of voluntary agreement) and 6 'new planned/potential' measures (Households: Increase in the old building upgrade programmes, Increase in energy-efficient new build programmes, Improvement in the overall energy efficiency of private dwellings, Promotion of heating upgrade programme; Tertiary sector: Electricity savings potential; Industry: Cross-cutting technologies savings potential; Renewables: Increase of the promotion of decentralised renewables)
Overall, the carbon intensity of Luxembourg's economy is among the lowest ones in the EU and remained virtually unchanged in the last decade. In 2009, CO2 was the main source of GHG in Luxembourg (representing 91.5% of the total GHG emissions calculated in CO2e, excluding LULUCF(299). The very high share of CO2 is the result of a GHG emissions structure dominated by energy-related releases: in 2009, 88% of the total GHG emissions were generated by energy production, combustion or distribution. Out of that total, emissions related to agriculture only represented 5.6% and industrial processes only 5.5%.
0.30
0.35
0.40
0.45
0.50
130
135
140
145
150
2006 2007 2008 2009 2010
Graph II.10.7:Luxembourg - Energy and carbon intensity of the economy
Energy intensity (lhs) CO2 intensity (rhs)
kgoe/1000 EUR ton CO2 eq./1000EUR
Source: Eurostat
Under the Kyoto Protocol, Luxembourg has an obligation to reduce greenhouse gas (GHG) emissions to an average of 28% below their 1990 level during the period 2008-2012(300). According to the European Commission's report on Kyoto objectives(301), Luxembourg is one of the countries which are likely to not reach their Kyoto target. In 2010, emissions per capita were the highest in the whole EU, although they have recorded a large decrease since 1990 and the total reduction compared to 1990 was equal to only 8.3%.
Luxembourg is also not likely to meet its target for the emissions reduction under the Effort Sharing Decision(302). Even when implementing additional measures, Kyoto mechanisms and carbon sinks, the reduction of emissions in 2020
(299) Land Use, Land Use Change and Forestry (300) European Environment Agency (2010) (301) European Commission (2012) (302) Decision 406/2009/EC

European Commission Member States’ Energy Dependence
182
compared to 2005 levels is likely to be only 5%, while the target for the country is –20%(303).
The share of GHG emissions falling under the ETS is equal to 18%, the lowest share in the EU. During the third phase of the scheme there will be an EU-wide emissions cap and allowances previously allocated for free will have to be auctioned. This will increase energy costs of companies that are likely to pass them on to consumers in the form of higher prices. The magnitude of the impacts on electricity prices will be largely determined by carbon prices and by the extent to which the power sector will pursue decarbonisation efforts. The slow but declining trend of emissions registered in the power sector between 2009 and 2011 is promising in this sense.
10.2.1. Industry
In 2010, the energy intensity of Luxembourg's industry was among the highest in the EU and the highest among the EU-15 countries. It increased by 24% since 2006. This happened on the back of a stable final energy consumption of industry but decreasing GVA. However, GVA started to increase again from the through in 2009 which gives some hope for improving the energy intensity features in the near future. According to the second NEEAP, the decoupling of energy consumption from economic growth was achieved at least partially.
2.25
2.30
2.35
2.40
245
285
325
365
2006 2007 2008 2009 2010
Graph II.10.8:Luxembourg - Energy intensity of industry, carbon intensity of
energy use
Energy intensity of industry (lhs)CO2 intensity of energy use (rhs)
kgoe/1000 EUR ton CO2 eq./1000EUR
Source: Eurostat
(303) European Commission (2011b)
In 2010, final energy consumption of industry equalled 17.4% of total final energy consumption, down from 18.4% in 2006. The main sectors consuming final energy were iron and steel (60.7%) and non-metallic minerals (20.9%). Both these sectors also displayed the highest energy intensity in Luxembourg's industry portfolio. Indeed, iron and steel industry was the most energy-intensive in the whole EU.
According to the second NEEAP, the interim savings in industry reached 301 GWh in 2010 and hence accounted for 1.35% of the savings target, mainly through on-going voluntary agreements with industry agents. It is foreseen that by 2016 industry will contribute 2.33% to the overall savings target, i.e. 458 GWh per year.
The carbon intensity of the energy sector remained close to the EU average in 2010 and registered a slight decline since 2006.
10.2.2. Transport
In 2009, the energy intensity of the transport sector was also among highest in the EU and exceeded that of all the other EU-15 countries. However, it decreased by 16% over the period 2006-2009.
2.10
2.20
2.30
2.40
2.50
2.60
860
895
930
965
1000
1035
2006 2007 2008 2009 2010
Graph II.10.9:Luxembourg - Energy and carbon intensity of transport
Energy intensity (lhs) CO2 intensity (rhs)
kgoe/1000 EUR ton CO2 eq./1000EUR
Source: Eurostat
In 2010, final energy consumption of transport equalled 60.9% of total final energy consumption, virtually unchanged compared to 2006. The main sectors consuming final energy were road transport (83.0%) and international aviation (16.4%). A large majority of Luxembourg's road transport is attributed to cars

Part II Individual Country Files
183
and trucks coming from across the borders. As transport fuels in Luxembourg cost less than in neighbouring countries (because of lower taxes on gasoline and diesel fuel), foreign motorists and truckers often cross the border to fill their tanks. This group also includes commuters, representing around 46% of the country’s workforce that enters the country daily from Belgium, France and Germany(304).
Even though Luxembourg raised its excise duties on diesel in 2008, they still remain significantly below those of neighbouring countries. At the same time, also VAT (at 15%) remains well below the rate of all three of its bordering countries. This partly explains the poor performance of Luxembourg's transport sector in terms of carbon and energy intensity.
The second NEEAP states three measures which were implemented from 2008 (i.e. a rise in the price of domestic fuel, the introduction of CO2-dependent motor vehicle tax and the promotion of low CO2 emissions vehicles). By 2010 they contributed 0.64% to the interim savings target, and by 2016 they should account for 1.51% of the overall FEC savings target.
The carbon intensity of transport was among the highest in the EU in 2009(305). However, the sector has reduced its carbon intensity over the years (mainly on the back of fast growth of GVA rather than a decrease in GHG emissions).
Luxembourg is the country with the highest share of transport emissions in the non-ETS sectors of the whole EU(306). This is a result of the fact that, as mentioned before, the country has a high volume of road transit traffic which is further increased by the large number of commuters. Compared to international traffic, domestic traffic plays a relatively small role since it accounts for only one quarter of all road fuel sold in Luxembourg. Consequently, in 2009, ‘road fuel sales to non-residents’ represented 38% of the total GHG emissions(307).
(304) International Energy Agency (2010) (305) This does not come as a surprise, as the carbon intensity of
the transport sector is highly correlated with its energy intensity.
(306) European Commission (2011b) (307) European Environment Agency (2010)
10.2.3. Households
Households' energy intensity was very low compared to that of other EU countries in 2010. Energy consumption of households decreased by 7.4% since 2006 and the country improved its position relative to other EU countries.
0.10
0.13
0.15
0.18
0.20
40
43
45
48
50
2006 2007 2008 2009 2010
Graph II.10.10:Luxembourg - Energy and carbon intensity of households
Energy intensity (lhs) CO2 intensity (rhs)
kgoe/1000 EUR ton CO2 eq./1000EUR
Source: Eurostat
At the same time, in 2010, final energy consumption of households equalled 11.3% of total final energy consumption, only slightly below the level of 2006.
The second NEEAP mentions eight energy efficiency measures in the household sector which were already implemented(308). The effective measures in the building sector focus on the progressive tightening of building regulations. In 2010, all implemented measures contributed 2.77% to the interim savings target. Together with another four measures, which are to be implemented in the course of 2012 and 2013, the full contribution to the 2016 savings target should total 992 GWh per year, or 5.05% of total savings.
The carbon intensity of the household sector is basically in line with the EU average and decreased slightly since 2006.
10.2.4. Conclusions
Overall, in terms of energy and carbon intensity Luxembourg is the most intensive among the EU-15 Member States, while among the EU-12 Member States only one country performs better. The relatively low energy intensity of the (308) See footnotes 297 and 298.

European Commission Member States’ Energy Dependence
184
economy masks the opposite performances of industry and transport, on the one hand, with a very large energy intensity, and of the household sector, on the other hand, with a very low energy intensity. According to the Second NEEAP, the country seems to be on track to achieve its savings target by 2016.
While the energy efficiency of industry and transport can be improved by policy measures, Luxembourg has to explore options to reduce its GHG emissions. The main source of GHG emissions in Luxembourg is road transportation. The country has a high volume of road transit traffic, which is further increased by the large number of commuters. One way to reduce the large CO2 emissions seems to be a further increase in fuel prices, reversing the incentive for cross-border fuel shopping.
10.3. CONTRIBUTION OF ENERGY PRODUCTS TO TRADE
10.3.1. Net energy trade balance
In 2011, Luxembourg's energy trade deficit was not among the largest ones in the EU. However, the deficit has worsened somewhat over the last decade, from 2.5% in 2002 to 3.9% of GDP in 2011.
-6
-4
-2
0
2
4
6
8
10
12
2007 2008 2009 2010 2011
% of GDP% of GDP
Graph II.10.11:Luxembourg - Trade balance of energy products and CA
CA (lhs) Oil (rhs)Gas (rhs) Total (rhs)
Source: Eurostat
The oil trade balance has been one of the worst in the EU (and the worst among the EU-15 Member States) in 2011 and on average over the period 2007–2011. By contrast, the gas trade balance
which has been in near balance over the period, records one of the best performances (a slight deficit of 0.02% of GDP in 2011). Both the gas and electricity trade balances have been broadly stable since 2006, whereas the oil trade deficit has varied between roughly 2.75% and 4.75% of GDP. Luxembourg is one of the largest net importers of electricity in the EU15.
The size of the energy trade deficit should be seen against the background of the country's current account balance. Over the whole period 2007-2011, the current account surplus was among the largest in the EU (amounting to 7.1% of GDP in 2011). This confirms that the current account surplus is a persistent feature of the economy and takes away the urgency for reducing the energy trade deficit.
10.3.2. Decomposition of the net energy trade balance
The energy trade balance can be decomposed into three multiplicative factors, namely the relative energy trade balance (i.e. the share of net exports in energy products in total cross-border energy trade), the share of energy in total trade and the macro openness to trade (i.e. the ratio of total trade to GDP). Luxembourg's deficit on its relative energy trade balance is among the largest in the EU. The very low volume of energy exports readily explains this. As mentioned in section 10.1, Luxembourg is basically fully dependent on imports of primary energy sources. The large relative trade deficit does not translate into a large deficit in GDP terms mainly because of the very low share of energy in total trade, in fact the lowest of all Member States in 2011 (a mere 5.1%), and, to a lesser extent the relatively small macro trade openness.
Table II.10.2:Decomposition of Energy Trade Balance
2007 2008 2009 2010 2011Energy trade balance (% GDP) -3.7 -4.6 -2.5 -3.5 -3.9Relative trade balance (%) -88.6 -90.0 -81.1 -87.7 -89.7Share of energy in total trade (%) 4.2 5.2 3.5 4.8 5.1Macro trade openness (% GDP) 99.2 99.7 89.5 84.0 84.7Source: Eurostat
At the same time, it is worth noting that the share of energy in total trade has steadily increased over the last decade, from 2.8% in 2001 to 5.1% in 2011. Its impact has been mitigated by a simultaneous decrease of macro trade openness from 2005 onwards.

Part II Individual Country Files
185
10.3.3. Conclusions
Luxembourg appears relatively unproblematic with respect to the trade balance of energy products. The position of the country remained stable over the past decade. Given Luxembourg's dependence on imports for oil, its main primary energy source, and non-existent energy products exports, the trade deficit for oil and relative energy trade deficit are big. However, both factors are mitigated by the large and persistent current account surplus as well as by the small share of energy in total trade.
10.4. REFERENCES
International Energy Agency (2010), Oil and Gas Security - Emergency Response of IEA Countries, IEA Free Publications, available from: http://www.iea.org/publications/freepublications/publication/name,3939,en.html
Institut Luxembourgeois de Régulation (2011), National Report – English summary 2010, August 2011
European Commission (2011a), 2009-2010 Report of Progress in creating the Internal Gas and Electricity Market, Single Market for Gas and Electricity – Benchmarking Reports, available from: http://ec.europa.eu/energy/gas_electricity/legislation/benchmarking_reports_en.htm
European Commission (2011b), Annual Growth Survey 2012, Europe 2020 targets: climate change and energy, COM (2011) 815 of 23 November
European Commission (2012), Progress towards achieving the Kyoto Objectives, COM (2012) 626 of 24 October.
Luxembourg (2007), First National Energy Efficiency Action Plan, available from: http://ec.europa.eu/energy/efficiency/end-use_en.htm
Luxembourg (2011a), Second National Energy Efficiency Action Plan, available from: http://ec.europa.eu/energy/efficiency/end-use_en.htm
Luxembourg (2011b), National Renewable Energy Action Plan 2010-2020, available from: http://ec.europa.eu/energy/renewables/action_plan_en.htm
European Environment Agency (2010), GHG trends and projections in Luxembourg, GHG Country Profiles, October 2010
Steinhilber S., Ragwitz M., Rathmann M, Klessmann C. and Noothout P (2011), Indicators assessing the performance of renewable energy support policies in 27 Member States, D17 Report of RE-Shaping project.


11. HUNGARY
187
11.1. SECURITY OF ENERGY SUPPLY
Hungary's import dependency was 58% in 2010, close to the EU average. Import dependency showed an improvement of 4 percentage points in the period 2006-2010. In terms of the diversification of import sources the country scores worse than the EU average especially in the case of oil. Hungary has a relatively well-balanced energy mix with a Herfindahl-Hirschman index (HHI) of 0.25.
20
40
60
80
100
2006 2007 2008 2009 2010
%Graph II.11.1:Hungary - Import dependence
Gas Oil Solid fuels Total
Source: Eurostat
11.1.1. Primary Energy Sources
11.1.1.1. Gas
Gas is the most important source of energy in Hungary. Though its share in the energy mix has shown some decline in the last five years, with a share of 38% it was still the dominant energy
Key Insights
Security of Energy Supply:
- The overall import dependency of Hungary is 58%, in line with the EU average. The country has some domestic production of fossil fuels but it is expected to decline in the future.
- The energy mix is relatively well diversified, but the high share of gas (38%) coupled with a very high share of Russian gas imports exposes the country to supply risks. A mitigating factor is that Hungary has substantial gas storage capacities.
- Recent developments in keeping regulated gas and electricity prices low regardless of the evolution of costs together with a sectoral tax on energy companies may lead to underinvestment in the distribution network and cause risks to the security of supply.
Energy and Carbon Intensity:
- The overall energy intensity of the Hungarian economy is higher than the EU average.
- The industrial sector performs better than the EU, while the transport and households sectors perform worse. The energy intensity of households is the third highest in the EU. The National Energy Efficiency Action Plans identify several key actions to tackle this, and rigorous implementation will be crucial.
- The policy of keeping regulated energy prices low reduces the effectiveness of policies supporting energy efficiency improvements.
Trade balance for energy products:
- Hungary has a persistently high energy trade deficit, which is one of the largest in the EU. The deficit was fluctuating in the range of 5-6% of GDP in the period 2007-2011.
- Increasing renewables production, improving energy efficiency and securing alternative, potentially cheaper, natural gas supplies could reduce the energy trade deficit.

European Commission Member States’ Energy Dependence
188
source in 2010. Hungary had one of the highest share of gas in the energy mix among EU countries in 2010. The country has some domestic production of natural gas and its import dependence was 79% in 2010.
The country depends heavily on gas imports from Russia, but it also imports from other countries including Turkmenistan, Uzbekistan and also from France and Germany transiting through Austria. With this import structure, Hungary performs slightly better than the EU average in terms of the HHI for gas imports as many countries source their gas from one single source only. On the other hand, 94% of Hungary's gas imports came from non-EEA countries in 2010, which is much higher than the EU average.
0
20
40
60
80
100
2006 2007 2008 2009 2010
%Graph II.11.2:Hungary - Energy mix
Gas Oil Nuclear Renewables Solid fuels
Source: Eurostat
Gas represents a relatively clean and efficient energy source, however, its very high share in the energy mix coupled with a very high share of one single import source exposes Hungary to supply risks. A mitigating factor is that Hungary has substantial gas storage capacity. In addition, Hungary has stepped up efforts to increase interconnections with its neighbours. The majority of gas enters the country through a pipeline from Ukraine, and a small share of it comes through a pipeline from Austria. Beside these, an interconnection is in operation with Romania since 2010 and with Croatia since 2011. Another interconnection with Slovakia is under preparation.
0.0
0.2
0.4
0.6
0.8
2006 2007 2008 2009 2010
Graph II.11.3:Hungary - HHI index energy imports
Gas Oil Solid fuels
Source: Eurostat
A well-functioning and interconnected gas market with competitive and market-based prices should provide the correct incentives for further investments and signals to consumers for an efficient and sustainable use of resources. Both elements are conducive to reducing the vulnerability of the country to energy-related shocks.
The wholesale gas market is dominated by a long-term purchasing agreement with Russia currently held by E.On, though recently the importance of cheaper gas entering from Austria through spot markets has increased. Hungarian authorities aim to nationalise the long-term contract with Russia together with the gas storage facilities also held by E.On. Domestic gas production is carried out by the integrated oil and gas company Mol, which is owned by more than 75% by private investors with the Hungarian state holding a 24.6% stake.
The retail market is characterised by a high number of market participants. There are 10 companies with a market share of at least 5%, which is the highest figure in the EU(309). However, this is the result of a historical structure where regional distributors enjoyed local monopolies. The retail market is liberalised now and customers can choose their suppliers.
Recent developments in the area of regulated prices are a cause for concern. Prices are regulated for the so-called universal service segment, which includes residential consumers and
(309) Eurostat

Part II Individual Country Files
189
also public institutions such as schools and hospitals. Since 2010 these regulated prices have not followed the evolution of costs of retailers leading to some losses in the gas retail sector. The situation of energy companies is further aggravated by a sectoral tax which targets energy companies. In addition, in January 2013 regulated prices for gas and electricity were further reduced by 10% by regulatory means. Besides the problem that regulated prices do not give a correct signal to consumers, this policy is likely to lead to underinvestment in the distribution network, which can undermine the security of supply.
11.1.1.2. Oil
Oil represented 26% of the primary energy mix in 2010, which is well below the EU average. The share of oil in the energy mix has been stable since 2006. The country imported 84% of its oil demand in 2010, which is a substantially lower share than the EU average. The import dependency has shown an increase in 2006-2010 due to a gradual decline in domestic production, which peaked in 1985 and is expected to continue its declining trend in the future. Oil imports come primarily from Russia, while some other sources represent a minor share in imports. The Hungarian import structure of oil is among the most concentrated ones in the EU with a HHI of 0.7 in 2010. The share of non-EEA import sources of 86% in 2010 is also among the highest ones in the EU.
40
55
70
85
100
2006 2007 2008 2009 2010
%
Graph II.11.4:Hungary - Non-EEA share of imports
Gas Oil Solid fuels
Source: Eurostat
Hungary imports most of its crude oil through the Druzhba pipeline which supplies oil from Russia transiting through Ukraine. The Adria crude oil
pipeline links Hungary with the Croatian port of Omisalj. This link provides the possibility of transporting oil from the Middle East to Hungary but in practice is mostly used to supply Russian oil to Croatia. Mol is the main oil company which operates both upstream and downstream. It is responsible for domestic production of oil and also owns the country's main oil refinery in Szazhalombatta.
11.1.1.3. Nuclear
Nuclear has the third highest share in the energy mix. In 2010 it accounted for some 16% of gross inland consumption. The country has one nuclear power plant at Paks with four units with a nominal capacity of 2000 MW(310). The plant was built in the 1980s with an expected lifetime of 30 years. The plant was granted permission to extend the lifetime of the units until 2032 and there are also plans to build two new units in the future. The power plant is owned by the incumbent state-owned electricity company MVM.
11.1.1.4. Solid fuels
Solid fuels represent a relatively small share in the Hungarian energy mix, only 11% of gross inland consumption in 2010. This share has been very stable in the period 2006-2010. Hungary has substantial domestic reserves of solid fuels, in 2010 only 42% of its consumption came from imports. Domestic production is limited to lignite which is used for electricity generation.
The import structure of solid fuels is relatively well balanced with a HHI of 0.3 in 2010. The main import sources of solid fuel are the United States, the Czech Republic, Russia and Poland. Consequently, the non-EEA share of imports of 57% in 2010 compares well within the EU, placing Hungary at the 5th best position in the EU.
(310) www.mvm.hu
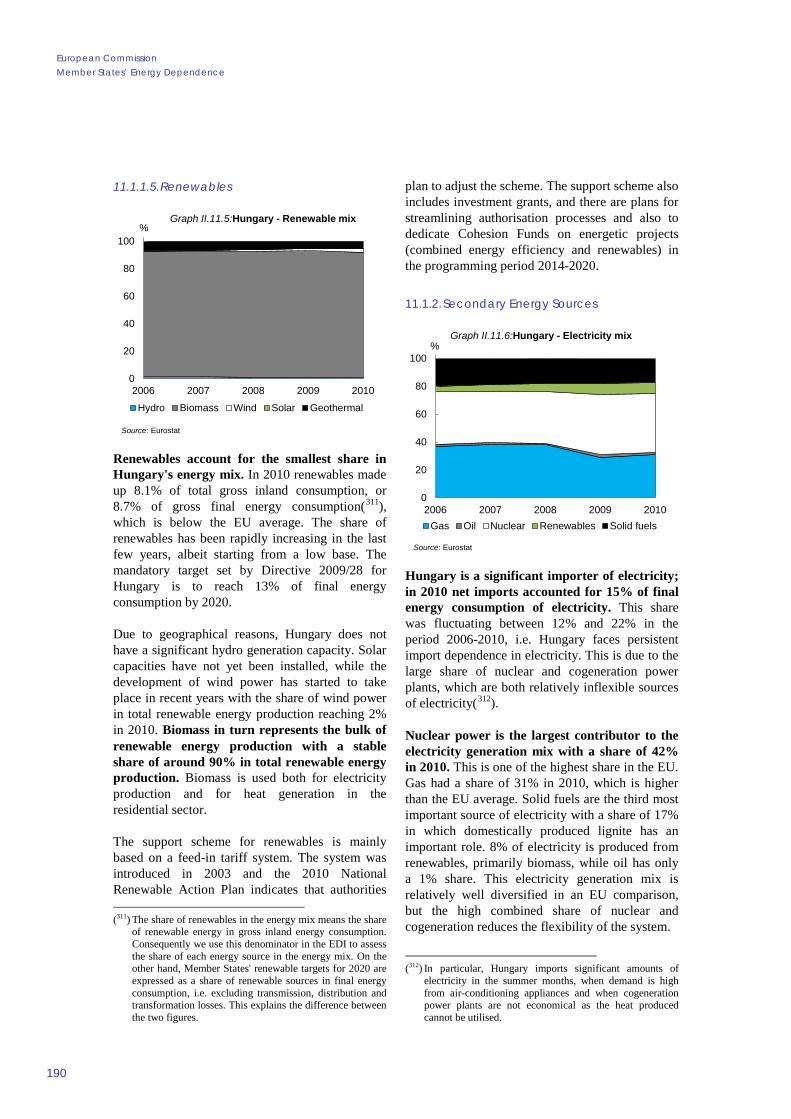
European Commission Member States’ Energy Dependence
190
11.1.1.5. Renewables
0
20
40
60
80
100
2006 2007 2008 2009 2010
%Graph II.11.5:Hungary - Renewable mix
Hydro Biomass Wind Solar Geothermal
Source: Eurostat
Renewables account for the smallest share in Hungary's energy mix. In 2010 renewables made up 8.1% of total gross inland consumption, or 8.7% of gross final energy consumption(311), which is below the EU average. The share of renewables has been rapidly increasing in the last few years, albeit starting from a low base. The mandatory target set by Directive 2009/28 for Hungary is to reach 13% of final energy consumption by 2020.
Due to geographical reasons, Hungary does not have a significant hydro generation capacity. Solar capacities have not yet been installed, while the development of wind power has started to take place in recent years with the share of wind power in total renewable energy production reaching 2% in 2010. Biomass in turn represents the bulk of renewable energy production with a stable share of around 90% in total renewable energy production. Biomass is used both for electricity production and for heat generation in the residential sector.
The support scheme for renewables is mainly based on a feed-in tariff system. The system was introduced in 2003 and the 2010 National Renewable Action Plan indicates that authorities (311) The share of renewables in the energy mix means the share
of renewable energy in gross inland energy consumption. Consequently we use this denominator in the EDI to assess the share of each energy source in the energy mix. On the other hand, Member States' renewable targets for 2020 are expressed as a share of renewable sources in final energy consumption, i.e. excluding transmission, distribution and transformation losses. This explains the difference between the two figures.
plan to adjust the scheme. The support scheme also includes investment grants, and there are plans for streamlining authorisation processes and also to dedicate Cohesion Funds on energetic projects (combined energy efficiency and renewables) in the programming period 2014-2020.
11.1.2. Secondary Energy Sources
0
20
40
60
80
100
2006 2007 2008 2009 2010
%Graph II.11.6:Hungary - Electricity mix
Gas Oil Nuclear Renewables Solid fuels
Source: Eurostat
Hungary is a significant importer of electricity; in 2010 net imports accounted for 15% of final energy consumption of electricity. This share was fluctuating between 12% and 22% in the period 2006-2010, i.e. Hungary faces persistent import dependence in electricity. This is due to the large share of nuclear and cogeneration power plants, which are both relatively inflexible sources of electricity(312).
Nuclear power is the largest contributor to the electricity generation mix with a share of 42% in 2010. This is one of the highest share in the EU. Gas had a share of 31% in 2010, which is higher than the EU average. Solid fuels are the third most important source of electricity with a share of 17% in which domestically produced lignite has an important role. 8% of electricity is produced from renewables, primarily biomass, while oil has only a 1% share. This electricity generation mix is relatively well diversified in an EU comparison, but the high combined share of nuclear and cogeneration reduces the flexibility of the system.
(312) In particular, Hungary imports significant amounts of
electricity in the summer months, when demand is high from air-conditioning appliances and when cogeneration power plants are not economical as the heat produced cannot be utilised.

Part II Individual Country Files
191
Good electricity interconnections and adequate domestic infrastructure capacity are important to shelter the country from supply shocks and to enable a proper absorption of renewables. A competitive and dynamic electricity market should cater the necessary investment incentives and provide the right price signals to consumers. Hungary has a very extensive cross-border interconnection system and is also a regional transit country for electricity. Hungary imports mainly from Slovakia and Ukraine and exports primarily to Croatia and Serbia. In addition, there is also an interconnection with Romania and Austria and there are plans to build new interconnections with Slovakia and Slovenia.
The largest electricity generation company is the state-owned MVM with a market share of 43% of total generation. The HHI figure of 0.22 indicates a relatively high concentration in electricity generation. The retail market is characterised by a relatively strong competition in the segment which is not eligible to the universal service (around 60% of the total market)(313). The universal service segment is subject to regulated prices. Similarly to the gas sector, regulated prices for electricity are not set in line with the evolution of costs, which can undermine the security of supply in the universal service segment.
11.1.3. Conclusions
While Hungary's import dependency is close to the EU average and its energy mix is well diversified, the very high share of gas in the energy mix together with the very high share of Russian gas in imports exposes the country to supply risks. To mitigate these risks, Hungary has invested in creating significant gas storage capacities. However, the country should explore all possible ways to diversify its gas imports. Hungary has participated in the Nabucco project, but the viability of this project remains in question. Negotiations have started to create a North-South gas corridor between Poland and Croatia linking two planned LNG terminals, Hungary should actively promote this corridor to have access to these terminals. In addition, Hungary should also aim to diversify its oil import sources as it shows one of the most concentrated import structures for oil in the EU. (313) Hungarian Energy Office, 2011
Regarding regulated gas and electricity prices, the country should focus on targeting subsidies only to vulnerable consumers instead of keeping energy prices low by regulatory means for all consumers in the universal service segment.
11.2. ENERGY AND CARBON INTENSITY
The overall energy intensity of the Hungarian economy is higher than the EU average. Energy intensity has been rather stable in the period 2006-2010.
Table II.11.1:Energy and carbon intensity
Energy intensity of the economy 1) 371 -18.2CO2 intensity of the economy 2) 0.95 -22.2Share of energy intensive sectors in Gross Value Added 3) 13.3 -4.2
Energy intensity of the economy 1) 152 -4.7CO2 intensity of the economy 2) 0.41 -9.1Share of energy intensive sectors in Gross Value Added 3) 8.9 -0.9Source: Eurostat
2010 percentage change2006 - 2010
memo items: EU27
Notes: 1) Kg of oil equivalent per 1000 EUR, changes in percent; 2) Tonnes of CO2 equivalent per 1000 EUR, changes in percent; 3) percent of total gross value added, changes in percentage points, latest data refer to the year 2009.
The first National Energy Efficiency Action Plan (NEEAP) sets the target of reducing energy consumption by 1% per annum in the period 2008-2016, or by a total of around 16 GWh. The support scheme is primarily based on investment subsidies for energy efficiency projects, but also includes voluntary agreements with large companies and information campaigns. The biggest savings are expected in the residential sector such as energy performance improvement of housing estates and also in the industry and transport sectors. The Second NEEAP states that the interim target for 2010 was reached and that the overall target for 2016 can be met with the planned actions.
0.70
0.75
0.80
0.85
0.90
280
285
290
295
300
2006 2007 2008 2009 2010
Graph II.11.7:Hungary - Energy and carbon intensity of the economy
Energy intensity (lhs) CO2 intensity (rhs)
kgoe/1000 EUR ton CO2 eq./1000EUR
Source: Eurostat

European Commission Member States’ Energy Dependence
192
The carbon intensity of the Hungarian economy is in line with the EU average. The high share of gas and nuclear in the energy mix contributes to a relatively low-carbon use in energy supply. The carbon intensity of the economy showed a steady decline in the period 2006-2010.
GHG emissions have shown a declining trend in the period 2006-2010. Hungary is safely on track to meet its Kyoto commitments, which is largely due to the process of economic transition that took place in the 1990s which reduced the share of heavy industry. Hungary needs to reduce GHG emissions by 6% relative to the reference year, but in 2010 the emissions were 41% below the reference year. As a result, Hungary has sold and intends to sell more of its unused Assigned Amount Units of its GHG emission quota.
Hungary is also expected to meet its targets for the non-ETS sector under the Effort Sharing Decision(314). Hungary was meant to limit its emissions by 2020 to an increase of 10% compared to 2005. The latest projections are instead showing that the country is expected to reduce its emissions by 26%(315).
Some 34% of total emissions in Hungary falls within the scope of the ETS. This is 6 p.p. below the EU average. While emissions allowances have so far been granted for free, the third phase of the ETS foresees an EU-wide emissions cap and the adoption of the auctioning starting in 2013. The impact of the system in Hungary is likely to be limited since the country has received a derogation in accordance with Article 10c of the ETS Directive to grant free allowances to its power sector until 2019.
11.2.1. Industry
Hungarian industry is less energy-intensive than the EU average. This is a notable achievement because the share of energy-intensive industries is above the EU average. Industry's energy intensity has fallen by 14% in the period 2006-2010.
(314) Decision 406/2009/EC (315) European Commission (2012)
1.85
1.90
1.95
2.00
2.05
2.10
140
150
160
170
180
2006 2007 2008 2009 2010
Graph II.11.8:Hungary - Energy intensity of industry, carbon intensity of energy use
Energy intensity of industry (lhs)CO2 intensity of energy use (rhs)
kgoe/1000 EUR ton CO2 eq./1000EUR
Source: Eurostat
The second NEEAP foresees further substantial energy savings in the industry, which should make up around 22% of total savings. The bulk of the savings should come from an investment support scheme promoting energy savings and the use of renewables by industrial consumers. Upgrading the district heating network, mandatory energy audits for large consumers, voluntary agreements and mandatory hiring of energetic experts by large consumers are also expected to deliver energy savings in the industry.
The carbon intensity of energy use is slightly below EU average. Gas represents a relatively low-carbon source of energy, and the high shares of gas and nuclear in the energy mix imply a low level of GHG emissions in the energy sector. The carbon intensity of energy use has fallen by 8% in the period 2006-2010. The reason behind this is an increase in the shares of nuclear and renewables in the energy mix.
11.2.2. Transport
The energy intensity of the Hungarian transport sector is substantially above the EU average. It has increased by 9% in the period 2006-2009 i.e. the deterioration continued during the economic crisis.

Part II Individual Country Files
193
1.95
2.00
2.05
2.10
2.15
710
735
760
785
810
2006 2007 2008 2009 2010
Graph II.11.9:Hungary - Energy and carbon intensity of transport
Energy intensity (lhs) CO2 intensity (rhs)
kgoe/1000 EUR ton CO2 eq./1000EUR
Source: Eurostat
According to the second NEEAP, 8% of the total energy savings should come from the transport sector. Most of this is foreseen through a moderation in energy demand of the sector through the extension of the road toll system for freight transport, the creation of low-traffic zones and the development of a bicycle road network. In addition, the upgrading of the railway network (electrification and modernisation) and the improvement of public transport systems is also expected to bring about energy savings.
The carbon intensity of transport is also much higher than the EU average. It has shown an increase throughout the period 2006-2009 similarly to the energy intensity of transport. Increasing the attractiveness of public transport as opposed to the use of private cars would be crucial in reversing this trend.
11.2.3. Households
The energy intensity of households is the third highest in the EU, i.e. this is an area where there are ample opportunities for improvement. Households' energy intensity showed some improvement in 2006-2007, but this was reversed in the years 2008-2010.
0.20
0.23
0.25
0.28
0.30
110
115
120
125
130
2006 2007 2008 2009 2010
Graph II.11.10:Hungary - Energy and carbon intensity of households
Energy intensity (lhs) CO2 intensity (rhs)
kgoe/1000 EUR ton CO2 eq./1000EUR
Source: Eurostat
The low energy performance of buildings is an acute problem, especially in the housing estates built in the 1960s-1970s. In addition, outdated communal heating systems with a lack of individual metering fail to give the correct signals for energy savings. The NEEAPs recognise the importance of these problems and foresee several measures in these areas.
The second NEEAP expects that 37% of the total energy savings will come from the household sector. One of the two most important programmes in this regard is the improvement of energy performance of housing estates through investment support for improvement of isolation, metering-based billing, stricter energy standards, energy audits and energy advisory assistance. A similarly important programme aims at improving the energy performance of other buildings through similar measures.
In this regard, it is important to emphasise that the policy of keeping regulated gas and electricity prices low for households by regulatory means reduces the effectiveness of policies supporting improvements in households' energy efficiency. This is especially problematic because the Hungarian household sector shows one of the highest energy intensity levels in the EU.
11.2.4. Conclusions
The overall energy intensity of the Hungarian economy is higher than the EU average. The industrial sector actually performs better than the EU average, which is notable given the relatively higher share of energy-intensive industries. The

European Commission Member States’ Energy Dependence
194
high overall energy intensity originates from the transport and more importantly the household sector.
The energy intensity of transport is substantially above the EU average and has been increasing lately even in the years of the crisis. Public transport especially in the Budapest metropolitan region has suffered from financing problems, which may have contributed to a decline in the demand for public transport. Increasing the attractiveness of public transport as an alternative to the use of private cars will be crucial in reversing the trend of the worsening energy intensity of the transport sector.
Households' energy intensity is outstandingly high in an EU comparison. The NEEAPs identify several crucial actions to tackle this problem, but effective implementation of these actions will be crucial to achieve the planned energy savings. Abolishing across-the-board electricity and gas price subsidies and targeting support only for vulnerable consumers would also contribute to energy savings in the household sector.
11.3. CONTRIBUTION OF ENERGY PRODUCTS TO TRADE
11.3.1. Net energy trade balance
Hungary's energy trade deficit has been one of the largest in the EU, both in the last year of observation 2011 and over the period 2007-2011 (namely 6.0% and 5.4% of GDP respectively). Over the period the variation of the energy trade deficit appears to follow the international oil price, as evidenced by a peak in the deficit in 2008.
The energy trade deficit showed a sudden increase of 3¼ percentage points of GDP from 2005 to 2006. This was mainly due by a marked increase in the oil trade deficit of 2½ percentage point, added by a ¾ percentage point increase in the gas trade deficit. While in the years before 2006 oil trade was more or less in balance, after 2006 the oil trade deficit has been varying around 2% to 3% of GDP(316). Hungary's gas trade deficit has been
(316) Since neither total energy nor oil import dependency
reveals a corresponding shock for 2005-2006, the jump in the figures for oil trade should be treated with caution as
among the largest in the EU throughout the decade.
-8
-6
-4
-2
0
-10
-5
0
5
2007 2008 2009 2010 2011
% of GDP% of GDP
Graph II.11.11:Hungary - Trade balance of energy products and CA
CA (lhs) Oil (rhs)Gas (rhs) Total (rhs)
Source: Eurostat
However, the developments and current size of the energy trade deficit should be seen against the background of the country's current account balance. After 2008, Hungary has successfully reduced a previously stubbornly high current account deficit, varying earlier in the decade around 7% to 8% of GDP. From 2009 onwards, the current account has shown to be in near balance and even recorded a modest surplus. In the current situation, the balance for the other product categories can be seen as more or less compensating. The substantial size of the energy trade deficit may, however, pose a risk in the future for keeping the current account balanced.
11.3.2. Decomposition of the net energy trade balance
The energy trade balance can be decomposed in three multiplicative factors, namely the relative energy trade balance (i.e. the share of net exports in energy products in total cross-border energy trade), the share of energy in total trade and the ratio of total trade to GDP (macro openness to trade).
Table II.11.2:Decomposition of Energy Trade Balance
2007 2008 2009 2010 2011Energy trade balance (% GDP) -4.6 -6.3 -4.9 -5.2 -6.0Relative trade balance (%) -54.6 -55.3 -61.0 -55.9 -51.3Share of energy in total trade (%) 6.1 8.1 6.4 6.5 7.7Macro trade openness (% GDP) 140.1 140.1 126.1 142.7 153.5Source: Eurostat
the trade data may be subject to confidentiality issues, which is not the case for import dependency figures.

Part II Individual Country Files
195
While Hungary's energy trade deficit in GDP terms is among the largest in the EU, Hungary does not stand out in the ranking of the relative energy trade deficit. The structural upward shift in the former is reflected in a peak in the relative deficit in 2006, but afterwards the size of the deficit falls back to levels not markedly different than before this shock.
Hungary has a rather low share of energy in total trade, although not among the lowest in the EU. From 2005 to 2008, this share almost doubled, hence explaining for a part the increase in the energy trade deficit.
Hungary's macro openness to trade has been among the largest in the EU throughout the decade. From 2006 onwards the level of openness seems markedly higher than before and rising, apart from a dip in 2009. As the energy share in total trade does not increase further after 2008, this suggests that the net energy imports grow in tandem with the net exports of other goods and services, corroborating the notion that the latter compensate from the energy trade deficit.
11.3.3. Conclusions
Hungary has a persistently high energy trade deficit which is one of the largest in the EU. The deficit was fluctuating in the range of 5-6% of GDP in the period 2007-2011. The country has a total energy import dependence which is in line with the EU average, but its high energy intensity contributes to the high energy trade deficit. Increasing the currently low level of renewable energy production together with improving energy efficiency would reduce the energy trade deficit of Hungary.
Furthermore, given the very high share of Russian gas in the energy mix, alternative, potentially cheaper, gas supplies in light of the recent fall in global natural gas prices could also reduce the energy trade deficit.
11.4. REFERENCES
European Commission, 2012, Progress towards achieving the Kyoto Objectives, COM (2012) 626 of 24 October.
Government of Hungary, 2008 National Energy Efficiency Action Plan.
Government of Hungary, 2011, Second National Energy Efficiency Action Plan.
MVM website: www.mvm.hu
Hungarian Energy Office, 2011, Annual report to the European Commission.


12. MALTA
197
12.1. SECURITY OF ENERGY SUPPLY
Malta was completely energy dependent in 2010, with no tangible improvement recorded since 2006. Furthermore, it relies almost exclusively on oil with just a minor contribution from renewables.
0
20
40
60
80
100
2006 2007 2008 2009 2010
%Graph II.12.1:Malta - Import dependence
Oil Total
Source: Eurostat
12.1.1. Primary Energy Sources
12.1.1.1. Oil
Malta has a (nearly) complete dependence on imported oil products, resulting in the bottom score for security of energy supply. No other sources of energy are reported for gross inland energy consumption(317). The degree of dependency on foreign oil is more extreme than for Cyprus, the EU country with similar geographical characteristics (an island in the Mediterranean) and hence useful for comparisons.
(317) It is not fully clear why this statistical measure does not
report positive shares of other energy sources for Malta, as do the (2009) IEA's energy balances, the 2010 National Renewable Energy Action Plan and Eurostat's "share of renewable energy in gross final energy consumption."
Key Insights
Security of Energy supply:
- Malta has significant security of energy supply concerns as it is nearly completely dependent on imported oil products, while its energy networks are fully isolated. Moreover, Malta has the lowest share of RES in its energy mix in the EU.
- The electricity connection with Sicily will alleviate these concerns as it will allow for electricity imports and higher consumption and production of renewable energy. The latter is urgently needed as Malta needs to considerably step up its efforts to expand the share of renewable energy.
Energy and Carbon Intensity:
- Malta does not stand out in the EU as regards the overall energy and carbon intensity of its economy, but the transport and electricity sectors’ dependence on oil imports could make Malta vulnerable to oil price shocks and volatility.
- The large debt accumulated by the public utility, caused by a sustained “tariff deficit” in the past, appears a hindrance for investments in the sector to improve efficiency, lower costs and boost environmental performance.
Trade balance for energy products:
- Despite its dependency on oil imports, Malta does not appear very vulnerable for the external dimension of energy dependency, because the energy trade deficit is among the lowest in the EU.
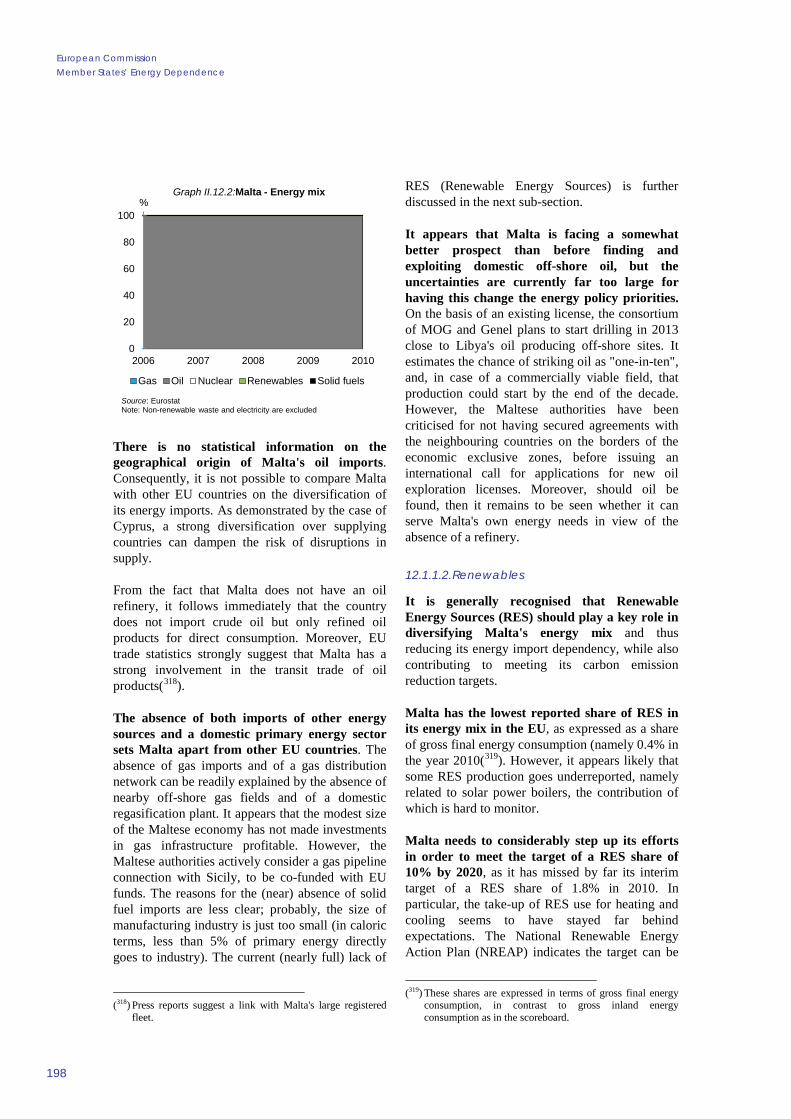
European Commission Member States’ Energy Dependence
198
0
20
40
60
80
100
2006 2007 2008 2009 2010
%Graph II.12.2:Malta - Energy mix
Gas Oil Nuclear Renewables Solid fuels
Source: EurostatNote: Non-renewable waste and electricity are excluded
There is no statistical information on the geographical origin of Malta's oil imports. Consequently, it is not possible to compare Malta with other EU countries on the diversification of its energy imports. As demonstrated by the case of Cyprus, a strong diversification over supplying countries can dampen the risk of disruptions in supply.
From the fact that Malta does not have an oil refinery, it follows immediately that the country does not import crude oil but only refined oil products for direct consumption. Moreover, EU trade statistics strongly suggest that Malta has a strong involvement in the transit trade of oil products(318).
The absence of both imports of other energy sources and a domestic primary energy sector sets Malta apart from other EU countries. The absence of gas imports and of a gas distribution network can be readily explained by the absence of nearby off-shore gas fields and of a domestic regasification plant. It appears that the modest size of the Maltese economy has not made investments in gas infrastructure profitable. However, the Maltese authorities actively consider a gas pipeline connection with Sicily, to be co-funded with EU funds. The reasons for the (near) absence of solid fuel imports are less clear; probably, the size of manufacturing industry is just too small (in caloric terms, less than 5% of primary energy directly goes to industry). The current (nearly full) lack of
(318) Press reports suggest a link with Malta's large registered
fleet.
RES (Renewable Energy Sources) is further discussed in the next sub-section.
It appears that Malta is facing a somewhat better prospect than before finding and exploiting domestic off-shore oil, but the uncertainties are currently far too large for having this change the energy policy priorities. On the basis of an existing license, the consortium of MOG and Genel plans to start drilling in 2013 close to Libya's oil producing off-shore sites. It estimates the chance of striking oil as "one-in-ten", and, in case of a commercially viable field, that production could start by the end of the decade. However, the Maltese authorities have been criticised for not having secured agreements with the neighbouring countries on the borders of the economic exclusive zones, before issuing an international call for applications for new oil exploration licenses. Moreover, should oil be found, then it remains to be seen whether it can serve Malta's own energy needs in view of the absence of a refinery.
12.1.1.2. Renewables
It is generally recognised that Renewable Energy Sources (RES) should play a key role in diversifying Malta's energy mix and thus reducing its energy import dependency, while also contributing to meeting its carbon emission reduction targets.
Malta has the lowest reported share of RES in its energy mix in the EU, as expressed as a share of gross final energy consumption (namely 0.4% in the year 2010(319). However, it appears likely that some RES production goes underreported, namely related to solar power boilers, the contribution of which is hard to monitor.
Malta needs to considerably step up its efforts in order to meet the target of a RES share of 10% by 2020, as it has missed by far its interim target of a RES share of 1.8% in 2010. In particular, the take-up of RES use for heating and cooling seems to have stayed far behind expectations. The National Renewable Energy Action Plan (NREAP) indicates the target can be
(319) These shares are expressed in terms of gross final energy
consumption, in contrast to gross inland energy consumption as in the scoreboard.

Part II Individual Country Files
199
met through a rapid expansion of RES use in the electricity and transport sectors. Two-thirds of the required supply is supposed to come from wind power, one fifth from solar power and the remaining 15% from biomass.(320) The rationale for the strong emphasis on wind power is not clearly explained.
While at first sight Malta's geography appears to provide excellent pre-conditions for domestic RES production, in particular for solar and wind power, some serious spatial obstacles are reported, on land due to environmental and planning constraints and off-shore because most of the coastal waters are too deep for current cost-efficient wind technologies. The use of photo-voltaic cells on buildings reportedly clashes with the other uses of the (flat) roofs. However, the government recently awarded a tender to install 67,000 square metres of photovoltaic systems on the rooftops of government buildings for an amount of EUR 20 million.
Nevertheless, the NREAP foresees a jump-wise increase in RES capacity, for solar power already this year and next, and for wind power in 2016 and in particular in 2017. In 2020, RES is supposed to deliver 13.8% of total electricity consumption. Plans for a large offshore wind farm and two smaller onshore ones are currently still at a relatively early stage of development. Furthermore, the additional wind power capacity seems contingent on the timely realisation of the electricity interconnection with Sicily, since the relatively small domestic electricity grid allegedly poses a challenge for accommodating a larger RES production capacity because of the latter’s large variation in actual supply.
Malta does not have potential for a large scale bio-fuels production because of the very limited water supply and space for agriculture. Bio-diesel is produced from locally recycled cooking oil and imported vegetable oil. Regulation foresees a staggered increase in the percentage of bio-fuels in the energy content of petroleum fuel(321).
(320) Republic of Malta (2011b) (321) It is not clear whether this will suffice to reach the
envisaged RES-share in transport of 10.7% in the year 2020 because of the introduction of LPG as transport fuel.
12.1.2. Secondary Energy sources
In the absence of gas, electricity is Malta’s dominant final energy source for the residential, industry and service sectors. Were it not for the large fuel consumption in the transport sector, it would have been the dominant source for the whole economy as well. Electricity generation currently relies almost completely on oil as primary energy source. About two -thirds of the imported oil products are used to produce electricity, during which two-thirds of the caloric value is lost.
0
20
40
60
80
100
2006 2007 2008 2009 2010
%Graph II.12.3:Malta - Electricity mix
Gas Oil Nuclear Renewables Solid fuels
Source: Eurostat
Good electricity interconnections and adequate domestic infrastructure capacity are important to shelter the country from supply shocks and to enable a proper absorption of renewables. A competitive and dynamic electricity market should cater the necessary investment incentives and provide the right price signals to consumers. However it appears that at present there is no effective competition in the energy sector because the state-owned enterprise Enemalta is the sole producer, distributor and supplier, apart (perhaps) from some small volumes of electricity generated with RES ("RES-E production"). This means that Enemalta is Malta's dominant importer of petroleum inputs (also for transport fuels); it operates the 2 power plants with a total capacity of 571 MW, and it takes care of the electricity networks for transmission and distribution.
The accounts for generation and distribution are financially unbundled. The tariffs are subject to (price) regulation by the MRA (Malta Resource Authority). This market regime appears in line

European Commission Member States’ Energy Dependence
200
with the third Energy Package because of the “isolated market” and “emerging market” derogations.
Electricity tariffs are among the highest in Europe.(322) Undoubtedly, a major cause has been the nearly complete reliance on fuel oil and diesel which are relatively costly energy inputs.
Despite the high tariffs, Enemalta has ended up in financial difficulties. Its high debt level (reportedly about EUR 600 million) and the delays in restructuring these debts have prompted Standard and Poor’s to downgrade Enemalta's credit rating for two consecutive years, citing as reasons “its poor profitability, high cost and old generation portfolio based mainly on fuel oil, exposure to oil prices, and lack of timely cost-reflective adjustments in its tariffs.” This citation is inter alia referring to the Marsa power plant which operates far beyond its planned lifetime and hence faces high production costs and fines for exceeding environmental limits. Moreover, there have been long-standing losses in the distribution of electricity as well as problems in metering and billing. In 2011, the amount of outstanding bills amounted to almost EUR 130 million. Enemalta’s lack of financial resources and the related sustained political interference in its operations appear to have hampered investments in RES and in the efficiency in electricity generation and distribution.
An electricity interconnection with Sicily is foreseen to come available by the end of 2013. It is supposed to deliver 200 MW on average being capable to serve peak demand through an additional 100 MW. The connection will expand capacity by one third up to one half, and thus alleviate Malta's dependency on imported oil, and reduce the costs and environmental pressures of electricity consumption. It will also enhance the deployment of RES, because the integration with the larger Sicilian electricity markets means that surpluses can be exported and any shortfall imported. It will not necessarily imply more effective competition (because of the emerging market derogation).
(322) Eurostat (2012)
12.1.3. Conclusions
Malta is nearly completely dependent on imported oil products, while its energy networks are fully isolated which gives rise to concerns on the security of supply. The dependence also leads to high prices for electricity, the dominant energy type in final energy consumption.
The electricity interconnection with Sicily will help to diversify the energy mix as it will allow the direct import of electricity and improve the conditions for the take-up of RES which is currently far behind schedule. The large debt accumulated by the public utility appears a hindrance for investments in the sector to improve efficiency, lower costs and boost environmental performance.
12.2. ENERGY AND CARBON INTENSITY
While some of the sectoral indicators for energy and carbon intensity are missing for Malta, the available indicators suggest that Malta does not stand out in this dimension of energy dependency. However, the influence of the almost complete dependence on oil as primary energy source is manifest.
Table II.12.1:Energy and carbon intensity
Energy intensity of the economy 1) 169 -7.7CO2 intensity of the economy 2) 0.56 -8.4Share of energy intensive sectors in Gross Value Added 3) 6.8 0.1
Energy intensity of the economy 1) 152 -4.7CO2 intensity of the economy 2) 0.41 -9.1Share of energy intensive sectors in Gross Value Added 3) 8.9 -0.9Source: Eurostat
2010 percentage change2006 - 2010
memo items: EU27
Notes: 1) Kg of oil equivalent per 1000 EUR, changes in percent; 2) Tonnes of CO2 equivalent per 1000 EUR, changes in percent; 3) percent of total gross value added, changes in percentage points, latest data refer to the year 2009.
The overall energy intensity of Malta does not stand out in the EU in 2010, whereas the energy intensity of households is the lowest in the EU. The latter reflects the impact of the Mediterranean climate. The energy intensity for industry and transport are not reported. Important aggravating factors include the almost complete dependence on oil in electricity production and the high energy intensity of the water sector which accounts for about 5% of total electricity consumption.
Malta's improvement in energy intensity over the period 2007-2011 is not among the largest

Part II Individual Country Files
201
ones in the EU but well above the EU average. Malta's second NEEAP(323) reports that the country has exceeded its interim target of 3% savings in final energy consumption (FEC) relative to the baseline(324) by the year 2010, as the actual savings amounted to 3.8%.
The NEEAP has maintained the energy savings target of 9% (378 GWh) for the year 2016. The more significant individual energy saving measures include improving the energy efficiency of the water sector (both as regards the desalination plants and water distribution), boosting the use of energy saving lamps, promoting mini wind and solar power installations (such as solar water heaters), and promoting public transport.
0.50
0.55
0.60
0.65
0.70
160
170
180
190
200
2006 2007 2008 2009 2010
Graph II.12.4:Malta - Energy and carbon intensity of the economy
Energy intensity (lhs) CO2 intensity (rhs)
kgoe/1000 EUR ton CO2 eq./1000EUR
Source: Eurostat
The dependence on oil imports coupled with the high energy intensity for some specific economic activities could make Malta vulnerable to oil price shocks and volatility, although both the share of energy-intensive sectors in the economy, among the lowest in the EU, and the budget share of energy in the consumers' budget, the lowest in the EU, should have a dampening effect.
Enemalta’s hedging against price variations in its purchases of oil products imports has provoked controversy, partly because it has not been well understood by the wider public and partly because (323) The Second National Energy Efficiency Action Plan
(Republic of Malta 2011a) as foreseen in the Directive 2006/32/EC. The reported savings are made against a reference scenario on final energy consumption trends.
(324) Republic of Malta (2007): The baseline is the average annual final energy consumption over the period 2001-2005.
it results in higher average prices next to reduced price volatility.
While the hedging operations as such have not been the cause for Enemalta’s substantial losses and lacklustre performance, they have contributed to the long-standing focus on the total value of annual oil product imports rather than on setting electricity tariffs on a solid cost basis. The prolonged period of electricity "tariff deficits" has been a major cause of Enemalta's current enormous debt and it has also contributed to a relative neglect of efficiency improvements and innovation. Moreover, consumers and companies have difficulties to absorb the substantial price increases necessary to bring tariffs to cost coverage levels, inviting further ad hoc political interference.
A sustainable and widely accepted price setting in the electricity sector would require the consistent application of a cost-based price regulation by the Malta Resource Authority on the basis of previously agreed general principles and a clear debt restructuring plan. Moreover, Enemalta should get clear targets and incentives as regards the required efficiency improvements. A gradual introduction of competition, when the inter-connection with Sicily becomes available, could further strengthen the regulator's position.
Malta’s household sector has one of the lowest carbon intensities in the EU. However, the country does not stand out in the EU as regards the carbon intensity of its economy; the very high carbon intensity of energy use seems to be the reason why it is not among the lowest ones. The latter seems related to the nearly complete dependence on fuels in transport and in the electricity sector, as well as to the inefficiencies in electricity production and distribution. Remarkably in view of Enemalta's large debt, Malta has not applied for a temporary derogation of the obligation to auction off the carbon allowances to the power plants rather than handing them out for free.

European Commission Member States’ Energy Dependence
202
0.09
0.10
0.11
0.12
0
10
20
30
2006 2007 2008 2009 2010
Graph II.12.5:Malta - Energy and carbon intensity of households
Energy intensity (lhs) CO2 intensity (rhs)
kgoe/1000 EUR ton CO2 eq./1000EUR
Source: Eurostat
Malta does not have a greenhouse gas (GHG) reduction target under the Kyoto protocol. However, under the Effort Sharing Decision(325), Malta has committed to limit the GHG emissions in non-ETS sectors (transport, agriculture, waste) to an increase of 5% by 2020 compared to 2005 levels. Latest projections show that in the absence of additional measures, the country is likely to miss its target, increasing emissions by 28%(326). Should more stringent policies be adopted the increase in emissions should be limited to 6%, a little above the foreseen target.
The share of GHG emission falling under the ETS is equal to 61%, the second highest share in the EU. As mentioned above the country did not apply for derogation under Art. 10c of the ETS Directive, this means that its energy sector will have to auction the emission allowances in the third phase of the ETS starting in 2013 when there will be also an EU-wide emissions cap. The power sector of Malta accounts for 100%(327) of the verified emissions, this means that any increase in energy costs due to the auctioning of the allowances will be reflected in an increase in electricity prices. The magnitude of the increase will be determined by the level of the carbon prices and on the pace with which the country will proceed to decarbonize its power sector currently heavily dependent of oil. The impact on consumers could however be relatively limited by the low share of energy items in HICP, which is actually the lowest of the EU.
(325) Decision 406/2009/EC (326) European Commission (2012) (327) European Environment Agency (2011)
Next to the energy saving measures, as outlined in the previous sections, a more balanced energy mix will help to reduce carbon emissions in the non-ETS sectors. Instruments to promote RES include a feed-in tariff and grants (such as a grant scheme for small-scale solar water heating). The former is reported to provide support to solar power installations for a period of seven years but at a level significantly below the range of electricity generation costs(328). However, probably the scheme is currently mainly used for (part of the) surplus power from domestic installations offered to the grid (according to the NREAP amounting to 0.15% of total power supplied in 2010). Hence, actual expenditure is currently low. However, the government is now working on a proposal for a photovoltaic farm open for people to invest in through a subsidy scheme.
As regards transport, next to the mandatory introduction of bio-fuels and a car scrappage scheme, the carbon intensity of transport (the indicator of which is missing for Malta) may be significantly reduced by the recent uptake of LPG because this fuel type is more efficient and leads to fewer carbon emissions. LPG has been introduced by Liquigas, which since 2009 has taken over the Enemalta’s gas division. The scoreboard’s diversity indicator will, however, not pick up diversification effect on the energy mix since it does not take account of the variety of oil products. Moreover, it is not fully clear to which extent LPG imports are independent from the imports of other refinery products.
12.2.1. Conclusions
Malta does not stand out in the EU as regards the overall energy and carbon intensity of its economy, but the nearly full dependence on oil raises the challenge to achieve higher energy efficiency and limit carbon emissions. The measures currently undertaken include the promotion of RES and public transport, a more efficient water sector, and the introduction of LPG.
The dependence on oil imports in the transport and electricity sectors production could make Malta vulnerable to oil price shocks and volatility. However, consumer prices need to remain based (328) Ecofys (2011)

Part II Individual Country Files
203
on a solid cost basis, as illustrated by Enemalta’s practice of sustained “tariff deficits” in the past which has led to a huge debt overhang for the public utility, contributing to a relative neglect of efficiency improvements and innovation.
12.3. CONTRIBUTION OF ENERGY PRODUCTS TO TRADE
12.3.1. Net energy trade balance
Malta has one of the lowest energy trade deficits in the EU, in spite of the strong dependence on imported oil products. However, the deficit tends to vary considerably over time as regards both its size and its relative ranking among the other EU countries. Over the period 2007-2011, the deficit was on average 1.2% of GDP, but in 2010 there was even a surplus of 1.1% of GDP. Most likely, this is related to Malta's involvement in oil (transit) trade. The size of the energy trade deficit should be seen against the background of the country's current account, which since Malta's entry into the EU in 2004 has always been larger than 5%, but in 2011 it improved to the more modest level of 3.1% of GDP. Despite Malta's dependency on oil imports, it does not appear very vulnerable for the external dimension of energy dependency, also because of the low energy intensity of its economy.
-4
-2
0
2
-12
-8
-4
0
2007 2008 2009 2010 2011
% of GDP% of GDP
Graph II.12.6:Malta - Trade balance of energy products and CA
CA (lhs) Oil (rhs)Gas (rhs) Total (rhs)
Source: Eurostat
12.3.2. Decomposition of the net energy trade balance
The energy trade balance can be decomposed into three multiplicative factors, namely the relative energy trade balance (i.e. the share of net exports in energy products in total cross-border energy trade), the share of energy in total trade and macro openness to trade (i.e. the ratio of total trade to GDP). Malta has one of the lowest relative energy trade deficits in the EU throughout the period 2007-2011, with a variation over time similar to that in the energy trade balance in GDP terms. As the relative energy trade deficit has been relatively close to zero, the other two factors have not had a major influence. The macro openness to trade does not stand out, but the share of energy in total trade has significantly increased over the period from 11% in 2007 to 28% in 2011 when Malta was among the countries in the EU with the highest share. On its own, however, such a high share can imply that variations in the relative trade balance are transmitted more strongly into the net energy trade balance and hence the current account. It is, however, too early to know to which extent the current high share is structural.
Table II.12.2:Decomposition of Energy Trade Balance
2007 2008 2009 2010 2011Energy trade balance (% GDP) -1.5 -2.4 -0.1 1.1 -3.0Relative trade balance (%) -12.7 -17.1 -0.4 5.8 -9.0Share of energy in total trade (%) 11.0 14.0 16.0 18.6 28.3Macro trade openness (% GDP) 109.9 101.9 89.8 104.6 118.0Source: Eurostat
12.3.3. Conclusions
Despite its dependency on oil imports, Malta does not appear very vulnerable for the external dimension of energy dependency, because the energy trade deficit is among the lowest in the EU and also the economy does not appear very energy-intensive.
However, should the recent increase of the share of energy in total trade be structural, variations in the relative energy trade balance would lead to stronger shifts in the net energy trade balance and hence the current account.
12.4. REFERENCES
Ecofys (2011), Financing Renewable Energy in the European Energy Market. January 2011

European Commission Member States’ Energy Dependence
204
Eurostat (2012), Energy statistics – Prices, available from: http://epp.eurostat.ec.europa.eu/portal/page/portal/energy/data/main_tables
International Energy Agency (2009), 2009 Energy Balance for Malta, IEA Energy Statistics by Country
European Environment Agency (2011), EU Emission Trading Scheme data viewer (online), available from: http://www.eea.europa.eu/data-and-maps/data/data-viewers/emissions-trading-viewer
Republic of Malta (2007), First National Energy Efficiency Action Plan, available from: http://ec.europa.eu/energy/efficiency/end-use_en.htm
Republic of Malta (2011a), Second National Energy Efficiency Action Plan, available from: http://ec.europa.eu/energy/efficiency/end-use_en.htm
Republic of Malta (2011b), National Renewable Energy Action Plan 2010-2020, available from: http://ec.europa.eu/energy/renewables/action_plan_en.htm

13. POLAND
205
13.1. SECURITY OF ENERGY SUPPLY
The Herfindahl index measuring the degree of diversification of energy sources shows that Poland's energy mix is among the least diversified in the EU. However, the long-term energy policy strategy of Poland envisages a diversification of the energy mix until 2030, by introducing nuclear sources and increasing the share of renewables.
Key Insights
Security of energy supply:
- Poland's small import dependency acts as a mitigating factor vis-à-vis potential security of supply risks.
- However, the country appears more vulnerable than the EU average. It highly relies on domestic hard coal and lignite for energy generation. Economically viable coal reserves are declining fast, which causes supply risk for its coal-firing power plants. Continued reliance on coal will also become more costly in the new phase of the EU ETS, starting in 2013.
- Another risk factor is related to the low geographical diversification of Poland's oil and gas supplies.
Energy and Carbon Intensity:
- Poland is one of the most vulnerable countries in the EU as far as energy and carbon intensities are concerned, although substantial progress has been made in recent years.
- However, the reliance on solid fuels is the reason behind the high carbon intensity. Poland, especially its power sector, will be vulnerable in case of increased carbon prices.
- Energy and carbon intensity is particularly high in transport, due to a surge in passenger and freight road traffic in recent years.
Trade balance for energy products:
- Poland's energy trade deficit appears relatively modest but its increase over time may have played a role in Poland's limited success in reducing its current account deficit. The energy trade deficit is primarily caused by oil imports, while the country's trade surplus in solid fuels and the trade deficit in gas largely cancel each other out.
- Together with the rather modest share of energy products in total trade, the size of the energy trade deficit suggests a relatively limited vulnerability as regards the external dimension of energy dependency. However, in view of the high energy intensity, energy prices and their impacts need to be watched carefully.

European Commission Member States’ Energy Dependence
206
Poland's import dependency is only 32%, one of one of the lowest in the EU, thanks to the very high share of domestic coal in energy consumption.
13.1.1. Primary energy sources
13.1.1.1. Solid fuels
The country's energy mix relies very much on domestic coal resources. In 2010, coal accounted for 54% of its primary energy supply. Although the share of solid fuels has gradually decreased from 58% in 2006, Poland still has the second largest share of solid fuels in the EU, after Estonia. Domestic production covers both hard coal and lignite. As regards hard coal, Poland is by far its largest producer in EU, accounting for 62% of the EU's hard coal output. There are 27 hard coal mines in Poland, most of them state-owned.
Contrary to other major EU coal producers like Germany and Spain, coal sales are not subsidised and mines receive only very limited state aid for historic liabilities, such as the costs of mine closures and benefits paid to redundant miners(329). Hard coal output is, however, falling and since 2008 it does not match domestic demand. In 2011, net imports of coal, mainly from Russia and Czech Republic, amounted to some 10% of country's hard coal consumption. While country's hard coal resources are abundant, economically recoverable hard coal reserves accessible from the established mines are declining
(329) OECD (2012)
fast. Hard coal production is likely to decrease considerably by 2030(330), although new mines are planned. Poland's lignite production represents, in energy terms, around ¼ of country's hard coal output. It is mined at opencast mines in four principal mining areas, which feed near power plants that supply 40% of total electricity output.
As in the case of hard coal, reserves in the established mines are declining and, in order to maintain sufficient lignite output, reserves in other parts of the country will have to be exploited.
13.1.1.2. Oil
Oil is the second source of energy used in Poland. It constitutes about 26% of the country energy mix and this share gradually increased from 12% in 1988 to 24% in 2006. The country is dependent on oil imports for 97% of its consumption; the rest comes from domestic production. Poland imports both crude oil and petroleum products. Oil imports amounted to some 27 Mt (million tonnes), consisting of 20 Mt of crude oil, 1 Mt of natural gas and 6 Mt of refined products. 95% of crude oil imports come from Russia via the Druzhba pipeline.
The HHI measuring oil imports shows that the composition of Poland's oil supplies is one of the least diversified in the EU. The government's intention is to diversify sources and routes of oil supply to Poland; one of the ideas considered is to
(330) International Energy Agency (2011)

Part II Individual Country Files
207
build a new pipeline(331) for the transportation of Caspian oil to Europe.
Overall demand for oil and oil products has been growing systematically, by some 30% between 2000 and 2010. The transport sector accounts for around 60% of the total oil consumption. Poland has two big and four smaller oil refineries. While their total capacity more than meets overall domestic needs, Poland has to import some 20% of its total diesel consumption as production of diesel oil in the domestic refineries is not sufficient(332).
13.1.1.3. Gas
The third energy source used in Poland is gas which accounts for 13% of the country's energy mix. Approximately two‐ thirds of total gas supply (some 10 billion tonnes of cubic meters a year) are imported, the rest is produced domestically.
Domestic gas production covers around one third of domestic consumption (5-6 billion tonnes of cubic meters a year). The proven reserves of natural gas are considered sufficient for over 25 years at current production rate. Moreover, Polish authorities strongly encourage the exploration of shale gas in order to reduce the country's dependence on Russian supplies. A government study published this year estimated recoverable shale gas reserves at 346-768 billion cubic metres, enough to encourage investment. So far, the authorities have granted 112 shale gas
(331) Extension of the Ukrainian Odessa‐Brody pipeline to
Polish refineries in Plock and Gdansk (332) International Energy Agency (2011)
exploration licences(333). Moreover, the government has urged state-controlled firms like PKN Orlen (oil sector), PGNiG (gas) and KGHM (copper mining) to invest in shale gas. The large‐scale exploitation of unconventional gas, if it materialises, would certainly change the energy landscape in Poland. However, it is still rather unlikely to start sooner than in the early 2020s, and many technical and environmental difficulties need to be overcome.
A well-functioning and interconnected gas market with competitive and market-based prices should provide the correct incentives for further investments and signals to consumers for an efficient and sustainable use of resources. Both elements are conducive to reduce the vulnerability of the country to energy-related shocks.
Currently, almost all imported gas is supplied through pipelines except for very small quantities of liquefied natural gas (LNG) transported by road in tanks. In 2010, the share of Russian gas in total gas imports stood at 82%, while imports from Germany accounted for 11%.
Gas imports from Russia are based on long‐term contracts between PGNiG (Polish main gas importer and trader) and Gazprom. The recent contract, signed in 2010, provides for a supply of some 10 billion tonnes of cubic meters a year and is valid until 2022.
New infrastructures for gas imports are being developed, with support from EU funds. Poland has recently increased the capacity of its interconnector with Germany, opened a new link with the Czech Republic and plans a new interconnector with Lithuania. Interconnections with the Slovak Republic are still missing; in addition more should be done to guarantee reverse flow with Germany.
The country’s first LNG terminal is under construction, expected to be completed in 2014. In the first stage of operation, the LNG terminal will enable the regasification of some 15% of the country's gas demand and can be increased subsequently, depending on demand for gas. Gas
(333) http://www.euractiv.com/energy/poland-issue-special-
shale-gas-b-news-513296

European Commission Member States’ Energy Dependence
208
storage facilities are relatively developed being the fourth largest in the EU, however projects are underway to further expand them almost doubling their size.
The wholesale and retail markets are highly concentrated with one company covering 97% of both. At the same time, domestic and industrial prices are subject to regulation. Both are below the EU average.
13.1.1.4. Renewables
Renewable energy is the fourth energy source in Poland. It accounts for 7% of its energy mix, or 9.4% of Poland's gross final energy consumption(334). Poland has increased its share of renewables in gross final energy consumption over the last years, from 7% in 2006, while its binding target by 2020 is 15%.(335)
The Polish renewable energy mix is, however, quite unbalanced. 96% of the total renewable energy supply comes from biomass and waste, and smaller amounts from hydropower (3%) and wind power (1%). Most of renewable energy is used for heating purposes; approximately half of all biomass is used for heating in the residential
(334) The share of renewables in the energy mix means the share
of renewable energy in gross inland energy consumption. We use this denominator consequently in the EDI to assess the share of each energy source in the energy mix. On the other hand, Member States' renewable targets for 2020 are expressed as a share of renewable sources in final energy consumption, i.e. excluding transmission, distribution and transformation losses. This explains the difference between the two figures.
(335) Republic of Poland (2011b)
sector. The share of electricity generated from renewable sources is 7% only in Poland, as against EU average of 21%; Poland's indicative target for 2020, set in the National Renewable Energy Action Plan, is 19.1% share of RES in electricity. 55% of renewable energy is produced from biomass, 30% from hydro power and 15% from wind power, although the share of wind energy rises systematically, from 6% in 2006. The share of biofuels in final energy in transport is 4.8%, which is above EU average of 4.2%
Tradable green certificates with a quota obligation system are the main instrument to support renewable energy.(336) All electricity suppliers must ensure that a certain percentage of electricity sold to end-users - currently 10.4% - comes from renewable sources, or pay a substitution fee. All technologies used in the generation of renewable electricity are eligible. Other incentives include the obligation to buy all electricity generated from RES at a guaranteed price, and a subsidy covering 50% of connection costs to electricity grids. They have been effective in stimulating investment in the most mature and economically attractive renewable energy technologies, especially in biomass, but also led to unbalanced renewable energy mix. Therefore the Ministry of Economy has proposed in October 2012 to revise the support scheme. The main change would be introducing of correcting coefficients to stimulate investment in the other technologies than biomass, especially in solar power. As regards biofuels, they benefit from excise tax rebates, and their producers have reductions in company income taxes.
13.1.1.5. Nuclear
Poland does not have any nuclear power plant. However, the government envisages introducing nuclear power. The necessary legislation is currently being adopted. The construction works are scheduled to start around 2016 and the first nuclear unit is to be operational by the end of 2022.
(336) Steinhilber S., Ragwitz M., Rathmann M, Klessmann C.
and Noothout P (2011)

Part II Individual Country Files
209
13.1.2. Secondary energy sources
Poland is a net exporter of electricity, although in 2010 net exports represented only some 1% of its electricity consumption. The main recipient of Polish electricity is Germany. Electricity exports could be bigger taking into account differences in wholesale electricity prices between Germany and Poland, but have been limited by the capacity at the interconnections with neighbouring countries.
The electricity mix is heavily dependent on solid fuels. Poland has one of the highest shares of solid fuels in electricity production, 87% in 2010. The share of RES is around 7% and gas 4%. Consequently, the diversification of the electricity mix is one of the lowest in the EU. The government foresees a decline in the share of coal because of growing share of renewables and the planned introduction of nuclear power (after 2022). Total electricity generation in 2010 was 158 TWh, 18% of which came from combined heat and power (CHP) making the country one of the largest CHP producers in the EU(337).
Good electricity interconnections and adequate domestic infrastructure capacity are important to shelter the country from supply shocks and to enable a proper absorption of renewables. A competitive and dynamic electricity market should cater the necessary investment incentives and provide the right price signals to consumers. While the country energy system seems to be able to cope with current demand peak, it requires substantial investment in the near future. (337) European Commission, DG Energy (2012)
Nearly half of today's generating capacity is older than 30 years, and nearly 80% of 400 kV lines and 99% of 220 kV lines are over 20 years old. Total investment in Poland’s power sector over the period 2010‐ 2030 amounts to EUR 195 billion of which two‐ thirds are needed to build 92 GW of new capacity and the remaining amount is needed in distribution (75%) and transmission (25%) grids. Total power sector investment needs represent 1.3% of GDP on annual basis(338).
Competition in the electricity wholesale is still limited yet better than in the gas market. The first three companies have an aggregated market share of over 60%. The electricity is traded for more than 90% either over the counter or bilaterally while the liquidity of the electricity exchange POLPX remains very limited. Attempts are being made to better integrate the country with the Swedish electricity exchange in order to enhance liquidity.
The retail market concentration is higher than in the wholesale with the first three firms covering 71% of the market.
The correlation between wholesale and retail prices is distorted due to retail price regulation. In 2011, energy and supply costs accounted for 55 % of domestic prices (without taxes), while network costs accounted for 45 %. For industrial consumers, the shares were 67% and 33% respectively. End-users prices are below the EU average for both industries and households.(339)
13.1.3. Conclusions
Poland appears more vulnerable than the EU average to security of energy supply risks. This is related to Poland's reliance on domestic hard coal and lignite for energy generation. On a positive side, Poland's import dependency was just 32% in 2010, much below EU average of 53%. As regards risks, economically viable coal reserves are declining fast, which causes supply risk for its coal-firing power plants. Continued reliance on coal will also become more costly in the new phase of the EU ETS, starting in 2013, when more carbon allowances (especially for power plants) will be auctioned rather than provided for free (see
(338) International Energy Agency (2011) (339) Eurostat (2012)
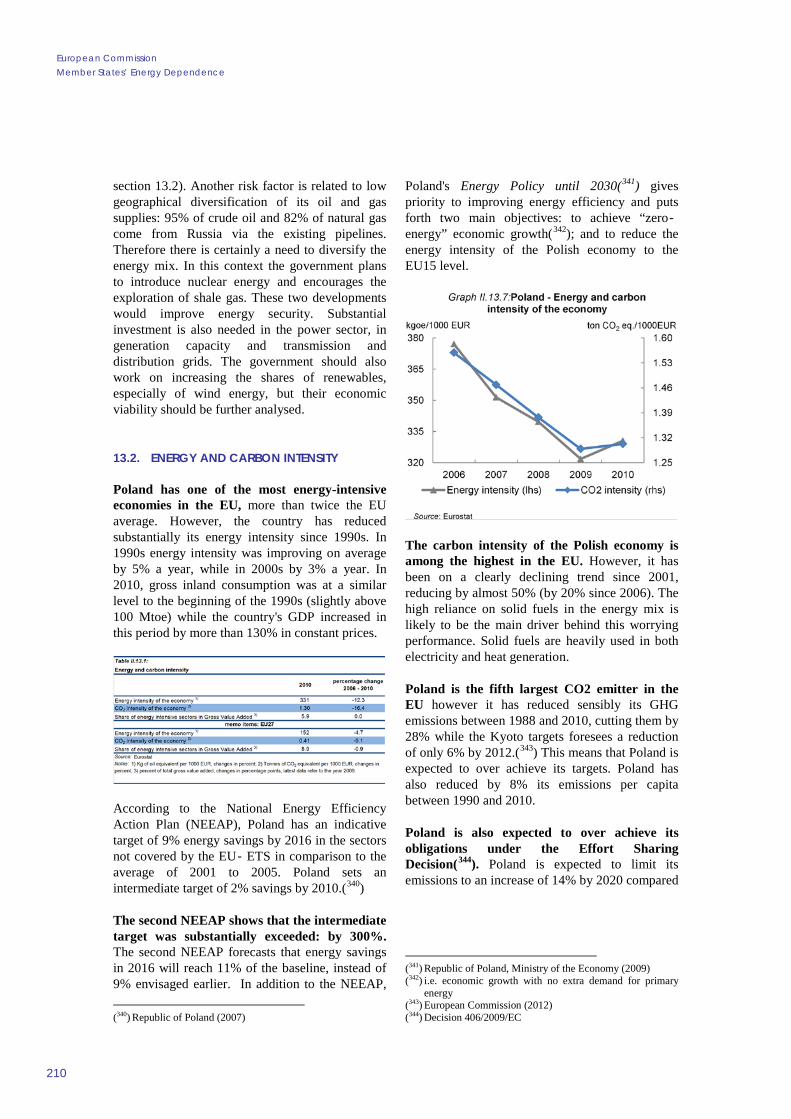
European Commission Member States’ Energy Dependence
210
section 13.2). Another risk factor is related to low geographical diversification of its oil and gas supplies: 95% of crude oil and 82% of natural gas come from Russia via the existing pipelines. Therefore there is certainly a need to diversify the energy mix. In this context the government plans to introduce nuclear energy and encourages the exploration of shale gas. These two developments would improve energy security. Substantial investment is also needed in the power sector, in generation capacity and transmission and distribution grids. The government should also work on increasing the shares of renewables, especially of wind energy, but their economic viability should be further analysed.
13.2. ENERGY AND CARBON INTENSITY
Poland has one of the most energy-intensive economies in the EU, more than twice the EU average. However, the country has reduced substantially its energy intensity since 1990s. In 1990s energy intensity was improving on average by 5% a year, while in 2000s by 3% a year. In 2010, gross inland consumption was at a similar level to the beginning of the 1990s (slightly above 100 Mtoe) while the country's GDP increased in this period by more than 130% in constant prices.
According to the National Energy Efficiency Action Plan (NEEAP), Poland has an indicative target of 9% energy savings by 2016 in the sectors not covered by the EU‐ ETS in comparison to the average of 2001 to 2005. Poland sets an intermediate target of 2% savings by 2010.(340)
The second NEEAP shows that the intermediate target was substantially exceeded: by 300%. The second NEEAP forecasts that energy savings in 2016 will reach 11% of the baseline, instead of 9% envisaged earlier. In addition to the NEEAP, (340) Republic of Poland (2007)
Poland's Energy Policy until 2030(341) gives priority to improving energy efficiency and puts forth two main objectives: to achieve “zero‐energy” economic growth(342); and to reduce the energy intensity of the Polish economy to the EU15 level.
The carbon intensity of the Polish economy is among the highest in the EU. However, it has been on a clearly declining trend since 2001, reducing by almost 50% (by 20% since 2006). The high reliance on solid fuels in the energy mix is likely to be the main driver behind this worrying performance. Solid fuels are heavily used in both electricity and heat generation.
Poland is the fifth largest CO2 emitter in the EU however it has reduced sensibly its GHG emissions between 1988 and 2010, cutting them by 28% while the Kyoto targets foresees a reduction of only 6% by 2012.(343) This means that Poland is expected to over achieve its targets. Poland has also reduced by 8% its emissions per capita between 1990 and 2010.
Poland is also expected to over achieve its obligations under the Effort Sharing Decision(344). Poland is expected to limit its emissions to an increase of 14% by 2020 compared
(341) Republic of Poland, Ministry of the Economy (2009) (342) i.e. economic growth with no extra demand for primary
energy (343) European Commission (2012) (344) Decision 406/2009/EC

Part II Individual Country Files
211
to 2005, however with current trends they are expected to be 14% below the baseline level.(345)
The share of GHG emissions falling under the ETS is equal to nearly 50%, ten points above the EU average. During the third phase of the Scheme starting in 2013 there will be an EU-wide emissions cap and an increasing quantity of emission allowances will have to be auctioned, implying higher energy costs for firms. However Poland has been granted a derogation to continue giving free allowances to its power sector(346). This is expected to substantially reduce the impacts of the auctioning as the power sector accounts for 85% of the country's total emissions.
13.2.1. Industry
The energy intensity of Polish industry is well above the EU average. However, it has substantially improved in the last years, reducing by almost 30%.
Industry accounts for 23% of total final energy consumption. The country's share of energy-intensive sectors in total GVA is below the EU average. Energy consumption of the industrial sector has been decreasing with economic transformation, by 40% between 1990 and 2010. The main industrial users of energy are the chemical and petrochemical industry, non-metallic minerals, such as cement, glass and ceramic, and iron and steel.
(345) European Commission (2011) (346) Pursuant Art. 10c of the ETS Directive.
According to the second NEEAP, industries accounted for more than a third of the achieved savings by 2010. Hence they have contributed a little more than their proportional share in final energy consumption. The NEEAP includes measures aimed at improving energy efficiency in industry, such as loans for investment, subsidies for energy management systems and energy audits. The government's strategy for Energy Policy of Poland until 2030 focuses on improving energy efficiency in the energy sector. Measures include enhancing efficiency of power generation by building highly efficient generation units and increasing the use of highly efficient co‐generation technology.
Carbon intensity of energy use in Poland is the highest in the EU, which is related to reliance on coal in the energy mix. In 2010, 87% of electricity was generated using solid fuels (the EU average is only 26%), while 82% of heat was generated with solid fuels compared to an EU average of 30%. Conversely, the share of renewables in both sectors is really low: in 2010 they accounted for some 7% in electricity, compared to an EU average of 18%, and for 4% in heat compared to an EU average of 14%. More than three‐ quarters of GHG emissions are solely due to CO2 from fossil fuel combustion.
13.2.2. Transport
Energy intensity of the transport sector was among the highest in the EU in 2010. Unlike energy intensity in industry, energy intensity in transport in Poland has further increased by 13% since 2006. By comparison, energy intensity in the EU27 has slightly decreased over the same period.
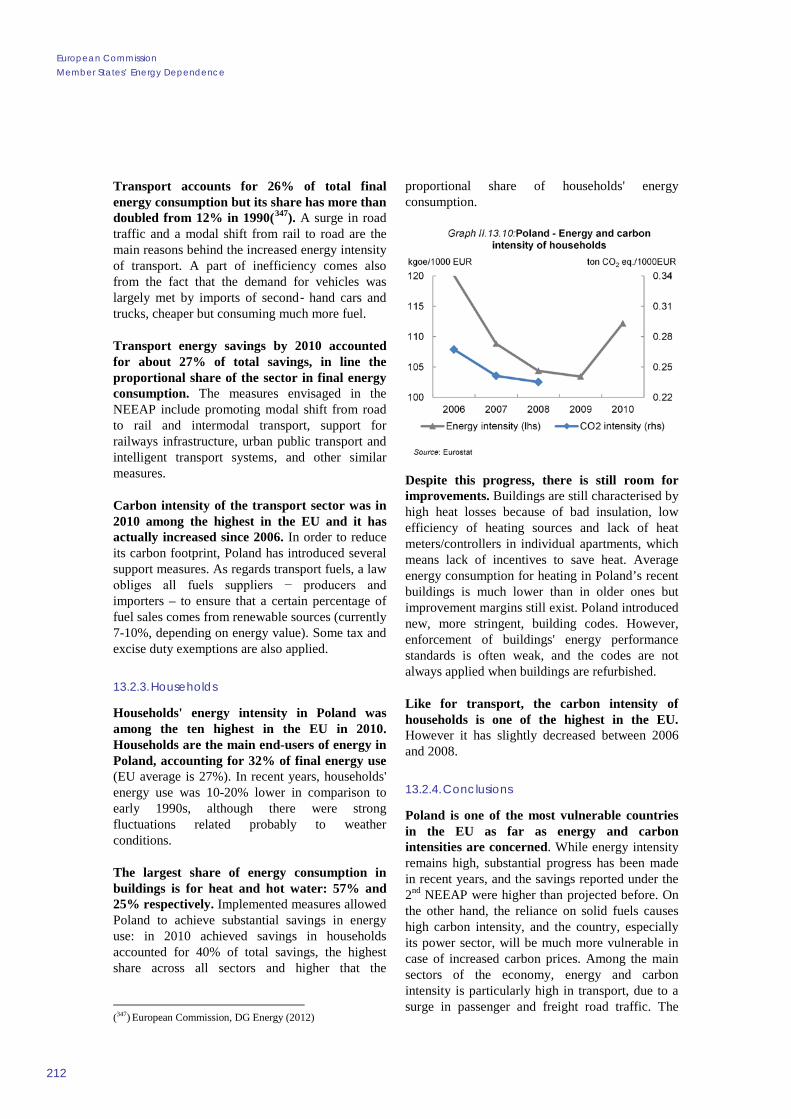
European Commission Member States’ Energy Dependence
212
Transport accounts for 26% of total final energy consumption but its share has more than doubled from 12% in 1990(347). A surge in road traffic and a modal shift from rail to road are the main reasons behind the increased energy intensity of transport. A part of inefficiency comes also from the fact that the demand for vehicles was largely met by imports of second‐ hand cars and trucks, cheaper but consuming much more fuel.
Transport energy savings by 2010 accounted for about 27% of total savings, in line the proportional share of the sector in final energy consumption. The measures envisaged in the NEEAP include promoting modal shift from road to rail and intermodal transport, support for railways infrastructure, urban public transport and intelligent transport systems, and other similar measures.
Carbon intensity of the transport sector was in 2010 among the highest in the EU and it has actually increased since 2006. In order to reduce its carbon footprint, Poland has introduced several support measures. As regards transport fuels, a law obliges all fuels suppliers − producers and importers – to ensure that a certain percentage of fuel sales comes from renewable sources (currently 7-10%, depending on energy value). Some tax and excise duty exemptions are also applied.
13.2.3. Households
Households' energy intensity in Poland was among the ten highest in the EU in 2010. Households are the main end-users of energy in Poland, accounting for 32% of final energy use (EU average is 27%). In recent years, households' energy use was 10-20% lower in comparison to early 1990s, although there were strong fluctuations related probably to weather conditions.
The largest share of energy consumption in buildings is for heat and hot water: 57% and 25% respectively. Implemented measures allowed Poland to achieve substantial savings in energy use: in 2010 achieved savings in households accounted for 40% of total savings, the highest share across all sectors and higher that the
(347) European Commission, DG Energy (2012)
proportional share of households' energy consumption.
Despite this progress, there is still room for improvements. Buildings are still characterised by high heat losses because of bad insulation, low efficiency of heating sources and lack of heat meters/controllers in individual apartments, which means lack of incentives to save heat. Average energy consumption for heating in Poland’s recent buildings is much lower than in older ones but improvement margins still exist. Poland introduced new, more stringent, building codes. However, enforcement of buildings' energy performance standards is often weak, and the codes are not always applied when buildings are refurbished.
Like for transport, the carbon intensity of households is one of the highest in the EU. However it has slightly decreased between 2006 and 2008.
13.2.4. Conclusions
Poland is one of the most vulnerable countries in the EU as far as energy and carbon intensities are concerned. While energy intensity remains high, substantial progress has been made in recent years, and the savings reported under the 2nd NEEAP were higher than projected before. On the other hand, the reliance on solid fuels causes high carbon intensity, and the country, especially its power sector, will be much more vulnerable in case of increased carbon prices. Among the main sectors of the economy, energy and carbon intensity is particularly high in transport, due to a surge in passenger and freight road traffic. The

Part II Individual Country Files
213
efforts to improve energy and carbon intensity need to be continued, especially in transport through a modal shift from road to rail and public transport, but also in households, industry and in the power sector.
13.3. CONTRIBUTION OF ENERGY PRODUCTS TO TRADE
13.3.1. Net energy trade balance
Poland's net energy trade deficit is not among the largest ones in the EU, but rather on the modest side. While it amounted to 3.3% of GDP in 2011, it fluctuated in the range of roughly 1% and 2% of GDP in the first half of the preceding decade and between 2 and 3% of GDP in the second half, influenced mainly by oil prices. For all these years, the trade deficit for oil and petroleum products has been of a similar size to total energy trade deficit, for instance it was 3.5% of GDP in 2011. In the same period, Poland has had a modest trade surplus for solid fuels and a modest trade deficit for gas; they have been of a similar size, namely varying between roughly between 0 and 1 % of GDP and ultimately decreasing in size. In 2011 they were respectively +0.5% and -0.3% of GDP. The remainder is explained by a small surplus in electricity trade.
The size of the energy trade deficit should be seen against the background of country's current account deficit. With a deficit of 4.3% of GDP, Poland is among the countries with the largest current account deficits in 2011, while it had an average ranking in the beginning of the period 2007-2011 (with a deficit of 6.2% of GDP in 2007). This illustrates that Poland has been less successful in reducing its current account deficit than other countries. It appears that the worsening energy trade deficit has been one of the causes of the stubbornness of the current account deficit.
13.3.2. Decomposition of the net energy trade balance
The energy trade balance can be decomposed into three multiplicative factors, namely the relative energy trade balance (i.e. the share of net exports in energy products in total cross-border energy trade), the share of energy in total trade and macro openness to trade (i.e. the ratio of total trade to GDP).
As regards the size of relative energy trade balance, Poland's deficit does not stand out compared to other countries, as ten countries have a bigger deficit. However, since both Poland's share of energy products in total trade and macro-trade openness are rather low, the energy trade deficit in GDP terms is even more modest as compared to other EU countries (eighteen of which having a larger deficit). Combined, these factors suggest that energy products play a modest role in Polish foreign trade turnover, and that trade volume has less an impact on the economy than in other EU countries. However, the high energy intensity could make the Polish economy vulnerable to (price) competitiveness erosion if cost increases from energy price shocks would be passed on to export prices.

European Commission Member States’ Energy Dependence
214
13.3.3. Conclusions
Poland's energy trade deficit appears relatively modest, but its increase over time may have played a role in the relatively limited success of Poland to reduce its current account deficit. The energy trade deficit is primarily caused by oil imports, while the country's trade surplus in solid fuels and the trade deficit in gas largely cancel each other out. Together with the rather modest share of energy products in total trade, the size of the energy trade deficit suggests a relatively limited vulnerability as regards the external dimension of energy dependency. However, in view of the high energy intensity, energy prices and their trade impacts need to be watched carefully.
13.4. REFERENCES
European Commission, Directorate-General for Energy (2012), Energy Statistics, June 2012, available from: http://ec.europa.eu/energy/publications/statistics/statistics_en.htm
European Commission (2011), Annual Growth Survey 2012, Europe 2020 targets: climate change and energy, COM (2011) 815 of 23 November
European Commission (2012), Progress towards achieving the Kyoto Objectives, COM (2012) 626 of 24 October.
Eurostat (2012), Energy statistics – Prices, available from: http://epp.eurostat.ec.europa.eu/portal/page/portal/energy/data/main_tables
OECD (2012), Inventory of estimated budgetary support and tax expenditures for fossil fuels, OECD Publishing
International Energy Agency (2011), Energy Policies of IEA Countries – Poland, IEA Free Publications, available from: http://www.iea.org/publications/freepublications/publication/name,15758,en.html
Republic of Poland (2007), First National Energy Efficiency Action Plan, available from: http://ec.europa.eu/energy/efficiency/end-use_en.htm
Republic of Poland (2011a), Second National Energy Efficiency Action Plan, available from: http://ec.europa.eu/energy/efficiency/end-use_en.htm
Republic of Poland (2011b), National Renewable Energy Action Plan 2010-2020, available from: http://ec.europa.eu/energy/renewables/action_plan_en.htm
Republic of Poland, Ministry of the Economy (2009), Energy Policy of Poland until 2030, 10 November
Steinhilber S., Ragwitz M., Rathmann M, Klessmann C. and Noothout P (2011), Indicators assessing the performance of renewable energy support policies in 27 Member States, D17 Report of RE-Shaping project.

14. PORTUGAL
215
14.1. SECURITY OF ENERGY SUPPLY
Portugal is fully dependent on imports regarding its use of fossil fuels. To compensate for this, the country has invested heavily in renewable generation sources, notably hydro and more recently wind and solar. As a result the total energy dependence of the country showed a steady decline, reaching 75% in 2010. Looking ahead, Portugal still aims to increase the share of renewable energy further by 2020 according to its National Renewable Action Plan. Regarding the overall diversification of the energy mix, Portugal scores in the middle range of EU countries with a HHI indicator of 0.35 in 2010.
70
80
90
100
110
2006 2007 2008 2009 2010
%Graph II.14.1:Portugal - Import dependence
Gas Oil Solid fuels Total
Source: Eurostat
14.1.1. Primary Energy Sources
14.1.1.1. Oil
Oil traditionally has a dominant share in the Portuguese energy mix, and even after decades of steady decline its share was still 51% of gross
Key Insights
Security of Energy Supply:
- Portugal scores somewhat below the EU average regarding the security of its energy supply. As a country with no natural resources in fossil fuels, it completely relies on imports for these fuels. To compensate for this, Portugal has invested heavily in renewables (mostly hydro, wind and solar), which has reduced its overall import dependence.
- Portugal has diversified its import sources of fossil fuels relatively well in comparison with other EU Member States, but sources a very high share of its imports from non-EEA countries.
- The lack of nuclear energy has implied a high share of oil in the energy mix, but in the last decade Portugal successfully reduced the share of oil by increasing the share of gas and renewables, thereby diversifying its energy mix.
Energy and Carbon Intensity:
- The Portuguese economy performs in line with the EU average in terms of energy and carbon intensity.
- The industry and the transport sectors perform substantially below the EU average, but the good performance of the household sector compensates for this.
- The energy intensity of the total economy has shown a moderate improvement in the period 2006-2010 similarly to the evolution of energy intensity in the EU as a whole.
Trade balance for energy products:
- The total energy trade deficit of Portugal stood at 4.2% of GDP in 2011 and fluctuated in the range of 3-5% of GDP in the period 2007-2011, which places the country in the middle range among EU Member States.
- While Portugal is not among the EU countries with the largest energy trade deficit, this sizeable deficit still gives rise to concern because of its persistence.

European Commission Member States’ Energy Dependence
216
inland consumption in 2010(348). The main reasons for the high share of oil are the lack of nuclear power generation and the relatively late introduction of gas into the Portuguese energy mix (only in 1997).
0
20
40
60
80
100
2006 2007 2008 2009 2010
%Graph II.14.2:Portugal - Energy mix
Gas Oil Nuclear Renewables Solid fuels
Source: EurostatNote: Non-renewable waste and electricity are excluded
Portugal has one of the best diversified import structures of oil and petrol products among Member States, as demonstrated by a very low HHI of 0.07. On the other hand around 80% of its imports come from non-EEA countries, which is substantially above the EU average.
There is no cross-border pipeline connection for oil, all imports pass through the country's ports. The two major ports for oil import are Sines and Leixoes, but Aveiro and Setubal also have oil terminals.
14.1.1.2. Gas
Natural gas was introduced in Portugal only in 1997, but its share in the energy mix has increased rapidly ever since and reached 18% of gross inland consumption in 2010. This has reduced the country's dependence on oil and has contributed to a more competitive and more efficient use of energy. Natural gas is used mainly for industrial purposes, to generate electricity and only to a lesser extent by residential consumers.
(348) European Commission, DG Energy (2012)
0.0
0.2
0.4
0.6
0.8
2006 2007 2008 2009 2010
Graph II.14.3:Portugal - HHI index energy imports
Gas Oil Solid fuels
Source: Eurostat
A well-functioning and interconnected gas market with competitive and market-based prices should provide the correct incentives for further investments and signals to consumers for an efficient and sustainable use of resources. Both elements are conducive to reducing the vulnerability of the country to energy-related shocks. The current situation shows that there could be scope for further diversification of gas imports in order to increase the security of supply of natural gas. Natural gas enters into Portugal either through the LNG terminal of the port of Sines, or through the cross-border gas pipeline from Spain. Portugal imports gas from two sources: from Algeria through the pipeline via Spain, and from Nigeria through the LNG terminal of Sines. This import structure puts Portugal in the middle range among EU countries regarding diversification, as there are several Member States which import all of their gas from one source. The current gas storage capacity is negligible but projects are underway to expand it.
The wholesale market is constrained by bilateral long-term contracts for the above-mentioned import sources. The gas retail market shows a high concentration with two domestic players holding a cumulative market share above 90% in 2010. The market is theoretically fully liberalised, and foreign entrants are present, but their market penetration has not yet proven to be successful.

Part II Individual Country Files
217
75
80
85
90
95
100
2006 2007 2008 2009 2010
%
Graph II.14.4:Portugal - Non-EEA share of imports
Gas Oil Solid fuels
Source: Eurostat
Portugal has committed itself to full liberalisation of end-user prices in the gas market, which should strengthen the competition in the future. End-users' prices without taxes for industrial consumers were close to the EU average in 2010, rising above the EU average in 2011-2012. End-users' prices for households were among the third highest in the EU in 2010-2012(349).
14.1.1.3. Renewables
Portugal has one of the highest share of renewables among Member States: 22% of its energy mix, or 24.6% of gross final energy consumption(350). This is the result of a long-term objective of the Portuguese energy policy to reduce the country's reliance on fossil fuels as it has no known reserves of these fuels. The share of renewables has been rising steadily over the last years. In its National Renewable Energy Action Plan Portugal (NREAP) committed itself to increase this share to 31% by 2020(351).
(349) Eurostat (2012) (350) The share of renewables in the energy mix means the share
of renewable energy in gross inland energy consumption. Consequently we use this denominator in the EDI to assess the share of each energy source in the energy mix. On the other hand, Member States' renewable targets for 2020 are expressed as a share of renewable sources in final energy consumption, i.e. excluding transmission, distribution and transformation losses. This explains the difference between the two figures.
(351) Republic of Portugal (2011b)
0
20
40
60
80
100
2006 2007 2008 2009 2010
%Graph II.14.5:Portugal - Renewable mix
Hydro Biomass Wind Solar Geothermal
Source: Eurostat
The share of renewables is particularly high in electricity generation: 53%, the fourth highest in the EU. The largest contributor continued to be hydro power, but the share of wind power has increased rapidly in the last years. The share of wind power in total electricity generation was 17%, the second highest in the EU after Denmark, which could cause some problems related to variability of wind production(352). Geothermal and solar energy play only a minor role in total renewable energy production. The share of renewables, mainly of biomass, was also very high in heating, 38%. In transport, the share of RES was 5.6%, also above the EU average.
According to the NREAP, the targeted rise in the total renewable energy consumption should come from the installation of new renewable electricity generation capacity and from an increase in renewables used in transport. The planned increase in renewable electricity generation capacity in turn should come mainly from hydro, wind and solar. In this context it should be noted that the recent financial distress of Portugal and the existence of an electricity tariff debt (see section 14.1.2) may pose a challenge in the future to achieve these targets.
14.1.1.4. Solid fuels
Solid fuels represent a relatively small and steadily declining share in the energy mix of Portugal. In 2010 the share of solid fuels was 7% of gross inland consumption. The country is
(352) On this issue, see box 5 in section 3.6. of the note on
Energy Dependence Indicators.

European Commission Member States’ Energy Dependence
218
sourcing its solid fuel imports from several suppliers, its HHI of 0.34 scores around the middle range among EU countries.
The share of non-EEA imports is high, around 95%. However, the same share for the EU as a whole is 85%, which indicates that there is probably limited scope for reducing the share of non-EEA imports of solid fuels.
14.1.2. Secondary Energy Sources
Portugal is among the best performers in the EU regarding the diversification of sources of electricity generation. In addition, the country managed to achieve this high level of diversification despite its decision not to use nuclear power. In the future though, the level of diversification will probably decline if the country fulfils its target for an increase in renewable generation.
0
20
40
60
80
100
2006 2007 2008 2009 2010
%Graph II.14.6:Portugal - Electricity mix
Gas Oil Nuclear Renewables Solid fuels
Source: Eurostat
It is worth noting that Portugal is a significant net importer of electricity. In the period 2006-2010, on average around 12% of gross final electricity consumption was imported from Spain in the framework of the common electricity market Mibel. However, in the last two years there has been a declining trend in electricity imports.
Good electricity interconnections and adequate domestic infrastructure capacity are important to shelter the country from supply shocks and to enable a proper absorption of renewables. A competitive and dynamic electricity market should cater the necessary investment incentives and provide the right price signals to consumers.
The Portuguese electricity market is dominated by the vertically integrated formerly state-owned incumbent, EDP. In the wholesale market EDP has a market share of around 55% in terms of electricity generated, and 50% in the retail market in terms of electricity supplied(353). Foreign entrants are present on the market but the overall level of competition has been weak.
The electricity market is fully liberalised as of the 1st of January 2013, but in the household segment virtually all energy has been supplied by the incumbent, which is due to the fact that until now prices were regulated. Portugal is in the process of full liberalisation of end-user prices in the electricity market, which should strengthen the competition in the future.
The Portuguese electricity sector faces the challenge of a significant tariff debt accumulated in the past years as a result of governmental decisions not to pass on the full cost of electricity generation to end-users. Renewables only represent one of the several factors that contributed to high generation costs. Other factors include: compensation for the premature termination of past long-term power purchase agreements, a power guarantee mechanism and a support scheme for co-generation.
Electricity end-users' prices without taxes are close to the EU average for industrial consumers, while they are below the average for households(354).
14.1.3. Conclusions
Overall, Portugal scores somewhat below the EU average regarding the security of its energy supplies. A key challenge to Portuguese energy security is the lack of any domestic reserves of fossil fuels. To compensate for this, Portugal has invested heavily in renewables and managed to bring down its overall import dependency to 75% by 2010. Despite this, oil still has a dominant share (51%) in the energy mix, though this share has been on a steady decline. Portugal managed to diversify its oil suppliers very well in relation to other EU countries, but it relies heavily on non-EEA suppliers. Although natural gas was only
(353) ERSE (2011) (354) Eurostat (2012)

Part II Individual Country Files
219
introduced in Portugal in 1997, its share in the energy mix has been rising rapidly and reached 18% in 2010. Natural gas is imported from two countries, both outside the EEA, but the existence of a LNG terminal gives Portugal the access to the global LNG market, currently characterised by overcapacity and attractive prices.
Portugal has the fifth highest share of renewables in the energy mix in the EU and the country is planning to increase this share further according to its EU2020 commitments.
14.2. ENERGY AND CARBON INTENSITY
The Portuguese economy performs in line with the EU average in terms of energy intensity. The industry and the transport sectors perform substantially below the EU average, but the good performance of the household sector compensates for this. The energy intensity of the total economy has shown a moderate improvement in the period 2006-2010 in line with the evolution of energy intensity in the EU as a whole. This improving trend was interrupted in 2009, when the economic recession led to a decline in GDP that exceeded the overall energy savings. The improvement in energy intensity on the other hand continued in 2010.
Table II.14.1:Energy and carbon intensity
Energy intensity of the economy 1) 155 -5.9CO2 intensity of the economy 2) 0.45 -14.0Share of energy intensive sectors in Gross Value Added 3) #N/A #N/A
Energy intensity of the economy 1) 152 -4.7CO2 intensity of the economy 2) 0.41 -9.1Share of energy intensive sectors in Gross Value Added 3) 8.9 -0.9Source: Eurostat
2010 percentage change2006 - 2010
memo items: EU27
Notes: 1) Kg of oil equivalent per 1000 EUR, changes in percent; 2) Tonnes of CO2 equivalent per 1000 EUR, changes in percent; 3) percent of total gross value added, changes in percentage points, latest data refer to the year 2009.
In its first National Energy Efficiency Action Plan (NEEAP), Portugal committed to reduce its final energy consumption by 9.8% by 2015 relative to its annual average over 2001-2005(355). By 2010 the country has achieved around 37% of this objective and was on track to meet the overall objective according to the 2011 revision of the NEEAP. In this second action plan, Portugal set itself the target of reducing final energy consumption by 12.1% by 2016 relative to the same baseline. (355) Republic of Portugal (2007)
The carbon intensity of the Portuguese economy is in line with the EU average, and it has shown a decline of more than 10% in the period 2006-2010 which surpasses the improvement recorded in the EU. However, in absolute terms GHG emissions have increased between 1990 and 2010 by 17% and emissions per capita have also increased by 16%: Portugal is one of the few Member States where this happened.
0.40
0.43
0.46
0.49
0.52
0.55
150
153
156
159
162
165
2006 2007 2008 2009 2010
Graph II.14.7:Portugal - Energy and carbon intensity of the economy
Energy intensity (lhs) CO2 intensity (rhs)
kgoe/1000 EUR ton CO2 eq./1000EUR
Source: Eurostat
GHG emissions have started a steady decline since 2005. The recent decline is partly due to the increase in renewable power generation, to increased energy efficiency and to some extent to the impact of the economic crisis in the last few years. According to the latest projections total GHG emissions are expected to be on a moderately declining path until 2020(356). The country is on track to meet its Kyoto targets(357), which require Portugal to limit its emissions to an increase of 27% by 2012 compared to 1990.
In the framework of the Effort Sharing Decision(358), Portugal is expected to limit its emissions in the non-ETS sectors to an increase of 1% by 2020 compared to 2005 levels. The latest projections show that the country will over-achieve this target as its emissions are expected to be 17% lower than the baseline year(359).
The share of the country's emissions falling under the ETS is 34%, six points below the EU average. While emissions allowances have so far
(356) European Commission (2012) (357) European Environment Agency (2011) (358) Decision 406/2009/EC (359) European Commission (2011)

European Commission Member States’ Energy Dependence
220
been granted for free, the third phase of the ETS foresees an EU-wide emissions cap and the adoption of the auctioning. The auctioning is likely to bring about an increase of energy prices as the power sector accounts for 65% of total emissions. However, the extent of this impact may be limited by the currently low carbon prices and by the recent declining rate of verified GHGs emissions in the country: between 2008 and 2011 they decreased by 13%.
14.2.1. Industry
The energy intensity of the Portuguese industry is clearly above the EU average, even though the share of industries that are traditionally highly energy intensive is relatively low in Portugal. This suggests that there may be scope for improvement in the energy intensity of industry. Portugal's industry energy intensity has been rather stable in the period 2006-2010 and its relative position in the EU as well.
2.00
2.10
2.20
2.30
2.40
220
225
230
235
240
2006 2007 2008 2009 2010
Graph II.14.8:Portugal - Energy intensity of industry, carbon intensity of energy use
Energy intensity of industry (lhs)CO2 intensity of energy use (rhs)
kgoe/1000 EUR ton CO2 eq./1000EUR
Source: Eurostat
According to the second NEEAP, around 27% of the total energy savings that have been realised until 2010 were delivered by the industry. The support scheme for industry energy efficiency consists of voluntary agreements with companies and fiscal incentives for companies with consumption above a certain threshold. In addition to these, the economic crisis also contributed to a reduction in the energy consumption of the industry.
The carbon intensity of energy use shows similar dynamic evolution than the carbon
intensity of the whole economy. It was reduced by 13% between 2006 and 2010 and is in line with the EU average. As mentioned in section 14.1, Portugal is among the best performers in the use of renewables among EU countries and since renewables represent a carbon-free energy source, this would imply low overall carbon intensity. However, the very high share of oil in the total energy mix in conjunction with the lack of nuclear power offsets the effect of the high share of renewables, resulting in a total carbon intensity that is in line with the EU average.
14.2.2. Transport
The Portuguese transport sector has a very high energy intensity in comparison with the EU average. The transport sector is dominated by road transport which is probably a major factor behind this performance. Portugal has a very well developed road infrastructure, the rail network is underdeveloped. In addition, rail transport and maritime shipping face several challenges which make them less competitive vis-à-vis road transport. In rail freight transport, the fact that the rail track gauge in the Iberian Peninsula is different from continental Europe presents a serious hindrance. There are plans to build a freight line in European gauge connecting Portugal and Spain with the rest of Europe which could overcome this problem. In the maritime sector, ports suffer from low competiveness, a restrictive regulatory framework and inefficient governance framework, which overall limit the country from using its potential in maritime shipping. Portugal is currently in the process of reforming its port sector with the aim to resolve these problems.
1.80
1.90
2.00
2.10
2.20
730
745
760
775
790
2006 2007 2008 2009 2010
Graph II.14.9:Portugal - Energy and carbon intensity of transport
Energy intensity (lhs) CO2 intensity (rhs)
kgoe/1000 EUR ton CO2 eq./1000EUR
Source: Eurostat

Part II Individual Country Files
221
According to the second NEEAP, the energy savings delivered by the transport sector represented around 13% of the total energy savings in 2008-2010(360). This was the result of the combination of three programmes: Upgrading of Cars, Urban Mobility and System of Energy Efficiency in Transport. The second NEEAP aims at further savings to be realised in the transport sector through measures such as the implementation of a new environment-friendly driving system and monitoring system, which is expected to have an impact by 2016. Further measures include the improvement of logistics and rail infrastructure and reforming the port sector.
The transport sector performs badly also in carbon intensity with a level in 2009 considerably above the EU average. However, the carbon intensity of transport has shown a significant improvement of around 11% in the period 2006-2009, and so Portugal closed some of the gap with the EU where the same indicator has been stable in this period.
14.2.3. Households
Households' energy intensity(361) was among the lowest in the EU in 2010. This is likely linked to the warm climate, which implies lower heating costs, as heating represents a substantial part of the energy consumption of the household sector. In addition, households' energy intensity has shown an improvement of around 10% in the period 2006-2010.
According to the second NEEAP, around 32% of the total energy savings that have been realised until 2010 were delivered by the residential and services sectors. The main programmes, which brought about the savings, are: Upgrading House and Office (which is the largest contributor), the implementation of the Energy Certification System of buildings, and Local Renewables (micro-generation and thermal solar).
(360) Republic of Portugal (2011a) (361) Note that energy intensity of households is calculated as
the ratio of final energy consumption and final consumption expenditures of households.
0.05
0.07
0.09
0.11
0.13
25
28
30
33
35
2006 2007 2008 2009 2010
Graph II.14.10:Portugal - Energy and carbon intensity of households
Energy intensity (lhs) CO2 intensity (rhs)
kgoe/1000 EUR ton CO2 eq./1000EUR
Source: Eurostat
The weight of energy in the consumer basket used for the Harmonised Index of Consumer Prices was close to the EU average in 2010, but has shown a clear upward trend in 2006-2010. In addition, there have been substantial increases in indirect taxation of energy products since then, and looking ahead, the existence of the electricity tariff debt indicates further upward pressure on electricity prices in the future. This is likely to induce further improvements in the energy efficiency of the household sector given that the price signal is becoming increasingly important. However, the financial crisis poses challenges to the financing of projects, which is likely to have a negative impact on further energy efficiency improvements.
Portuguese households have one of the lowest carbon intensity in the EU, and its level has actually slightly decreased since 2006, making Portuguese dwellings the third least carbon-intense in the EU.
14.2.4. Conclusions
The Portuguese economy performs in line with the average of the EU27 both in terms of energy and carbon intensity. The industry and the transport sectors perform substantially below the EU average, but the good performance of the household sector compensates for this. Portugal is on track to meet its target for energy efficiency defined in the National Energy Efficiency Action Plan and its target for greenhouse gas emissions defined in the Kyoto Protocol. The country has achieved significant energy savings in the industry primarily through voluntary agreements and in the

European Commission Member States’ Energy Dependence
222
residential sector primarily by upgrading the building stock (especially lighting), household appliances and through the implementation of the Energy Certification System of buildings. The transport sector has contributed less to the overall energy savings. This sector is characterised by very high energy and carbon intensities, which are linked to the very high share of road transport in the sector.
On-going reforms of the port sector should be followed through persistently to unlock the potential of maritime shipping and efforts should be made to increase the competitiveness of rail vis-à-vis road transport.
14.3. CONTRIBUTION OF ENERGY PRODUCTS TO TRADE
14.3.1. Net energy trade balance
The total energy trade deficit of Portugal stood at 4.2% of GDP in 2011 and fluctuated in the range of 3-5% of GDP in the period 2007-2011, which places the country in the middle range among Member States. In line with its dominant share in the energy mix, the trade deficit for oil contributed the most to the overall deficit, with deficits varying between 2% and 3.5% of GDP. This also suggests that the peak in the energy trade deficit (almost 5% of GDP) reflects the peak in oil prices.
In contrast to the oil trade deficit, the deficit for gas shows a much gradual development, with a slow increase over time, which can be explained by the stability provided by the long-term contractual arrangements that characterise the imports of gas in Portugal, and the gradual increase in the share of gas in the energy mix.
However, the developments and current size of the energy trade deficit should be seen against the background of the country's current account balance. In the last decade, Portugal has been among the countries with the highest deficit in the EU. In the period 2005-2010 it has been over 10% of GDP while it peaked in 2008, when the deficit exceeded 12% of GDP. With the onset of the economic crisis and subsequent structural reforms, the deficit fell back to 6.4% of GDP by 2011.
-6
-4
-2
0
-18
-12
-6
0
2007 2008 2009 2010 2011
% of GDP% of GDP
Graph II.14.11:Portugal - Trade balance of energy products and CA
CA (lhs) Oil (rhs)Gas (rhs) Total (rhs)
Source: Eurostat
At the same time, the total energy deficit was unaffected by this adjustment, which reflects its persistent nature. As a consequence, the contribution of the energy trade deficit to the current account deficit has sharply increased to almost two-thirds in 2011. In the years to come the current account is expected to become more or less balanced with an outlook even of a modest surplus, indicating that through the improvement of the competitiveness of the Portuguese economy, the trade balance for the other product categories can be seen as compensating the persistent energy trade deficit.
It is worth noting that in the absence of domestic renewables production, the total energy deficit and the current account deficit would be higher. A simplistic calculation would suggest that the total energy deficit could have been higher by around 1.1 percentage point of GDP in 2011 if the country had not invested at all in renewables previously(362). However, it is crucial to ensure a cost-effective support scheme for renewables not to harm the competitiveness of the Portuguese economy through excessively high electricity prices.
14.3.2. Decomposition of the net energy trade balance
The energy trade balance can be decomposed into three multiplicative factors, namely the relative energy trade balance (i.e. the share of net exports
(362) Assuming that an increase of total import dependency to
100% in the absence of renewables would be matched by a proportionally higher energy trade deficit.

Part II Individual Country Files
223
in energy products in total cross-border energy trade), the share of energy in total trade and the macro openness to trade (i.e. the ratio of total trade to GDP). Portugal does not stand out among EU countries regarding its relative energy trade balance for 2011 and it is close to the EU average regarding the share of energy in total trade. By contrast, the Portuguese economy shows a significantly lower macroeconomic openness than most EU countries.
Table II.14.2:Decomposition of Energy Trade Balance
2007 2008 2009 2010 2011Energy trade balance (% GDP) -3.7 -4.7 -2.9 -3.4 -4.2Relative trade balance (%) -64.7 -65.4 -61.5 -54.4 -53.9Share of energy in total trade (%) 10.0 12.1 9.6 11.5 13.4Macro trade openness (% GDP) 58.0 59.9 49.3 54.3 58.6Source: Eurostat
A closer look over the period 2007-2011 reveals that, the relative trade balance has been declining, in contrast to the energy trade balance in GDP terms, which has shown a more fluctuating pattern. With the decomposition, one can show that the increase in the share of energy in total trade has had a counteracting effect. In case this share would have remained at the 2007 level, the energy trade deficit would have fallen as well, in 2011 by 1 percentage point of GDP. The changes in macroeconomic openness have not had a significant impact.
14.3.3. Conclusions
The total energy trade deficit of Portugal stood at 4.2% of GDP in 2011 and fluctuated in the range of 3-5% of GDP in the period of 2007-2011, which places the country in the middle range among Member States. Oil was the dominant contributor to this deficit in line with its major share in the energy mix, with gas representing a smaller share in the total deficit.
While Portugal is not among the EU countries with the largest energy trade deficits, this sizeable deficit still gives rise to concern because of its persistence and the still very large current account deficit.
14.4. REFERENCES
European Commission (2011), Annual Growth Survey 2012, Europe 2020 targets: climate change and energy, COM (2011) 815 of 23 November
European Commission (2012), Progress towards achieving the Kyoto Objectives, COM (2012) 626 of 24 October.
European Commission, Directorate-General for Energy (2012), Country Factsheets – EU 27 Member States, Energy Figures by Country, available from: http://ec.europa.eu/energy/observatory/countries/countries_en.htm
Eurostat (2012), Energy statistics – Prices, available from: http://epp.eurostat.ec.europa.eu/portal/page/portal/energy/data/main_tables
European Environment Agency (2011), GHG Trends and Projections in Portugal, Greenhouse gas emission trends and projections in Europe 2011 – Tracking progress towards Kyoto and 2020 targets, 7 October
Republic of Portugal (2007), First National Energy Efficiency Action Plan, available from: http://ec.europa.eu/energy/efficiency/end-use_en.htm
Republic of Portugal (2011a), Second National Energy Efficiency Action Plan, available from: http://ec.europa.eu/energy/efficiency/end-use_en.htm
Republic of Portugal (2011b), National Renewable Energy Action Plan 2010-2020, available from: http://ec.europa.eu/energy/renewables/action_plan_en.htm


15. ROMANIA
225
15.1. SECURITY OF ENERGY SUPPLY
Romania is one of the least energy dependent countries. Import dependence was 22% in 2010 against an EU average of 54%, and compared to 29% in 2006. The energy mix is one of the most diversified in the EU and it has shown improvements between 2006 and 2010.
15.1.1. Primary energy sources
15.1.1.1. Gas
The first source of energy is gas, which accounted for 30% of the energy mix in
Key Insights
Security of Energy Supply:
- Romania displays large natural oil and gas reserves, which make it one of the least energy dependent Member States of the EU.
- Price regulation and quantitative restrictions in the gas market may limit the potential for restructuring the energy sector towards a more efficient and less carbon-intensive use of resources.
Energy and Carbon Intensity:
- Romania still appears to be one of the five most vulnerable countries in the EU in terms of Energy and Carbon intensity. However, while energy efficiency gains have been good over the past decade, the regulated energy prices do not provide the right signals to consumers. Further improvement could be expected once electricity and gas prices are deregulated and begin to reflect market and energy conditions.
- Romania's situation is characterised by a highly energy-intensive economy with a high proportion of energy-intensive industries. In addition, the significant share of solid fuels in the energy mix is the main factor behind the high carbon intensity of the economy.
- Transport is becoming more and more of a concern as it is the only economic sector that has been continuously increasing both its energy and carbon intensity.
Trade balance for energy products:
- Romania's energy trade deficit is relatively small and appears fairly stable, because of the significant improvement of the current account.
- The current account deficit remains, however, rather large and hence future developments will have to be closely monitored.

European Commission Member States’ Energy Dependence
226
2010(363) and has been on a declining trend since 2006. Romania is one of the largest producers of natural gas in the EU, as it has important reserves(364). However, the country imported 17% of the gas it consumed in 2010. Import sources are limited basically to Russia. Imports are expected to increase due to both the increase in domestic consumption and the gradual depletion of internal gas reserves.
A well-functioning and interconnected gas market with competitive and market-based prices should provide the correct incentives for further investments and signals to consumers for an efficient and sustainable use of resources. Both elements are conducive to reduce the vulnerability of the country to energy-related shocks. Some of the features of the Romanian gas market suggest that the situation could be significantly improved.
For a start, the Romanian gas market is highly regulated. The holder of a Petroleum agreement has the right to dispose of the amounts of natural gas to which it is entitled. However, in accordance with the applicable legislation, the export of natural gas production is prohibited for the moment until domestic demand has been fully covered. Under order 1284/27/160/2011, holders of petroleum permits are obliged to make available their entire gas production for the domestic market. (363) European Commission, DG Energy (2012) (364) Global Legal Group (2011): According to some estimates,
Romania's primary reserves are estimated at 1630 billion cubic metres and the identified natural gas reserves (150 bn cubic metres) are estimated to cover domestic production for a period of 15-20 years.
As such, the measure constitutes an implicit export ban. De facto, imports are limited as they are required for only that portion of demand that has not been covered by domestic production.
The natural gas market has two main producers – a fully state-owned enterprise holding a market share of 51% in 2010 and a partly private enterprise with 46% of the market. The exploration and development of gas reserves is performed by both companies, based on concessions obtained more than 20 years ago(365). As regards oil and gas reserves, the government grants concession rights to producers and receives royalties which are applied in relation to the volume of gross production extracted. The level of royalties is defined in the Petroleum law (238/2004) and ranges between 3.5% (for blocks that produce more than 10 million cubic metres per quarter) and 13% (for blocks that produce more than 200 million cubic metres per quarter)(366).
Security of supply is part of the obligation of gas producers under the Gas Law 351/2004 (article 4(2)). In December 2011, the Parliament voted an
(365) Petrom has the same concession rights obtained when it
was a state-owned company. (366) These percentages are established in the Petroleum Law
238/2004 which also applies to natural gas as regards the level of royalties. The Petroleum agreement is concluded between the NAMR (National Agency for Mineral Resources) as representative of the State and private legal entity. The royalty shall be determined as a percentage from the gross production extracted as a result of the production operations of the natural gas services. When Petrom S.A was sold to OMV in 2004, the Romanian government committed not to increase royalties again until 2014 (Rush, 2010). The conditions of the privatisation were highly controversial at that time.

Part II Individual Country Files
227
amendment to this law, providing that, in order to ensure the security of supply, gas producers should supply the domestic market until the diversification of gas supply is ensured. Such amendment goes against the on-going infringement procedure launched by the Commission and the conditions included in the economic adjustment programme negotiated in June 2011. The control of gas quantities contributes to ensuring the regulation of end-user prices.
Gas end-user prices are regulated and are the lowest in the EU27(367). In PPS, the Romanian gas prices are among the lowest in the whole EU. Households account for 20.25% of natural gas demand, 22.4% comes from heat and electricity generation, 20.9% from the chemical industry, 16.1% from other industries, 11.3% from other non-households consumers and 9% from technological consumption. Regulated prices apply mostly to households. Large industrial users negotiate bilateral contracts with gas producers, some of which are not negotiated on a transparent basis. As gas prices do not reflect true market conditions, industrial users are implicitly subsidized (energy accounts for more than 10% of input costs in chemicals and metal ores). In 2010, during the crisis, the Government decided to allow the fertilizer industries to buy natural gas at the domestic price instead of at the basket price(368). This decision was repealed in Q4/2010.
The diversification of gas supply is an objective of the Romanian authorities. At the moment, Romania has a connection with Hungary (Arad-Szeged pipeline), but the pipeline only allows for the import of natural gas. A new project to build a second interconnection with Bulgaria in 2012 is underway. The Government is also planning a project in LNG facilities: AGRI – Azerbaijan, Georgia, Romania Interconnection. Natural gas would come from Azerbaijan through Georgia to the Romanian shore. Romania also has gas storage capacity which is planned to increase by 5.1% by 2015.
(367) Gas prices for non-household and household consumers are
planned to be deregulated by end 2014 and 2018, respectively
(368) The "gas basket" is composed of the import price and the price of domestic gas. Domestic prices are lower than import prices. The import price parity was a condition imposed by IMF during the EU accession negotiation.
15.1.1.2. Oil
The second source of energy is oil. The share of oil in the energy mix is 26% compared to an EU average of 36% in 2010. It remained almost unchanged since 2006. Romania holds large oil reserves, and OMV-Petrom and Rompetrom are the most important oil producers and refiners. OMV-Petrom is the major domestic crude oil producer (99% market share in 2009).
Despite domestic oil reserves, Romania is a net importer. Imports accounted for 51% of gross inland consumption in 2010 (44% in 2006). The degree of diversification of imports is higher than for gas; Romania imports mainly from Kazakhstan and Russia.
15.1.1.3. Solid fuels
The third source of energy is solid fuels which accounted for 20% of the energy mix in 2010. The share of solid fuels in the energy mix is higher than the EU average but, it is on a declining trend. Coal still accounts for a high share of electricity production. However, the Romanian authorities have started to restructure and close down mining.
15.1.1.4. Renewables
Renewable energy is the fourth energy source in Romania. The country had in 2010 a 16% share of renewable energy in its energy mix, or 23.4% of gross final energy consumption(369). The share of
(369) The share of renewables in the energy mix means the share
of renewable energy in gross inland energy consumption. We use this denominator consequently in the EDI to assess

European Commission Member States’ Energy Dependence
228
RES in gross final energy consumption increased regularly over the last years from 17% in 2006. Romania has already almost reached its binding target for 2020 stipulated in the renewables directive(370), which of 24%.
The share of renewables in electricity generation was 33% in 2010, 98% of which comes from hydropower. The country offers opportunities for wind, solar, biomass (forests) and geothermal energy for electricity generation, but their contribution has been minimal so far. According to the energy regulator(371), there were 15 wind producers in 2010 and one in solar energy. The share of renewables in heat generation, mainly of wood and biomass, was also high at 27%, while the share of RES in transport was below the EU average – 3.2% in Romania, as against a 4.3% EU average.
Romania uses a quota system through green certificates to promote renewable energy production. The quota system came into effect in October 2011. The RES quota – which does not cover large hydro plants – will rise from 12% in 2012 to 20% in 2020. The amount of subsidy corresponds to the price per certificate achieved in
the share of each energy source in the energy mix. On the other hand, Member States' renewable targets for 2020 are expressed as a share of renewable sources in final energy consumption, i.e. excluding transmission, distribution and transformation losses. This explains the difference between the two figures.
(370) Directive 2009/28/EC on the promotion of the use of energy from renewable sources; Republic of Romania (2011b)
(371) Autoritate Nationala de Reglementare in Domeniul Energiei (2011)
the market. The transaction value of a green certificate is to be at least EUR 27 and at most EUR 55. The Romanian authorities have notified a budget to the Commission of approximately EUR 19.5 bn for the whole duration of the period (2011-2016), which covers the total value of green certificates issued for the whole support period for the contracts concluded in the respective year(372). Penalties are collected if the electricity suppliers do not acquire the required number of green certificates. Penalty payments are collected by the TSO and turned into revenues for the Environmental Fund which finances the environmental projects.
The number of certificates per MWh is differentiated by technology; for instance, wind power producers will get two certificates. It means that at the maximum level, a renewable developer would get EUR 110/MWh plus the market price for energy. This would make the Romanian support scheme one of the most generous schemes in Europe. Moreover, the regulator ANRE does not seem to allow electricity supply companies to pass on the extra cost of the green certificates to consumers, which means that suppliers risk losing up to EUR 110/MWh for each wind MWh put into the system(373).
15.1.2. Secondary energy sources
Romania is a net exporter of electricity. In 2010, it exported 6% of its electricity production compared to 10% in 2006. The electricity mix comes from different sources – 34% from coal, 33% from renewables, 19% from nuclear and 12% from gas. The degree of diversification of the energy mix seems adequate. In 2010, electricity production increased by 4.3% compared to 2009, reaching approx. 54.94TWh(374).
(372)
(373) Updated information from the World Bank. (374) Autoritate Nationala de Reglementare in Domeniul
Energiei (2011)

Part II Individual Country Files
229
Good electricity interconnections and adequate domestic infrastructure capacity are important to shelter the country from supply shocks and to enable a proper absorption of renewables. A competitive and dynamic electricity market should cater the necessary investment incentives and provide the right price signals to consumers. The internal electricity network seems to be generally able to deal with demand(375). The situation is different in terms of interconnections, where import/export lines with Ukraine, Serbia, Hungary and Bulgaria appear to be often at congestion risk, especially the export flows to Hungary and import flows from Bulgaria and Serbia.
The electricity market is regulated and composed of several state-owned enterprises that are being restructured. Transelectrica is the TSO of Romania. Following the unbundling of transmission, distribution and generation, the following companies were created: SC Electrica SA, the distribution and supply operator, and SC Termoelectrica SA and SC Hidroelectrica SA, the two generation companies.
The wholesale market is concentrated and has not made noticeable progress. In 2010, the generation share of the three most important producers was 67.4%. The HHI of the wholesale market points to an increase in concentration between 2004 (1500) and 2010 (1900).
In 2010 the retail market had 55 active suppliers. The degree of concentration of the market varies among consumer segments: the (375) In 2010 only 2 days of congestion were reported due to the
temporary halt of one major power plant.
'households' segment reports the highest HHI with a value of more than 0.23 in 2010 and with the 3 main companies covering almost 75% of the market. The industrial segment appears more competitive with an HHI for small and medium enterprises of about 0.15 and for big industries of about 0.09.
End-user prices are mainly regulated(376). In 2010, 90% of all consumers were supplied in the regulated market (a decrease of 7% compared to 2009), while 10% were on the free market (an increase of 19% compared to 2009). The price level for industrial consumers in 2011 was the 8th highest in the EU, while for household consumers prices in PPS terms are in line with the EU average.(377)
15.1.3. Conclusions
Romania displays large natural oil and gas reserves, which make it one of the least energy dependent Member States of the EU. Issues can be raised with regard to the functioning of the gas and electricity markets. Given the large discrepancies between international and domestic prices in the gas market, the government regulates quantities and prices, which isolates the market from the rest of the world. As Russia is the main gas supplier, Romanian authorities deem necessary to maintain the security of supply.
However, one of the adverse effects is that energy prices do not reflect market conditions. It has to be borne in mind that EU climate change mitigation policies would imply a necessary restructuring of energy sectors, towards more efficient and less polluting energy sources. In that context, clear price signals will facilitate the transition. Price deregulation would stimulate the restructuring of the energy sector towards more efficient units and towards energy efficient sources as well as energy savings by large industrial users. Removing quantitative restrictions could contribute to increasing gas imports and exports, which would inevitably need to be reflected in gas end-user prices. Strengthening interconnection capacity
(376) Electricity prices for non-household and household
consumers are planned to be deregulated by end 2013 and 2017, respectively.
(377) Eurostat (2012)

European Commission Member States’ Energy Dependence
230
with neighbouring countries should also be seen as a priority.
15.2. ENERGY AND CARBON INTENSITY
Romania has one of the most energy intensive economies in the EU. In the period 2001-2009, the energy intensity of the economy has decreased by an average of 30%. The GDP (expressed in Euro 2005 constant prices) has grown in 2000-2008 by 63%, however the primary energy consumption has only increased by 9.4%, and the final energy consumption has increased by 14%. This indicates that the country has been able to decouple to some extent GDP growth from resources exploitation. As part of its Europe 2020 climate and energy headline target, Romania has pledged to reduce its energy intensity by 10 Mtoe(378).
The saving target for 2016 is equal to a reduction of 9% of final energy consumption (FEC)(379). The second National Energy Efficiency Action Plan of Romania shows that the country has already over delivered on its interim 2010 target exceeding it by 230%. The savings achieved in 2010 actually constitute almost 80% of the expected target for 2016, signalling that the country is progressing at a very fast pace towards meeting its obligations.
Romania's economy was among the five most carbon-intensive in the EU in 2010, although noticeable improvements have taken place since 2006. This result appears to be mainly due to the high carbon intensity of households and of the energy use, although both sectors have been
(378) European Commission (2011) -. annex 1 (379) Republic of Romania (2007): The National Energy
Efficiency Plan (NEEAP) runs for the period 2008 – 2016, the baseline consumption level, against which savings are compared, is the average consumption between 2001 and 2005.
reducing their carbon intensity between 2006 and 2009.
Romania has over achieved the Kyoto targets: emissions have been reduced by 56% in 2010 compared to 1990 levels, while the Kyoto protocol foresaw reductions of only 8%. Consequently Romania also reduced by almost half its emissions per capita, displaying in 2010 one of the lowest share in the EU with 6 tCO2-eq.
In the non-ETS sectors, Romania is expected to limit its emissions to an increase of 19% by 2020 compared to 2005 levels under the Effort Sharing Decision(380). Latest projections show that the country is on track to over achieve its target, reducing emissions by 10% in 2020(381).
The share of GHG emissions falling under the ETS is 39%, one point lower than the EU average. From 2013 there will be an EU-wide emissions cap and most allowances will be auctioned. However Romania has been granted a derogation (Article 10(c) of the ETS directive) whereby the power sector will continue to receive free allocation, reducing substantially potential impacts of the auctioning mechanism since the energy sector alone accounts for nearly 75% of total GHG emissions.
15.2.1. Industry
Despite improvements over the past decade, Romania's industry remains very energy (380) Decision 406/2009/EC (381) European Commission (2012a); European Commission
(2012b)

Part II Individual Country Files
231
intensive. Improvements have been noticeable in mining, non-metallic products and non-ferrous metals. The chemical and petrochemical industries remain energy intensive. The recent improvements are due to both energy efficiency gains and a structural effect.
Since 2000, the manufacturing structure has been reshaped. The share of low-tech sectors such as textile, clothing and leather has decreased (2.8% of total value added in 2000 and 0.6% in 2007), while the share of ICT and the automotive sector has been increasing over the same period (respectively from 1.3% to 1.8% and from 0.7% to 2.0%). A large part of this evolution is explained by the presence of foreign investments, in particular in the automotive sector.
The share of energy intensive industries amounted to 10.6% of gross value added in 2009 (against 9.8% in the EU27). This share has slightly decreased since 2001 (11.1%).
Industries contributed the most to the total savings reached in 2010, representing almost 50% them. This is proportionate to the weight of industries in final energy consumption.
15.2.2. Transport
Energy intensity in transport is above the EU average and has increased since 2006. Romania's performance has worsened with increasing motorisation rates. Romania has still by far the lowest motorisation rate of the EU, almost half of the EU-12 average.
Data from the ITF/OCDE show that between 2000 and 2008 Romania's investment in rail as a percentage of GDP has been well below investment in other Member States, while investment in road as a percentage of GDP has been significantly higher than in other Member States.
The transport volumes in both passenger and freight have decreased dramatically since 1990 (by around two thirds). In inland transport, railway accounts for 7% of total passenger-km and for 19% of total tonne-km, close to the EU average.
According to the second NEEAP, transport is the sector that contributed the least to the energy savings achieved up to 2010, constituting a mere 4% of them.(382) However this is more or less proportional to the weight of the sector in the FEC of Romania which is around 6%.
The carbon intensity of the transport sector still appears quite unproblematic but unlike the other sectors it has increased significantly between 2006 and 2009, indicating that the increase in motorisation in the country is deteriorating the carbon footprint.
15.2.3. Households
Energy consumption per dwelling has decreased over the last 8 years. However, in 2010 Romanian households were still among the five most energy-intensive of the EU. The weight
(382) Republic of Romania (2011a)

European Commission Member States’ Energy Dependence
232
of energy items in the consumer's basket is among the highest in the EU - 17% in 2010.
Consumption per dwelling for space heating has decreased at a higher rate than the EU average (-2.9% from 2000 to 2008 versus -1.2% for EU average). Finally, consumption per dwelling is below the EU average and has decreased more rapidly than in the EU27 (-1.9% between 2000 and 2008 against -0.7% in the EU27).
The savings achieved by households in 2010 were equal to 12% of total savings, somewhat below the proportional weight of households in FEC which is around 28%.
Carbon intensity of households used to be among the highest in the EU in 2006 however progress has been made and in 2010 Romania left the group of the worst performing countries. Households reduced their carbon intensity by 16% over the period 2006-2010.
15.2.4. Conclusions
Romania still appears to be one of the five most vulnerable countries in the EU in terms of energy and carbon intensity. Its situation is determined by the combination of high energy intensity in the economy and the presence of a big proportion of energy-intensive industries. In addition, the important share of solid fuels in the energy mix is the main factor explaining the high carbon intensity of the economy and of the main sectors considered, especially households and energy use. Transport is becoming more and more of a concern as it is the only economic sector that
has been continuously increasing both its energy and its carbon intensity. Given the rising motorisation of the country, ad-hoc measures should be implemented to promote the development of renewables and cleaner transport modes.
However, while energy efficiency gains have been good over the past decade, the regulated energy prices do not provide the right signals to consumers. Further improvement could be expected once electricity and gas prices are deregulated and begin to reflect market and energy conditions.
15.3. CONTRIBUTION OF ENERGY PRODUCTS TO TRADE
15.3.1. Net energy trade balance
Romania's energy trade deficit has been among the lowest in the EU over the period 2007 - 2011. Moreover, it has remained stable, varying in the range of 1.5 to 3% GDP. In 2011 the deficit amounted to 2.7% of GDP. In terms of product categories, the trade deficit for oil increased slightly over the period (from 1.5% to 1.9% of GDP), while conversely the gas deficit contracted (from 0.8% to 0.6% of GDP).
The importance of the energy trade deficit for Romania's overall economic performance must be assessed against the background of the country's current account, and more generally against that of an economic recovery after a sharp and deep

Part II Individual Country Files
233
recession which followed a financially imbued boom. The current account has strongly improved: the country had a current account deficit of 13.4% in 2007 which decreased to 4.4% of GDP in 2011. Despite this improvement (in particular from 2008 to 2009, the current account remains sizeable, rendering the country more vulnerable to energy price and supply shocks.
15.3.2. Decomposition of the net energy trade balance
The energy trade balance can be decomposed in three multiplicative factors, namely the relative energy trade balance (i.e. the share of net exports in energy products in total cross-border energy trade), the share of energy in total trade and the macro openness to trade (i.e. the ratio of total trade to GDP).
Romania’s relative trade balance for energy products does not really stand out and it has remained fairly constant over the period 2007 - 2011. The relative trade deficit for oil has remained rather low, reflecting Romania's status as a significant oil producer and exporter. In contrast, the relative trade deficit for gas has been traditionally high, reflecting the fact that strong regulation of the market has severely hampered the export of domestic natural gas while imports have merely served as mixing complement to domestic gas. The latter is currently fully dedicated to supplying the domestic market. An opening of the market would probably contribute to an increase in imports and exports, the latter aided by the price differential between the international and the domestic markets.
Romania's inconspicuous relative trade balance is translated into one of the lowest energy trade deficit in GDP terms through a modest share of energy in total trade and relatively low level of macro openness.
15.3.3. Conclusions
Romania's energy trade deficit is relatively small and appears to be fairly stable over time, while further integration of Romania in the regional energy markets may well change this balance. Moreover, the significant improvement of its current account renders the energy trade deficit less urgent. The current account deficit remains, however, sizeable and therefore future developments will have to be closely monitored.
15.4. REFERENCES
Autoritate Nationala de Reglementare in Domeniul Energiei (2011), Annual Report.
European Commission (2011), Annual Growth Survey 2012, Europe 2020 targets: climate change and energy, COM (2011) 815 of 23 November
European Commission, Directorate-General for Energy (2012), Country Factsheets – EU 27 Member States, Energy Figures by Country, available from: http://ec.europa.eu/energy/observatory/countries/countries_en.htm
European Commission (2012a), Annual Growth Survey 2013, Europe 2020 targets: climate change and energy, COM (2012) 750 of 28 November
European Commission (2012b), Progress towards achieving the Kyoto Objectives, COM (2012) 626 of 24 October.
Eurostat (2012), Energy statistics – Prices, available from: http://epp.eurostat.ec.europa.eu/portal/page/portal/energy/data/main_tables
Global Legal Group (2011), The International Comparative Legal Guide to: Gas Regulation 2011 – Romania chapter, International Comparative Legal Studies
Republic of Romania (2007), First National Energy Efficiency Action Plan, available from: http://ec.europa.eu/energy/efficiency/end-use_en.htm
Republic of Romania (2011a), Second National Energy Efficiency Action Plan, available from: http://ec.europa.eu/energy/efficiency/end-use_en.htm
Republic of Romania (2011b), National Renewable Energy Action Plan 2010-2020, available from: http://ec.europa.eu/energy/renewables/action_plan_en.htm


16. SLOVENIA
235
16.1. SECURITY OF ENERGY SUPPLY
Slovenia's import dependency is low. In 2010 it was equal to 49% of domestic energy needs, below the EU average and 3 percentage points below the level of 2006. The Slovenian energy mix is among the most diversified in the EU and it has been constant in the period 2006-2010 with a Herfindahl Index (HHI) of 0.24.
0
20
40
60
80
100
2006 2007 2008 2009 2010
%Graph II.16.1:Slovenia - Import dependence
Gas Oil Solid fuels Total
Source: Eurostat
Key Insights
Security of Energy Supply:
- Slovenia appears to be relatively well protected from potential security of supply risks. The overall import dependency is around 50% and import origins are quite diversified for all energy sources.
- The wholesale gas market is highly concentrated. Currently there is no gas trading platform in Slovenia, long-term supply contracts are still dominant and infrastructures encounter increasing congestion problems. This translates into higher than average prices for consumers.
- Renewables development proceeded slowly over the past years. Progress in the electricity and transport sectors appear insufficient to meet the 2020 targets.
Energy and Carbon Intensity:
- Slovenia stands out for its high level of CO2 emissions, especially coming from households and transportation which have one of the highest carbon intensities in the EU.
- Particularly problematic appears the transport sector where renewables are very low compared to their target level. The nature of the country as a passage way makes the difficulty to reduce the carbon footprint even bigger.
Trade balance for energy products:
- Slovenia appears to be among the most vulnerable countries in the EU as regards the external dimension of energy dependence as it has one of the largest energy trade deficits in the EU which, moreover, has seriously deteriorated over the last decade.
- The increase in both the share of energy trade in total trade and macro-trade openness suggests that Slovenia's economy is particularly exposed to energy price and supply shocks through the deterioration of the terms of trade and ensuing external imbalances.
- The successful reduction of a once sizeable current account deficit puts these risks into context, but also should serve as an encouragement to reduce the energy trade deficit in order not to jeopardise this achievement.

European Commission Member States’ Energy Dependence
236
16.1.1. Primary Energy Sources
16.1.1.1. Oil
The first source of energy used in Slovenia is oil. It accounted for 35% of the country's energy mix in 2010, a share that remained basically constant since 2001.(383) Slovenia imports all its oil needs and it does so via a rather diversified pool of import sources. The main trading partners are other EU Member States and the United States.
0
20
40
60
80
100
2006 2007 2008 2009 2010
%Graph II.16.2:Slovenia - Energy mix
Gas Oil Nuclear Renewables Solid fuels
Source: Eurostat
The first importer of petroleum products to Slovenia is Cyprus, followed by Italy.
Slovenia has only one oil refinery, Nafta Lendava, a fully state-owned enterprise. The capacity of the company is estimated to be around 600,000 tons a year. In 2009, exports of refined oil products totalled 0.49 Mtoe(384).
16.1.1.2. Solid fuels
Solid fuels are the second source of energy with a 20% share in the energy mix in 2010. Overall consumption of solid fuels remained constant since 1990, fluctuating between 1.5 and 1.3 Mtoe per year. Import dependency for solid fuels is very low (19% in 2010). Most of imports (83% in 2010) are sourced from outside the EEA and the main trading partner is Vietnam which accounts for more than half of total imports, although other important suppliers are the Czech Republic, Italy and Russia.
(383) European Commission, DG Energy (2012) (384) Nafta Lendava website
0.0
0.2
0.4
0.6
0.8
2006 2007 2008 2009 2010
Graph II.16.3:Slovenia - HHI index energy imports
Gas Oil Solid fuels
Source: Eurostat
Domestic lignite and brown coal resources are estimated to be around 1,174 million tonnes(385). The two mining sites for lignite are at Velenje and Trobvlje. The mine of Velenje is the bigger and more active, it is exploited by a subsidiary of the state-owned holding Slovenske Elektrarne (HSE). The mine is expected to remain operational until 2054. The mine of Trobvlje is gradually being closed down. The two sites combined accounted for almost 4.5 million tonnes of lignite and brown coal output in 2010. To expand the electricity generation capacity and meet the increase in electricity demand, HSE has decided to build a 600 MW thermal plant at Sostanj which has committed to employ the best available technologies to limit its CO2 emissions. The new block should be activated by 2014(386).
70
75
80
85
90
2006 2007 2008 2009 2010
%
Graph II.16.4:Slovenia - Non-EEA share of imports
Gas Oil Solid fuels
Source: Eurostat
(385) Eurocoal (2012) (386) Eurocoal (2012)

Part II Individual Country Files
237
16.1.1.3. Nuclear
Nuclear is the third source of energy used. In 2010 it accounted for some 20% of the energy mix. Slovenian nuclear capacity comes from one shared reactor with Croatia, Krsko nuclear power plant, which provided the country with some 3 billion kWh in 2008(387); the reactor is run by NEK, a company which is co-owned by the Slovenian state and by the Croatian company Hrvatska elektroprivreda.
The reactor has currently a total capacity of 696 MWe. A further unit of about 1,100/1,600 MWe capacity is under consideration. The cost of the construction is around EUR 5 billion and it is awaiting government approval.
16.1.1.4. Renewables
Renewable energy is the fourth source of energy in Slovenia. The country had in 2010 a 15% share of renewable energy in its energy mix, or 19.8% of gross final energy consumption(388). This share grew modestly over the last years, from 15.5% in 2006. The overall mandatory target for renewables in Slovenia, set by Directive 2009/28, is 25% by 2020.(389)
0
20
40
60
80
100
2006 2007 2008 2009 2010
%Graph II.16.5:Slovenia - Renewable mix
Hydro Biomass Wind Solar Geothermal
Source: Eurostat (387) World Nuclear Association (2012) (388) The share of renewables in the energy mix means the share
of renewable energy in gross inland energy consumption. We use this denominator consequently in the EDI to assess the share of each energy source in the energy mix. On the other hand, Member States' renewable targets for 2020 are expressed as a share of renewable sources in final energy consumption, i.e. excluding transmission, distribution and transformation losses. This explains the difference between the two figures.
(389) Republic of Slovenia (2011b)
The share of renewables is the highest in electricity generation – 32%, with an indicative target of 39.8% by 2020. Almost all of this comes from hydro power, with small quantities of electricity produced from biomass. Solar power is still very marginal whereas there is currently no significant wind power generation. The share of RES in heating & cooling is 26.6%, which is almost twice above EU average; the target for 2020 is set at 32.2%. The current share of RES in transport is 2.9%, while the target for 2020 is 10.5%.
Renewables support schemes in Slovenia are mainly based on feed-in tariffs for RES plants below 5 MW and feed-in premiums above this threshold. In addition, fiscal incentives and low-interest loans are also available for investments in RES technologies. Quota obligations exist for the heating and cooling and for the transport sectors. Biofuels also enjoy tax exemptions and reduced excise duties. The current tariffs, which are in force since 2009, have been assessed to be slightly above average generation costs for wind and below costs for solar power. This should in principle attract investors to wind power, which has been underdeveloped in Slovenia so far.
16.1.1.5. Gas
Gas is the last energy source used in Slovenia. In 2010 it represented 12% of the country's energy mix. Slovenia imports all its gas needs from a rather diversified pool of sources, although 80% comes from non-EEA States. The main trading partners are Russia and Algeria. In 2010, total consumption of gas amounted to 1,050 million cubic meters, an increase of 3% compared to the previous year, and Geoplin d.o.o. was the largest supplier, importer and trader of gas; 40% of the company is controlled by the Slovenian government. In 2010 it accounted for 94% of total gas imports.
A well-functioning and interconnected gas market with competitive and market-based prices should provide the correct incentives for further investments and signals to consumers for an efficient and sustainable use of resources. Both elements are conducive to reduce the vulnerability of the country to energy-related shocks.

European Commission Member States’ Energy Dependence
238
The gas market presents several shortcomings. The wholesale segment is highly concentrated: there are 5 active traders while Geoplin accounts for more than 70% of the market. Currently there is no gas trading platform in Slovenia. For the time-being long-term supply contracts are still dominant, although between 2009 and 2010 the share of short-term contracts went from 1% to 12% of the total. For small countries an independent fully-fledged trading platform might not be a viable solution; stronger integration with bigger neighbouring gas markets would probably be a better option.
The transmission system operator is Plinovodi, a subsidiary of the holding Geoplin. It manages a network composed of more than 1,000 km of pipes which functions also as a gas portal for neighbouring countries: in 2010 almost half of the gas received by Plinovodi was passed on to other transmission networks. The current network is often at risk of congestion: during peak demand, in January, it reaches in some stretches almost 100% exploitation. In addition Slovenia does not have gas connections with Hungary, nor does it have gas storage capacity. For this reason, development investments have been carried out by the operator to expand it. In 2010, Plinovodi allocated EUR 43 million for investment, 69% of which were devoted to expanding the capacity of the system.
In 2010, Geoplin had a retail market share of 70%. The second competitor is Energetika Ljubljana with a share of 7.5%.
In 2010, according to the Slovenian Energy Regulator, final consumers' prices were on average EUR 0.44 per cubic meter, nearly ten cents higher than the EU average. Slovenia is the 4th most expensive country in the EU for both households and industrial consumers.
16.1.2. Secondary Energy Sources
At first sight, Slovenia is a net exporter of electricity, but from the total amount of exports one should deduct half of the electricity generated by the nuclear power plant of Krsko which is officially co-owned with Croatia. Taking this aspect into consideration, Slovenia was a net importer of electricity in 2010, albeit to a very marginal extent. The electricity mix is rather diversified and is composed of nuclear (34%),
solid fuels (32%) and renewables, i.e. mostly hydro power (30%). Gas plays a very minor role in electricity generation (3%).
0
20
40
60
80
100
2006 2007 2008 2009 2010
%Graph II.16.6:Slovenia - Electricity mix
Gas Oil Nuclear Renewables Solid fuels
Source: Eurostat
Good electricity interconnections and adequate domestic infrastructure capacity are important to shelter the country from supply shocks and to enable a proper absorption of renewables. A competitive and dynamic electricity market should create the necessary investment incentives and provide the right price signals to consumers. Slovenia does not appear to have particular problems of electricity supply congestion. The peak demand in any year since 2001 has always been well below the total available capacity of the system.
However, the country still does not have connections with Hungary and the cross-border congestion management has become increasingly problematic(390) because of loop flows coming from neighbouring countries. The Transmission System Operator is Elektro Slovenija while the Distribution System Operator is SODO. The electricity exchange operator is Borzen. All three companies are state-owned. The Slovenia Energy Regulator reports that in 2010, the distribution network development investment was significantly below the planned amount (EUR 99.5 million instead of 179 million), mainly due to the declining revenues of the companies due to the crisis. On the other hand, the transmission system development investments totalled EUR 76.4 million which is almost 70% more than initially planned. Long-term plans (2009-2018) foresee
(390) European Commission (2012b)

Part II Individual Country Files
239
total investment to the transmission system of EUR 767 million and EUR 1,634 million to the distribution system. Further investments would be needed to strengthen interconnections with Italy, improving the market coupling mechanism.
The degree of concentration of the wholesale market is very high. In 2011, electricity generation was carried out by 9 main companies(391). The two major holding companies responsible for the biggest share of electricity generation, HSE and GEN, are both state-owned enterprises. HSE has a wholesale market share of 59.1% while that of GEN is 25.3%. The electricity retail market is composed of 16 suppliers. The main company, Elecktro Energija, has a market share of 25.9% while the second competitor, GEN-I, has a share of 23.1%. These shares increase slightly if we take into account only household consumers. Despite the fact that these figures suggest a more vibrant degree of competition in the retail segment than in the wholesale one, the concentration index remains high also for the retail market (HHI was equal to 0.1881 in 2010(392).
Electricity prices in 2010 were for households slightly below the EU average while for industrial operators they were in line with the EU average.(393)
16.1.3. Conclusions
Slovenia appears to be relatively well protected from potential security of supply risks. The overall import dependency is around 50% and import origins are quite diversified for all energy sources.
However, the country could further improve its situation especially in two respects. First, by creating a more competitive environment in the gas sector Slovenia would contribute to creating incentives for the deployment of the necessary investment in the network currently often at risk of congestion. Furthermore, the creation of a gas trading platform could gradually help reduce final consumers' prices which are higher than the EU average. Second, Slovenia could progressively
(391) However most of them operate within the HSE and GEN
Holdings. (392) A HHI above 0.18 indicates high concentration. (393) Eurostat (2012a)
disengage the government stakes from those sectors of the energy market where private initiatives could be promoted. This could introduce a fairer competition especially in sectors that seem to be rather closed shops at the moment (such as electricity). Benefits for consumers could come from a wider choice of suppliers and lower prices.
16.2. ENERGY AND CARBON INTENSITY
The overall energy intensity of the Slovenian economy is higher than the EU average. The country has constantly reduced its energy intensity, decreasing it by 15% between 2001 and 2010.
Table II.16.1:Energy and carbon intensity
Energy intensity of the economy 1) 231 -4.0CO2 intensity of the economy 2) 0.62 -8.1Share of energy intensive sectors in Gross Value Added 3) 12.1 -1.9
Energy intensity of the economy 1) 152 -4.7CO2 intensity of the economy 2) 0.41 -9.1Share of energy intensive sectors in Gross Value Added 3) 8.9 -0.9Source: Eurostat
2010 percentage change2006 - 2010
memo items: EU27
Notes: 1) Kg of oil equivalent per 1000 EUR, changes in percent; 2) Tonnes of CO2 equivalent per 1000 EUR, changes in percent; 3) percent of total gross value added, changes in percentage points, latest data refer to the year 2009.
The saving target to be reached by 2016 is an overall decrease in final energy consumption by 9% compared to the baseline level(394). The latest report published in October 2011 reported Slovenia has reduced its energy consumption by 2.5% compared to the baseline, meeting the interim target foreseen by the Plan. This means that the country has already achieved more than a quarter of the expected total savings in the first three years of the Plan. A consistent application of the energy efficiency measures should lead to meeting the 2016 target. Slovenia actually expects to exceed the target, reducing final energy consumption by 14% in 2016 compared to the baseline.
The carbon intensity of the economy is rather low in Slovenia and it has been steadily declining over the years suggesting a gradual shift to less-carbon intense energy sources.
However Slovenia's GHG emissions in 2010 were higher than the level that it should have (394) Republic of Slovenia (2007): The National Energy
Efficiency Plan (NEEAP) runs for the period 2008 – 2016, the baseline consumption level, against which savings are compared, is the average consumption between 2001 and 2005 which in Slovenia equalled 47.349 GWh.

European Commission Member States’ Energy Dependence
240
been according to the Kyoto Protocol(395); the reduction compared to 1990 was only of 4% while it should have been double. Slovenia is also one of the only two countries whose emissions per capita have increased between 1990 and 2010, going from 9 to 10 tCO2-eq.
In the context of the Effort Sharing Decision(396), Slovenia is expected to limit its GHG emissions in the non-ETS sectors to an increase of 4% by 2020 compared to 2005 levels. However current projections show that without additional policy measures the country will miss its target increasing the emissions by 13%(397).
0.60
0.62
0.64
0.66
0.68
0.70
220
225
230
235
240
245
2006 2007 2008 2009 2010
Graph II.16.7:Slovenia - Energy and carbon intensity of the economy
Energy intensity (lhs) CO2 intensity (rhs)
kgoe/1000 EUR ton CO2 eq./1000EUR
Source: Eurostat
The share of GHG emissions falling under the ETS is 41%, about the same as the EU average of 40%. While allowances have so far been allocated for free, they will have to be auctioned in the third phase of the ETS starting in 2013 when there will also be an EU-wide emission cap. This may have important impacts on the Slovenian energy sector which accounts for 84% of total emissions and which in recent years has been emitting consistently more than the indicative national emission cap allocated to it(398). The auctions will imply higher generation costs that will be most likely passed-through to consumers in the form of higher electricity bills. However the currently low carbon prices might mitigate impacts on consumers.
(395) European Environment Agency (2011) (396) Decision 406/2009/EC (397) European Commission (2012a) (398) European Commission (2012c)
16.2.1. Industry
The energy intensity of industry is just a little above the EU average. This comes somehow as a surprise considering the very high share of energy-intensive sectors in the total gross value added, which is among the five highest in the EU. Slovenia has a specialization in chemical and basic metals industries whose gross value added is significantly higher that the EU average, however their energy intensity is in line with the EU average(399).
2.15
2.20
2.25
2.30
2.35
175
190
205
220
235
2006 2007 2008 2009 2010
Graph II.16.8:Slovenia - Energy intensity of industry, carbon intensity of energy use
Energy intensity of industry (lhs)CO2 intensity of energy use (rhs)
kgoe/1000 EUR ton CO2 eq./1000EUR
Source: Eurostat
Furthermore it is important to note that the energy intensity of the industrial sector in Slovenia has been constantly decreasing over the past years despite the fact that the final energy consumption of industries has actually increased. This suggests that the Slovenian industries have been able to decouple their production from energy use.
The expected savings for the industrial sector constitute 23% of the total expected savings and represent a reduction of the final energy consumption of the sector of 0.8% by 2016 compared to the baseline level. In 2010 Slovenian industries had already achieved more than a third of the total expected savings. Measures to achieve the targets are in the form of financial incentives for technology upgrade and energy efficiency investments. An ad hoc fund called the Eco Fund will provide loans for environmental investments(400).
(399) Eurostat (2012b) (400) Republic of Slovenia (2011a)

Part II Individual Country Files
241
The carbon intensity of the energy use is more or less in line with the EU average and remained constant since 2006. The widespread use of solid fuels in the country's energy mix seems to be offset by an equally important share of nuclear energy and by a significant employment of renewables.
16.2.2. Transport
The energy intensity of the transport sector is among the highest in the EU and it has constantly increased since 2005 except for the most severe period of the economic crisis between 2008 and 2009.
2.20
2.30
2.40
2.50
2.60
750
780
810
840
870
2006 2007 2008 2009 2010
Graph II.16.9:Slovenia - Energy and carbon intensity of transport
Energy intensity (lhs) CO2 intensity (rhs)
kgoe/1000 EUR ton CO2 eq./1000EUR
Source: Eurostat
One possible explanation is the sharp decline of railway freight services in favour of road transport in the past twenty years. In addition, the railways themselves have been underperforming. The sectoral energy savings have been particularly unsatisfactory according to the Slovenian authorities, contributing to further increases of the energy intensity of the transport sector.
The expected savings in the transport sector by 2016 amount to 36% of total savings, the largest share among the sectors considered. Final energy consumption of transport should be reduced by about 10% in 2016 compared to baseline. The latest report shows that only one fifth of the expected savings have been achieved(401), clearly indicating that efforts in this sector have been less successful than in the other sectors. Measures to achieve this target include mainly promotion of inter-modality, upgrading and development of the
(401) Republic of Slovenia (2011a)
railway network and promotion of local public transport to counter the increasing number of private vehicles.
The carbon intensity of the transport sector is also very high. In 2010 it was the second highest in the EU and it does not seem to be on a declining path as it actually increased compared to 2005 levels. Transport GHG emissions appear to be most critical: in 2009, despite a marked decline due to the slowdown economic activities, they were still 162% higher than the base year level and they represented nearly 30% of total Slovenian emissions(402).
16.2.3. Households
Households' energy intensity is in line with the EU average. The energy consumption and the energy intensity of households in Slovenia have followed a similar pattern over the years: after a period of almost constant decline in both dimensions between 2001 and 2007, they picked up again and in 2010 they were back to the pre-crisis level. This suggests that energy efficiency improvements by households have been rather modest. One reason for this shortcoming could be the fact that the programme for efficient electricity use in households (foreseen by the first NEEAP) that should have yielded the bulk of the energy savings in households between 2008 and 2010, never started for lack of funds.
0.20
0.23
0.26
0.29
0.32
0.35
60
63
66
69
72
75
2006 2007 2008 2009 2010
Graph II.16.10:Slovenia - Energy and carbon intensity of households
Energy intensity (lhs) CO2 intensity (rhs)
kgoe/1000 EUR ton CO2 eq./1000EUR
Source: Eurostat
The NEEAP expects to reduce final energy consumption by 11% by 2016 compared to the (402) Slovenian Institute of Macroeconomic Analysis and
Development (2011)

European Commission Member States’ Energy Dependence
242
baseline level. Savings from households should amount to 22% of total expected savings. According to the latest report in 2010 a quarter of the expected savings was achieved. The main measures to achieve these targets should be financial incentives for efficient heating systems (accounting for almost half of the expected savings) and incentives for energy-efficient renovation (about 27% of the expected savings). Households will have access to the loans facility of the Eco Fund. Further increase of the coverage of district heating is also envisaged, combined more and more with CHP and the use of renewables. In terms of CHP, the aim is to reach 18% in gross energy end-use by 2020. Currently, the district heating system in Slovenia is relatively well developed, serving about 17% of citizens(403), although, according to the NEEAP, it incurs losses of about 15% of the gross heat generation.
Households' carbon intensity appears problematic: it is the highest in the EU and it was not significantly reduced in the past ten years. This could be explained by the fact that nearly 60% of heating for households still comes from fossil fuels(404).
At the same time the weight of energy items in the HICP basket is one of the highest in the EU, suggesting that Slovenian consumers will be relatively more exposed to any change in energy prices than most of their European counterparts.
16.2.4. Conclusions
Slovenia stands out for its high level of CO2 emissions, especially coming from households and transportation. Stronger incentives for cleaner energy sources will be needed in order to meet the EU and international requirements in terms of GHG reductions. Particularly problematic appears to be the transport sector. The position of the country makes it a natural passage way for freight services travelling across Central and Eastern Europe and this makes it even more difficult to tackle the issue of CO2 emissions.
However, margins for improvement exist, especially through a stronger promotion of railway
(403) Euroheat and Power (2009) (404) National Energy Regulator of the Republic of Slovenia
(2010)
services and local public transport. Finally, the renewable support levels are low; hence a partial increase could be feasible, bringing long-term benefits to consumers and the environment.
16.3. CONTRIBUTION OF ENERGY PRODUCTS TO TRADE
16.3.1. Net energy trade balance
Slovenia has one of the highest energy trade deficits in the EU. It increased from 3.5% in 2001 to 6.3% of GDP in 2011. The very high oil deficit seems to be the main driver behind this performance; it rose from 2.8% in 2001 to 5.4% of GDP in 2011. This happened on the back of a slowdown of the economy. The gas trade deficit on the other hand remained rather constant over the years, around 1% of GDP, while Slovenia became a net exporter of electricity.
-8
-6
-4
-2
0
-10
-5
0
5
2007 2008 2009 2010 2011
% of GDP% of GDP
Graph II.16.11:Slovenia - Trade balance of energy products and CA
CA (lhs) Oil (rhs)Gas (rhs) Total (rhs)
Source: Eurostat
The importance of the energy trade deficit for Slovenia's overall economic performance must be assessed against the background of the country's current account. Over the period 2007-2011, in particular from 2008 to 2009, Slovenia has successfully reduced its sizeable current account deficit. Hence, currently, Slovenia's sizeable energy trade deficit is combined with a moderate current account deficit, namely 1.1% of GDP in 2011. The trade surplus for the other product categories can be seen as compensating for a large part of the energy trade deficit.

Part II Individual Country Files
243
In spite of the absence of a direct empirical link between energy trade and current account deficit movements over time, Slovenia should nonetheless pursue with determination adjustments towards a less oil-dependent economy in order to shelter itself from potential severe imbalances in the event of a deterioration of the current account.
16.3.2. Decomposition of the net energy trade balance
The energy trade balance can be decomposed into three multiplicative factors, namely the relative energy trade balance (i.e. the share of net exports in energy products in total cross-border energy trade), the share of energy in total trade, and macro openness to trade (i.e. the ratio of total trade to GDP).
Table II.16.2:Decomposition of Energy Trade Balance
2007 2008 2009 2010 2011Energy trade balance (% GDP) -4.7 -6.3 -4.0 -5.1 -6.3Relative trade balance (%) -65.7 -64.2 -57.4 -53.2 -47.0Share of energy in total trade (%) 5.6 7.5 6.6 7.6 9.7Macro trade openness (% GDP) 130.1 129.9 106.2 125.6 139.5Source: Eurostat
In 2011, the relative energy trade deficit was somewhere in the middle of the EU ranking. It has made marked improvements over the decade from a level of 80.5% in the year 2000 and the current level of 47%. However, the improvement of the relative energy trade balance has been more than compensated by the increased share of energy in total trade which almost doubled (from 4.7% in 2000 to 9.7% in 2011) and by an increase of the macro trade openness of the country which went from 95% in 2000 to the current 139%, one of the highest levels in the EU. This points to the growing importance of energy trade for overall trade and for the whole economy. Any imbalance in this dimension is therefore more likely to impact negatively on the entire economic performance. The increased exposure to international (energy) trade constitutes an additional reason to closely monitor the currently worsening energy trade deficit.
16.3.3. Conclusions
Slovenia appears to be among the most vulnerable countries in the EU as far as the external dimension of energy dependency is concerned. Slovenia has one of the highest energy trade deficits in the EU which has significantly
increased over the last decade. The increase from 2007 onwards in both the share of energy trade in total trade and macro-trade openness suggests that Slovenia's economy is particularly exposed to energy price and supply shocks through the deterioration of the terms of trade and ensuing external imbalances. While the successful reduction of a once sizeable current account deficit puts these risks into context, the mitigation of the particularly large trade deficit for oil should be a priority.
16.4. REFERENCES
Eurocoal (2012), Country Profile - Slovenia, available from: http://www.euracoal.be/pages/layout1sp.php?idpage=80
Euroheat and Power (2009), District Heating and Cooling Statistics - Slovenia, available from: http://www.euroheat.org/Slovenia-94.aspx
European Commission, Directorate-General for Energy (2012), Country Factsheets – EU 27 Member States, Energy Figures by Country, available from: http://ec.europa.eu/energy/observatory/countries/countries_en.htm
European Commission (2012a), Annual Growth Survey 2013, Europe 2020 targets: climate change and energy, COM (2012) 750 of 28 November
European Commission (2012b), Making the Internal Energy Market Work, COM/2012/663, SWD/2012/367 and 368 of 15 November
European Commission (2012c), Progress towards achieving the Kyoto Objectives, COM (2012) 626 of 24 October.
European Environment Agency (2011), GHG Trends and Projections in Slovenia, Greenhouse gas emission trends and projections in Europe 2011 – Tracking progress towards Kyoto and 2020 targets, 7 October
Eurostat (2012a), Energy statistics – Prices, available from: http://epp.eurostat.ec.europa.eu/portal/page/portal/energy/data/main_tables
Eurostat (2012b), Energy statistics – Main indicators, available from: http://epp.eurostat.ec.europa.eu/portal/page/portal/energy/data/main_tables
Nafta Lendava Website: http://www.nafta-lendava.si/
National Energy Regulator of the Republic of Slovenia - Javna agencija RS za energijo (2010), Report on the Energy Sector in Slovenia for 2010
National Energy Regulator of the Republic of Slovenia - Javna agencija RS za energijo (2011), Report on the Energy Sector in Slovenia for 2011
Republic of Slovenia (2007), First National Energy Efficiency Action Plan, available from: http://ec.europa.eu/energy/efficiency/end-use_en.htm
Republic of Slovenia (2011a), Second National Energy Efficiency Action Plan, available from:

European Commission Member States’ Energy Dependence
244
http://ec.europa.eu/energy/efficiency/end-use_en.htm Republic of Slovenia (2011b), National Renewable Energy Action Plan 2010-2020, available from: http://ec.europa.eu/energy/renewables/action_plan_en.htm
Slovenian Institute of Macroeconomic Analysis and Development (2011), Development Report 2011, 20 July
World Nuclear Association (2012), Nuclear Power in Slovenia, available from: http://www.world-nuclear.org/info/default.aspx?id=370&terms=slovenia

17. SLOVAKIA
245
17.1. SECURITY OF ENERGY SUPPLY
In 2010, Slovakia's import dependency was 63%, ten p.p. higher than the EU average. Slovakia has one of the most diversified energy mix in the EU almost equally divided among gas, nuclear, oil and solid fuels and with a smaller proportion of renewables.
55
70
85
100
115
2006 2007 2008 2009 2010
%Graph II.17.1:Slovakia - Import dependence
Gas Oil Solid fuels Total
Source: Eurostat
Key Insights
Security of Energy Supply:
- Slovakia has an import dependency which is ten points above the EU average however it has a well-diversified energy mix, almost equally divided among gas, nuclear, oil and solid fuels.
- However, the high import dependency for gas and oil gives rise to some concerns because it is combined with a very limited pool of import sources, mainly non-EEA countries.
- The country's electricity market is characterised by the high market shares of incumbents and high regulated prices due also to environmentally-harmful subsidies. Investment incentives might be limited due to the lack of effective competition.
Energy and Carbon Intensity:
- Slovakia is among the most vulnerable Member States as far as energy and carbon intensities are concerned, due to the high share of energy-intensive sectors in the economy and the high energy- and carbon-intensive transport sector.
- However, progress has been made, especially in the households sector. Further efforts would be needed to improve the efficiency of the Slovakian industries and to promote cleaner transport modes.
- The level of support to renewable energies has recently increased significantly, driving up the electricity network costs.
Trade balance for energy products:
- The size of Slovakia's energy trade deficit is a matter of concern. The trade deficit of the gas sector appears the most problematic aspect because of the complete reliance on Russia for gas imports which means that the security of Slovakia's supply and its sustainability depend ultimately and solely on Russian energy policies.
- There are some mitigating elements. In particular, the positive current account suggests that non-energy trade components are for the time being offsetting the energy trade deficit. In addition, the size of energy trade in total trade is still small, although it has been constantly increasing over the past five years.

European Commission Member States’ Energy Dependence
246
17.1.1. Primary energy sources
17.1.1.1. Gas
Slovakia's first source of energy is gas. In 2010 it accounted for 28% of the energy mix. This share has been declining compared to 2000 when it amounted to 32% of the energy mix(405).
99% of Slovakia's gas needs of are imported and the only supplier is Russia. Only a negligible quantity of gas is domestically produced, 0.09 MToe (a little less than 100 million cubic meters) in 2009(406). The gas storage capacity in Slovakia is managed by two companies. The two companies combined have storage facilities able to store up to 2.78 billion of cubic meters. In comparison it is worth mentioning that the total transmitted gas was 71.4 billion cubic meters in 2010, of which 6.2 billion cubic meters were for domestic consumption(407). The volume of transmitted gas decreased in 2011 and 2012 due to start of operation of the Nordstream pipeline.
0
20
40
60
80
100
2006 2007 2008 2009 2010
%Graph II.17.2:Slovakia - Energy mix
Gas Oil Nuclear Renewables Solid fuels
Source: Eurostat
A well-functioning and interconnected gas market with competitive and market-based prices should provide the correct incentives for further investments and signals to consumers for an efficient and sustainable use of resources. Both elements are conducive to reducing the vulnerability of the country to energy-related shocks. Slovakia's gas network currently lacks interconnections on the north-south axis with (405) Although it has slightly increased compared to 2009 when
it was 26%. (406) European Commission, DG Energy (2012) (407) International Energy Agency (2011)
Hungary and Poland. This bottleneck substantially reduces possibilities for diversifying import sources; the existing pipelines passing through Slovakia come from Russia through Ukraine and reach the Czech Republic and Austria. Eustream(408) has started construction of another interconnection line with Hungary, which should begin its operation in 2014, and an additional interconnection with Ukraine, for which the bidding phase is now open. Eustream's investment plan to upgrade the transmission system foresees investments of about 360 million euros over the next five years(409).
0.0
0.2
0.4
0.6
0.8
1.0
2006 2007 2008 2009 2010
Graph II.17.3:Slovakia - HHI index energy imports
Gas Oil Solid fuels
Source: Eurostat
Price regulation for households and market concentration are the main features of Slovakia's gas market. Slovenský plynárenský priemysel, a.s. (SPP) is the incumbent gas operator in Slovakia. It is a state-controlled company(410) which maintains the highest share in the Slovakian market(411). In 2011, SPP supplied 90% of Slovakia's households and had an overall share of 70% in the wholesale market(412). However, following the liberalization of the gas market in 2007, SPP has seen its share declining(413). SPP has two subsidiaries, SPP – distribucia and
(408) Eustream is an independent transmission system operator. (409) www.eustream.sk (410) Managing rights together with 49% of shares are held by
Slovak Gas Holding B.V. (a consortium of GDF Suez and E.ON Ruhrgas).
(411) While the Regulatory Office for Network Industries of Slovakia asserts that there are 5 active gas trading companies in the market, the European Energy Regulator database shows that there are only 2 companies with a market share above 5% and that they control 99% of the wholesale market.
(412) Slovensky Plynarensky Priemsyel (2011) (413) Slovensky Plynarensky Priemsyel (2011)

Part II Individual Country Files
247
Eustream TSO. SPP – distribucia is the main Distribution System Operator in Slovakia which supplies 1.5 million consumers; it owns and operates the distribution network composed of more than 31.000 km of pipelines. Price regulation still applies to household consumers and this might partly explain why the segment remains insulated from further competition(414). Industrial consumers' prices are among the lowest in the EU, while for households the price level in PPS is in line with the EU average(415).
17.1.1.2. Solid fuels
The second source of energy used in Slovakia is solid fuel. It accounted for 22% of the country's energy mix in 2010 and 76% of Slovakia's needs are covered by imports. The pool of import countries is quite varied and includes mainly other EU Member States, Russia, the USA and Ukraine. Domestic production of solid fuels accounted for some 0.6 Mtoe in 2009 and has decreased significantly over the past 20 years (it was 1.4 Mtoe in 1990). At the same time, the share of solid fuels in the country's energy mix also declined substantially, from 36% in 1990 to 23% in 2010. Lignite resources are estimated to be around 420 million tonnes; in addition, some 500 million tonnes could become available in the future. By comparison, around 2.3 million tonnes of lignite were produced in 2010(416). There are five lignite mines active in Slovakia, located in the southern and western parts of the country.
80
85
90
95
100
2006 2007 2008 2009 2010
%
Graph II.17.4:Slovakia - Non-EEA share of imports
Gas Oil Solid fuels
Source: Eurostat
(414) The independence and transparency of the Slovak regulator
(URSO) also appears to be a matter of concern. (415) Eurostat (2012) (416) Eurocoal (2012)
17.1.1.3. Nuclear
Nuclear is the third source of energy used in Slovakia. With a 21% share in the energy mix, Slovakia is one of the five countries with the highest nuclear energy share in the EU. Slovakia has four active nuclear reactors which generate some 60% of the total domestic energy production of the country and 52% of the country's electricity. Two more nuclear units were shut down at the beginning of 2006 as a precondition for the country's accession to the EU.
The closure of the two units created a sudden electricity shortage for Slovakia which went from being a net electricity exporter to a net importer. Two new reactors are currently being built; the projects are expected to be completed by 2013/2014. By 2020-2025 another reactor should also become operational. Uranium is currently supplied by a Russian company. However, Slovakia is also exploring its domestic mines for uranium supply. Estimated deposits are about 12,900 tonnes U3O8(417).
17.1.1.4. Oil
21% of Slovakia's energy mix is composed of oil. This is a relatively small share, the second lowest in the EU. Import dependency was 89% in 2010 compared to 95% in 2006. At the same time, the country does not have a well-diversified pool of import sources. In 2010 most of the country's imports came from Russia and only 18% from EEA countries(418). Total oil demand in Slovakia equalled 3.7 Mtoe in 2010, and the transport sector is the largest single user, consuming 50% of it.
Crude oil is refined by the only active refinery and sold as petroleum finished products mainly to the Czech Republic and Austria, making Slovakia a net exporter of refined products. Domestic oil sources are scarce - 500 barrels per day - and they are expected to be completely depleted after 2017(419). Currently only the Russian pipeline of Druzhba supplies oil to Slovakia. However, the country is exploring new import options via the trans-alpine pipeline supplied by the port of Trieste. Import capacity on this line is currently (417) World Nuclear Association (2012) (418) The Slovakian government has a contract with the Russian
government for the supply of up 6 Mt a year until 2014. (419) International Energy Agency (2011)

European Commission Member States’ Energy Dependence
248
too limited to constitute a viable alternative to the Russian pipes but future expansion projects could be foreseen by the government(420). Oil storage facilities have a capacity of 1.4 million cubic meters.
17.1.1.5. Renewables
Renewable energy is the least used energy source in Slovakia, accounting for some 8% of the energy mix, or 9.8% of final energy consumption(421). RES are the second source in terms of domestic production, after nuclear, representing about 20% of the country's domestic energy output. The share of renewables in final energy consumption increased over the last years, from 6.6% in 2006. The overall mandatory target for renewables in Slovakia, stipulated in the renewables directive, is 14% by 2020.(422)
0
20
40
60
80
100
2006 2007 2008 2009 2010
%Graph II.17.5:Slovakia - Renewable mix
Hydro Biomass Wind Solar Geothermal
Source: Eurostat
The share of renewables in electricity generation is 23%, or 17.8% in final electricity consumption. Hydropower is the most common source of renewable electricity in Slovakia(423), with a lower share of biomass. The recent jump in solar power generation capacity could help meet
(420) International Energy Agency (2011) (421) The share of renewables in the energy mix means the share
of renewable energy in gross inland energy consumption. We use this denominator consequently in the EDI to assess the share of each energy source in the energy mix. On the other hand, Member States' renewable targets for 2020 are expressed as a share of renewable sources in final energy consumption, i.e. excluding transmission, distribution and transformation losses. This explains the difference between the two figures.
(422) Republic of Slovakia (2011b) (423) Republic of Slovakia (2011b) – pg. 6: Hydro accounts for
90% of all plants using RES.
this target(424). However this boom in solar energy has caused imbalances in the electricity network that are further discussed in the following chapters. Heating relies exclusively on biomass and RES accounted for 8% of total heat generation in 2010. The indicative 2020 target envisaged by the National renewable energy action plan for Heating and Cooling is 14.6%. Slovakia has a well-developed system of district heating, meeting almost 60% of its consumption; the government intends to further exploit it to increase the amount of RES in the heating and cooling sector. A considerable increase in RES has been registered in the transport sector, which went from having 0.6% renewables in 2005 to 7.8% in 2010. The 2020 target for the transport sector is 10%. The government expects to meet its target mainly through the promotion of second-generation biofuels.
The renewable support scheme in Slovakia consists mainly of feed-in tariffs (+ and an additional payment(425), purchase obligations and tax exemptions(426). According to the National Renewable Energy Action Plan the RES production between 2010 and 2020 should grow from 5.481 GWh to 8.000 GWh in order to meet the country's binding targets. This is an ambitious increase, which will require adequate and sustainable investments.
For the moment, problems of two different natures seem to have arisen. First there are difficulties in connecting the RES plants to the electricity grid either for the lack of technical capacity of the distribution network or for long and burdensome authorization procedures. The energy regulator is indicating that there is a lack of resources for the investments needed to adapt the distribution network. Second the initial design of the support scheme, which promoted also solar plants with capacity above 100kW, has led to the creation of
(424)
http://www.finance.gov.sk/Components/CategoryDocuments/s_LoadDocument.aspx?categoryId=7936&documentId=6283
(425) The difference between the market price proxy and the RES tariffs determined by the Regulator.
(426) Electricity generated from renewable sources is exempt from excise tax. http://www.res-legal.de/en/search-for-countries/slovakia/more-about/land/slowakei/ueberblick/foerderung.html

Part II Individual Country Files
249
several very large solar power plants(427) that in turn have enormously increased the network costs and subsequently electricity bills (see below chapter on electricity).
The Slovak government has intervened amending the Renewable Act in November 2011 and abolishing the promotion of plants exceeding 100 kW to encourage installation of smaller plants. Now, only plants below 10MW are eligible for the additional payment. In addition, in 2011 the energy regulator has lowered by 68% the amount of the feed-in tariffs for solar energy plants, to improve cost-efficiency of the support scheme.
17.1.2. Secondary energy sources
Slovakia went from being a net exporter of electricity to being a net importer following the closure of two nuclear reactors. In 2010 Slovakia imported 4% of its electricity needs mainly from the Czech Republic, Poland and Ukraine. The electricity mix is rather diversified when compared to the other EU countries, although it relies mostly on nuclear (52%) and to a smaller extent on renewables (23%), solid fuels (13%) and gas (10%). Oil plays a negligible role, only 2%. Total electricity consumption in 2010 was 5% higher than in the previous year but still below the pre-crisis level.
0
20
40
60
80
100
2006 2007 2008 2009 2010
%Graph II.17.6:Slovakia - Electricity mix
Gas Oil Nuclear Renewables Solid fuels
Source: Eurostat
Good electricity interconnections and adequate domestic infrastructure capacity are important to shelter the country from supply shocks and
(427) Since the beginning of the support scheme in 2009
electricity production from PV increased from 0 to 483MW above the 2020 target of the NREAP of 300MW
to enable a proper absorption of renewables. A competitive and dynamic electricity market should create the necessary investment incentives and provide the right price signals to consumers. Currently Slovakia has interconnections with Hungary, Poland, the Czech Republic and Ukraine. The transmission system is affected by the loop flows which originates in Germany and are passed through to Poland, the Czech Republic and Slovenia. Adequate upgrade and maintenance of the network should be undertaken to avoid congestion problems arising from the loop flows(428).
High end-users' prices, regulated prices for households and weak competition characterized the Slovakian electricity market. The Electricity transmission system operator is Slovenska elektrizacna (SEPS), a 100% state-owned enterprise. The main Distribution System Operators are three, operating in three different regions of the country. All three of them are 51% owned by the state(429). The retail market remains still rather concentrated, considering that the three main companies vertically integrated with the above- mentioned regional distributors represent around 70% of the market(430).
The main electricity generator has a market share of about 72%(431) and it is the only generator with a market share above 5%(432). The company produces almost 85% of its electricity without fossil fuels, exploiting either nuclear power or renewables(433). OKTE is the electricity exchange operator in charge of managing the short-term electricity market. Since 2009, the Slovak market has been coupled to the Czech market. The CZ-SK market coupling has been extended to Hungary as of 11 September 2012.
The final electricity prices are regulated(434). Currently, electricity prices for both industrial
(428) European Commission (2012b) (429) There is a general shortage of data on market concentration
for the electricity sector in the Regulator's report (English version). However the Regulator reported that at local level smaller distributors are spreading for connection points with less than 100,000 customers
(430) Regulatory Office for Network Industries (2011) (431) European Commission (2012b) (432) According the European Energy Regulator database (433) http://www.seas.sk/en/the-company/about-us/slovenske-
elektrarne (434) Regulatory Office for Network Industries (2011)

European Commission Member States’ Energy Dependence
250
users and households are the fourth highest in the EU(435) (in PPS terms). Already in 2007-2008, electricity prices were among the highest in the EU and their increase was above the EU average between 2007 and 2011 (above 20% against 16% in the EU)(436).
The decomposition of electricity prices helps to understand which factors contributed to the recent increases (excluding taxes). Between 2010 and 2012, network charges increased in order to cover expenses related to support for generation from renewable sources: the RES component of the tariff for System Operation went from EUR 1.7 per MWh to EUR 11.9 per MWh(437). The main reason for this jump is related to the sudden increase in solar generation capacity which went from virtually zero to 2% of total electricity generation in the space of one year(438).
Interestingly, between 2010 and 2011, the component covering transmission and distribution losses decreased both for distribution (-2.71%) and for transmission (-3.58%). Finally, another component of the network costs covers domestic lignite-fired generation. This support to an environmentally-harmful energy source increased between 2010 and 2011 from EUR 3 per MWh to EUR 3.6 per MWh, but went down to 2.2 EUR per MWh in 2012. This component constitutes around 15% of the system operation tariff. In 2011, network costs accounted for 53% of total electricity prices (excluding taxes) for households and 51% for industrial customers (EU average above 40% for households and 30% for industrial customers)(439).
17.1.3. Conclusions
Slovakia has an import dependency 10 pp above the EU average but it has a well-diversified energy mix. This contributes to mitigating the risks of potential security of supply shocks. The high import dependency for oil and gas gives rise to some concerns because it is combined with a (435) Eurostat (2012) (436) Electricity prices excluding taxes and VAT. (437) Regulatory Office for Network Industries (2011) (438) Oko-Institut (2012) (439) In general, the share of network costs is lower for industrial
customers as large industries can be directly connected to the transmission network. Contrary to other countries, Slovakia applies the same network charge to households and industrial customers (Eurostat data).
very limited pool of import sources, especially because the import sources are mainly non-EEA countries. Supply shocks or price surges could therefore impact negatively on the country which would have limited alternatives for its supply of gas and oil.
The electricity and gas markets are characterized by the high market shares of the incumbents, relatively high and regulated prices, especially for electricity, and the lack of effective competition which may hamper investment incentives. It will also become more and more strategic for Slovakia to develop a better functioning gas wholesale and retail market, to enhance interconnections with neighbouring countries, primarily Hungary and Poland, and to explore other import sources rather than relying exclusively on long-term contracts with Russia. In addition, environmentally-harmful subsidies to lignite should be gradually phased out.
17.2. ENERGY AND CARBON INTENSITY
Slovakia is one of the most energy-intensive countries in the EU. However, the situation has been slowly, but steadily, improving. The energy intensity of the economy decreased by 40% between 2001 and 2010 signalling major improvement in the efficient use of energy sources. The National Energy Action Plan (NEEAP) runs for the period 2008-2016. The savings target to be reached by 2016 is an overall decrease in final energy consumption (FEC) by 9% compared to the baseline(440).
Table II.17.1:Energy and carbon intensity
Energy intensity of the economy 1) 371 -18.2CO2 intensity of the economy 2) 0.95 -22.2Share of energy intensive sectors in Gross Value Added 3) 13.3 -4.2
Energy intensity of the economy 1) 152 -4.7CO2 intensity of the economy 2) 0.41 -9.1Share of energy intensive sectors in Gross Value Added 3) 8.9 -0.9Source: Eurostat
2010 percentage change2006 - 2010
memo items: EU27
Notes: 1) Kg of oil equivalent per 1000 EUR, changes in percent; 2) Tonnes of CO2 equivalent per 1000 EUR, changes in percent; 3) percent of total gross value added, changes in percentage points, latest data refer to the year 2009.
(440) Republic of Slovakia (2007): The baseline consumption
level, against which savings are compared, is the average
consumption between 2001 and 2005, which in Slovakia equalled 312 200 TJ (excluding the share of ETS companies, which were left out of national energy saving target calculations, at the request of the Commission).

Part II Individual Country Files
251
The Slovakia's 2010 energy saving target has not been met. The latest report published in October 2011 stated that Slovakia had achieved in 2010 only a 1.2% reduction in FEC relative to the baseline. This suggests that Slovakia is unlikely to meet its 2016 target, given that savings of only 2.7% of the baseline have been planned for the next three 3-year period (2011-2013). However, the report has stated that the energy savings of several measures implemented between 2008 and 2010 are yet to be quantified. Hence, the actual savings achieved during the first 3 years of the NEEAP might exceed those which have been reported.
The carbon intensity of the Slovakian economy was among the highest in the EU in 2010. However, it has decreased by almost 40% since 2001. The high intensity appears to be the consequence of the poor performances of the transport sector more than anything else, while the carbon intensities of households and of energy use are among the lowest in the EU.
According to the European Energy Agency, at the end of 2010, Slovakia was on track to meet its Kyoto requirements. Overall GHG emissions stood 37% below the base-year level, already offsetting the Kyoto target of – 8% for the period 2008-2012. Emissions per capita have been reduced significantly going from 14 tCO2-eq in 1990 to 8 tCO2-eq in 2010, a level below the EU12 and EU27 averages(441).
0.85
0.95
1.05
1.15
1.25
360
380
400
420
440
460
2006 2007 2008 2009 2010
Graph II.17.7:Slovakia - Energy and carbon intensity of the economy
Energy intensity (lhs) CO2 intensity (rhs)
kgoe/1000 EUR ton CO2 eq./1000EUR
Source: Eurostat
The latest projections show that Slovakia will be able to meet its 2020 targets under the Effort (441) European Commission (2012c)
Sharing Decision(442). In the context of the EU climate agenda, Slovakia is expected to limit its emissions to an increase of 13% in the non-ETS sectors by 2020 compared to 2005 levels; the level of emissions in 2020 is foreseen to be the same as in 2005 level, hence a 0% increase(443).
The share of GHG emissions falling under the Emission Trading Scheme is 47%, above the EU average of 40%. Emission allowances have so far been allocated for free but during the third phase of the ETS starting in 2013 there will be an EU-wide emissions cap and allowances will have to be auctioned. Unlike other EU12 Member States, Slovakia will not have a derogation for the power sector which will have to auction its emissions allowances. The potential impacts on energy prices of the auctioning might however be relatively limited by the low carbon intensity of the Slovakia power sector: emissions from combustion installation account for only 37% of total emissions(444), compared to countries such as Czech Republic or Estonia where power sector's emissions are 90% of more of the total. In addition over the past three years the ETS sectors in Slovakia have been emitting considerably below the national cap for 2008-2012(445).
17.2.1. Industry
In 2010, Slovakia's energy intensity of industry was one of the highest in the EU, and has slightly increased since 2006. This is a consequence of the fact that the country has one of the highest shares of energy intensive industries in total gross value added. Some of the most important sectors in Slovakia are the automotive, the chemical engineering and the machinery construction. Metallurgy is also a very important sector in Slovakia, the gross value added of which is almost double the EU average. The industrial energy consumption in 2009 was 14% lower than the baseline.
(442) Decision 406/2009/EC (443) European Commission (2012a) (444) European Environment Agency (2011) (445) European Commission (2012c)

European Commission Member States’ Energy Dependence
252
1.70
1.75
1.80
1.85
1.90
280
300
320
340
360
380
2006 2007 2008 2009 2010
Graph II.17.8:Slovakia - Energy intensity of industry, carbon intensity of energy use
Energy intensity of industry (lhs)CO2 intensity of energy use (rhs)
kgoe/1000 EUR ton CO2 eq./1000EUR
Source: Eurostat
According to the second NEEAP the industrial sector should account for 34% of the total expected energy savings by 2016. For the period 2011-2013, it has been allocated 30% of total savings planned(446). Measures to promote these savings will mainly focus on innovation and technology transfers and on increasing efficiency of the industrial production processes. However, the bulk of the savings should come from low-cost measures identified by companies once the mandatory energy audits foreseen by the Energy Efficiency Act, have been carried out (deadlines are end of 2011 and end of 2013).
Carbon intensity of energy use is one of the lowest in the EU. This appears to be a consequence of the high share of carbon-free sources in the electricity mix, which as recalled in §1.2 relies mostly on nuclear and renewables. The low carbon intensity of the energy sector in Slovakia might prove to be particularly beneficial during the third phase of the ETS when emission allowances will have to be auctioned, as seen in the previous paragraph.
17.2.2. Transport
In 2009, the energy intensity of the transport sector was well above the EU average. The intensity has more or less remained constant in the past 5 years, having decreased by less than 8% since 2005. However, the FEC of the transport sector in 2009 was 20% higher than in 2005. This means that the productivity of the sector has increased over the same period of time. (446) Only for non ETS sectors.
1.85
1.95
2.05
2.15
2.25
725
755
785
815
845
875
2006 2007 2008 2009 2010
Graph II.17.9:Slovakia - Energy and carbon intensity of transport
Energy intensity (lhs) CO2 intensity (rhs)
kgoe/1000 EUR ton CO2 eq./1000EUR
Source: Eurostat
The expected energy savings in the transport sector by 2016 amount to 18% of total planned savings. Only around a quarter of these savings had been achieved by 2010, with a further 18% planned for the period 2011-2013. This suggests that the sectoral savings target is unlikely to be reached by 2016, although almost half of all funding for energy efficiency measures planned for 2011-2013 will be allocated to transport. The biggest share of savings is expected to come from the construction and upgrade of transport infrastructure, mainly motorways and expressways. Other measures to achieve this target include the promotion of public transportation both at national level, through the upgrade of the railway network, and at local level to decrease the number of private vehicles. At the same time, the exploitation of cleaner fuels will be promoted as well as the renewal of the car fleet. Finally the interconnection of the various transport modes will be enhanced(447).
In terms of carbon intensity, the transport sector is a particularly poor performer, well above the EU average in the period 2006-2010. This could derive from the inevitable predominance of fossil fuels in the sector, from the still relatively marginal (albeit increasing) uptake of renewables and from the significant shift from railways to roads as regards the freight services(448). Transportation is the only sector, together with waste management, that actually increased its share of GHG emissions compared to the 1990 level.
(447) European Commission (2011a) (448) Eurostat (2011)

Part II Individual Country Files
253
17.2.3. Households
Households' energy intensity was also above the EU average in 2010. The value has been steadily declining since 2001, decreasing by about 40%. The FEC of households in 2009 was 24% lower than the baseline.
0.10
0.13
0.15
0.18
0.20
80
88
95
103
110
2006 2007 2008 2009 2010
Graph II.17.10:Slovakia - Energy and carbon intensity of households
Energy intensity (lhs) CO2 intensity (rhs)
kgoe/1000 EUR ton CO2 eq./1000EUR
Source: Eurostat
Measures related to energy savings for households include energy efficiency improvements in buildings and energy efficiency improvement for appliances, whose combined estimated savings for the period 2011-2013 account for 33% of total energy savings planned. Of overall reductions in FEC planned over the period 2008-2016, the housing sector is expected to contribute around a quarter.
Buildings renovation and thermal insulation should account for the bulk of the savings in the building sector, with a projection of 50000 family houses to be renovated during the target period. For the appliances most of the savings is expected to come from the replacement of the so-called white goods (refrigerators, freezers, etc.) which should be replaced at a rate of 6% a year for the following three years, yielding savings of about 205 GWh(449).
Slovakia has the second highest weight of energy products in the HICP basket within the EU, hence Slovakian households will be relatively more exposed to any changes in energy prices than their European counterparts. This must be taken account of in any energy policy aiming to reduce
(449) European Commission (2011a)
the GHG emission levels and improve the energy efficiency of the country.
Energy efficiency adaptation measures and decarbonisation of the economy will come at a cost and this cost will be borne in particular by the Slovakian citizens. Therefore it would be necessary to provide the correct price signals to consumers in order to promote savings but also to implement mitigating measures, such as more vibrant competition in the energy markets, in order to help especially low-income households which are already faced with some of the highest energy prices in the EU.
The carbon intensity of households is among the lowest in the EU and it has been reduced by 20% between 2006 and 2010.
17.2.4. Conclusions
Slovakia is among the most vulnerable Member States as far as energy and carbon intensities are concerned. The country has a high share of energy-intensive sectors in total gross value added and high energy intensities of the economy and of the industry and a rather high energy- and carbon-intensive transport sector which may be explained mostly by the dramatic shift from railways to road transport over the last ten years.
However, progress in reducing energy intensity has been made, especially in the households sector. Further efforts would be needed to improve the efficiency of the Slovakian industries and to promote cleaner transport modes. Any adjustment measure will have to be balanced against the need to mitigate the adverse effects on consumers. Slovakia also needs to pursue the reform of the support scheme to ensure cost-effectiveness to avoid undue increases of the electricity network costs. Further energy savings can also be achieved in the transport sector by promoting biofuels and cleaner transport modes and this will also help to reduce the carbon footprint of the country.

European Commission Member States’ Energy Dependence
254
17.3. CONTRIBUTION OF ENERGY PRODUCTS TO TRADE
17.3.1. Net energy trade balance
Slovakia has one of the highest energy trade deficits in the EU (6.5% of GDP in 2011). Over the last decade, it varied between 4% and 6.5% of GDP (except for the year 2001). In contrast to most other countries, natural gas has contributed more to the energy trade deficit than oil products. For instance, in 2011 the gas trade deficit amounted to 2.8% of GDP, while the one for oil was equal to 2.5%. While the shut-down of two out of the five nuclear power plants had a noticeable effect on the electricity trade balance, namely changing Slovakia from a net electricity exporter to a net electricity importer, it has had no visible negative effect on the overall energy balance. It is likely that the new nuclear facilities, currently under construction, will enable Slovakia to regain its status as a net electricity exporter.
-8
-6
-4
-2
0
-10
-5
0
5
2007 2008 2009 2010 2011
% of GDP% of GDP
Graph II.17.11:Slovakia - Trade balance of energy products and CA
CA (lhs) Oil (rhs)Gas (rhs) Total (rhs)
Source: Eurostat
The size of the energy trade deficit should be seen against the background of the country's current account balance. The evolution of the two balances has been diverging: while the energy trade balance has stayed within a certain range (worsening somewhat as the 2011 deficit is larger than those in previous years), the current account has gradually improved from the sizeable deficit of 5.3% of GDP in 2007 to a slight surplus in 2011 (+0.1% of GDP). This suggests that the trade surplus for the other product categories is increasingly successful in compensating for the energy trade deficit.
17.3.2. Decomposition of the net energy trade balance
The energy trade balance can be decomposed into three multiplicative factors, namely the relative energy trade balance (i.e. the share of net exports in energy products in total cross-border energy trade), the share of energy in total trade and the macro openness to trade (i.e. the ratio of total trade to GDP).
Table II.17.2:Decomposition of Energy Trade Balance
2007 2008 2009 2010 2011Energy trade balance (% GDP) -5.0 -6.0 -4.4 -5.8 -6.5Relative trade balance (%) -40.7 -44.2 -43.3 -45.1 -38.2Share of energy in total trade (%) 7.7 8.9 8.0 8.7 10.4Macro trade openness (% GDP) 158.6 153.1 127.6 148.8 162.9Source: Eurostat
Unlike the net energy trade balance, Slovakia does not stand out as regards the relative energy trade balance. In contrast to the former, the latter actually decreased markedly in 2011.
However, both the share of energy in total trade and the macro openness to trade increased significantly in 2011, causing the net energy trade balance to increase. In particular the macro openness to trade stands out as one of the largest in the EU, reflecting the fact that Slovakia is one of the most open economies in the EU (in 2011 second only to Belgium). At the same time, the share of energy in total trade, while not among the largest ones (namely 10.4%), has steadily increased from 2007 onwards (when it was 7%). Finally, the exploitation of nuclear power helps the country to contain its import dependency within reasonable limits (65% on average between 2006 and 2010). This suggests that while the country has a very trade-oriented economy, its economic outlook is likely to be more and more influenced by energy trade, should the current trends persist.
17.3.3. Conclusions
Slovakia's energy trade deficit is sizeable. The country could suffer relatively more than other Member States in the event of supply disruptions or price surges. The trade deficit of the gas sector appears the most problematic aspect because of the almost complete reliance on Russia for gas imports which means that the security of Slovakia's supply and its sustainability depend ultimately and solely on Russia energy policies.

Part II Individual Country Files
255
There are some mitigating elements. The positive current account suggests that non-energy trade components are for the time being offsetting the energy trade deficit. The still relatively small size of energy trade in total trade may also reduce potential imbalances caused by a deteriorating energy trade deficit. The importance of energy trade is, however, increasing and therefore its impacts on the overall economy of Slovakia might also get bigger. It would be beneficial for the country to put additional efforts into a more efficient use of energy sources and to buttress its security of supply by improving domestic capacity in order to shelter the economy from potential shocks and reduce the adverse effects of the energy trade deficit.
17.4. REFERENCES
Eurocoal (2012), Country Profile - Slovakia, available from: http://www.euracoal.be/pages/layout1sp.php?idpage=79
European Commission, Directorate-General for Energy (2010), Member States' progress in reaching various renewable energy targets, Progress Reports, available from: http://ec.europa.eu/energy/renewables/reports/2011_en.htm
European Commission, Directorate-General for Energy (2012), Country Factsheets – EU 27 Member States, Energy Figures by Country, available from: http://ec.europa.eu/energy/observatory/countries/countries_en.htm
European Commission (2012a), Annual Growth Survey 2013, Europe 2020 targets: climate change and energy, COM (2012) 750 of 28 November
European Commission (2012b), Making the Internal Energy Market Work, COM/2012/663, SWD/2012/367 and 368 of 15 November
European Commission (2012c), Progress towards achieving the Kyoto Objectives, COM (2012) 626 of 24 October.
European Environment Agency (2011), EU Emission Trading Scheme data viewer
Eurostat (2011), Transport Pocketbook Statistics.
Eurostat (2012), Energy statistics – Prices, available from: http://epp.eurostat.ec.europa.eu/portal/page/portal/energy/data/main_tables
International Energy Agency (2011), Slovak Republic, Oil and Gas Security: Emergency Response of IEA Countries 2011
Oko-Insitut (2012), RES-Integration Country Report Slovakia.
Republic of Slovakia (2007), First National Energy Efficiency Action Plan, available from: http://ec.europa.eu/energy/efficiency/end-use_en.htm
Republic of Slovakia (2011a), Second National Energy Efficiency Action Plan, available from: http://ec.europa.eu/energy/efficiency/end-use_en.htm
Republic of Slovakia (2011b), National Renewable Energy Action Plan 2010-2020, available from: http://ec.europa.eu/energy/renewables/action_plan_en.htm
Regulatory Office for Network Industries (2011), Electricity and Gas market Annual Report.
Slovensky Plynarensky Priemsyel (2011), Annual Report.
World Nuclear Association (2012), Nuclear Power in Slovakia, available from: http://www.world-nuclear.org/info/inf91.htm

KC-AH-13-145-EN
-N