Melrose Industries PLC · A proposed final dividend of 3.4 pence per share (2018: 3.05 pence) is...
33
Strictly private and confidential Buy Improve Sell Melrose Industries PLC Year ended 31 December 2019 5 March 2020 Full Year Results GKN ePowertrain Nortek StatePoint ®
Transcript of Melrose Industries PLC · A proposed final dividend of 3.4 pence per share (2018: 3.05 pence) is...

BuyImproveSell
Strictly private and confidential
BuyImproveSell
Melrose Industries PLC
Year ended 31 December 20195 March 2020
Full Year Results
GKN ePowertrain Nortek StatePoint®
BuyImproveSell
Contents
1 Highlights
2 The results
3 Businesses – investment & improvement
4 Appendices
1The revenue and profit numbers included in this presentation are shown in round millions. Margin calculations are calculated using unrounded numbers

Highlights
2
BuyImproveSell

BuyImproveSell
Highlights
3
The results for 2019 were comfortably ahead of the Board’s expectations for both profit and cash generation
Adjusted1 diluted earnings per share (“EPS”) were 14.3 pence, up 13% on last year (statutory EPS: 0.9 pence) and adjusted free cashflow3 was £591 million, up 72%4 on an annualised like-for-like basis
Group net debt and leverage have both been improved and were reduced to £3.28 billion and 2.25x respectively
Net trade working capital in the Group was reduced by £95 million (5%) in the year, with adjusted profit conversion to cash1 of 104%.More progress in net trade working capital to come, in line with achieving the previously announced £400 million target within theMelrose ownership period
Loss-making contracts have been improved materially with the losses from 2018 reducing by 11% in 2019. In addition, c.25% of theremaining provision has been released (as previously stated this release is not included in adjusted1 operating profit) due toimprovements implemented by management this year. These improvements impact future trading in GKN positively
The GKN UK defined benefit pension schemes are significantly better funded, aided by over £240 million5 of cash contributions fromthe Group so far during Melrose ownership, fully in line with the plan agreed with the Trustees. Along with better investment returns, theremaining contributions required to make these schemes well funded has reduced from up to £1 billion at acquisition to c.£500 million
1. Described in the glossary to the 2019 Preliminary Announcement, released on 5 March 20202. Results for 2018 include GKN for 8 months only and have been restated for discontinued operations3. Adjusted free cash flow excludes the special one-off pension contributions and restructuring spend4. Calculated compared to 2018 annualised adjusted free cash flow, excluding the previously announced £150 million cash outflow from unwinding creditor stretch
in 2018. 2018 annualised adjusted free cash flow includes 12 months of GKN ownership5. Including the contribution paid on 6 January 2020
Continuing operations2
Adjusted1 results Statutory results
2019£m
2018£m
2019£m
2018£m
Revenue 11,592 8,645 10,967 8,152
Operating profit/(loss) 1,102 813 318 (387)
Profit/(loss) before tax 889 672 106 (542)
Diluted earnings per share 14.3p 12.7p 0.9p (11.8)p

BuyImproveSell 4
Highlights
A proposed final dividend of 3.4 pence per share (2018: 3.05 pence) is 11% up on last year, giving a full year dividend of 5.1 pence pershare (2018: 4.6 pence) up 11%
During 2019, a record total level of investment has been made in new product development; technology; environmental, social &governance (ESG); and capital and restructuring projects - all designed to improve the quality of the businesses and their futureperformance
The effects of the COVID-19 outbreak are not fully known at present. Approximately 10% of Group sales are manufactured in China, ofwhich 5% is sold in China, with GKN Automotive having the largest exposure through its 50% joint venture – all except one site areoperational after the new year break. Whilst there will clearly be some impact, the opportunities to improve GKN in 2020 and beyondposition Melrose well to deliver positive returns for shareholders in the future
The Automotive and Aerospace businesses are now totally separate from a head office, legal, tax and pensions perspective. Melrosewill be holding an Investor Day for Automotive in New York in October this year to update the markets on its future strategy
Melrose has appointed advisers to explore the strategic options for Nortek Air Management, although clearly recent events may havesome bearing on timing. In the event of a significant disposal, a further reduction to net debt would be made along with an exceptionalrepayment to shareholders and a further contribution to the GKN UK defined benefit pension schemes
Justin Dowley, Chairman of Melrose Industries PLC, today said:
“We are delighted with the Melrose performance in 2019 and the substantial value that is being unlocked. Notwithstanding anyimplications of the COVID-19 outbreak, the bedrock has now been built for the GKN businesses to attain results which were not previouslyachievable, and, in addition, the shareholder value built up in our longer held assets is closer to being realised. This shows, once more,that the Melrose model thrives by investing properly in businesses and giving management the entrepreneurial freedom to succeed. Thisis just the start of what is possible for GKN.”

BuyImproveSell
The results
5
BuyImproveSell
BuyImproveSell
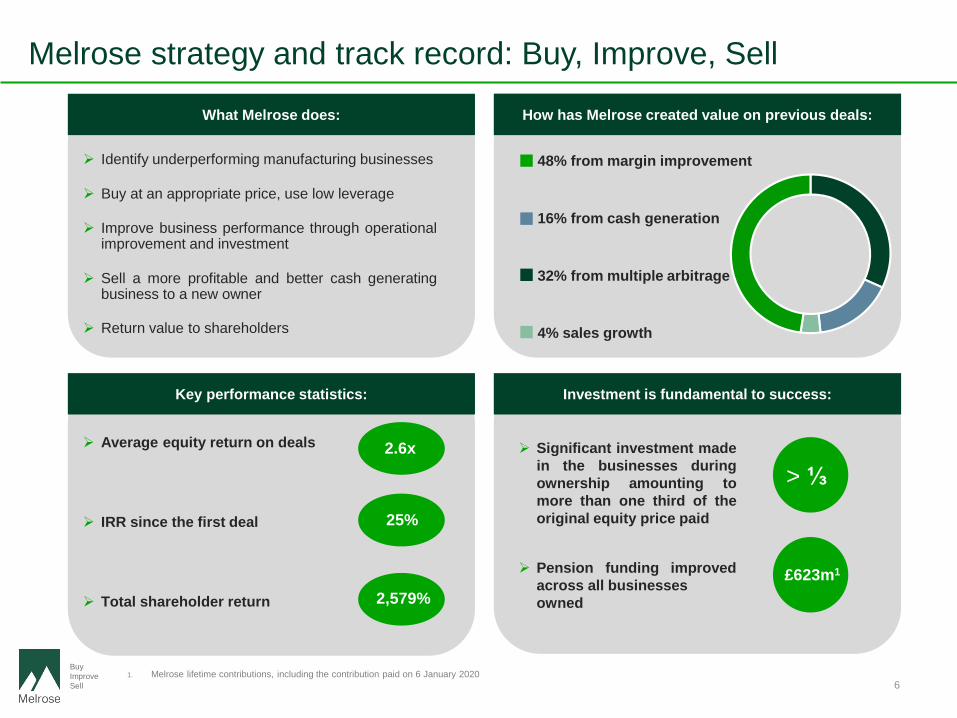
Melrose strategy and track record: Buy, Improve, Sell
6
Identify underperforming manufacturing businesses
Buy at an appropriate price, use low leverage
Improve business performance through operationalimprovement and investment
Sell a more profitable and better cash generatingbusiness to a new owner
Return value to shareholders
What Melrose does:
Average equity return on deals
IRR since the first deal
Total shareholder return
2.6x
25%
2,579%
Key performance statistics:
48% from margin improvement
16% from cash generation
32% from multiple arbitrage
4% sales growth
How has Melrose created value on previous deals:
Significant investment madein the businesses duringownership amounting tomore than one third of theoriginal equity price paid
Pension funding improvedacross all businessesowned
Investment is fundamental to success:
£623m1
1. Melrose lifetime contributions, including the contribution paid on 6 January 2020
> ⅓
BuyImproveSell
Reconciliation between statutory and adjusted1 results
7
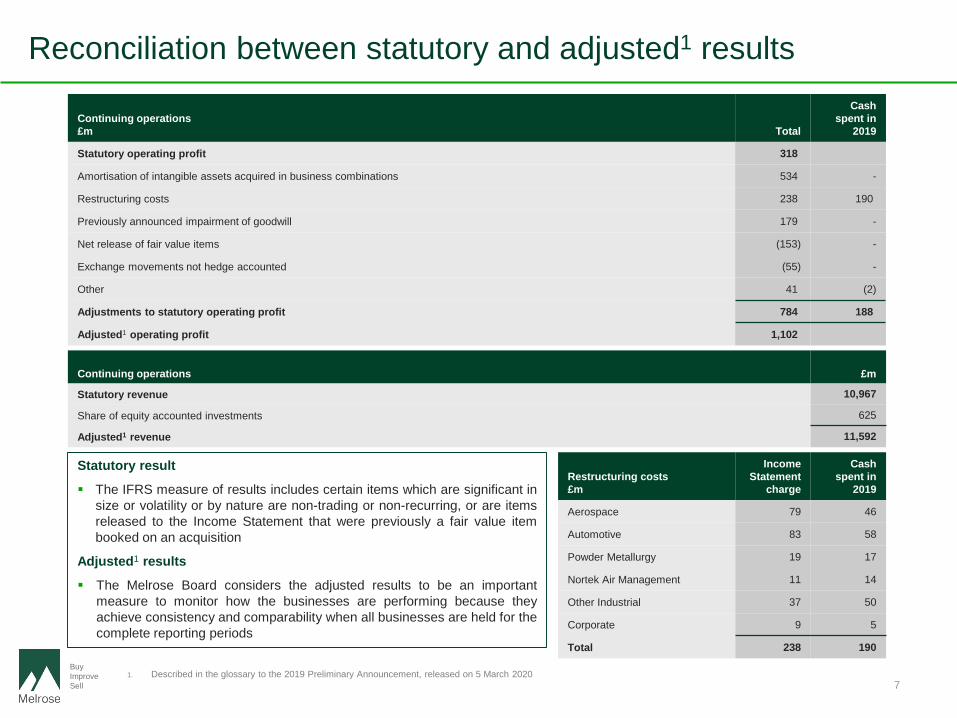
Statutory result
The IFRS measure of results includes certain items which are significant insize or volatility or by nature are non-trading or non-recurring, or are itemsreleased to the Income Statement that were previously a fair value itembooked on an acquisition
Adjusted1 results
The Melrose Board considers the adjusted results to be an importantmeasure to monitor how the businesses are performing because theyachieve consistency and comparability when all businesses are held for thecomplete reporting periods
Restructuring costs£m
Income Statement
charge
Cash spent in
2019
Aerospace 79 46
Automotive 83 58
Powder Metallurgy 19 17
Nortek Air Management 11 14
Other Industrial 37 50
Corporate 9 5
Total 238 190
Continuing operations £m
Statutory revenue 10,967
Share of equity accounted investments 625
Adjusted1 revenue 11,592
1. Described in the glossary to the 2019 Preliminary Announcement, released on 5 March 2020
Continuing operations£m Total
Cash spent in
2019
Statutory operating profit 318
Amortisation of intangible assets acquired in business combinations 534 -
Restructuring costs 238 190
Previously announced impairment of goodwill 179 -
Net release of fair value items (153) -
Exchange movements not hedge accounted (55) -
Other 41 (2)
Adjustments to statutory operating profit 784 188
Adjusted1 operating profit 1,102
BuyImproveSell
Cash generation in the year
8
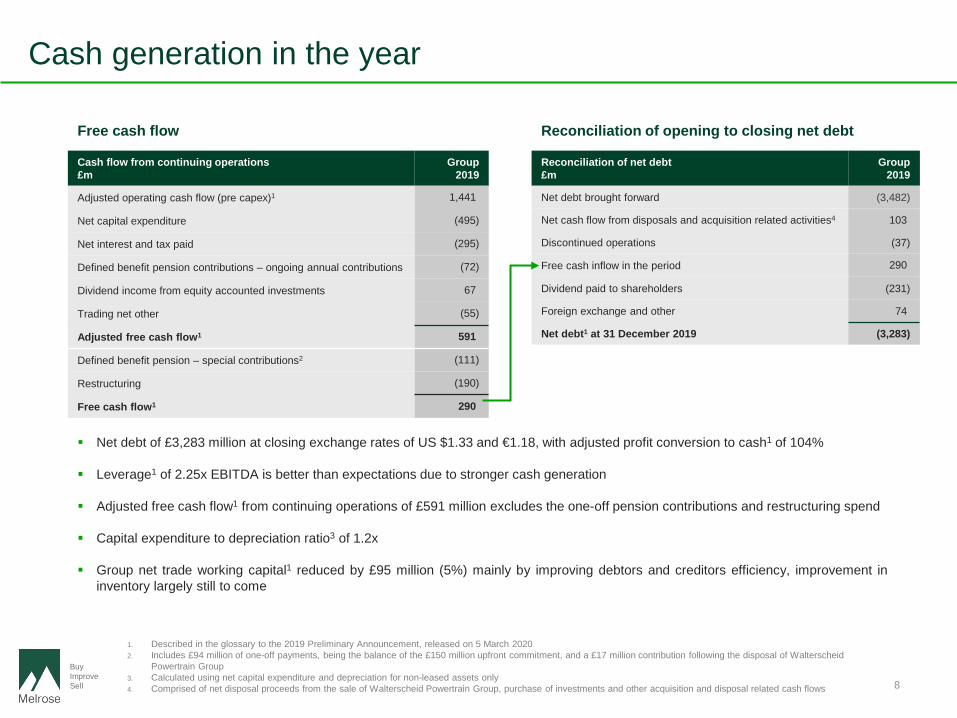
Cash flow from continuing operations£m
Group2019
Adjusted operating cash flow (pre capex)1 1,441
Net capital expenditure (495)
Net interest and tax paid (295)
Defined benefit pension contributions – ongoing annual contributions (72)
Dividend income from equity accounted investments 67
Trading net other (55)
Adjusted free cash flow1 591
Defined benefit pension – special contributions2 (111)
Restructuring (190)
Free cash flow1 290
Reconciliation of net debt£m
Group2019
Net debt brought forward (3,482)
Net cash flow from disposals and acquisition related activities4 103
Discontinued operations (37)
Free cash inflow in the period 290
Dividend paid to shareholders (231)
Foreign exchange and other 74
Net debt1 at 31 December 2019 (3,283)
Free cash flow Reconciliation of opening to closing net debt
1. Described in the glossary to the 2019 Preliminary Announcement, released on 5 March 20202. Includes £94 million of one-off payments, being the balance of the £150 million upfront commitment, and a £17 million contribution following the disposal of Walterscheid
Powertrain Group3. Calculated using net capital expenditure and depreciation for non-leased assets only4. Comprised of net disposal proceeds from the sale of Walterscheid Powertrain Group, purchase of investments and other acquisition and disposal related cash flows
Net debt of £3,283 million at closing exchange rates of US $1.33 and €1.18, with adjusted profit conversion to cash1 of 104%
Leverage1 of 2.25x EBITDA is better than expectations due to stronger cash generation
Adjusted free cash flow1 from continuing operations of £591 million excludes the one-off pension contributions and restructuring spend
Capital expenditure to depreciation ratio3 of 1.2x
Group net trade working capital1 reduced by £95 million (5%) mainly by improving debtors and creditors efficiency, improvement ininventory largely still to come
BuyImproveSell
Segmental performance – adjusted1 results
9
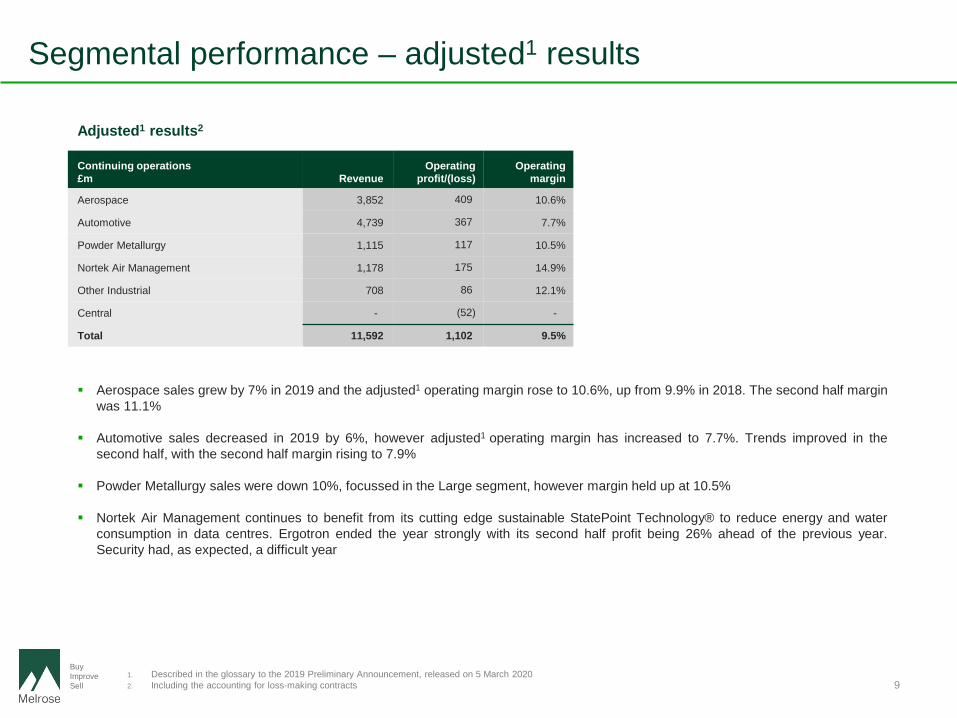
Continuing operations£m Revenue
Operating profit/(loss)
Operating margin
Aerospace 3,852 409 10.6%
Automotive 4,739 367 7.7%
Powder Metallurgy 1,115 117 10.5%
Nortek Air Management 1,178 175 14.9%
Other Industrial 708 86 12.1%
Central - (52) -
Total 11,592 1,102 9.5%
Adjusted1 results2
Aerospace sales grew by 7% in 2019 and the adjusted1 operating margin rose to 10.6%, up from 9.9% in 2018. The second half marginwas 11.1%
Automotive sales decreased in 2019 by 6%, however adjusted1 operating margin has increased to 7.7%. Trends improved in thesecond half, with the second half margin rising to 7.9%
Powder Metallurgy sales were down 10%, focussed in the Large segment, however margin held up at 10.5%
Nortek Air Management continues to benefit from its cutting edge sustainable StatePoint Technology® to reduce energy and waterconsumption in data centres. Ergotron ended the year strongly with its second half profit being 26% ahead of the previous year.Security had, as expected, a difficult year
1. Described in the glossary to the 2019 Preliminary Announcement, released on 5 March 20202. Including the accounting for loss-making contracts
BuyImproveSell
GKN – loss-making contracts
10
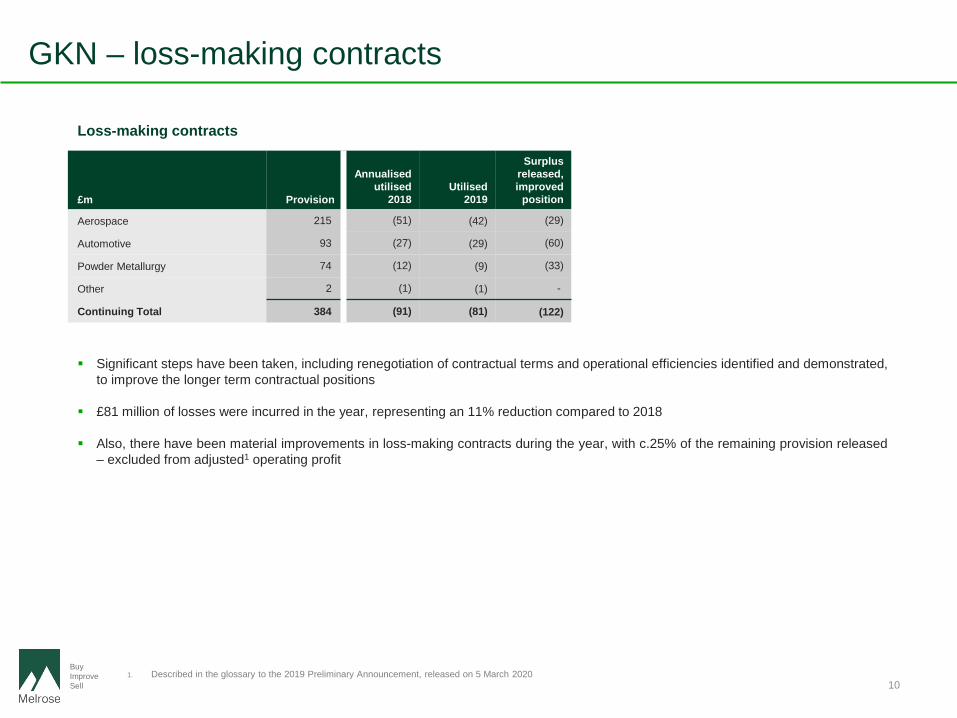
£m Provision
Aerospace 215
Automotive 93
Powder Metallurgy 74
Other 2
Continuing Total 384
Loss-making contracts
Significant steps have been taken, including renegotiation of contractual terms and operational efficiencies identified and demonstrated,to improve the longer term contractual positions
£81 million of losses were incurred in the year, representing an 11% reduction compared to 2018
Also, there have been material improvements in loss-making contracts during the year, with c.25% of the remaining provision released– excluded from adjusted1 operating profit
1. Described in the glossary to the 2019 Preliminary Announcement, released on 5 March 2020
Annualised utilised
2018Utilised
2019
Surplus released, improved
position
(51) (42) (29)
(27) (29) (60)
(12) (9) (33)
(1) (1) -
(91) (81) (122)
BuyImproveSell
Pensions and tax
11
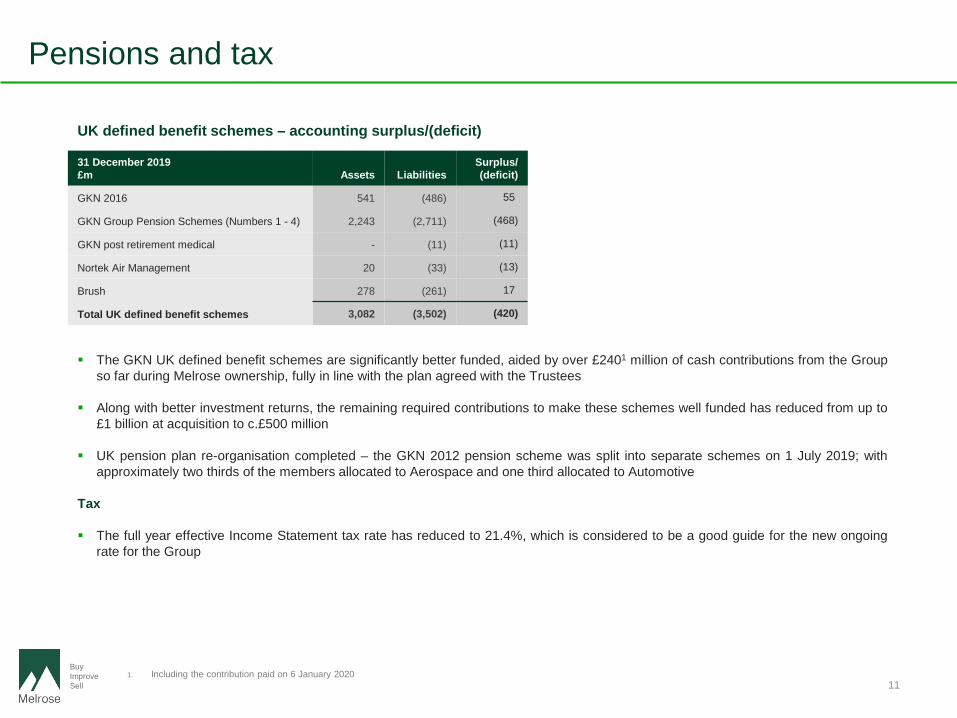
The GKN UK defined benefit schemes are significantly better funded, aided by over £2401 million of cash contributions from the Groupso far during Melrose ownership, fully in line with the plan agreed with the Trustees
Along with better investment returns, the remaining required contributions to make these schemes well funded has reduced from up to£1 billion at acquisition to c.£500 million
UK pension plan re-organisation completed – the GKN 2012 pension scheme was split into separate schemes on 1 July 2019; withapproximately two thirds of the members allocated to Aerospace and one third allocated to Automotive
Tax
The full year effective Income Statement tax rate has reduced to 21.4%, which is considered to be a good guide for the new ongoingrate for the Group
UK defined benefit schemes – accounting surplus/(deficit)
31 December 2019£m Assets Liabilities
Surplus/ (deficit)
GKN 2016 541 (486) 55
GKN Group Pension Schemes (Numbers 1 - 4) 2,243 (2,711) (468)
GKN post retirement medical - (11) (11)
Nortek Air Management 20 (33) (13)
Brush 278 (261) 17
Total UK defined benefit schemes 3,082 (3,502) (420)
1. Including the contribution paid on 6 January 2020

BuyImproveSell
Businesses – investment & improvement
12
BuyImproveSell
BuyImproveSell
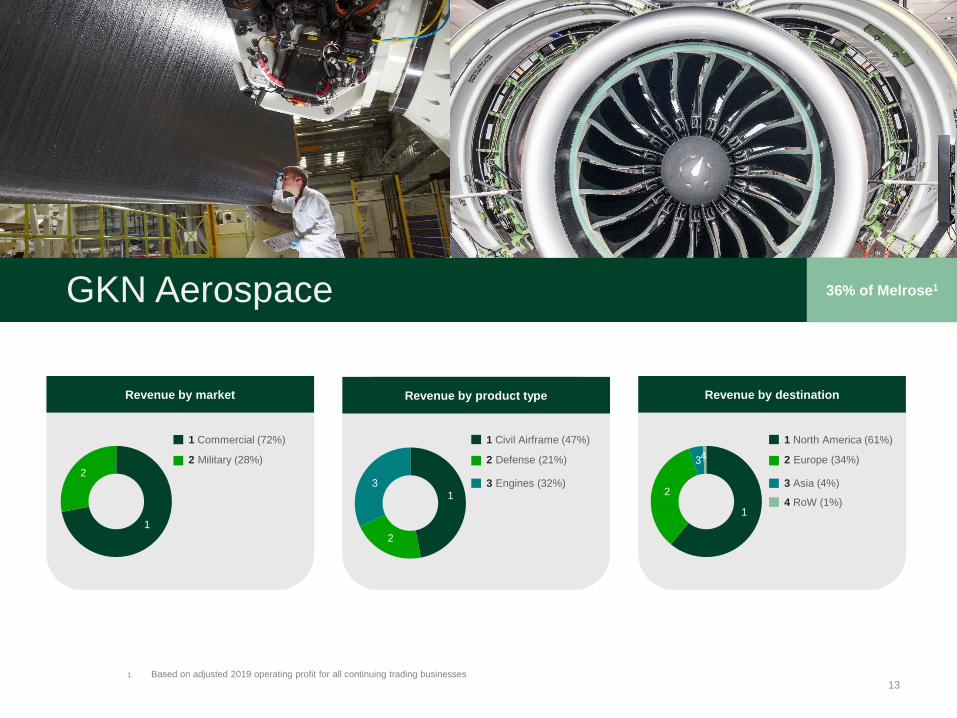
GKN Aerospace
13
36% of Melrose1
1. Based on adjusted 2019 operating profit for all continuing trading businesses
1
2
Revenue by market
1 Commercial (72%)
2 Military (28%)
4 RoW (1%)
1
2
3
Revenue by destination
1 North America (61%)
2 Europe (34%)
3 Asia (4%)
4
1
2
3
Revenue by product type
1 Civil Airframe (47%)
3 Engines (32%)
2 Defense (21%)
4 RoW (1%)

BuyImproveSell 14
Aerospace – highlights
Highlights
Adjusted1 operating profit up 25%, adjusted1 operating margin up 1.4 percentage points
Second half performance stronger than the first half, adjusted1 operating margin reaching 11% in the second half
New “One Aerospace” structure being implemented to better serve customers and generate further efficiencies
Major new operational improvement programme commenced to drive sustainable gains in quality, delivery and cost
North American Aerostructures business generated a small profit; only two years ago this part of Aerospace made a £43 million loss
Record year of investment in technology, construction underway on the new Global Technology Centre in Bristol, UK, which isexpected to open in 2020
1. Described in the glossary to the 2019 Preliminary Announcement, released on 5 March 20202. Growth is calculated at constant currency against 2018 annualised results, excluding the impact of loss-making contracts and IFRS 16 in both periods for consistency
£m2019
Adjusted1 results Growth2
H1 2019 Adjusted1
results
H2 2019 Adjusted1
results
H2 2019 Year on Year
Growth2
Revenue 3,852 7% 1,904 1,948 7%
EBITDA 579 17% 276 303 16%
EBITDA margin % 15.0% +1.2 ppts 14.5% 15.6% +1.2 ppts
Operating profit 409 25% 192 217 23%
Operating margin % 10.6% +1.4 ppts 10.1% 11.1% +1.3 ppts
BuyImproveSell 15
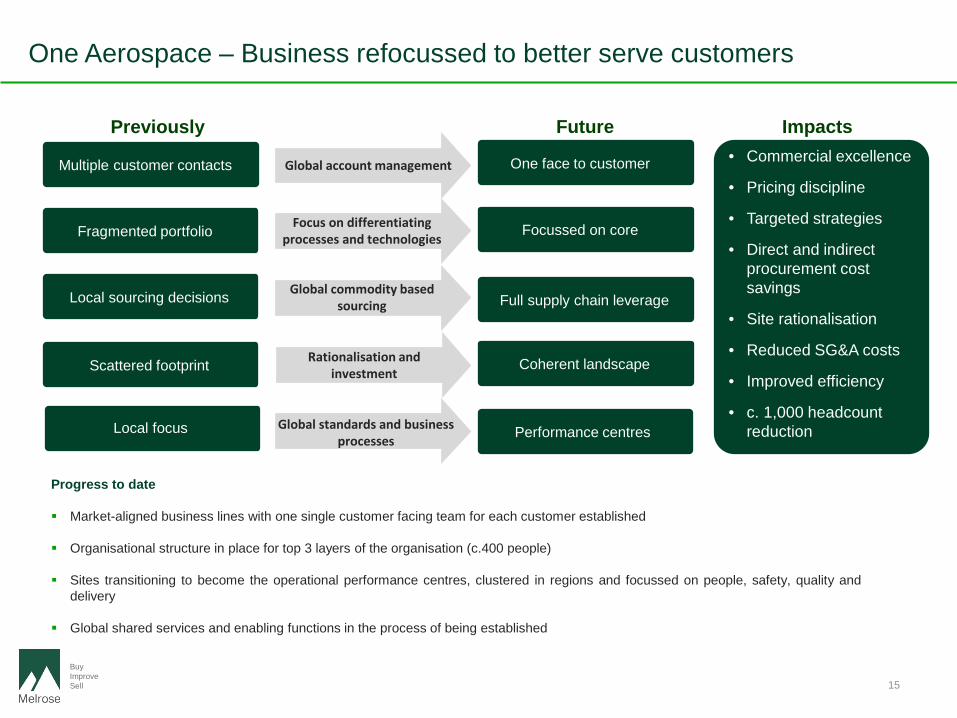
One Aerospace – Business refocussed to better serve customers
Previously Future Impacts
Multiple customer contacts
Fragmented portfolio
Local sourcing decisions
Scattered footprint
Local focus
One face to customer
Focussed on core
Full supply chain leverage
Coherent landscape
Performance centres
Global account management
Focus on differentiating processes and technologies
Rationalisation and investment
Global commodity based sourcing
Global standards and business processes
• Commercial excellence
• Pricing discipline
• Targeted strategies
• Direct and indirect procurement cost savings
• Site rationalisation
• Reduced SG&A costs
• Improved efficiency
• c. 1,000 headcount reduction
Progress to date
Market-aligned business lines with one single customer facing team for each customer established
Organisational structure in place for top 3 layers of the organisation (c.400 people)
Sites transitioning to become the operational performance centres, clustered in regions and focussed on people, safety, quality anddelivery
Global shared services and enabling functions in the process of being established
BuyImproveSell 16
Aerospace – markets, investment, technology and environment
Markets
Civil aerospace has a healthy backlog; long-term civil aerospace market remains in line with acquisition assumptions
Boeing 737 MAX position being monitored closely with required mitigating actions being taken – GKN Aerospace has an approximateshipset value of up to £400k for each aircraft
Military market is strong and could increase the balance of military versus commercial sales in the future
Investment and restructuring
Creation of “One Aerospace”; major new operational excellence programme commenced, focussed on serving customers better
Delivery, quality and customer relationships all continue to improve, working capital improvement plans being implemented
Good progress being made on resolving loss-making contracts – financial benefits expected to follow
Closure of two loss-making sites underway, full exit expected during 2020
Significant capital investment injected into previously underinvested parts of the business and in to new growth areas
Technology and ESG
Record investment in technology – focussed on improving efficiency, weight and emissions of aircraft:
– Construction of the new Global Technology Centre in Bristol, UK is underway, expected to open in 2020– World leading additive manufacturing pilot production cell at Oak Ridge National Laboratory, US– Technology centre in the Netherlands to focus on thermoplastic components– Manufactured first components for the Wing of Tomorrow programme
– Additive technologies being developed to significantly reduce waste material from production processes
Substantial research and development project into zero-emission hydrogen power systems planned for 2020 – decarbonisationopportunity leading to cleaner air

BuyImproveSell
GKN Automotive
17
32% of Melrose1
1. Based on adjusted 2019 operating profit for all continuing trading businesses
Revenue by product type
1
2
341 Driveline (72%)
3 eDrive (2%)2 All Wheel Drive (25%)
4 Cylinder Liners (1%)
Revenue by destination
1
2
3
41 Europe (35%)
3 Asia (26%)2 North America (34%)
4 RoW (5%)
BuyImproveSell 18
Automotive – highlights
1. Described in the glossary to the 2019 Preliminary Announcement, released on 5 March 20202. Growth is calculated at constant currency against 2018 annualised results, excluding the impact of loss-making contracts and IFRS 16 in both periods for
consistency
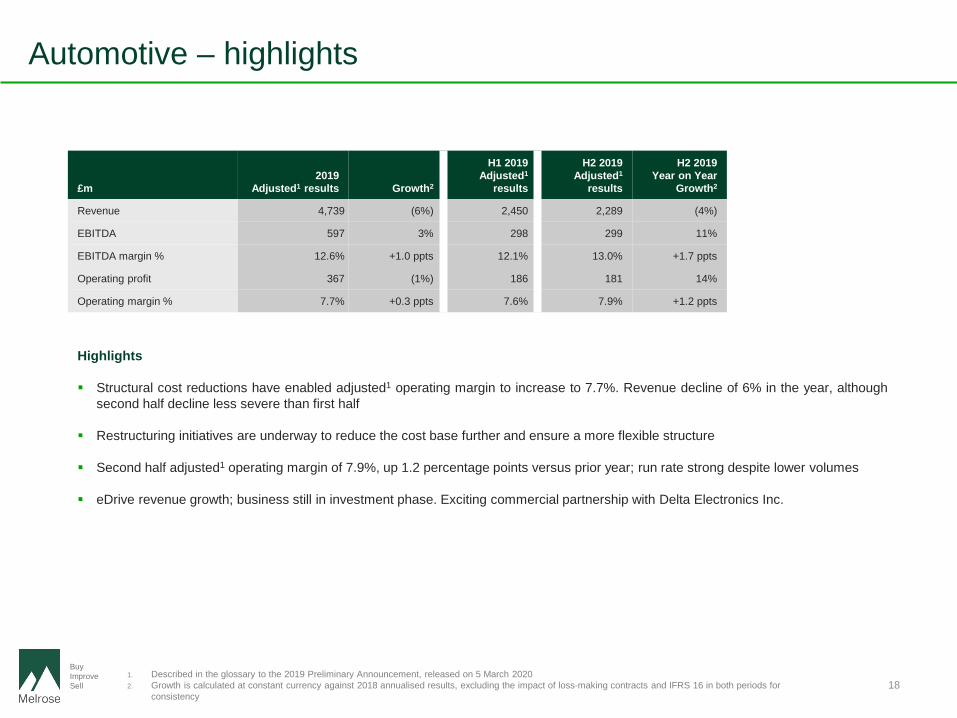
£m2019
Adjusted1 results Growth2
H1 2019 Adjusted1
results
H2 2019 Adjusted1
results
H2 2019 Year on Year
Growth2
Revenue 4,739 (6%) 2,450 2,289 (4%)
EBITDA 597 3% 298 299 11%
EBITDA margin % 12.6% +1.0 ppts 12.1% 13.0% +1.7 ppts
Operating profit 367 (1%) 186 181 14%
Operating margin % 7.7% +0.3 ppts 7.6% 7.9% +1.2 ppts
Highlights
Structural cost reductions have enabled adjusted1 operating margin to increase to 7.7%. Revenue decline of 6% in the year, althoughsecond half decline less severe than first half
Restructuring initiatives are underway to reduce the cost base further and ensure a more flexible structure
Second half adjusted1 operating margin of 7.9%, up 1.2 percentage points versus prior year; run rate strong despite lower volumes
eDrive revenue growth; business still in investment phase. Exciting commercial partnership with Delta Electronics Inc.
BuyImproveSell 19
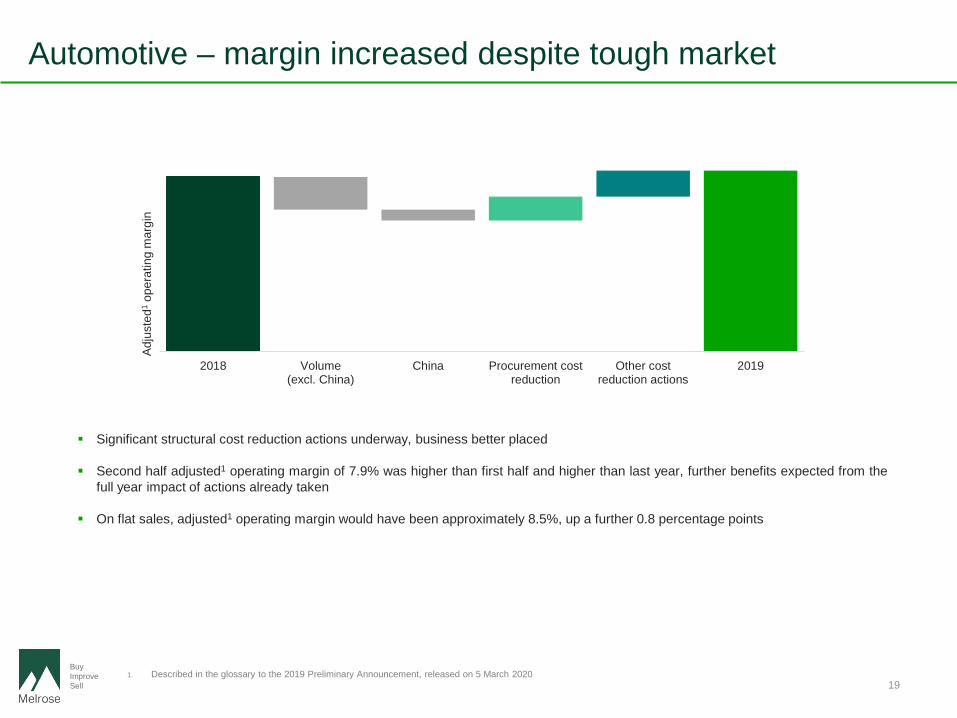
Automotive – margin increased despite tough market
1. Described in the glossary to the 2019 Preliminary Announcement, released on 5 March 2020
Significant structural cost reduction actions underway, business better placed
Second half adjusted1 operating margin of 7.9% was higher than first half and higher than last year, further benefits expected from thefull year impact of actions already taken
On flat sales, adjusted1 operating margin would have been approximately 8.5%, up a further 0.8 percentage points
2018 Volume(excl. China)
China Procurement costreduction
Other costreduction actions
2019
Adju
sted
1op
erat
ing
mar
gin
BuyImproveSell 20
Automotive – investments, technology and environment
Investment and restructuring
Significant restructuring programmes underway:
− Layers of management removed− Structural reductions in fixed costs− Early retirement programmes at several plants− Footprint reduction taking place – two site closures completed− Consolidation of back office service functions underway
Focus on improving production, material and inter-factory flows
Structural improvements in procurement, yielding direct and indirect savings
Good progress being made on resolving loss-making contracts – release of corresponding provision
Working capital improvement plan being implemented
Technology and ESG
Electric vehicle powertrain solutions enable low-carbon vehicles – eDrive becoming increasingly important with capital investments to increase specific eDrive manufacturing capacity
Strategy to make electric propulsion more affordable – using standardised electric drive systems and highly integrated inverters and motors
Strategic collaboration with power electronics specialist, Delta Electronics Inc., joint development should accelerate delivery of next generation 3-in-1 eDrive systems – a key step towards scaling greener powertrain solutions
BuyImproveSell
GKN Powder Metallurgy
21
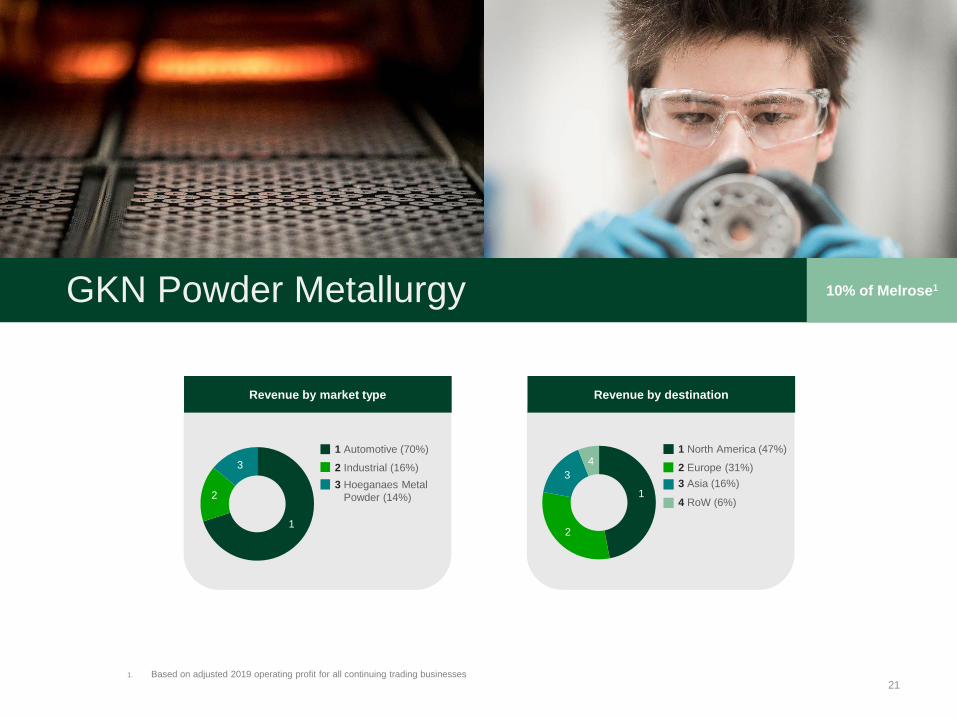
10% of Melrose1
1. Based on adjusted 2019 operating profit for all continuing trading businesses
Revenue by market type
1
2
31 Automotive (70%)
3 Hoeganaes Metal Powder (14%)
2 Industrial (16%)
Revenue by destination
1
2
34
1 North America (47%)
3 Asia (16%)2 Europe (31%)
4 RoW (6%)
BuyImproveSell 22
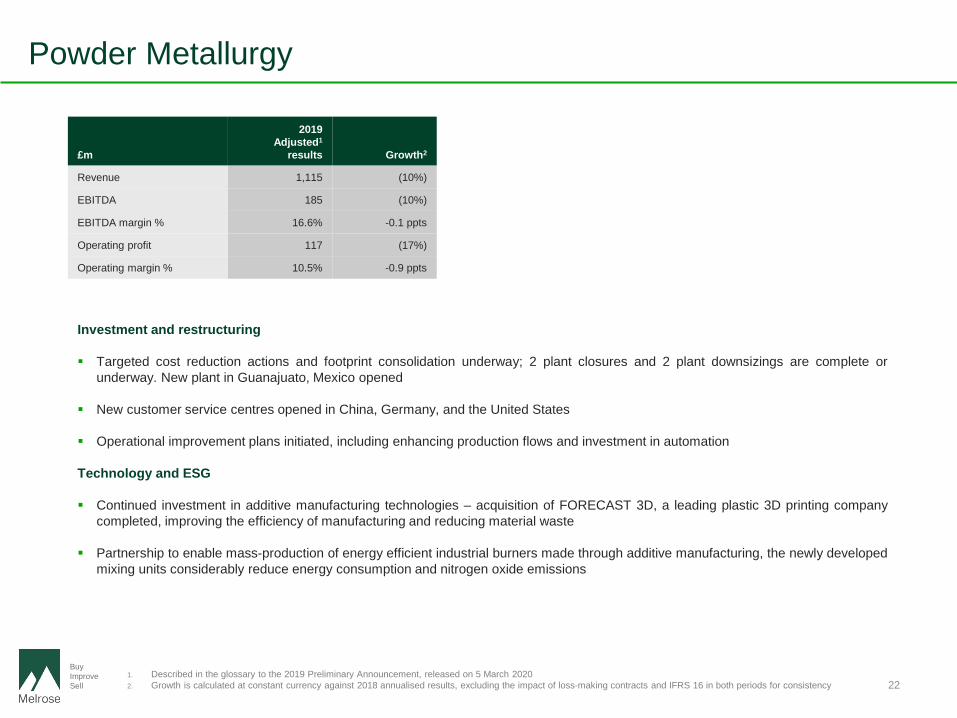
Powder Metallurgy
Investment and restructuring
Targeted cost reduction actions and footprint consolidation underway; 2 plant closures and 2 plant downsizings are complete orunderway. New plant in Guanajuato, Mexico opened
New customer service centres opened in China, Germany, and the United States
Operational improvement plans initiated, including enhancing production flows and investment in automation
Technology and ESG
Continued investment in additive manufacturing technologies – acquisition of FORECAST 3D, a leading plastic 3D printing companycompleted, improving the efficiency of manufacturing and reducing material waste
Partnership to enable mass-production of energy efficient industrial burners made through additive manufacturing, the newly developedmixing units considerably reduce energy consumption and nitrogen oxide emissions
£m
2019 Adjusted1
results Growth2
Revenue 1,115 (10%)
EBITDA 185 (10%)
EBITDA margin % 16.6% -0.1 ppts
Operating profit 117 (17%)
Operating margin % 10.5% -0.9 ppts
1. Described in the glossary to the 2019 Preliminary Announcement, released on 5 March 20202. Growth is calculated at constant currency against 2018 annualised results, excluding the impact of loss-making contracts and IFRS 16 in both periods for consistency
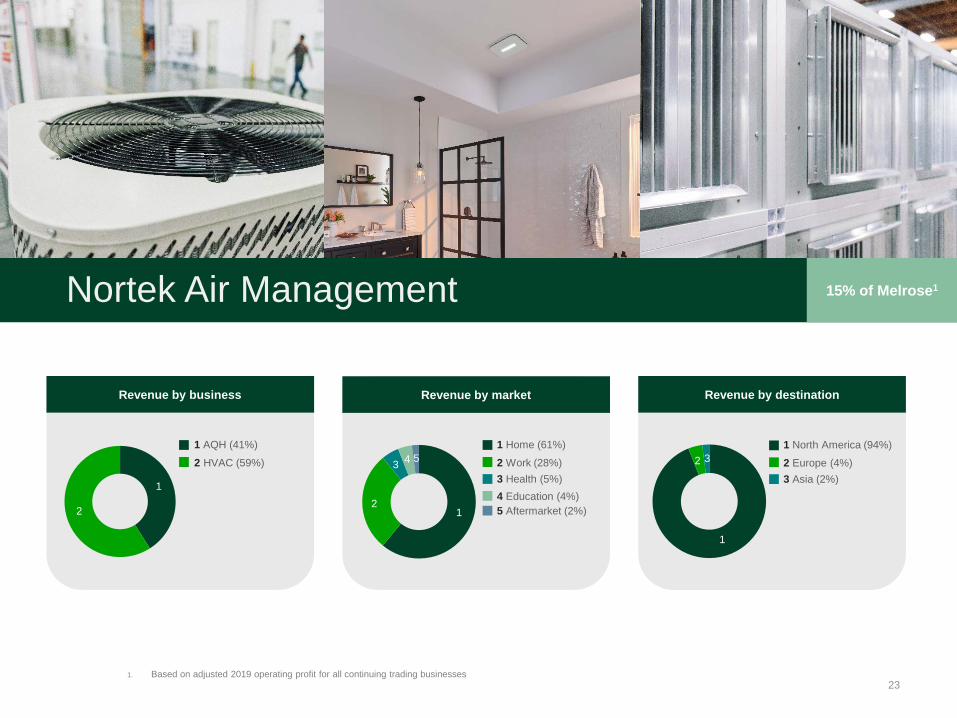
Nortek Air Management
23
15% of Melrose1
1. Based on adjusted 2019 operating profit for all continuing trading businesses
1
2 31 North America (94%)2 Europe (4%)
Revenue by destination
3 Asia (2%)
Revenue by market
12
3 4 51 Home (61%)
3 Health (5%)2 Work (28%)
4 Education (4%)5 Aftermarket (2%)
1
2
Revenue by business
1 AQH (41%)2 HVAC (59%)
BuyImproveSell 24
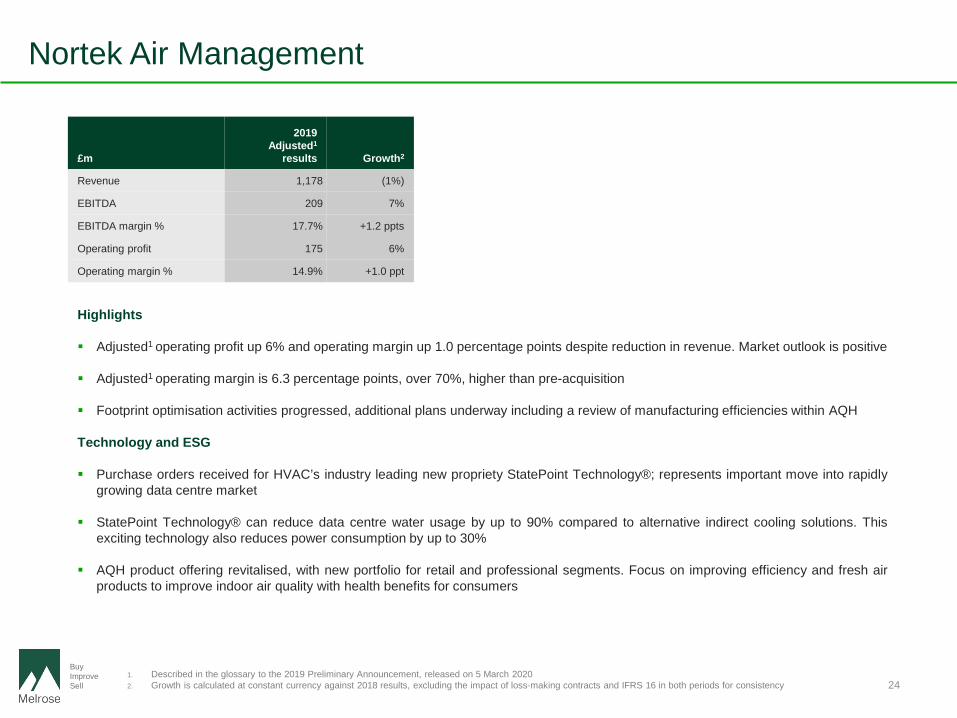
Nortek Air Management
Highlights
Adjusted1 operating profit up 6% and operating margin up 1.0 percentage points despite reduction in revenue. Market outlook is positive
Adjusted1 operating margin is 6.3 percentage points, over 70%, higher than pre-acquisition
Footprint optimisation activities progressed, additional plans underway including a review of manufacturing efficiencies within AQH
Technology and ESG
Purchase orders received for HVAC’s industry leading new propriety StatePoint Technology®; represents important move into rapidlygrowing data centre market
StatePoint Technology® can reduce data centre water usage by up to 90% compared to alternative indirect cooling solutions. Thisexciting technology also reduces power consumption by up to 30%
AQH product offering revitalised, with new portfolio for retail and professional segments. Focus on improving efficiency and fresh airproducts to improve indoor air quality with health benefits for consumers
£m
2019 Adjusted1
results Growth2
Revenue 1,178 (1%)
EBITDA 209 7%
EBITDA margin % 17.7% +1.2 ppts
Operating profit 175 6%
Operating margin % 14.9% +1.0 ppt
1. Described in the glossary to the 2019 Preliminary Announcement, released on 5 March 20202. Growth is calculated at constant currency against 2018 results, excluding the impact of loss-making contracts and IFRS 16 in both periods for consistency
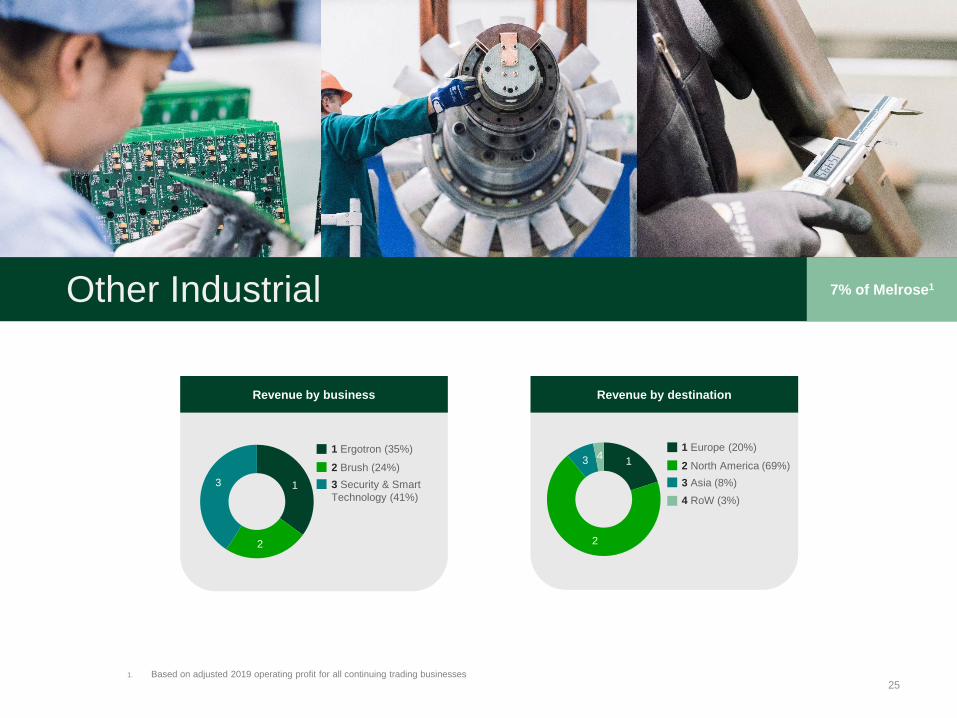
Other Industrial
25
1
2
3 41 Europe (20%)
3 Asia (8%)2 North America (69%)
4 RoW (3%)
Revenue by destinationRevenue by business
1
2
3
1 Ergotron (35%)
3 Security & SmartTechnology (41%)
2 Brush (24%)
7% of Melrose1
1. Based on adjusted 2019 operating profit for all continuing trading businesses

BuyImproveSell 26
Other Industrial
£m2019
Adjusted1 results Growth2
Revenue 708 (9%)
EBITDA 103 (20%)
EBITDA margin % 14.5% -1.8 ppts
Operating profit 86 (21%)
Operating margin % 12.1% -1.8 ppts
1. Described in the glossary to the 2019 Preliminary Announcement, released on 5 March 20202. Growth is calculated at constant currency against 2018 results, excluding the impact of loss-making contracts and IFRS 16 in both periods for consistency
Investment and restructuring
Ergotron market impacted by US tariffs on Chinese goods. Adjusted1 operating profit higher than last year on reduced revenue. Newproducts gaining traction
Brush margins expanding following completion of successful restructuring. Operational footprint consolidated into product-specificfacilities and dedicated service centres. Enhanced focus on growing services market
Security & Smart Technology moved from Nortek Air & Security to Other Industrial following the Board’s decision to consider strategicoptions for Nortek Air Management and Security & Smart Technology separately
Security market remains challenging, partly due to the impact of US tariffs, increased competition and technological changes, however,operations have been restructured to move production out of China
Wheels & Structures business made a small adjusted1 operating loss and is classified as held for sale at 31 December 2019
Appendices
27
BuyImproveSell

BuyImproveSell
Impact of loss-making contracts
28
Continuing operations£m Revenue
Operating profit/(loss)pre-positive
impact of loss-making
contracts
Positiveimpact of
loss-making contracts
Operating profit/(loss)
post-positive impact of
loss-makingcontracts
Operating margin
Pre-positive impact of
loss-making contracts
Post-positive impact of
loss-making contracts
Aerospace 3,852 367 42 409 9.5% 10.6%
Automotive 4,739 338 29 367 7.2% 7.7%
Powder Metallurgy 1,115 108 9 117 9.7% 10.5%
Nortek Air Management 1,178 175 - 175 14.9% 14.9%
Other Industrial 708 85 1 86 11.9% 12.1%
Central - (52) - (52) - -
Total 11,592 1,021 81 1,102 8.8% 9.5%
Adjusted1 results
1. Described in the glossary to the 2019 Preliminary Announcement, released on 5 March 2020

BuyImproveSell 29
Aerospace future potential cash profile
Over £10 billion of cash expected from existing RRSP1 arrangements
1. Risk and revenue sharing partnership
0
50
100
150
200
250
300
350
400
450
2020 2025 2030 2035 2040 2045 2050 2055 2060
£m p
er a
nnum
Indicative cash flows from RRSP1 portfolio
BuyImproveSell 30
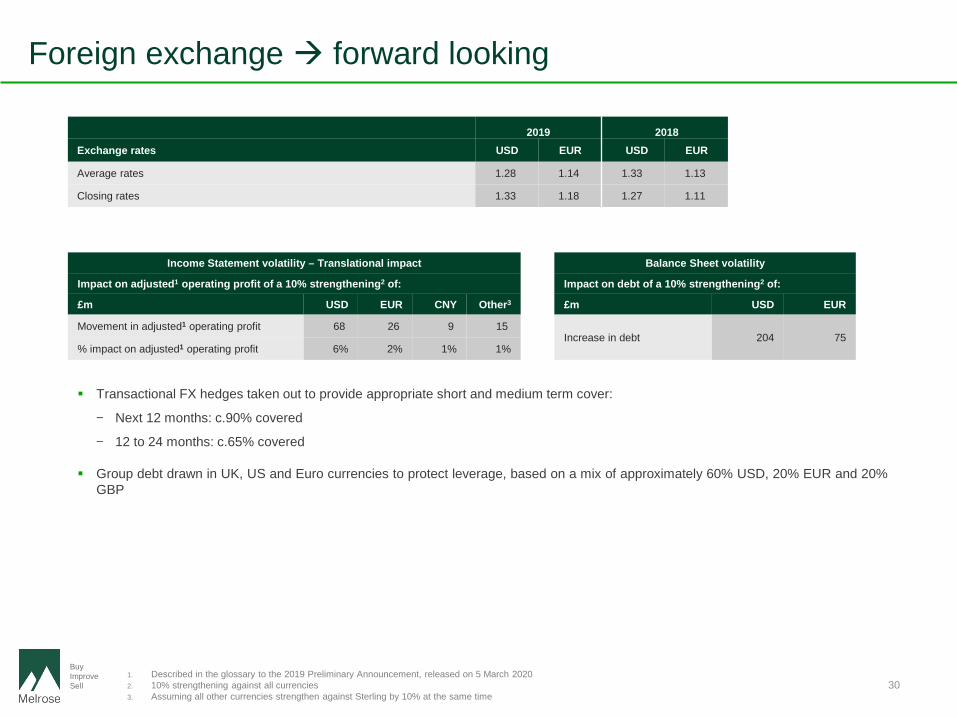
Foreign exchange forward looking
Transactional FX hedges taken out to provide appropriate short and medium term cover:
− Next 12 months: c.90% covered
− 12 to 24 months: c.65% covered
Group debt drawn in UK, US and Euro currencies to protect leverage, based on a mix of approximately 60% USD, 20% EUR and 20%GBP
2019 2018Exchange rates USD EUR USD EUR
Average rates 1.28 1.14 1.33 1.13
Closing rates 1.33 1.18 1.27 1.11
Income Statement volatility – Translational impact
Impact on adjusted1 operating profit of a 10% strengthening2 of:
£m USD EUR CNY Other3
Movement in adjusted1 operating profit 68 26 9 15
% impact on adjusted1 operating profit 6% 2% 1% 1%
Balance Sheet volatility
Impact on debt of a 10% strengthening2 of:
£m USD EUR
Increase in debt 204 75
1. Described in the glossary to the 2019 Preliminary Announcement, released on 5 March 20202. 10% strengthening against all currencies3. Assuming all other currencies strengthen against Sterling by 10% at the same time

BuyImproveSell
Interest
31
Interest
£m Facility size
At 31 December
2019
IncomeStatement
rate Cash rate
Bonds
2022 5.375% unsecured bond 450 450 2.9% 5.4%
2032 4.625% unsecured bond 300 300 4.4% 4.6%
Cross-currency swaps (2022 bonds) 74
750 824
Bank debt1
2021 term loan 824 824 3.8% 3.6%
2023 revolving credit facility 3,031 1,865 3.8% 3.4%
Cross-currency swaps 6
3,855 2,695
Other facilities 81 81
Total facilities / Gross debt 4,686 3,600 3.7% 3.6%
Cash (317)
Net debt2 3,283
1. Bank debt is presented net of £30 million of unamortised arrangement fees and includes £6 million cross-currency swaps valuation at 31 December 2019. Headroom on the Group’s committed bank facility at 31 December 2019 was £1,136 million
2. Described in the glossary to the 2019 Preliminary Announcement, released on 5 March 2020
Interest
Approximately 70% of interest exposure fixedon projected gross debt
Significant committed facility headroom
Effective average Income Statement interestrate of 3.7% on gross debt and cash rate of3.6%
2019 bond and associated cross-currencyswaps repaid in October 2019 usingcommitted bank debt
2021 term loan amended to include, atMelrose’s option, the right to extend thematurity date to April 2024

BuyImproveSell
Some helpful data for 2019
32
1. Described in the glossary to the 2019 Preliminary Announcement, released on 5 March 2020 2. IFRS 16 was effective from 1 January 2019, it increased the finance cost by £21 million (with a partially balancing uplift to operating profit) 3. £426 million of depreciation of owned property, plant and equipment and amortisation of owned computer software and depreciation of £72 million of leased assets as
described in the glossary to the 2019 Preliminary announcement released on 5 March 20204. Including the contribution paid on 6 January 20205. Includes £94 million of one-off payments, being the balance of the £150 million upfront commitment, and £17 million contribution following the disposal of Walterscheid
Powertrain Group
Continuing operations Income Statement Cash Flow
Item 2019 adjusted1 results 2019 adjusted1 results
Operating profit £1,102 million £1,102 million
Positive impact of loss-making contracts included above (£81 million) N/A
Central costs £52 million (includes a GKN LTIP charge of £20 million) (£32 million)
Adjusted free cash flow1 N/A £591 million
Finance costs2:- Bank and loan related- Amortisation of debt arrangement costs- Pension interest- Other
(£143 million) (£11 million)(£31 million)(£28 million)
(£178 million)2
Tax 21.4%(of adjusted1 profit before tax)
(£117 million)(13% of adjusted1 profit before tax)
Depreciation (£498 million)3 £498 million3
Capital expenditure N/A (£495 million)
Pension payments – ongoing contributions (global) N/A (£102 million)4
(£65 million UK, £37 million overseas)
Pension payments – special contributions N/A (£111 million) in 20195
(£56 million) in 2018
Restructuring costs (£238 million) (£190 million)
Annual dividend 5.1 pence per share (£231 million)
Non-controlling interest £6 million N/A
Number of shares in issue 4,858 million(average number of shares) N/A

![2003 annual [Read-Only]/media/Files/R/RBS... · Slide 4 Dividends 2003 2002 Dividend per ordinary share 50.3 pence 43.7 pence Dividend growth +15% +15% AVS dividend 55.0 pence 30.0](https://static.fdocuments.in/doc/165x107/5f7e0968c930365d39560b1b/2003-annual-read-only-mediafilesrrbs-slide-4-dividends-2003-2002-dividend.jpg)