Melchior de Muralt
35
GUILÉ FUNDS PRESENTATION
-
Upload
tbli-conference -
Category
Economy & Finance
-
view
419 -
download
0
Transcript of Melchior de Muralt
GUILÉ FUNDS PRESENTATION
This document is published for information purposes only. The content of this document does not constitute an offer for sale or a solicitation of an offer to purchase nor does it constitute an incentive to invest or to engage in arbitrage transactions. It may not be construed as a contract under any circumstances. The information contained in this document has not been analyzed with regard to your personal profile. If you have questions regarding any investment or if you have doubts as to whether an investment decision is appropriate, please contact your particular client representative or, if applicable, seek financial, legal or tax advice from your customary advisors. De Pury Pictet Turrettini S.A. makes every effort to verify the information provided but cannot give any guarantee as to its accuracy. Past performance that might be indicated in the information transmitted by de Pury Pictet Turrettini S.A. in no way determines future returns. Any decision to invest or divest that may be made by the reader of the information appearing herein is made at his or her sole initiative by the investor who is familiar with the mechanisms governing the financial markets. All documents legally required to be made available to investors, in particular the prospectus relating to an investment company with variable share capital (SICAV), will be provided to them upon their request. This document is the intellectual property of de Pury Pictet Turrettini S.A. Any reproduction or transmission of this document in whole or in part to a third party without the prior written authorization of de Pury Pictet Turrettini S.A. is strictly prohibited.

3
1. GUILÉ PROFILE Reconciling Performance & Engagement
2. FINANCIAL MANAGEMENTPhilosophy / Methodology / Performance
3. SHAREHOLDER MANAGEMENTAnalysis and dialogue with companies / Exercising voting rights
4. REPORTINGActivity / Results / Impact assessment

RESPONSIBLE INVESTMENT STRATEGIES
4
Negative screening
Positive screening
Best in class Engagement Integration
Shareholder activism through voting and dialogue
ESG criteria in the overall analysis
Exclusion according to anti-ESG criteria
Inclusion according to management of ESG criteria
Best in class selection (on a relative basis)
5
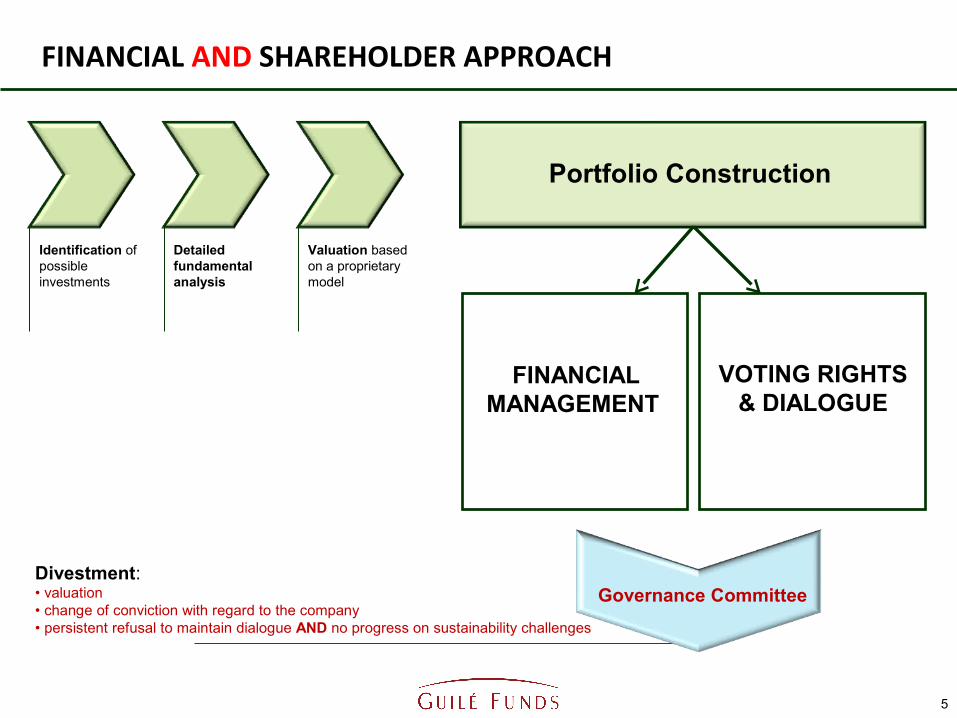
Governance Committee
Identification of possible investments
Detailed fundamental analysis
Valuation based on a proprietary model
Portfolio Construction
VOTING RIGHTS & DIALOGUE
FINANCIAL MANAGEMENT
Divestment:• valuation• change of conviction with regard to the company• persistent refusal to maintain dialogue AND no progress on sustainability challenges
FINANCIAL AND SHAREHOLDER APPROACH

FINANCING SHAREHOLDER ACTIVITY
6
Management fee paid by the
investor
Management feede Pury Pictet Turrettini
orComgest
Shareholder activity feesExercising voting rights
&Shareholder dialogue:
Team of specialists within the Guilé Foundation
%
% *
* only source of financing for Guilé engagement activities

7
1. GUILÉ PROFILE Reconciling Performance & Engagement
2. FINANCIAL MANAGEMENTPhilosophy / Methodology / Performance
3. SHAREHOLDER MANAGEMENT Exercising voting rights / Analysis and dialogue with companies
4. REPORTINGActivity / Results / Impact assessment

de PURY PICTET TURRETTINI & Cie S.A.
8
De Pury Pictet Turrettini & Cie SA was created in 1996 by David de Pury, Guillaume Pictet, Henri Turrettini and Christian Berner.
The company is held by its 8 managing partners. It manages CHF 2.5 billion as of end 2011 and employs 21 people.
The company specializes in European equities with a quality growth investment style.
It is dedicated to contributing to responsible finance in a tangible way.
Christopher Quast is a Managing Partner of PPT, which he joined in 1999. He is responsible for the asset management division. Previously, he was a Senior Project Manager at McKinsey & Co in Zurich, New York and Geneva, where, among other achievements, he directed several strategic and investment projects for banking and insurance groups. Christopher Quast is a graduate of HEC Lausanne, the Faculty of Business and Economics of the University of Lausanne, and earned an M.B.A. from INSEAD Business School in Fontainebleau.
Jean Niklas joined PPT in 2001. He is in charge of European equities research and technical market analysis. He co-manages the European equities investment portfolios. He began his career as an auditor with Arthur Andersen and then Ernst & Young in Geneva, before joining the Finance Department of the Pargesa Group in 1997, where he held various positions. Jean Niklas is a graduate of HEC Lausanne, the Faculty of Business and Economics of the University of Lausanne. He is also a Certified Public Accountant (a CPA in the US), a Chartered Financial Analyst (CFA) and a Chartered Market Technician (CMT).
Christopher Quast
Jean Niklas, CPA, CFA, CMT
EUROPEAN RESEARCH AND MANAGEMENT TEAM
9

INVESTMENT PHILOSOPHY
bottom-up
25 to 45 securities
no benchmark influence
sector diversification
Consequently:
very low turnover (5 to 7 years)
high tracking error (up to 7%)
10
long term (5 to 10 years)
companies (not shares)
fundamental research
proprietary valuation model
regular contact with the companies
revisiting investment cases

INVESTMENT PROCESS
11
Investment universe: major European companies with capitalization above EUR 3 billionInvestment universe: major European companies with capitalization above EUR 3 billion
ScreeningScreening VisitsVisits Macro-economic and technical analysis
Macro-economic and technical analysis
Broker recommendations
Broker recommendations
Fundamental analysis (approx. 100 companies)Fundamental analysis (approx. 100 companies)
Portfolio constructionPortfolio constructionRisk management
(sectors / liquidity / position size
/ market risk)
Risk management
(sectors / liquidity / position size
/ market risk)
Portfolio
25-40 positions
Portfolio
25-40 positions
An
alysisA
nalysis
Selectio
nS
election
12
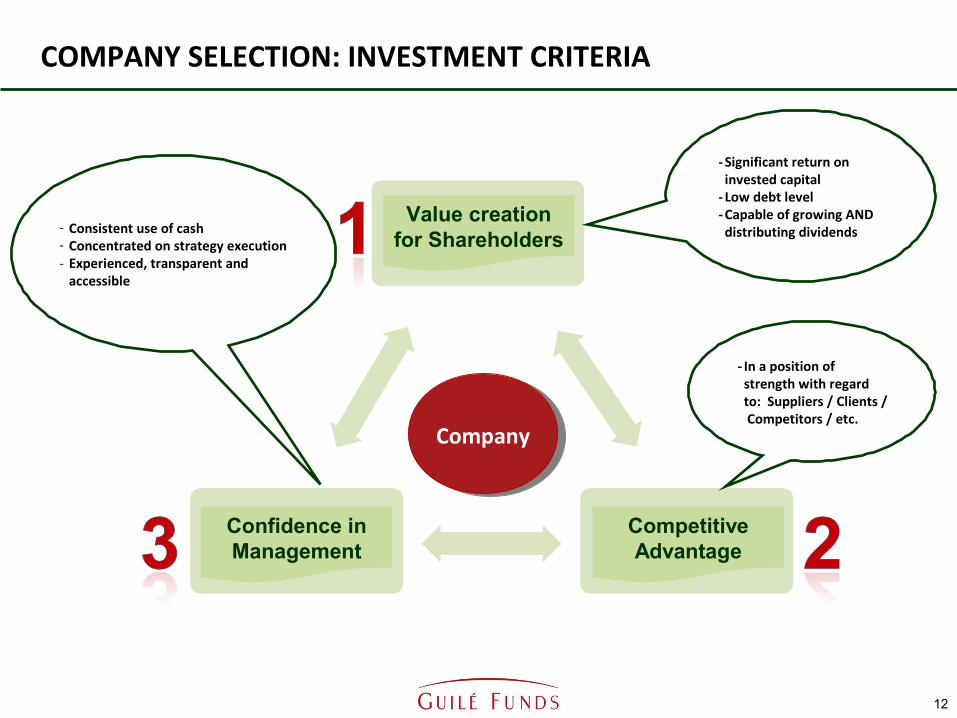
- Significant return on invested capital
- Low debt level - Capable of growing AND
distributing dividends- Consistent use of cash - Concentrated on strategy execution- Experienced, transparent and
accessible
- In a position of strength with regard to: Suppliers / Clients / Competitors / etc.
CompanyCompany
COMPANY SELECTION: INVESTMENT CRITERIA
12
Value creation for Shareholders
Confidence in Management
Competitive Advantage

… what does that mean?
13
1. CREATING VALUE …
13
Return on invested capital
Level of debt
Growth AND dividends
How much RETURN from each € invested?
How may years to REPAY the debt with
Free Cash Flow?Does the shareholder have ACCESS to the
cash?
How much does growth COST?
Can the company grow and distribute
dividends?
MUST BE HIGH
MUST BE LOW
(Net debt / FCF < 5x)
PROFITABILITY CAN FINANCE
BOTH

- Technologically advanced? - Cost leadership?- Investment in R&D?- etc.
- Technologically advanced? - Cost leadership?- Investment in R&D?- etc.
Company
Competitors
New entrants &
Substitution Risk
CommunityClients
Suppliers & inputs
14
- Market share?- Size?- Financial power?- Etc.
- Market share?- Size?- Financial power?- Etc.
- Regulation?- Community relations?- Reputation ?- etc.
- Regulation?- Community relations?- Reputation ?- etc.
- Loyalty?- Product mix?- Pricing?- etc.
- Loyalty?- Product mix?- Pricing?- etc.
- Relative size?- Pricing power?- etc.
- Relative size?- Pricing power?- etc.
2. COMPETITIVE ADVANTAGE?
14
15
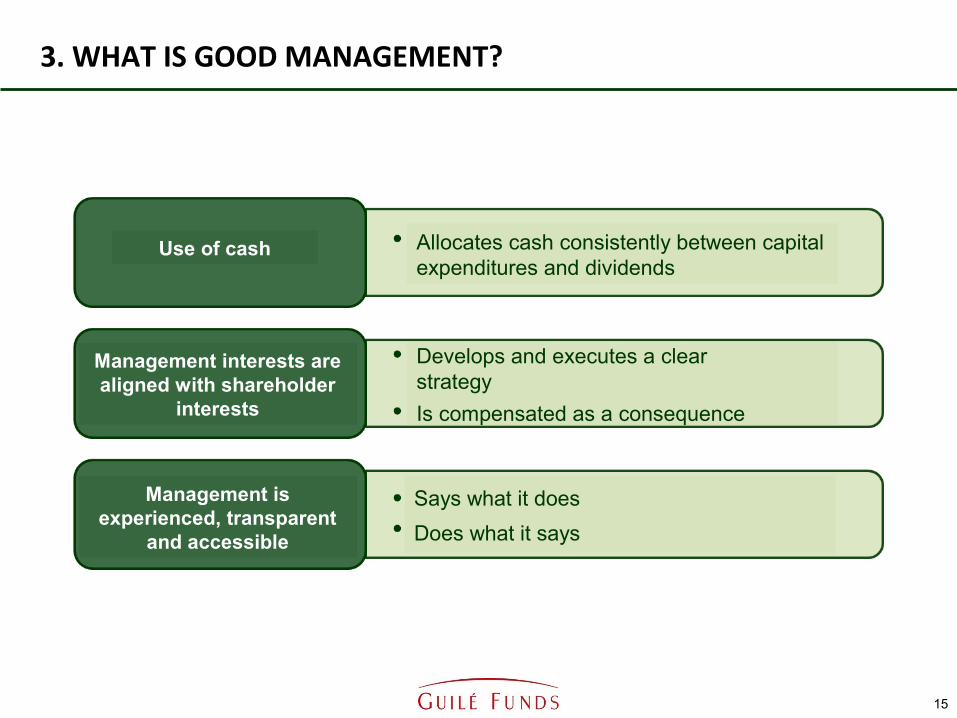
3. WHAT IS GOOD MANAGEMENT?
15
Use of cash
Management interests are aligned with shareholder
interests
Allocates cash consistently between capital expenditures and dividends
Management is experienced, transparent
and accessible
Develops and executes a clear strategy
Is compensated as a consequence
Says what it does
Does what it says
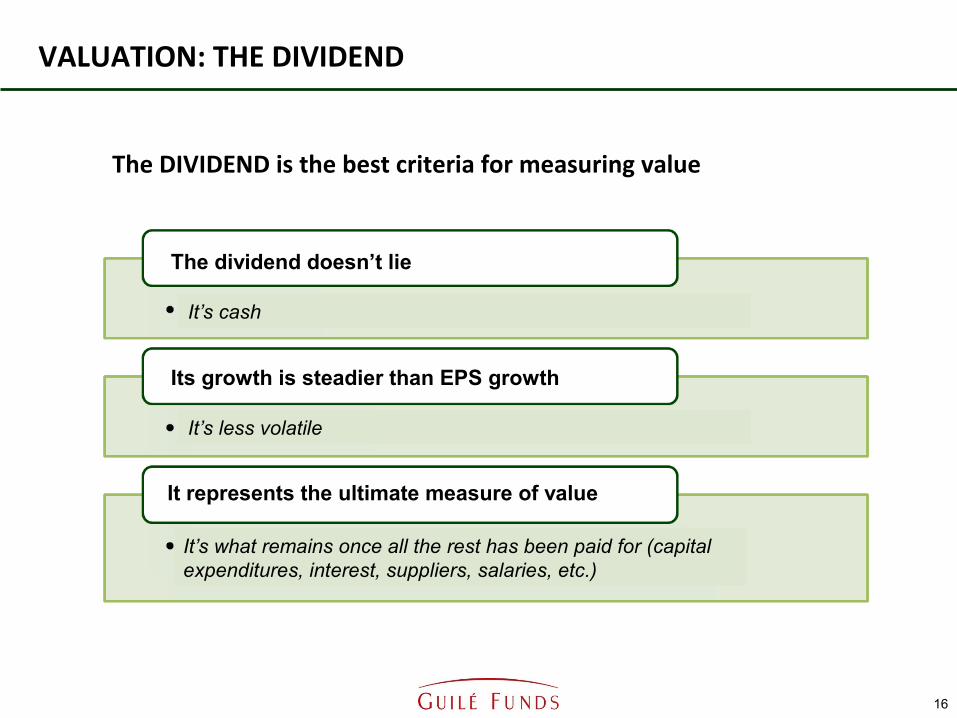
The DIVIDEND is the best criteria for measuring value
VALUATION: THE DIVIDEND
16
The dividend doesn’t lie
Its growth is steadier than EPS growth
It represents the ultimate measure of value
It’s what remains once all the rest has been paid for (capital expenditures, interest, suppliers, salaries, etc.)
It’s less volatile
It’s cash

VALUATION MODEL
17
- Analyst expectations- Source: Bloomberg
- Analyst expectations- Source: Bloomberg
- g* = ROE x (1-D%)- g* and ROE: PPT analysis
- g* = ROE x (1-D%)- g* and ROE: PPT analysis
- WACC = (Risk Free + premium)- Risk Free = 10Y German Yield- Inferred premium (market expectations)- Source: Bloomberg
- WACC = (Risk Free + premium)- Risk Free = 10Y German Yield- Inferred premium (market expectations)- Source: Bloomberg
FV =
Dn / (1+k) nΣ∞n = 1

PROVEN LONG-TERM PERFORMANCE
18
Guilé European Engagement Fund (GEEF)
created in 2006
managed in Geneva by de Pury Pictet Turrettini
aggregate data over 10 years with the same portfolio managers
superior performance and excellent rankings (see next page)
0.00
20.00
40.00
60.00
80.00
100.00
120.00
140.00
160.00
180.00
PPT
STOXX 50 ND

RELATIVE PERFORMANCE OF THE GEEF
19
Universe of investment funds sold in Switzerland and quoted in the daily newspaper “Le Temps”:
Institution Fund Name CyLaunch
DatePrice
31.12.2011 2011 2010 2009 2008 2007 Since 1.1.07
LOMBARD ODIER LO FUNDS-EUROPE HIGH CONV-IA EUR 18.01.2006 6.7 1.5% 8.0% 31.7% -42.0% 3.76% -13.1%FIDELITY FIDELITY FDS-EUROPEAN GRW-A€ EUR 02.10.1990 8.7 -14.8% 15.7% 26.8% -45.7% 21.11% -18.0%REYL REYL GLOBAL-EUROPEAN EQTYS-B EUR 07.02.2003 197.6 -15.2% 23.7% 32.7% -41.6% 0.75% -18.1%ROTSCHILD EDM ROTH PRIFUND-EURO EQTY-A EUR 14.12.2000 106.2 -15.8% 18.0% 29.7% -38.3% 2.45% -18.5%PPT CADMOS FUND MGMT-GUILE EUR-A EUR 19.10.2006 80.5 -9.5% 12.28% 26.64% -39.90% 2.39% -20.8%GAM GAM STAR-EURO EQ-ORD EUR ACC EUR 12.10.1992 180.7 -9.3% 8.8% 25.0% -40.2% 4.98% -22.6%
STOXX 50 NET DIVIDEND EUR 4180.5 -5.1% 3.1% 28.7% -41.2% 2.62% -24.0%SYZ - OYSTER OYSTER-EUROPE OPPORT-EUR EUR 01.06.1999 256.9 -15.2% 21.1% 30.2% -45.1% 3.18% -24.3%UBS UBS LUX EQTY-EUROPEAN OPP-P EUR 28.08.1990 433.1 -11.1% 12.5% 35.5% -44.8% 1.10% -24.4%FIDELITY FIDELITY FNDS-IN EU BLU-I€ EUR 16.07.2004 126.5 -15.2% 10.1% 24.7% -41.9% 10.01% -25.5%BCGE BCGE SYNCHRONY EUROPE EQUITY EUR 29.11.1996 942.3 -13.7% 19.5% 26.5% -42.9% -0.31% -25.7%BORDIER BO FUND II-EUROPE EUR 12.12.2006 70.3 -9.4% 10.9% 18.3% -41.9% 1.40% -30.0%CAPITAL INT. CAP INT EUROPEAN EQ-B EUR EUR 02.07.1999 9.2 -11.2% 11.9% 27.7% -44.7% -2.30% -31.4%JULIUS BAER JB EUROPE STOCK FUND-C EUR EUR 24.08.1999 262.4 -18.5% 13.4% 32.0% -46.2% 2.88% -32.5%PICTET PICTET-EUROPE EQ SEL-P€ EUR 31.10.1990 404.3 -11.5% 12.0% 33.3% -49.8% 0.12% -33.6%BANQUE MORVAL WILLEREQUITY EUROPE-P€ EUR 02.07.1992 16.0 -7.5% 2.5% 16.2% -39.8% -0.98% -34.3%MIRABAUD MIRABAUD-EQ SEL EUROP-A DIS€ EUR 28.06.2011 51.7 -22.6% 17.9% 24.1% -43.4% 1.67% -34.8%RAIFFEISEN RAIFFEISEN EUROAC-B EUR 23.03.1994 92.1 -10.1% 9.9% 31.1% -50.3% 1.06% -35.0%EFG BANK EFG EQUITY FDS-EUROPE EUR 01.10.2004 101.7 -16.4% 15.1% 24.4% -48.9% 4.58% -36.2%IFP QUANTAVIOUR IFP QUANT EE-€-A EUR 28.09.2006 65.8 -23.6% 7.6% 25.7% -40.2% 1.96% -37.0%IAM IAM EUROPEAN EQUITY FUND CHF 05.05.1997 1005.7 -4.0% -10.6% 22.2% -46.6% 12.18% -37.1%BCV AMC PRO EUR B EUR 22.06.2005 78.6 -16.5% 5.3% 28.8% -47.3% 2.73% -38.7%SWISSCANTO SWISSCANTO CH EQ EUROPE EUR 26.09.1986 98.8 -16.9% 7.9% 30.0% -48.6% 2.29% -38.8%BALOISE ASS. BFI EUROSTOCK EUR-R EUR 22.05.2001 29.5 -10.0% 0.4% 24.3% -47.4% 1.71% -39.9%BCV AMC PRO ACT€-A EUR 15.11.2004 60.4 -12.9% 11.9% 26.4% -53.5% 1.11% -42.1%JP MORGAN JPMORGAN F-EURO STRAT VL-A€ EUR 14.02.2000 9.6 -14.3% 2.9% 30.1% -51.0% -9.28% -49.1%BANQUE MIGROS MI-FONDS CH-EUROPESTOCK-A CHF 28.02.2006 55.6 -14.1% -10.0% 30.1% -53.8% 3.89% -51.7%ETHOS ETHOS-EQUITIE EUROPE EX CH-E CHF 13.12.2005 73.4 -12.5% -9.0% 26.6% -54.0% -2.32% -54.7%
Moyenne : -12.7% -31.9%Ecart-Type : 5.3% 10.5%
Source: Bloomberg
AverageStandard deviation
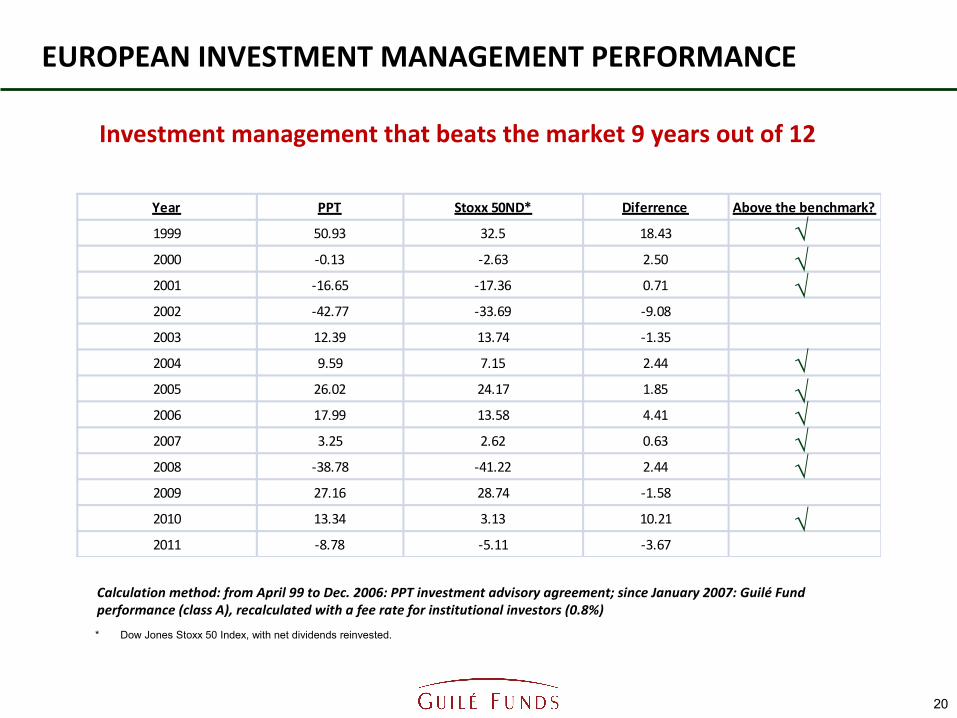
Year PPT Stoxx 50ND* Diferrence Above the benchmark?
1999 50.93 32.5 18.43
2000 -0.13 -2.63 2.50
2001 -16.65 -17.36 0.71
2002 -42.77 -33.69 -9.08
2003 12.39 13.74 -1.35
2004 9.59 7.15 2.44
2005 26.02 24.17 1.85
2006 17.99 13.58 4.41
2007 3.25 2.62 0.63
2008 -38.78 -41.22 2.44
2009 27.16 28.74 -1.58
2010 13.34 3.13 10.21
2011 -8.78 -5.11 -3.67
Investment management that beats the market 9 years out of 12
20
√
* Dow Jones Stoxx 50 Index, with net dividends reinvested.
EUROPEAN INVESTMENT MANAGEMENT PERFORMANCE
Calculation method: from April 99 to Dec. 2006: PPT investment advisory agreement; since January 2007: Guilé Fund performance (class A), recalculated with a fee rate for institutional investors (0.8%)
20
√
√
√√√√√
√
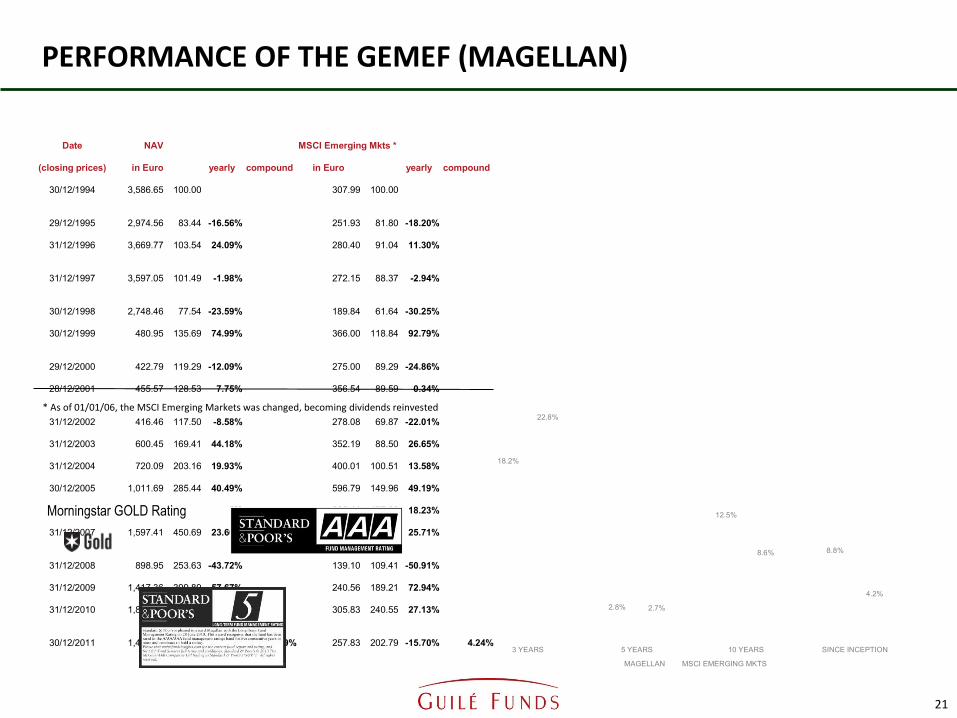
PERFORMANCE OF THE GEMEF (MAGELLAN)
21
* As of 01/01/06, the MSCI Emerging Markets was changed, becoming dividends reinvested
Date NAV MSCI Emerging Mkts *
(closing prices) in Euro yearly compound in Euro yearly compound
30/12/1994 3,586.65 100.00 307.99 100.00
29/12/1995 2,974.56 83.44 -16.56% 251.93 81.80 -18.20%
31/12/1996 3,669.77 103.54 24.09% 280.40 91.04 11.30%
31/12/1997 3,597.05 101.49 -1.98% 272.15 88.37 -2.94%
30/12/1998 2,748.46 77.54 -23.59% 189.84 61.64 -30.25%
30/12/1999 480.95 135.69 74.99% 366.00 118.84 92.79%
29/12/2000 422.79 119.29 -12.09% 275.00 89.29 -24.86%
28/12/2001 455.57 128.53 7.75% 356.54 89.59 0.34%
31/12/2002 416.46 117.50 -8.58% 278.08 69.87 -22.01%
31/12/2003 600.45 169.41 44.18% 352.19 88.50 26.65%
31/12/2004 720.09 203.16 19.93% 400.01 100.51 13.58%
30/12/2005 1,011.69 285.44 40.49% 596.79 149.96 49.19%
29/12/2006 1,292.39 364.63 27.75% 225.41 177.30 18.23%
31/12/2007 1,597.41 450.69 23.60% 283.37 222.89 25.71%
31/12/2008 898.95 253.63 -43.72% 139.10 109.41 -50.91%
31/12/2009 1,417.36 399.89 57.67% 240.56 189.21 72.94%
31/12/2010 1,809.03 510.40 27.63% 305.83 240.55 27.13%
30/12/2011 1,485.13 419.01 -17.90% 8.79% 257.83 202.79 -15.70% 4.24%
18.2%
2.8%
12.5%
8.8%
22.8%
2.7%
8.6%
4.2%
3 YEARS 5 YEARS 10 YEARS SINCE INCEPTION
MAGELLAN MSCI EMERGING MKTS
Morningstar GOLD Rating

22
1. GUILÉ PROFILE Reconciling Performance & Engagement
2. FINANCIAL MANAGEMENTPhilosophy / Methodology / Performance
3. SHAREHOLDER MANAGEMENT Exercising voting rights / Analysis and dialogue with companies
4. REPORTINGActivity / Results / Impact assessment

23
Guilé is the name formed by combining the first names of Maguy and Léon Burrus for their family home in Boncourt, Switzerland
The Burrus family company was the first to introduce retirement funds and family allowances in Switzerland
After the sale of the company, the 6th generation decided to create a foundation
Its mission is to promote entrepreneurial responsibility with respect for human dignity and the environment
PRESENTATION OF THE FONDATION GUILÉ

GLOBAL COMPACT: THE ONLY NORMATIVE FRAMEWORK
24
is a groundbreaking global initiative to promote self regulation (now 5,300 signatory companies, they will be some 20,000 in 2020!)
an initiative that aims for Corporate Social Responsibility by aligning business operations and strategies with ten universally accepted principles (in the areas of human rights, labor, the environment and combating corruption, see appendix)
which first and foremost requires transparency and the disclosure of information open to all.
Launched in January 2000, the United Nations Global Compact:
Self regulation
Signing the
Annual obligation of transparency:

FONDATION GUILÉ & GLOBAL COMPACT PARTNERSHIP
25
Memorandum that gives the Guilé Foundation the role of catalyst to help companies implement the ten principles of the Global Compact
Letter from the Director of the Global Compact, Mr. George Kell, confirms this collaboration and cooperates in the launch of the Guilé Funds
Letter from the Secretary-General of the United Nations, Mr. Ban Ki-moon, testifies to the pioneering role of the Guilé Foundation.
LEGITIMACYMemorandum Cooperation Recognition

THE TEN PRINCIPLES OF THE GLOBAL COMPACT
26
The Ten Principles of the Global Compact state that businesses should:
1.- support and respect the protection of internationally proclaimed human rights
2.- make sure that they are not complicit in human rights abuses
3.- uphold the freedom of association and the effective recognition of the right to collective bargaining
4.- eliminate all forms of forced and compulsory labor
5.- abolish child labor
6.- eliminate discrimination in respect of employment and occupation
7.- support a precautionary approach to environmental challenges
8.- undertake initiatives to promote greater environmental responsibility
9.- encourage the development and diffusion of environmentally friendly technologies
10.- work against corruption in all its forms, including extortion and bribery.
HUMAN RIGHTS
ENVIRONMENT
ANTI-CORRUPTION
LABOR STANDARDS
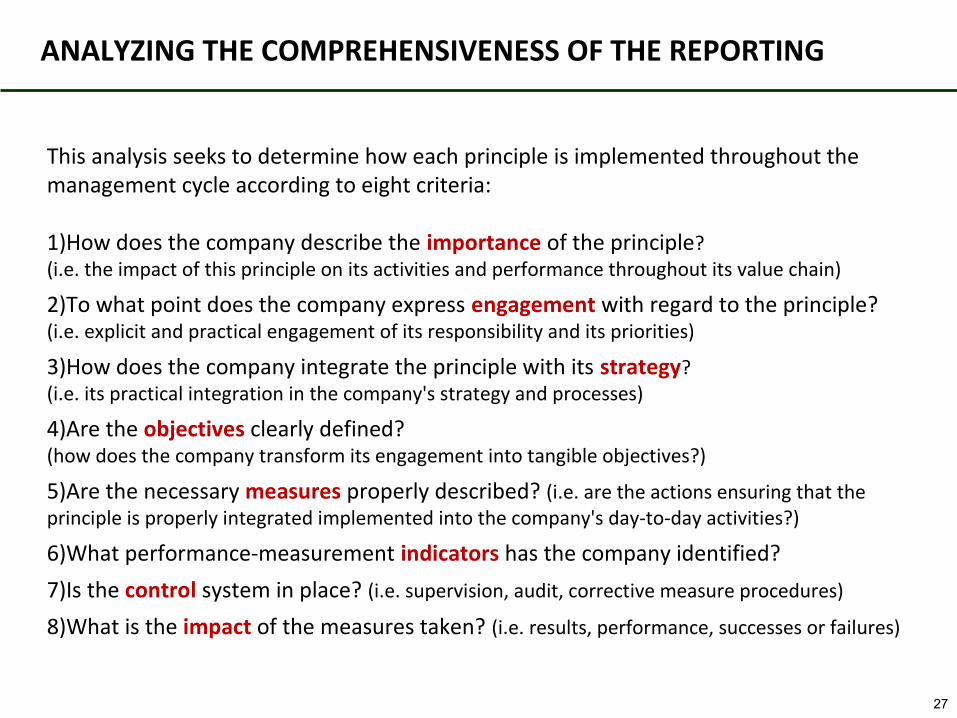
ANALYZING THE COMPREHENSIVENESS OF THE REPORTING
This analysis seeks to determine how each principle is implemented throughout the management cycle according to eight criteria:
1)How does the company describe the importance of the principle?(i.e. the impact of this principle on its activities and performance throughout its value chain)
2)To what point does the company express engagement with regard to the principle?(i.e. explicit and practical engagement of its responsibility and its priorities)
3)How does the company integrate the principle with its strategy?(i.e. its practical integration in the company's strategy and processes)
4)Are the objectives clearly defined? (how does the company transform its engagement into tangible objectives?)
5)Are the necessary measures properly described? (i.e. are the actions ensuring that the principle is properly integrated implemented into the company's day-to-day activities?)
6)What performance-measurement indicators has the company identified?
7)Is the control system in place? (i.e. supervision, audit, corrective measure procedures)
8)What is the impact of the measures taken? (i.e. results, performance, successes or failures)
27
28
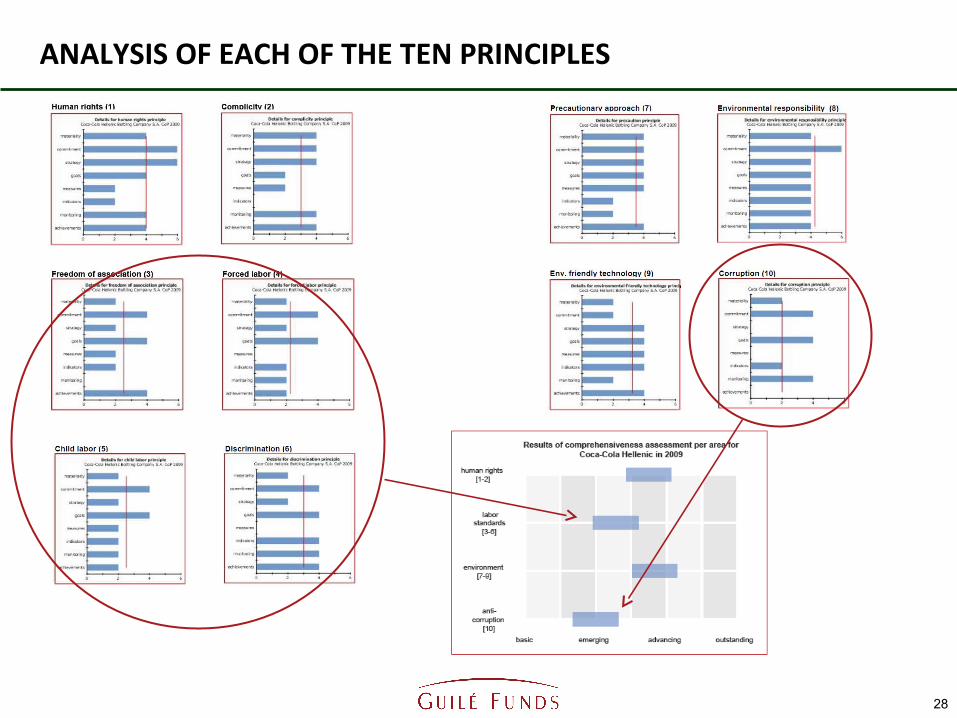
ANALYSIS OF EACH OF THE TEN PRINCIPLES
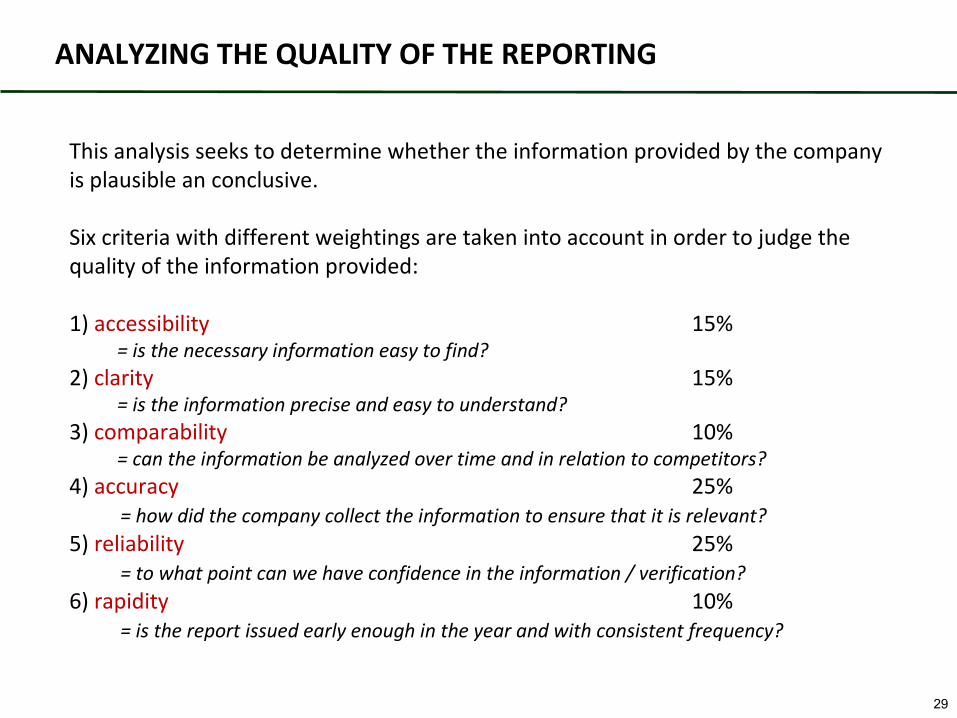
ANALYZING THE QUALITY OF THE REPORTING
This analysis seeks to determine whether the information provided by the company is plausible an conclusive.
Six criteria with different weightings are taken into account in order to judge the quality of the information provided:
1) accessibility 15% = is the necessary information easy to find?2) clarity 15% = is the information precise and easy to understand?3) comparability 10% = can the information be analyzed over time and in relation to competitors?4) accuracy 25% = how did the company collect the information to ensure that it is relevant?5) reliability 25% = to what point can we have confidence in the information / verification?6) rapidity 10% = is the report issued early enough in the year and with consistent frequency?
29

30
OVERALL GUILÉ ANALYSIS FOR EACH COMPANY
Analysis sent to the:1. Chairman of the Board of Directors2. CEO 3. Sustainable Development managers.
QUALITY OF THE REPORTING
COMPREHENSIVENESS OF THE REPORTING

GUILÉ DIALOGUE CONCLUSION: PROGRESS EXPECTATIONS
Presentation to senior management
Joint analysis of the issues
EITHER dichotomy
between reality and information
OR real internal challenges for improvementPROGRESS FOR
STAKEHOLDERS+
SHAREHOLDER VALUE
Strategy dialogue
Results of Guilé analysis of the CoP
31
Information dialogue
32
1. GUILÉ PROFILE Reconciling Performance & Engagement
2. FINANCIAL MANAGEMENTPhilosophy / Methodology / Performance
3. SHAREHOLDER MANAGEMENTExercising voting rights / Analysis and dialogue with companies
4. REPORTINGActivity / Results / Impact assessment

MONTHLY AND QUARTERLY REPORTING
33
Monthly (front):- Financial information;- Manager’s comments.
Quarterly (back):- Main dialogues conducted;- A few more specific analytical results of the companies in relation to the GC principles.

ANNUAL REPORTING
34
Annual activity report:
CONFIDENTIAL DOCUMENT
for Guilé’s clients
- Statistics on voting and engagement over the year;
- Analysis of the ten GC principles, points discussed during the dialogue with the companies, people met, degree of impact of this engagement.
Assemblée générale du 22 avril 2010 – Beurs van Berlage, Amsterdam
Informations générales :Nombre d’employés : plus de 55’000, actionnaires principaux : L’Arche Green N.V. (détenue presque à 100% par la famille Heineken) 58.78%, Massachusetts Financial Services 5.03%, après le deal du point 3b, FEMSA aura 14.94%.Le Directeur Général (van Boxmeer) et Président du CA (van Lede) sont deux fonctions séparées.
Faits marquants pour la votation à l’Assemblée Générale:
RémunérationLa politique de rémunération est basée sur une structure et une transparencecorrespondant aux standards de gouvernance en place en Hollande. Le salaire est diviséen une part fixe, une part de compensation variable à court terme, et un part decompensation variable à long terme.Le point 5a souhaite permettre de fixer des objectifs quantitatifs, comme c’est déjàprévu, pour estimer 75% du « bonus court terme », mais de façon annuelle en débutd’année sans communiquer ces objectifs considérés comme «informations sensibles »commercialement. Le point 5b, dans la même logique mais pour le plan decompensation à long terme, stipule des éléments de mesure de performance surlesquels se basent la rémunération, mais les seuils des objectifs ne sont pascommuniqués non plus.
Composition du Conseil d’AdministrationLa société ne respecte pas un des points du Code de Gouvernance des Pays-Bas quistipule que les membres du CA ne devraient pas être élus pour plus de 3 mandats de 4ans (cet élément ne s’appliquant pas aux membres de la famille propriétaire Heineken).Cela concerne en particulier M. Das.
HEINEKEN - Hollande
ANALYSE: 5e analyse de la Responsabilité d’entreprise (COP)2011: 2e discussion de Guilé avec la société, réunion téléphonique avec 4 personnes: CSR manager, sustainable development manager, integrity/compliance manager et un spécialiste en droit du travail.Résultats pour 2010 :
ANALYSE DES RAISONS DE L’INVESTISSEMENT :
La seule véritable marque mondiale – la société est virtuellement mono-produit.Ceci permet une concentration des moyens marketing –la clé dans cette activité.Présence et croissance dans de nombreux pays émergents (tendance: consommation moindre mais de produits de marque haut de gamme).
DIALOGUE : Combler les principales lacunesAlors que l'exhaustivité et la qualité du reporting sont relativement bonnes, le rapport sur les normes fondamentales du travail est encore relativement faible. La vérification interne/externe est expliquée en détail, ce qui est un gage de qualité pour le rapport.L'évaluation Guilé a révélé des lacunes concernant la gestion de la chaîne d'approvisionnement, les technologies respectueuses de l'environnement et la lutte anticorruption. Heineken a accepté les principales conclusions de l'évaluation Guilé et annoncé sa décision de renforcer le reporting sur les questions liées au travail. Heineken publiera prochainement de nouvelles directives sur les normes du travail, qui seront examinées par un groupe de partenaires. Guilé est l'un des partenaires qu'a choisis Heineken pour lui fournir un feedback. Heineken est d'accord avec Guilé sur la nécessité de contrôler l'application des nouvelles directives et d'en rendre compte l'an prochain. L'entreprise a refusé la proposition de Guilé d'intégrer ou d'harmoniser le rapport financier et le rapport sur la durabilité. Heineken préfère un rapport distinct sur la durabilité pour s'assurer que les questions ESG reçoivent l'attention nécessaire, en interne comme à l'extérieur de l'entreprise.
HEINEKEN - signataire du Global Compact depuis 2006
DEGRÉ D’ENGAGEMENT
Source: Fondation Guilé Source: Fondation Guilé
Analyse des enjeux de responsabilité D’ENTREPRISE :Le défi est de promouvoir la bière (alcool) de façon responsable (« consommation responsable »). Heineken a besoin 1) de récoltes et d'un approvisionne-ment en eau en grande quantité et de très bonne qualité, ainsi que 2) de beaucoup d'énergie pour brasser sa bière. Les risques pour son image sont liés à l'applica-tion systématique de normes éthiques et environne-mentales dans sa chaîne d'approvisionnement.
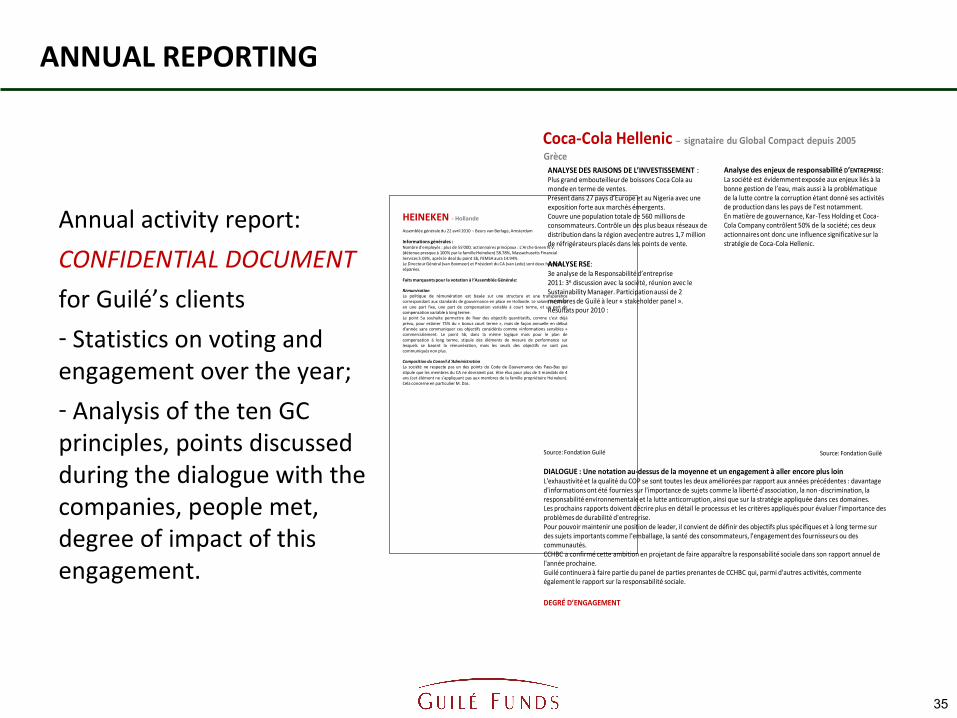
ANNUAL REPORTING
35
Annual activity report:
CONFIDENTIAL DOCUMENT
for Guilé’s clients
- Statistics on voting and engagement over the year;
- Analysis of the ten GC principles, points discussed during the dialogue with the companies, people met, degree of impact of this engagement.
Assemblée générale du 22 avril 2010 – Beurs van Berlage, Amsterdam
Informations générales :Nombre d’employés : plus de 55’000, actionnaires principaux : L’Arche Green N.V. (détenue presque à 100% par la famille Heineken) 58.78%, Massachusetts Financial Services 5.03%, après le deal du point 3b, FEMSA aura 14.94%.Le Directeur Général (van Boxmeer) et Président du CA (van Lede) sont deux fonctions séparées.
Faits marquants pour la votation à l’Assemblée Générale:
RémunérationLa politique de rémunération est basée sur une structure et une transparencecorrespondant aux standards de gouvernance en place en Hollande. Le salaire est diviséen une part fixe, une part de compensation variable à court terme, et un part decompensation variable à long terme.Le point 5a souhaite permettre de fixer des objectifs quantitatifs, comme c’est déjàprévu, pour estimer 75% du « bonus court terme », mais de façon annuelle en débutd’année sans communiquer ces objectifs considérés comme «informations sensibles »commercialement. Le point 5b, dans la même logique mais pour le plan decompensation à long terme, stipule des éléments de mesure de performance surlesquels se basent la rémunération, mais les seuils des objectifs ne sont pascommuniqués non plus.
Composition du Conseil d’AdministrationLa société ne respecte pas un des points du Code de Gouvernance des Pays-Bas quistipule que les membres du CA ne devraient pas être élus pour plus de 3 mandats de 4ans (cet élément ne s’appliquant pas aux membres de la famille propriétaire Heineken).Cela concerne en particulier M. Das.
HEINEKEN - Hollande
DIALOGUE : Une notation au-dessus de la moyenne et un engagement à aller encore plus loin L'exhaustivité et la qualité du COP se sont toutes les deux améliorées par rapport aux années précédentes : davantage d'informations ont été fournies sur l'importance de sujets comme la liberté d'association, la non -discrimination, la responsabilité environnementale et la lutte anticorruption, ainsi que sur la stratégie appliquée dans ces domaines. Les prochains rapports doivent décrire plus en détail le processus et les critères appliqués pour évaluer l'importance des problèmes de durabilité d'entreprise.Pour pouvoir maintenir une position de leader, il convient de définir des objectifs plus spécifiques et à long terme sur des sujets importants comme l'emballage, la santé des consommateurs, l'engagement des fournisseurs ou des communautés. CCHBC a confirmé cette ambition en projetant de faire apparaître la responsabilité sociale dans son rapport annuel de l'année prochaine. Guilé continuera à faire partie du panel de parties prenantes de CCHBC qui, parmi d'autres activités, commente également le rapport sur la responsabilité sociale.
Source: Fondation Guilé
ANALYSE RSE: 3e analyse de la Responsabilité d’entreprise2011: 3e discussion avec la société, réunion avec le Sustainability Manager. Participation aussi de 2 membres de Guilé à leur « stakeholder panel ».Résultats pour 2010 :
Source: Fondation Guilé
ANALYSE DES RAISONS DE L’INVESTISSEMENT :Plus grand embouteilleur de boissons Coca Cola au monde en terme de ventes.Présent dans 27 pays d’Europe et au Nigeria avec une exposition forte aux marchés émergents.Couvre une population totale de 560 millions de consommateurs. Contrôle un des plus beaux réseaux de distribution dans la région avec entre autres 1,7 million de réfrigérateurs placés dans les points de vente.
Grèce
Coca-Cola Hellenic – signataire du Global Compact depuis 2005
DEGRÉ D’ENGAGEMENT
Analyse des enjeux de responsabilité D’ENTREPRISE:La société est évidemment exposée aux enjeux liés à la bonne gestion de l’eau, mais aussi à la problématique de la lutte contre la corruption étant donné ses activités de production dans les pays de l’est notamment.En matière de gouvernance, Kar-Tess Holding et Coca-Cola Company contrôlent 50% de la société; ces deux actionnaires ont donc une influence significative sur la stratégie de Coca-Cola Hellenic.