melatonin normalizes clinical and biochemical parameters of mild ...
29
Cano Barquilla, Pilar ; Pagano, Eleonora S. ; Jiménez Ortega, Vanesa ; Fernández Mateos, Pilar ; Esquifino, Ana I. ; Cardinali, Daniel P. Melatonin normalizes clinical and biochemical parameters of mild inflammation in diet-induced metabolic syndrome in rats Preprint del documento publicado en Journal of Pineal Research, Nº 57, 2014 Este documento está disponible en la Biblioteca Digital de la Universidad Católica Argentina, repositorio institucional desarrollado por la Biblioteca Central “San Benito Abad”. Su objetivo es difundir y preservar la producción intelectual de la Institución. La Biblioteca posee la autorización de los autores y de la editorial para su divulgación en línea. Cómo citar el documento: Cano Barquilla, P, Pagano, ES, Jiménez Ortega, V, Fernández Mateos, P, Esquifino, AI, Cardinlai, DP. Melatonin normalizes clinical and biochemical parameters of mild inflammation in diet-induced metabolic syndrome in rats [en línea]. Preprint del documento publicado en Journal of Pineal Research 2014;57. Disponible en :http://bibliotecadigital.uca.edu.ar/repositorio/investigacion/melatonin-normalizes-clinical-biochemical.pdf [Fecha de consulta: …]
Transcript of melatonin normalizes clinical and biochemical parameters of mild ...

Cano Barquilla, Pilar ; Pagano, Eleonora S. ; Jiménez Ortega, Vanesa ; Fernández Mateos, Pilar ; Esquifino, Ana I. ; Cardinali, Daniel P.
Melatonin normalizes clinical and biochemical parameters of mild inflammation in diet-induced metabolic syndrome in rats
Preprint del documento publicado en Journal of Pineal Research, Nº 57, 2014
Este documento está disponible en la Biblioteca Digital de la Universidad Católica Argentina, repositorio institucional desarrollado por la Biblioteca Central “San Benito Abad”. Su objetivo es difundir y preservar la producción intelectual de la Institución.La Biblioteca posee la autorización de los autores y de la editorial para su divulgación en línea.
Cómo citar el documento:
Cano Barquilla, P, Pagano, ES, Jiménez Ortega, V, Fernández Mateos, P, Esquifino, AI, Cardinlai, DP. Melatonin normalizes clinical and biochemical parameters of mild inflammation in diet-induced metabolic syndrome in rats [en línea]. Preprint del documento publicado en Journal of Pineal Research 2014;57. Disponible en :http://bibliotecadigital.uca.edu.ar/repositorio/investigacion/melatonin-normalizes-clinical-biochemical.pdf [Fecha de consulta: …]

1
Preprint of article published in Journal of Pineal Research, 57:280–290, 2014
Melatonin Normalizes Clinical and Biochemical
Parameters of Mild Inflammation in Diet-induced
Metabolic Syndrome in Rats
Pilar Cano Barquilla1, Eleonora S, Pagano2, Vanesa Jiménez-Ortega1, Pilar
Fernández-Mateos3, Ana I. Esquifino1 and Daniel P. Cardinali2,4.*
1 Department of Biochemistry and Molecular Biology III, Faculty of Medicine,
Universidad Complutense, Madrid 28040, Spain.
2 Department of Teaching & Research, Faculty of Medical Sciences, Pontificia
Universidad Católica Argentina, 1107 Buenos Aires, Argentina.
3 Department of Cellular Biology, Faculty of Medicine, Universidad Complutense,
Madrid 28040, Spain
4 Department of Physiology, Faculty of Medicine, University of Buenos Aires, 1121
Buenos Aires, Argentina.
* Corresponding Author:
Dr. D.P. Cardinali,
Director, Departamento de Docencia e Investigación,
Facultad de Ciencias Médicas,
Pontificia Universidad Católica Argentina,
Av. Alicia Moreau de Justo 1500, 4o piso
1107 Buenos Aires, Argentina.
Tel: +54 11 43490200 ext 2310
E-mail: [email protected]; [email protected]
Running title: Melatonin and Mild Inflammation in High-Fat Fed Rats.

2
Abstract
The objective of the present study was to evaluate the efficacy of melatonin to
affect mild inflammation in the metabolic syndrome (MS) induced by a high-fat
diet in rats. Adult Wistar male rats were divided into four groups (n= 16/group):
(i) control diet (3% fat); (ii) high-fat (35%) diet; (iii) high-fat diet + melatonin; (iv)
melatonin. Rats had free access to high-fat or control chow and one of the
following drinking solutions for 10 weeks: (a) tap water; (b) 25 μg/mL of
melatonin. Plasma interleukin (IL)-1β, IL-4, IL-6, IL-10, tumor necrosis factor
(TNF)-α, interferon (IFN)-γ and C-reactive protein (CRP) were measured at two
time intervals, i.e. the middle of daylight period and the middle of the scotophase.
In addition, a number of somatic and metabolic components employed clinically to
monitor the MS were measured. Melatonin decreased the augmented circulating
levels of IL-1β, IL-6, TNF-α, IFN-γ and CRP seen in obese rats and restored the
depressed levels of IL-4 and IL-10. Rats fed with the high-fat diet showed
significantly higher body weights and augmented systolic blood pressure from the
3rd and 4th week onwards, respectively, melatonin effectively preventing these
changes. In high-fat fed rats circulating low-density lipoprotein-cholesterol, total
cholesterol and triglyceride concentration augmented significantly, melatonin
being effective to counteract these changes. Melatonin-treated rats showed a
decreased insulin resistance, the highest values of plasma high-density
lipoprotein-cholesterol and the lowest values of plasma uric acid. The results
indicate that melatonin is able to normalize the altered biochemical pro-
inflammatory profile seen in rats fed with a high-fat diet.
Key words:
cytokines; dyslipidemia; glucose tolerance; high fat diet; hypertension;
inflammation; uric acid.

3
Introduction
The metabolic syndrome (MS), a cluster of cardiovascular disease risk factors
including obesity, hypertension, hyperinsulinemia, glucose intolerance and
dyslipidemia, is a major clinical challenge with a prevalence of 15-30% depending
on the world region considered [1]. The MS increased overall cardiovascular
mortality by 1.5- to 2.5-fold and together with neurodegenerative disorders like
Alzheimer’s disease, are the two greatest public health concerns of the 21st century
[2,3].
There is impressive information indicating that obesity in MS is associated with
a low-grade inflammation of the white adipose tissue that can subsequently lead to
insulin resistance, impaired glucose tolerance and diabetes [4,5]. Adipocytes
actively secrete leptin and proinflammatory cytokines and activate a vicious cycle
leading to additional weight gain largely in the form of fat [2]. Inflammation in
obesity is also indicated by the increased circulating levels of C-reactive protein
(CRP) and other biological markers of inflammation.
Adipose tissue-produced pro-inflammatory molecules like tumor necrosis
factor-α (TNF-α), interleukin (IL)-1β and IL-6 have both local and systemic effects
[5]. The amounts of TNF-α, IL-1β and IL-6 are positively correlated with body fat
and decrease in obese patients after weight loss. Therefore, fat cells are both a
source of and a target for TNF-α, IL-1β and IL-6 effects [5].
In a previous study we assessed the effect of a high-fat diet (35% fat) on mean
levels and 24-h pattern of circulating IL-1β, IL-6 and TNF-α in rats [6]. Mean levels
of plasma cytokines augmented and the normal daily pattern seen in control
became disrupted in high-fat fed rats compatible with the occurrence a mild
inflammation. In a similar group of high-fat fed rats we also reported a significant
decrease in amplitude of pineal melatonin rhythm [7] and the reversion by
melatonin, administered orally for 9 weeks of body weight, dyslipidemia and
insulin resistance [8].
The objective of the present study was to further evaluate the efficacy of
melatonin to normalize clinical and biochemical signs of mild inflammation in the
MS induced by a high-fat diet in rats. Plasma IL-1β, IL-4, IL-6, IL-10, TNF-α,
interferon (IFN)-γ and CRP were measured at two time intervals, i.e., the middle of
daylight period and the middle of scotophase. In addition a number of somatic and

4
metabolic components employed clinically to monitor the MS, i.e., body weight
increase, systolic blood pressure (BP) and several circulating analytes including
insulin, glucose, triglycerides, total cholesterol, high-density lipoprotein-
cholesterol (HDL-c), low-density lipoprotein-cholesterol (LDL-c), total protein,
creatinine, urea and uric acid were measured. At the time of completion of the
present experiments a publication by Agil et al. [9]reported that melatonin was
effective in ameliorating low-grade inflammation in young Zucker diabetic fatty
rats as demonstrated by the decrease of plasma IL-6, TNF-α and CRP levels.
Materials and Methods
Animals and experimental design
Male Wistar rats (70 days of age, 230-260 g) were maintained under standard
conditions with controlled light (12:12 h light/dark schedule; lights on at 08:00 h)
and temperature (22 ± 2 C). Rats had ad libitum access to a normal or a high-fat
diet. Normal rat chow contained 3% fat, 16% protein and 60% carbohydrate
(mainly as starch with less than 0.4% fructose) providing a total caloric content of
2.9 Kcal/g. The high (35%) fat chow contained 35% carbohydrates and 20%
proteins, providing a total caloric content of 5.4 Kcal/g.
Animals were randomly divided into four groups (n= 16/group) as follows: (i)
control; (ii) high-fat diet (obese); (iii) obese + melatonin; (iv) melatonin. Rats had
free access to high-fat or control chow and one of the following drinking solutions
for 10 weeks: (a) tap water; (b) 25 μg/mL of melatonin. Since ethanol was used as
a melatonin´s vehicle, drinking solutions in groups (i) and (iv) 0.015 % ethanol
was added to the drinking solutions. Water bottles were changed every other day.
Because rats drank about 30 mL/day with 90–95% of this total daily water taken
up during the dark period, the daily melatonin dosage used provided
approximately 2.3 mg/kg melatonin. The human equivalence dose, calculated by
using the body surface area normalization method [10] was about 0.35 mg/kg
(about 25-30 mg/day for a 75 kg human adult).
The animals were weighed once a week for 10 wk and were euthanized by
decapitation under conditions of minimal stress at two time intervals: at the
middle of the light period (13:00 h) and at the middle of the scotophase (01:00 h).
All experiments were conducted in accordance with the guidelines of the

5
International Council for Laboratory Animal Science (ICLAS). Trunk blood was
collected and plasma samples were obtained by centrifugation of blood at 1,500 x g
for 15 min and were stored at –70 C until further analysis.
BP measurement
Systolic BP was measured by using a manometer-tachometer (Rat Tail NIBP
System; ADInstruments Pty Ltd., Sydney, Australia) employing an inflatable tail-
cuff connected to a MLT844 Physiological Pressure Transducer (ADInstruments)
and PowerLab data acquisition unit (ADInstruments) as described previously [11].
Rats were placed in a plastic holder mounted on a thermostatically controlled
warm plate that was maintained at 35°C during measurements. An average value
from three-BP readings (that differed by no more than 2 mm Hg) was determined
for each animal after they became acclimated to the environment. BP
measurements were made weekly between 09:00 and 12:00 h.
Biochemical assays
Plasma concentrations of IL-1β, IL-6, TNF-α, IFN-γ and insulin were measured
in a multianalyte profiling by using the Luminex-100 system and the XY Platform
(Luminex Corporation, Oosterhout, The Netherlands) as described elsewhere [6].
Calibration microspheres for classification and reporter readings as well as sheath
fluid were also purchased from Luminex Corporation. Acquired fluorescence data
were analyzed by the MasterPlexTM QT software. All analyses were performed
according to the manufacturer’ protocol. Plasma concentrations of IL-4, IL-10 and
CRP were measured by ELISA assays (Elabscience Biotechnology Co., Wuhan,
Hubei Province, China) following manufacturers’ instructions. Concentrations
were estimated from a standard curve and expressed as pg/mL (IL-4 and IL-10) or
µg/mL (CRP). The plasma concentrations of glucose, cholesterol, triglycerides,
HDL-c, LDL-c, urea, uric acid, total protein and creatinine were measured by
commercially available kits according to the manufacturers' instructions (Randox
Laboratories, Antrim, Northern Ireland, UK).
Statistical analysis

6
After verifying normality of distribution of data, the statistical analysis was
performed by a three-factor analysis of variance (ANOVA) or a one-way ANOVA
followed by a Holm-Sidak multiple comparisons test, as stated. The three-factor
ANOVA was used to test for differences between individual data grouped
according to the levels of each factor, i.e. treatment, diet, and time period, and for
interactions between the factors. Four hypotheses were tested: (a) there was no
difference between the levels of treatment (melatonin or vehicle); (b) there was no
difference between the levels of diet (normal or high-fat diet); (c) there was no
difference between the levels of time period (weeks or middle of day or middle of
night, as stated); (d) there was no interaction between the factors. P values lower
than 0.05 were taken as evidence of statistical significance.
Results
Individual daily chow and water consumption were similar for controls (17 ± 3
g and 27 ± 3 ml) and high-fat-fed rats (16 ± 3 g and 29 ± 2 ml). The percentage of
food intake at night was 75.7 ± 6.5 % (normal diet), 79.8 ± 8.1% (high-fat diet),
81.1± 6.7% (high-fat diet + melatonin) and 71.0 ± 8.9 (melatonin; F= 0.03, P= 0.98,
ANOVA). Melatonin administration did not affect significantly chow or water
consumption.
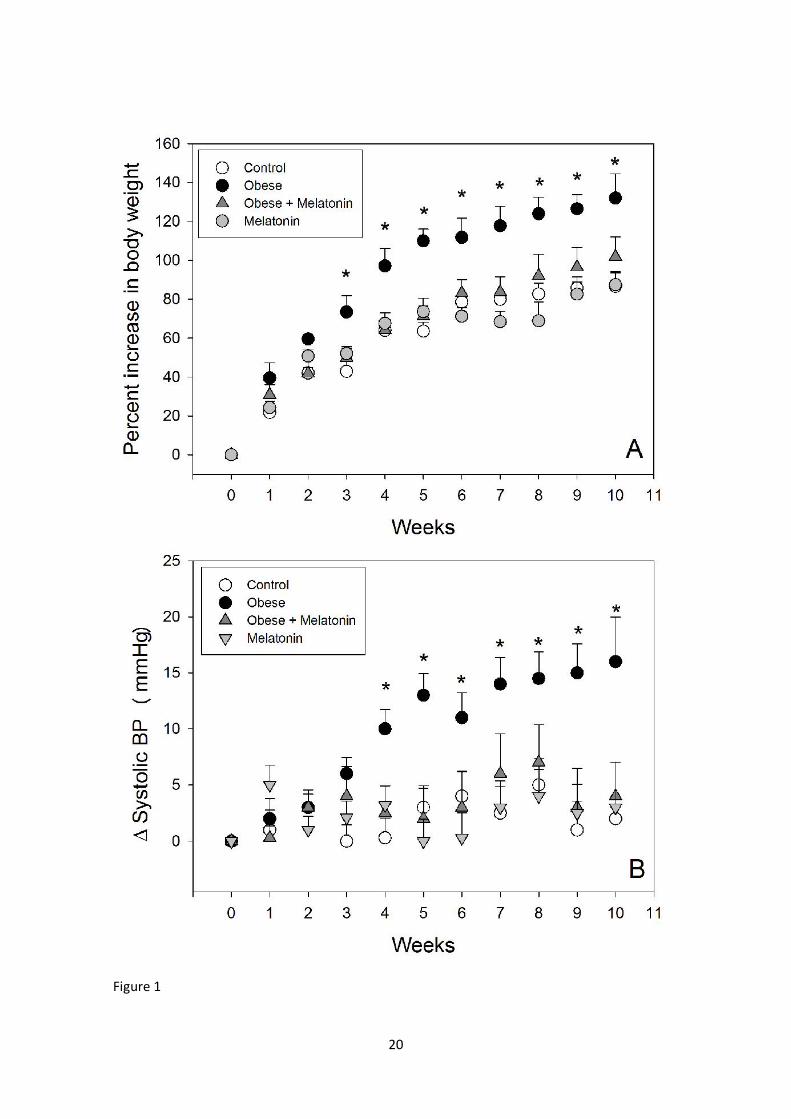
Figure 1 depicts the changes in body weight and systolic BP in the four
experimental groups. Body weight of high-fat–fed rats receiving vehicle attained
values 44 % higher than controls after 70 days of treatment (Panel A). The
concomitant administration of melatonin significantly attenuated body weight
increase in high-fat–fed rats. In the three-factor ANOVA all factors were significant
(F= 50.4, P< 0.001 for treatment; F= 103.9, P< 0.001 for diet; F= 43.9, P<0.001 for
week interval) as well as the interactions “treatment x diet” (F= 35.1, P< 0.001)
and “diet x week interval”, F= 5.6, P= 0.023). The significant interactions found
supported the conclusion that the effect of melatonin on body weight increase is
seen mainly in obese rats and is dependent on the elapsed time of treatment.
Systolic BP was significantly higher in the obese rats from the 4th week on,
melatonin being effective to counteract this effect (Fig. 1, Panel B). In the three-
factor ANOVA the significant factors detected were treatment (F= 26.2, P< 0.001)

7
and diet (F= 36.3) with a significant interaction “treatment x diet” (F= 35.1, P<
0.001) indicating that the effect of melatonin was mainly observed in obese rats.
Figure 2 summarizes the changes in plasma IL-1β and IL-6 levels at the two
examined time intervals after the 10-week experiment. Obesity generally
augmented both cytokines and melatonin decreased them. In the three-way
ANOVA the three factors were significant for IL-1β results (F= 94.6, P< 0.001 for
treatment; F= 12.7, P< 0.001 for diet; F= 72.6, P<0.001 for time of day) as well as
the interactions “treatment x diet” (F= 12.1, P= 0.001), “treatment x time of day”
(F= 56.6, P< 0.001) and “diet x time of day”, F= 5.6, P= 0.023). In the case of IL-6
two factors were significant (F= 29.1, P< 0.001 for treatment; F= 69.1, P<0.001 for
time of day) with significant interactions “treatment x diet” (F= 4.67, P= 0.03) and
“treatment x time of day” (F= 18.7, P< 0.001). Collectively this analysis supported
the view that melatonin decreased IL-1β and IL-6 mainly in obese rats. Melatonin
treatment was effective to decrease both cytokine levels at day hours.
Plasma levels of TNF-α and IFN-γ in rats fed a normal or a high-fat diet and
receiving melatonin or vehicle in drinking water are shown in figure 3. As results
in figure 2, the high-fat diet brought about an increase in both cytokines melatonin
being effective to reverse the changes observed. The three factors were statistically
significant for TNF-α and IFN-γ (F= 29.4 and F= 14.1, P< 0.001 for treatment; F=
11.7 and 10.9, P= 0.002 for diet; F= 171.2 and 12.1, P<0.001 for time of day,
respectively). The interactions were significant for TNF-α only (“treatment x diet”:
F= 15.5, P< 0.001); “treatment x time of day”: F= 17.8, P< 0.001; “diet x time of
day”: F= 10.9, P= 0.002). In the case of IFN-γ the three-factors were significant (F=
14.1, P< 0.001 for treatment; F= 10.9, P= 0.002 for diet; F= 12.1 P= 0.001 for time
of day). Collectively this indicated that melatonin decreased TNF-α and IFN-γ in
obese rats. Melatonin treatment was globally effective to decrease IFN-γ at day
hours. The circulating levels of IL-1β, IL-6 and TNF-α detected during the day were
significantly greatly than those found in daylight (Figs. 2 and 3).
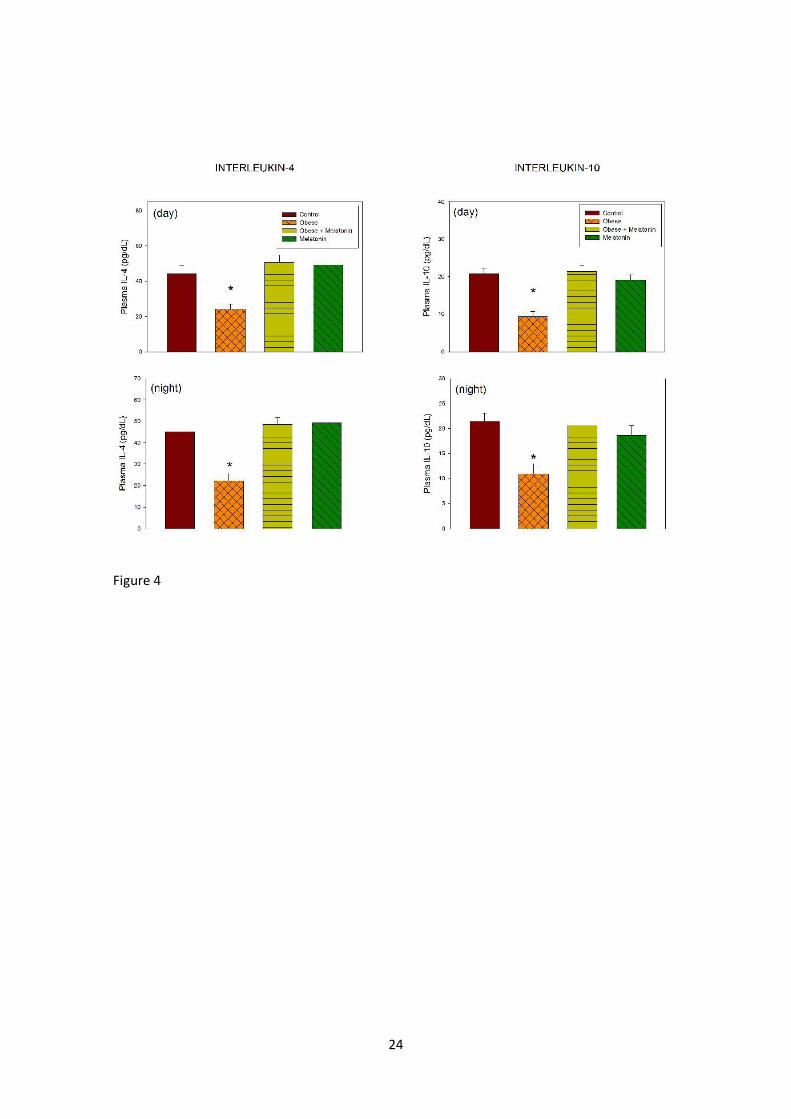
Figure 4 depicts the changes in plasma IL-4 and IL-10 levels. The picture for
both anti-inflammatory cytokines was similar, the high-fat diet decreasing and
melatonin restoring the levels to controls. In the three-factor ANOVA the only
factor significant was treatment (F= 16.1 and 12.9 for IL-4 and IL-10, P <0.001,

8
respectively) with a significant interaction “treatment x diet” (F= 32.2 and 26.7, P<
0.001, respectively), the effect of melatonin being observed in the obese rats only.
As shown in table 1 plasma CRP levels augmented 40-57% in obese rats, an
effect blunted by concomitant melatonin administration. In the three-way ANOVA
the only factor significant was treatment (F= 26.3, P <0.001) with a significant
interaction “treatment x diet” (F= 15.5, P< 0.001, respectively) the effect of
melatonin being observed in the obese rats only.
Results shown in figures 5 to 8 summarize the efficacy of melatonin to prevent a
number of biochemical changes typical of MS. The high-fat diet induced insulin
resistance as shown by the significantly augmented plasma insulin and glucose
levels, the effect being prevented by melatonin (Fig. 5). In the three-factor ANOVA,
two factors were significant for insulin (F= 54.3, P< 0.001 for treatment; F= 23.8,
P< 0.002 for diet) as well as the interaction “treatment x diet” (F= 14.4, P< 0.001).
In the case of glucose the three-factors were significant (F= 41.6, P< 0.001 for
treatment; F= 35.1, P< 0.001 for diet; F= 65.4 P< 0.001 for time of day) with a
significant interaction “treatment x diet” (F= 23.9, P<0.001). Collectively the
results indicate that melatonin decreased insulin resistance in obese rats (Fig. 5).
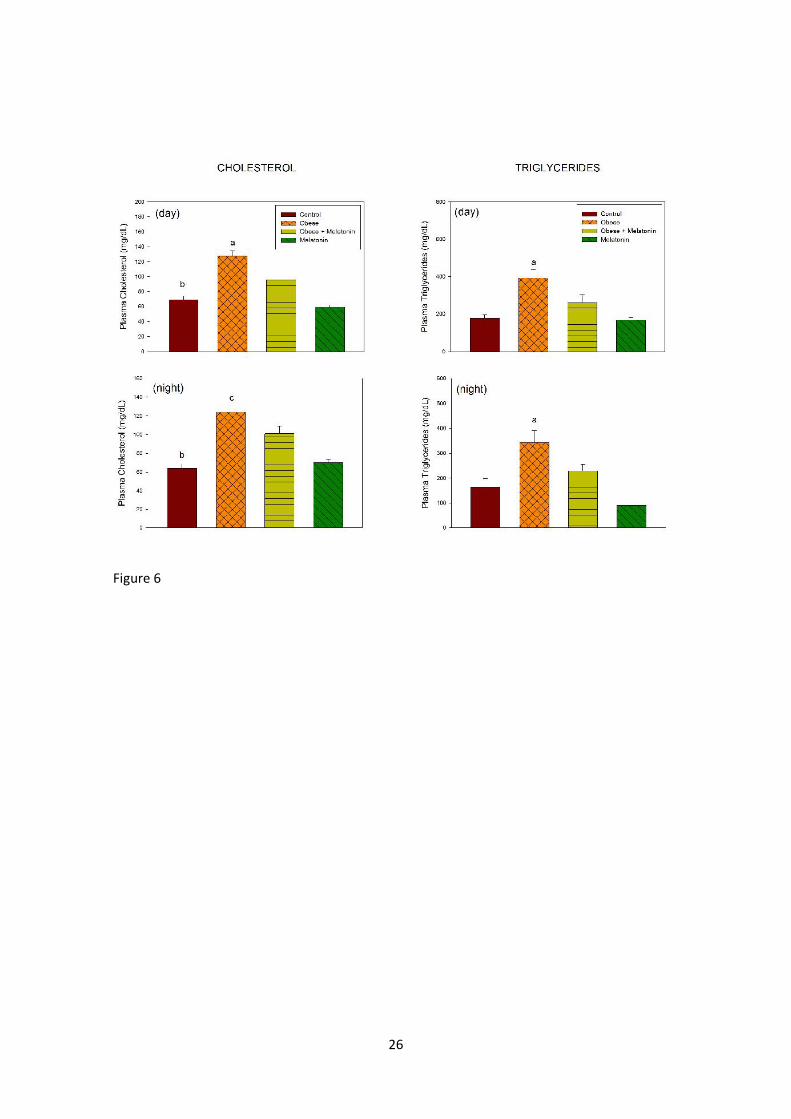
The changes in plasma lipid profile are summarized in figures 6 and 7. The
increase in total cholesterol, triglycerides and LDL-c brought about by the high-fat
diet was reversed by melatonin whereas the highest value of HDL-c was seen in
melatonin-treated rats. This was further supported by the three-way ANOVA. Two
factors were significant for cholesterol and LDL-c, i.e. treatment (F= 71.3 and F=
32.9, P< 0.001, respectively) and diet (F= 6.72, P= 0.03 and F= 42.1, P< 0.001,
respectively). In the case of triglycerides the three factors were significant (F=
16.3, P< 0.001 for treatment; F= 58.8, P< 0.001 for diet; F= 4.11, P= 0.046 for time
of day) as well as the interaction “treatment x diet” (F= 4.65, P= 0.034). For HDL-c
the only significant factor detected was treatment (F= 71.3, P< 0.001).
The plasma levels of urea remained unchanged in rats fed a normal or a high-fat
diet with melatonin or vehicle while the lowest value of plasma uric acid was seen
in melatonin-treated animals, as indicated by both by the one-way ANOVA shown
in the Fig. 8 well as by the significance of the factor treatment in the three-way
ANOVA (F= 114.8, P< 0.001). Neither total plasma protein nor plasma creatinine
changed significantly in the four examined groups (results not shown).

9
Discussion
The foregoing results support the view that melatonin is able to normalize the
altered biochemical pro-inflammatory profile seen in obese rats fed a high-fat diet.
Melatonin decreased the augmented circulating levels of IL-1β, IL-6, TNF-α, IFN-γ
and CRP, all markers of inflammation, and restored the depressed circulating
levels of the anti-inflammatory cytokines IL-4 and IL-10. Rats fed with the high-fat
diet showed significantly higher body weights and augmented systolic BP from the
3rd and 4th week on, respectively, melatonin effectively preventing these changes.
Additionally, in high-fat fed rats circulating LDL-c, cholesterol and triglyceride
concentration augmented significantly, melatonin having the opposite effect.
Melatonin administration counteracted the increased insulin resistance seen in
obese rats and resulted in the highest values of plasma HDL-c and the lowest
values of circulating uric acid.
TNF-α, IL-1β and IL-6 are major soluble factors of the innate response and are
considered as indicators of inflammation, like that occurring in high-fat fed rats
[4]. In the case of the specific immune response, and based on the cytokine milieu,
T helper (Th) lymphocytes can differentiate primarily into several major
phenotypes. One of these, Th1 cells, play a key role in the development of
inflammatory processes through the production of IFN-γ, a cytokine which showed
increased circulating values in the group of high-fed rats studied herein. Th2 cells
produce cytokines such as IL-4 and IL-10 that mediate, among other, anti-
inflammatory responses and tended to be impaired under the predominance of a
pro-inflammatory condition like obesity [4]. Therefore, the increased in circulating
levels of IL-1β, IL-6, TNF-α and IFN-γ with the concomitant decrease of IL-4 and IL-
10 reported in obese rats in the present study all support the conclusion that a
mild inflammation happened in rats after a high-fat diet administration. Such a
conclusion is further supported by the increase of another marker of inflammation,
i.e. plasma CRP in high-fat fed rats.
Among several substances with the capacity to curtail the MS, melatonin has
received attention because of its very low or absent toxicity that turns it
potentially appropriate for human use. Concerning the immune system, Carrillo-
Vico and co-workers have put forth the idea that melatonin acts as a buffer for the
10
immune system, displaying stimulant effects under basal or immunosuppressive
conditions and acting as an anti-inflammatory signal in situations when there is an
exacerbated immune response [12]. Indeed, melatonin neutralized the exacerbated
production of pro-inflammatory cytokines in a large number of animal models of
inflammation (for ref see [12]). In vitro melatonin inhibited lipopolyssacharide-
stimulated TNF-α, IL-1β, IL-6 and IL-8 production through a mechanism involving
the attenuation of nuclear factor (NF)-κB activation [13,14]. Melatonin also
decreased both the methamphetamine-induced up regulation of TNF-α, IL-1β and
IL-6 in a rat microglial cell line [15] and the amyloid-beta-induced overproduction
of TNF-α and IL-6 in organotypic hippocampal cultures [16]. Agil et al. recently
showed that melatonin attenuated low-grade inflammation in young Zucker
diabetic fatty rats as indicated by normalizing the augmented plasma IL-6, TNF-α
and CRP levels [9]. Collectively the results obtained in the present study are
compatible with the idea that melatonin behaves as an anti-inflammatory signal in
rats fed a high-fat diet.
Several in vivo studies have shown the capacity of melatonin to promote a Th2
response, high doses of melatonin enhancing the production of the Th2 cytokine
IL-4 in bone marrow lymphocytes [17]. Chronic administration of melatonin to
antigen-primed mice increased the production of IL-10 and decreased that of TNF-
α, also indicative of a Th2 response [18]. Melatonin increased IL-10 production in a
murine model of septic shock [19] and significantly reversed aging- and
pancreatitis-induced reduction of IL-10 levels in rats [20,21]. Thus the increase in
IL-4 and IL-10 levels reported in the present study after melatonin administration
is compatible with a promoting effect of melatonin on Th2 response.
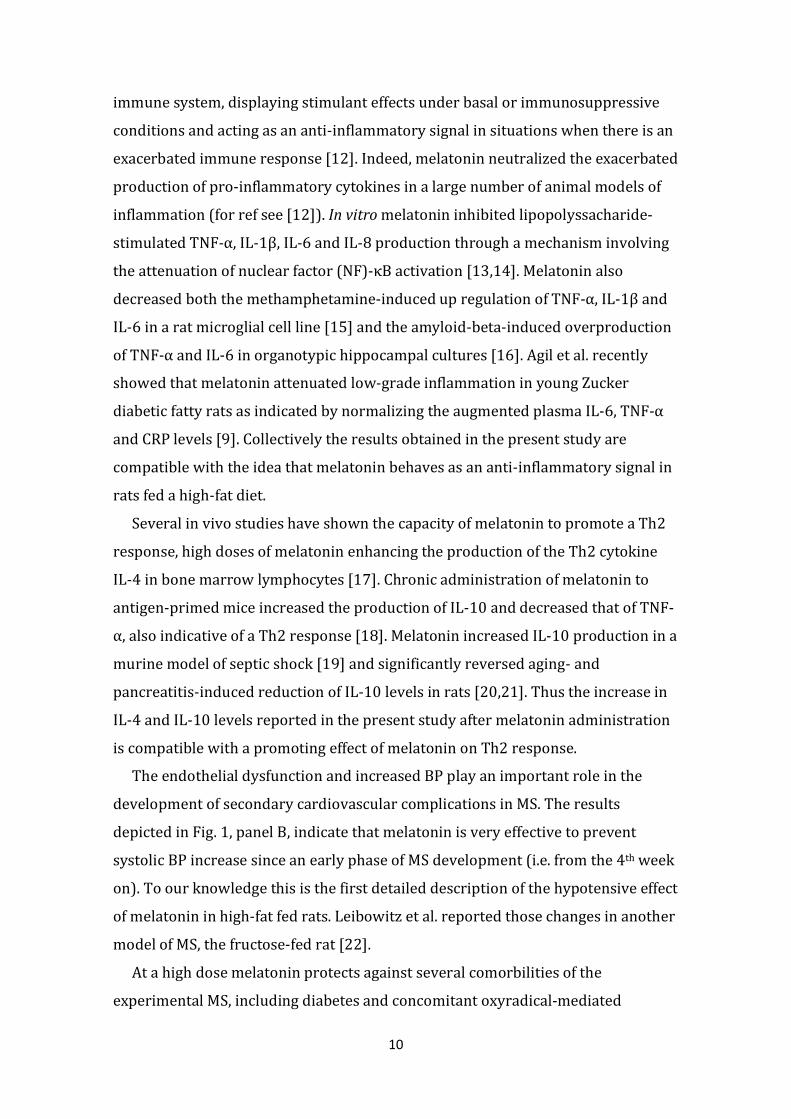
The endothelial dysfunction and increased BP play an important role in the
development of secondary cardiovascular complications in MS. The results
depicted in Fig. 1, panel B, indicate that melatonin is very effective to prevent
systolic BP increase since an early phase of MS development (i.e. from the 4th week
on). To our knowledge this is the first detailed description of the hypotensive effect
of melatonin in high-fat fed rats. Leibowitz et al. reported those changes in another
model of MS, the fructose-fed rat [22].
At a high dose melatonin protects against several comorbilities of the
experimental MS, including diabetes and concomitant oxyradical-mediated

11
damage, inflammation, microvascular disease and atherothrombotic risk [23-25].
Vascular production of both excessive reactive oxygen and nitrogen species
contribute to endothelial dysfunction by directly damaging macromolecules and by
activating several cellular stress-sensitive pathways, e.g. NF-κB, which play a key
role in the development of type 1 and type 2 diabetes complications as well as in
the insulin resistance and impaired insulin secretion occurring type 2 diabetes
[26,27]. Since melatonin provides both in vivo and in vitro protection at the level of
cell membrane, mitochondria and nucleus, partly due to its free-radical scavenging
and antioxidant properties [24], the involvement of these mechanisms in
melatonin´s prevention of vascular sequels and insulin resistance in the diet-
induced model of rodent MS herein examined seems warranted. Remarkably the
effect of melatonin in rodent models of hyperadiposity [8,28-35] is exerted in the
absence of significant differences in food intake. To what extent the weight-loss-
promoting effect of melatonin is attributable to an increase in energy expenditure
by brown adipose tissue deserves further exploration (see for ref. [36]).
In the present study melatonin decreased plasma uric acid levels both in normal
and high-fat fed rats. This effect could be of a potential therapeutic value in human
MS since hyperuricemia is considered a cardiovascular and renal risk factor in MS.
Mild hyperuricemia in normal rats induces systemic hypertension, renal
vasoconstriction, glomerular hypertension and hypertrophy, as well as
tubulointerstitial injury independent of intrarenal crystal formation [37].
Therefore lowering uric acid in high-fat fed rats may help to ameliorate much of
the MS, including a reduction in BP, serum triglycerides, hyperinsulinemia, and
weight gain.
Collectively the present study supports the view that melatonin limits body
weight increase, reduces BP and normalizes cytokine levels in high-fat fed rats.
These physiological findings must be complemented with the analysis of the
molecular mechanisms involved in order to define their possible clinical
implications. As well as in animal models, clinical studies have shown that
melatonin provides benefits on lipid profiles. Melatonin treatment (1 mg/kg for 30
days) elevated HDL-c levels in peri- and postmenopausal women [38]. In an open-
label study which included 33 healthy volunteers and 30 MS patients treated with
melatonin, patients with MS had significantly higher values than controls in total

12
cholesterol, LDL-c, triglycerides, systolic and diastolic BP, glycemia, fibrinogen, and
erythrocyte thiobarbituric acid-reactive substrate levels [39]. They also had lower
levels of HDL-c and reduced activities of catalase, glutathione peroxidase and
superoxide dismutase in erythrocytes. Melatonin (5 mg/day) decreased
significantly hypertension and improved the serum lipid profile and the
antioxidative status [39]. In another open label study comprising 100 elderly
hypertensive patients the simultaneous application of melatonin together with
lisinopril or amlodipine had the normalizing effect on BP and metabolic
parameters [40]. Melatonin administration improved the enzymatic profile in
patients with non alcoholic hepatic esteatosis [41,42]. Treatment with melatonin
improved the MS occurring after treatment of schizophrenic or bipolar patients
with 2nd generation antipsychotics [43,44].
Collectively, the results suggest that melatonin therapy can be of benefit for
patients with MS, particularly with arterial hypertension. Further studies
employing melatonin doses in the 30-50 mg/day range are needed to clarify its
potential therapeutical implications on the MS in humans. If one expects melatonin
to be an effective cytoprotector, especially in aged people, it is likely that the low
doses of melatonin employed so far (2-5 mg) are not very beneficial.
Acknowledgments
This research was supported by grants from Ministerio de Educación y Ciencia,
Spain (SAF2008-00424), Agencia Nacional de Promoción Científica y Tecnológica,
Argentina (PICT 2012-0984), University of Buenos Aires (M 048), and Mutua
Madrileña and Eugenio Rodríguez Pascual Foundations, Madrid, Spain. ESP and
DPC are Research Career Awardees from the Argentine Research Council.
(CONICET).
Conflict of Interest
The authors declare no conflict of interest.
Author contribution
P.C.B., E.S.P, V.J-O. and M.P.F-M were responsible of acquisition of data, data
analysis and initial data interpretation. A.I.E. and D.P.C. contribute to the concept

13
and design of the experiments, to the drafting of the manuscript, and to the critical
revision of the manuscript and approval of the article.
14
References
1. SHIN JA, LEE JH, LIM SY, et al. Metabolic syndrome as a predictor of type 2 diabetes, and its
clinical interpretations and usefulness. J Diabetes Investig 2013; 4:334-343.
2. KAUR J. A comprehensive review on metabolic syndrome. Cardiol Res Pract 2014;
2014:943162
3. ZHANG P, TIAN B. Metabolic syndrome: an important risk factor for Parkinson's disease.
Oxid Med Cell Longev 2014; 2014:729194
4. MAKKI K, FROGUEL P, WOLOWCZUK I. Adipose tissue in obesity-related inflammation and
insulin resistance: cells, cytokines, and chemokines. ISRN Inflamm 2013;
2013:139239
5. DONATH MY. Targeting inflammation in the treatment of type 2 diabetes: time to start. Nat
Rev Drug Discov 2014; 13:465-476.
6. CANO P, CARDINALI DP, RÍOS-LUGO MP, et al. Effect of a high-fat diet on 24-hour pattern of
circulating adipocytokines in rats. Obesity 2009; 117:1866-1871.
7. CANO P, JIMENEZ-ORTEGA V, LARRAD A, et al. Effect of a high-fat diet on 24-hour pattern of
circulating levels of prolactin, luteinizing hormone, testosterone, corticosterone,
thyroid stimulating hormone and glucose, and pineal melatonin content, in rats.
Endocrine 2008; 33:118-125.
8. RIOS-LUGO MJ, CANO P, JIMENEZ-ORTEGA V, et al. Melatonin effect on plasma adiponectin,
leptin, insulin, glucose, triglycerides and cholesterol in normal and high fat-fed rats.
J Pineal Res 2010; 49:342-348.
9. AGIL A, REITER RJ, JIMENEZ-ARANDA A, et al. Melatonin ameliorates low-grade
inflammation and oxidative stress in young Zucker diabetic fatty rats. J Pineal Res
2013; 54:381-388.
10. REAGAN-SHAW S, NIHAL M, AHMAD N. Dose translation from animal to human studies
revisited. FASEB J 2008; 22:659-661.
11. CARDINALI DP, BERNASCONI PA, REYNOSO R, TOSO CF, SCACCHI P. Melatonin may curtail
the metabolic syndrome: studies on initial and fully established fructose-induced
metabolic syndrome in rats. Int J Mol Sci 2013; 14:2502-2514.
12. CARRILLO-VICO A, LARDONE PJ, ALVAREZ-SANCHEZ N, RODRIGUEZ-RODRIGUEZ A,
GUERRERO JM. Melatonin: buffering the immune system. Int J Mol Sci 2013;
14:8638-8683.
13. HUANG SH, CAO XJ, WEI W. Melatonin decreases TLR3-mediated inflammatory factor
expression via inhibition of NF-κB activation in respiratory syncytial virus-infected
RAW264.7 macrophages. J Pineal Res 2008; 45:93-100.
14. CHOI EY, JIN JY, LEE JY, et al. Melatonin inhibits Prevotella intermedia lipopolysaccharide-
induced production of nitric oxide and interleukin-6 in murine macrophages by
suppressing NF-κB and STAT1 activity. J Pineal Res 2011; 50:197-206.

15
15. TOCHARUS J, KHONTHUN C, CHONGTHAMMAKUN S, GOVITRAPONG P. Melatonin attenuates
methamphetamine-induced overexpression of pro-inflammatory cytokines in
microglial cell lines. J Pineal Res 2010; 48:347-352.
16. HOPPE JB, FROZZA RL, HORN AP, et al. Amyloid-beta neurotoxicity in organotypic culture is
attenuated by melatonin: involvement of GSK-3β, tau and neuroinflammation. J
Pineal Res 2010; 48:230-238.
17. WU CC, LU KC, LIN GJ, et al. Melatonin enhances endogenous heme oxygenase-1 and
represses immune responses to ameliorate experimental murine membranous
nephropathy. J Pineal Res 2012; 52:460-469.
18. RAGHAVENDRA V, SINGH V, KULKARNI SK, AGREWALA JN. Melatonin enhances Th2 cell
mediated immune responses: lack of sensitivity to reversal by naltrexone or
benzodiazepine receptor antagonists. Mol Cell Biochem 2001; 221:57-62.
19. CARRILLO-VICO A, LARDONE PJ, NAJI L, et al. Beneficial pleiotropic actions of melatonin in an
experimental model of septic shock in mice: regulation of pro-/anti-inflammatory
cytokine network, protection against oxidative damage and anti-apoptotic effects. J
Pineal Res 2005; 39:400-408.
20. KIREEV RA, TRESGUERRES AC, GARCIA C, et al. Melatonin is able to prevent the liver of old
castrated female rats from oxidative and pro-inflammatory damage. J Pineal Res
2008; 45:394-402.
21. JAWOREK J, SZKLARCZYK J, JAWOREK AK, et al. Protective effect of melatonin on acute
pancreatitis. Int J Inflam 2012; 2012:173675
22. LEIBOWITZ A, PELEG E, SHARABI Y, et al. The role of melatonin in the pathogenesis of
hypertension in rats with metabolic syndrome. Am J Hypertens 2008; 21:348-351.
23. CARDINALI DP, PAGANO ES, SCACCHI BERNASCONI PA, REYNOSO R, SCACCHI P. Disrupted
chronobiology of sleep and cytoprotection in obesity: possible therapeutic value of
melatonin. Neuro Endocrinol Lett 2011; 32:588-606.
24. HARDELAND R, CARDINALI DP, SRINIVASAN V, et al. Melatonin--a pleiotropic, orchestrating
regulator molecule. Prog Neurobiol 2011; 93:350-384.
25. NDUHIRABANDI F, DU TOIT EF, LOCHNER A. Melatonin and the metabolic syndrome: a tool
for effective therapy in obesity-associated abnormalities? Acta Physiol (Oxf) 2012;
205:209-223.
26. VINCENT HK, INNES KE, VINCENT KR. Oxidative stress and potential interventions to reduce
oxidative stress in overweight and obesity. Diabetes Obes Metab 2007; 9:813-839.
27. PRIETO D, CONTRERAS C, SANCHEZ A. Endothelial dysfunction, obesity and insulin
resistance. Curr Vasc Pharmacol 2014; 12:412-426.
28. AGIL A, NAVARRO-ALARCON M, RUIZ R, et al. Beneficial effects of melatonin on obesity and
lipid profile in young Zucker diabetic fatty rats. J Pineal Res 2011; 50:207-212.
29. PRUNET-MARCASSUS B, DESBAZEILLE M, BROS A, et al. Melatonin reduces body weight gain
in Sprague Dawley rats with diet-induced obesity. Endocrinology 2003; 144:5347-
5352.

16
30. PUCHALSKI SS, GREEN JN, RASMUSSEN DD. Melatonin effect on rat body weight regulation in
response to high-fat diet at middle age. Endocrine 2003; 21:163-167.
31. SARTORI C, DESSEN P, MATHIEU C, et al. Melatonin improves glucose homeostasis and
endothelial vascular function in high-fat diet-fed insulin-resistant mice.
Endocrinology 2009; 150:5311-5317.
32. LADIZESKY MG, BOGGIO V, ALBORNOZ LE, et al. Melatonin increases oestradiol-induced
bone formation in ovariectomized rats. J Pineal Res 2003; 34:143-151.
33. SANCHEZ-MATEOS S, ALONSO-GONZALEZ C, GONZALEZ A, et al. Melatonin and estradiol
effects on food intake, body weight, and leptin in ovariectomized rats. Maturitas
2007; 58:91-101.
34. HUSSEIN MR, AHMED OG, HASSAN AF, AHMED MA. Intake of melatonin is associated with
amelioration of physiological changes, both metabolic and morphological
pathologies associated with obesity: an animal model. Int J Exp Pathol 2007; 88:19-
29.
35. RASKIND MA, BURKE BL, CRITES NJ, TAPP AM, RASMUSSEN DD. Olanzapine-induced weight
gain and increased visceral adiposity is blocked by melatonin replacement therapy
in rats. Neuropsychopharmacology 2007; 32:284-288.
36. TAN DX, MANCHESTER LC, FUENTES-BROTO L, PAREDES SD, REITER RJ. Significance and
application of melatonin in the regulation of brown adipose tissue metabolism:
relation to human obesity. Obes Rev 2011; 12:167-188.
37. NAKAGAWA T, CIRILLO P, SATO W, et al. The conundrum of hyperuricemia, metabolic
syndrome, and renal disease. Intern Emerg Med 2008; 3:313-318.
38. TAMURA H, NAKAMURA Y, NARIMATSU A, et al. Melatonin treatment in peri- and
postmenopausal women elevates serum high-density lipoprotein cholesterol levels
without influencing total cholesterol levels. J Pineal Res 2008; 45:101-105.
39. KOZIROG M, POLIWCZAK AR, DUCHNOWICZ P, et al. Melatonin treatment improves blood
pressure, lipid profile, and parameters of oxidative stress in patients with metabolic
syndrome. J Pineal Res 2011; 50:261-266.
40. SHATILO VB, BONDARENKO EV, ANTONIUK-SHCHEGLOVA IA. [Metabolic disorders in
elderly patients with hypertension and their correction with melatonin]. Adv
Gerontol 2012; 25:84-89.
41. GONCIARZ M, BIELANSKI W, PARTYKA R, et al. Plasma insulin, leptin, adiponectin, resistin,
ghrelin, and melatonin in nonalcoholic steatohepatitis patients treated with
melatonin. J Pineal Res 2013; 54:154-161.
42. GONCIARZ M, GONCIARZ Z, BIELANSKI W, et al. The effects of long-term melatonin treatment
on plasma liver enzymes levels and plasma concentrations of lipids and melatonin in
patients with nonalcoholic steatohepatitis: a pilot study. J Physiol Pharmacol 2012;
63:35-40.

17
43. ROMO-NAVA F, ALVAREZ-ICAZA GD, FRESAN-ORELLANA A, et al. Melatonin attenuates
antipsychotic metabolic effects: an eight-week randomized, double-blind, parallel-
group, placebo-controlled clinical trial. Bipolar Disord 2014; 16:410-421.
44. MODABBERNIA A, HEIDARI P, SOLEIMANI R, et al. Melatonin for prevention of metabolic
side-effects of olanzapine in patients with first-episode schizophrenia: randomized
double-blind placebo-controlled study. J Psychiatr Res 2014; 53:133-140.

18
FIGURE LEGENDS
Figure 1. (A) Percent increase in body weight of rats fed a normal or a high-fat diet
and melatonin (25 µg/mL) or vehicle in drinking water for 10 weeks. (B) Systolic
blood pressure difference as compared to the previous week. Shown are the mean
+ S.E.M. (n = 12-16/group). Asterisks indicate the existence of significant
differences with the remaining groups after a one-way ANOVA followed by a Holm-
Sidak multiple comparisons test at a given week of treatment.
Figure 2. Plasma levels of IL-1β and IL-6 in rats fed a normal or a high-fat diet and
melatonin (25 µg/mL) or vehicle in drinking water for 10 weeks. Groups of rats
were euthanized at the middle of the light period or at the middle of the
scotophase. Shown are the means ± SEM (n= 7-8 per group). Letters indicate
significant differences in a one-way ANOVA followed by a Holm-Sidak multiple
comparisons test, as follows: (a) P< 0.01 as compared to the melatonin-treated
groups; (b) P< 0.05 as compared to the remaining groups; (c) P< 0.05 as compared
to the melatonin-treated groups; (d) P< 0.05 as compared to the obese + melatonin
group. For further statistical analysis, see text.
Figure 3. Plasma levels of TNF-α and IFN-γ in rats fed a normal or a high-fat diet
and melatonin (25 µg/mL) or vehicle in drinking water for 10 weeks. Groups of
rats were euthanized at the middle of the light period or at the middle of the
scotophase. Shown are the means ± SEM (n= 7-8 per group). Letters indicate
significant differences in a one-way ANOVA followed by a Holm-Sidak multiple
comparisons test, as follows: (a) P< 0.01 as compared to the remaining groups; (b)
P< 0.05 as compared to the melatonin-treated groups. For further statistical
analysis, see text.
Figure 4. Plasma levels of IL-4 and IL-10 in rats fed a normal or a high-fat diet and
melatonin (25 µg/mL) or vehicle in drinking water for 10 weeks. Groups of rats
were euthanized at the middle of the light period or at the middle of the
scotophase. Shown are the means ± SEM (n= 7-8 per group). Asterisks indicate
significant differences in a one-way ANOVA followed by a Holm-Sidak multiple
comparisons test, P< 0.01 as compared to the remaining groups. For further
statistical analysis, see text.
Figure 5. Plasma levels of insulin and glucose in rats fed a normal or a high-fat diet
and melatonin (25 µg/mL) or vehicle in drinking water for 10 weeks. Groups of
rats were euthanized at the middle of the light period or at the middle of the
scotophase. Shown are the means ± SEM (n= 7-8 per group). Asterisks indicate
significant differences in a one-way ANOVA followed by a Holm-Sidak multiple
comparisons test, P< 0.01 as compared to the remaining groups. For further
statistical analysis, see text.

19
Figure 6. Plasma levels of cholesterol and triglycerides in rats fed a normal or a
high-fat diet and melatonin (25 µg/mL) or vehicle in drinking water for 10 weeks.
Groups of rats were euthanized at the middle of the light period or at the middle of
the scotophase. Shown are the means ± SEM (n= 7-8 per group). Letters indicate
significant differences in a one-way ANOVA followed by a Holm-Sidak multiple
comparisons test, as follows: (a) P< 0.01 as compared to the remaining groups; (b)
P< 0.01 as compared to animals fed a high fat diet. For further statistical analysis,
see text.
Figure 7. Plasma levels of LDL-c and HDL-c in rats fed a normal or a high-fat diet
and melatonin (25 µg/mL) or vehicle in drinking water for 10 weeks. Groups of
rats were euthanized at the middle of the light period or at the middle of the
scotophase. Shown are the means ± SEM (n= 7-8 per group). Letters indicate
significant differences in a one-way ANOVA followed by a Holm-Sidak multiple
comparisons test, as follows: (a) P< 0.01 as compared to the remaining groups; (c)
(b) P< 0.01 as compared to the melatonin-treated groups. For further statistical
analysis, see text.
Figure 8. Plasma levels of urea and uric acid in rats fed a normal or a high-fat diet
and melatonin (25 µg/mL) or vehicle in drinking water for 10 weeks. Groups of
rats were euthanized at the middle of the light period or at the middle of the
scotophase. Shown are the means ± SEM (n= 7-8 per group). Letters indicate
significant differences in a one-way ANOVA followed by a Holm-Sidak multiple
comparisons test, as follows: (a) P< 0.01 as compared to the melatonin-treated
groups. For further statistical analysis, see text.
20
Figure 1

21

22
Figure 2

23
Figure 3
24
Figure 4

25
Figure 5
26
Figure 6

27
Figure 7

28
Figure 8