Mekesson Quarterly Reports 2003 2nd
28
1 SECURITIES AND EXCHANGE COMMISSION Washington, D.C. 20549 FORM 10-Q (Mark One) x QUARTERLY REPORT PURSUANT TO SECTION 13 OR 15(d) OF THE SECURITIES EXCHANGE ACT OF 1934 For quarter ended September 30, 2002 ¤ TRANSITION REPORT PURSUANT TO SECTION 13 OR 15(d) OF THE SECURITIES EXCHANGE ACT OF 1934 For the transition period from to Commission file number 1 -13252 McKESSON CORPORATION (Exact name of Registrant as specified in its charter) Delaware 94-3207296 (State or other jurisdiction of incorporation or organization) (IRS Employer Identification No.) One Post Street, San Francisco, California 94104 (Address of principal executive offices) (Zip Code) (415) 983-8300 (Registrant’s telephone number, including area code) Indicate by check mark whether the Registrant (1) has filed all reports required to be filed by Section 13 or 15(d) of the Securities Exchange Act of 1934 during the preceding 12 months (or for such shorter period that the Registrant was required to file such reports), and (2) has been subject to such filing requirements for the past 90 days. Yes x No ¤ Indicate the number of shares outstanding of each of the issuer’s classes of common stock, as of the latest practicable date. Class Outstanding at November 6, 2002 Common stock, $0.01 par value 291,122,797 shares
-
Upload
finance2 -
Category
Economy & Finance
-
view
138 -
download
1
Transcript of Mekesson Quarterly Reports 2003 2nd

1
SECURITIES AND EXCHANGE COMMISSION
Washington, D.C. 20549
FORM 10-Q
(Mark One)
⌧ QUARTERLY REPORT PURSUANT TO SECTION 13 OR 15(d) OF THE SECURITIES EXCHANGE ACT OF 1934
For quarter ended September 30, 2002 ¨ TRANSITION REPORT PURSUANT TO SECTION 13 OR 15(d) OF THE SECURITIES
EXCHANGE ACT OF 1934 For the transition period from to
Commission file number 1 -13252
McKESSON CORPORATION (Exact name of Registrant as specified in its charter)
Delaware 94-3207296 (State or other jurisdiction of incorporation or organization) (IRS Employer Identification No.)
One Post Street, San Francisco, California 94104 (Address of principal executive offices) (Zip Code)
(415) 983-8300
(Registrant’s telephone number, including area code)
Indicate by check mark whether the Registrant (1) has filed all reports required to be filed by Section 13 or
15(d) of the Securities Exchange Act of 1934 during the preceding 12 months (or for such shorter period that the Registrant was required to file such reports), and (2) has been subject to such filing requirements for the past 90 days. Yes ⌧ No ¨
Indicate the number of shares outstanding of each of the issuer’s classes of common stock, as of the latest practicable date. Class Outstanding at November 6, 2002
Common stock, $0.01 par value 291,122,797 shares

McKESSON CORPORATION
2
TABLE OF CONTENTS
Item Page PART I. FINANCIAL INFORMATION
1. Condensed Financial Statements Consolidated Balance Sheets September 30, 2002 and March 31, 2002....................................................................................... 3 Consolidated Statements of Operations Quarter and six months ended September 30, 2002 and 2001.................................................... 4 Consolidated Statements of Cash Flows Six months ended September 30, 2002 and 2001 ......................................................................... 5 Financial Notes............................................................................................................................................ 6-15 2. Management’s Discussion and Analysis of Results of Operations and Financial Condition Financial Review................................................................................................................................ 16-24 3. Quantitative and Qualitative Disclosures about Market Risk ............................................................. 25 4. Controls and Procedures............................................................................................................................ 25
PART II. OTHER INFORMATION 1. Legal Proceedings....................................................................................................................................... 25 6. Exhibits and Reports on Form 8-K .......................................................................................................... 25
Signatures..................................................................................................................................................... 26

McKESSON CORPORATION
See Financial Notes.
3
PART I. FINANCIAL INFORMATION
CONDENSED CONSOLIDATED BALANCE SHEETS (In millions, except per share amounts)
(Unaudited)
September 30,
2002 March 31,
2002 ASSETS Current Assets
Cash and equivalents $ 300.3 $ 557.8 Marketable securities available for sale 11.3 5.1 Receivables 4,405.9 3,998.1 Inventories 5,993.8 6,011.5 Prepaid expenses and other 100.3 121.4
Total 10,811.6 10,693.9 Property, Plant and Equipment, net 584.1 592.2 Capitalized Software Held for Sale 119.4 118.4 Notes Receivable 256.6 237.7 Goodwill and Other Intangibles 1,445.8 1,115.7 Other Assets 651.6 566.1
Total Assets $ 13,869.1 $ 13,324.0
LIABILITIES AND STOCKHOLDERS’ EQUITY Current Liabilities
Drafts and accounts payable $ 6,346.7 $ 6,334.4 Deferred revenue 371.6 387.9 Short-term borrowings 282.0 - Current portion of long-term debt 141.6 141.2 Other 691.1 724.5
Total 7,833.0 7,588.0 Postretirement Obligations and Other Noncurrent Liabilities 345.4 311.4 Long-Term Debt 1,295.4 1,288.4 McKesson Corporation - Obligated Mandatorily Redeemable Convertible Preferred
Securities of Subsidiary Grantor Trust Whose Sole Assets are Junior Subordinated Debentures of McKesson Corporation 196.2 196.1
Other Commitments and Contingent Liabilities
Stockholders’ Equity Preferred stock, $0.01 par value, 100.0 shares authorized, no shares issued or
outstanding - - Common stock, $0.01 par value, 800.0 and 400.0 shares authorized, and 290.3
and 287.9 shares issued and outstanding at September 30, 2002 and March 31, 2002 2.9 2.9
Additional paid-in capital 1,881.6 1,831.0 Other (91.9) (94.9) Retained earnings 2,564.7 2,357.2 Accumulated other comprehensive losses (86.7) (81.6) ESOP notes and guarantees (70.7) (74.5) Treasury shares, at cost, 0.1 shares at September 30, 2002 (0.8) -
Total Stockholders’ Equity 4,199.1 3,940.1 Total Liabilities and Stockholders’ Equity $ 13,869.1 $ 13,324.0
McKESSON CORPORATION
See Financial Notes.
4
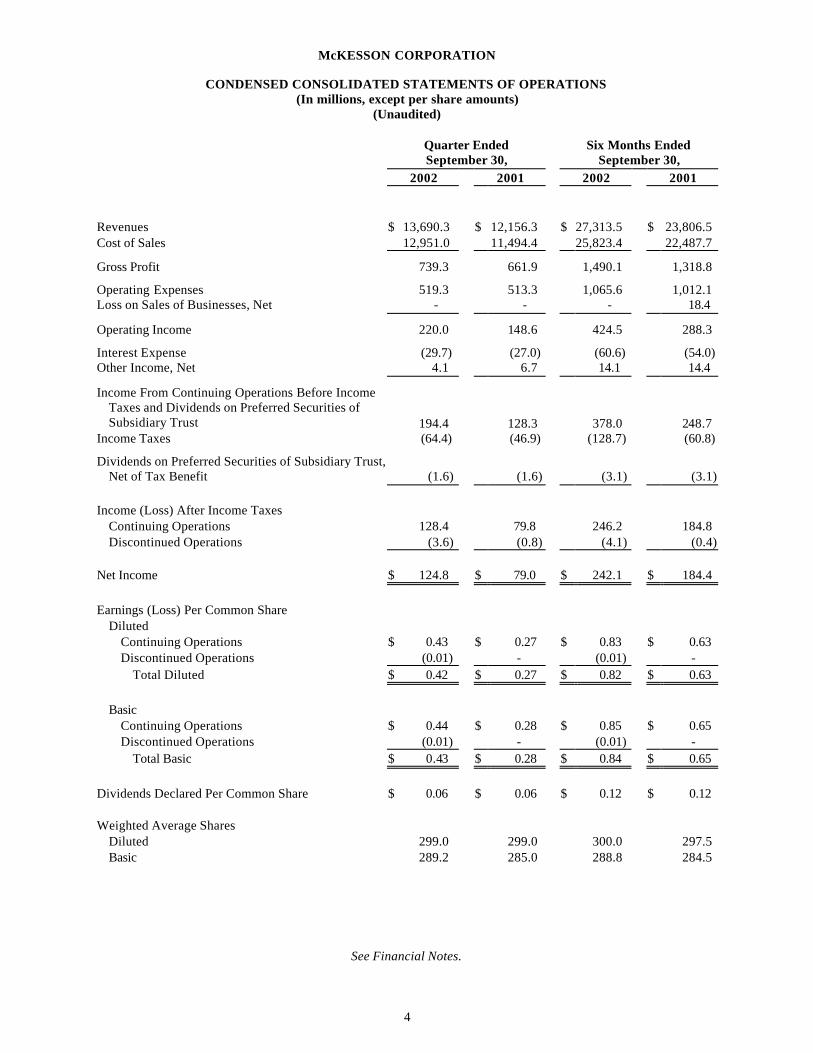
CONDENSED CONSOLIDATED STATEMENTS OF OPERATIONS (In millions, except per share amounts)
(Unaudited)
Quarter Ended September 30,
Six Months Ended September 30,
2002 2001 2002 2001 Revenues $ 13,690.3 $ 12,156.3 $ 27,313.5 $ 23,806.5 Cost of Sales 12,951.0 11,494.4 25,823.4 22,487.7
Gross Profit 739.3 661.9 1,490.1 1,318.8
Operating Expenses 519.3 513.3 1,065.6 1,012.1 Loss on Sales of Businesses, Net - - - 18.4
Operating Income 220.0 148.6 424.5 288.3
Interest Expense (29.7) (27.0) (60.6) (54.0) Other Income, Net 4.1 6.7 14.1 14.4
Income From Continuing Operations Before Income Taxes and Dividends on Preferred Securities of Subsidiary Trust 194.4 128.3 378.0 248.7
Income Taxes (64.4) (46.9) (128.7) (60.8)
Dividends on Preferred Securities of Subsidiary Trust, Net of Tax Benefit (1.6) (1.6) (3.1) (3.1)
Income (Loss) After Income Taxes
Continuing Operations 128.4 79.8 246.2 184.8 Discontinued Operations (3.6) (0.8) (4.1) (0.4)
Net Income $ 124.8 $ 79.0 $ 242.1 $ 184.4 Earnings (Loss) Per Common Share
Diluted Continuing Operations $ 0.43 $ 0.27 $ 0.83 $ 0.63 Discontinued Operations (0.01) - (0.01) -
Total Diluted $ 0.42 $ 0.27 $ 0.82 $ 0.63 Basic
Continuing Operations $ 0.44 $ 0.28 $ 0.85 $ 0.65 Discontinued Operations (0.01) - (0.01) -
Total Basic $ 0.43 $ 0.28 $ 0.84 $ 0.65 Dividends Declared Per Common Share $ 0.06 $ 0.06 $ 0.12 $ 0.12 Weighted Average Shares
Diluted 299.0 299.0 300.0 297.5 Basic 289.2 285.0 288.8 284.5

McKESSON CORPORATION
See Financial Notes.
5
CONDENSED CONSOLIDATED STATEMENTS OF CASH FLOWS (In millions) (Unaudited)
Six Months Ended
September 30, 2002 2001 Operating Activities Income from continuing operations $ 246.2 $ 184.8 Adjustments to reconcile to net cash provided (used) by operating activities:
Depreciation 52.2 58.3 Amortization 48.6 44.5 Provision for bad debts 47.0 28.3 Deferred taxes on income 13.9 26.1 Loss on sales of businesses, net - 18.4 Other non-cash items (0.4) 23.8
Total 407.5 384.2 Effects of changes in:
Receivables (438.0) (363.1) Inventories 24.3 (543.0) Accounts and drafts payable 15.0 600.3 Deferred revenue (21.7) (77.4) Other (22.8) 6.6
Total (443.2) (376.6) Net cash provided (used) by continuing operations (35.7) 7.6
Discontinued operations (0.8) (3.7) Net cash provided (used) by operating activities (36.5) 3.9
Investing Activities Property acquisitions (55.9) (42.9) Capitalized software expenditures (86.6) (69.9) Notes receivable issuances, net (18.9) (30.0) Acquisitions of businesses, less cash and equivalents acquired (355.3) (7.4) Other 7.8 15.8
Net cash used by investing activities (508.9) (134.4)
Financing Activities Proceeds from issuance of debt 282.0 4.2 Repayment of debt (6.0) (17.0) Dividends paid on convertible preferred securities of subsidiary trust (5.0) (5.0) Capital stock transactions:
Issuances 46.7 41.4 ESOP notes and guarantees 3.8 8.9 Dividends paid (34.6) (34.3) Share repurchases - (15.1) Other 1.0 -
Net cash provided (used) by financing activities 287.9 (16.9) Net decrease in cash and equivalents (257.5) (147.4) Cash and equivalents at beginning of period 557.8 433.5 Cash and equivalents at end of period $ 300.3 $ 286.1

McKESSON CORPORATION
FINANCIAL NOTES (Unaudited)
6
1. Interim Financial Statements
In our opinion, these unaudited condensed consolidated financial statements include all adjustments necessary for a fair presentation of McKesson Corporation’s (the “Company”) financial position as of September 30, 2002, the results of operations for the quarter and six months ended September 30, 2002 and 2001 and cash flows for the six months ended September 30, 2002 and 2001.
The results of operations for the quarter and six months ended September 30, 2002 and 2001 are not necessarily
indicative of the results that may be expected for the entire year. These interim financial statements should be read in conjunction with the annual audited financial statements, accounting policies and financial notes included in our 2002 consolidated financial statements previously filed with the Securities and Exchange Commission. Certain prior period amounts have been reclassified to conform to the current period presentation.
The Company’s fiscal year begins on April 1 and ends on March 31. Unless otherwise noted, all references to a
particular year shall mean the Company’s fiscal year.
2. New Accounting Pronouncements
In June 2001, the Financial Accounting Standards Board (“FASB”) issued Statement of Financial Accounting Standards (“SFAS”) No. 143, “Accounting for Asset Retirement Obligations,” which addresses financial accounting requirements for retirement obligations associated with tangible long-lived assets. In May 2002, the FASB issued SFAS No. 145, “Rescission of FASB Statements Nos. 4, 44, 64, Amendment to FASB Statement No. 13, and Technical Corrections as of April 2002.” SFAS Nos. 143 and 145 will become effective for 2004. We are evaluating what impact, if any, SFAS Nos. 143 and 145 may have on the consolidated financial statements.
In August 2001, the FASB issued SFAS No. 144, “Accounting for the Impairment or Disposal of Long-Lived
Assets,” that replaces SFAS No. 121, “Accounting for the Impairment of Long-Lived Assets and for Long-Lived Assets to Be Disposed Of.” SFAS No. 144 requires that long-lived assets to be disposed of by sale, including those of discontinued operations, be measured at the lower of carrying amount or fair value less cost to sell. Discontinued operations will no longer be measured at net realizable value or include amounts for operating losses that have not yet been incurred. Except for those provisions of this accounting standard where implementation extends to the end of 2003, we have adopted SFAS No. 144 as of April 1, 2002. As the provisions were generally to be applied prospectively, the adoption did not have a material impact on our consolidated financial statements. In addition, the adoption of the remaining provisions is not expected to have a material impact on our consolidated financial statements.
In July 2002, the FASB issued SFAS No. 146, “Accounting for Costs Associated with Exit or Disposal
Activities,” which replaces Emerging Issues Task Force (“EITF”) Issue No. 94-3, “Liability Recognition for Certain Employee Termination Benefits and Other Costs to Exit an Activity.” SFAS No. 146 requires that liabilities associated with exit or disposal activities be recognized when they are incurred. Under EITF Issue No. 94-3, a liability for exit costs is recognized at the date of a commitment to an exit plan. SFAS No. 146 also requires that the liability be measured and recorded at fair value. Accordingly, the adoption of this standard may affect the timing of recognizing future restructuring costs as well as the amounts recognized. We will adopt the provisions of SFAS No. 146, for restructuring activities initiated after December 31, 2002.

McKESSON CORPORATION
FINANCIAL NOTES (Continued) (Unaudited)
7
3. Acquisitions and Investments
In July 2002, we acquired 98.4% of the outstanding stock of A.L.I. Technologies Inc. (“A.L.I.”), of Vancouver, British Columbia, Canada, by means of a cash tender offer. The remaining 1.6% of A.L.I.’s outstanding common stock was acquired mid-September 2002. A.L.I. provides digital medical imaging solutions which are designed to streamline access to diagnostic information, automate clinical workflow and eliminate the need for film. The acquisition of A.L.I. complements our Horizon Clinicals offering by incorporating medical images into a computerized patient record. The results of A.L.I.’s operations have been included in the condensed consolidated financial statements within our Information Solutions segment since the July acquisition date.
The aggregate purchase price for A.L.I. was $349.2 million and was financed through cash and short-term
borrowings. The following table summarizes the estimated fair values of the assets acquired and liabilities assumed at the date of acquisition: (In millions) Current assets $ 21.2 Long-term assets:
Goodwill 331.8 Other (primarily intangibles) 17.3
Liabilities (21.1) Net assets acquired, less cash and equivalents $ 349.2
We are in the process of finalizing a third-party valuation of the intangible assets; thus, the allocation of the
purchase price is subject to modification. The acquired intangibles represent technology assets and have a weighted-average useful life of 5 years. None of the amount assigned to goodwill is expected to be deductible for tax purposes.
During the six months ended Septemb er 30, 2002 and 2001, our Pharmaceutical Solutions segment completed
several smaller acquisitions. Pro forma results of operations have not been presented for these acquisitions, nor the acquisition of A.L.I., as the effects were not material to the condensed consolidated financial statements on either an individual or aggregate basis.
In May 2002, the Company and Quintiles Transnational Corporation formed a joint venture, Verispan, L.L.C.
(“Verispan”). Verispan is a provider of patient-level data delivered in near real time as well as a supplier of other healthcare information. We have an approximate 46% equity interest in the joint venture. Contributions of $12.1 million to the joint venture consisted of $7.7 million in net assets from a Pharmaceutical Solutions segment business and $4.4 million in cash, and are subject to adjustment. We have also committed to provide additional aggregate cash contributions of $9.4 million and to purchase a total of $15.0 million in services from the joint venture through 2007. No gain or loss was recognized as a result of this transaction. Financial results for this joint venture are recognized on the equity basis of accounting, and are included in “Other Income, Net” in the condensed consolidated statements of operations, within our Pharmaceutical Solutions segment.
4. Discontinued Operations and Divestitures
In September 2002, we sold the net assets of a marketing fulfillment business which was previously included in our Pharmaceutical Solutions segment. Net consideration from the sale of this business was $4.5 million. The disposition resulted in an after-tax loss of $3.7 million or $0.01 per diluted share. In accordance with SFAS No. 144, the net assets and results of operations of this business have been presented as a discontinued operation, and as a result, prior year amounts have been reclassified.

McKESSON CORPORATION
FINANCIAL NOTES (Continued) (Unaudited)
8
The operating results of discontinued operations for the quarters and six months ended September 2002 and 2001 were as follows:
Quarter Ended September 30,
Six Months Ended September 30,
(In millions) 2002 2001 2002 2001 Revenues $ 3.6 $ 3.8 $ 8.4 $ 9.9 Income (loss) before income taxes $ 0.1 $ (1.4) $ (0.6) $ (0.7) Loss on sale of business (6.0) - (6.0) - Income tax benefit 2.3 0.6 2.5 0.3 Loss on discontinued operations $ (3.6) $ (0.8) $ (4.1) $ (0.4)
At March 31, 2002, assets and liabilities of the discontinued business were $7.3 million and $3.7 million. During the quarter ended June 30, 2001, we sold two businesses from our Information Solutions segment. We
recognized a net pre-tax loss of $18.4 million and an after-tax gain of the same amount. For accounting purposes, the net assets of one of these businesses were written down in 2001 in connection with the restructuring of a former business segment. The tax benefit could not be recognized until the first quarter of 2002, when the sale of the business was completed.
5. Special Charges (Credits)
We incurred the following special charges (credits):
Quarter Ended September 30,
Six Months Ended September 30,
(In millions) 2002 2001 2002 2001 Securities litigation costs incurred $ - $ 0.9 $ 0.1 $ 1.5 Loss on investments, net 4.8 2.5 7.4 4.8 Loss on sales of businesses, net (Financia l Note 4) (1) - - - 18.4 Restructuring and related asset impairments (Financial
Note 6) (10.6) 21.2 (6.1) 20.3 Other (0.9) 1.0 4.2 4.2 Total pre-tax special charges (credits) (6.7) 25.6 5.6 49.2 Income tax expense (benefit) 2.4 (9.3) (1.9) (48.0) Total after-tax special charges (credits) $ (4.3) $ 16.3 $ 3.7 $ 1.2 Diluted loss (income) per share attributable to special
charges (credits) $ (0.01) $ 0.05 $ 0.01 $ - (1) Excludes the September 2002 sale of the marketing fulfillment business, which was treated as a discontinued operation.
Securities litigation costs: We incurred expenses, net of estimated insurance recoveries, in connection with the
securities litigation arising out of the 1999 restatement of our his torical consolidated financial statements (See Financial Note 13). The restatement was the result of improper accounting practices at HBO & Company (“HBOC”), which we acquired in a January 1999 pooling of interests transaction.
Loss on investments, net: We recorded other-than-temporary impairment losses on equity and venture capital
investments as a result of declines in the market values of these investments. The loss on investments also includes a $1.0 million recovery from an investment for the quarter and six months ended September 30, 2001.
Other: Other special charges for the quarter and six months ended September 30, 2002 include charges
incurred for reductions in workforce of $0.3 million and $5.4 million, a $0.7 million reversal of a previous year charge and a $0.5 million recovery from a third party vendor. In 2003, we entered into an agreement with a vendor

McKESSON CORPORATION
FINANCIAL NOTES (Continued) (Unaudited)
9
that entitles us to a total $12.4 million credit against future purchases. We anticipate utilizing the remaining $11.9 million credit by the end of 2003 and will account for such recovery as a special credit, reducing operating expenses.
Other special charges for the quarter and six months ended September 30, 2001 include impairments of
inventory of $4.8 million offset partially by recoveries of claims with third parties. In addition, other special charges for the six months ended September 30, 2001 include a $3.2 million write-off of purchased software.
To reflect the items discussed above, these charges were recorded within the condensed consolidated statements
of operations, as follows:
Quarter Ended September 30,
Six Months Ended September 30,
(In millions) 2002 2001 2002 2001 Cost of sales $ - $ 4.8 $ - $ 4.8 Operating expenses (11.5) 19.3 (1.8) 22.2 Loss on sales of businesses, net - - - 18.4 Other income, net 4.8 1.5 7.4 3.8 Total pre-tax special charges (credits) $ (6.7) $ 25.6 $ 5.6 $ 49.2
Special charges (credits) by business segment are disclosed in Financial Note 14.
6. Restructuring and Related Asset Impairments
We recorded the following charges and adjustments for restructuring and related asset impairments in the condensed consolidated statements of operations:
Quarter Ended September 30,
Six Months Ended September 30,
(In millions) 2002 2001 2002 2001 Asset impairments $ 0.3 $ 0.6 $ 1.3 $ 1.2 Severance (5.1) 6.6 (4.2) 2.8 Exit -related (5.8) 14.0 (3.2) 16.3 Total $ (10.6) $ 21.2 $ (6.1) $ 20.3
During the quarter and six months ended September 30, 2002, we recorded net reductions in severance and exit-
related accruals of $10.9 million and $7.4 million, and restructuring-related asset impairments of $0.3 million and $1.3 million.
In the first quarter of 2003, we incurred a $2.5 million charge pertaining to the planned closure of a distribution
center (includes severance charges, exit costs and asset impairments), and a $2.0 million charge for additional facility closure costs, reflecting a change in estimated costs associated with a prior year restructuring plan. The distribution center is scheduled for closure in the third quarter of 2003, and approximately 65 employees were given termination notices. Both of these charges pertain to our Pharmaceutical Solutions segment.
Restructuring charges for the quarter ended September 30, 2002 include $5.1 million and $5.8 million reversals
of severance and exit-related accruals pertaining to our 2002 Medical-Surgical Solutions segment distribution center network consolidation plan. The reversals were the result of our reevaluation of this segment’s distribution center strategy during the second quarter of 2003. The revised consolidation plan includes a net reduction of 14 distribution centers, from 51, compared to a net reduction of 20 under the original consolidation plan. We anticipate completing the revised consolidation plan by the end of 2003.

McKESSON CORPORATION
FINANCIAL NOTES (Continued) (Unaudited)
10
The following tables summarize program-to-date and plan 2003 and 2002 restructuring activities:
Program-to-Date Plan
Number of: Completed Balance to Complete
Original Revised
Distribution center closures 18 3 30 21 Distribution center openings 5 1 8 6 Employee terminations (1) 481 173 985 654
(1) Employee terminations primarily relate to distribution, delivery and associated back-office functions.
Restructuring charges for the quarter and six months ended September 30, 2001 primarily related to our
Medical-Surgical Solutions segment distribution center network consolidation plan. The following table summarizes the activity related to restructuring liabilities for the six months ended
September 30, 2002:
Pharmaceutical
Solutions Medical-Surgical
Solutions Information
Solutions Corporate
(In millions) Severance Exit-
Related SeveranceExit-
Related Severance Exit-
Related SeveranceExit-
Related Total Balance, March 31, 2002 $ 1.2 $ 4.4 $ 10.9 $ 14.3 $ 5.6 $ 4.5 $ 16.8 $ 0.3 $ 58.0 Current period expense 0.9 0.6 - - - - - - 1.5 Adjustment to prior year’s
expense - 2.0 (5.1) (5.8) - - - - (8.9) Net expense for the period 0.9 2.6 (5.1) (5.8) - - - - (7.4) Cash expenditures (0.8) (0.7) (3.6) (1.7) (3.0) (0.7) (1.4) (0.3) (12.2) Balance, September 30, 2002 $ 1.3 $ 6.3 $ 2.2 $ 6.8 $ 2.6 $ 3.8 $ 15.4 $ - $ 38.4
Accrued restructuring liabilities are included in other liabilities in the accompanying condensed consolidated
balance sheets. The September 30, 2002 balance for the Pharmaceutical Solutions and Medical-Surgical Solutions segments relate primarily to the consolidation of certain distribution centers and include severance costs and costs for preparing facilities for disposal, lease costs and property taxes required subsequent to termination of operations. Restructuring liabilities for the Information Solutions segment primarily represent accrued severance and contract liabilities. Corporate accrued severance primarily pertains to retirement costs. With the exception of the retirement costs, which are anticipated to be paid over the next few years, substantially all other accrued restructuring amounts are anticipated to be paid by the end of 2003.
In addition to the above restructuring activities, we are still managing a 2001/2000 restructuring plan associated
with customer settlements for our discontinuance of overlapping and nonstrategic products and other product development projects within our Information Solutions segment. Customer settlement allowances, which are included as a reduction of accounts receivable in the accompanying condensed consolidated balance sheets, were reduced by $5.8 million and $5.0 million in cash and non-cash settlements during the first six months of 2003 to $122.6 million at September 30, 2002, from $133.4 million at March 31, 2002. Total cash and non-cash settlements of $36.0 million and $76.6 million have been incurred since the inception of the restructuring plan. Although the final outcome of these customer settlements cannot be determined, we believe that any additional liability and related expenditures will not have a material adverse effect on our financial position, results of operations or cash flows.

McKESSON CORPORATION
FINANCIAL NOTES (Continued) (Unaudited)
11
7. Goodwill and Other Intangible Assets
Changes in the carrying amount of goodwill, by business segment, are as follows:
(In millions) Pharmaceutical
Solutions Medical-Surgical
Solutions Information
Solutions Total Balance, March 31, 2002 $ 303.9 $ 689.4 $ 29.0 $ 1,022.3 Goodwill acquired 2.2 - 331.8 334.0 Foreign currency translations and other (1.3) - (12.6) (13.9) Balance, September 30, 2002 $ 304.8 $ 689.4 $ 348.2 $ 1,342.4
Information regarding other intangible assets is as follows:
September 30, March 31, (In millions) 2002 2002 Customer lists $ 91.8 $ 88.1 Technology 58.3 44.1 Trademarks and other 22.7 22.5 Total intangibles 172.8 154.7 Accumulated amortization (69.4) (61.3) Intangibles, net $ 103.4 $ 93.4
Amortization expense of other intangible assets was $4.6 million and $8.5 million for the quarter and six
months ended September 30, 2002 and $3.6 million and $7.1 million for the comparable prior year periods. As of September 30, 2002, estimated future annual amortization expense of other intangible assets is $17.8 million, $18.5 million, $18.7 million, $13.2 million, $13.0 million and $10.4 million in the years 2003 through 2008.
8. Short-Term B orrowings and Hedging Activities
We have a 364-day revolving credit agreement that allows for short-term borrowings of up to $550.0 million which expires in September 2003 and a $550.0 million three-year revolving credit facility which expires in September 2005. These facilities, which were entered into in September 2002, are primarily intended to support our commercial paper borrowings. With the exception of the three-year revolving credit facility, which was previously a five-year facility, terms of these agreements are substantially similar to those previously in place.
We also have a committed revolving receivables sale facility aggregating $850.0 million, which expires in June
2003. This facility was renewed in the first quarter of 2003 under substantially similar terms to those previously in place.
At September 30, 2002, we had $282.0 million of short-term borrowings outstanding and no borrowings
outstanding at March 31, 2002. In addition, at September 30, 2002 and March 31, 2002, the revolving receivables sale facility was unused.
In order to hedge a portion of our fixed interest rate debt with variable interest rates, in April 2002, we entered
into two interest rate swap agreements. The first agreement exchanges a fixed interest rate of 8.91% per annum to the London Inter Bank Offering Rate (“LIBOR”) plus 4.155%, on a notional amount of $100 million and matures in February 2005. The second agreement exchanges a fixed interest rate of 6.30% per annum to LIBOR plus 1.575%, on a notional amount of $150 million and matures in March 2005. These agreements are designated as fair value hedges and are intended to manage our ratio of variable to fixed interest rates.

McKESSON CORPORATION
FINANCIAL NOTES (Continued) (Unaudited)
12
9. Convertible Preferred Securities
In February 1997, our wholly-owned subsidiary trust issued 4 million shares of preferred securities to the public and 123,720 common securities to us, which are convertible at the holder’s option into McKesson Corporation common stock. The proceeds of such issuances were invested by the trust in $206.2 million aggregate principal amount of our 5% Convertible Junior Subordinated Debentures due 2027 (the “Debentures”). The Debentures represent the sole assets of the trust. The Debentures mature on June 1, 2027, bear interest at the rate of 5% per annum, payable quarterly, and are redeemable by us at 102.5% of the principal amount.
Holders of the securities are entitled to cumulative cash distributions at an annual rate of 5% of the liquidation
amount of $50 per security. Each preferred security is convertible at the rate of 1.3418 shares of McKesson Corporation common stock, subject to adjustment in certain circumstances. The preferred securities will be redeemed upon repayment of the Debentures and are callable by us at 102.5% of the liquidation amount.
We have guaranteed, on a subordinated basis, distributions and other payments due on the preferred securities
(the “Guarantee”). The Guarantee, when taken together with our obligations under the Debentures, and in the indenture pursuant to which the Debentures were issued, and our obligations under the Amended and Restated Declaration of Trust governing the subsidiary trust, provides a full and unconditional guarantee of amounts due on the preferred securities.
The Debentures and related trust investment in the Debentures have been eliminated in consolidation and the
preferred securities reflected as outstanding in the accompanying consolidated financial statements.
10. Stockholders’ Equity
On July 31, 2002, our stockholders approved an amendment to the Company’s Restated Certificate of Incorporation to increase authorized common stock from 400.0 million to 800.0 million shares. Also on that date, our stockholders approved an increase in common stock available for issuance under the Employee Stock Purchase Plan from 6.1 million to 11.1 million shares, and our Board of Directors approved an increase in common stock available for issuance in the form of nonqualified stock options under the broad-based 1999 Stock Option Plan and Restricted Stock Plan from 32.7 million (of which approximately 3 million remained available for issuance) to 45.2 million shares.
11. Comprehensive Income
Comprehensive income is as follows:
Quarter Ended September 30,
Six Months Ended September 30,
(In millions) 2002 2001 2002 2001 Net income $ 124.8 $ 79.0 $ 242.1 $ 184.4 Unrealized loss on marketable securities and
investments - (2.6) (1.3) (5.2) Net gain (loss) on derivative instruments (0.7) (0.9) (1.1) 1.3 Foreign currency translation adjustments (14.6) (5.9) (2.7) (3.9) Comprehensive income $ 109.5 $ 69.6 $ 237.0 $ 176.6
McKESSON CORPORATION
FINANCIAL NOTES (Continued) (Unaudited)
13
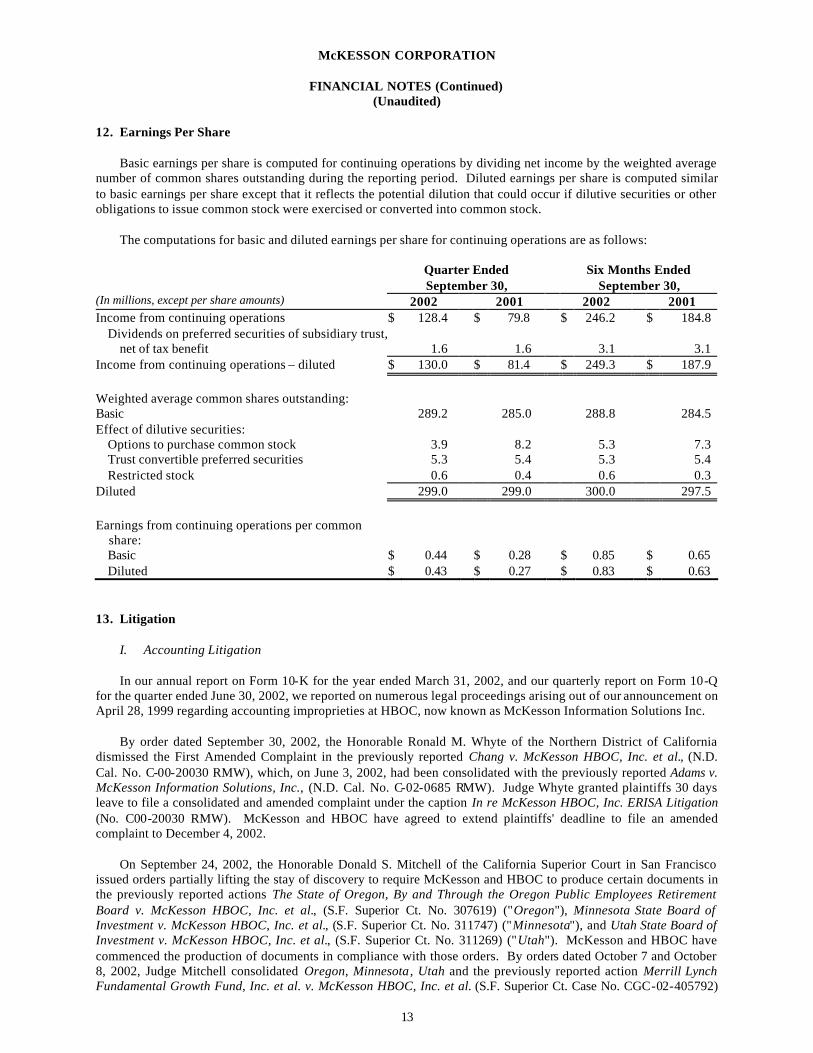
12. Earnings Per Share
Basic earnings per share is computed for continuing operations by dividing net income by the weighted average number of common shares outstanding during the reporting period. Diluted earnings per share is computed similar to basic earnings per share except that it reflects the potential dilution that could occur if dilutive securities or other obligations to issue common stock were exercised or converted into common stock.
The computations for basic and diluted earnings per share for continuing operations are as follows:
Quarter Ended September 30,
Six Months Ended September 30,
(In millions, except per share amounts) 2002 2001 2002 2001 Income from continuing operations $ 128.4 $ 79.8 $ 246.2 $ 184.8
Dividends on preferred securities of subsidiary trust, net of tax benefit 1.6 1.6 3.1 3.1
Income from continuing operations – diluted $ 130.0 $ 81.4 $ 249.3 $ 187.9 Weighted average common shares outstanding: Basic 289.2 285.0 288.8 284.5 Effect of dilutive securities:
Options to purchase common stock 3.9 8.2 5.3 7.3 Trust convertible preferred securities 5.3 5.4 5.3 5.4 Restricted stock 0.6 0.4 0.6 0.3
Diluted 299.0 299.0 300.0 297.5 Earnings from continuing operations per common
share: Basic $ 0.44 $ 0.28 $ 0.85 $ 0.65 Diluted $ 0.43 $ 0.27 $ 0.83 $ 0.63
13. Litigation
I. Accounting Litigation In our annual report on Form 10-K for the year ended March 31, 2002, and our quarterly report on Form 10-Q
for the quarter ended June 30, 2002, we reported on numerous legal proceedings arising out of our announcement on April 28, 1999 regarding accounting improprieties at HBOC, now known as McKesson Information Solutions Inc.
By order dated September 30, 2002, the Honorable Ronald M. Whyte of the Northern District of California
dismissed the First Amended Complaint in the previously reported Chang v. McKesson HBOC, Inc. et al., (N.D. Cal. No. C-00-20030 RMW), which, on June 3, 2002, had been consolidated with the previously reported Adams v. McKesson Information Solutions, Inc., (N.D. Cal. No. C-02-0685 RMW). Judge Whyte granted plaintiffs 30 days leave to file a consolidated and amended complaint under the caption In re McKesson HBOC, Inc. ERISA Litigation (No. C00-20030 RMW). McKesson and HBOC have agreed to extend plaintiffs' deadline to file an amended complaint to December 4, 2002.
On September 24, 2002, the Honorable Donald S. Mitchell of the California Superior Court in San Francisco
issued orders partially lifting the stay of discovery to require McKesson and HBOC to produce certain documents in the previously reported actions The State of Oregon, By and Through the Oregon Public Employees Retirement Board v. McKesson HBOC, Inc. et al., (S.F. Superior Ct. No. 307619) ("Oregon"), Minnesota State Board of Investment v. McKesson HBOC, Inc. et al., (S.F. Superior Ct. No. 311747) ("Minnesota"), and Utah State Board of Investment v. McKesson HBOC, Inc. et al., (S.F. Superior Ct. No. 311269) ("Utah"). McKesson and HBOC have commenced the production of documents in compliance with those orders. By orders dated October 7 and October 8, 2002, Judge Mitchell consolidated Oregon, Minnesota , Utah and the previously reported action Merrill Lynch Fundamental Growth Fund, Inc. et al. v. McKesson HBOC, Inc. et al. (S.F. Superior Ct. Case No. CGC-02-405792)

McKESSON CORPORATION
FINANCIAL NOTES (Continued) (Unaudited)
14
("Merrill Lynch"). These actions have been consolidated under the caption The State of Oregon, By and Through the Oregon Public Employees Retirement Board v. McKesson HBOC, Inc. et al. (Master File No. 307619). On October 16, 2002, plaintiffs in Oregon, Minnesota and Utah filed a consolidated and amended complaint which consolidated the claims in those actions and, on October 11, 2002, plaintiffs in Merrill Lynch filed an amended complaint in the Merrill Lynch action.
In a series of rulings dated September 9, October 11 and October 18, 2002 in the previously reported action
Derdiger v. Tallman, et al. (Del. Ch. Case No. 17276), the court denied plaintiff's motion to vacate the stay of that action as to any purported class claims but granted plaintiff leave to proceed with his individual claims.
We do not believe it is feasible to predict or determine the outcome or resolution of the accounting litigation
proceedings, or to estimate the amounts of, or potential range of, loss with respect to those proceedings. In addition, the timing of the final resolution of these proceedings is uncertain. The range of possible resolutions of these proceedings could include judgments against the Company or settlements that could require substantial payments by the Company, which could have a material adverse impact on McKesson's financial position, results of operations and cash flows.
II. Other Litigation and Claims The Company sold the assets of its former McKesson Chemical Company division (the “Former Division”) in
1986. The provisions of the sale included an indemnification agreement (the “Indemnity Agreement”) which, by its terms, obligates the buyer (now known as Univar USA, Inc., “Univar”) to defend and fully indemnify the Company from various claims including those alleging personal injury. The Company, through the Former Division, has been named as one of more than 200 defendants in 41 actions filed in state courts in Mississippi as a result of the Former Division’s alleged distribution of asbestos. These actions typically involve multiple plaintiffs claiming personal injuries and unspecified compensatory and punitive damages arising from their alleged exposure to asbestos-containing materials. The Company has tendered each of these cases to Univar under the terms of the Indemnity Agreement, and Univar is defending the Company in all cases. However, Univar has recently advised the Company that it wants to confer and discuss the extent of Univar’s obligations under the Indemnity Agreement. The Company has made no payments, nor paid or incurred any costs or expenses in connection with these actions to date. In addition, the Company believes that, if necessary, a portion of these claims would be covered by insurance.
14. Segment Information
Our operating segments consist of Pharmaceutical Solutions, Medical-Surgical Solutions and Information Solutions. We evaluate the performance of our operating segments based on operating profit before interest expense, income taxes and discontinued operations. Our Corporate segment includes expenses associated with Corporate functions and projects, and certain employee benefits. Corporate expenses are allocated to the operating segments to the extent that these items can be directly attributable to the segment.

McKESSON CORPORATION
FINANCIAL NOTES (Concluded) (Unaudited)
15
Financial information relating to our segments is as follows:
Quarter Ended September 30,
Six Months Ended September 30,
(In millions) 2002 2001 2002 2001 Revenues Pharmaceutical Solutions $ 12,730.6 $ 11,234.7 $ 25,416.5 $ 21,963.6 Medical-Surgical Solutions 684.2 684.3 1,367.1 1,359.4 Information Solutions 275.5 237.3 529.9 483.5
Total $ 13,690.3 $ 12,156.3 $ 27,313.5 $ 23,806.5 Operating profit (loss) Pharmaceutical Solutions $ 227.2 $ 180.7 $ 446.2 $ 351.0 Medical-Surgical Solutions 12.7 (3.3) 30.9 22.6 Information Solutions 24.9 14.6 43.4 3.5
Total 264.8 192.0 520.5 377.1 Corporate (40.7) (36.7) (81.9) (74.4) Interest expense (29.7) (27.0) (60.6) (54.0) Income from continuing operations before income
taxes and dividends on preferred securities of subsidiary trust $ 194.4 $ 128.3 $ 378.0 $ 248.7
Special charges (credits) included in operating profit (loss)
Pharmaceutical Solutions $ - $ (1.3) $ 6.8 $ (1.2) Medical-Surgical Solutions (10.8) 27.3 (9.6) 26.2 Information Solutions (0.7) (1.1) (0.7) 20.6 Corporate 4.8 0.7 9.1 3.6
Total $ (6.7) $ 25.6 $ 5.6 $ 49.2
September 30, March 31, (In millions) 2002 2002 Segment assets, at period end Pharmaceutical Solutions $ 10,622.8 $ 10,178.2 Medical-Surgical Solutions 1,465.5 1,485.6 Information Solutions 1,026.9 674.8
Total 13,115.2 12,338.6 Corporate
Cash, equivalents and marketable securities 311.6 562.9 Other 442.3 422.5
Total $ 13,869.1 $ 13,324.0

McKESSON CORPORATION
FINANCIAL REVIEW (Unaudited)
16
Item 2. Management’s Discussion and Analysis of Results of Operations and Financial Condition Financial Overview
Quarter Ended September 30,
Six Months Ended September 30,
(In millions, except per share data) 2002 2001 Change 2002 2001 Change Revenues
Excluding Sales to Customers’ Warehouses $ 10,282.0 $ 8,914.8 15% $ 20,408.1 $ 17,458.5 17%
Sales to Customers’ Warehouses 3,408.3 3,241.5 5 6,905.4 6,348.0 9 Total Revenues $ 13,690.3 $ 12,156.3 13 $ 27,313.5 $ 23,806.5 15 As Reported – U.S. GAAP
Operating Profit (1) 264.8 192.0 38 520.5 377.1 38 Net Income 124.8 79.0 58 242.1 184.4 31 Diluted Earnings Per Share 0.42 0.27 56 0.82 0.63 30
Pro Forma (2) Operating Profit $ 253.3 $ 216.9 17 $ 517.0 $ 422.7 22 Net Income 124.1 96.1 29 249.9 186.0 34 Diluted Earnings Per Share 0.42 0.32 31 0.84 0.63 33
(1) Operating profit for our three business segments is defined as earnings from continuing operations before Corporate
expenses, interest expense and income taxes. (2) Pro forma financial results exclude the impact of special charges (credits) and discontinued operations.
As reported under U.S. generally accepted accounting principles (“U.S. GAAP”), net income increased 58% to
$124.8 million for the second quarter of 2003 compared to the same period a year ago, and diluted earnings per share increased $0.15 to $0.42. For the six months ended September 30, 2002, net income increased 31% to $242.1 million compared to the same period a year ago, and diluted earnings per share increased $0.19 to $0.82.
U.S. GAAP financial results include pre-tax special credits of $6.7 million and charges of $25.6 million for the
second quarter of 2003 and 2002, or $4.3 million and $16.3 million (credit of $0.01 and a loss of $0.05 per diluted share) after-taxes. For the six months ended September 2002 and 2001, U.S. GAAP financial results include pre-tax special charges of $5.6 million and $49.2 million, or $3.7 million and $1.2 million ($0.01 and nil per diluted share) after-taxes.
U.S. GAAP financial results also include losses from discontinued operations of $3.6 million and $4.1 million
($0.01 per diluted share), for the quarter and six months ended September 30, 2002, and $0.8 million and $0.4 million for the comparable prior year periods (nil per diluted share). In September 2002, we sold a marketing fulfillment business which was previously included in our Pharmaceutical Solutions segment. Financial results for this business have been presented as a discontinued operation and accordingly, all periods presented have been reclassified.
We provide pro forma financial data, which excludes special charges and credits and discontinued operations,
as an alternative for understanding our results. We believe such discussion is the most informative representation of recurring and non-recurring, non-transactional-related operating results. These measures are not in accordance with, nor an alternative for, U.S. GAAP and may be different from pro forma measures used by other companies.
Pro forma net income and net income per diluted share for the second quarter of 2003 increased 29% and 31%
to $124.1 million and $0.42, compared to the same period a year ago. For the six months ended September 30, 2002, pro forma net income and net income per diluted share increased 34% and 33% to $249.9 million and $0.84, compared to the same period a year ago. The increase was due to revenue growth and operating margin improvement in our Pharmaceutical Solutions and Information Solutions segments, offsetting flat revenues and a decline in operating profit in our Medical-Surgical Solutions segment.

McKESSON CORPORATION
FINANCIAL REVIEW (Continued) (Unaudited)
17
The following discussion regarding our financial results excludes special charges and credits. Special charges and credits are discussed in detail commencing on page 20, which includes a reconciliation of pro forma financial results to those reported under U.S. GAAP. In addition, the Company’s fiscal year begins on April 1 and ends on March 31. Unless otherwise noted, all references to a particular year shall mean the Company’s fiscal year.
Results of Operations
Revenues:
Quarter Ended September 30,
Six Months Ended September 30,
(In millions) 2002 2001 Change 2002 2001 Change Pharmaceutical Solutions
Pharmaceutical Distribution & Services
U.S. Healthcare $ 8,504.7 $ 7,278.7 17% $ 16,874.1 $ 14,188.6 19% U.S. Healthcare Sales to
Customers’ Warehouses 3,408.3 3,241.5 5 6,905.4 6,348.0 9 Total U.S. Healthcare 11,913.0 10,520.2 13 23,779.5 20,536.6 16
International 817.6 714.5 14 1,637.0 1,427.0 15 Total Pharmaceutical
Solutions 12,730.6 11,234.7 13 25,416.5 21,963.6 16
Medical-Surgical Solutions 684.2 684.3 - 1,367.1 1,359.4 1 Information Solutions
Software 50.7 42.2 20 95.8 87.6 9 Services 199.1 180.0 11 389.4 363.0 7 Hardware 25.7 15.1 70 44.7 32.9 36
Total Information Solutions 275.5 237.3 16 529.9 483.5 10 Total Revenues $ 13,690.3 $ 12,156.3 13 $ 27,313.5 $ 23,806.5 15
Revenues, Excluding Sales to Customers’ Warehouses:
Pharmaceutical Solutions $ 9,322.3 $ 7,993.2 17 $ 18,511.1 $ 15,615.6 19 Medical-Surgical Solutions 684.2 684.3 - 1,367.1 1,359.4 1 Information Solutions 275.5 237.3 16 529.9 483.5 10
Total $ 10,282.0 $ 8,914.8 15 $ 20,408.1 $ 17,458.5 17
Revenues increased by 13% to $13,690.3 million and 15% to $27,313.5 million in the quarter and six months ended September 30, 2002 compared to the same prior year periods. The increase was largely due to growth in our Pharmaceutical Solutions segment, which accounted for over 92% of consolidated revenues.
Increases in U.S. healthcare revenues, excluding sales to customers’ warehouses, were due to market growth
rates and the benefit of having one additional selling day in our pharmaceutical distribution business, and growth in our automation and specialty pharmaceutical products and pharmacy outsourcing services businesses. Year-to-date revenues also reflect the impact of agreements that took effect in the first quarter of 2002 for new pharmaceutical distribution business that was previously direct or outside the distribution channel. Market growth rates reflect growing drug utilization and price increases which are offset in part by the increased use of generics. In the second half of 2003, U.S. pharmaceutical distribution growth rate is expected to reflect the U.S. market growth rate.
U.S. healthcare sales to customers’ warehouses increased as a result of growth from existing customers. Sales
to customers’ warehouses represent large volume sales of pharmaceuticals to major self-warehousing drugstore chains whereby we act as an intermediary in the order and subsequent delivery of products directly from the manufacturer to the customers’ warehouses. These sales provide a benefit to our customers in that they can use one source for both their direct store-to-store business and their warehouse business.

McKESSON CORPORATION
FINANCIAL REVIEW (Continued) (Unaudited)
18
International pharmaceutical revenues, which are derived from our Canadian operations, grew primarily reflecting both market growth rates and greater sales to our existing customers.
Medical-Surgical Solutions segment revenues were flat or increased nominally as growth in primary and
extended care products were fully or almost fully offset by a decline in revenues for acute care products. The segment’s decline in its acute care business reflects the competitive environment in which it operates and the continued self-warehousing strategy by a major customer.
Information Solutions segment revenues increased reflecting growth in all three categories: software sales,
services and hardware. In addition, revenues from the recently acquired A.L.I. Technologies Inc. (“A.L.I.”) business contributed to the growth in this segment’s revenues.
As of September 30, 2002, the backlog for our Information Solutions segment, which includes firm contracts
for maintenance fees, implementation and software contracts, and outsourcing agreements, was $2.09 billion compared to $2.06 billion at March 31, 2002 and $1.51 billion a year ago. The increase in backlog from September 30, 2001 was primarily due to a ten-year, $480 million outsourcing contract to provide a standardized, fully automated human resources and payroll system for the National Health Service of England and Wales, which was entered into during the third quarter of 2002.
Gross Profit:
Quarter Ended September 30,
Six Months Ended September 30,
(In millions) 2002 2001 Change 2002 2001 Change Pro Forma Gross Profit
Pharmaceutical Solutions $ 481.5 $ 420.6 14% $ 975.2 $ 827.1 18% Medical-Surgical Solutions 128.1 132.5 (3) 259.6 265.5 (2) Information Solutions 129.7 113.6 14 255.3 231.0 11
Total $ 739.3 $ 666.7 11 $ 1,490.1 $ 1,323.6 13
Pro Forma Gross Profit Margin (1) Pharmaceutical Solutions 5.17% 5.26% (9) bp (2) 5.27% 5.30% (3) bp Medical-Surgical Solutions 18.72 19.36 (64) 18.99 19.53 (54) Information Solutions 47.08 47.87 (79) 48.18 47.78 40
Total 7.19 7.48 (29) 7.30 7.58 (28) (1) Excludes sales to customers’ warehouses. (2) Basis points (“bp”).
As a percentage of revenues, excluding sales to customers’ warehouses, gross profit margin decreased,
primarily reflecting a higher proportion of revenues attributable to our U.S. pharmaceutical distribution business, which has lower margins both relative to the other product lines within the segment as well as to other segments, partially offset by an improvement in gross margins from our Information Solutions segment. Pharmaceutical Solutions segment pro forma gross margin as a percentage of revenues decreased, reflecting a decline in the selling margin to customers, offset in part by the benefit of increased sales of generic drugs with higher margins, and growth in other higher margin products and services.
We exclude sales to customers’ warehouses in analyzing our gross and operating profits and operating expenses
as a percentage of revenues as these revenues from bulk shipments to warehouses have a significantly lower gross margin compared to traditional direct store delivery sales because of their low cost-to-serve model. These sales do, however, contribute positively to our cash flows due to favorable timing between the customer payment and our payment to the supplier.
McKESSON CORPORATION
FINANCIAL REVIEW (Continued) (Unaudited)
19
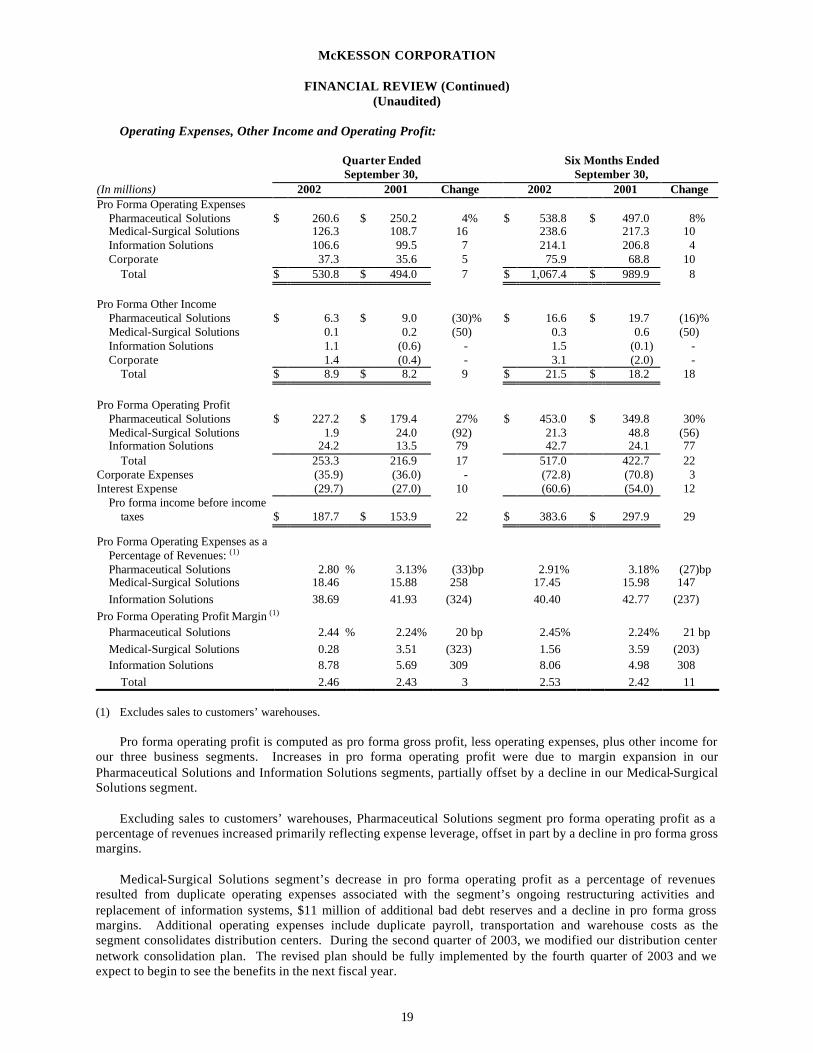
Operating Expenses, Other Income and Operating Profit:
Quarter Ended September 30,
Six Months Ended September 30,
(In millions) 2002 2001 Change 2002 2001 Change Pro Forma Operating Expenses
Pharmaceutical Solutions $ 260.6 $ 250.2 4% $ 538.8 $ 497.0 8% Medical-Surgical Solutions 126.3 108.7 16 238.6 217.3 10 Information Solutions 106.6 99.5 7 214.1 206.8 4 Corporate 37.3 35.6 5 75.9 68.8 10
Total $ 530.8 $ 494.0 7 $ 1,067.4 $ 989.9 8 Pro Forma Other Income
Pharmaceutical Solutions $ 6.3 $ 9.0 (30)% $ 16.6 $ 19.7 (16)% Medical-Surgical Solutions 0.1 0.2 (50) 0.3 0.6 (50) Information Solutions 1.1 (0.6) - 1.5 (0.1) - Corporate 1.4 (0.4) - 3.1 (2.0) -
Total $ 8.9 $ 8.2 9 $ 21.5 $ 18.2 18 Pro Forma Operating Profit
Pharmaceutical Solutions $ 227.2 $ 179.4 27% $ 453.0 $ 349.8 30% Medical-Surgical Solutions 1.9 24.0 (92) 21.3 48.8 (56) Information Solutions 24.2 13.5 79 42.7 24.1 77
Total 253.3 216.9 17 517.0 422.7 22 Corporate Expenses (35.9) (36.0) - (72.8) (70.8) 3 Interest Expense (29.7) (27.0) 10 (60.6) (54.0) 12
Pro forma income before income taxes $ 187.7 $ 153.9 22 $ 383.6 $ 297.9 29
Pro Forma Operating Expenses as a Percentage of Revenues: (1) Pharmaceutical Solutions 2.80 % 3.13% (33)bp 2.91% 3.18% (27)bp Medical-Surgical Solutions 18.46 15.88 258 17.45 15.98 147 Information Solutions 38.69 41.93 (324) 40.40 42.77 (237)
Pro Forma Operating Profit Margin (1) Pharmaceutical Solutions 2.44 % 2.24% 20 bp 2.45% 2.24% 21 bp Medical-Surgical Solutions 0.28 3.51 (323) 1.56 3.59 (203) Information Solutions 8.78 5.69 309 8.06 4.98 308
Total 2.46 2.43 3 2.53 2.42 11
(1) Excludes sales to customers’ warehouses.
Pro forma operating profit is computed as pro forma gross profit, less operating expenses, plus other income for our three business segments. Increases in pro forma operating profit were due to margin expansion in our Pharmaceutical Solutions and Information Solutions segments, partially offset by a decline in our Medical-Surgical Solutions segment.
Excluding sales to customers’ warehouses, Pharmaceutical Solutions segment pro forma operating profit as a
percentage of revenues increased primarily reflecting expense leverage, offset in part by a decline in pro forma gross margins.
Medical-Surgical Solutions segment’s decrease in pro forma operating profit as a percentage of revenues
resulted from duplicate operating expenses associated with the segment’s ongoing restructuring activities and replacement of information systems, $11 million of additional bad debt reserves and a decline in pro forma gross margins. Additional operating expenses include duplicate payroll, transportation and warehouse costs as the segment consolidates distribution centers. During the second quarter of 2003, we modified our distribution center network consolidation plan. The revised plan should be fully implemented by the fourth quarter of 2003 and we expect to begin to see the benefits in the next fiscal year.

McKESSON CORPORATION
FINANCIAL REVIEW (Continued) (Unaudited)
20
Information Solutions segment’s pro forma operating profit as a percentage of revenues increased reflecting improved customer support productivity and better control of expenses, partially offset by a decline in gross margins attributable to the segment’s product mix. In addition, pro forma operating profit for the six months ended September 30, 2001 included approximately $2 million in losses from a business that was sold earlier in that fiscal year.
Corporate expenses, net of other income, were flat for the second quarter of 2003 and increased 3% on a year-
to-date basis compared to the same periods a year ago. Higher benefit and insurance costs and lower pension income were either fully or partially offset with the elimination of losses associated with our share of an investment in Health Nexis LLC and lower costs associated with the receivable sales program. In the second quarter of 2003, we lowered our pension plan assets earnings assumption to 8.25% from 9.75%.
Interest Expense: Interest expense increased primarily due to higher average borrowings. Interest expense for
2003 reflects the issuance of $400.0 million 7.75% notes partially offset by the retirement of $175.0 million 6.875% notes, which occurred in the fourth quarter of 2002.
In order to hedge a portion of our fixed interest rate debt with variable interest rates, in the first quarter of 2003,
we entered into two interest rate swap agreements. The first agreement exchanges a fixed interest rate of 8.91% per annum to LIBOR plus 4.155%, on a notional amount of $100 million and matures in February 2005. The second agreement exchanges a fixed interest rate of 6.30% per annum to LIBOR plus 1.575%, on a notional amount of $150 million and matures in March 2005. These agreements are designated as fair value hedges and are intended to manage our ratio of variable to fixed interest rates.
Income Taxes: The effective income tax rate excluding special charges and credits for the six months ended
September 30, 2002 and 2001 was 34.0% and 36.5%. The reduction in our effective income tax rate reflects the Company's estimated annualized rate for 2003 and is the result of a higher proportion of income being attributable to foreign countries that have lower income tax rates. A portion of this rate reduction occurred in the second quarter of 2003, resulting in an effective income tax rate of 33.0% for the current quarter compared to 36.5% for the same period a year ago.
Weighted Average Diluted Shares Outstanding: Diluted earnings per share were calculated based on an average
number of diluted shares outstanding of 299.0 million for the second quarters of 2003 and 2002 and 300.00 million and 297.5 million for the six months ended September 30, 2002 and 2001.
Special Charges (Credits): We incurred the following special charges (credits):
Quarter Ended September 30,
Six Months Ended September 30,
(In millions) 2002 2001 2002 2001 Securities litigation costs incurred $ - $ 0.9 $ 0.1 $ 1.5 Loss on investments, net 4.8 2.5 7.4 4.8 Loss on sales of businesses, net - - - 18.4 Restructuring and related asset impairments (10.6) 21.2 (6.1) 20.3 Other (0.9) 1.0 4.2 4.2 Total pre-tax special charges (credits) (6.7) 25.6 5.6 49.2 Income tax expense (benefit) 2.4 (9.3) (1.9) (48.0) Total after-tax special charges (credits) $ (4.3) $ 16.3 $ 3.7 $ 1.2 Diluted loss (income) per share attributable to special
charges (credits) $ (0.01) $ 0.05 $ 0.01 $ - Securities litigation costs: We incurred expenses, net of estimated insurance recoveries, in connection with the
securities litigation arising out of the 1999 restatement of our historical consolidated financial statements. The restatement was the result of improper accounting practices at HBO & Company (“HBOC”), which we acquired in a January 1999 pooling of interests transaction.
McKESSON CORPORATION
FINANCIAL REVIEW (Continued) (Unaudited)
21
Loss on investments, net: We recorded other-than-temporary impairment losses on equity and venture capital investments as a result of declines in the market values of these investments. The loss on investments also includes a $1.0 million recovery from an investment for the quarter and six months ended September 30, 2001.
Loss on sales of businesses, net: During the first quarter of 2002, we sold two businesses from our Information
Solutions segment for a net pre-tax loss of $18.4 million. Restructuring charges (credits): During the quarter and six months ended September 30, 2002, we recorded net
reductions in severance and exit-related accruals of $10.9 million and $7.4 million, and restructuring-related asset impairments of $0.3 million and $1.3 million.
In the first quarter of 2003, we incurred a $2.5 million charge pertaining to the planned closure of a distribution
center (includes severance charges, exit costs and asset impairments) and a $2.0 million charge for additional facility closure costs, reflecting a change in estimated costs associated with a prior year restructuring plan. The distribution center is scheduled for closure in the third quarter of 2003, and approximately 65 employees were given termination notices. Both of these charges pertain to our Pharmaceutical Solutions segment.
Restructuring charges for the quarter ended September 30, 2002 include $5.1 million and $5.8 million reversals
of severance and exit-related accruals pertaining to our 2002 Medical-Surgical Solutions segment distribution center network consolidation plan. The reversals were the result of our reevaluation of this segment’s distribution center strategy during the second quarter of 2003. The revised consolidation plan included a net reduction of 14 distribution centers, from 51, compared to a net reduction of 20 under the original consolidation plan. We anticipate completing the revised consolidation plan by the end of this fiscal year.
Restructuring charges for the quarter and six months ended September 30, 2001 primarily related to our
Medical-Surgical Solutions segment distribution center network consolidation plan. Refer to Financial Note 6, “Restructuring and Related Asset Impairments,” of the accompanying condensed
consolidated financial statements for further discussions regarding our restructuring activities. Other: Other special charges for the quarter and six months ended September 30, 2002 include charges
incurred for reductions in workforce of $0.3 million and $5.4 million, a $0.7 million reversal of a previous year charge and a $0.5 million recovery from a third party vendor. In 2003, we entered into an agreement with a vendor that entitles us to a total $12.4 million credit against future purchases. We anticipate utilizing the remaining $11.9 million credit by the end of 2003 and will account for such recovery as a special credit, reducing operating expenses.
Other special charges for the quarter and six months ended September 30, 2001 include impairments of
inventory of $4.8 million offset partially by recoveries of claims with third parties. In addition, other special charges for the six months ended September 30, 2001 include a $3.2 million write-off of purchased software.
Income taxes on special charges (credits): Income taxes on special charges and credits are generally recorded
at our annual effective tax rate. For accounting purposes, a tax benefit on the net assets of one of the businesses written down in connection with the restructuring of a former business segment in 2001 was not recognized until the first quarter of 2002, when the sale of the business was completed.
Refer to Financial Notes 5 and 14, “Special Charges and Credits” and “Segment Information,” of the
accompanying condensed consolidated financial statements for further discussions regarding our special charges and credits.

McKESSON CORPORATION
FINANCIAL REVIEW (Continued) (Unaudited)
22
A reconciliation of pro forma operating profit to income from continuing operations as reported under U.S. GAAP is as follows:
Quarter Ended September 30,
Six Months Ended September 30,
(In millions) 2002 2001 2002 2001 Total Pro Forma Operating Profit $ 253.3 $ 216.9 $ 517.0 $ 422.7 Special (Charges) Credits 11.5 (24.9) 3.5 (45.6) Operating Profit – U.S. GAAP 264.8 192.0 520.5 377.1 Corporate
Excluding Special Charges (35.9) (36.0) (72.8) (70.8) Special Charges (4.8) (0.7) (9.1) (3.6)
Total Corporate Expenses (40.7) (36.7) (81.9) (74.4) Interest Expense (29.7) (27.0) (60.6) (54.0) Income From Continuing Operations Before Income Taxes
and Dividends on Preferred Securities of Subsidiary Trust 194.4 128.3 378.0 248.7 Income Taxes
Before Special Charges (62.0) (56.2) (130.6) (108.8) Special Charges (2.4) 9.3 1.9 48.0
Total Income Taxes (64.4) (46.9) (128.7) (60.8) Dividends on Preferred Securities of Subsidiary
Trust, net of Tax Benefit (1.6) (1.6) (3.1) (3.1) Income From Continuing Operations – U.S. GAAP $ 128.4 $ 79.8 $ 246.2 $ 184.8 Acquisitions, Investments, Discontinued Operations and Divestitures
In July 2002, we acquired 98.4% of the outstanding stock of A.L.I., of Vancouver, British Columbia, Canada, by means of a cash tender offer. The remaining 1.6% of A.L.I.’s outstanding common stock was acquired mid-September 2002. A.L.I. provides digital medical imaging solutions, which are designed to streamline access to diagnostic information, automate clinical workflow and eliminate the need for film. The acquisition of A.L.I. complements our Horizon Clinicals offering by incorporating medical images into a computerized patient record. The results of A.L.I.’s operations have been included in the condensed consolidated financial statements within our Information Solutions segment since the July acquisition date. The aggregate purchase price for A.L.I. was $349.2 million and was financed through cash and short-term borrowings.
On May 16, 2002, the Company and Quintiles Transnational Corporation formed a joint venture, Verispan,
L.L.C. (“Verispan”). Verispan is a provider of patient-level data delivered in near real time as well as a supplier of other healthcare information. We have an approximate 46% equity interest in the joint venture. The initial contribution to the joint venture of $12.1 million consisted of $7.7 million in net assets from a Pharmaceutical Solutions’ business and $4.4 million in cash, and is subject to adjustment. We have also committed to provide additional aggregate cash contributions of $9.4 million and to purchase a total of $15.0 million in services from the joint venture through 2007.
In September 2002, we sold the net assets of a marketing fulfillment business which was previously included in
our Pharmaceutical Solutions segment. Net consideration from the sale of this business was $4.5 million. The disposition resulted in an after tax loss of $3.7 million or $0.01 per diluted share. In accordance with Statement of Financial Accounting Standards No. 144, the net assets and results of operations of this business have been presented as a discontinued operation, and as a result, prior year amounts have been reclassified.
Refer to Financial Notes 3 and 4, “Acquisitions and Investments” and “Discontinued Operations and
Divestitures,” of the accompanying condensed consolidated financial statements for further discussions regarding these activities.

McKESSON CORPORATION
FINANCIAL REVIEW (Continued) (Unaudited)
23
Financial Condition, Liquidity, and Capital Resources
Net cash of $36.5 million was used by operating activities during the six months ended September 30, 2002, as $246.2 million in income from continuing operations and non-cash items of $161.3 million were more than offset by an increase in accounts receivable and other net working capital items. The net increase in working capital items primarily reflects higher accounts receivables due to revenue growth.
During the six months ended September 30, 2001, operating activities provided cash of $3.9 million, as income
from continuing operations of $184.8 million and non-cash items of $199.4 million were almost fully offset by net increases in working capital items. The use of cash in 2002 for working capital items reflects the build up associated with the implementation of new pharmaceutical distribution business.
Net cash used by investing activities was $508.9 million and $134.4 million during the six months ended
September 30, 2002 and 2001. Investing activities for the first six months of 2003 include the purchase of A.L.I. for $349.2 million, and increases in property acquisitions and software expenditures. Financing activities provided net cash of $287.9 million in the first six months of 2003 and used $16.9 million in the comparable prior year period. Second quarter 2003 financing activities reflect short-term borrowings of $282.0 million. Selected Measures of Liquidity and Capital Resources
(In millions) September 30,
2002 March 31,
2002 Cash and equivalents and marketable securities $ 311.6 $ 562.9 Operating working capital 3,681.4 3,287.3 Debt net of cash and equivalents and marketable securities 1,407.4 866.7 Debt to capital ratio 28.1% 25.7% Ratio of net debt to net capital employed 24.3% 17.3% Return on committed capital 22.9% 22.0%
Our Pharmaceutical Solutions segment requires a substantial investment in operating working capital
(receivables and inventories net of related payables). Operating working capital is susceptible to large variations during the year as a result of inventory purchase patterns and seasonal demands. Inventory purchase activity is a function of sales activity, new customer build-up requirements and the desired level of investment inventory. Consolidated operating working capital at September 30, 2002 was greater than at March 31, 2002, as a result of our higher sales volume. No trade receivables were sold at September 30, 2002 or March 31, 2002.
The ratio of net debt to net capital employed at September 30, 2002 increased from March 31, 2002, reflecting
the increase in net debt to fund internal growth and business acquisitions. Return on committed capital improved to 22.9% at September 30, 2002 from 22.0% at March 31, 2002, as growth in our operating profit exceeded the growth in working capital needed to fund the increase in revenues.
On July 31, 2002, our stockholders approved an amendment to the Company’s Restated Certificate of
Incorporation to increase authorized common stock from 400.0 million to 800.0 million shares. Increases in the authorized common stock provide us with greater flexibility for stock splits, stock dividends, issuances under employee benefit and incentive plans, financings, corporate mergers and acquisitions, and other general corporate matters.
Credit Resources
Working capital requirements are primarily funded by cash, short-term borrowings and our receivables sale facility. We have a 364-day revolving credit agreement that allows for short-term borrowings of up to $550.0 million which expires in September 2003 and a $550.0 million three-year revolving credit facility which expires in September 2005. These facilities, which were entered into in September 2002, are primarily intended to support our commercial paper borrowings. With the exception of the three-year revolving credit facility, which was previously a five-year facility, terms of these agreements are substantially similar to those previously in place.

McKESSON CORPORATION
FINANCIAL REVIEW (Concluded) (Unaudited)
24
We also have a committed revolving receivables sale facility aggregating $850.0 million, which expires in June 2003. This facility was renewed in the first quarter of 2003 under substantially similar terms to those previously in place.
At September 30, 2002, we had $282.0 million of short-term borrowings outstanding and no borrowings
outstanding at March 31, 2002. In addition, at September 30, 2002 and March 31, 2002, the revolving receivables sale facility was unused.
Our various borrowing facilities and long-term debt are subject to certain covenants. Our principal debt
covenant is our debt to capital ratio, which cannot exceed 56.5%. If we exceed this ratio, repayment of debt outstanding under the revolving credit facility and $335.0 million of term debt could be accelerated. At September 30, 2002, this ratio was 28.1% and we were in compliance with our other financial covenants. A reduction in our credit ratings or the lack of compliance with our covenants could negatively impact our ability to finance operations through our credit facilities, or issue additional debt at the interest rates then currently available.
We have $125.0 million of term debt that matures in November 2002. Funds necessary for future debt
maturities and our other cash requirements are expected to be met by existing cash balances, cash flows from operations, existing credit sources and other capital market transactions.
New Accounting Pronouncements
See Financial Note 2, “New Accounting Pronouncements,” on page 6 of the accompanying condensed consolidated financial statements.
FACTORS AFFECTING FORWARD-LOOKING STATEMENTS
In addition to historical information, management’s discussion and analysis includes certain forward -looking statements within the meaning of section 27A of the Securities Act of 1933, as amended (the “Securities Act”) and section 21E of the Securities Exchange Act of 1934, as amended (the “Exchange Act”). Some of the forward-looking statements can be identified by use of forward-looking words such as “believes,” “expects,” “anticipates,” “may,” “will,” “should,” “seeks,” “approximates,” “intends,” “plans,” or “estimates,” or the negative of these words, or other comparable terminology. The discussion of financial trends, strategy, plans or intentions may also include forward-looking statements. Forward-looking statements involve risks and uncertainties that could cause actual results to differ materially from those projected. Among the factors that could cause actual results to differ materially are the following:
• the resolution or outcome of pending shareholder litigation regarding the 1999 restatement of our historical
financial statements; • the changing U.S. healthcare environment, including potential mandated benefits, changes in private and
governmental reimbursement or in the delivery systems for healthcare products and services; • the ability to successfully market both new and existing products domestically and internationally; • timing and amounts of ongoing customer settlements; • changes in manufacturers’ pricing, sales or distribution policies; • substantial defaults in payment or a material reduction in purchases by large customers; • challenges in integrating our software products, or the slowing or deferral of demand for these products; • the malfunction or failure of our segments’ information systems for any extended period of time; • our ability to successfully identify, consummate and integrate acquired businesses; and • changes in generally accepted accounting principles.
These and other risks and uncertainties are described herein or in our Forms 10-K, 10-Q, 8-K and other public
documents filed with the Securities and Exchange Commission. Readers are cautioned not to place undue reliance on these forward-looking statements, which speak only as of the date hereof. We undertake no obligation to publicly release the result of any revisions to these forward-looking statements to reflect events or circumstances after this date or to reflect the occurrence of unanticipated events.

McKESSON CORPORATION
25
Item 3. Quantitative and Qualitative Disclosures about Market Risk
We believe there has been no material change in our exposure to risks associated with fluctuations in interest and foreign currency exchange rates discussed in our 2002 Annual Report on Form 10-K.
Item 4. Controls and Procedures
(a) Evaluation of Disclosure Controls and Procedures. The Company’s Chief Executive Officer and Chief Financial Officer (the “Senior Officers”), with the participation of other members of the Company’s management, have evaluated the effectiveness of the Company’s disclosure controls and procedures (as such term is defined in Rules 13a – 14(c) and 15d – 14 (c) under the Securities Exchange Act of 1934, as amended (the “Exchange Act”)) as of a date within 90 days prior to the filing date of this quarterly report (the “Evaluation Date”). Based on that evaluation, the Senior Officers have concluded that, as of the Evaluation Date, the Company’s disclosure controls and procedures are effective in alerting them on a timely basis to material information relating to the Company (including its consolidated subsidiaries) required to be included in the Company’s reports filed or submitted under the Exchange Act. (b) Changes in Internal Controls. Since the Evaluation Date, there have not been any significant changes in the Company’s internal controls or in those factors that could significantly affect those controls.
PART II. OTHER INFORMATION
Item 1. Legal Proceedings
See Financial Note 13 of our unaudited condensed consolidated financial statements contained in Part I of this Quarterly Report on Form 10-Q.
Item 6. Exhibits and Reports on Form 8-K
(a) Exhibits
Exhibit 3.2 Amended and Restated By-Laws of the Company dated as of July 31, 2002.
Exhibit 99.1 Certification Pursuant to 18 U.S.C. Section 1350, as Adopted Pursuant to Section 906 of the Sarbanes-Oxley Act of 2002.
Exhibit 99.2 Certification Pursuant to 18 U.S.C. Section 1350, as Adopted Pursuant to Section 906 of the Sarbanes-Oxley Act of 2002.
(b) Reports on Form 8-K
The following reports on Form 8-K were filed during the three months ended September 30, 2002. Form 8-K dated and filed July 10, 2002 relating to the completion of our tender offer to acquire A.L.I. Technologies on July 5, 2002. Form 8-K dated and filed August 9, 2002 relating to the statements under oath by John H. Hammergren and William R. Graber in response to the order of the Securities and Exchange Commission pursuant to Section 21 (a) (1) of the Securities Exchange Act of 1934 (SEC File No. 4-460).
There were no reports on Form 8-K filed after September 30, 2002 through to the date of this filing.

McKESSON CORPORATION
26
SIGNATURES
Pursuant to the requirements of the Securities Exchange Act of 1934, the Registrant has duly caused this report to be signed on its behalf by the undersigned, thereunto duly authorized.
McKesson Corporation
Dated: November 12, 2002 By /s/ William R. Graber
William R. Graber Senior Vice President and Chief Financial Officer
By /s/ Nigel A. Rees Nigel A. Rees Vice President and Controller

McKESSON CORPORATION
CERTIFICATION PURSUANT TO 18 U.S.C SECTION 1350,
AS ADOPTED PURSUANT TO SECTION 302 OF THE SARBANES-OXLEY ACT OF 2002
I, John H. Hammergren, certify that: 1. I have reviewed this quarterly report on Form 10-Q of McKesson Corporation (the “Registrant”); 2. Based on my knowledge, this quarterly report does not contain any untrue statement of a material fact or omit to
state a material fact necessary to make the statements made, in light of the circumstances under which such statements were made, not misleading with respect to the period covered by this quarterly report;
3. Based on my knowledge, the financial statements, and other financial information included in this quarterly
report, fairly present in all material respects the financial condition, results of operations and cash flows of the Registrant as of, and for, the periods presented in this quarterly report;
4. The Registrant’s other certifying officer and I are responsible for establishing and maintaining disclosure controls and procedures (as defined in Exchange Act Rules 13a - 14 and 15 d - 14) for the Registrant and we have: (a) designed such disclosure controls and procedures to ensure that material information relating to the Registrant, including its consolidated subsidiaries, is made known to us by others within those entities, particularly during the period in which this quarterly report is being prepared; (b) evaluated the effectiveness of the Registrant’s disclosure controls and procedures as of a date within 90 days prior to the filing date of this quarterly report (the “Evaluation Date”); and (c) presented in this quarterly report our conclusions about the effectiveness of the disclosure controls and procedures based on our evaluation as of the Evaluation Date;
5. The Registrant’s other certifying officer and I have dis closed, based on our most recent evaluation, to the Registrant’s auditors and the audit committee of Registrant’s board of directors: (a) all significant deficiencies in the design or operation of internal controls which could adversely affect the Registrant’s ability to record, process, summarize and report financial data and have identified for the Registrant’s auditors any material weaknesses in internal controls; and (b) any fraud, whether or not material, that involves management or other employees who have a significant role in the Registrant’s internal controls; and
6. The Registrant’s other certifying officer and I have indicated in this quarterly report whether or not there were significant changes in internal controls or in other factors that could significantly affect internal controls subsequent to the date of our most recent evaluation, including any corrective actions with regard to significant deficiencies and material weaknesses.
Date: November 12, 2002 /s/ John H. Hammergren John H. Hammergren Chairman and Chief Executive Officer

McKESSON CORPORATION
CERTIFICATION PURSUANT TO 18 U.S.C. SECTION 1350,
AS ADOPTED PURSUANT TO SECTION 302 OF THE SARBANES-OXLEY ACT OF 2002
I, William R. Graber, certify that: 1. I have reviewed this quarterly report on Form 10-Q of McKesson Corporation (the “Registrant”); 2. Based on my knowledge, this quarterly report does not contain any untrue statement of a material fact or omit to
state a material fact necessary to make the statements made, in light of the circumstances under which such statements were made, not misleading with respect to the period covered by this quarterly report;
3. Based on my knowledge, the financial statements, and other financial information included in this quarterly
report, fairly present in all material respects the financial condition, results of operations and cash flows of the Registrant as of, and for, the periods presented in this quarterly report;
4. The Registrant’s other certifying officer and I are responsible for establishing and maintaining disclosure controls and procedures (as defined in Exchange Act Rules 13a - 14 and 15 d - 14) for the Registrant and we have: (a) designed such disclosure controls and procedures to ensure that material information relating to the Registrant, including its consolidated subsidiaries, is made known to us by others within those entities, particularly during the period in which this quarterly report is being prepared; (b) evaluated the effectiveness of the Registrant’s disclosure controls and procedures as of a date within 90 days prior to the filing date of this quarterly report (the “Evaluation Date”); and (c) presented in this quarterly report our conclusions about the effectiveness of the disclosure controls and procedures based on our evaluation as of the Evaluation Date;
5. The Registrant’s other certifying officer and I have disclosed, based on our most recent evaluation, to the Registrant’s auditors and the audit committee of Registrant’s board of directors: (a) all significant deficiencies in the design or operation of internal controls which could adversely affect the Registrant’s ability to record, process, summarize and report financial data and have identified for the Registrant’s auditors any material weaknesses in internal controls; and (b) any fraud, whether or not material, that involves management or other employees who have a significant role in the Registrant’s internal controls; and
6. The Registrant’s other certifying officer and I have indicated in this quarterly report whether or not there were significant changes in internal controls or in other factors that could significantly affect internal controls subsequent to the date of our most recent evaluation, including any corrective actions with regard to significant deficiencies and material weaknesses.
Date: November 12, 2002 /s/ William R. Graber William R. Graber Senior Vice President and Chief Financial Officer