
Megatrends - iron ore, metallurgical coal and scrap 2 - CRU - OECD-SA Dec 2014.pdf · Megatrends -...
25
Megatrends - iron ore, metallurgical coal and scrap Prepared for: OECD/South Africa Workshop on Steelmaking Raw Materials 11 th December 2014 Prepared by: Laura Brooks, Senior Consultant
Transcript of Megatrends - iron ore, metallurgical coal and scrap 2 - CRU - OECD-SA Dec 2014.pdf · Megatrends -...
Megatrends - iron ore, metallurgical coal and scrap
Prepared for:
OECD/South Africa Workshop on Steelmaking Raw Materials
11th December 2014
Prepared by: Laura Brooks, Senior Consultant
Agenda • Summary of trade flows • Recent trends for the bulks – why have prices collapsed? • Forecast – 3 megatrends to watch for • What are our expectations for the scrap market? • Conclusions
3
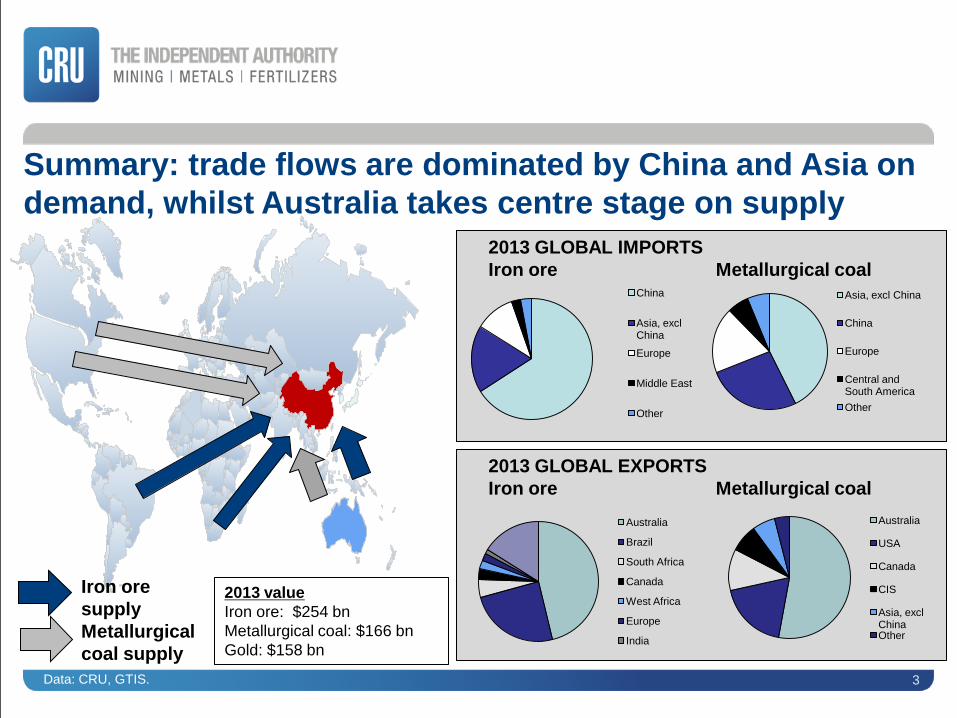
Summary: trade flows are dominated by China and Asia on demand, whilst Australia takes centre stage on supply
China
Asia, excl China
Europe
Middle East
Other
Asia, excl China
China
Europe
Central and South America Other
2013 GLOBAL IMPORTS Iron ore Metallurgical coal
2013 GLOBAL EXPORTS Iron ore Metallurgical coal
Australia
Brazil
South Africa
Canada
West Africa
Europe
India
Australia
USA
Canada
CIS
Asia, excl China Other
2013 value Iron ore: $254 bn Metallurgical coal: $166 bn Gold: $158 bn
Iron ore supply Metallurgical coal supply
Data: CRU, GTIS.
Agenda • Summary of trade flows • Recent trends for the bulks – why have prices collapsed? • Forecast – 3 megatrends to watch for • What are our expectations for the scrap market? • Conclusions
5
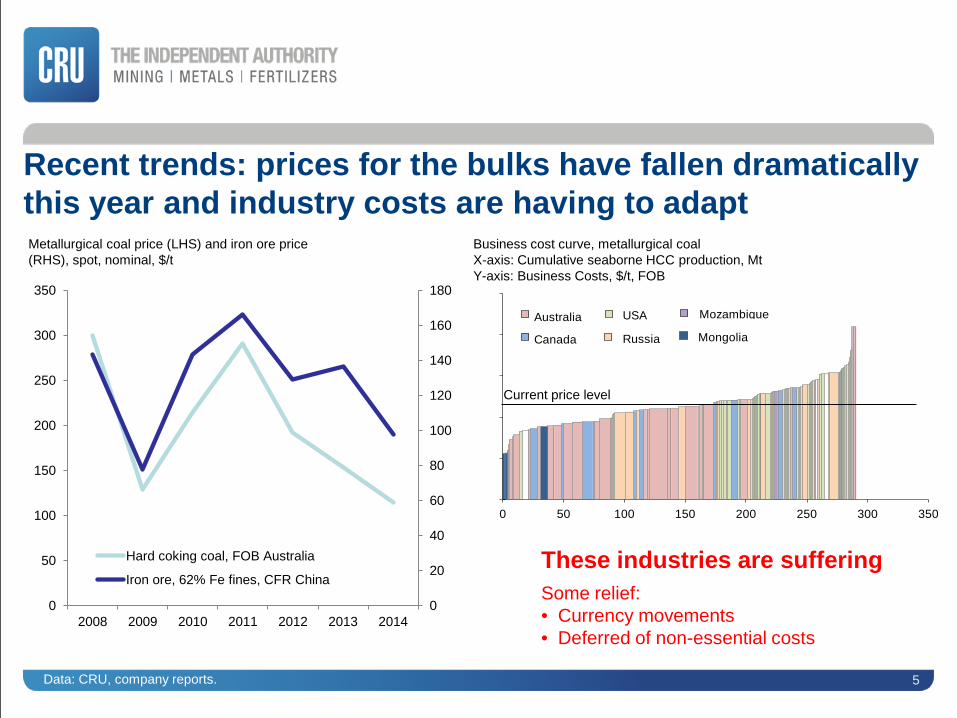
Recent trends: prices for the bulks have fallen dramatically this year and industry costs are having to adapt
0
20
40
60
80
100
120
140
160
180
0
50
100
150
200
250
300
350
2008 2009 2010 2011 2012 2013 2014
Hard coking coal, FOB Australia
Iron ore, 62% Fe fines, CFR China
Metallurgical coal price (LHS) and iron ore price (RHS), spot, nominal, $/t
0
50
100
150
200
250
0 50 100 150 200 250 300 350
Cos
ts ($
/t)
Cumulative production (mt)
0
50
100
150
200
250
0 50 100 150 200 250 300 350
Australia USA
Canada Russia
Mozambique
Mongolia
Business cost curve, metallurgical coal X-axis: Cumulative seaborne HCC production, Mt Y-axis: Business Costs, $/t, FOB
These industries are suffering
Some relief: • Currency movements • Deferred of non-essential costs
Current price level
Data: CRU, company reports.
6
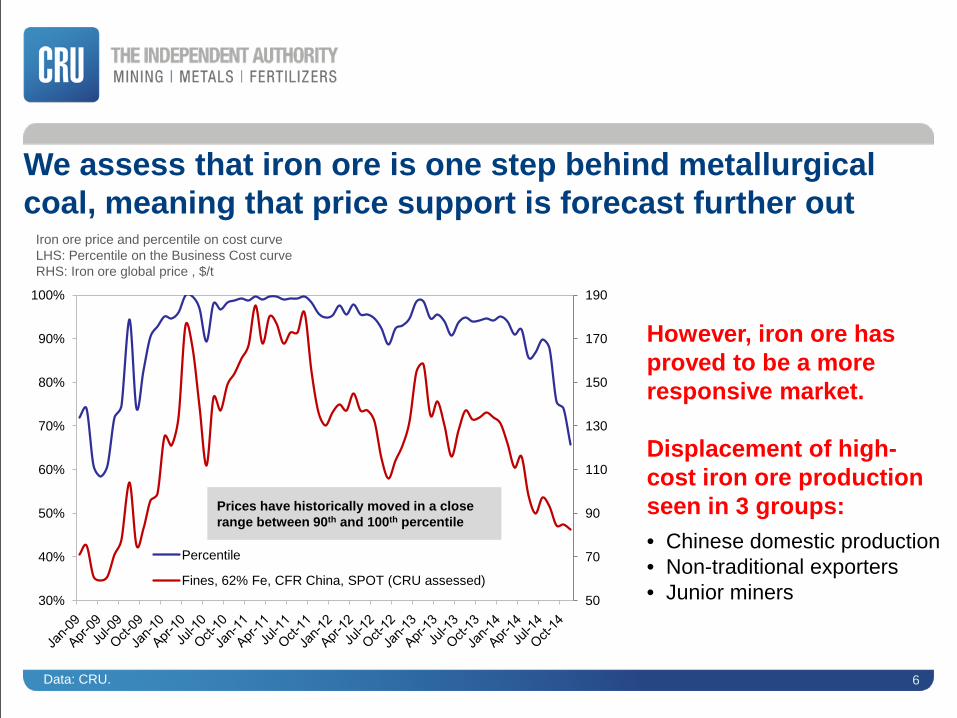
We assess that iron ore is one step behind metallurgical coal, meaning that price support is forecast further out
However, iron ore has proved to be a more responsive market. Displacement of high- cost iron ore production seen in 3 groups:
• Chinese domestic production • Non-traditional exporters • Junior miners
50
70
90
110
130
150
170
190
30%
40%
50%
60%
70%
80%
90%
100%
Percentile
Fines, 62% Fe, CFR China, SPOT (CRU assessed)
Iron ore price and percentile on cost curve LHS: Percentile on the Business Cost curve RHS: Iron ore global price , $/t
Prices have historically moved in a close range between 90th and 100th percentile
Data: CRU.
7
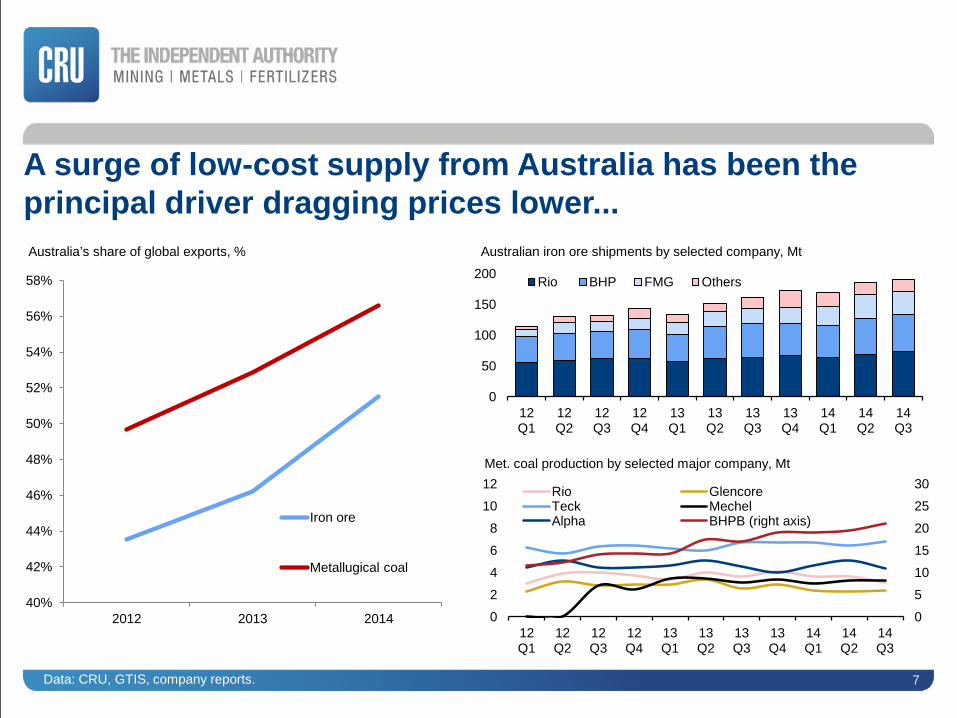
A surge of low-cost supply from Australia has been the principal driver dragging prices lower...
0
50
100
150
200
12 Q1
12 Q2
12 Q3
12 Q4
13 Q1
13 Q2
13 Q3
13 Q4
14 Q1
14 Q2
14 Q3
Rio BHP FMG Others
Australian iron ore shipments by selected company, Mt
0
5
10
15
20
25
30
0
2
4
6
8
10
12
12 Q1
12 Q2
12 Q3
12 Q4
13 Q1
13 Q2
13 Q3
13 Q4
14 Q1
14 Q2
14 Q3
Rio Glencore Teck Mechel Alpha BHPB (right axis)
Met. coal production by selected major company, Mt
40%
42%
44%
46%
48%
50%
52%
54%
56%
58%
2012 2013 2014
Iron ore
Metallugical coal
Australia’s share of global exports, %
Data: CRU, GTIS, company reports.
8
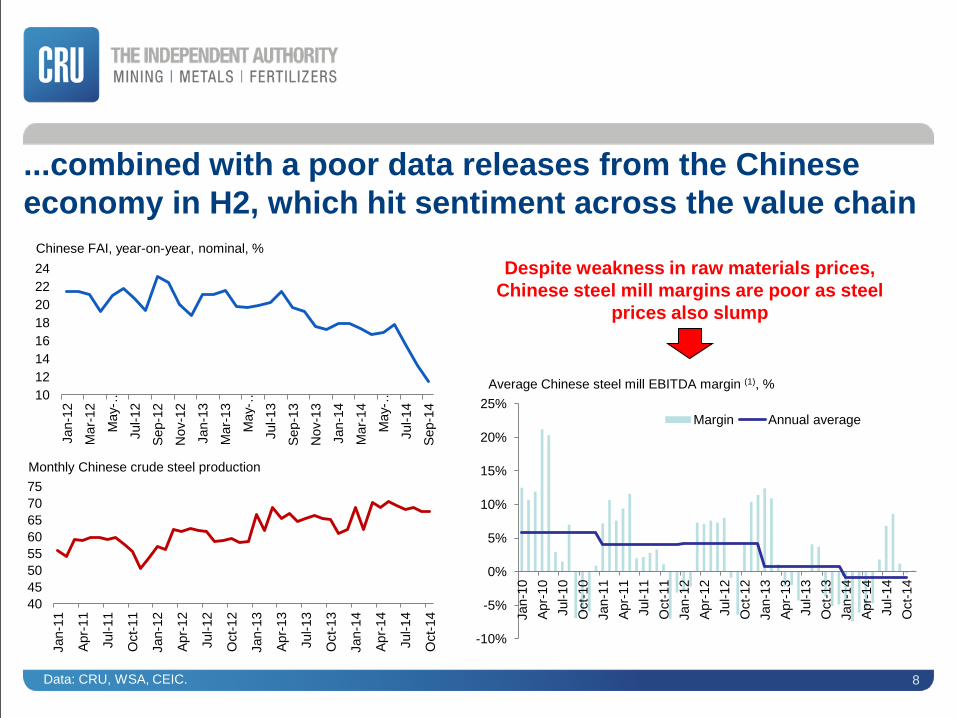
...combined with a poor data releases from the Chinese economy in H2, which hit sentiment across the value chain
40 45 50 55 60 65 70 75
Jan-
11
Apr-
11
Jul-1
1
Oct
-11
Jan-
12
Apr-
12
Jul-1
2
Oct
-12
Jan-
13
Apr-
13
Jul-1
3
Oct
-13
Jan-
14
Apr-
14
Jul-1
4
Oct
-14
Monthly Chinese crude steel production
10 12 14 16 18 20 22 24
Jan-
12
Mar
-12
May
-…
Jul-1
2
Sep-
12
Nov
-12
Jan-
13
Mar
-13
May
-…
Jul-1
3
Sep-
13
Nov
-13
Jan-
14
Mar
-14
May
-…
Jul-1
4
Sep-
14
Chinese FAI, year-on-year, nominal, %
-10%
-5%
0%
5%
10%
15%
20%
25%
Jan-
10
Apr-
10
Jul-1
0 O
ct-1
0 Ja
n-11
Ap
r-11
Ju
l-11
Oct
-11
Jan-
12
Apr-
12
Jul-1
2 O
ct-1
2 Ja
n-13
Ap
r-13
Ju
l-13
Oct
-13
Jan-
14
Apr-
14
Jul-1
4 O
ct-1
4
Margin Annual average
Despite weakness in raw materials prices, Chinese steel mill margins are poor as steel
prices also slump
Average Chinese steel mill EBITDA margin (1), %
Data: CRU, WSA, CEIC.
Agenda • Summary of trade flows • Recent trends for the bulks – why have prices collapsed? • Forecast – 3 megatrends to watch for • What are our expectations for the scrap market? • Conclusions
10
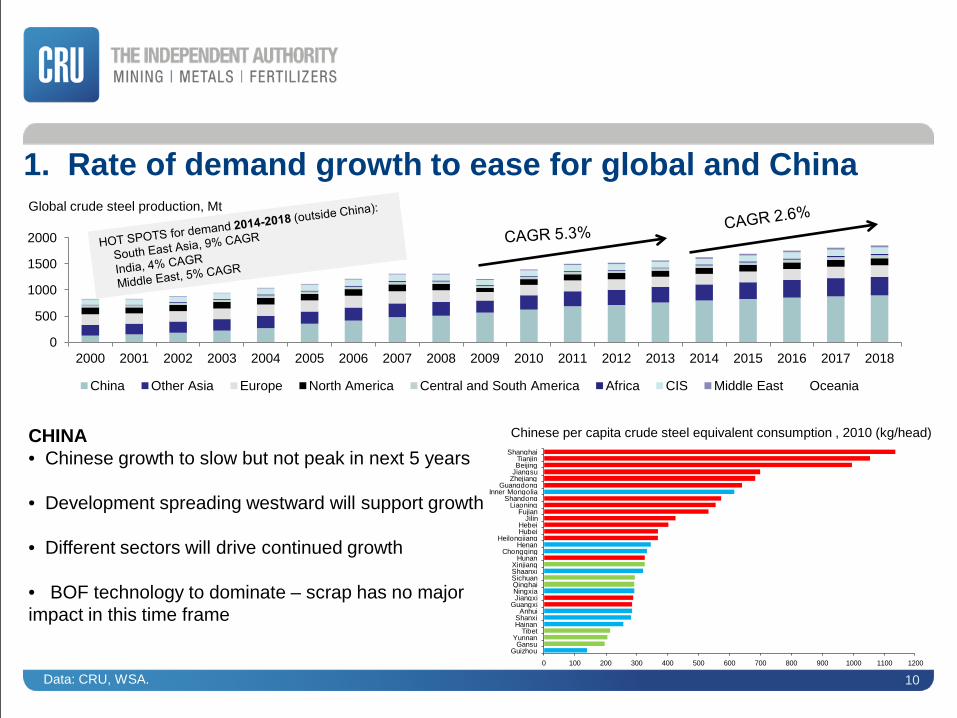
1. Rate of demand growth to ease for global and China
0 100 200 300 400 500 600 700 800 900 1000 1100 1200
GuizhouGansu
YunnanTibet
HainanShanxi
AnhuiGuangxiJiangxiNingxiaQinghaiSichuanShaanxiXinjiang
HunanChongqing
HenanHeilongjiang
HubeiHebei
JilinFujian
LiaoningShandong
Inner MongoliaGuangdong
ZhejiangJiangsuBeijingTianjin
Shanghai
Chinese per capita crude steel equivalent consumption , 2010 (kg/head)
0
500
1000
1500
2000
2000 2001 2002 2003 2004 2005 2006 2007 2008 2009 2010 2011 2012 2013 2014 2015 2016 2017 2018
China Other Asia Europe North America Central and South America Africa CIS Middle East Oceania
Global crude steel production, Mt
CHINA • Chinese growth to slow but not peak in next 5 years • Development spreading westward will support growth
• Different sectors will drive continued growth
• BOF technology to dominate – scrap has no major impact in this time frame
Data: CRU, WSA.
11
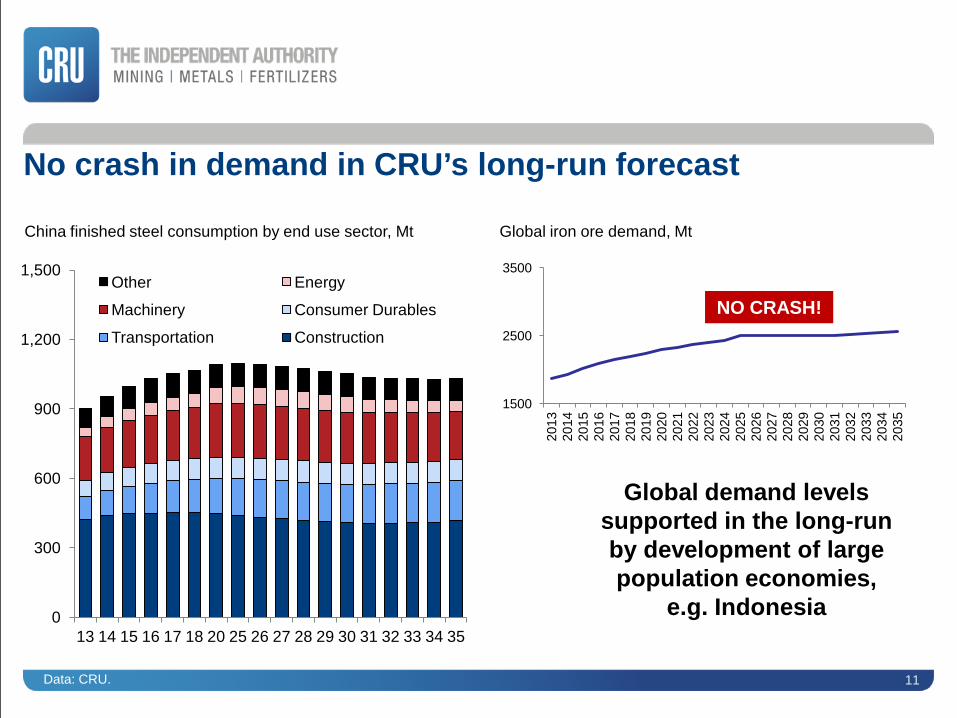
No crash in demand in CRU’s long-run forecast
0
300
600
900
1,200
1,500
13 14 15 16 17 18 20 25 26 27 28 29 30 31 32 33 34 35
Other Energy
Machinery Consumer Durables
Transportation Construction
China finished steel consumption by end use sector, Mt
1500
2500
3500
2013
20
14
2015
20
16
2017
20
18
2019
20
20
2021
20
22
2023
20
24
2025
20
26
2027
20
28
2029
20
30
2031
20
32
2033
20
34
2035
Global iron ore demand, Mt
Global demand levels supported in the long-run by development of large population economies,
e.g. Indonesia
NO CRASH!
Data: CRU.
12
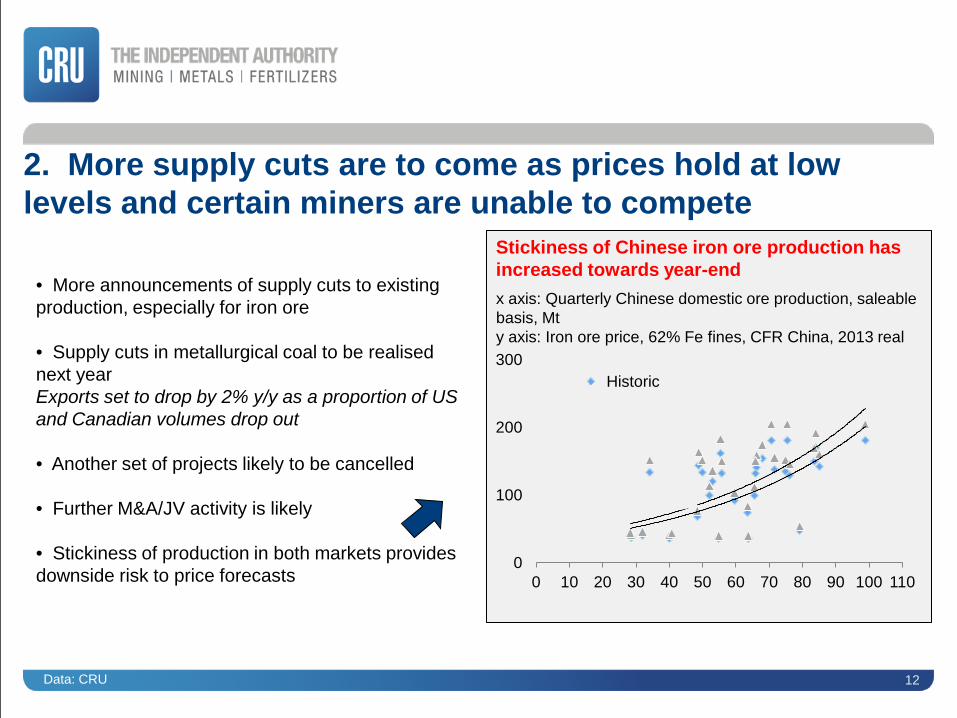
2. More supply cuts are to come as prices hold at low levels and certain miners are unable to compete
• More announcements of supply cuts to existing production, especially for iron ore
• Supply cuts in metallurgical coal to be realised next year Exports set to drop by 2% y/y as a proportion of US and Canadian volumes drop out • Another set of projects likely to be cancelled
• Further M&A/JV activity is likely
• Stickiness of production in both markets provides downside risk to price forecasts
0
100
200
300
0 10 20 30 40 50 60 70 80 90 100 110
Historic
x axis: Quarterly Chinese domestic ore production, saleable basis, Mt y axis: Iron ore price, 62% Fe fines, CFR China, 2013 real
Stickiness of Chinese iron ore production has increased towards year-end
Data: CRU
13
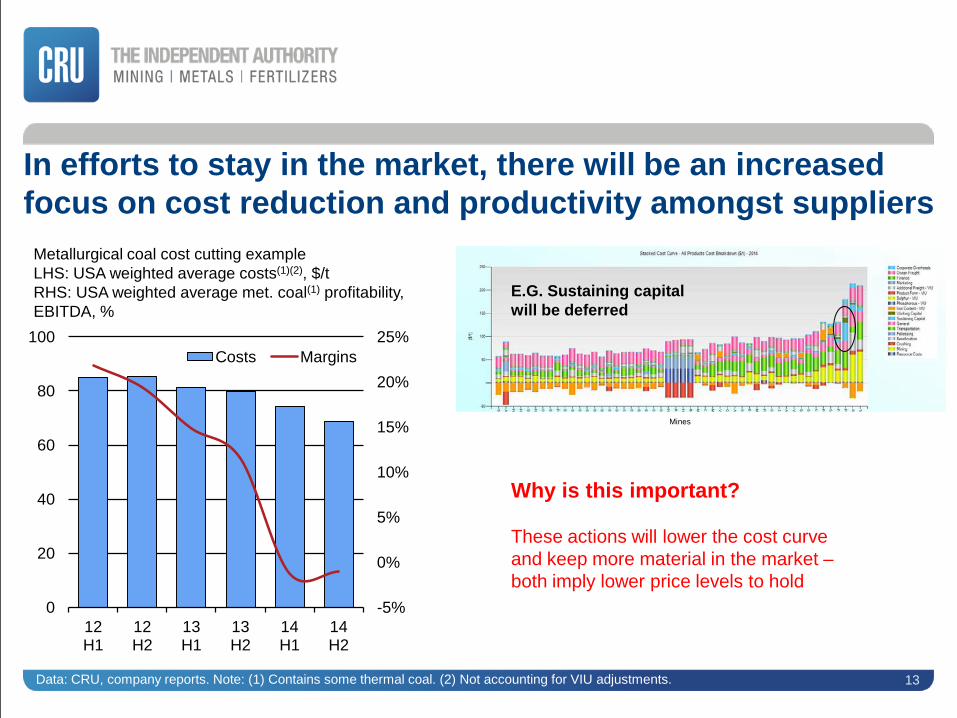
In efforts to stay in the market, there will be an increased focus on cost reduction and productivity amongst suppliers
-5%
0%
5%
10%
15%
20%
25%
0
20
40
60
80
100
12 H1
12 H2
13 H1
13 H2
14 H1
14 H2
Costs Margins
Metallurgical coal cost cutting example LHS: USA weighted average costs(1)(2), $/t RHS: USA weighted average met. coal(1) profitability, EBITDA, %
Data: CRU, company reports. Note: (1) Contains some thermal coal. (2) Not accounting for VIU adjustments.
E.G. Sustaining capital will be deferred
Mines
Why is this important? These actions will lower the cost curve and keep more material in the market – both imply lower price levels to hold
14
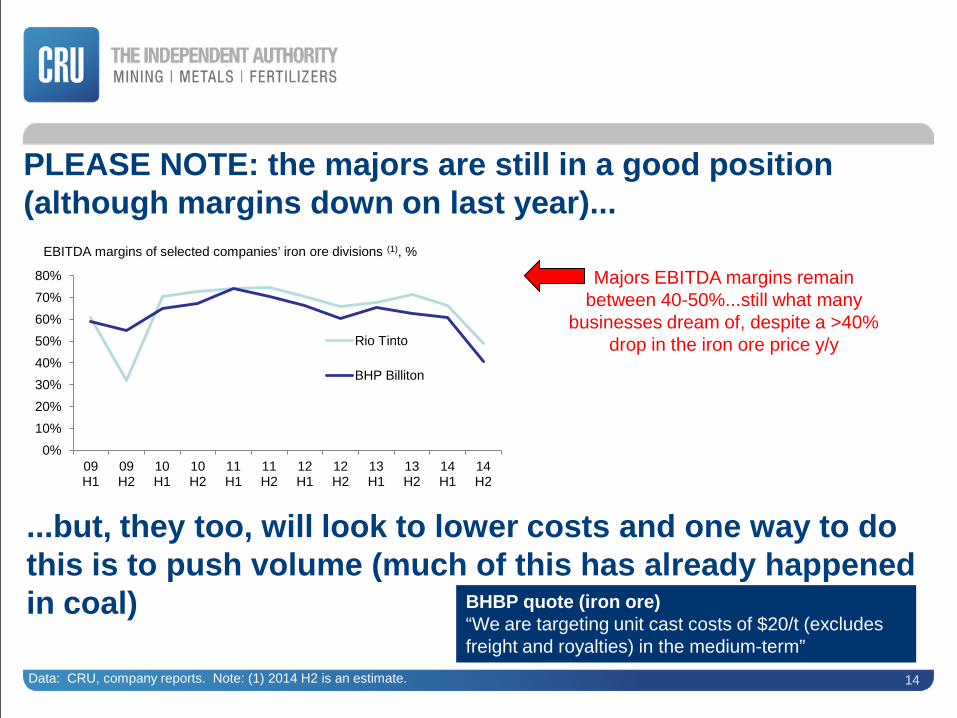
PLEASE NOTE: the majors are still in a good position (although margins down on last year)...
...but, they too, will look to lower costs and one way to do this is to push volume (much of this has already happened in coal) BHBP quote (iron ore)
“We are targeting unit cast costs of $20/t (excludes freight and royalties) in the medium-term”
0% 10% 20% 30% 40% 50% 60% 70% 80%
09 H1
09 H2
10 H1
10 H2
11 H1
11 H2
12 H1
12 H2
13 H1
13 H2
14 H1
14 H2
Rio Tinto
BHP Billiton
Majors EBITDA margins remain between 40-50%...still what many
businesses dream of, despite a >40% drop in the iron ore price y/y
EBITDA margins of selected companies’ iron ore divisions (1), %
Data: CRU, company reports. Note: (1) 2014 H2 is an estimate.
15
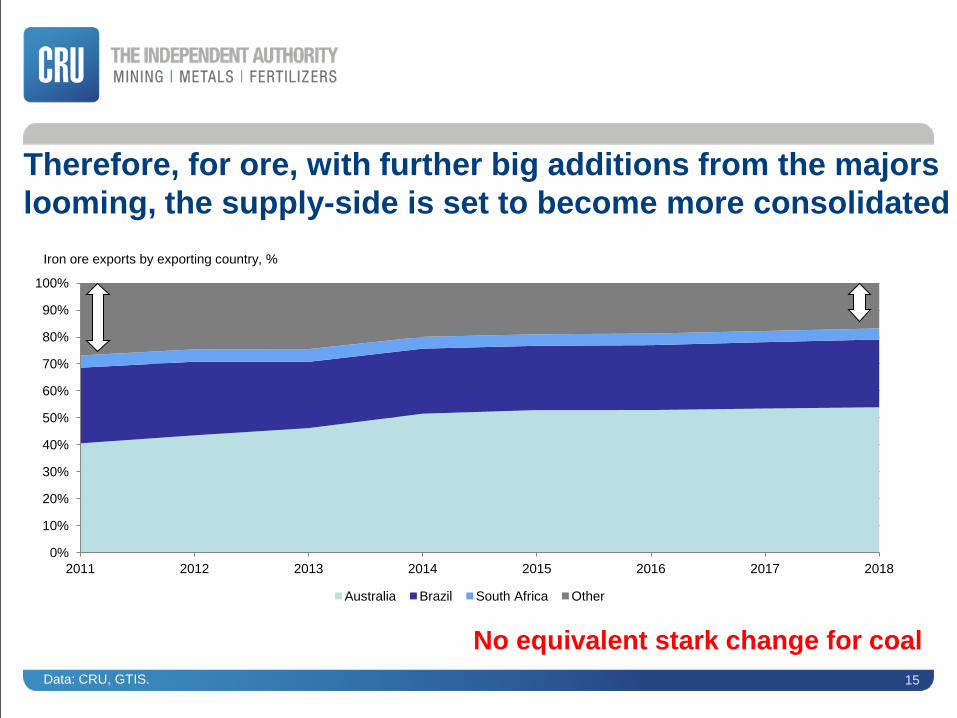
Therefore, for ore, with further big additions from the majors looming, the supply-side is set to become more consolidated
0%
10%
20%
30%
40%
50%
60%
70%
80%
90%
100%
2011 2012 2013 2014 2015 2016 2017 2018
Australia Brazil South Africa Other
Iron ore exports by exporting country, %
No equivalent stark change for coal Data: CRU, GTIS.
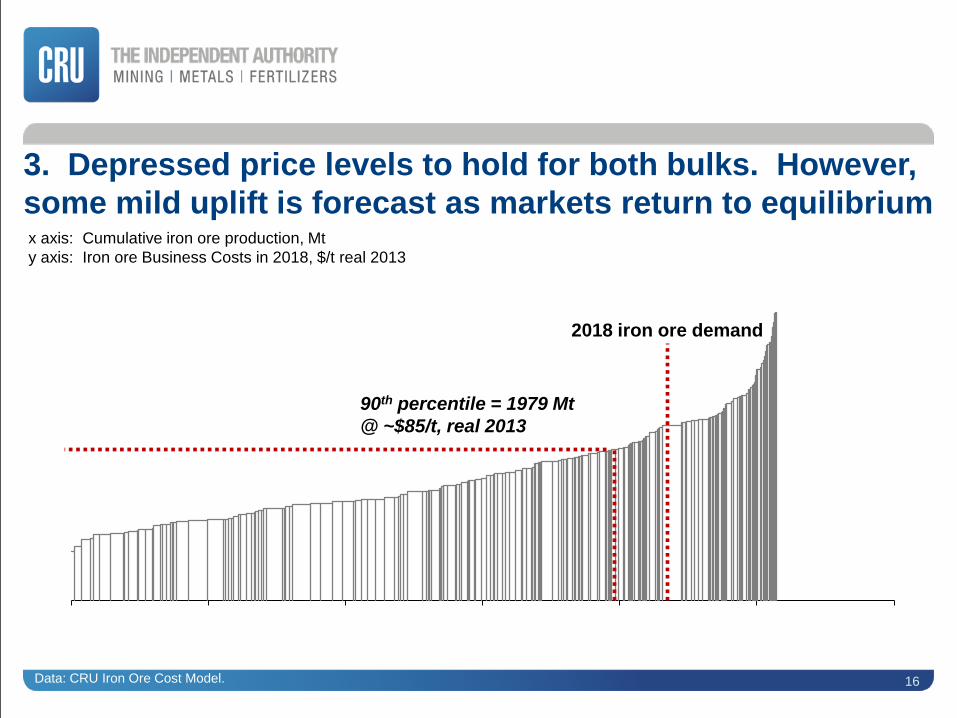
3. Depressed price levels to hold for both bulks. However, some mild uplift is forecast as markets return to equilibrium
Data: CRU Iron Ore Cost Model.
x axis: Cumulative iron ore production, Mt y axis: Iron ore Business Costs in 2018, $/t real 2013
0
20
40
60
80
100
120
140
160
180
0 500 1,000 1,500 2,000 2,500 3,000
2018 iron ore demand
90th percentile = 1979 Mt @ ~$85/t, real 2013
16
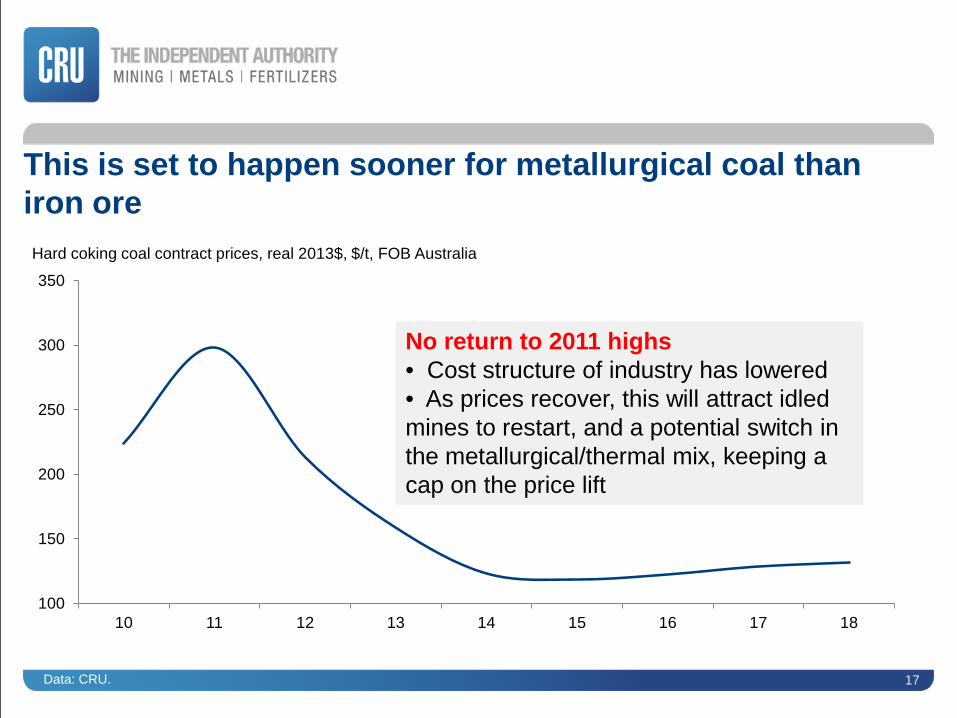
This is set to happen sooner for metallurgical coal than iron ore
17
100
150
200
250
300
350
10 11 12 13 14 15 16 17 18
Hard coking coal contract prices, real 2013$, $/t, FOB Australia
No return to 2011 highs • Cost structure of industry has lowered • As prices recover, this will attract idled mines to restart, and a potential switch in the metallurgical/thermal mix, keeping a cap on the price lift
Data: CRU.
18
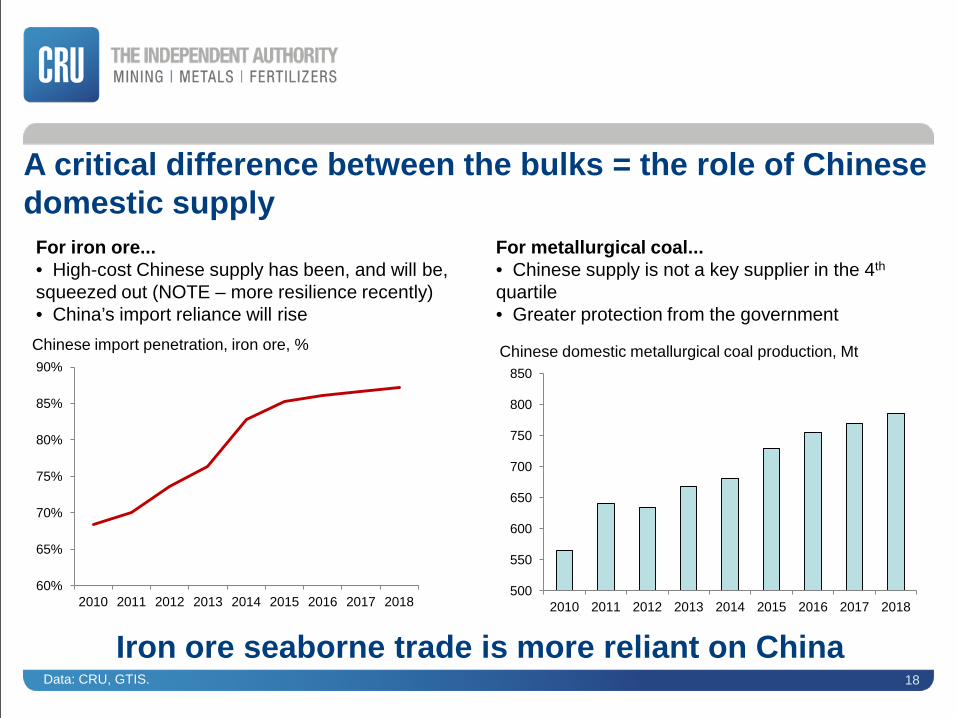
A critical difference between the bulks = the role of Chinese domestic supply
For iron ore... • High-cost Chinese supply has been, and will be, squeezed out (NOTE – more resilience recently) • China’s import reliance will rise
For metallurgical coal... • Chinese supply is not a key supplier in the 4th quartile • Greater protection from the government
Iron ore seaborne trade is more reliant on China
60%
65%
70%
75%
80%
85%
90%
2010 2011 2012 2013 2014 2015 2016 2017 2018
Chinese import penetration, iron ore, %
500
550
600
650
700
750
800
850
2010 2011 2012 2013 2014 2015 2016 2017 2018
Chinese domestic metallurgical coal production, Mt
Data: CRU, GTIS.
Agenda • Summary of trade flows • Recent trends for the bulks – why have prices collapsed? • Forecast – 3 megatrends to watch for • What are our expectations for the scrap market? • Conclusions
20
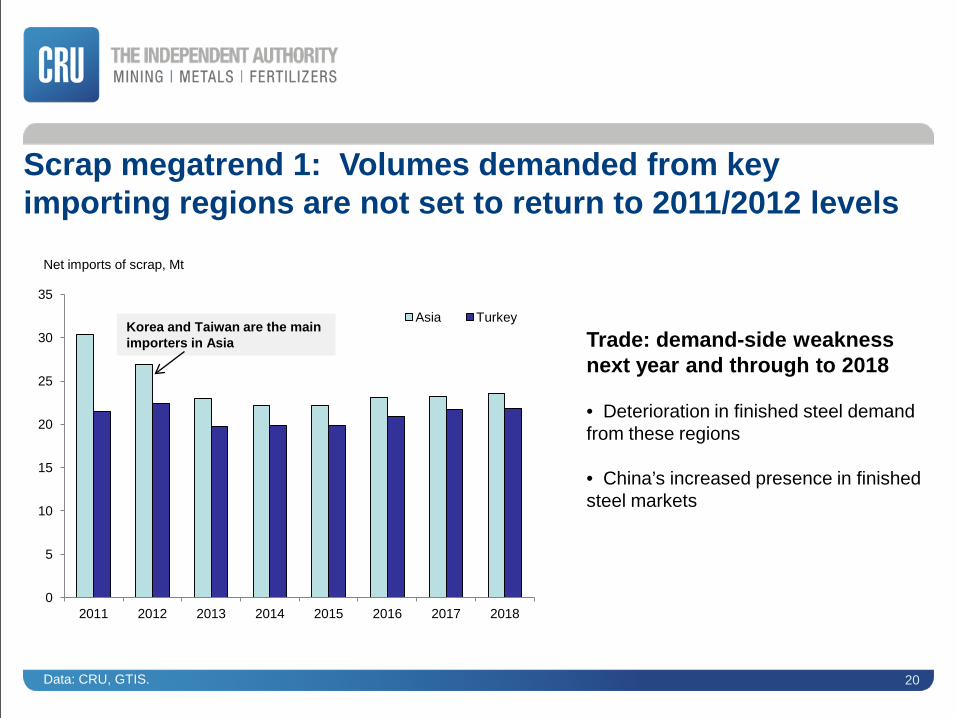
Scrap megatrend 1: Volumes demanded from key importing regions are not set to return to 2011/2012 levels
Net imports of scrap, Mt
0
5
10
15
20
25
30
35
2011 2012 2013 2014 2015 2016 2017 2018
Asia Turkey Korea and Taiwan are the main importers in Asia Trade: demand-side weakness
next year and through to 2018 • Deterioration in finished steel demand from these regions • China’s increased presence in finished steel markets
Data: CRU, GTIS.
21
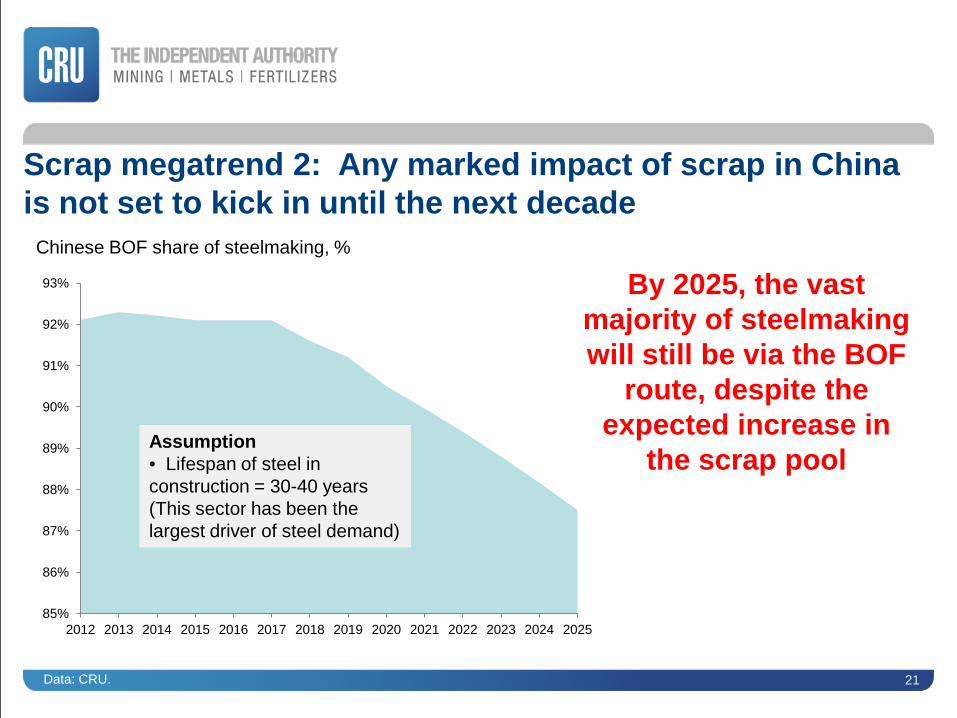
Scrap megatrend 2: Any marked impact of scrap in China is not set to kick in until the next decade
Chinese BOF share of steelmaking, %
85%
86%
87%
88%
89%
90%
91%
92%
93%
2012 2013 2014 2015 2016 2017 2018 2019 2020 2021 2022 2023 2024 2025
By 2025, the vast majority of steelmaking will still be via the BOF
route, despite the expected increase in
the scrap pool Assumption • Lifespan of steel in construction = 30-40 years (This sector has been the largest driver of steel demand)
Data: CRU.
Agenda • Summary of trade flows • Recent trends for the bulks – why have prices collapsed? • Forecast – 3 megatrends to watch for • What are our expectations for the scrap market? • Conclusions
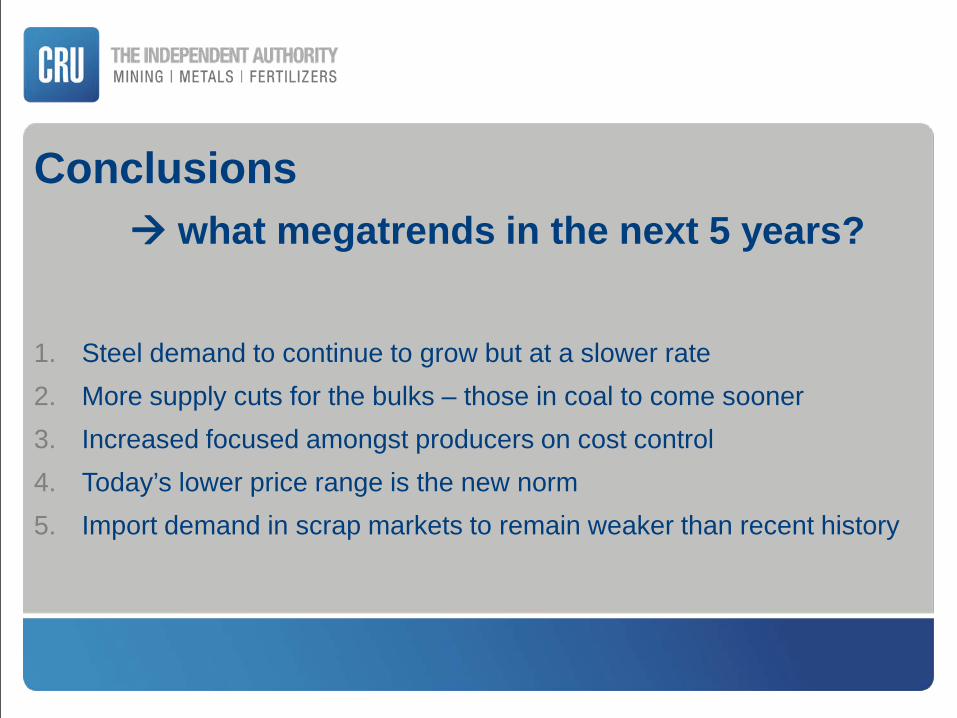
Conclusions what megatrends in the next 5 years?
1. Steel demand to continue to grow but at a slower rate 2. More supply cuts for the bulks – those in coal to come sooner 3. Increased focused amongst producers on cost control 4. Today’s lower price range is the new norm 5. Import demand in scrap markets to remain weaker than recent history

Thank you for your attention

Laura Brooks
Senior Consultant – Steel Raw Materials
T: +44 (0)20 7903 2239
Please address any questions or comments relating to this presentation to:
25