MegaCity Report 1439020
34
Publisher:SiemensAG Corpora teCommunications(CC) Wittelsbache rplatz2,80333 Munich Forthe publisher:StefanDenig stefan.denig @siemens.c om(Tel.+49 89636 83110) EditorialOffice: GarethLofthouse,EconomistIntelligenceUnit Research:GlobeScan,Toron to MRCMcLeanHazel,Edinburgh PictureEditing: JudithEgelhof,PublicisMunich Internet:www.siemens.com/m egacities;Dr.UlrichEberl, UlrikeZechbauer ,Siemens AG Layout/ Lithography:RigoRatschke,SeufferleMediendesignGmbH,Stuttgart Graphics: JochenHaller,SeufferleMediendesignGmbH,Stuttgart Printing:BechtleDruck&Service,Esslingen PictureCredits: Gettyimages (58-59, 60-61, 62-63). The copyright of all other images is held by Siemens AG. PrintedinGermany.Reproductionofthe articlesinwhole orin partrequiresthe permissio nof thepublisher.Thisalso appliestostoragein electronicdatabase s, onthe InternetandreproductiononCD-ROM. Whilsteveryeffort hasbeen takento verifytheaccuracyof thisinformation, neitherThe Economis tIntelligenceUnit Ltd.,SiemensAG northeiraffiliates can acceptanyresponsibilityor liabilityforrelianceby anypersonon thisinformation. M e g a c i t y C h a l l e n g e s A s t a k e h o l d e r r e s e a r c h p r o j e c t c o n d u c t e d b y G l o b e S c a n a n d M R C M c L e a n H a z e l Sponsored by Siemens A research project conducted by GlobeScan and MRC McLean Hazel Sponsored by Siemens Megacity Challenges A stakeholder perspective
-
Upload
cathy-fran -
Category
Documents
-
view
226 -
download
0
Transcript of MegaCity Report 1439020

8/3/2019 MegaCity Report 1439020
http://slidepdf.com/reader/full/megacity-report-1439020 1/34
Publisher:SiemensAGCorporateCommunications(CC)Wittelsbacherplatz2,80333 MunichForthe publisher:[email protected](Tel.+49 89636 83110)
EditorialOffice:GarethLofthouse,EconomistIntelligenceUnit
Research:GlobeScan,TorontoMRCMcLeanHazel,Edinburgh
PictureEditing: JudithEgelhof,PublicisMunichInternet:www.siemens.com/megacities;Dr.UlrichEberl,UlrikeZechbauer,Siemens AGLayout/ Lithography:RigoRatschke,SeufferleMediendesignGmbH,StuttgartGraphics: JochenHaller,SeufferleMediendesignGmbH,StuttgartPrinting:BechtleDruck&Service,Esslingen
PictureCredits:Gettyimages (58-59, 60-61, 62-63).The copyright of all other images is held by Siemens AG.
PrintedinGermany.Reproductionofthe articlesinwhole orin partrequiresthepermissionof thepublisher.Thisalso appliestostoragein electronicdatabases,onthe InternetandreproductiononCD-ROM.
Whilsteveryeffort hasbeen takento verifytheaccuracyof thisinformation,neitherThe EconomistIntelligenceUnit Ltd.,SiemensAG northeiraffiliates canacceptanyresponsibilityor liabilityforrelianceby anypersonon thisinformation.
M e g a c i t y C h a l l e n g e s
A s t a k e h o l d e r r e s e a r c h p r o j e c t
c o n d u c t e d b y G l o b e S c a n a n d M R C M c L e a n H a z e l
Sponsored by Siemens
A research project conducted by GlobeScan and MRC McLean Hazel
Sponsored by Siemens
Megacity ChallengeA stakeholder perspective

8/3/2019 MegaCity Report 1439020
http://slidepdf.com/reader/full/megacity-report-1439020 2/34
Content
Page
Key Findings 4
Megacity Challenges: an Overview 10
St ake ho ld er Pr io rit ie s: th e B ig Pi ct ur e 1 8
Five Infrastructures 24
Transportation 26
Electricity 32
Water and Waste Water 38
Healthcare 44
Safety and Security 50
City Governance and Finance 56
Conclusions 64
Appendix: Methodology 66
Chapter
01
02
03
04
05
06
07
08
09
10
11
12
Megacity Challenges
At some point in 2007, humanity will
reach a significant demographic mi-
lestone: for the first time in history more
people will live in cities than the coun-tryside, according to predictions by the
United Nations. By 2030, over 60% of
people will live in cities. The growth rate
is particularly rapid in many of the so-cal-
led megacities, cities with more than 10
million inhabitants. The megacities listed
by the UN already have a total population
of around 280 million. They are increa-
singly the growth engines of their respec-
tive national economies. But as these
cities and economies grow, so do the
challenges. One key issue is the burden
that growth is placing on urban infra-
structures.
Urban residents the world over want
— and deserve — a good quality of life.
They need good air to breathe, good wa-
ter to drink and reliable electricity to
power their lives. People need healthcare.
They also need to be mobile — so trans-
portation systems must be capable of
transporting millions of people while
putting as little strain as possible on the
environment and city budgets. In other
words, a good quality of life requires a
well-functioning infrastructure. More-
over, an effective infrastructure in turn
Acknowledgements
This report was written by the Economist Intelligence
Unit, based on research conducted by MRC McLean Hazel
and GlobeScan.
We would like to thank all those who participated in the
survey for their valuable insights and time.
Shanghai
contributes to economic prosperity, further
improving quality of life. Unfortunately,
the infrastructure in many cities lags be-
hind the population’s needs — a majorchallenge for city governments in both
emerging and industrialized nations.
This report summarizes the key find-
ings of a unique global research project
undertaken by two independent research
organizations with the support of
Siemens, the infrastructure provider. The
goal of the project was to carry out re-
search at the individual megacity level to
gather objective data as well as perspec-
tives from mayors, city administrators
and other experts on local infrastructure
challenges. Over 500 public- and private-
sector experts from 25 cities were inter-
viewed for this purpose.
The result is a fascinating and, we
hope, useful picture of how challenges
are prioritized and what infrastructure
solutions are best able to improve the
local economy, environment and quality
of life of megacities.
We hope you enjoy reading the report!
Prof. George Hazel, OBE,
MRC McLean Hazel
Doug Miller, GlobeScan
Preface
2 Megacity Challenges Megacity Chal

8/3/2019 MegaCity Report 1439020
http://slidepdf.com/reader/full/megacity-report-1439020 3/34
2007will be the year that, for the firsttime in history, more people will
live in cities than in the country. For many, it is
the megacity that symbolizes everything that is
inspiring and troubling about this era of rapid
urbanization.
Today’s megacities are home to almost one
in ten of the world’s urban population. Like all
great metropolises before them, these mega-
cities act as magnets for trade, culture, knowl-
Key findings
4 Megacity Challenges Megacity Chal
Key Findings
01edge and industry, but on an unprecedentedscale. In varying forms, they all face hugely
complex social and environmental challenges.
Achieving the opportunities for human and
economic development that megacities afford,
while improving their many problems, will
require the development of innovative infra-
structure solutions and new a pproaches to met-
ropolitan governance.
This report explores the key challenges and
trends that will shape urban developmglobal cities over the coming years.
ings are based on an in-depth survey
500 megacity stakeholders, including
officials, public- and private-sector em
and influencers such as academics, N
media. This survey was supplemen
extensive secondary research, enabl
shed light on the key challenges faced
cities at various stages of developmen
New York City
Key findings■ Megacities prioritize economic competitiveness and employment■ The environment matters, but may be sacrificed for growth■ Transport overtakes all other infrastructure concerns■ Better governance is a vital step towards better cities■ Holistic solutions are desired but difficult to achieve■ Cities will seek to improve services, but could do more to manage demand■ Technology will help deliver transparency and efficiency■ The private sector has a role to play in increasing efficiency

8/3/2019 MegaCity Report 1439020
http://slidepdf.com/reader/full/megacity-report-1439020 4/34
Key findings
6 Megacity Challenges Megacity Cha
Megacities prioritize economic competi-
tiveness and employment. When asked
which issues drive decision-making, 81% of
stakeholders involved in city management
cite the importance of the economy and
employment. There is a strong focus on creat-
ing jobs, with unemployment emerging as the
top economic challenge for survey respon-
dents from Emerging and Transitional cities.
Competitiveness in the global economy is
another important consideration. Six in ten
stakeholders think that their cities place a
high importance on making themselves com-
petitive to attract private investment when
deciding on infrastructure issues.
The environment matters, but may be
sacrificed for growth. Stakeholders through-
out the survey place a high importance onenvironmental issues. They see air pollution
as the most significant environmental chal-
lenge, followed by congestion issues. Six in
ten stakeholders believe their city’s leadership
recognizes the vital role that infrastructure
decisions can play in protecting the environ-
ment. Environmental issues also feature
prominently in the thinking of the infrastruc-
ture specialists in the survey: those in trans-
port predict an emphasis on mass transit solu-
tions, and those in the energy sector show a
strong inclination for solutions based on
renewables. But if a choice has to be made
between the environment and economic
growth, it is the latter that often wins out.This is particularly so in the developing world,
where 55% of stakeholders predict that their
cities will sacrifice environmental considera-
tions for the sake of increased capacity, com-
pared with only 14% respondents in Mature
cities who believe that this will happen.
Transport overtakes all other infrastruc-
ture concerns. Transportation emerges as
the top megacity infrastructure challenge by a
large margin. It is the one infrastructure area
that stakeholders believe has the biggest
impact on city competitiveness. They are also
highly aware of its environmental impact (for
example, air pollution) and are keen to move to
greener mass transit solutions. It is not surpris-
ing therefore to find that transport also
emerges as the top priority for investment.
Stakeholders acknowledge that the four other
infrastructure sectors covered by this study –
water, electricity, healthcare and safety & secu-
rity — are also in need of investment. Interest-
ingly, they are less likely to see a strong link
between spending in these areas and improvedcompetitiveness, despite the fact that each has
an important impact on the overall attractive-ness of the city for investment.
Better governance is a vital step towards
better cities. With so many areas crying out
for investment in better infrastructure, it is
not surprising that funding emerges as a big
issue for many stakeholders in the survey. But
for those involved in city management, it is
improvements to governance — rather than
just money — that are the top priority going
forward. Over half of respondents with know-
ledge of urban management see improved
planning as the priority to solving city prob-
lems, compared with only 12% that prioritize
increased funding. In addition to more strate-
gic planning, there is also a strong focus on
managing infrastructure and services moreefficiently. Both these goals will require cities
to make the step from passive administration
of existing services, to a more active style of
managing systems that focuses on improved
efficiency and more measurable outcomes.
Holistic solutions are desired, but are dif-
ficult to achieve. The main barriers to strate-
gic management are poor coordination between
the different levels of municipal government,
together with a lack of strong leadership,
according to the survey. Stakeholders express
a clear desire for a more holistic approach to
city management, but this is rarely the reality
today. Many megacities have a multitude of
administrative bodies with overlapping and
poorly defined responsibilities, which inevita-
bly saps efficiency and makes strategic plan-
ning difficult. Governance structures need to
balance the needs of the city with the wider
metropolitan area, and also take into account
the interdependencies between the various
infrastructures (water and healthcare, for
example). Cities and their needs are complexand the traditional, departmentally organized
approach to city governance needs to be
rethought to enable more holistic solutions
on the one hand, and more responsiveness
and accountability to citizens at a local level
on the other.
Cities will seek to improve services, but
could do more to manage demand. Faced
by huge pressures on public services, cities
tend to emphasize direct and immediate sup-
ply-side solutions. This does not always mean
adding more capacity: in many cases stake-
holders emphasize the need to increase the
efficiency of existing infrastructure over buil-
ding new roads, railways, hospitals and so on.
By contrast, although it gets mentioned by a
minority of respondents, demand manage-
ment never emerges as a priority. Demandmanagement approaches have been advocat-
ed in a variety of areas, but even the special-
ists in specific infrastructure sectors do not
see managing demand as the primary solu-
tion to their challenges. Yet with consumption
consistently outstripping supply in many
cities and infrastructure areas, there is a
strong case for the wider adoption of demand
management strategies on a global basis. In
this context, the proper pricing of
could be a step forward.
Technology will help to delive
parency and efficiency. Techno
help city governments in two major
making them more efficient, an
accountable to their citizens. Eigh
respondents think that their city wil
ingly integrate advanced information
ogy into their administration and o
over the next five years. Moreover, c
agement specialists predict a strong e
on digitalization or e-government rat
on recruiting more staff (64% to 36thermore the value of technology
restricted to rich cities. Cash-strappe
ing cities place almost as much impor
e-government and digitalization as
Transitional and Mature cities.
The private sector has a role to
increasing efficiency. The stakeho
vey provides a mixed picture on att
privatization. Most respondents
strong public ownership and control
structure sectors and services. How
majority of stakeholders also say that
open to public-private partnership
Private-sector respondents are natu
biggest enthusiasts, but more than
public-sector and elected responde
PPPs as a viable means to impleme
structure solutions and more thbelieve that privatization of infra
would increase its efficiency. Again
out that efficiency, rather than just fu
the main perceived advantage of
towards greater participation from th
sector. But even where cities move
the private operation of services to
efficiency, they want to retain stron
leadership and control.
Key findings of the researchinclude the following.
Buenos Aires

8/3/2019 MegaCity Report 1439020
http://slidepdf.com/reader/full/megacity-report-1439020 5/34
Key findings
8 Megacity Challenges Megacity Cha
Cities surveyed
Cit y Count ry 2003 2015 A rea S
Population Population in km2
in Mio. in Mio.
Tokyo Japan 35.0 36.2 13100
New York USA 21.2 22.8 10768
Seoul-Inchon South Korea 20.3 24.7 4400
Mexico-City Mexico 18.7 20.6 4600
São Paulo Brasil 17.9 20.0 4800
Mumbai India 17.4 22.6 4350
Los Angeles USA 16.4 17.6 14000
Delhi India 14.1 20.9 1500
Manila-Quezon Philippines 13.9 16.8 2200
Calcutta India 13.8 16.8 1400
Buenos Aires Argentina 13.0 14.6 3900
Shanghai China 12.8 12.7 1600
Jakarta Indonesia 12.3 17.5 16
Dhaka Bangladesh 11.6 17.9 1500
Rio de Janeiro Brasil 11.2 12.4 2400
Karachi Pakistan 11.1 16.2 1200 Ruhr Area Germany 11.1 11.1 9800
Cairo Egypt 10.8 13.1 1400
Beijing China 10.8 11.1 1400
Lagos Nigeria 10.7 17.0 1100
Moscow Russian Fed. 10.5 10.9 1100
Paris France 9.8 10.0 2600
Istanbul Turkey 9.4 11.3 2650
Chicago USA 9.2 10.0 8000
London Great Britain 7.6 7.6 1600
Infrastructure highlights
Transportation: More action needed to
manage demand
Congestion costs are huge for the megacityeconomy and environment. But despite some
success with congestion charging schemes in
several cities, the idea of road pricing has yet
to become a major focus for city stakeholders
around the world. Page 26
Electricity: Strong focus on renewablesWith demand again outstripping supply, there
is an emphasis on allowing electricity to be
priced by the market rather than subsidized.
Specialists in this sector also display a strong
appetite for renewable fuels, but it is likely
that surging demand will lead many growing
cities to continue to rely primarily on cheaperfossil fuels in the near future. Page 32
Water and waste water: Still fighting for
attention?
In many megacities, large sections of the pop-
ulation live without access to clean water or
basic sanitation. Research indicates that the
economic, not to mention social, costs of a
failure to address this problem are significant.
But only 3% of stakeholders cite water as the
major contributor to growth and competitive-ness. Page 38
Healthcare: Increased spending must be
combined with better managementOur survey indicates an emphasis on more
efficiency, delivered through common shared
healthcare infrastructure, ahead of simply
building more facilities. Preventative
approaches are desired, but external factors
are sometimes overlooked: no healthcare
stakeholder mentions water quality as a major
issue even in Emerging cities, indicating the
lack of a more holistic view to problem solv-
ing. Page 44
Safety & Security: Organized crime is a
bigger threat than terrorism
Organized crime is the biggest security chal-
lenge for megacities, and is cited as such by
twice as many stakeholders as those who
mention terrorism, the second most promi-
nent issue. Interestingly, surveillance is
emphasized well ahead of concerns for privacy.
Page 50
About this reportThis report looks at the challenges facing
megacities in city management and five critical
infrastructure sectors: Transportation, Electrici-
ty, Water and Waste Water, Healthcare, and
Safety and Security.
The conclusions are based on a survey of 522
stakeholders spread across 25 cities. Stake-
holders were divided into four groups:
Elected political leaders (described in this re-
port as electeds).
Employees of the municipality (employees).
Private sector infrastructure providers, con-
struction company managers, and financiers
(privates).People who are in roles that influence infra-
structure decision makers such as thought lead-
ers, academics, NGOs, and media (influencers).
The survey included general questions onmegacity issues that were addressed to all 522
respondents. More detailed sections on specif-
ic areas (ie. the five infrastructure sectors as
well as city management and finance) were
addressed to those respondents with the most
relevant knowledge and experience. For the
latter, we use the terms specialist or stakehold-
er (as in transport stakeholder, or city manage-
ment specialist) as convenient shorthand
throughout this report. Sample sizes range
from 124 in transportation to 72 in electricity.
To understand the different challenges and is-
sues facing megacities at different levels of de-
velopment, the research analyzes three cate-
gories of city: Emerging cities, Transitionalcities and Mature cities. Although every city is
unique, those in each of these archetypes
share many characteristics and face many simi-
lar problems. Throughout this report, we high-
light challenges and priorities for each of the
megacity archetypes, as well as key areas
where action is needed to enable cities to bal-
ance competitiveness with quality of life and
environmental sustainability.
London

8/3/2019 MegaCity Report 1439020
http://slidepdf.com/reader/full/megacity-report-1439020 6/34
Megacity challenges: an overview
10 Megacity Challenges Megacity Challe
Megacity Challenges
02T
he rise of the megacity often
observers between wonder and
nation. On one level, these super-siz
are seen as the engines of the globa
my, efficiently connecting the flow o
people, culture and knowledge. They
least potentially, unprecedented cotions of skills and technical resources
bring increased wealth and improve
of life to vast numbers of people.
But megacities also conjure up
gether darker vision. All the cities co
this research face huge challenges
from congestion and pollution to
threats and inadequate services
under the weight of excessive deman
Key findings■ The number of megacities has multiplied over the past 50 years,
to the extent that they now provide a home to 9% of the
world’s urban population
■ Their importance in the national and global economy is
disproportionately high
■ City governance is having to adapt to the challenge of
delivering holistic solutions across vast metropolitan regions
■ City managers must strike the balance between three overriding
concerns: Economic competitiveness, environment and
quality of life for urban residents
Mumbai

8/3/2019 MegaCity Report 1439020
http://slidepdf.com/reader/full/megacity-report-1439020 7/34
Megacity challenges: an overview
12 Megacity Challenges Megacity Challe
Population density (per km2)
Istanbul0
5,000
10,000
15,000
20,000
25,000
30,000
35,000
LagosLondon
MoscowMumbai
New YorkSão Paulo
Shanghai
S o u r c e : D e m o g r a p h i a ,
f r o m
v a r i o u s
Mega-growth, mega-complexitynamely economic competitiveness; quality of
life; and the environment.
The following sections look at the key chal-
lenges faced by cities at different stages of
development. We reveal the overall priorities
for stakeholders in a world where resources
are all too finite. The research also sheds light
on trends and strategies in five critical areas
of infrastructure — transportation, electricity,
water, healthcare and safety & security — as
well as through new approaches to metropoli-
tan governance.
Megacities have been described as the
urban phenomenon of the 21st century. Their
unprecedented size and complexity, and their
critical role as gateways in the global econo-
my, pose huge challenges for sustainable
urban development. We hope that this report
stimulates new thinking on the solutionsrequired to meet the Megacity challenge.
in the developing world also struggle to cope
with the rapid growth of informal settle-
ments. Today almost one in three of the
world’s urban population lives in slums, with-
out access to good housing or basic services,
according to UN-HABITAT’s 2006 State of the
World’s Cities report.
At one level or another, all of the stake-
holders surveyed as part of our research must
deal with this dual reality on a daily basis. In
their own areas, they hold significant respon-
sibility for overcoming the multitude of chal-
lenges that, to greater or lesser degrees, con-
front the 25 megacities covered by this
report. Many of them are also tasked with
delivering the solutions and services that will
enable their cities to compete in a globally
connected economy.This report looks at how stakeholders will
balance these demands in three major areas:
The megacity is a relatively new form of
urban development. In 1950, there were
only two cities with populations of over 10
million: New York and Tokyo. By 1975, two
more locations, Shanghai and Mexico City,
joined the club. But by 2004, the number of
megacities had rocketed to 22* and, together,
these cities now account for 9% of the world’s
urban population.
Urban growth is spread unequally around
the world, and the same is true of its largest
cities. Most of the megacities in the devel-
oped world are growing slowly, if at all. Tokyo
remains the largest with 35 million inhabi-
tants, but the fastest growth will be in thedeveloping world (particularly in Asia and
Africa), placing huge pressure on infrastruc-
ture in those locations. By 2020 Mumbai,
Delhi, Mexico City, São Paulo, Dhaka, Jakarta
and Lagos will each have populations of over
20 million. For many Emerging cities, soaring
populations are extremely difficult to man-
age: at current rates of growth, the number of
inhabitants in Nigeria’s Lagos will double by
2020, mainly through expansion of informal
settlements. By contrast, most Mature cities
(as well as many Transitional ones) will need
to address a different kind of demographic
challenge in the form of population ageing.
Today’s megacities are not only bigger
than the cities of the mid-20th century, theyare also more complex. For one, they are
increasingly competing with, and de
on, relationships with other cities in
al economy. At the same time, we are
ing the emergence of new city re
sprawling conurbations that ext
beyond the boundaries of a single cit
ples include the “BosWash stretch” (e
from Boston, MA to Washingon, DC) i
and Chongqing in China.
These huge megacity regions crea
urban dynamic. Commuters travel l
tances from densely populated subu
nomic activity frequently becomes d
trated, dissipating from the cente
periphery. Often fragmented system
ropolitan governance have not ca
with this trend, with the result that
cult to deliver an efficient, holistic ato infrastructure challenges at a
regional level.
* According to UN definition of megacity
Karachi

8/3/2019 MegaCity Report 1439020
http://slidepdf.com/reader/full/megacity-report-1439020 8/34
Megacity challenges: an overview
14 Megacity Challenges Megacity Challe
0
0
World’s most polluted Cities
Delhi(India)
Cairo(Egypt)
Calcutta(India)
Mexico City(Mexico)
Tokyo(Japan)
London(UK)
New York(US)
S o u r c e : T h e W o r l d B a n k
5 10
50
15
100
20 25 30
150
35 40
200
Population in 2005 (millions)
Particle matter in 2002 (micrograms per cubic metre)
1st
2nd
3rd
41st
57th
91st
96th
Pollution levels
Population levels
Megacities are the gateways of globaliza-
tion, driving the flow of people, goods,
knowledge, and money around the world.
Already, one-fifth of the world’s GDP is gener-
ated in the ten economically most important
cities. Megacities also make a disproportion-ately large contribution to economic growth at
a national level. According to a Munich Re
study, Tokyo accounts for 28% of the Japanese
population, but 40% of the country’s GDP.
Paris is home to 16% of the French population,
but is responsible for 30% of its GDP. In the
developing world, Lagos is home to 8% of
Nigeria’s population but contributes 30% of
the country’s output. In OECD countries, most
metropolitan regions have a higher GDP per
capita than their national average, higher
labor productivity levels, and many of them
tend to have faster growth rates than their
countries.
Given their weight in their respective natio-nal economies, the ability of these megacities
to compete at a global level is paramount. To
attract investment, these cities need modern,
efficient infrastructures. Transportation is an
obvious case in point, and megacity mayors
are eager to improve often overloaded road
and rail networks, ports and airports. Abundant
(and preferably skilled) labor together with
modern IT and communications technologies
are also hugely important, as evidenced by the
offshoring trend that has itself fuelled the
growth of cities like Bangalore in India. Anoth-
er crucial (although sometimes less obvious)
factor is the quality of basic services: people
with access to quality housing, education andgood basic services such as water and electric-
ity are much more likely to fulfill their potential
and contribute to economic growth. The wider
business environment is also a key factor:
research from the Economist Intelligence Unit
indicates that clear, business-friendly policies
and regulations is a more important factor in
attracting international investment than in-
centives such as subsidies and tax breaks*.
Competitiveness
Environment
Governance
Quality of life Environment
Competitiveness It would be wrong to assume that megacity
growth is automatically bad for the environ-
ment. It is obvious that a city with 20 million
people will have a large environmental
impact, but it is less clear whether that impact
is bigger than if the same number of people
lived rurally. Certainly there are those who
argue that clean, modern cities, where dense
living enables resources to be consumed effi-
ciently, provide an environmentally sustain-
able model for the future.
Whatever their potential, however, many
of today’s megacities feature a catalogue of
environmental problems. Congestion, air and
water pollution, waste management and
degradation of green areas are familiar issues
in most large cities around the world, and are
particularly extreme in the megacities of the
developing world. In London and Tokyo, for
example, air quality has improved
last 50 years. In Shanghai and Kuala
it has gone down.
Historically, cities tend to get r
then clean up later. Unfortunat
approach could be disastrous in the c
climate change: this is one reason
growing focus on sustainable urban
ment. Sustainable solutions promote
use of alternative energy sources a
energy-efficient buildings and t
measures to combat congestion
emissions, water and waste recycling
use of vegetation to filter pollution
ture carbon dioxide. While several ci
started implementing at least some
measures to good effect, there will b
for more concerted efforts if the env
tal cost of urbanization is to be reduc
* World Investment Prospects Survey, 2004
Strikinga balance
In megacities, the complexity of building
and maintaining infrastructures, and of
meeting the needs of a huge and often grow-
ing urban population, reaches new levels. As
they seek to address that challenge, those
involved in the delivery of services and solu-
tions must balance three overriding concerns.
São Paulo
M i h ll i

8/3/2019 MegaCity Report 1439020
http://slidepdf.com/reader/full/megacity-report-1439020 9/34
Megacity challenges: an overview
16 Megacity Challenges Megacity Chall
As i s clear from the research, each megaci-
ty has its own unique issues that require
specific, local solutions. Nevertheless, cities
at similar stages of economic and social devel-
opment face a number of common chal-
lenges. With this in mind, we have identified
three basic “archetypes”: Emerging cities,
Transitional cities and Mature cities, depend-
ing on their stage of economic and social
development.
Emerging Cities: Emerging megacities tend
to be characterized by high growth rates dri-
ven by migration and natural growth, much of
which occurs in informal settlements not
served by the installed base of infrastructureand services. Annual growth rates are on the
order of between 3% and 6%. A 3.5% growth
rate implies a doubling of population in 20
years. Emerging cities are typically in coun-
tries with urban populations of less than 50%.
Populations tend to be younger and more
male, with a high proportion of poorly edu-
cated rural migrants. Social polarity, and the
gaps in wealth, health, education, and politi-
cal power between groups is generally high-
est in Emerging cities.
Transitional Cities: Transitional megacities
have often developed mechanisms to more
effectively manage dynamic growth, and may
be seeing a slowing of annual growth rates.
Continued population growth stems largely
from migration, with lower natural population
increases; several of these cities are seeing the
first signs of an ageing population. Growthrates are typically of the order of 2%-3% per
annum and Transitional cities are often in
countries that are more than 50% urbanized.
Transitional cities have similar infrastructure
challenges as compared with Emerging cities
but are better able to respond financially and
organizationally. Increasing affluence
cities places additional new demands
structure as growth in demand for tra
tion, water, energy, and services ofte
outpaces population growth.
Mature Cities: Mature megacities ha
slower growth rates than both Emer
Transitional megacities, at around 1%
age. In some of these cities, the popul
stagnated or is shrinking. Mature m
also have older population profiles. T
in countries that are typically arou
urban. Mature megacities have built
basic infrastructure to serve their po
one or two generations ago. With hig
infrastructure in place the challenge
ed to coping with the need for renewing systems or to dealing with obso
where the installed infrastructure n
meets regulatory requirements or c
service expectations. The other, growi
of Mature megacities is responding
increased and changing demands for
of all types posed by their ageing pop
Three City ArchetypesMegacities may be engines of economic
growth, but they feature huge inequali-
ties in the distribution of wealth and econom-
ic opportunity. In its recent report on urban-
ization trends, UN-HABITAT describes cities as
“the new locus of poverty”. World Bank esti-
mates predict that while rural areas are cur-
rently home to a majority of the world’s poor,
by 2035 cities will become the predominant
locations of poverty.
The consequences of a failure to improve
quality of life for the urban poor are huge. The
UN-HABITAT research indicates that people
living in slums, where a large proportion of
the urban poor reside, are more likely to be
affected by child mortality and acute respira-
tory illnesses and water-borne diseases than
their non-slum counterparts. They are also
more likely to live near hazardous locations,making them more vulnerable to natural dis-
asters such as floods. Inadequate access to
basic services saddles them “with heavy
health and social burdens, which ultimately
affect their productivity”.* Poverty may be
less extreme in the more developed cities, but
social problems still abound. The OECD’s
report on competitive cities notes increased
socio-economic inequalities even in some of
its most dynamic metropolitan regions. It
points to large and persistent pockets of
unemployment: about one-third of the 78
metropolitan regions covered in the OECD
report have above average national unem-
ployment rates, and between 7-25% of popu-
lations live in deprived neighborhoods that
often have reduced access to public infra-
structure and services. The report concludes
that poverty and social exclusion lead to sig-
nificant costs including high levels of crimi-
nality (on average 30% higher in urban areas
than the national level). Failure to addressthese inequalities risks making megacities
centers of deprivation and instability with a
consequent negative effect on their economy.
Development decisions are often seen in
terms of difficult trade-offs between growth
and greenness, or growth and quality of life.
But there are obvious interdependencies
between the three concerns. Competitive
cities are more likely to have the wealth and
resources to invest in high-quality infrastruc-
ture and services, and to create economic and
social opportunities for large numbers of the
urban population. All things being equal,
environmentally clean, modern cities create
more attractive locations for a broad spec-
trum of business activities than those withheavy pollution. Equally, cities with a healthy,
well-educated urban population are better
positioned to attract investment than those
where deprivation and inequality blocks large
swathes of the population from participating
in economic growth. This suggests that, in the
long run, focusing on one of these concerns
to the detriment of the others will be a recipe
for failure.
Quality of Life
■over 40%
■ 20 – 40%
■ 10 – 20%
■under 10%
■High-income
countries
S o u r c e : U N M i l l e n n i u m
P r o j e c t 2 0 0 5 ( U N - H a b
i t a t 2 0 0 3 )
Proportion of urban populationliving in slums
* State of the World’s Cities 2006/7, UN-HABITAT
São Paulo
Stakeholder priorities The big picture

8/3/2019 MegaCity Report 1439020
http://slidepdf.com/reader/full/megacity-report-1439020 10/34
Huge cities create huge challen
the money and resources to
them are distinctly finite. How will
stakeholders responsible for deliver
tions respond? Having summarized
characteristics and issues faced by
megacities, we now turn to the priorkey factors that drive decision makin
25 cities covered by this report.
The entire sample of 522 stakehol
asked the survey questions referred
section. It is immediately clear that th
respondents are balancing a wide
economic, social and environmen
cerns. Nevertheless some clear
emerge.
Stakeholder priorities: The big picture
18 Megacity Challenges Megacity Challe
StakeholderPriorities
03Key findings■ Unemployment is the top economic
challenge
■ Air pollution and congestion are theprinciple environmental concerns
■ Stakeholders see transportation as the
main infrastructure issue and the top
priority for investment
■ Most stakeholders are optimistic that they
can solve city challenges, although
influencers in the survey are more skeptical
Moscow
Stakeholder priorities: The big picture

8/3/2019 MegaCity Report 1439020
http://slidepdf.com/reader/full/megacity-report-1439020 11/34
infrastructure challenge by just 6% o
dents overall and 8% in Emerging citi
despite the fact that several cities co
the study face severe problems wi
scarcity/quality. Even lower proportio
tion electricity (2%) and healthcare
the main infrastructure challenge fac
city.
Investment needs: Stakeholders we
to rank 13 different areas according
need for investment over the next fi
years. Once again transportation co
as the top priority by a significant
cited by 86% of respondents. In join
place comes environmental protec
Stakeholder priorities: The big picture
20 Megacity Challenges Megacity Challe
the problem to transportation and vehicle
emissions. General pollution and water prob-
lems are also cited, but are considered to be
less of a priority.
Social issues: Stakeholder respondents men-
tion a wide range of social concerns, with no
clear priority emerging. Topping the list by a
small margin is poor quality housing and living
conditions, cited by 14% of all respondents.
This issue is particularly emphasized by stake-
holders in Transitional and Emerging cities.
Other key issues included the gap between
rich and poor (11%) and poverty (9%). Public
safety and crime also feature as a significant
issue for respondents in Emerging cities.
Infrastructure: Transportation is perceived
as by far the biggest infrastructure challenge
by stakeholders in the survey. Responding to
an open-ended question in the survey, 35% of
all stakeholders mention the transport system
or traffic problems as their city’s most signifi-
cant infrastructure challenge. In distant sec-
ond place is the inadequacy of the city’s infra-
structure (10%). Surprisingly, only 6% cite
finance issues as a big infrastructure chal-
lenge.
Other infrastructure areas appear to be
much lower on the agenda for stakeholders as
a whole. Even when added together, lack of
water and water sanitation is cited as a critical
Most serious economicchallenge
20%
14%
14%
8%
7% % of respondentsmentioning
Unemployment
Cost of living
Economic development
Inadequate infrastructure
Financing
Most serious environmentalchallenge
26%
15%
14%
13%
9% % of respondentsmentioning
Air pollution
Transportation
General pollution
Water pollution
Solid waste
Most serious social challenge
14%
11%
9%
7%
% of respondentsmentioning
7%
7%
7%
Poor living conditions
Gap between rich and poor
Poverty
Education
Population growth
Public safety
Unemployment
Most serious challenge facing city’infrastructure
Transportation
Emerging Transitional Mature
% of respondents mentioning
Inadequate /inefficientInfrastructure
Planning
Lack of funding
Environment/pollution
17
9
9
3
9
43
14
8
11
4
10
9
4
2
Economy: Unemployment and underemploy-
ment emerge as the predominant economic
challenge in the survey (cited by 20% of
respondents overall). It is the top economic
challenge according to respondents in Emerg-
ing and Transitional cities, and comes second
only to economic development as a concern
in Mature cities. The next most commonly
cited issues are economic development and
the rising cost of living (both 14%).
Environment: Air pollution is considered by
far the most serious environmental challenge
facing megacities (26%), especially by those
in Mature cities (36%). A large proportion of
stakeholders mentioning air pollution relate
London
Stakeholder priorities: The big picture

8/3/2019 MegaCity Report 1439020
http://slidepdf.com/reader/full/megacity-report-1439020 12/34
Infrastructure area most importantin attracting economic investment
27%
9%
6%
% of respondentsselecting
6%
6%
6%
6%
Transportation
Safety and security
Education
Communications
Energy supply
Leisure and culture
City management
5%Environment
4%Health care
3%Water
City’s probability of successfullymanaging short-term future
71%
66%
57%
55%
50%
42%
North America
Africa/ Middle East
India/China
Europe
Latin America
Other Asia
education, both cited by 77% of stakeholders.
The need to invest in environmental protec-
tion is emphasized particularly highly in Tran-
sitional cities, indicating that the desire for
ecologically sustainable solutions is not
restricted to the rich cities.
Water comes lower down the list of invest-
ment priorities overall, but is cited by many
more stakeholders in Emerging cities (81%)
where access to clean water and sanitation is
often a major issue.
Competitive drivers: When asked, again
with an open-ended question, which single
area of their city’s infrastructure is the most
important in attracting investment versus
Not surprisingly, respondents in the
Mature cities were more likely to rate their
cities as better than average, while respon-
dents in Emerging cities were more likely to
rate their cities the worst among the three
archetypes; but even here, almost one-half
consider their cities to be average in terms of
quality of life.
When respondents were asked to rate their
city’s probability of successfully managing its
future over the next five years, overall, two-
thirds responded positively (67%), with only
slightly better odds expressed by respondents
in Mature cities.
It is notable, however, that elected officials
and public-sector employees are most likely to
have an optimistic outlook, while in
in the survey tend to be more skept
findings suggest that cities will att
juggle economic, social and envir
concerns, but when push comes to sh
overriding issue in decision-making
nomic competitiveness.
This perspective filters down to th
zation of investment into transp
which is seen as central to a citiy’s
generate wealth and attract investme
High awareness of the need to
environmental protection, however,
that cities will seek to balance grow
sustainable solutions wherever this
and affordable.
Stakeholder priorities: The big picture
22 Megacity Challenges Megacity Challe
Need for investment over the next fiveto ten years by infrastructure area
86%
100%
77%
77%
74%
71%
71%
Transportation
Environmental protection
Education
Health care system
Public safety and security
Waste management
70%Water
69%Public housing and
civic buildings
67%Energy supply
66%Social services
other cities around the world, transportation
is by far the most mentioned, followed dis-
tantly by safety and security. Far lower num-
bers of respondents cite education and
healthcare as key factors in attracting invest-
ment. Communications and energy are seen
as more important issues for attracting invest-
ment by respondents in Emerging cities.
Stakeholder outlook: Although stakehold-
ers are acutely aware of the economic, social
and environmental challenges faced by their
cities, the majority have an upbeat outlook.
For example, almost one-half of respondents
(44%) rate their city’s quality of life as better
than average.
Net rating — High minus Low
% saying high need for investment
Beijing
Five infrastructures

8/3/2019 MegaCity Report 1439020
http://slidepdf.com/reader/full/megacity-report-1439020 13/34
All cities need high-quality infrastructureto facilitate the movement of people and
goods, and the delivery of basic services to
their populations. But the challenge of deliv-
ering these infrastructures and services in
today’s megacity regions is immense. This is
true for Mature cities where, for example,
roads, rail networks, sewers and hospitals
were often built decades or even centuries
ago and in some cases are now becoming
24 Megacity Challenges Megacity Challe
Five Infrastructures
04increasingly unfit for purpose. It is also true ofthe Transitional cities, which are struggling to
cope with demographic change, and Emerg-
ing cities where even basic services are badly
lacking, particularly in the rapidly expanding
informal settlements. Moreover, in all three
city archetypes there are complex issues to be
resolved over the funding, management,
maintenance and efficient running of ser-
vices, as well as the need to find infrastruc-
ture solutions that are environmentainable.
The following section of the rep
with five major infrastructure area
portation, electricity, water and was
healthcare, and safety and security.
infrastructure sector, survey questio
answered primarily by those stak
with the most relevant knowledge a
ence, unless otherwise noted in the t
Shanghai
Transportation

8/3/2019 MegaCity Report 1439020
http://slidepdf.com/reader/full/megacity-report-1439020 14/34
Transport preoccupies the stakeholderslike no other infrastructure issue. As
noted above, the general survey marks trans-port out as the single biggest infrastructurechallenge faced by their cities, and by a largemargin*. That focus is particularly high in
Mature cities (45%) and Transitional cities(43%) and in Europe (52%), where car owner-ship in the EU has risen ten times more quicklythan the population over the past ten years. InEmerging cities, the emphasis on transport isless pronounced, but at 17% is still far aheadof the other infrastructure mentioned such aswater (8%) and electricity (5%). Transport isalso the priority for spending, with 86% ofstakeholders overall citing this as an impor-
26 Megacity Challenges Megacity Challe
Transportation
05tant area for investment. Transportation is topof the pile for a number of reasons. Whereassome infrastructure problems, such as lack ofwater, primarily affect the poorer areas of thecity, congestion, crowded trains and traffic-linked pollution are very visible at all levels of
society. But there is also a clear and direct linkwith city competitiveness. If megacities arethe engines of the global economy, it is thetransport network that keeps those enginesworking efficiently. When roads and railwaysseize up, or when ports and airports becomeoverloaded, the cost to the economy is high.In the UK, where many cities including Lon-don are struggling to keep up with traveldemand, the Confederation of British Industry
(CBI) estimates that the cost of cong£20 billion (US$38 billion) a year*holders in the overall survey are acuteof the importance of transport netdriving the economy: 27% mention tas the one area of the city’s infr astruc
is most critical in attracting investmahead of the second most cited issuand security, 9%).
Coping with growth: As well asacross all levels of civic society, problems affect cities at all levels of ment, although they manifest themdifferent ways across our three arcFor Mature cities, the primary proble
* Transport questions in the survey encompass mass transit, individual motorized transit, air and surface transport, and people as well as freight transit** “Running out of Road”, The Economist, 2 December 2006
Key findings■ Transportation is seen as the single biggest infrastruc-
ture challenge by a large margin, and is a key factor in
city competitiveness
■ With air pollution and congestion emerging as the
two top environmental challenges, stakeholders predict
a strong emphasis on mass transit solutions
■ Cities are more likely to focus on incremental improve-
ments to existing infrastructure, rather than new systems
■ Demand management is rarely mentioned as a major
strategy for addressing the cities’ transport problems
Transportation
8/3/2019 MegaCity Report 1439020
http://slidepdf.com/reader/full/megacity-report-1439020 15/34
monorail, despite the fact that the idea forone was floated as far back as 1952. Mean-while the number of public transport vehiclesis insufficient for the population of the city,forcing commuters to travel on the rooftopsof buses with all the inherent safety issuesthat this implies.
Istanbul, a Transitional city according toour methodology, faces both problems. Thecity’s geography poses its own problems, withmany of its residents commuting daily acrossthe Bosphorus from one part of the city to theother. With its many hills and narrow streets,Istanbul has a major problem with traffic con-gestion, particularly at peak travel times.
There is also a serious lack of public transportcapacity on the Asian side of the city. Istanbulis having to make major investments toaddress these problems. A 22km light metroline is currently under construction, and fur-ther lines are planned. In total, Istanbul plansto invest a further US$4.9 billion in tram and
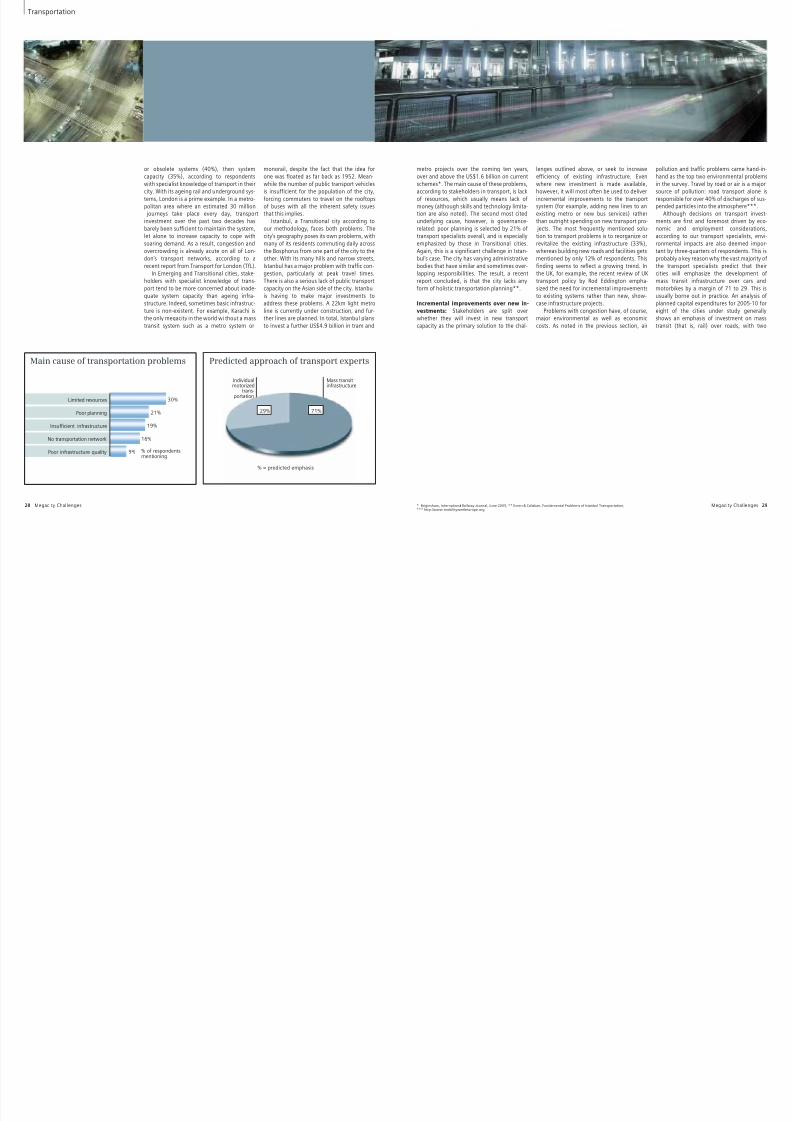
metro projects over the coming ten years,over and above the US$1.6 billion on currentschemes*. The main cause of these problems,according to stakeholders in transport, is lackof resources, which usually means lack ofmoney (although skills and technology limita-tion are also noted). The second most citedunderlying cause, however, is governance-related: poor planning is selected by 21% oftransport specialists overall, and is especiallyemphasized by those in Transitional cities.Again, this is a significant challenge in Istan-bul’s case. The city has varying administrativebodies that have similar and sometimes over-lapping responsibilities. The result, a recent
report concluded, is that the city lacks anyform of holistic transportation planning**.
Incremental improvements over new in-
vestments: Stakeholders are split overwhether they will invest in new transportcapacity as the primary solution to the chal-
lenges outlined above, or seek to increaseefficiency of existing infrastructure. Evenwhere new investment is made available,however, it will most often be used to deliverincremental improvements to the transportsystem (for example, adding new lines to anexisting metro or new bus services) ratherthan outright spending on new transport pro- jects. The most frequently mentioned solu-tion to transport problems is to reorganize orrevitalize the existing infrastructure (33%),whereas building new roads and facilities getsmentioned by only 12% of respondents. Thisfinding seems to reflect a growing trend. Inthe UK, for example, the recent review of UK
transport policy by Rod Eddington empha-sized the need for incremental improvementsto existing systems rather than new, show-case infrastructure projects.
Problems with congestion have, of course,major environmental as well as economiccosts. As noted in the previous section, air
28 Megacity Challenges Megacity Challe
or obsolete systems (40%), then systemcapacity (35%), according to respondentswith specialist knowledge of transport in theircity. With its ageing rail and underground sys-tems, London is a prime example. In a metro-politan area where an estimated 30 million journeys take place every day, transportinvestment over the past two decades hasbarely been sufficient to maintain the system,let alone to increase capacity to cope withsoaring demand. As a result, congestion andovercrowding is already acute on all of Lon-don’s transport networks, according to arecent report from Transport for London (TfL).
In Emerging and Transitional cities, stake-
holders with specialist knowledge of trans-port tend to be more concerned about inade-quate system capacity than ageing infra-structure. Indeed, sometimes basic infrastruc-ture is non-existent. For example, Karachi isthe only megacity in the world wi thout a masstransit system such as a metro system or
pollution and traffic problems came hand as the top two environmental in the survey. Travel by road or air issource of pollution: road transport responsible for over 40% of dischargepended particles into the atmosphere
Although decisions on transporments are first and foremost drivennomic and employment considaccording to our transport specialisronmental impacts are also deemetant by three-quarters of respondentprobably a key reason why the vast mthe transport specialists predict thcities will emphasize the develop
mass transit infrastructure over cmotorbikes by a margin of 71 to 29usually borne out in practice. An anplanned capital expenditures for 200eight of the cities under study gshows an emphasis of investment transit (that is, rail) over roads, w
Main cause of transportation problems
30%
21%
19%
16%
9% % of respondentsmentioning
Limited resources
Poor planning
Insufficient infrastructure
No transportation network
Poor infrastructure quality
Predicted approach of transport experts
Mass transitinfrastructure
Individualmotorized
trans-portation
71%29%
* Briginshaw, International Railway Journal, June 2005, ** Evren & Caliskan, Fundamental Problems of Istanbul Transportation,*** http://www.mobilityweek-europe.org
% = predicted emphasis
Transportation

8/3/2019 MegaCity Report 1439020
http://slidepdf.com/reader/full/megacity-report-1439020 16/34
30 Megacity Challenges Megacity Challe
notable exceptions. Moscow has a world-classmass transit system, with high rail investmentlevels that are comparable with London, butcurrent planned expenditure shows an em-phasis on road over rail that is driven by a risein vehicle ownership. Lagos shows high-lev-els of investment in roads because urban railis virtually nonexistent and the city thereforerelies heavily on buses.
Mass transit may be favored, but there isno doubt that the pace of demand growth inmany of these cities makes delivering sustain-able solutions a huge challenge. Shanghaialone is expected to see a quadrupling of carsand trucks by 2020. The very dense urban
area and lack of parking and road space forvehicles has pushed growth outside the city,thus setting in motion a spatial developmentpattern that will be increasingly difficult toserve by more sustainable modes of trans-
port. In Shanghai and other Transitional citieswhere car ownership is set to soar, there areno easy answers to the issues posed by con-gestion.
Putting demand management on the map:
In recent years demand management solu-tions have been posited as a way to promotemore sustainable modes of transport overcars, but — somewhat surprisingly — thisemerges as a low priority in this part of thesurvey. Only 9% of stakeholders involved intransport mention demand managementsolutions as the best approach to resolvingtransportation issues.
This is despite a variety of schemes in glo b-al cities that indicate a role for demand man-agement in reducing congestion. Such solu-tions generally divide into two categories:“pull” measures that focus on providing
motorists with alternatives to using their cars,primarily by increasing the attractiveness ofpublic transport; and “push” measures thatincrease the cost or difficulty of using a car toreach a specific area. Various cities haveexperimented with demand management inthe form of road pricing or congestion charg-ing, including London, Stockholm and Oslo.Singapore introduced the world’s first signifi-cant road pricing initiative to control entryinto its central business district in 1975. Thecity today has electronic road pricing based ona system that uses on-board tags to identifyvehicles.
Road pricing in Singapore runs in parallel
with a more radical “push” solution: a massivetax of over 100% on new car purchases.Where it has been implemented, there is evi-dence that demand management in the formof road pricing has delivered significant bene-
fits. In London and Stockholm, congestion hasbeen reduced by approximately 30%. Bothcities have experienced a reduction ofbetween 10-20% in fuel emissions and roadaccidents*. The economic impact has beenmore difficult to assess — TfL, for example,found no evidence of either a positive or neg-ative impact of congestion charging on aggre-gate business performance in central Lon-don**. But the London transport authoritysays that congestion charging brought in netrevenue of €174m in 2005-06. TfL now plansto extend the scheme in 2007, a move thatwill roughly double the charging area.
Projects like London’s are high profile, but
only a handful of cities currently have suchschemes in place. There are only a couple ofcurrent examples in the US, such as the SR 91Toll Lanes in Orange County, California. Inmany cities, the cost of car use in cities is actu-ally falling. In Shanghai, car ownership washistorically suppressed through high fees andlimited permits. In recent years, however, thishas been reduced (partly as a result of thepresence of vehicle manufacturing), andincomes are rising. In Mumbai, despite thecongestion and pollution caused by privatemotorized transport, road taxes and parkingfees remain low (demand management isnow being discussed). One would have toconclude that, globally, demand manage-ment as a solution to congestion remains anemerging concept that has yet to become a
priority in many of the cities under study.
The public and private sectors: For trans-port and other infrastructure sectors, the sur-vey also explored survey respondents’ viewson the involvement of the private sector indelivering solutions. Here, transportation isprimarily seen as a public rather than a privatetask by respondents to the survey (59% versus41%). Mature cities in particular are inclined
to predict an emphasis on public owrather than private (72% versus 28%sis of eight of the cities in the study the view that transportation in remains firmly within the realm oresponsibility, with high-levels of owand control through regulation and low levels of private-sector participoperations, with occasional exceptio
However, when asked to predict their cities would emphasize public ooperation of transportation infrastruthe future, there was more of an eq(53% public versus 47% private). Cwith current levels of private oper
transport, which is low on a global bmay indicate growing openness tosector management of services. Cthe rail sector is almost entirely pubtrolled and operated, with the notabtion being London where private oexist in a climate of regulatory congovernment involvement in infraprovision.
Globally, the road sector is largewith occasional examples of toll facilipricing. Airports retain a surprising dpublic control despite trends to privand increasing evidence of privaoperations. Ports are almost entirelycontrolled and typically take the formcontrolled companies that operate inprivate fashion. Overall, private-secto
pation in operations remains rare exfew cities.For those that predict a greater ro
vate-sector operation, surprisingly tadvantages of this approach are not faccording to the survey, but rather iefficiency and better management. Pdisadvantages of private operationmarily higher user costs, inability demand, and a profit-seeking menta
The best solution to transportationproblems
33%
17%
12%
12%
% of respondentsmentioning
11%
10%
9%
Reorganize/revitalizeexisting infrastructure
Allow private investment /increase investment
Build new roadsand facilities
Better management/governance
New equipment
Better use of mass transit systemsinstead of personal cars
Manage demand
*Sources: TfL, City of Stockholm, **TfL fourth monitoring report, June 2006
Electricity

8/3/2019 MegaCity Report 1439020
http://slidepdf.com/reader/full/megacity-report-1439020 17/34
Any di scussion of electricity infrastructurehas to take place against the backdrop of
rapidly escalating world demand. Simply put,expanding cities need additional electricity tolive and economies need it to grow. Between1972 and 2002, world GDP increased at 3.3%
per annum while electricity consumptionmore than kept pace at 3.6%. Even withexpected efficiency gains, the InternationalEnergy Agency predicts that between 2002and 2030 worldwide electricity demand willdouble. Most of this increase will come in thedeveloping world, especially the rapidly grow-ing economies of India and China. The IEA fur-ther foresees that OECD countries will need tomake nearly US$4 trillion in investment on
32 Megacity Challenges Megacity Challe
Electricity
06generation, transmission and distributionduring those years, while developing coun-tries will require some US$5.2 trillion*.
Only 2% of those questioned describedelectricity supply as their most serious infra-structure challenge. Moreover, the impor-
tance of investment in this area ranks belowfields such as transportation, water, educa-tion, public housing and security. Not surpris-ingly, Emerging cities see the issue as muchmore important.
Demand outstrips supply: The three cityarchetypes face different difficulties, but theyall revolve around the fact that demandgrowth is outstripping supply. According to
electricity stakeholders in TransitioMature cities, old or obsolete infrastrthe main problem. Then comes efficilowed close behind by lack of capaexample of the tight constraints westructure can place on the power syst
in the richest places comes from NThere, 80% of power must by law beed in the city because the transmissto bring electricity from outside simpcope with the higher load. Companieing to build small generating plants bis little land available on which to do out a solution, maximum capacity wmaximum demand by 2008**.
In Emerging cities, on the other h
* International Energy Agency, World Energy Report 2004** New York City Energy Policy Task Force, New York City Energy Policy: An Electricity Resource Roadmap, January 2004
Key findings■ Cities at all levels of development face a
challenge in keeping up with rapidly rising
demand for electricity
■ The impact on the environment is a major con-
sideration in decision making on energy issues
■ Stakeholders will emphasize renewable energy
sources in the future as much as fossil fuels
■ More stakeholders predict a leading role for
the private sector in electricity than in any
other infrastructure sector in the survey
Electricity

8/3/2019 MegaCity Report 1439020
http://slidepdf.com/reader/full/megacity-report-1439020 18/34
infrastructure is the biggest difficulty. Thiscan describe both average and peak load.Mumbai, for example, has seen hard to meetdemand growth of 12.4% over the last fouryears*. Meanwhile the power system in itsstate, Maharashtra, suffered its highestdemand peak in January 2006 which exceed-ed supply by 4,500 MW** more than one-third over the average requirement for all ofMumbai. As the next most important prob-lem, Emerging city stakeholders point to latemaintenance and lack of planning. Those inTransitional cities blame lack of investment.Lagos is an excellent example of how all theseproblems work together. There, because of lit-
tle investment since 1990, the 6,000 MW
maximum generation capacity cannot meetthe 8,500 MW that the city requires on aver-age before even considering represseddemand of 5,000 MW. Worse still, poor main-tenance means actual output averages 3,000MW. All this before 45% of power is lost in thepoorly maintained and frequently vandalizedtransmission system*.
The problems of Mature cities seems aworld away: the chief culprit is monopoly reg-ulation — such as a ten-year price freeze onChicago’s domestic electricity prices thatsometimes leaves the private utility thereforced to pay more on the open market forelectricity than it can charge. Such a structure
allowed unscrupulous power producers to
create the great California energy crisis of2000-01. Like their colleagues in Transitionalcities, for Mature cities stakeholders under-investment is the second most frequentlycited concern.
Pricing power: Electricity stakeholders ex-pect to address the energy needs of theircities mainly by putting money into powergeneration. When asked the single thing thatthey could do to solve problems in this area,the most frequent response was to improveon existing infrastructure or build new (citedby 29%) followed by general investment inthe system (23%).
The regulation of energy use — a heavy-
34 Megacity Challenges Megacity Chall
lack of sufficient generating capacity is by farthe most pressing concern, according to thesurvey. Old infrastructure and inefficientoperations are lesser problems because thereis relatively little of it anyway. This is a particu-lar issue in India and China where half thestakeholders cited difficulties arising fromlack of capacity. Shanghai, for example, hasfrequent brown-outs in summer. Businesseshave had to shut down completely or shiftproduction to night time when more electrici-ty is available.
Stakeholders in each type of city also ana-lyze the underlying causes of their problemsdifferently. For Emerging, and even more for
Transitional cities, unexpected load on the
handed version of demand managecame fourth (11%), but had no tMature cities where it would doubtlesdraconian. Mumbai does not have thThe local utility has resorted to “loding” — stopping provision to certaand restricting the use of neon sig ns cable TV transmission — to help mservice that already experiences powone to two hours per day in urban amore in rural ones**.
This does not mean efforts tdemand will have no role. When asmuch their cities would emphasizeation of new capacity compared with
management, responses were sp
The most serious problem of electricityinfrastructure
30%
27%
20% % of respondentsselecting
Lack of systemcapacity
Obsoleteinfrastructure
Inefficient operations
Combination ofproblems
20%
83%
100%
81%
81%
79%
76%
75%
Energy sources
Environmental impacts
Up-front capital cost
User affordability
Regulations
Appropriateness
73%Life cycle costs
73%Impacts on economy and
employment
Factors influencing the city’s decisionmaking on electricity supply
The best solution to electricity problems
29%
23%
13%
11%
9% % of respondentsmentioning
Improve on existing infrastructure
Additional investment
Promote alternative energysources
Regulate energy use
Improve governance andadministration
* BEST data filed with regulator: MERC/22-26, 38, 39-45, 61 of 2003/1326 dt. June 7/22, 2006,**The Financial Express, 16 January 2006
*Nigerian Electric Power Supply Nigerian Electric Power Supply Industry, http://www.bpeng.org/CGI-BIN/news/reform%20 electricity.pdf,“You're going to feel a jolt, Chicago Tribune, 19 June 2006, ** Prayas submission on CII proposal for Pune Load Shedding, Dec 5, 2005,
% saying important impact
Electricity

8/3/2019 MegaCity Report 1439020
http://slidepdf.com/reader/full/megacity-report-1439020 19/34
36 Megacity Challenges Megacity Chall
evenly (53% versus 47%). If this played out inpractice, and nearly half of cities placed asmuch emphasis on demand management ason new capacity, this would be a significanttrend.
The potential value of demand manage-ment initiatives is certainly great. Studies inIndia indicate that they could eliminate 20%to 30% of demand growth*. To reach theeffectiveness foreseen this sort of demandmanagement will require a dramatic rampingup. Probably the most effective way to affectdemand quickly will be market pricing of elec-tricity. Electricity specialists expect theemphasis to be on selling power in their cities
at market prices rather than be subsidized(57% versus 43%). Denmark took this onestep further by heavily taxing use of fossil
fuels. The biggest outliers in the survey areIndia and China, where the combined equiva-lent figures are 36% at market prices and 64%subsidized.
Energy and the city environment: If ener-gy stakeholders aspire to modify demand,they also show a marked concern for environ-mental issues. On average, they thought thatover the next five to ten years their citieswould emphasize fossil fuels and renewabletechnologies to nearly the same degree (52%to 48%), an understandable result as thebroader survey lists air pollution as the singlelargest environmental problem cities face,
and global warming as the sixth (third amongMature city respondents). Only North Ameri-ca still seems wedded to fossil fuels (73% ver-
sus 27%). Environmental issues also figureprominently as key factors driving decisionmaking in the survey, along side financialconcerns.
The aspiration to move toward renewablesis clear, but there is a long way to go in prac-tice. London, for example, uses 39% gas, 35%coal, and 20% nuclear to power its genera-tors, but only 4% comes from renewablesources. Moscow uses Russia’s relativelycheap gas for 95% of its fuel mix; China andIndia both use readily available local coal sup-plies for 75% of theirs despite the detrimentaleffect on the already bad air pollution. Evenafter several decades of probably the most
active state measures in the world to promoteuse of renewables, by 2004 Denmark pro-duced only 25% of its power this way*. It is
therefore unlikely that renewables will pro-vide a major contribution to megacity powerneeds in the near future. Nuclear power — along proven technology — is another optionthat has been advanced as the best short-term solution to global warming by people asdiverse as British Prime Minister Tony Blair andthe environmentalist Professor James Love-lock**. Despite its low CO2 footprint, howev-er, nuclear power’s other drawbacks keep itfar less popular among all energy stakehold-ers than even traditional power sources (40%versus 60%).
The public and private sectors: If, as noted
above, those responding to the larger surveyput the importance of investment in electrici-ty behind many other infrastructure areas,one reason may be that cities are lookingmore to the private sector in this field than inothers discussed in this study. When askedabout the relative emphasis of reliance on pri-vate firms versus public bodies, electricitystakeholders expected to look 54% to the for-mer and 46% to the latter. Figures for privateor public operation of generation and distrib-ution facilities, as well as private or publicfinancing, were nearly identical.
The vast level of new generating capacityand money needed in the coming years isleading governments worldwide to considerhow best to use the private sector and com-petitive market forces. Those surveyed who
advocate private ownership or operation,indicate that greater efficiency is the majoradvantage, with access to funding mentionedless frequently. The disadvantages are primar-ily seen as higher user costs, which suggeststhat if privatization is to work there needs tobe strong competition to keep prices down.
A number of Mature cities, including Lon-don and New York, already have largely pri-vate, if highly regulated, power industries
serving their needs. Places as diShanghai, Mumbai, and São Paulo nificant private activity in a mixed sysfirst of these in particular has privatpation in power generation, whilePaulo nine separate companies compower distribution.
Meanwhile, Turkey, Russia, andhave reached different stages of resttheir state power sectors as a precprivatization of, and the introductionpetition in, various functions. In tcases, the need for investment andefficiency is driving the process.
Regional differences: Given theilevels of economic development, thent city archetypes have understandferent needs and responses in theelectricity supply.
The responses from continental Euparticularly interesting. This region combine a much more traditional vierole of the state in power generation vision with a far greater concern for mental issues. Contrary to overall electricity stakeholders in Europe slightly greater emphasis on subsidiing than the free market (53% versuand by far the greatest focus on puprivate ownership of any region (6238%). In making decisions about esupply issues, they put far more emp
environmental impact. This may beson why European stakeholders are group in the survey that expects to loto demand management than new (60% versus 40%).
These figures should serve as a that even though megacities worldwsimilar difficulties across diverse fieresponses will be profoundly affectedpolitical and cultural contexts.
Predicted approach of electricity experts
Renewabletechnologies
Fossil fuels
48%52%
* Demand-Side Management (DSM) in the Electricity Sector, Prayas Energy Group (Pune) for Climate Change & Energy Programme World WideFund for Nature, February 2005
* IEA, Energy Policies of IEA Countries – Denmark, 2006, **PM 'convinced' on nuclear future, 29 November 2005,'Only nuclear power can now halt global warming', The Independent, 24 May 2004
% = predicted emphasis
Water and waste water

8/3/2019 MegaCity Report 1439020
http://slidepdf.com/reader/full/megacity-report-1439020 20/34
One of the Tokyo-based respondents toldthis survey, “Recently there are often
rainfalls of more than 100mm. Rain water isstored in underground rivers to avoid flooding.Most people do not know. Real infrastructureshould be working in the background withoutbeing noticed.” For Mature cities, “working andunnoticed” is usually a good description of thewater infrastructure: the presence of gooddrinking water, sanitation, and drainage aresimply assumed. Any problems, such as therecent drought restrictions imposed in London,provoke annoyance. Catastrophic failures, suchas in the wake of hurricane Katrina, provokeoutrage. As in both these cases, the publicinsists that those responsible should have had
38 Megacity Challenges Megacity Challe
Waterand Waste Water
07proper infrastructure in place – the problem iscertainly not nature. For Transitional, andespecially for Emerging cities, the situation isprofoundly different. The UNDP estimates thatin 2004 some 1.1 billion people lived morethan 1km from the nearest safe water source.Worse still, 2.6 billion people, roughly 40% ofthe world’s population, had no access toimproved sanitation. These figures, UNDPsuspects, probably underestimate the scale ofthe problem. Official data for Jakarta andNairobi, for example, both indicate 90%coverage for clean water and sanitation. Thesefigures apparently leave out huge slum areas,in the former accounting for some 7.6 millionpeople without such facilities. The roughly 1
million residents of Nairobi’s notoriouslum rely on putting human waste bags and throwing it into the street*.
A growing challenge for the em
world: Our overall survey data refdifferent experience of respondents aarchetype cities. When survey respwere asked about the most seriostructure challenges facing their citierelated issues were split into separatries: water supply and wastewater ment. If added together, the combinastitutes the third most frequently ci(8%), a figure that nevertheless pubehind transport as a perceived c
* UNDP, Human Development Report, 2006
Key findings■ Water and sanitation is seen as an important issue
by specialists in this sector, but comes lower down the
list of priorities in the survey overall
■ Even in Emerging cities, the importance of water issues
for their economic development is not widely recognized
■ Solutions that focus on water reuse emerge as a
significant trend for the future
■ There is some movement towards private sector
management of publicly-owned water provision as a way
to improve efficiency
Water and waste water

8/3/2019 MegaCity Report 1439020
http://slidepdf.com/reader/full/megacity-report-1439020 21/34
serious drinking water problems in the 21 st
century*.Investment priorities also reflect a higher
focus on water issues in Emerging cities. Ove-rall, 70% of respondents believe that there is ahigh need for investment in water and wastewater infrastructure, placing it sixth out of 13infrastructure areas. In Emerging cities, how-ever, the figure was much greater (81%).
Hidden costs: The link between public healthand clean water and sanitation is clear: theUNDP estimates that a lack of these servicesresults in about half the developing worldsuffering from a health problem at any given
time, and accounts for 1.8 million annual childdeaths from diarrhea alone. Conversely, intro-duction of safe water supplies and sanitation inLondon and various American cities about a
century ago coincided with the largest drops ininfant mortality and increases in life expec-tancy those locations have ever seen. Cholera,of only historic interest there, is a frequentvisitor to Lagos where water treatment iseffectively nonexistent*. Nevertheless, health-care stakeholders make no mention of the roleof water infrastructure in improving healthcareoutcomes, which may reveal a lack of holisticthinking.
In the same way, when all survey res-pondents were asked about factors enhancingeconomic competitiveness, only 3% placedwater supply and sanitation first, even inEmerging cities where water is such a big issue.
Noticed or not, water and sanitation are inreality crucial for economic development. TheWHO estimates roughly that lack of access tothem costs developing countries US$170
billion per year, or 2.6% of their GDP**. Sub-Saharan Africa loses about 5% of GDP, or someUS$28.4 billion annually, a figure thatexceeded total aid flows and debt relief to theregion in 2003. Conversely, investment inwater can generate a high return. The UNDPestimates that every US$1 spent in the sectorcreates on average US$8 in costs averted andproductivity gained.
According to water stakeholders, theprimary difficulty this under-appreciated areafaces overall is older, obsolete infrastructure(cited by 47% of respondents). This figure iseven higher in Mature cities (59%), andespecially Europe (63%) and North America
(66%). These cities, having benefited from safewater for over one 100 years, face thedifficulties of maintaining or upgrading cen-tury-old facilities. London’s water company,
40 Megacity Challenges Megacity Challe
(35%). In Emerging cities, water issues comesecond (13%), but in Mature ones they appearwell down the list (3%). Similarly, overall waterpollution/water quality is listed as the fourthlargest environmental challenge (13%), butcomes second in Transitional cities (22%).
Shanghai is one Transitional city facinghuge challenges in this area. Its main watersource — the River Huangpu — is so con-taminated by industrial and agriculturalpollutants that it has been devoid of aquaticlife for over 20 years. The River Yangtze, thealternative water source, faces increasedsalination in its lower reaches resulting fromlower water levels brought about by the Three
Gorges Dam. Meanwhile, ground water isfacing increasing contamination from sea-water. Little wonder that the UN namedShanghai one of six major cities likely to face
even after substantial upgrading effloses one-third of water to leaky pipeswhich occurs in London’s Victsystem***. New York, meanwhile, walways had a clean water source so cleto require filtration, now may have US$8 billion to filter suspended particTransitional and Emerging cities aobsolete infrastructure: Moscow’s wtem rivals that of London and New Yoand urgently needs modernization.
A bigger role for water reuse: Devarying intensity of challenges to wastructure in the different city arc
stakeholders overall had a similar appsolving these problems. Asked whichwould have the biggest impact, tcommonly cited choice was renovatiovement of the infrastructure (42%), by the more general one of iinvestment (29%). Respondents didmuch value in raising the low political water — 5% suggested making it a pwhich is interesting in light of therecent call to do so in its 2006Development Report.
Any renovation and investment isto revolutionize how cities addresneeds. Water stakeholders expect emphasis in their cities in the next fivyears will be slightly more on iefficiency than new plants and facilitversus 48%). This is even more likely case in Mature cities (62% versus 38an approach makes sense in a city lwhere ongoing investment and expansion over a century and a half hsound basis for future water provisionrelatively low emphasis on new pEmerging cities (52% versus 48%) mfrom widespread denial about the exteproblem. Mumbai, for example, c
The most serious problem of watersupply and wastewater management
47%
14%
12%
20% % of respondentsselecting
Old or obsoleteinfrastructure
Lack of systemcapacity
Inefficient operations
Combination ofproblems
92%
100%
91%
90%
85%
81%
79%
Water quality
Environmental impacts
Up-front capital cost
Appropriateness
User affordability
Impacts on economy andemployment
Factors influencing the city’sdecision making on water supply andwaste water management
* ht t p: // ww w. ch s. ub c. ca /c hi na /s ha ng ha i. pd f, ht tp :/ /w ww .e hp on li n e. org/ do cs /1 99 4/ 10 2- 2/ fo cu s. ht ml * UN DP 20 0 6, ProM ED -mai l 6 Ja nu ary 20 0 6, ** W HO (W or l d H e al t h O rg an izat i on ), “E co no mi c a nd He al t h E f fe ct s o f I nc re as in g Coverag e o fLow Cost Water and Sanitation Interventions”; UNHDR Occasional Paper, http://hdr.undp.org/hdr2006/pdfs/background-docs/Thematic_Papers/WHO.pdf),***”Drought in London”, London Assembly Committee, July 2006, ****"New York’s Water Supply May Need Filtering”. New York Times, 20 July 2006.
% saying important impact
Water and waste water

8/3/2019 MegaCity Report 1439020
http://slidepdf.com/reader/full/megacity-report-1439020 22/34
42 Megacity Challenges Megacity Challe
water provision covers 95-100% of itspopulation: the UNDP suspects the number isclose to half of that*.
One surprising finding is the emphasis inthe future on water reuse rather than thetapping of new sources (55% versus 45%).Such an approach need not solely involvewater for industrial use. Beijing’s Bei XiaoheWastewater Treatment Plant currently providesdrinking water for 400,000 people and isundergoing an expansion — the largest suchproject in the world — to more than doublecapacity. It will provide drinking water at thecoming Olympic Games. Singapore, mean-while, hopes to get 20% of its water requi-
rements from a recycling plant: the PrimeMinister proudly serves its output at state din-ners.Market forces and conservation: Focusedon investment, water stakeholders see asmaller role for demand management: only
15% cited it as the best strategy to address theirproblems. Simple expedients in this area canhave a great impact. Shanghai’s recent require-ment that families replace 13-litre toilets with9-litre ones will save the city US$189 millionannually in water treatment costs**. Ratherthan focusing on education programs, how-ever, water stakeholders expect to managedemand and encourage conservation throughmarket forces. Overall, they foresee the em-phasis for water revenue to be more on userfees than on taxes (67% versus 33%). In Maturecities the former figure rises to 80%. The con-straint in Emerging and Transitional cities ismore likely to be the technological one of
installing metering equipment than anythingideological.
Lagos, for example, is happy to privatize itsbankrupt Lagos State Water Corporation buthas no idea where 90% of the company’s watergoes*.
The public and private sectors: Althoughmarket mechanisms will apply in water pro-vision, water stakeholders still expect theemphasis on the public sector to predominateover the private in operating facilities (57%versus 43%). North Americans seem par-ticularly attached to public operation (78% ver-sus 22%), this being one of the few areaswhere Europeans are happier to contemplateprivate sector participation (52% versus 48%).
Such an emphasis could involve a remark-able increase in private participation. Current-ly, the UNDP estimates that public utilities pro-vide 90% of the developing world’s water;Veolia Environment, the world’s biggest pro-
vider of water and waste recycling services,puts the world figure at 95%**.
Recent trends suggest, however, that al-though private-sector involvement in waterwill increase, it will do so in specific areas andtake on very specific forms. In the 1990s, the
World Bank encouraged greater private par-ticipation in water provision. A number ofhigh-profile grants of concessions tocompanies to provide municipal water faileddramatically, for reasons ranging from thepolitical difficulty of raising prices to covercosts through to currency exchange-ratefluctuations. Although there have beensuccess stories in this field – notably in Chileand parts of Manila – this history and the highupfront investment costs involved with waterhave increased corporate reluctance to take onsuch concessions***.
Instead, a variety of World Bank and OECDpublications**** indicate that the private
sector is moving more into the management ofpublicly owned water provision to improveefficiency, and especially the building andoperation of waste treatment plants. Privateoperation in particular involves lower risk – asthe state or the public utility, not the end user,
is the customer – and are less psensitive. A typical example is a neplant set to open in Moscow in 20structed by a German company uBOOT model (Build, Operate, Own, TThe company will operate and revenues from the facility for ten yeait slowly transfers it to the municipali
Private contracts also now tensmaller than the huge concession1990s, although there are more of th54 countries having opened the doocontinued on with, private participwater infrastructure in the last 15 ytime goes on, smaller domestic comp
taking a larger share of the market handful of transnational operators, incompetition.
In areas with reasonable levels ofreturn, private-sector participation wgrow as the survey results indicatehowever, have only limited abilityEmerging cities, as companies are avoonly politically sensitive business moalso locations unlikely to be profitabever welcoming.
The vast majority of new private invin water projects is currently going in(56% of the world total) and Algeria Lagos finds a purchaser, it will be an eto the trend. Emerging city water stakexpect the split of public and private ein the operation of new facilities to besus 43%. Most will likely need thecontribute far more than this.
The biggest advantages cited by tcates of privatization are increased ebetter funding, better quality manand a higher-quality service.
Those who are more skeptical avate-sector involvement cite high users, profit seeking and inadequate major impediments.
The best solution to water problems
42%
29%
15%
12%
10% % of respondentsmentioning
Improve existing waterinfrastructure
Increase investmentfunding
Manage demand witheducation/awareness
Better information andtechnology
Improve management
Predicted approach of water experts
New sourcesWater reusesystems
45%55%
* Urban Water Sector in South East Asia, Benchmarking Performance, Water and Sanitation Program (WSP) May 2006, UNDP, Human Develop-ment Report. **"City Launches Toilet Reform", Xinhua News Agency, 13 May 2002, ‘Shanghai Flash’, Consulate General of Switzerland in Shang-hai Commercial Section, Issue 4, July 2003.
*"Lagosresidentsthirstforbetterwatersupply",PlanetArk,10 June2003,**UNDP,HumanDevelopmentReport,2006,p.10,"Watersupplybogsdownincomplexity",InternationalHeraldTribune,20 August2005, ***UNDP,Human DevelopmentReport, ****Forexample,see http://www.ppiaf.org/Gridlines/14ppiwater.pdfand paperslisted onhttp://www.oecd.org/document/22/0,2340,en_2649_37425_37456726_1_1_1_37425,00.html#Background,*****http://www.degremont.com/uk/files/actualites/presse/files/2004/juin/contrats.htm
% = predicted emphasis
Healthcare

8/3/2019 MegaCity Report 1439020
http://slidepdf.com/reader/full/megacity-report-1439020 23/34
44 Megacity Challenges Megacity Challe
Healthcare
08 A
round the world, healthcare systems arecoming under increasing pressure. The
rising cost of prescription drugs and privatehealth insurance is one challenge. Hugeinefficiency in the delivery of healthcare isanother. But it is arguably the phenomenon ofpopulation ageing that creates the biggestlong-term problem for many countries, par-ticularly in Europe and East Asia.
Increased life expectancy means thathealthcare systems face an increase in theproportion of older patients. Ageing alsoplays a role in the occurrence of chronicdiseases, which in turn leads to greaterdemand for long-term care. That people livelonger has much to do with the achievements
of medical science, but it comes at con-siderable financial cost. People over the ageof 75 incur per capita health expendituresthat are five times higher than people aged 25to 34. Ageing is currently estimated toaccount for 6%-7% of the increase in health-care costs per year.
Costs rising fastest in developed world:
Spiraling healthcare costs are particularlymarked in the developed countries with theirextended health systems. Between 1990 and2004, health spending has been growingfaster than total output in all OECD countriesexcept Finland. In the US, which has the mostexpensive healthcare system in the world,
health expenditure as a percentageduction has increased from 13.1% to six years*. In contrast, developing ccannot afford to spend anywhere much on healthcare, and access to treis often non-existent or inadequateing to the World Bank, developing chave 90% of the world’s disease load12% of its health spending. Moretically, the poorest countries have 56load but only 2% of spending**.
Healthcare in megacities reflecbroader national environments. Ecities have basic infrastructures andfor privately funded care for the eoften provide only rudimentary
* Source: OECD, ** OECD Health Data 2006, October 2006, World Bank, Health Financing Revisited: A Practitioner’s Guide, 2006
Key findings■ City healthcare systems around the world will struggle
to cope with the effect of an ageing population
■ There is a high emphasis on increasing the efficiency
of the system to contain costs while improving quality
■ Stakeholders predict an emphasis on preventative
solutions and integrated healthcare
■ Healthcare is mainly seen as a public task, but
significant proportions are open to private sector
involvement — with quality of service and efficiency
cited as key advantages
Healthcare

8/3/2019 MegaCity Report 1439020
http://slidepdf.com/reader/full/megacity-report-1439020 24/34
Lagos’s health system cannot even providebasic needs in the face of serious AIDS,tuberculosis, and malaria problems*. Mum-bai, although India’s richest municipality andspending 25% of its budget on health, can stillcare for only 20% of the population, leavinglarge slum areas poorly served**. Transitionalcities are doing better, with places likeIstanbul and São Paulo seeing good impro-vements in recent years***. This city arche-type is now beginning to face medical pro-blems associated with more developedsocieties: whether the effects of pollutionarising from industrialization in Shanghai, orthe need for specialized facilities for Seoul’s
ageing population as Korea undergoes thedemographic transition typical of matureeconomic development. Mature cities such asNew York, which boasts one of the world’shighest concentrations of hospitals, are
troubled by healthcare inflation and diseasesof affluence, such as obesity-induced dia-betes and cardiovascular problems.
Given the scale of these challenges, it issurprising that healthcare is not more of apriority for respondents in the overall survey.It comes well down the list of socialchallenges (mentioned by only 4%) and infra-structure challenges (1%). Of the 4% whothink it the leading area for determining acity’s competitiveness, most are in the healthfield. The combination of underinvestmentand lack of focus can prove dangerous. As onesurvey participant from Beijing noted, theoutbreak of SARS had a pronounced effect on
the Chinese Government’s attention tohealthcare.The biggest problem facing city healthcare
systems is lack of capacity followed closely byinefficient operations, according to the
survey. Concerns about inefficiency were par-ticularly marked among stakeholders fromthe Emerging cities. Overall, it appears thathealth stakeholders think that it is not enoughsimply to pump money into current systems.Far more important is the need to put cityhealth infrastructures in order so that theycan use what they have more efficiently.
Improving healthcare efficiency: Whenasked about solutions to these problems,most stakeholders again offer a combinationof greater efficiency and increased capacity.Those in Mature cities expect to emphasizeefficiency gains by a wide margi n (61% versus
39%). Emerging cities also had a greater focuson measures to improve efficiency, withstakeholders prioritizing the need for bettergovernance of healthcare, a more integratedhealthcare system, and only then more staff.
46 Megacity Challenges Megacity Challe
Stakeholders in Transitional cities different order of priorities, in thexpect to emphasize new capacincreased efficiency. Their preferredis more money, so greater investmecomes well ahead of the needintegrated system (17%) in their view
The desire to control costs and efficiency also informs two other trensurvey: towards preventative and awacute medical care (67% versus 33%particularly in Transitional and Maturtoward common healthcare infraswith shared services as against indeindividual institutions (63% versus 37
One universal point worth noting acity archetypes is that stakeholders fomuch more on their systems as the of health, rather than on patient behliving conditions. When naming t
The most serious problem in thehealthcare sector
32%
29%
19%
14%
% of respondents selecting
Lack of system capacity
Inefficient operations
Obsolete infrastructure
Combination of problems
* www.vanguardngr.com/articles/2002/features/health/gh105092006.html; USAID Nigeria:http://www.usaid.gov/ng/index.htmFinancialNigeria.com (2006); Economic Report: New Polio Report Challenges Nigeria's Commitmentto Health -care Delivery 05/09/2006
** T.R. Dilip and Ravi Duggal, “Unmet Needs for Public-Health Care Services in Mumbai, India”, Asia-Pacific Population Journal, 2004*** OECD, Health Data 2006: How does Turkey compare?, “Sumario de Dados, 2004”; Secretaria Municipal de Governo Municipal
Healthcare

8/3/2019 MegaCity Report 1439020
http://slidepdf.com/reader/full/megacity-report-1439020 25/34
48 Megacity Challenges Megacity Challe
effective single strategy to address thechallenges outlined above, health promotionand education came well down the list, citedby only 5% of respondents. Getting thepatient to avoid anything from unsafepractices that spread HIV/AIDS to theexcessive drinking devastating Russian healthwould have a profound effect. So too wouldaddressing significant air or water pollutionissues, such as those in Transitional cities likeShanghai and Mexico City, with even Maturecities like Tokyo, London and New York excee-ding WHO-recommended nitrogen dioxidelevels.
IT in healthcare: IT has a major role to playin healthcare, supporting both treatment andadministration. The shift towards electronicpatient records is one example. São Paulo hasa medical smartcard that lets patients taketheir medical record between hospitals on
wallet sized pieces of plastic. IT can also savemoney: for example, a new system linkinghospitals in Copenhagen is expected to bringsavings of approximately US$46 millionannually. These are attractive benefits, butimplementing IT systems is not just a matterof finding suitable technology. Specialistsargue that the problems experienced by theUK’s National Health Service in implementingelectronic patient systems are more to dowith the difficulty of achieving cooperationon a huge project between a multitude ofstakeholders than the technology itself. Thesechallenges indicate that organizational inno-vation will be just as important as technolo-
gical advances when it comes to improvingthe performance of megacity healthcare systems.
The public and private sectors: Stakehol-ders in the survey believe that public healthinfrastructures will be the path for the future.
In terms of public or private ownership oroperation of facilities, they expected theemphasis to be for the former (58% versus42%). They also believe that there will be agreater emphasis on free-to-user medical ser-vices as opposed to healthcare models wherepatients pay for treatment (59% versus 41%).
Attitudes do vary by city archetype, how-ever. Transitional cities are especially likely toemphasize public ownership (63%), operation(63%) and free health care (70%). However,Mature city stakeholders expect fee-payingservices to be emphasized slightly more thanfree ones in the coming years, and splitroughly evenly on public or private ownership
and operation. Currently the public sector isdominant in healthcare in the developedworld, with the state covering 70% of healthspending in OECD countries, so this may con-stitute a relatively high degree of openness toprivate-sector involvement.
Emerging cities stakeholders greater emphasis on public ownershand operation (59%) in the future. Tbe viewed in the context of low pubding on healthcare in these countr29% of health spending comes from lic purse, and in India the figure is jaccording to the World Bank). Whmoney will come from to move thisaspiration is unclear.
The one certainty is that Emergifaced with pressing health probleneed to use whatever resources tmuster, public or private, in as efficieas possible.
In this context it is worth noting tother infrastructure sectors in thequality of service and efficiency aremajor benefits of privatization. Hcosts and profit-seeking are perceivemain disadvantages.
Predicted approach of healthcare experts
New capacityIncreased efficiency
49%51%
% = predicted emphasis
Safety and security

8/3/2019 MegaCity Report 1439020
http://slidepdf.com/reader/full/megacity-report-1439020 26/34
Security has one important qualitativedifference from other infrastructure areas
in this study: whereas water or transport pro-vide something tangible, the ultimate goal ofsafety efforts is to create a subjective state ofmind. Statistical success is not enough. In2005, the FBI reported that violent crime has
been decreasing in America for a decade, buta Gallup poll showed that two thirds of thepopulation believed the complete opposite.Worries have real world implications: flyingafter September 11, 2001 was objectivelysafer because of enhanced security, butpassenger numbers suffered nonetheless.
Whatever the difficulties, urban specialistsunderstand that security is a crucial infra-
50 Megacity Challenges Megacity Challe
Safety and Security
09structure element. The complete surveypopulation ranked public safety and securityas the second most important infrastructurearea in determining competitiveness with 9%of respondents. It is also the sixth-biggestsocial challenge, while crime/corruptioncomes in tenth.
Threats against the city: The more detailedsurvey answers by security stakeholdersfleshes out their more informed concerns.Organized crime, including by armed gangs,is their biggest challenge — named by 36% ofthose questioned and by even higher num-bers in the Emerging and Transitional cities.Next, a surprising distance behind, comes
terrorism (18%), a particular conEmerging and Mature cities.
Although distinct threats, the twoin important ways. Terrorists use oviolence to weaken the state: crimindo so to gain wealth. This frequently a distinction without a difference: t
their ends, the IRA robbed banks andcartel undermined the Colombian practice, the main problem facingprofessionals is organized grouchallenge the rule of law, and that inly cooperate with each other whatefinal goals. A recent study, Illicit bNaim, shows that globalization hasorganized crime and terrorism to c
Key findings■ Safety and security comes second only to transport as a factor
contributing to city competitiveness
■ Organized crime emerges as the biggest problem, followed some
distance behind by terrorism
■ Cities are attempting to shift to a more proactive approach to security
■ Although open communities are the favored as the route forward
for most, gated communities will also be emphasized by many —
especially in Emerging cities
■ Public surveillance is deemed more important than protecting privacy
Safety and security

8/3/2019 MegaCity Report 1439020
http://slidepdf.com/reader/full/megacity-report-1439020 27/34
Towards proactive protection: How canthe city protect itself against these threats?The survey indicates a greater focus on thethreats themselves, rather than underlyingcauses. The leading ones they named were:crime itself (put first by 24%), corrupt orincompetent law enforcement (15%), poorplanning/city management (10%), terrorism(9%), and natural disasters (9%). In otherwords, the causes of crime, terrorism andnatural disasters are criminals, terrorists, andnatural disasters, or incompetence in fightingthem. Social issues such as unemploymentand poverty are well down the list. The lack ofa holistic approach to these threats is evident,
possibly because security specialists in thesurvey feel that the underlying social causesof crime are outside their remit.
Asked how best the city could addresssecurity issues, the most popular response isadditional officers and law enforcement
capacity (28%), while the third is betterpreparedness and planning (17%). Emergingcities emphasize the former and Mature ones
— which can already afford larger policeforces — the latter, but the common messageis more capacity, better used.
Over recent decades numerous policedepartments have shifted from a reactiveapproach to take the fight to the enemy. Thesurvey results show this occurring worldwide.Respondents indicate that, given a two-waychoice, the emphasis of security efforts wouldbe towards preventing problems over pro-tection from them (60% versus 40%). Inanother question they emphasize protecting
the city from threats over responding to them(57% versus 43%).The success of so-called “risk-based po-
licing” has been dramatic. New York City’songoing, widely copied COMPSTAT program,which analyzes police data to indicate crime
hotspots, allowing frequent tactical resourcereallocation, was important in that city’s dropin crime figures in the late 1990s. A similarinitiative in Bogotá, and related efforts toreclaim crime-blighted public spaces iden-tified by technology, were instrumental inreducing its murder rate by 48% between1994 and 2005. A slightly different, butrelated approach, which has spread from theUK through Europe and Australasia is dubbed“intelligence-led policing”. In addition tocrime data analysis, this involves the sys-tematic collection of informant informationdescribing the criminal environment and par-ticularly the behavior of repeat offenders.
Safety over privacy: A strategy based onpredicting crime has its controversial ele-ments. Survey respondents thought that theemphasis on the need for public surveillancewould far outstrip privacy concerns, a con-
52 Megacity Challenges Megacity Challe
and thrive. For example, from 1990 to 2005money-laundering expanded five times morequickly than global trade.
The next most pressing safety concern,potential natural disasters, shows theimportance of context in risk perception. Ove-rall, 13% name this as their city’s leadingsecurity challenge. Mature city respondents,however, rank it almost as high as anythingelse, while Emerging city respondents do notmention it. The latter are not exempt frompotential disasters. Lagos will lose significantterritory if global warming raises sea levels.With a barely functioning security apparatus,however, it cannot even properly address
current annual floods. Shanghai, though,with a low crime rate and greater resources,can invest in preparation for potential earth-quakes and flooding. Security stakeholdersare perhaps focusing on where they have thecapacity to make a difference.
viction strongest in Transitional andcities — where risk-based policingadvanced.
In pursuing their campaign criminals and terrorists, however, stakeholders fully understand the maintain perspective. The most ifactors influencing their decisions aron the economy and employmentpriateness, public satisfaction and coimpact. These all come well ahead The city's protection cannot unduly cpeople's lives and businesses — indfocus of decisions is to enhance teconomic competitiveness and quali
Technology is essential for rpolicing, and a vital tool for generalance in cities wishing to increascapacity. Crime mapping is just one Another ubiquitous and sometimuseful one is CCTV. Introduction o
The most serious safety and securityproblem
36%
18%
13%
8%
% of respondents selecting
8%
6%
7%
Organized crime
Terrorism
Natural disasters
Ethnic conflicts
Mass events
Crime and violence of all types
Combination of problems
Predicted approach of safetyand security experts
Prevention ofproblems
Protection fromproblems
60%40%
Predicted approach of safetyand security experts
Public surveiProtecting Privacy
59%41%
% = predicted emphasis % = predicted emphasis
Safety and security

8/3/2019 MegaCity Report 1439020
http://slidepdf.com/reader/full/megacity-report-1439020 28/34
54 Megacity Challenges Megacity Challe
system, for example, in central Johannesburgbrought an 80% drop in crime in 2002 andwas instrumental in the revival of a previouslydevastated downtown*.
The security stakeholders see technology'simportance, expecting the emphasis on itspurchase to be greater than investment inhuman resources (54% to 46%). This figure,though, also indicates that technology with-out having enough people to use it is insuf-ficient. More strikingly, while 28% of res-pondents see more officers as the best way topromote security, only 4% wish to rely onmore CCTV alone. Technology is seen as acrucial tool, not a complete solution.
Mobilizing citizens: The survey also indi-cates the international strength of anotherimportant shift in policing: enlisting the
community in efforts to promote its ownsecurity. After more enforcement capacity,respondents thought the best option for citieswas increasing awareness/education/sense ofcommunity (18%). Combining these respon-ses with those advocating the same measuresspecifically directed at youth raises the figureto just under one quarter.
Community involvement can make a hugedifference. A core part of Chicago’s Alter-native Policing Strategy has been mobilizingthe public. From 1992-2002, robbery in thecity declined by 58% — more than anywhereelse in America — and more importantly fearof crime fell by 20% among the most
vulnerable. Still more dramatic were efforts inSão Paulo’s Jardim Ângela, which the UN oncelabelled the world’s most violent neigh-borhood. Efforts by the city and 26 NGOs to
increase community cohesion were crucial inreducing the murder rate there between 1999and 2004 by over 73%.
Harnessing community strength, however,alters the relationship between the securityforces and society. Safety is no longer simply astate-provided public good, but becomespartly the responsibility of individual citizens.Now, measures like Neighbourhood Watch orcountless volunteer citizen patrols in NorthAmerica — from New York’s Guardian Angelsto the South Cariboo Citizens on Patrol in ruralBritish Columbia — are no longer branded asvigilantism but are often assisted by thepolice. Once people in a community feel that
they have responsibility for their own safetyand security, the incentive exists to turn toprivate security solutions if they considerpublic efforts insufficient.
The public and private sectors: Thegrowth of a private-sector role in such a tradi-tionally public field sparks some anxietyamong those surveyed. Those most opposedare moved by more ideological arguments:this field is the role of the state (39%); the pri-vate sector is unaccountable (23%); and pri-vate security companies are elitist (16%). Themuch smaller number favoring greater privateparticipation instead point to utilitarian justi-fications: such arrangements are credible andreliable, they attract investment, and arehighly efficient.
Given such views, the surprise is that indeveloping solutions to the security problems
of their cities over the next five to ten years,on average these respondents expect effortsto emphasize private versus public efforts by33% to 67% — a finding that could be signifi-
cant in what is currently a state-dofield.
Force of circumstance is drivgrowth, in two areas. The first companies hired to perform specifnot front-line, tasks by government with a security role. This arouses relatle controversy. Britain, for exampsources part of its passport applicacess to Siemens Business Systems aairports use private security firms degree.
The second category results fromindividuals or companies exercisiresponsibility for their own safety
their fears are insufficiently allayedstate’s efforts. An increasingly commof this practice around the world is tcommunity — protected by walls andits own private guards. Although mosindicate that such neighborhoods enjthe same level of safety as their surrothe feeling of security within is imuch higher.
Such private security procuremensome controversy. In our survey, resthink that their cities will strongly emdeveloping open communities ovecommunities (61% versus 39%). In Ecities, however, with higher crime rfewer public resources, respondents inclined to predict an emphasis on gaopen communities (52% versus 4crime rates drop and resources rise
Transitional and Mature cities, supgated communities lessens.
Thus, where cities can providesecurity of their residents, or mortantly make them feel safe, the pubwill outsource some highly controlfor reasons of efficiency and financethey cannot, the private sector wicessity do so for those who can afford
Predicted approach of safetyand security experts
Develop gatedcommunities
Develop opencommunities
39%61%
88%
100%
83%
82%
82%
78%
Impacts on economyand employment
Public satisfaction
Appropriateness
Community impacts
Regulations
Factors influencing city’s decisionmaking on safety and security
* (http://www.joburg.org.za/metro_police/police_projects.stm, http://www.joburg.org.za/july_2002/cctv.stm)
% = predicted emphasis% saying important impact
City governance and finance

8/3/2019 MegaCity Report 1439020
http://slidepdf.com/reader/full/megacity-report-1439020 29/34
Metropolitan governance has increasingly complex as cities h
phed into agglomerations combiningadministrative organizations and jurisThis has led to calls for a complete rment of urban governance. Megacneed innovative funding strategies t
much-needed investment to address structure challenges outlined in prevtions.
These requirements are widely edged, but there is considerable debahow to address them. As usual, a onall strategy is inappropriate: governafinance structures must be adapted tounique circumstances and needs of e
56 Megacity Challenges Megacity Challe
City Governanceand Finance
10
Beijing
Key findings■ Economic growth and employment are the primary drivers in decision-making for
specialists in city management
■ Environmental issues are also important but are sometimes sacrificed in the race for growth
■ Attempts to deliver holistic solutions are often undermined by a lack of strategic
planning and poor coordination between different levels of government
■ Many cities focus on increasing supply to cope with growth; demand management
strategies have yet to be widely adopted
■ Infrastructure will usually remain under public control, but the private sector has
an important role to play in managing services for increased efficiency
City governance and finance

8/3/2019 MegaCity Report 1439020
http://slidepdf.com/reader/full/megacity-report-1439020 30/34
6% of respondents to this survey saw educa-tion as the most important area determiningcity competitiveness. Similarly, cities need ahealthy workforce to achieve their economicpotential, yet in the survey only 3% citedhealthcare as the single biggest factor in citycompetitiveness. It is therefore worth stressingthat the health, education and welfare of thecity’s inhabitants may be at least as big a factorin attracting investment and delivering growthas physical transport infrastructure.
Environmental concerns are important
but are sometimes sacrificed for growth.
Respondents also have a high awareness ofecological factors: six in ten city managers inthe survey think that their city’s leadership rec-ognizes the vital role that infrastructure deci-sions can play in protecting the environment.This echoes a wider sensitivity to environmen-tal issues in the survey overall — for example,the desire to make transport greener byemphasizing mass transit solutions, or to placean increased emphasis on renewable energysources to provide a greater proportion ofpower to the city.
Even so, when push comes to shove thesearch for economic competitiveness oftenwins out over environmental considerations.For example, 45% of respondents overall pre-dict that their cities will increase infrastructurecapacity at the expense of the environment.Stakeholders in the developing world are par-ticularly likely to put capacity growth first:
about 55% of respondents in Emerging andTransitional cities believe their cities will sacri-fice environmental considerations for the sakeof increased capacity, whereas only 14% ofrespondents in Mature cities believe that thiswill happen.
More resources need to be made available
for the urban poor. A wealth of depressing
statistics drive home the scale of urban pover-ty. Worldwide, 18% of all urban housing unitsare non-permanent structures and at least 25%of all housing does not meet urban construc-tion codes. Problems are especially acute in theEmerging cities and particularly in Sub-Saha-ran Africa, which has the highest slum growthrate.
In the UN-HABITAT report, Kofi Annan com-ments that efforts to improve the lives of theurban poor have not kept up with the rate ofurbanization. Many in the survey seem toagree: only 37% of stakeholders say that theircity makes adequate infrastructure invest-ments into the poorer areas. Respondents inEmerging cities are most likely to think thatinvestment into poorer areas is inadequate.
It is not that stakeholders in the survey donot appreciate these problems. Education andhousing are two areas where stakeholders saythere is a high need for investment. However,Emerging cities often lack the resources toaddress these issues effectively.
Better performance begins with better
governance. Stakeholders are aware that get-ting money to invest in improved services,though important, is not the only issue. Long-term strategic planning emerges as the singlebiggest problem facing city managers in thesurvey. When asked what the best solution is tothe challenges they face, one-half of respon-dents in this area call for better planning, ver-sus only 12% that cite the need for more fund-
ing. The call for better city governance isechoed in a related issue, the need for moreefficiency in the management and implemen-tation of infrastructure. Only half of all respon-dents to the survey say that the implementa-tion of infrastructure decisions is currentlydone well, although that proportion rises toapproximately two-thirds for public-sectoremployees and elected officials.
Finance is of course a major issue, and iscited as such when we asked the differentinfrastructure specialists about their chal-lenges. What is clear, however, is that city man-agement stakeholders see that good gover-nance is a prerequisite for raising funds andachieving value for money. In this respect,good governance is the cornerstone of com-petitiveness. Poor governance also acts as abarrier to achieving the goals of sustainabledevelopment. Even in the more developedcountries, recent OECD research* on metropol-itan governance discusses how the currentstructures are not well-suited to balancing theneeds of economic competitiveness and ‘live-ability’. The three main obstacles identified area fragmentation of administrative jurisdiction;strain of the financial and fiscal abilities of localmunicipalities in metropolitan areas; and a lackof transparent, accountable, decision-makingprocesses. The report goes on to identify cer-tain features that can contribute to the dualgoals of enhancing competitiveness and live-ability of large metropolitan regions. Theseinclude stronger area-wide metropolitan gov-ernment, improved coordination and integra-tion of policies in metropolitan areas, and gov-ernance and strategic planning to supportmore sustainable urban development.
58 Megacity Challenges Megacity Challe
However, some strong themes and challengesemerge in the survey that provide an insightinto how governance and finance strategiesmight evolve in megacities globally and at thethree archetypal stages of development.
Growth and competitiveness are the pri-
mary drivers in decision-making. The clearpriority for those stakeholders in the surveyinvolved in city management is to grow theeconomy and create or protect jobs. Whenasked to rate the importance of ten factors interms of their impact on the city’s decisionmaking today, 81% acknowledge the impor-tance of the economy and employment,whereas smaller proportions cite the impor-tance of responding to citizens (73%) or of con-sidering community impacts (68%).
Competitiveness also emerges as an impor-tant consideration in decisions relating to spe-cific infrastructures. Six in ten stakeholdersthink that their city places a high importanceon making themselves competitive to attractprivate investment when deciding on infra-structure issues, a proportion that rises amongelected officials and municipal employees.
A multitude of different factors combine tomake a city competitive. Some are related tophysical assets, others to the contributionmade by the city’s inhabitants*. As noted inprevious sections, stakeholders are highlyaware of the more tangible and direct factors — namely that a good transport infrastructureis vital for commerce. By contrast, other infra-
structure areas covered by this report are seenas social or environmental problems in need ofinvestment, but are rarely linked with city com-petitiveness. This may be an oversight. Forexample, a number of surveys of internationalexecutives by the Economist IntelligenceUnit** indicate that the availability of skills is adecisive factor in attracting overseas invest-ment from global businesses. Despite this, only
City management must becom
transparent and accountable. Maholders in the survey are aware of theimprove transparency in municipalment. Only 44% of city managemeholders agree that their city has traand consistent decision-making pwhen it comes to investing in infraswhile 38% disagree, and the remaineutral on the subject. One-half ofdents believe that their city’s biddingdering processes are major obstacletimely implementation of infrastruc jects. Once again, improvements in thare vital steps towards improving afunding. Investment and lending is inly tied to clear measures of how monespent, and assurances that projects wciently managed. When the World Bana deal with Nigeria in 2006 to lend US$lion to improve drainage and solid waagement in Lagos, the agreement clauses on transparency and financiaing. Political reform at the metropolhas been a key factor in delivering iinfrastructure in Bogotá, Colombia. case study** emphasized the imporcity-level leadership and an enablingcontext, especially in a developing
12%
% of respondenmentioning
Improve management /planning
Additional funding
Better education 5%
The best solution to city managemen
*In its recent report on city competitiveness, the OECD notes that factors such as infrastructure and accessibility, industry and eco-nomic scale and structure, human capital and the labor force act as major determinants of city competitiveness.**For example, World Investment Prospects 2004, CEO Briefing 2005
*OECD Policy Brief, The reform of Metropolitan Governance, October 2000; OECD Policy Brief, Competitive Cities in the Global Economy, 2006**The Mobilization of Private Finance in Bogotá,
City governance and finance

8/3/2019 MegaCity Report 1439020
http://slidepdf.com/reader/full/megacity-report-1439020 31/34
60 Megacity Challenges Megacity Challe
Important measures included reforms thatgave more authority to local officials and madethem accountable to their constituents. Fiscaldecentralization provided funding sources forlocal programs and initiatives. The combi-nation of these factors and an enabling legalframework provided a window so that localofficials could be more responsive to localissues, as well as needs of the poor in particular.
Silos and short-term thinking are holding
megacities back. The underlying reason forpoor planning, according to city managers inthe survey, is poor coordination and a lack ofleadership. While the influencers and private-sector respondents are especially critical, evenone-third of the public-sector employees arenot satisfied with their own performance inthis regard. Poor coordination between depart-mental silos makes it hard for cities to provide astrategic response to complex infrastructurechallenges across multiple jurisdictions. Theinterdependencies between different infra-structures are seemingly overlooked, judgingby the survey — the fact that improved waterand sanitation is rarely cited as a key step topreventative healthcare being a classic example.
There is a clear stakeholder emphasis onholistic urban management over separatedresponsibilities in the survey (61% versus39%). But it appears that current structures formunicipal governance often prevent this fromhappening. For example, another recent OECDreport* analyzed the challenges posed by frag-
mented governance in Mexico City. The city’soverall metropolitan area consists of fourmajor governmental units: the Federal District(itself consisting of 16 sub-units); the stategovernments of Mexico and Hidalgo (with 59municipal governments); and the federal gov-ernment (which maintains substantial day-to-day responsibilities). The different governmen-tal entities within the metropolitan area clearly
recognize the need for cooperation at the met-ropolitan level, as evidenced through the largenumber of coordinating bodies that have beencreated to manage specific issues, but the over-all impact of these has been minimal. The over-all impression is that these plans are poorlylinked to the political channels through whichinvestment decisions and budgetary allocationare determined. These problems resonate else-where. The city of São Paulo is one of 39 citieswithin the greater Metropolitan area, and thecity government has major challenges in coor-dinating its activities with surrounding com-munities. The municipal government wentthrough a process of decentralization in the1960s that was necessary to address the prob-lems of rapid growth but, as stated in a recentreport from the Woodrow Wilson InternationalCenter for Scholars, better municipal coordina-tion will now be vital for improving the effec-tiveness of metropolitan governance. Coordi-nation is also a major issue in Mumbai, wherethere are multiple administrative agenciesoften with overlapping authority. It is estimat-ed that, compared with other large cities, ittakes more time in Mumbai to process typicalmunicipal tasks such as building plans or con-struction regulation**. A government task-force identified improved governance as a keystep towards Mumbai becoming a World ClassCity***. This challenge of delivering holisticsolutions that balance the needs of the city andthe wider metropolitan region are acknowl-edged by some, but by no means all, of the
stakeholders in the survey.One implication of the research is that the
traditional model of municipal governmentmay need to be reconsidered. As opposed tohaving many departments based around a sin-gle discipline (for example, planning, transportand environment departments), cities mightadopt “local area teams” that offer the multi-disciplinary skills required to deliver integrated
solutions at a local level. This would need to becombined with a central planning and deliveryteam with responsibility for delivering holisticsolutions across the metropolitan region.
Cities emphasize supply over demand
management. Faced by huge pressures onpublic services, cities tend to emphasize supply-side solutions. This does not necessarily meanbuilding more roads, railways, hospitals and soon. On the contrary, there is often a preferenceto increase efficiency of existing infrastructureas opposed to building new capacity. For exam-ple, healthcare stakeholders make the case forintegrated healthcare systems, those in trans-port emphasize the need for incrementalimprovements to existing systems, and citymanagement stakeholders look to the efficien-cies offered by IT. Where cities invest in newcapacity, this tends to be combined with thedesire for more efficient management of pro- jects to achieve a better outcome. Demandmanagement does get mentioned by a minorityof respondents, but never emerges as a priority.This is true even of responses from specialists inparticular infrastructure sectors — a findingthat is perhaps surprising given that demandmanagement has been a hot topic for severalyears. Despite the success of several road pric-ing schemes in cities such as London and Singa-pore, only a fraction of respondents citeddemand management as a priority for solvingtheir city’s challenges. Demand management iseven less likely to be cited as a key solution by
stakeholders in the Water and Waste Water sec-tor, despite the fact that many (including theUNDP) have argued for the benefits of meteringand pricing water.
Information technology will help to drive
transparency and performance. IT can playan important role in improving transparency,accountability and the efficiency of municipal
services. As a measure of transparency, theWorld Bank report on city governance and glob-alization looked at whether cities have a web-site that includes information on the city bud-get, and advice on how to start a business.Those that met these criteria tended to performbetter across a range of public services. Ofcourse, as well as increasing transparency, ITcan improve cost-efficiency. In Denmark, thecountry that topped the Economist IntelligenceUnit’s e-readiness rankings in 2006, e-procure-ment is saving the country’s taxpayers as muchas US$188m per year. Politicians elsewherehave also cottoned on to the benefits of e-gov-ernment strategies. EU ministers have nowdecreed that by 2010, at least 50% of publicprocurement in member countries should becarried out electronically. The value of technol-ogy is well recognized by city managementstakeholders in the survey. Eight in ten respon-dents think that their cities will increasinglyintegrate advanced IT into their administrationand operations over the next five years. More-over, respondents predict an emphasis on digi-talization or e-government over recruiting more
staff by a ratio of 2:1. Interestingly, Ecity respondents predict almost aemphasis on e-government and digias those in Transitional and Mature cigesting that the benefits of IT are not rto the rich cities alone.
The private sector has a role to
increasing efficiency. The survey pmixed picture on privatization. Generrespondents predict public ownershipstructure sectors and services. Howemajority of stakeholders also say thatopen to public-private partnerships (Psurprisingly, private-sector respondentmost likely to predict privatization. Hmore than 70% of publics and electPPP’s as a viable means to implement inture solutions and more than 60% beprivatizing infrastructure would incefficiency. Surprisingly, respondentsmain advantages of privatization as efficiency, rather than money. Givenwas traditionally perceived primarily atap the private sector for increased fun
Predicted approachon city management
Digitalizatioe-Governme
More staff
64%36%
*OECD Territorial Review, Mexico City, 2004, **Mumbai City Development Plan, Appraisal Report, 2006,***Transforming Mumbai into a World Class City, First report of the Chief Minister’s Task Force, 2004
% = predicted emphasis
City governance and finance

8/3/2019 MegaCity Report 1439020
http://slidepdf.com/reader/full/megacity-report-1439020 32/34
62 Megacity Challenges Megacity Challe
may represent a significant shift in attitudes. Bycontrast, the main disadvantages of privatiza-tion are seen as potential higher user costs andinadequate supply for the broad population. Areport from the World Bank acknowledges that,while there is growing empirical evidence of pri-vatization’s benefits, this often coincides withdissatisfaction and opposition among citizensand policymakers. It argues that rather thanabandoning privatization, there should be aredoubling of efforts to privatize correctly. Thisentails tailoring privatization to local condi-tions. The report also warns against focusingsolely on privatization transactions, arguingthat instead cities need to create a framework inwhich public-private partnerships can succeed.This involves developing and protecting com-petitive forces, creating proper regulatoryframeworks before privatization, introducingand enforcing transparency in the sales process,developing social safety nets for the adverselyaffected, and introducing innovative pricingand subsidy mechanisms that ensure access toaffordable basic services. Get these admittedlycomplex issues right, and the efficiency gainsfrom privatization can be compelling.
Megacities are calling for public leader-
ship. It is clear that many stakeholders are opento the benefits of public-private partnership,but they are also reluctant to relinquish publiccontrol of services. If anything, our city man-agement specialists call for stronger municipalgovernment. As noted in the infrastructure sec-tions of this report, stakeholders predict an
emphasis on public ownership. The need forstrategic solutions at a city-wide level is also dri-ving a shift towards greater central control andautonomy within municipal government. Thereis a clear emphasis on greater regulation ratherthan deregulation in the future (58% versus42%), and a bias towards centralization ratherthan decentralization in city management (62%versus 38%). Thus it seems that governmentand the public sector will seek to provide strongleadership, but will bring in the private sector tomanage and increase the efficiency of services.
“By raising the price [the seller of scarce corn] discourages the consumption, and putseverybody more or less, ... upon thrift and good management. ... If by not raising the price highenough he discourages the consumption so little that the supply of the season is likely to fall shorof the consumption ..., he exposes the people to suffer ... the dreadful horrors of a famine.”
Adam Smith, Wealth of Nations, (1776) Book 4, C
75%
PPP’s are viable means ofimplementing infra-structure solutions
ElectedsEmployees
Privates Influ-encers
Role of public private partnershipsand the private sector
73%77%
70%64%
Privatization of cityinfrastructure wouldincrease efficiency
ElectedsEmployees
Privates Influ-encers
63%
77%
63%
0%
10%
20%
30%
40%
50%
60%
70%
80%
90%
100%
The link between supply, pricing and demand
management has long been at the heart of
economics. It has moved toward the heart of
sustainable development strategy as well.
Kyoto’s carbon emission trading provisions are
just one example.
For megacities encountering water, fuel, or
transport constraints, correct pricing can play
an important role in building a sustainable in-
frastructure, by unleashing entrepreneurial in-
genuity in support of the environmental trinity:
reduce, reuse, recycle.
Beijing, for example, a city that faces serious
water shortages and where low prices led to
rampant waste, has seen nine price increases
for water customers in the last 15 years, rai-
sing the price by some 3,000% – although still
costing the average household only 1.8% of its
total outlay. Between 2001 and 2005, the city’s
overall use dropped by 15%. The EU has adop-
ted this strategy too: its Water Framework
Directiverequires pricing by 2010 that encou-
rages resource efficiency.
Prices can also affect electricity use and the ty-
pes of fuel used for power. Denmark’s policies
of selective taxation of fossil fuels throughout
the 1990s were central to bringing about itsvastly increased energy efficiency — its energy
intensity, or energy used per unit of GDP — is
35% below the average of International Ener-
gy Association Member States, and its renewa-
bles sector now provides 25% of all its energy.
Road pricing can have even more rapid results
in transport. In its first six months, Central
London’s Congestion Charge brought a drop of
30% in non-exempt vehicles entering the char-
ging zone, most of the occupants of which
had switched to more sustainable means of
travel, such as public transport.
Success in this type of demand management,
however, requires more than simply taking
people’s money. First, new fees must be correctly
targeted. Price increases work better in some
places than others. For example, the market for
indoor residential water use is relatively inela-
stic. For water, industrial and (often heavily sub-
sidized) agricultural users — including garden-
ers — are much m ore responsive: higher prices
led to a roughly 25% improvement in Chilean
irrigation efficiency between 1975 and 1992,
and numerous companies in water-poor Chen-
nai (India), rather than pay for expensive pri-
vate supplies, are treating their own wastewater.
Even more importantly, such charges require
groundwork to garner political support. Despi-
te using market mechanisms, charges to pro-
mote sustainability are not market driven: a
cyclical fall in crude oil prices is more likely to
exacerbate global warming than reduce it, for
example. Price setting, and its acceptance by
consumers, is a process both deeply political
and expensive when misjudged. The largeCochabamba water concession in Bolivia
collapsed in 1999 over protests at charges for
previously free water, putting an acrimonious
end to plans for a new dam and purification
plant; and in early 2005 the residents of Edin-
burgh voted three to one against a congestion
charge modeled on London’s successful sche-
me, slowing the spread of such arrangements
to other cities in Britain. Doesn’t mark
cing further disadvantage the poor? S
form of subsidized service for those w
simply destitute will be essential, but
tice the main beneficiaries of infrastru
charges are, when properly constructe
least well off themselves. According to
UNDP, in megacities the people least l
be connected to the water system are
orest residents, especially those in slu
must pay exorbitant prices for bottled
dubious quality. Meanwhile, subsidies
go to those connected to the municip
stems and able to afford water. In Ban
and Kathmandu, 30% or more of thes
fits go to the richest 20% of the popul
Using water charges to fund expansio
network to poor parts of cities, as the
water utility does in Abidjan, does far
reduce costs to those less well off tha
offering free water. Sim ilarly, those i
who cannot afford its Congestion Cha
bably cannot afford a car to begin with
raised to improve the public transport
they use and improved air quality with
ced noise in their urban environment
them nothing.Thus, properly structured and targeted
ges can lead to more sustainable infra
re and thereby help with all three goa
ban leaders: a more competitive city,
environment, and an improved quality
for all residents. Adam Smith was righ
ting the price right is as much a moral
an economic operation.
Pricing andSustainability
% Agree
Conclusions

8/3/2019 MegaCity Report 1439020
http://slidepdf.com/reader/full/megacity-report-1439020 33/34
Dense, vast and complex, megacities pose
challenges on an unprecedented scale
for urban planners, city managers and those
responsible for delivering basic services and
infrastructure. It is clear that each city has its
own unique issues and circumstances to
address. However, this research has highlight-
ed a number of common themes and trendsthat will shape the evolution of megacities
over the coming years.
The majority of stakeholders see economic
competitiveness as a priority. This is under-
standable: unless megacities can create
wealth and attract investment, they will not
create the number of jobs needed for their
burgeoning populations, nor will they attract
64 Megacity Challenges Megacity Challe
Conclusions
11require megacities to contract out the man-
agement of more services to the private-sec-
tor.
One of the more surprising findings in the
survey is the fact that the main perceived
advantage of private-sector operation is
improved efficiency, more than access to
funding.Where cities do increase private sector
involvement, they will need to create the right
framework for success. There is a variety of
models available, where ownership and oper-
ation of services can be shared. But when
entering into partnerships with the private
sector, the consequences must be well
thought through, and success will require a
“context-sensitive” approach to priv
with overall control (and responsibi
ing with the public sector.
Overall, the research indicates tha
ities are moving from passive admin
of services to active management
infrastructures.
This entails a desire for strong putrol of services and the ability to
strategic, city-wide response to t
lenges that they face. If comprehen
ernance models and efficient man
structures are put in place, econom
tiveness, environmental protection a
ty of life for all citizens need not be c
tory goals.
the financial resources needed to address the
huge challenges that they face. However,
while areas like transport infrastructure are
recognized as being vital to competitiveness,
stakeholders often overlook the economic im-
portance of other areas – in particular educa-
tion, healthcare and basic services such as
water.City stakeholders do place significant
importance on environmental considerations,
and there is a clear aspiration to focus on
more sustainable solutions in many of the
infrastructure sectors. However, the survey
also suggests that, when push comes to
shove, ecological considerations can be sacri-
ficed in the race for economic growth. In par-
enue. A key factor in this will be the correct
pricing of services to support sustainable
goals.
Delivering in each of these areas will
require new governance structures and more
efficient management. Stakeholders are high-
ly aware of this, but delivery is tricky. Gover-
nance structures need to deliver holistic solu-tions across infrastructure sectors, which
balance the needs of the city with the wider
metropolitan area and take into account the
interdependencies between the various infra-
structures. This may mean a new non-de-
partmental approach to the management of
cities.
The search for improved efficiency may
ticular in Emerging cities, economy and
ecology are still often viewed as contradic-
tions.
Can stakeholders’ desire to deliver greener
solutions be reconciled with the need to deliv-
er growth? This is the question at the heart of
the debate on sustainable development, and
one that cannot be fully addressed in a paperof this size. However, a greater focus on
demand management – a concept that the
survey indicates has yet to gain global accep-
tance — would be one way that cities could
develop more sustainable infrastructures.
Failure to monitor and manage the use of
many services (for example, road usage or
water) also creates problems in raising rev-
Appendix

8/3/2019 MegaCity Report 1439020
http://slidepdf.com/reader/full/megacity-report-1439020 34/34
This report studies infrastructure chal-
lenges and governance trends in the
world’s largest megacities. The research
focuses on five critical infrastructure sectors –
transportation, water, electricity, healthcare
and safety & security. It also looks at how city
management is evolving to address these
challenges, based on the views of a range of
municipal stakeholders.
The UN defines a metropolis as a “megaci-
ty” if it has a population of 10 million or more.
This report focuses on 25 megacities and met-
ropolitan areas, most of which were selected
on the basis that they are the most populouscities in the world*.
Choices include some large metropolitan
agglomerations like the German Ruhr (with a
large number of independent municipalities).
London, which has fewer than 10 million
inhabitants, was chosen for its economic
importance.
The findings in this report are primarily
66 Megacity Challenges Megacity Challe
Methodology
City archetypes: It is recognized that cities
are unique, as each city today is a reflection of
its own unique mix of social, political and eco-
nomic history. Nonetheless, as an organizing
principle for the study of megacities, a sec-
ond, and related, element of the MRC McLean
Hazel study has been to undertake an analysis
of whether there are logical, simplifying,
groupings of megacities in order to facilitate
an understanding of the processes and
dynamics of urbanization on a global basis.
These groupings should be powerful enough
to undertake a first order generalization in
order to simplify further analysis and providea common understanding of key issues.
Our analysis is based on three major arche-
types: Emerging Cities, Transitional Cities,
and Mature Cities, using a simple two-axis
grid based on readily available data.
The methodology employed uses a combi-
nation of absolute Gross Metropolitan Product
(GMP) to position cities along a vertical axis
and a proxy for the level of social and
development along the horizontal a
ranged from approximately 1,500 eu
ta for Emerging cities, to 5,000 eur
for Transitional cities, and 30,000 eu
ta for Mature cities.
The proxy for social and physical
ment was a composite measure th
national scores from the United
Human Development Index, city sco
Mercer Human Resource Consultin
Quality of Living Survey, and nation
from Transparency International's Co
Perception Index.
Each index was brought to a comm
for the purpose of developing the co
measure. The composite index rangetypical value of 0.40 for Emerging Cifor Transitional cities, and 0.98 fo
cities. Sensitivity testing, by vary
weightings of these three indices, rev
tle change in the city groupings.
The UN Human Development In
standard comparative measure of w
for countries. It employs measure
expectancy, literacy, education, a
dards of living for countries worldwid
used to assess a country’s level of
ment and to measure the impact of e
policies on quality of life.
Mercer’s city-level Quality of Life
based on detailed assessments and
tions of 39 key quality of living deter
grouped into categories that include
and social environment; economic ment; socio-cultural environment;
and health considerations; schools
cation; and public services and tra
tion.
The Corruption Perceptions Ind
more than 150 countries by their p
levels of corruption, as determined b
assessments and opinion surveys.
based on the following research initiatives
and methodology.
Stakeholder survey: The report is based on
a survey of 522 stakeholders spread across 25
cities, with approximately 20 interviews per
city**. The survey was conducted by Globe
Scan*** between September 28 and Novem-
ber 17, 2006, either face-to-face or by tele-
phone. Respondents include four stakeholder
groups: elected political leaders (Electeds);
employees of the municipality (Employees);
private-sector infrastructure providers, con-
struction company managers, and financiers(Privates); and people who are in roles that
influence infrastructure decision makers and
implementers such as thought leaders, acade-
mics, NGOs, and media (Influencers). Sixty-
nine percent of respondents have at least ten
years of experience in city infrastructure.
City diagnostics: MRC McLean Hazel under-
took an analysis of critical infrastructure sec-
tors in eight of the 25 cities covered by this
report.
The megacities studied were: Istanbul,
Turkey; Lagos, Nigeria; London, England;
Moscow, Russia; Mumbai, India; New York,
USA; Shanghai, China; and São Paulo, Brazil.
The project relied exclusively on secondary
data sources (ie. existing studies and data
sets).
A primary goal of the project was to devel-
op an understanding of the key functional
characteristics of the megacities on a sector-
by-sector basis, the level of service provided,critical challenges faced, solutions employed
to overcome these challenges, and important
barriers remaining to be overcome. Where
possible, MRC McLean Hazel’s research
focused on the entire metropolitan region;
where data availability issues preclude this
full metropolitan perspective, focus is given
to the core cities within the region.
Stakeholder survey
Electeds:100 (19%)
Privates:108 (21%)
Influencers:130 (25%)
Unweightedtotal:
522 (100%)
Public Employees:184 (35%)
12
*Based on methodology used in Megacities – Megarisks: Trends and challenges for insurance and risk management, Munich Re, 2004**The graphs in this report only display the most frequently mentioned factors and thus do not always add up to 100%***and various local partner companies