Megacities: Emissions, urban, regional and Global ...megapoli.dmi.dk/nlet/MEGAPOLI_NewsLet03.pdf ·...
14
NewsLetters of the FP7 EC MEGAPOLI Project 1 Issue 3, June 2009 Content 1 Editorial, Latest News EGU-2009 and AQ7-2009 2 MEGAPOLI Paris Campaign 3 French Mobile Observatory 4 Car Based and Satellite Observations for Megacities 5 Regional and Continental Aerosol Sources in Paris 6 Morphology Database 7 Question of Scale: LES in Urban Research 8 International Urban Energy Balance Model Comparison 9 LES with Nudging to Mean Observed MeteoProfiles 10 Megacity Initiative: Local and Global Research Observations (MILAGRO) 11 Risk-Habitat-Megacity 12 COST Action ES0602 CWF 13 NASA Monitoring Urbanization in China 14 MEGAPOLI Project Office Coming Presentations, Publications, Conferences Latest News Coming soon – Jul 2009 – Paris Plume Study (WP3) – measurement campaign in the Paris metropolitan area and surroundings 19-24 Apr 2009 – special session on "Megacity Impacts on Regional and Global Scales" and Meetings (CityZen, MEGAPOLI, MILAGRO participants) at the European Geosciences Union General Assembly (EGU-2009), Vienna, Austria; joint MEGAPOLI and CityZen meeting and discussions 7-8 Apr 2009 – WP3: Megacity Plume Study - campaign planning meeting in Paris, France - discussions among participants about chemical and meteorological measurements, lidars, remote sensing, mobile ground based platforms, etc. practical involvement of other French research teams and authorities (AirParif) 24-27 Mar 2009 – MEGAPOLI special session organized in cooperation with the MEGAPOLI, CityZen, EUCAARI, COST-728 - "Air Quality and Climate/ Meteorology Interactions and Feedbacks" and the MEGAPOLI Modelling Teams meeting at the 7th International Conference on Air Quality - Science and Application, Istanbul, Turkey Welcome to the third issue of the Newsletter Editorial The MEGAPOLI consortium is pleased to present the 3rd issue of the MEGAPOLI Newsletter. Short contributions from Partners and Collaborators, as well as Research Teams introductions are given here. Details on the project progress can be found in public documents available at the project website (www.megapoli.info ). The purpose of the newsletters is to inform about activities, progress, and achievements of the MEGAPOLI project as well as to establish a dynamic communication link with the Partners, Collaborators, and Users Community, to monitor the project activities and to exchange input and experiences. For these reasons your contributions to newsletters and news at the web-site as well as comments are always welcome (send to [email protected]). June 2009 Issue: 3 M egacities: E missions, urban, regional and G lobal A tmospheric POL lution and climate effects, and I ntegrated tools for assessment and mitigation EGU-2009 (Apr 2009, Vienna, Austria) MILAGRO/ MEGAPOLI/ CityZen special session and Meetings (MEGAPOLI and CityZen participants) during the European Geosciences Union Assembly: Special Session on "Megacity Impacts on Regional and Global Scales"; joint meeting with the MEGAPOLI-CityZen projects participants; CityZen and MEGAPOLI Projects presentations; discussions on IGAC-sponsored "Assessment on Impacts of Mega-cities on Air Quality and Climate: Outline and Activities"; discussion of possible collaboration with NOAA on WP1 and WP8 for emission datasets; discussions on joint session (for EGU-2010) with contributions from the MEGAPOLI, CityZen, and MILAGRO projects with presentations by continents (e.g. Europe, America, Asia, and other); as well 2nd splinter meeting between the MEGAPOLI and CityZen projects will be organized. AQ7-2009 (Mar 2009, Istanbul, Turkey) Additionally to MEGAPOLI, CityZen, EUCAARI, COST-728 special session and MEGAPOLI modelling teams meetings during the 7th International Conference on Air Quality, partners and collaborators had short working meetings on the following research topics: Po Valley focus group; Istanbul megacity study group; Up-scaling (from city to regional and to global scales) modelling; Two-way nesting for street- and city scales; Paris datasets (emission, land-use, monitoring, modelling) and experiment plans; Meteo-measurements for the Paris plume study; Remote sensing and data assimilation; Integrated modelling; Air pollution and ecosystem impact indexes; Urban planning and future scenarios; TNO emission inventory for MEGAPOLI. Theme FP7-ENV-2007.1.1.2.1: Megacities and regional hot-spots air quality and climate MEGAPOLI-NL03-09-06
Transcript of Megacities: Emissions, urban, regional and Global ...megapoli.dmi.dk/nlet/MEGAPOLI_NewsLet03.pdf ·...

NewsLetters of the FP7 EC MEGAPOLI Project
1 Issue 3, June 2009
Content
1 Editorial, Latest News
EGU-2009 and AQ7-2009
2 MEGAPOLI Paris Campaign
3 French Mobile Observatory
4 Car Based and Satellite Observations for Megacities
5 Regional and Continental Aerosol Sources in Paris
6 Morphology Database
7 Question of Scale: LES in Urban Research
8 International Urban Energy Balance Model Comparison
9 LES with Nudging to Mean Observed MeteoProfiles
10 Megacity Initiative: Local and Global Research Observations (MILAGRO)
11 Risk-Habitat-Megacity
12 COST Action ES0602 CWF
13 NASA Monitoring Urbanization in China
14 MEGAPOLI Project Office Coming Presentations, Publications, Conferences
Latest News Coming soon – Jul 2009 – Paris Plume Study (WP3) – measurement campaign in the
Paris metropolitan area and surroundings
19-24 Apr 2009 – special session on "Megacity Impacts on Regional and Global Scales" and Meetings (CityZen, MEGAPOLI, MILAGRO participants) at the European Geosciences Union General Assembly (EGU-2009), Vienna, Austria; joint MEGAPOLI and CityZen meeting and discussions
7-8 Apr 2009 – WP3: Megacity Plume Study - campaign planning meeting in Paris, France - discussions among participants about chemical and meteorological measurements, lidars, remote sensing, mobile ground based platforms, etc. practical involvement of other French research teams and authorities (AirParif)
24-27 Mar 2009 – MEGAPOLI special session organized in cooperation with the MEGAPOLI, CityZen, EUCAARI, COST-728 - "Air Quality and Climate/ Meteorology Interactions and Feedbacks" and the MEGAPOLI Modelling Teams meeting at the 7th International Conference on Air Quality - Science and Application, Istanbul, Turkey
Welcome to the third issue of the Newsletter
Editorial
The MEGAPOLI consortium is pleased to present the 3rd issue of the MEGAPOLI Newsletter. Short contributions from Partners and Collaborators, as well as Research Teams introductions are given here. Details on the project progress can be found in public documents available at the project website (www.megapoli.info). The purpose of the newsletters is to inform about activities, progress, and achievements of the MEGAPOLI project as well as to establish a dynamic communication link with the Partners, Collaborators, and Users Community, to monitor the project activities and to exchange input and experiences. For these reasons your contributions to newsletters and news at the web-site as well as comments are always welcome (send to [email protected]).
June 2009 Issue: 3
Megacities: Emissions, urban, regional and Global Atmospheric POLlution and climate effects, and Integrated tools for assessment and mitigation
EGU-2009 (Apr 2009, Vienna, Austria)
MILAGRO/ MEGAPOLI/ CityZen special session and Meetings (MEGAPOLI and CityZen participants) during the European Geosciences Union Assembly:
Special Session on "Megacity Impacts on Regional and Global Scales"; joint meeting with the MEGAPOLI-CityZen projects participants; CityZen and MEGAPOLI Projects presentations; discussions on IGAC-sponsored "Assessment on Impacts of Mega-cities on Air Quality and Climate: Outline and Activities"; discussion of possible collaboration with NOAA on WP1 and WP8 for emission datasets; discussions on joint session (for EGU-2010) with contributions from the MEGAPOLI, CityZen, and MILAGRO projects with presentations by continents (e.g. Europe, America, Asia, and other); as well 2nd splinter meeting between the MEGAPOLI and CityZen projects will be organized.
AQ7-2009 (Mar 2009, Istanbul, Turkey)
Additionally to MEGAPOLI, CityZen, EUCAARI, COST-728 special session and MEGAPOLI modelling teams meetings during the 7th International Conference on Air Quality, partners and collaborators had short working meetings on the following research topics:
Po Valley focus group; Istanbul megacity study group; Up-scaling (from city to regional and to global scales) modelling; Two-way nesting for street- and city scales; Paris datasets (emission, land-use, monitoring, modelling) and experiment plans; Meteo-measurements for the Paris plume study; Remote sensing and data assimilation; Integrated modelling; Air pollution and ecosystem impact indexes; Urban planning and future scenarios; TNO emission inventory for MEGAPOLI.
Theme FP7-ENV-2007.1.1.2.1: Megacities and regional hot-spots air quality and climate
MEGAPOLI-NL03-09-06

NewsLetters of the FP7 EU MEGAPOLI Project
2 Issue 3, June 2009
Two one month campaigns are scheduled in July 2009 and in January/February 2010.
Figure2. Example of flight plan with the French ATR-42 aircraft in the
western sector. Flights will be performed at about 500 to 800 m altitude during afternoon. Similar flight plans are made for 5 other
sectors.
A very large suite of state of the art instruments will be set-up during the campaign (see Table 1), allowing for fast measurement of aerosol chemical composition and physico-chemical properties, and of related precursor gas concentrations. Conjunct airborne and ground based measurements of the chemical SOA composition and of (oxidised) VOC will offer the opportunity to document gas phase aerosol interaction at various stages of the aging of polluted air masses.
In addition, the modification of optical and hygroscopic parameters during plume aging will be addressed. Data from these campaigns will allow for a detailed assessment, for one case study, of how megacity emissions impact on air quality, regional scale atmospheric composition and regional climate. They will also allow for in depth model evaluation and improvement.
Table 1. List of instruments for gas and aerosol phase measurements to be deployed during the 2 intensive field experiments
(summer/winter).
MEGAPOLI Campaign in the Paris Region during Summer 2009 and Winter 2009/2010
M. Beekmann (1), U. Baltensperger (2), A. Borbon (1), J. Sciare, V. Gros (3), and the MEGAPOLI Paris- campaign team (4)
(1) Laboratoire InterUniversitaire des Systèmes Atmosphériques (LISA), Université Paris Est et 7, CNRS, Créteil, France, (2) Paul Scherrer Institut, Villingen, Switzerland, (3) Laboratoire des Sciences du Climat et de l’Environnement (LSCE), Gif sur Yvette, France, the MEGAPOLI Paris-campaign team : L. Gomes, P. Tulet (Game-CNRM), A. Wiedensohler A. Held, W. Birmli (IfT), P. Laj, K. Sellegri, A. Schwarzenbock (LaMP), J.L. Jaffrezo (LGGE), A. Colomb, I. Coll, F. Doussin, H. Mac Leod, Q. Zhang*(LISA), P. Chazette (LSCE), S. Borrmann (MPIC), P. DiCarlo, A. Prevot, E. Weingartner, (PSI), M. Kulmala, (Univ. Helsinki), S. Pandis (Univ. Patras), Ph. Lameloise, O. Sanchez, A. Kauffman, H. Marfaing, V. Ghersi, C. Honoré (AIRPARIF), S. Kukui, F. Ravetta (LATMOS), Y. Le Moullec (LHVP), M. Haeffelin (LMD), * also ARIA-Technologie.
Within the frame of the FP7 MEGAPOLI project, an intensive measurement campaign will be set up in the Paris region during 2009and 2010. The general objective is to better quantify primary and secondary aerosol sources in a large urban agglomeration and in its plume. A particular focus will be put on the build-up of secondary organic aerosol and its relation to precursor gases. A ground based segment with observations at an urban (Laboratoire de l’Hygiene de la Ville de Paris) and a suburban site (IPSL/SIRTA) during one summer and winter month will allow for documenting the aerosol composition and properties, and their variability, near primary emission sources, and likewise in air masses entering or leaving the agglomeration (Figure 1).
Figure1. Location of primary (fully equipped) urban (LHVP) and peri-
urban (SIRTA) measurement sites for the campaign, Secondary sites at Jissieu and Créteil will host spectroscopic and lidar measurements. For mobile platforms will be deployed for in-situ aerosol measurements,
MAXDOAS and aerosol lidar measurements .
An airborne segment with dedicated flights with the French ATR-42 aircraft in the Paris plume during one summer month will permit documenting the evolution of the megacity plume (Figure 2). In addition to the observations funded within MEGAPOLI, several mobile laboratories (from PSI and MPIC) will allow aerosol and gas phase characterisation at various locations in the region (upwind of the agglomeration, within the plume). Aerosol backscatter measurements at three fixed locations and from one mobile platform will give information on the vertical aerosol distribution and on spatio-temporal variations of the boundary layer height. Meteorological and dynamical parameter measurements (wind, temperature, turbulence.) will also be performed at the peri-urban IPSL-SIRTA site.
Matthias Beekmann
E-mail: [email protected] Laboratory Inter-universitaire des Systèmes Atmosphériques (LISA), Centre National de Recherche Scientifique (CNRS) http://www.univ-paris12.fr/7583UMR /0/fiche___laboratoire/

NewsLetters of the FP7 EC MEGAPOLI Project
3 Issue 3, June 2009
biomass burning aerosols (from 1 to 3.2 km agl) and desert dust (at 3.5 km agl). Their interactions are illustrated at 2100 h when the biomass burning plume subsides down to the ABL and produces a significant increase in the surface black carbon concentration.
Figure 1. Muli-wavelength Lidar observations: attenuated backscatter βatt at 532 nm and the surface black carbon concentration (in red and white points), in the Paris region (48.7°N 2.2°E) on May 26th 2005.
In 2006, ATMOS contributed to the AMMA “African Monsoon Multidisciplinary Analysis”, in Tamanrasset and in Niamey for observing the aerosols and the atmospheric boundary layer in the Sahara [Cuesta et al., 2008] and in the Sahel [Chazette et al., 2007]. It documented for the first time the development of the Saharan convective boundary layer which gains steadily ~1 km per hour during summer until nearly 6 km agl at 1300 UTC (see example of Fig. 2). In the afternoon, a continuous cumulus cloud deck typically formed with vertical recirculation depicted by the alternating occurrence of virga and dust updrafts from the surface (between 1600 UTC and 1830 UTC).
Figure 2. Mini-Lidar observations in Tamanrasset (22.8° N 5.5° E 1370
m) on June 25th 2006. White curves correspond to radiosounding potential temperature profiles
In 2007, ATMOS was deployed for the COPS “Convectively and Orographycally driven Precipitation Study” in the Rhin Valley and the validation of the spatial mission CALIPSO.
Upcoming Field Campaigns In the coming years, ATMOS will be deployed i) in the Paris Megacity, in the framework of MEGAPOLI (2009-2010), ii) in southern France for the Chemistry-Aerosol Mediterranean Experiment CHARMEX (2011-2012) and iii) the validation of ADM-Aeolus in 2010-2011 and Earth-Care in 2012. References Chazette, P., Sanak, J., and Dulac, F., 2007: New approach for aerosol
profiling with a lidar onboard an ultralight aircraft: application to the African Monsoon Multidisciplinary Analysis, Environmental Sciences and Technologies, 41, 8335-8341.
Cuesta, J., et al., 2008: Multi-platform observations of the seasonal evolution of the Saharan atmospheric boundary layer in Tamanrasset, Algeria, in the framework the African Monsoon Multidisciplinary Analysis field campaign, J. Geophys. Res., 113, D00C07, doi:10.1029/2007JD009417.
Raut, J.-C., and Chazette, P., 2007: Retrieval of aerosol complex refractive index from a synergy between lidar, sunphotometer and in situ measurements during LISAIR experiment, Atmos. Chem. Phys., 7, 2797-2815.
French Mobile Observatory of Atmospheric Physico-Chemical Processes and Climate
Juan Cuesta1,2, Patrick Chazette1,3, Pierre Flamant1, Bernard Bonsang3, Dimitri Edouart1, Laetitia Estevan1, Fabien Gibert1, Valérie Gros3, Fabien Marnas1, Jean-Christophe Raut1,3, Joseph Sanak3 and Cyrille Flamant2
1 LMD/IPSL-CNRS, Ecole Polytechnique, 91128 Palaiseau, France, 2 LATMOS/IPSL, 4 Place Jussieu, 75252 Paris, France 3 LSCE/IPSL, CEA-CNRS-UVSQ, F-91191 Gif-sur-Yvette, France E-mail of Presenting Author: [email protected] Institut Pierre Simon Laplace, LMD-LATMOS / CNRS http://www.ipsl.jussieu.fr/ http://admweb.lmd.polytechnique.fr/LiMAG/ The ATMOS Mobile Observatory A new ATmospheric Mobile ObServatory, so called “ATMOS”, has been developed by the LiMAG “Lidar, Meteorology and Geophysics” team of the Institut Pierre Simon Laplace (IPSL) in France, in order to contribute to international field campaigns for studying atmospheric physico-chemistry, air quality and climate (i.e. aerosols, clouds, trace gazes, atmospheric dynamics and energy budget) and the ground-based validation of satellite observations. The deployment of ATMOS is an essential for complementing the fixed sites and a potential alternative of airborne platforms. Instrumental Payload ATMOS payload is modular, accounting for the different platforms, instruments and measuring techniques. It comprises both the remote sensing platform MOBILIS (“Moyens mOBIles de téLédetection de l’IPSL”) and the in-situ physico-chemical station SAMMO (“Station Aérosols et chiMie MObile”). MOBILIS is an autonomous and high-performance system constituted by a full set of active and passive remote sensing instrumentation (i.e. Lidars and radiometers), whose payload may be adapted for either i) long term fixed monitoring in a maritime container or a shelter [Cuesta et al., 2008], ii) ground-based transect observation onboard a small car and ii) an airborne deployment in an ultra-light airplane (ULA) [Chazette et al., 2007]. SAMMO is a fully equipped in-situ sensor payload, oriented to pollution monitoring (i.e. particles and trace gazes), onboard a truck. International Field Campaigns and Observations ATMOS has been first deployed in the framework of LISAIR “Lidar pour la Surveillance de la qualité de l’AIR” [Raut and Chazette, 2007], for monitoring air quality in 2005. The platform enabled the characterization of local anthropogenic aerosols in the atmospheric boundary layer (ABL, up to 1 km above ground level agl in the example of Figure 1) and the long range transport overflowing the Paris region in the free troposphere of

NewsLetters of the FP7 EC MEGAPOLI Project
4 Issue 3, June 2009
At second, from MAX-DOAS observations, the vertically integrated trace tropospheric gas concentration above the instrument can be determined. These observations are used to validate the satellite observations. In addition, by making measurements in circles around large emission sources, the total emissions of these sources can be quantified.
If MAX-DOAS (Figure 2) observations are performed from moving platforms, also integration along the driving route can be performed. Together with information on wind speed and direction, this allows to determine the complete trace gas flux through the plane above the route. If emission sources are encircled, even the complete trace gas emission of the sources can be determined.
Figure 2. Mini Max-Doas Instrument. Spectral range: 310-461 nm.
For the Paris campaign within the MEGAPOLI project in July 2009 we plan to encircle Paris on ring roads of different diameter. This will allow determining the emissions of different parts of the city.
Wind direction
Wind direction
Figure 3. Retrieved tropospheric NO2 VCD during one circle around Ludwigshafen-Mannheim. High values are observed downwind of strong
sources like large chemical complex (BASF) (Ibrahim, 2009).
References Shaiganfar R., O. Ibrahim, S. Beirle, and T. Wagner (2009): Combined
Use of Car Based and Satellite Observations for Characterization and Quantification of Large Emission Sources Like Megacities, EGU2009-5307 , Poster Presentation
Beirle, S., (2004): Estimating source strengths and lifetime of Nitrogen Oxides from satellite data, Heidelberg, Univ., Diss.
Hönninger, G., von Friedeburg, C., and Platt, U. (2004): Multi axis differential optical absorption spectroscopy (MAX-DOAS), Atmos. Chem. Phys., 4, 231-254.
Ibrahim, O. (2009): Applications on ground-based tropospheric measurements using multi-axis differential optical absorption spectroscopy, Heidelberg, Univ., Diss.
Combined Use of Car Based and Satellite Observations for Characterization and
Quantification of Large Emission Sources Like Megacities
Reza Shaiganfar 1, Steffen Beirle 1, Ossama Ibrahim 1, Ulrich Platt ², Thomas Wagner 1 1 Max Planck Institute for Chemistry, Mainz, Germany 2 Institute for Enviromental Physics, University of Heidelberg, Germany E-mail: [email protected] http://www.mpch-mainz.mpg.de/satellite
Megacities constitute important emission sources of atmospheric pollutants. These emissions affect not only the air quality in the urban areas but can also be transported over large distances. We aim to quantify megacity emissions in particular of NO2 using (a) satellite observations and (b) mobile based remote sensing instrumentation like Multi-AXis-(MAX-) DOAS mounted on a car. At first, the satellite observations show enhanced levels of pollutants over many megacities; by combining these observations with model simulations, the emissions can be quantified and existing emission inventories can be improved.
Figure 1. Average tropospheric NO2 VCD (2003-2007) [molec/cm²] of cloud free, from SCIAMACHY on ENVISAT.
Satellites provide long time series with global cover. In the Figure 1, the average tropospheric NO2 VCD over Europe is shown. Enhanced values are found over densely populated emission sources. We will analyze time series of tropospheric NO2 columns from SCIAMACHY, as well as from GOME2 and OMI, for various megacities.

NewsLetters of the FP7 EC MEGAPOLI Project
5 Issue 3, June 2009
This time-resolved dataset of carbonaceous aerosols (EC+POM) and inorganic salts (ions) are reported in Figure 2.
Figure 2. Temporal variations of PM2.5, Carbonaceous (EC+POM) aerosols, and inorganic salts (ammonium, nitrate, sulphate).
This allowed investigating the factors controlling the levels of PM2.5 and showed that polluted periods with PM2.5 > 40µg/m3 were characterized by air masses of continental (European) origin and chemical composition made by 75% of ions (periods I and III, see Figure 2). By contrast, clean marine air masses have shown the lowest PM2.5 concentrations (typically of about 10 µg/m3); carbonaceous aerosols contributed for most of this mass, i.e. typically 75% (period II, see Figure 2). The rather stable levels of carbonaceous aerosols observed during this study suggest that the region of Paris is a major contributor to this fraction. By opposite, long-range transport from European continent is proposed as the main contributor for ions measured in Paris during springtime. All these conclusions are supported by modelling results performed with the CHIMERE model (Q. Zhang, M. Beekmann, and co-workers; Sciare et al., 2009). This model is a multi-scale model primarily designed to produce daily forecasts of ozone, aerosols and other pollutants and make long-term simulation (http://www.lmd.polytechnique.fr/chimere/). The use of artefact-free measurements of PM2.5 made by TEOM-FDMS has shown here to amplify the contrast between periods with low (respectively high) PM2.5 concentrations. Although carbonaceous aerosols showed to be mainly produced at regional scale, our results also suggest that almost 2/3 of organic carbon measured in Paris is of secondary origin, pointing out the high reactivity of organic aerosols and gas precursors, in the few hours following their formation and/or transformation.
References Sciare, J., O. d’Argouges, Q. Zhang, M. Beekmann, R. Sarda-Estève, C.
Gaimoz, and V. Gros, (2009): Investigating regional and continental aerosol sources of PM2.5 in France (France) during springtime, Atmospheric Chemistry and Physics, submitted.
Sciare J., O. D'Argouges, R. Sarda-Estève, C. Gaimoz, and V. Gros (2009): Investigating regional and continental aerosol sources of PM2.5 in Paris (France) during springtime from fast chemical measurements. EGU2009-1746
Investigating Regional and Continental Aerosol Sources of PM2.5 in Paris (France)
Sciare, J., O. d’Argouges, R. Sarda-Estève, C. Gaimoz, and V. Gros Laboratoire des Sciences du Climat et de l’Environnement (LSCE), CNRS-CEA, Gif/Yvette, France E-mail: [email protected] Laboratoire des Sciences du Climat et de l’Environnement (LSCE), CNRS-CEA, Gif/Yvette, Franc. http://www.lsce.ipsl.fr
Hourly concentrations of inorganic salts (ions) and carbonaceous material in fine aerosols (aerodynamic diameter, A.D. < 2.5 µm) have been determined from fast measurements performed for a 3-week period in spring 2007 in Paris (France). The sum of these two chemical components (ions and carbonaceous aerosols) has shown to account for most of the fine aerosol mass (PM2.5). The reconstruction of PM2.5 from chemical measurements is illustrated in Figure 1.
PM2.5 (TEOM-FDMS) = 0.93 x PM2.5 (CHEMISTRY) - 1.67R2 = 0.96; N = 418
0
10
20
30
40
50
60
70
0 10 20 30 40 50 60 70
PM2.5 (TEOM-FDMS), µg/m3
PM2.
5(C
HEM
ISTR
Y), µ
g/m
3
PM2.5 (TEOM-FDMS) = 0.93 x PM2.5 (CHEMISTRY) - 1.67R2 = 0.96; N = 418
0
10
20
30
40
50
60
70
0 10 20 30 40 50 60 70
PM2.5 (TEOM-FDMS), µg/m3
PM2.
5(C
HEM
ISTR
Y), µ
g/m
3
Figure 1. Reconstruction of fine aerosol mass (PM2.5) from hourly
chemical measurements.

NewsLetters of the FP7 EC MEGAPOLI Project
6 Issue 3, June 2009
Three of them are shown below (streets, blocks and trees) from the Paris fine resolution test area.
Database is created using optical images, street maps and SAR interferometry. Optical images and street maps are acquired from public sources in the internet (Google Maps, Microsoft Virtual Earth etc.). SAR images are obtained by European Space Agency’s ENVISAT ASAR instrument. The DEM of Paris area was acquired from NASAs Shuttle Radar Topography Mission (SRTM).
We extracted streets, parks and water bodies from street maps. This is done simply by manipulating colour histograms. Optical images are used to extract buildings and trees using supervised classification. In supervised classification samples are collected to represent classes. These classes represent the whole spectrum of that image and they are named after what they represent, e.g. roofs, roads, water, trees, grass etc. After the selection classified image is computed. In this case buildings and trees are extracted from the optical image. Classified images are masked using thematic road, park and water maps to avoid misinterpretation, e.g. some roofs and pavement have similar spectrum. After masking, images are filtered for noise reduction. Fine tuning of supervised classification process is time consuming because of potential misinterpretation.
Interferometric SAR images provide information regarding height and coherence. Topographic elevation model is acquired from the SRTM database. Envisat SAR is used to explore the possibility to derive building height using SAR interferometry. Additionally, interferometric coherence is used to estimate variance in building height thus providing a coarse height of building.
All thematic layers are combined to unified morphological database which can be used in the modelling of urban micro-meteorology and dispersion.
References Luckman, A.; Grey, W., (2003): "Urban building height variance from
multibaseline ERS coherence," Geoscience and Remote Sensing, IEEE Transactions on, vol.41, no.9, pp. 2022-2025, Sept. 2003 URL: http://ieeexplore.ieee.org/stamp/stamp.jsp?arnumber=1232216&isnumber=27602
Morphology Database: How It Is Created
Pauli Sievinen 1, Jaan Praks 1, Antti Hellsten 2, Jarkko Koskinen 2, and Jaakko Kukkonen 2 [1] Helsinki University of Technology, Department of Radio Science and
Engineering, http://radio.tkk.fi/en/ [2] Finnish Meteorological Institute, http://www.fmi.fi The transport of momentum, heat and pollutants over urban areas take place within a layer known as atmospheric boundary layer (ABL), also known as the mixed layer. The mixing properties of the ABL depend strongly on the ground-air interactions, and thus on the surface morphology. Computational Fluid Dynamics (CFD) models of various degree of description of involved physical processes are used in studies of the ABL processes over urban areas.
In large-scale models the surface morphology is typically modelled by means of simple scalar measures of surface roughness such as the roughness length. This is a highly simplified approach and cannot provide new insight into the details of the ground-air interaction processes taking place in the lowest part of urban ABL, the roughness layer. To understand these processes and to assess and further develop better simplified models for them, so called obstacle resolving numerical simulations are needed. This means that a morphology model of the urban area must be created.
In this project, morphology models for Paris are developed. In the present work, we decided to create a fine-resolution model covering a rectangular area in central or southern central Paris with Place d'Italie in the centre point of the rectangle. The rest of Paris will be in coarser resolution. We included most blocks, streets, squares, parks, water-areas and trees in this fine-resolution model. From the CFD-point of view, the blocks and buildings form the most important part of the morphology data. The ground projections of the blocks and buildings can be obtained with 1 meter resolution, but the variation of the building height within a block, and the roof shapes are difficult to handle with same accuracy. Hence a flat roof assumption.
The quickest way to gather city morphology related information over wide areas is remote sensing. Remote sensing provides variety of space borne and airborne instruments, capable to measure different properties of the target. Optical images can provide high resolution classification of land use, Synthetic Aperture Radar (SAR) interferometry can provide terrain elevation models, infrared sensors measure heat flux etc. In this project, several remote sensing instruments and several image analysis methods are combined in order to produce a morphology database of the study area.
Database consists of following layers: water, trees and vegetation, streets, roads and railroads, buildings and average block heights, digital elevation model (DEM).
Pauli Sievinen E-mail: [email protected] Helsinki University of Technology/ Department of Radio Science and Engineering http://radio.tkk.fi/en/

NewsLetters of the FP7 EC MEGAPOLI Project
7 Issue 3, June 2009
LES as an Instrument for Urban Research LES are well established tool in the PBL research. Nevertheless, to establish LES in the urban research, one ought to overcome at least two difficulties. First, a data assimilation technique must be introduced to nudge the simulated profiles to observed mean profiles of meteorological quantities/concentrations without the loss of consistency in the simulated turbulent fluctuations and secondary flows. Fortunately, for high Re 3D turbulent fields, the downscale energy cascade and turbulence diffusion dominate. Thus, the mean wind and temperature measured in few points provide severe constrains on the simulated turbulent fields. To narrow constrains, the method of artificial neural network could be used. The idea is that the surface heterogeneity and emission sources do not change their location and therefore introduce phase-locked perturbations into the turbulent fields. More Detailed isn’t More Optimal Obviously, the urban features depend heavily on the urban relief. Street canyon experiments revealed the mesh with at least 4 to 8 nodes per cube placed in the turbulent flow is required. Thus, a straightforward approximation of the urban relief is not an option for the megacity LES. The blending height approach may help for low built areas. More prospective approach has been proposed in oceanography (Wunsch et al.). It use functional cost minimization to obtain the approximate resolved-scale urban relief as the surface where the LES produce the most realistic turbulent flow. Urban PBL – Part of the Earth’s Climate System Having the proper turbulence dynamics, the data assimilation and the urban relief treatment in place, the LES would be ready to answer the scientific questions on the material of specific urban campaigns, and hopefully for further theoretical generalizations. In particular, it is expected to quantify how megacities affect air quality and the transport and transformation rates of the major air pollutants from their scattered local sources to regional mesh scales (Q2 and Q3). Perhaps the least developed problem is the PBL-feedback mechanisms in megacities (Q8). It is trivial to notice that the change of meteorological conditions result in changes in the PBL and therefore in the megacity impact. It is less trivial to recognize that the response is strongly asymmetrical and scale differential. The local conditions will experience the strongest changes under stably stratified PBL where the pollutants, aerosols, and to some degree heat and moisture are trapped in the urban sub-layer. If the megacity climate change favors the increasing stability conditions, the local megacity impact, including hazardous near-surface concentrations, will increase. If the convective conditions favored, the opposite effect, i.e. the regional- to global impact will increase. At least in theory, those feedbacks can be rationally manipulated via landscape planning.
Figure 2. The effect of the resolved interactions between secondary flow and turbulence field. Insertions show 3D mean flow structure
corresponding to certain aspect ratio of horizontal heterogeneity and PBL depth scales (unpublished analysis; Esau, 2007).
References Esau, I., (2007): Amplification of turbulent exchange over wide Arctic
leads: Large-eddy simulation study. J. Geophys. Res., 112, D08109 Cuxart, J. et al., (2006): Single-Column Model Intercomparison for a
Stably Stratified Atmospheric Boundary Layer, Boundary-Layer Meteorol., 118(2), 273.
The Question of Scale: Large Eddy Simulation in Urban Research
Introduction Cities are interesting for an atmospheric physicist and modeller as “hot-spots” of anthropogenic impact on the Earth’s system. The impact is measurable through a number of physical (the surface heat/moisture balance), chemical (urban emissions), and dynamical (surface roughness) effects. Strong heterogeneity and patchiness of the urban features on relatively small scales introduces formidable difficulties into urban research. Meteorological models resolve only a limited interval of scales and that interval usually misrepresents the natural scales of emissions and dynamically related meteorological phenomena. This is illustrated on a sketch in Fig.1. Large-eddy simulations (LES) is a potent technique to resolve critical turbulent dynamics and thus to link small- and large (regional)-scale atmospheric processes. Important feedbacks (Objectives 1, 2) are observed between turbulent motions and non-turbulent phenomena, e.g. street canyon effects and aerosol inhibition of urban cloudiness just to mention a few of them. In the project proposal, we suggested that the LES may serve as key, flexible and inexpensive instrument to investigate those feedbacks.
Figure 1. Schematic representation of urban relief on large- and fine-scale model meshes. At any feasible mesh, the relief and surface features
remain to be under-resolved as building to PBL scale ration 1:500 is currently can be resolved only in street canyon models but not on the
megacity scales.
Heterogeneity as Modified Homogeneity At present, the most popular approaches consider heterogeneous planetary boundary layer (PBL), as a special case of the homogeneous PBL. Two, not necessary excluding, approaches exist. The blending height approach defines a minimal mixing scale at which the traditional homogeneous parameterizations are still applicable. It is particularly useful under strong wind conditions and for relatively small heterogeneities. The mosaic PBL approach defines a minimal spatial scale at which the surface could be represented as a mosaic of independent homogeneous conditions. It is particularly useful under weak wind conditions and for relatively large patches of surface heterogeneities. The approaches require monotonic, but not necessary linear, modification of the transport and mixing properties from the homogeneous state, which is usually also determined incorrectly (Cuxart et al., 2006), to the state of no mixing. E.g. the flux-mosaic method gives the total flux A (see Fig.1) as a weighed sum of fluxes A1 (green area) and A2 (urban area).
Resonance-Like Response on Heterogeneity The abovementioned approaches are widely used in models but generally speaking they are incorrect (Pielke et al. and others). The heterogeneity creates secondary circulations. Those circulations are produced by the horizontal pressure gradients (Esau, 2007), omitted in homogeneous PBL. It has been overlooked however that the secondary circulations interact with large-scale turbulence, which is represented by convective cells (slow wind conditions) or rolls (strong wind conditions). Fig.2 shows the effect of these interactions over the heterogeneously heated terrain. In this case, the heterogeneity is created by the open water leads in the sea ice surface with the horizontal temperature difference of 8K. The interactions on the PBL depth scale can enhance the fluxes by several times.
Igor Esau E-mail: [email protected] Nansen Environmental and Remote Sensing Center and Bjerknes Centre for Climate Research http://www.nersc.no/
NewsLetters of the FP7 EC MEGAPOLI Project
8 Issue 3, June 2009
To assist in comparing the models, each was classified based on a number of characteristics including their modelling of vegetation, anthropogenic heat fluxes and the urban morphology, the facets and orientation assumed, number of urban canopy reflections, albedo and emissivity assumptions and handling of the storage heat flux.
In spite of participants being aware of the observations their models would ideally output, the relative performance of each model was found to vary significantly. This variability, assessed in terms of the root mean squared error (rmse) when compared with observed data, depended on: the specific fluxes being compared, the time period being examined (i.e. day-time, night-time or the whole period) and/or the assumptions of the models themselves. Such variability, in terms of Q* for the entire period, is shown in Fig. 1.
Figure 1. Range of rmse values for the Q* flux for all 27 models involved. Models are identified by an anonymous, random number
known only to that particular participant.
Following the commencement of later phases of the project, modellers were given the opportunity to re-run their models for this initial phase, perhaps utilising model improvements they had made. The effect of this was significant, with rmse for the final model runs falling for all fluxes (Fig. 2). This result alone highlights the importance of this work as it has, in just one short phase, facilitated modellers in improving the performance of their models.
Figure 2. RMSE values (maximum, minimum and mean) for first and final runs, derived using all 27 models and for particular fluxes noted.
Other general observations from this phase include that the models have best overall capability to model Q*. Additionally, no model appeared to perform best or worst for all fluxes and performing well for one flux did not guarantee optimal performance for other fluxes.
It is important to stress that these results are based on the evaluation of a short time series and for one particular urban location. Later stages evaluate the same models but using a longer data set (Grimmond et al. 2009, in preparation).
References Grimmond, Blackett, et al. (2009): First Results from the International
Urban Energy Balance Model Comparison: Model Complexity, EGU2009-5713, Poster Presentation
Grimmond et al. (2009): in preparation. Henderson-Sellers, A., et al. (1993): BAMS, 74, 1335-1349. Voogt, J.A. and C.S.B. Grimmond, (2000): JAM, 39, 1679-1699.
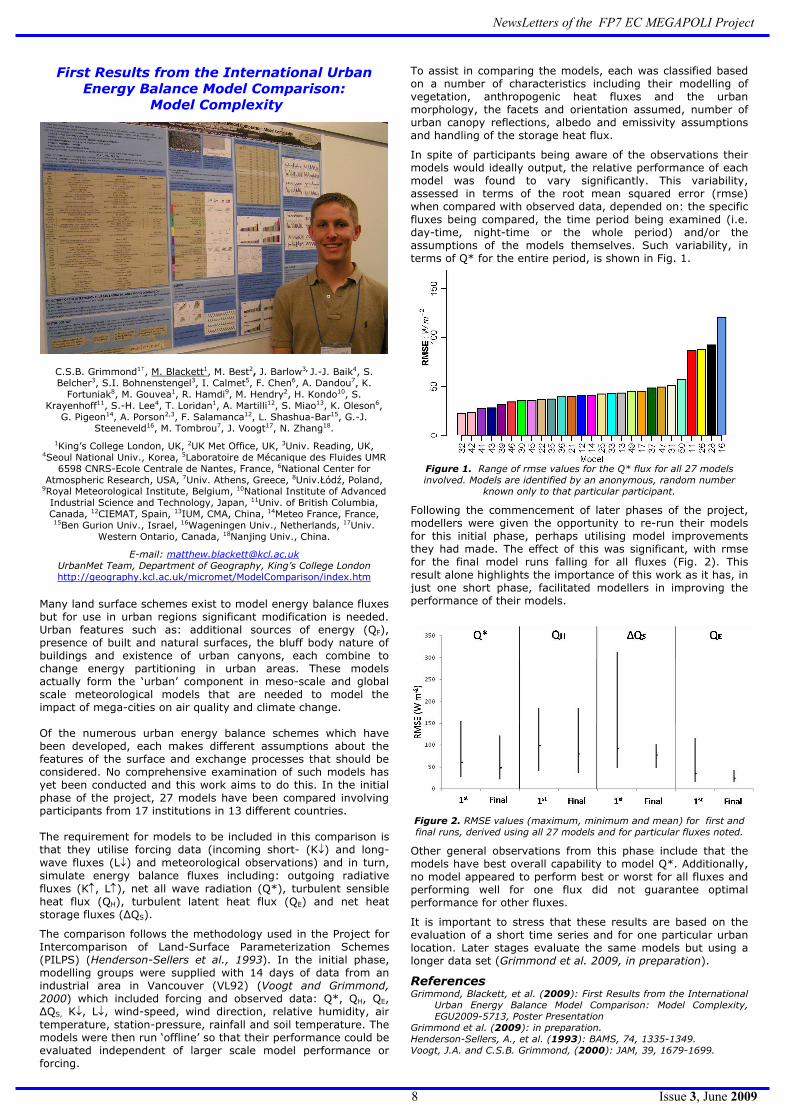
First Results from the International Urban Energy Balance Model Comparison:
Model Complexity
C.S.B. Grimmond1†, M. Blackett1, M. Best2, J. Barlow3, J.-J. Baik4, S. Belcher3, S.I. Bohnenstengel3, I. Calmet5, F. Chen6, A. Dandou7, K.
Fortuniak8, M. Gouvea1, R. Hamdi9, M. Hendry2, H. Kondo10, S. Krayenhoff11, S.-H. Lee4, T. Loridan1, A. Martilli12, S. Miao13, K. Oleson6,
G. Pigeon14, A. Porson2,3, F. Salamanca12, L. Shashua-Bar15, G.-J. Steeneveld16, M. Tombrou7, J. Voogt17, N. Zhang18.
1King’s College London, UK, 2UK Met Office, UK, 3Univ. Reading, UK,
4Seoul National Univ., Korea, 5Laboratoire de Mécanique des Fluides UMR 6598 CNRS-Ecole Centrale de Nantes, France, 6National Center for
Atmospheric Research, USA, 7Univ. Athens, Greece, 8Univ.Łódź, Poland, 9Royal Meteorological Institute, Belgium, 10National Institute of Advanced
Industrial Science and Technology, Japan, 11Univ. of British Columbia, Canada, 12CIEMAT, Spain, 13IUM, CMA, China, 14Meteo France, France,
15Ben Gurion Univ., Israel, 16Wageningen Univ., Netherlands, 17Univ. Western Ontario, Canada, 18Nanjing Univ., China.
E-mail: [email protected] UrbanMet Team, Department of Geography, King’s College London http://geography.kcl.ac.uk/micromet/ModelComparison/index.htm
Many land surface schemes exist to model energy balance fluxes but for use in urban regions significant modification is needed. Urban features such as: additional sources of energy (QF), presence of built and natural surfaces, the bluff body nature of buildings and existence of urban canyons, each combine to change energy partitioning in urban areas. These models actually form the ‘urban’ component in meso-scale and global scale meteorological models that are needed to model the impact of mega-cities on air quality and climate change. Of the numerous urban energy balance schemes which have been developed, each makes different assumptions about the features of the surface and exchange processes that should be considered. No comprehensive examination of such models has yet been conducted and this work aims to do this. In the initial phase of the project, 27 models have been compared involving participants from 17 institutions in 13 different countries. The requirement for models to be included in this comparison is that they utilise forcing data (incoming short- (K↓) and long-wave fluxes (L↓) and meteorological observations) and in turn, simulate energy balance fluxes including: outgoing radiative fluxes (K↑, L↑), net all wave radiation (Q*), turbulent sensible heat flux (QH), turbulent latent heat flux (QE) and net heat storage fluxes (ΔQS).
The comparison follows the methodology used in the Project for Intercomparison of Land-Surface Parameterization Schemes (PILPS) (Henderson-Sellers et al., 1993). In the initial phase, modelling groups were supplied with 14 days of data from an industrial area in Vancouver (VL92) (Voogt and Grimmond, 2000) which included forcing and observed data: Q*, QH, QE, ΔQS, K↓, L↓, wind-speed, wind direction, relative humidity, air temperature, station-pressure, rainfall and soil temperature. The models were then run ‘offline’ so that their performance could be evaluated independent of larger scale model performance or forcing.

NewsLetters of the FP7 EC MEGAPOLI Project
9 Issue 3, June 2009
Results Fig.2 presents the relative difference in the frequency spectrum of the horizontally averaged streamwise velocity, i.e. (CTR-NDG)/CTR. Generally, the difference is rather small, which reassures the proper turbulence recovery in the NDG run. However, certain damping at any height is found on lower frequencies corresponding to the longer scales. The damping is also observed above the PBL at any frequency. This is certainly due to elimination of the inertial oscillation in the flow and corresponding turbulence suppression. Nudging also pumps some energy at frequencies of the turbulence spectral maxima. It suggests that the nudging acts as a forcing for the energy cascade toward LS increasing available energy for the LS development. The profiles of 2nd order turbulent statistics are very similar in both NDG and CTL runs (not shown). However, the surface stress and integral turbulent kinetic energy are about 20% less in NDG than in CTL runs. One obvious problem is the distortion of the energy exchange between components of the horizontal stress. The components of the stress are free but those of the mean velocity are prescribed. This distortion is observed for any relaxation time scale significantly less than the inertial oscillation time scale and should be studied in more details.
Figure 2. Difference in the frequency spectrum of horizontally averaged streamwise velocity. Spectrum presented as altitude-
frequency plot of (CTR-NDG)/CTR (red – nudging damps energy; blue – nudging supplies energy)
Conclusions Nudging is a simple and robust method of the modelling with observational data assimilation. It has been used with LES in [1,2] but its impact on the turbulent energy cascade and statistics has not been clarified before. This work suggests that the simplest nudging is not suitable for the LES. It damps a broad spectral range of energy containing turbulence. It distorts turbulent fluxes in the lower PBL and effectively filters out turbulence in the upper PBL. The distortions are however rather small. So for some practical applications this type of nudging could be acceptable. Additional studies, not discussed here, suggest that the simplest nudging might work better in the stratified PBL where the scale separation between meso- and LS-scales is larger. Probably more selective nudging as in [3] may serve better for the data assimilation in the realistic LES.
References [1] Carrio, G., Cotton, W., & Zupanski, D., (2005), P1.4 AGU meeting [2] Cheng, W., Wu, T., & Cotton, W., (2001), J. Atmos. Sci., 58, 1017 [3] von Storch, H., et al., (2000), Mon. Wea. Rev., 128, 3664
Large-Eddy Simulation Experiments with Nudging to Observed Mean Meteorological Profiles
Igor Esau
E-mail: [email protected]
G.C. Rieber Climate Institute at the Nansen Environmental and Remote Sensing Center and Bjerknes Centre for Climate Research
http://www.nersc.no
Introduction Turbulent mixing in the planetary boundary layer (PBL) is organized in large-scale structures (LS) as seen in Fig.1 with scales (U~10 m/s; T~104 s; L~103 m) comparable to typical meso-meteorological scales. The LS dominate the PBL mixing as their eddy viscosity Km ~ UL ~ L2/T ~102 m2/s) is large relative to the Kolmogorov’s mixing Km ~ 1 m2/s. Thus, the observed meteorology in the PBL and the large-scale turbulence are inherently related. PBL simulations require recovery of LS consistent with observed mean profiles. This requirement dictates the need for turbulence-scale data assimilation.
Figure 1. LS in the PBL visualized by Cu hum (cloud streets) under
strong on-shore wind over west Sweden coast 5th April 2009.
Approach The data assimilation in LES (turbulence-resolving large-eddy simulation model) has been attempted in [1] for chemicals and aerosols and in [2] for dynamics. Variants of the Newtonian relaxation (nudging) method was used
as ( ) ( )LESobsctRHSdtd Φ−Φ+Φ=Φ −1)(/ , where Φ
is a meteorological variable (temperature or velocity), ct is the relaxation time scale, and the angular brackets denote the mean value. Nudging is essentially diffusive process distorting the turbulence energy cascade [3] in LES. This distortion is analysed in the study through comparison of two Ekman PBL LES runs. One (CTR) run is integrated without the nudging term. Another (NDG) run uses the mean profiles from CTR in assimilation.

NewsLetters of the FP7 EC MEGAPOLI Project
10 Issue 3, June 2009
on aircraft, and satellites that provided extensive measurements of gas and aerosol chemistry, aerosol microphysics and optics, radiation and meteorology [Molina et al., 2009]. Major findings are being published in two special issues of Atmospheric Chemistry and Physics as well as in other journals. http://www.atmos-chem-phys.net/special_issue21.html http://www.atmos-chem-phys.net/special_issue83.html
The MCMA motor vehicles produce abundant amounts of primary PM, elemental carbon, particle-bound polycyclic aromatic hydrocarbons, CO and a wide range of air toxics, including formaldehyde, acetaldehyde, benzene and toluene. Figure 2 compares the total annual emissions from light-duty gasoline vehicles estimated from fuel sales records and fuel-based emission factors obtained from on-road measurements during MILAGRO and available data from remote sensing measurements against the corresponding mobile emissions estimates in the 2006 official emissions inventory (sma.df.gob.mx). The comparison shows reasonable agreement for CO and NO, an overall underprediction of about 1.4 to 1.7 for VOCs and a factor of 4 for PM2.5 emissions from gasoline vehicles in the inventory with respect to the measurements.
Figure 2. Evaluation of the mobile emissions inventory. (From Zavala
et al., Atmos. Chem. Phys. Discuss., 9, 6363-6395, 2009.)
High concentrations of aerosol particles were observed both at ground sites and from aircraft and found to compose in large part of organics, but black carbon, crustal matter, sulfate and nitrate were also significant contributors. Figure 3 shows the average submicron PM composition within the MCMA basin during 2006. Biomass burning (agricultural, forest, wood cooking, trash burning) also contributes to the urban and regional pollution in the Mexico Basin. The response of urban O3 to precursors VOCs and NOx remains a topic of interest. Both measurements and chemical transport model simulations during 2003 and 2006 suggest that O3 production in the source region is VOC limited in the photochemically active periods. The pollution plume from Mexico City can be observed several hundreds of kilometers downwind. Aircraft-based measurements show ongoing production of secondary organic aerosols and O3 for several days downwind, added to the O3 and aerosols produced in the city and exported with the plume. We anticipate new results from MILAGRO will continue to contribute to our understanding of Mexico City air pollution and its potential impacts on human health, ecosystem viability, and climate change. This information will facilitate the decision makers in Mexico City to craft effective policies as well as provide insights to other megacities around the world.
References Molina, L.T. and M.J. Molina, eds.: (2002): Air Quality in the Mexico
Megacity: An Integrated Assessment, Kluwer Academic Publishers. Molina, L.T., et al., (2007): Air quality in North America’s most
populous city - overview of the MCMA-2003 campaign, Atmos. Chem. Phys., 7, 2447– 2473.
Molina, L.T., et al., (2009): Overview of the 2006 MILAGRO Campaign in Mexico City: Transport and Transformation of Emissions from a Megacity, to be submitted to Atmos. Chem. Phys.
Megacity Initiative: Local and Global Research Observations (MILAGRO)
The MILAGRO (Megacity Initiative: Local and Global Research Observations) Campaign is a large, international, multi-agency, collaborative project to assess the outflow of emissions from a megacity. Specific goals of the campaign include quantifying the spatial and temporal extent of the urban plume, analyzing pollutant chemical and physical transformation in the plume, examining the interaction of the urban plume with surrounding sources and evaluating the regional and global impacts of the plume. The Mexico City Metropolitan Area (MCMA, 19°25’N latitude and 99°10’W longitude) is North America’s most populous city and one of the world's largest megacities with an estimated 20 million inhabitants living in an elevated basin at an altitude of 2240 m asl and confined on three sides by mountain and volcanoes (Figure 1). The MCMA experienced a huge increase in population and urbanized areas during the 20th Century as it attracted migrants from other parts of the country and industrialization stimulated economic growth. Population growth, increasing motorization and industrial activities, a constrained basin and intense solar radiation combined to cause severe air quality problems of both primary and secondary pollutants. High concentrations of all criteria pollutants were recorded in the late 1980s. Ozone exceeded the air quality standards more than 90% of the days, and peaked above 300 ppb about 40-50 days a year, among the worst in the world [Molina and Molina, 2002]. During the past two decades, the Mexican government has made remarkable progress in improving air quality by developing and implementing comprehensive air quality management programs. As a result of regulatory actions combined with technology change, concentrations of criteria pollutants have been decreasing over the past decade despite the continuing increase in population and economic activity. The combination of meteorology, topography, population and multi-pollutant emission density of the MCMA has attracted a number of field studies. The MCMA-2002/2003 campaigns provided detailed measurements of many oxidant precursors and photochemical intermediates including radicals, as well as meteorology and emissions [Molina et al., 2007]. The observation phase of MILAGRO took place during March 2006 and included a wide range of instruments at ground sites,
Figure 1. Topographical map of the Mexico City Metropolitan Area. (From
Molina and Molina, 2002.) Figure 3: Submicron PM composition (mass and percent) measured during MILAGRO. (From Aiken et al., Atmos.
Chem. Phys. Discuss., 9, 8377-8427, 2009.)
Luisa T. Molina and the MILAGRO Science Team
E-mail: [email protected] Molina Center for Energy and the Environment and Massachusetts Institute of Technology
Http://www.mce2.org

NewsLetters of the FP7 EC MEGAPOLI Project
11 Issue 3, June 2009
In the face of the expected growth of urban populations, rise in standards of living, expansion of the economy and urban sprawl in megacities, air pollution will reach intolerable levels in the future, with serious socio-economic and ecological implications. Health problems specific to megacities can be caused by chemical and physical environmental exposure, contagious germs (intensified by extremely high population densities) and socio-economic conditions. Primary and photochemically produced pollutants create fundamental human health risks (Peters et al. 1997; Phalen 1998; Pope et al. 2006; WHO 2002, 2006). Therefore a detailed knowledge of the air quality situation is a basic requirement for the development of feasible strategies to improve air quality and the concomitant health status. The definition and implementation of measures for mitigation and adaptation requires a sound understanding of the current pollution situation. This is not available and must be established through the coordinated and integrated efforts of the scientists, stakeholders, and local authorities. Therefore only such an interdisciplinary and holistic project can develop and give solutions in order to improve the air quality and quality of life in urban agglomerations in a sustainable way.
Local Stakeholders Scientific Advisory Board
Crosscutting Concept:Sustainable development
Crosscutting Concept:Governance
Crosscutting Concept: Risk
Development and Dissemination of
Orientation Knowledge
MethodsIndicatorsToolkits
Scenarios
Capacity Building
Centre for Sustainable Urban
Development
Soc
io-s
patia
l diff
eren
tiatio
n
Wat
er-r
esou
rces
and
serv
ices
Land
use
man
agem
ent
Ene
rgy
syst
em
Research Programme „Risk Habitat
Megacity“
Air
qual
ityan
d he
alth
Was
tem
anag
emen
t
Tran
spor
tatio
n
Project CoordinatorProject Coordination Committee
Figure 1. “Risk-Habitat-Megacity” program architecture
Web link: http://www.risk-habitat-megacity.ufz.de/ From 7th to 9th September 2009 an international conference on “Megacities: Risk, Vulnerability and Sustainable development” will take place in Leipzig dealing with such concepts and based on a interdisciplinary approach: www.megacity-conference2009.ufz.de Coordinator: Dr. Dirk Heinrichs
Helmholtz Centre for Environmental Research - UFZ Permoserstraße 15 04318 Leipzig, Germany Phone: +49 341 235-1739 Fax: +49 (0)341 235-2825 E-mail: [email protected]
Speaker on Air Quality and Health: Dr. Peter Suppan
Institute for Meteorology and Climate Research Atmospheric Environmental Research Division (IMK-IFU) Karlsruhe Institute of Technology (KIT-Campus Alpine) Kreuzeckbahnstr. 19 82467 Garmisch-Partenkirchen, Germany Phone: +49 8821 183-239 Fax: +49 8821 183-243 E-mail: [email protected]
Risk-Habitat-Megacity
The Risk Habitat Megacity research initiative reflects the joint work of about forty natural and social scientists and engineers from five research centres of the German Helmholtz Association – the German Aerospace Centre (DLR), the Karlsruhe Institute of Technology (KIT-Campus North / Forschungszentrum Karlsruhe), the Helmholtz Centre for Infection Research (HZI), the GeoForschungsZentrum Potsdam (GFZ), and the Helmholtz Centre for Environmental Research – UFZ, and four partner organizations in Latin America – Universidad de Chile, Pontificia Universidad Católica de Chile, Pontificia Universidad Católica de Valparaíso and Economic Commission for Latin America and the Caribbean (ECLAC/CEPAL) in the United Nations. The research plan adopts an integrative research approach that combines basic theoretical and conceptual considerations with empirical and application-oriented analysis. The underlying notion of integration is a broad one, taking different dimensions of integration into account and making them explicit. To implement the integrative and interdisciplinary research approach and to offer a common framework for orientation, the research initiative applies three well-established, theory-based analytical concepts: • The concept of Sustainable Development
formulates the target dimension of the initiative. It provides orientation towards basic goals by defining specific sustainability criteria in close cooperation with the Chilean partners. The aim is to identify the desired future mega-urban development and to provide guidelines for both research and urban policy.
• The Risk concept focuses on the extent of the problems and their severity. In addition, it helps to identify and analyse the conditions for and impact of the emergence of risks that pose a potential threat to future sustainability.
• The Governance concept concentrates on the actions to be undertaken. This will be achieved by analysis of current efforts to enhance sustainability in megacities, and by the provision of knowledge and recommendations relevant to the appropriate solutions to specific problems and their potential for implementation.
The initiative applies these analytical concepts to several typical megacity issues, such as Land use management, Socio-spatial differentiation, Energy, Transportation, Air quality and health, Water resources and services, and Waste management (see Figure 1). The program comprises ten topics: three “cross-cutting concepts” – Sustainable Development, Risk, and Governance – and seven “fields of application”.
Air Quality and Health as one of application fields has become a serious problem in metropolitan areas and is most pronounced in topographically structured areas (Molina/ Molina 2004; Gurjar/ Lelieveld 2005). Major contributors to air pollution are traffic emissions, domestic heating and industrial sources.
Peter Suppan E-mail: [email protected] Institute for Meteorology and Climate Research (IMK-IFU) Karlsruhe Institute of Technology (KIT-Campus Alpine) http://imk-ifu.fzk.de

NewsLetters of the FP7 EC MEGAPOLI Project
12 Issue 3, June 2009
The key areas and tasks of WP1 are: • identification of requirements for data exchange
(all kinds of data needed for CWF); • investigation of infrastructure needed to meet the
identified demands. The key areas and tasks of WP2 are: • existing operational forecasting tools; • air quality tools, methods, criteria, experience,
requirements for measurement data; • ensembles (single- / multi-model), existing /
developing, experience; • data assimilation into air quality models; • experience in short-term emission abatement,
possible network contribution; • boundary conditions for meso- or local-scale
applications. The key areas and tasks of WP3 are: • assess how various organisations or systems select
the data and information on display, and by which means, platforms and format;
• identify which data collection protocols to use and which models and data are readily available;
• delineate relevant temporal and spatial resolution: hourly data, rural and urban data, next day ozone forecasts; details about used models.
Figure 1. A graphical illustration of the European chemical weather forecasting portal that provides a direct gateway to various national
and international CW forecast and information systems in Europe. Only some selected web-based services have been presented in the figure
(Karatzas and Kukkonen, 2009) (http://www.chemicalweather.eu/Domains).
References Karatzas, Kostas and Jaakko Kukkonen (editors), 2009. Quality of life
information services towards a sustainable society for the atmospheric environment, COST Action ES0602, Workshop Proceedings, Sofia Publications S.A., Thessaloniki, Greece, ISBN: 978-960-6706-20-2. 118 pp.
Kukkonen, J., T. Klein, K. Karatzas, K. Torseth, A. Fahre Vik, R. San Jose, T. Balk, and M. Sofiev, 2009a. COST ES0602: towards a European network on chemical weather forecasting and information systems, Adv. Sci. Res., 1, 1–7, www.adv-sci-res.net/1/1/2009/, Contributions of the 8th EMS Annual Meeting and 7th European Conference on Applied Climatology, 2008.
Kukkonen, Jaakko, Kostas Karatzas, Kjetil Tørseth, Aasmund Fahre Vik, Thomas Klein, Roberto San José, Taru Balk and Mikhail Sofiev, 2009b. An overview of the COST action “Towards a European network on chemical weather forecasting and information systems”. In: Karatzas, Kostas and Jaakko Kukkonen (editors), Quality of life information services towards a sustainable society for the atmospheric environment, COST Action ES0602, Workshop Proceedings, Sofia Publications S.A., Thessaloniki, Greece, ISBN: 978-960-6706-20-2, pp. 21-37.
Chemical Weather Forecasting – COST Action ES0602
J. Kukkonen1, T. Klein2, K. Karatzas3, K. Torseth4, A. Fahre Vik4, R. San Jose5 and M. Sofiev1
1 Finnish Meteorological Institute, Helsinki, Finland 2 Swedish Meteorological and Hydrological Institute, Norrköping, Sweden 3 Aristotle University, Thessaloniki, Greece 4 Norwegian Institute for Air Research, Kjeller, Norway 5 Computer Science School, Technical University of Madrid (UPM), Spain The COST Action ES0602 action “Towards a European Network on Chemical Weather Forecasting (CWF) and Information Systems “provides a forum for benchmarking approaches and practices in data exchange and multi-model capabilities for chemical weather forecasting and near real-time information services in Europe. The action includes approximately 30 participants from 19 countries, and its duration is from 2007 to 2011 (http://www.chemicalweather.eu/). Major efforts have been dedicated in other actions and projects to the development of infrastructures for data flow. We have therefore aimed for collaboration with ongoing actions towards developing near real-time exchange of input data for air quality forecasting. We have collected information on the operational air quality forecasting models on a regional and continental scale in a structured form, and inter-compared and evaluated the physical and chemical structure of these models. We have also constructed a European chemical weather forecasting portal that includes links to most of the available chemical weather forecasting systems in Europe (Kukkonen et al., 2009a,b). The collaboration also includes the examination of the case studies that have been organized within COST-728, in order to inter-compare and evaluate the models against experimental data. We have also constructed an operational model forecasting ensemble. Data from a representative set of regional background stations have been selected, and the operational forecasts for this set of sites will be inter-compared and evaluated. The Action has investigated, analysed and reviewed existing chemical weather information systems and services, and will provide recommendations on best practices concerning the presentation and dissemination of chemical weather information towards the public and decision makers (Karatzas and Kukkonen, 2009). The main Work Packages of Action are the following: WP1 - Exchange of air quality forecasts and input data; WP2 - Multi-scale forecasting, multi-model ensemble, boundary data; WP3 - Dissemination and visualization.
Jaakko Kukkonen E-mail: [email protected] Finnish Meteorological Institute Erik Palmenin aukio 1, P.O.Box 503, FI-00101 Helsinki http://www.fmi.fi
NewsLetters of the FP7 EC MEGAPOLI Project
13 Issue 3, June 2009
The teams use a suite of remotely sensed parameters to parameterize and validate their modelling results. These projections can help improve our understanding of the dynamics of land use transformations, the relative importance of the drivers that foster/impede land conversion, and the complex interactions between urban change and sustainable systems. The teams will also evaluate current adaptation strategies and illustrate a range of possible adaptation measures that the respective city governments can use to cope with the impacts of various future climate changes. This multi-institutional, international effort represents the first comprehensive study of Chinese metropolitan development based on empirical results from satellite imagery, socioeconomic data and field surveys. It will improve our understanding of China's urbanization and regional climate changes and have a practical policy dimension for selected cities.
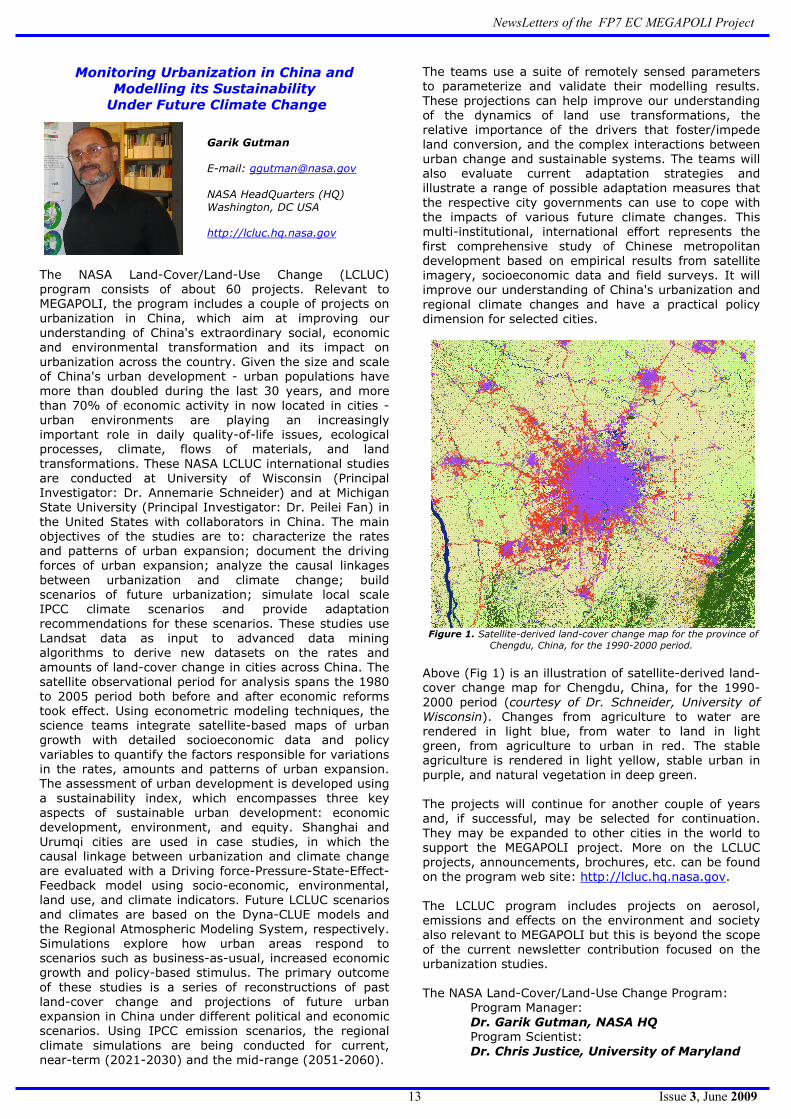
Figure 1. Satellite-derived land-cover change map for the province of Chengdu, China, for the 1990-2000 period.
Above (Fig 1) is an illustration of satellite-derived land-cover change map for Chengdu, China, for the 1990-2000 period (courtesy of Dr. Schneider, University of Wisconsin). Changes from agriculture to water are rendered in light blue, from water to land in light green, from agriculture to urban in red. The stable agriculture is rendered in light yellow, stable urban in purple, and natural vegetation in deep green. The projects will continue for another couple of years and, if successful, may be selected for continuation. They may be expanded to other cities in the world to support the MEGAPOLI project. More on the LCLUC projects, announcements, brochures, etc. can be found on the program web site: http://lcluc.hq.nasa.gov. The LCLUC program includes projects on aerosol, emissions and effects on the environment and society also relevant to MEGAPOLI but this is beyond the scope of the current newsletter contribution focused on the urbanization studies. The NASA Land-Cover/Land-Use Change Program:
Program Manager: Dr. Garik Gutman, NASA HQ Program Scientist: Dr. Chris Justice, University of Maryland
Monitoring Urbanization in China and Modelling its Sustainability
Under Future Climate Change
The NASA Land-Cover/Land-Use Change (LCLUC) program consists of about 60 projects. Relevant to MEGAPOLI, the program includes a couple of projects on urbanization in China, which aim at improving our understanding of China's extraordinary social, economic and environmental transformation and its impact on urbanization across the country. Given the size and scale of China's urban development - urban populations have more than doubled during the last 30 years, and more than 70% of economic activity in now located in cities - urban environments are playing an increasingly important role in daily quality-of-life issues, ecological processes, climate, flows of materials, and land transformations. These NASA LCLUC international studies are conducted at University of Wisconsin (Principal Investigator: Dr. Annemarie Schneider) and at Michigan State University (Principal Investigator: Dr. Peilei Fan) in the United States with collaborators in China. The main objectives of the studies are to: characterize the rates and patterns of urban expansion; document the driving forces of urban expansion; analyze the causal linkages between urbanization and climate change; build scenarios of future urbanization; simulate local scale IPCC climate scenarios and provide adaptation recommendations for these scenarios. These studies use Landsat data as input to advanced data mining algorithms to derive new datasets on the rates and amounts of land-cover change in cities across China. The satellite observational period for analysis spans the 1980 to 2005 period both before and after economic reforms took effect. Using econometric modeling techniques, the science teams integrate satellite-based maps of urban growth with detailed socioeconomic data and policy variables to quantify the factors responsible for variations in the rates, amounts and patterns of urban expansion. The assessment of urban development is developed using a sustainability index, which encompasses three key aspects of sustainable urban development: economic development, environment, and equity. Shanghai and Urumqi cities are used in case studies, in which the causal linkage between urbanization and climate change are evaluated with a Driving force-Pressure-State-Effect-Feedback model using socio-economic, environmental, land use, and climate indicators. Future LCLUC scenarios and climates are based on the Dyna-CLUE models and the Regional Atmospheric Modeling System, respectively. Simulations explore how urban areas respond to scenarios such as business-as-usual, increased economic growth and policy-based stimulus. The primary outcome of these studies is a series of reconstructions of past land-cover change and projections of future urban expansion in China under different political and economic scenarios. Using IPCC emission scenarios, the regional climate simulations are being conducted for current, near-term (2021-2030) and the mid-range (2051-2060).
Garik Gutman E-mail: [email protected] NASA HeadQuarters (HQ) Washington, DC USA http://lcluc.hq.nasa.gov

NewsLetters of the FP7 EC MEGAPOLI Project
14 Issue 3, June 2009
MEGAPOLI Project Office WWW ADDRESS http://www.megapoli.info POSTAL ADDRESS MEGAPOLI Project Office Danish Meteorological Institute (DMI) Research Department Lyngbyvej 100 DK-2100 Copenhagen DENMARK
COORDINATOR Prof. Alexander Baklanov E-mail: [email protected] Phone: +45 3915-7441 Fax: +45 3915-7400
VICE-COORDINATORS Dr. Mark Lawrence E-mail: [email protected] Phone: +49-6131-305331 Fax: +49-6131-305511 Prof. Spyros Pandis E-mail: [email protected] Phone: +30-2610-969510 Fax: +30-2610-990987
MANAGER Dr. Alexander Mahura E-mail: [email protected] Phone: +45 3915-7423 Fax: +45 3915-7400
SECRETARY Britta Christiansen E-mail: [email protected] Phone: +45 3915-7405 Fax: +45 3915-7400
EC Scientific Officer Dr. Jose M. Jimenez Mingo E-mail: jose.jimenez-mingo ec.europa.eu Phone: +32-2-2976721 Fax: +32-2-2995755
IMPORTANT NOTICE
If you do not wish to receive this newsletter, send an e-mail to the following address - [email protected] - and you will be removed from the mailing list. We apologise for any inconvenience caused.
Coming Presentations and Publications
Dear colleagues, please, pay your attention to presentations and publications related to the MEGAPOLI Project:
• MEGAPOLI project to be presented (by Alexander Baklanov, DMI Team) at the United Nations Framework Convention on Climate Change (UNFCCC) talks, "Air pollution and climate change: EU research activities to protect the planet and its inhabitants", 5 Jun 2009, Bonn, Germany;
• MEGAPOLI project to be presented (by Ari Karppinen, FMI Team) for the Air and Waste Management Association (AWMA-2009) Conference, 16-19 Jun 2009, Detroit, Michigan, USA;
• MEGAPOLI project to be presented (by Alexander Mahura, DMI Team) International Conference on Computational Information Technologies for Environmental Sciences (CITES-2009), 11-15 Jul 2009, Krasnoyarsk, Russia;
Coming Conferences Dear colleagues, please, pay your attention to conferences you might be interested to attend and/or present the MEGAPOLI Project results and findings:
• International Conference «Megacities: Risk, Vulnerability and Sustainable Development» Leipzig, Germany, 7-9 Sep 2009 http://www.megacity-conference2009.ufz.de/
• European Meteorological Society Annual Meeting (EMS-2009) Toulouse, France, 28 Sep - 2 Oct 2009 (special MEGAPOLI session) http://www.emetsoc.org/annual_meetings/annual_meetings_2009.php
• International Workshop «Atmospheric Composition Changes: Climate Chemistry Interactions» Lecce, Italy, 2-4 Nov 2009 Contact Ashraf Zakey (ICTP Team), [email protected]
• WMO, COST-728, MEGAPOLI End-user Workshop Geneva, Switzerland, 8-10 Dec 2009 Contact Liisa Jalkanen (WMO Team), [email protected]
• European Geosciences Union General Assembly (EGU-2010) Vienna, Austria, 2-7 May 2010 (special MEGAPOLI, CityZen, MILAGRO session) http://meetings.copernicus.org/egu2010/
• International Aerosol Conference Helsinki, Finland, 29 Aug – 3 Sep 2010 http://www.iac2010.fi