Mega Lifesciences PCL Investor Presentationmega.listedcompany.com/misc/PRESN/20140228-MEGA... ·...
41
We care Mega Lifesciences PCL Investor Presentation Financial Year 2013
Transcript of Mega Lifesciences PCL Investor Presentationmega.listedcompany.com/misc/PRESN/20140228-MEGA... ·...

We care
Mega Lifesciences PCLInvestor PresentationFinancial Year 2013

We care
Section 1Business Overview

3We care
Our history
1982
Incorporated
1985-86
1993-94
1995-96
20022012
•Received approval from Thai FDA for Samut Prakarnfacility in Thailand•Began manufacturing nifedipine for Berlin Pharmaceutical Industry Co. Ltd
•Expanded into Vietnam, Myanmar and Cambodia to sell branded products and operate distribution business
•Established manufacturing plant in Australia
•Market leading branded products in key Southeast Asian markets•Leading distributor of pharmaceutical and OTC products •Announced acquisition of Eugica
•Commenced branded products business •Acquired Medicrafts brand
We have evolved from an OEM player into a leading international consumer healthcare and pharmaceutical company
Started as an OEM manufacturer
Entered branded products and distribution business;
geographical expansion
Emerged as a leading branded and distribution company
2013
•Commissioning of new plant in Australia•Planned manufacturing expansion in Thailand• Successful IPO on SET

4We care
Distribution Business46.4% and 44.9 % of 2012 and 2013
operating revenues respectively
Branded Products Business 45.3% and 48.4% of 2012 and 2013
operating revenues, respectively
Mega at a glance
OEM Business8.3% and 6.7% of 2012 and 2013 operating revenues, respectively
2012 2013 Gr.%
Total Sales (THB mn) 2,700 3,403 26.0
Nutraceuticals 76.0% 76.1% 25.6
Prescription 19.9% 19.5% 22.9
OTC 4.1% 4.4% 35.3
2012 2013 Gr.%
Total Sales (THB mn) 498 473 (5.0)
Australia 52.4% 52.8% (4.3)
Thailand 30.9% 28.7% (11.7)
Others 16.7% 18.5% 5.4
1 2 3
65.9% and 72.8% of Gross Profit in 2012 and 2013, respectively
29.7% and 24.5% of Gross Profit in 2012 and 2013, respectively
4.5% and 2.7% of Gross Profit in 2012 and 2013, respectively
2012 2013 Gr.%
Total Sales (THB mn) 5,965 7,034 17.9
Mega Lifesciences PCL
2012 2013 Gr.%
Total Sales (THB mn) 2,767 3,157 14.1
Pharmaceuticals 75.8% 65.8% (0.9)
FMCG 20.1% 30.2% 71.2
Intersegment 4.1% 4.0% 11.6

5We care
Geographical overview of our operations – we derive majority of our revenue from Southeast Asia
Thailand, Vietnam and Myanmar are our key geographies which accounted for 75.7% of our operating revenue in 2013
1.Revenues exclude other income
Philippines
Indonesia
MalaysiaSingapore
Myanmar
Cambodia
VietnamThailand
Azerbaijan
Sri Lanka
Uzbekistan
YemenUnited Arab Emirates
Mongolia
Hong Kong
GhanaKenya
Nigeria
TanzaniaUganda
KazakhstanUkraine
Russia
Belarus
Peru
Denmark
Legend
Countries with sales of our branded products
Countries with manufacturing or product development capabilities
Ausralia
IndiaTrinidad
Rwanda
Kuwait
South East Asia 84.8%
Rest of World 15.2%
Southeast Asia accounts for majority of revenues1
Revenue Breakdown by Region (2013)

6We care
We sell nutraceuticals, prescription and OTC products within our branded business
Product Categories Description Key Brands
Nutraceutical Products
• Products which provide health benefits in addition to the basic nutritional value found in normal diet
• Regulation varies across jurisdictions but generally regulated for their manufacturing, safety, efficacy, labeling and marketing
Prescription Products
• Medicines only available for purchase by consumers with a medical prescription
• Strictly regulated by authorities as to their manufacturing, safety, efficacy, labeling and marketing
OTC Products • Medicines sold directly to consumer without a prescription from a healthcare professional

7We care
Our value-added distribution business model for pharmaceutical and FMCG products
Conventional distribution services (CDS)• Our integrated approach lends enhanced efficiency and quality control of our
products at every stage of our operations from procurement to delivery to our end consumers
• We purchase products from our principals, subject them to a quality control inspection, then warehouse the products in a climate-controlled environment until receipt of end customer orders. We arrange for logistics services and ensure the timely delivery of products
1
2
3
Sales and conventional distribution services (SCDS)• In addition to our conventional distribution services, we also provide sales support
to our principals• Our sales channels include pharmacies, hospitals and clinics for pharmaceutical
products and supermarkets, department stores, key accounts, wholesalers and dealers for FMCG products
Marketing, sales and conventional distribution services (MSCDS)• Our pharmaceutical and FMCG teams provide a complete package of marketing,
sales and distribution services tailored to our principals and their products• The teams market directly and engage in marketing activities through available
channels
Principals can choose from any of our three service models to help meet their distribution needs

8We care
Thailand manufacturing facilities: two manufacturing facilitiesFacility 1 – Soi 6, Samut Prakarn Facility 2 – Soi 8, Samut Prakarn
Description• Commenced
production in 1985• Planned upgrade to
3.8bn capsules p.a.1
• Manufactures:– Soft gels– Hard gels– Sachets
• Approved by German health authorities, the Thai FDA and the Australian TGA
1 Annual design capacity for soft gels will increase to 3.8 bn capsules when the addition of eight new production lines at the Soi 8 facility is completed,
Description• Commenced
production in 1985• Manufactures:
– Soft gels (after expansion)
– Hard gels– Tablets– Sachets
• Approved by German health authorities, the Thai FDA and the Australian TGA

9We care
Australian manufacturing facility: Pakenham facility
Overview
• Facility replaces the manufacturing facility established in Dandenong, Melbourne
• Commenced production in 2nd quarter 2013• Manufactures:• Hard capsules• Tablets• Powders
• Approved by Australian TGA
Pakenham facility

We care
Section 2Key investment highlights

11We care
Key investment highlights
Leading distributor of pharmaceutical and OTC products in frontier markets of Myanmar, Vietnam and Cambodia2
Focused on fast growing markets including a unique established and market leading presence in the Myanmar market3
High quality products manufactured in world-class manufacturing facilities accredited by international regulatory agencies
4
Strong product pipeline driven by an efficient and targeted product development strategy5
Proven track record of delivering growth and profitability6
Experienced management team instrumental in building the business is significantly invested in the Company7
Market leading own consumer health and pharmaceutical brands in fast growing developing markets1

12We care
Own Brand Rank Therapeutic Category (TC)
Nat C
#1 Vitamin C
Nat B
#1 Vitamin B Complex
Fish oil
#1 Anti-atheromaNatural
Gofen
#4 Anti-rheumatics Non-steroidal
Own Brand Rank Therapeutic Category (TC)
Ferrovit
#1 Haematinics
Enat
#1 Vitamin E
Calcivita
#1 Calcium Supplements
Livolin Forte
#1 Hepatoprotectant
Prenatal
#2 Prenatal
Nutrivita
#2 MVMM
Own Brand Rank Therapeutic Category (TC)
Enat
#1 Vitamin E
Eugica
#1 Herbal Cough Sedative
Acnotin
#2 Oral Anti-acne Preparation
Ferrovit
#5 Iron Combination Products
Giloba
#5Cerebral and
Peripheral Vascular
NNO
#3 Emollients and Protectives
Our market leading nutraceutical, branded generic and OTC brands
1
Source: IMS Health Sep 2013, Myanmar estimates based on Myanmar import customs data and Company assumptions
Thailand Vietnam Myanmar
Acnotin
#1 Oral Anti-acne Preparation

13We care
Science-based sales and marketing approach to build awareness of the safety and efficacy of our brands
“Science-based” sales and educational approach catering to medical customers
Overview
• Customers of branded products business include:
– Pharmacies
– Hospitals
– Clinics
– Health practitioners
– Physicians
• Direct promotion to these channels to strengthen market recognition and build brand loyalty
• Sales representatives and product consultants promote products through
– Educational seminars
– Trade shows
– Product information and promotional material
– Academic trainings
– Informational sessions for medical professionals
• Sales force includes members with a medical background
Sales and product consultants promoting Mega products
1

14We care
Leading distributor of pharmaceutical and OTC products in frontier marketsKey Distribution Markets Myanmar Vietnam Cambodia
Market Positioning
• Leading international distributor of pharmaceutical and OTC products
• Among top 2 distributors of FMCG products
• Leading international distributor of pharmaceutical and OTC products
• Leading international distributor of pharmaceutical and OTC products
Distribution Infrastructure
• 8 warehouses strategically located across Yangon, Mandalay, Mawlamyaing, Naypyidaw, Taungyyi and Lashio
• Distribute to 27,204 outlets representing c.85% geographical coverage
• 3 warehouses strategically located in Hanoi, Danang, Ho Chi Minh, with 2 feeder warehouses in Can Tho
• Distribute to 12,280 outlets across 48 out of 58 provinces
• 1 warehouse located in Phnom Penh
• Distribute to 5,700 outlets
% of Distribution Sales (2013) 63.0% 31.1% 5.8%
2

15We care
Advanced information technology systems provide valuable business intelligence for our principalsOverview
• Our advanced IT systems allow us to collect, analyse and derive business intelligence across each of our distribution markets
• We offer a broad range of value-added services, including:
– Inventory tracking systems
– Inventory management systems
– Access to valuable market data
– Real-time information sharing
• Our principals can leverage on the array of value-added services we offer in order to:
– Increase operational efficiency
– Reduce inventory cost, fulfillment cost and operational expenses
– Tailor their marketing activities to target their customers
– Improve overall efficiency of their businesses
• We believe this is a key competitive advantage and it strengthens the existing principal and customer relationships
Through our advanced IT systems we can provide value-added services to help our principals increase operational efficiency, reduce inventory cost, fulfillment cost and operational expenses, and tailor their marketing activities
Our teams collecting real time data on the field
We capture all aspects of our relationship
with customers,
providing us with current
market insights which
we use for effective sales & marketing
2

16We care
1.4%
1.8%
2.1%
2.3%
2.8%
3.5%
4.0%
19.9%
23.1%
32.7%
Philippines
Peru
Ukraine
Malaysia
Nigeria
Australia
Cambodia
Thailand
Vietnam
Myanmar
Revenue growth (‘12-’13)
We focus on fast growing developing markets…3
% Real GDP growth (‘12-’16)
6.7%
5.3%
4.6%
7.2%
3.1%
7.1%
2.4%
5.2%
6.1%
5.5%
Source: IMF, WEO Database, April 2013 | Countries with GDP growth < 5%Countries with GDP growth > 5%
28%
10%
20%
10%
(4%)
(11%)
36 %
4%
83%
45%
We have consistently grow
n faster than the markets w
e operate in
Note : Brand business in Nigeria grew by 21.0 % (‘12-’13)

17We care
58.9
23.8
6.0
ThailandVietnamMyanmar
…and Mega is well-positioned to capitaliseMyanmar’s GDP expected to witness significant growth…
Myanmar GDP at current prices in USD bns
…with a leading position in Myanmar, a key market with significant growth potential
3
53
73
2012E 2016E
…and expected to benefit a significantly underpenetrated health care market
Myanmar pharma and consumer health market size per capita (USD)
1995
10.3%
85%
8
9
63.0%
Source: IMF, WEO Database, April 2013, ADB Study 2012, Estimates based on Myanmar import customs data and Company assumptions| Note: (1) Suffix ‘E’ represents IMF estimate, (2) as at 31Dec 2013
1 1
Establishment date testament to our long-standing presence in the country
% of 2013 branded revenues (before inter-segment charges) generated in Myanmar
% of 2013 distribution revenues generated in Myanmar
# of our branded products ranked as leading brands in their respective therapeutic category
# of strategically located warehouses
Extensive distribution reach covering 85% of the country
Myanmar significantly lags behind Vietnam
and Thailand in healthcare spend
c.1,4502 # of employees in Myanmar

18We care
All of our products are made to high quality standards in world class manufacturing facilities
4
State of the art quality control laboratoryInternationally accredited manufacturing facilities
Manufacturing facilities in Australia and Thailand
These facilities are accredited and regularly inspected by:• German health authorities• Australian TGA• Thai FDA • Additional GMP
certifications from 12 countries
• Australian TGA approved since 1992• Amongst the few manufacturers globally,
who apply the same standards for the manufacturing of nutraceutical products as with pharmaceutical products
• Team of 151 professionals in our Quality Assurance and Quality Control teams to ensure our products comply with the highest quality standards
• State of the art QC laboratory with world class Quality Assurance (“QA”) systems and EU GMP standard manufacturing facilities make us amongst the leading such facility in its category in Thailand and in Southeast Asia
Internationally accredited facilities Sizeable and dedicated teams monitor quality Significant investment made into infrastructure
We manufacture our nutraceutical products to pharmaceutical standards

19We care
Product development strategy
Efficient and targeted product development strategy drives a strong product pipeline
5
Nutraceuticals
• Identify new clinically-effective and safe product candidates
• Create line extensions of existing established products
Prescription Pharmaceuticals
• Review effective pharmaceutical compounds which have been successful for major originator companies
• Products with expired or due to expire patents
OTC
• Develop products which offer the following: faster relief, are easy to use, have better formulations for self medication, and will be recommended by pharmacies
Our objective is to develop new products which offer consumers health and wellness benefits
Products - Key information as at 31 Dec 2013Existing:# of Unique formulations 195 # of Product registrations 681
Application for registrations:# of Unique formulations 71 # of Product registrations 398
# of unique product formulation under Development
75
# No of poroduct launches (Jan 2008 to Dec 2013) 103

20We care
Growing both top-line and bottom-line
CAGR (2010-2013)
Proven track record of delivering growth and profitability
6
Commentary
• Evolved from a contract manufacturer to a leading branded products and consumer health company
• Growth in branded products driven by strong brands across markets
• Growing volumes on the back of strong promotional activities
• Focus on building long term relationships with customers
• Leveraged on well established distribution infrastructure
• Increased focus on international principals
• Distribution business benefited from increased volumes from principals
19%
17%
19%
PATMI
EBIDTA
Sales

21We care
Management ably supported by other experienced in-country personnel and teams
Management1 team instrumental in building the business is significantly invested in the Company
7
Vivek DhawanChief Executive Officer and Chief coach• Joined Mega in 1986
Thomas AbrahamChief Financial Officer and
Head coach • Joined Mega in 1998
Duangnapa TongsiriPresident and Head coach, Mega We Care , Thailand
(excluding Manufacturing)• Joined Mega in 1993
Girish WadhwaPresident and Head coach,
Mega We Care and Maxxcare, Myanmar
• Joined Mega in 1997
Paramjit SinghPresident International and
Head coach ,Mega We Care and Maxxcare
(excluding Thailand , Myanmar and Manufacturing)Joined Mega in 1993
Management team has a collective history of over 100 years working with the Company
John FarleyManaging Director, Australia, 1989
Apichai ChancharusiriDirector Manufacturing, 1985
Pornchai WongpayakDirector Quality Control, 1990
1 Management designations have been changed w.e.f. 01-Jan-2014; approved in the Board meeting dated 25-Feb-2014 . SET filling in due course

22We care
Continue OEM• Helps service our long standing
customers and helps improve the productivity and efficiency of our manufacturing processes
Grow our market leading brands• Leverage brand strength and
recognition to increase demand• Expand specialised sales and
marketing team to increase our coverage of the market
Launch new branded products• Launch new products and line
extensions• Leverage on speed to market
competitive advantage
Expand distribution business• Strengthen relations with existing
principals, add new principals and invest in infrastructure
Enter new markets• Selectively enter new markets
where we can compete effectively• Identified new markets in Africa,
Middle East, CIS and South America as new frontier markets
Expand margins and profitability• Minimise manufacturing and
distribution cost inefficiencies • Improving yield on
manufacturing processes
Selective acquisitions• Selectively assess complimentary
acquisitions• For e.g. the Eugica acquisition
helped us add a leading brand to our portfolio
Future strategies
Our strategies for the branded and distribution business will drive future growth

23We care
Organization structure
The Company operates in 22 countries through 17 subsidiaries and an affiliate and 17 branch or representative offices
Mega Lifesciences Public Company Limited
(Thailand)
Mega Lifesciences Public Company Limited
(Thailand)
99.99% 99.99% 99.96%
99.99%99.99%
99.99%98.99%99.99%99.96% 99.99% 99.99%
99.99%99.99%99.99%99.99% 99.99% 49%
Natural Health Foods Ltd.
(Thailand)
Natural Health Foods Ltd.
(Thailand)
Mega Lifesciences Pty. Ltd.
(Thailand)
Mega Lifesciences Pty. Ltd.
(Thailand)
Mega We Care Ltd.(Thailand)
Mega We Care Ltd.(Thailand)
Mega Lifesciences Pty. Peru S.A.C.
(Peru)
Mega Lifesciences Pty. Peru S.A.C.
(Peru)
Mega Products (Mauritius) Ltd.
(Mauritius)
Mega Products (Mauritius) Ltd.
(Mauritius)
Mega Lifesciences Sdn. Bhd.
(Malaysia)
Mega Lifesciences Sdn. Bhd.
(Malaysia)
PT Mega Lifesciences(Indonesia)
PT Mega Lifesciences(Indonesia)
Mega Lifesciences Pty. Ltd.
(Cambodia)
Mega Lifesciences Pty. Ltd.
(Cambodia)
E-Sense Ltd.(Thailand)
E-Sense Ltd.(Thailand)
Mega Lifesciences Ltd.(Myanmar)
Mega Lifesciences Ltd.(Myanmar)
Mega Lifesciences(Vietnam) Ltd.
(Vietnam)
Mega Lifesciences(Vietnam) Ltd.
(Vietnam)
Mega LifesciencesNigeria Ltd.
(Nigeria)
Mega LifesciencesNigeria Ltd.
(Nigeria)
Mega Lifesciences Ghana Ltd.
(Ghana)
Mega Lifesciences Ghana Ltd.
(Ghana)
Mega Lifesciences Pte. Ltd.
(India)
Mega Lifesciences Pte. Ltd.
(India)
Mega Lifesciences Pte. Ltd.
(Singapore)
Mega Lifesciences Pte. Ltd.
(Singapore)
Mega Lifesciences(Australia) Pty. Ltd.
(Australia)
Mega Lifesciences(Australia) Pty. Ltd.
(Australia)
Mega Product Ltd.(Yemen)
Mega Product Ltd.(Yemen)
Note : As at 31 Dec 2013

24We care
Pre-IPO and post-IPO shareholding
7.06%20.44%0.96%58.92% 3.76% 8.86%
Existing Minority (Employees)
Existing Minority (Employees)ManagementManagementG. Prem Gee Pte.
Co., Ltd.G. Prem Gee Pte.
Co., Ltd.Unistretch
Company Ltd.Unistretch
Company Ltd.Globlex
Corporation Ltd.Globlex
Corporation Ltd. Shah FamilyShah Family
Existing Minority (Employees)
Existing Minority (Employees)ManagementManagementShah FamilyShah Family
25.00% 6.00%15.23%50.08% 0.02% 3.67%
New InvestorsNew Investors UnistretchCompany Ltd.
UnistretchCompany Ltd.
GloblexCorporation Ltd.
GloblexCorporation Ltd.
Mega Lifesciences PCLMega Lifesciences PCL
Mega Lifesciences PCLMega Lifesciences PCL
Pre – IPO shareholding
Post – IPO shareholding1
1. As at 31-Dec-2013
25We care
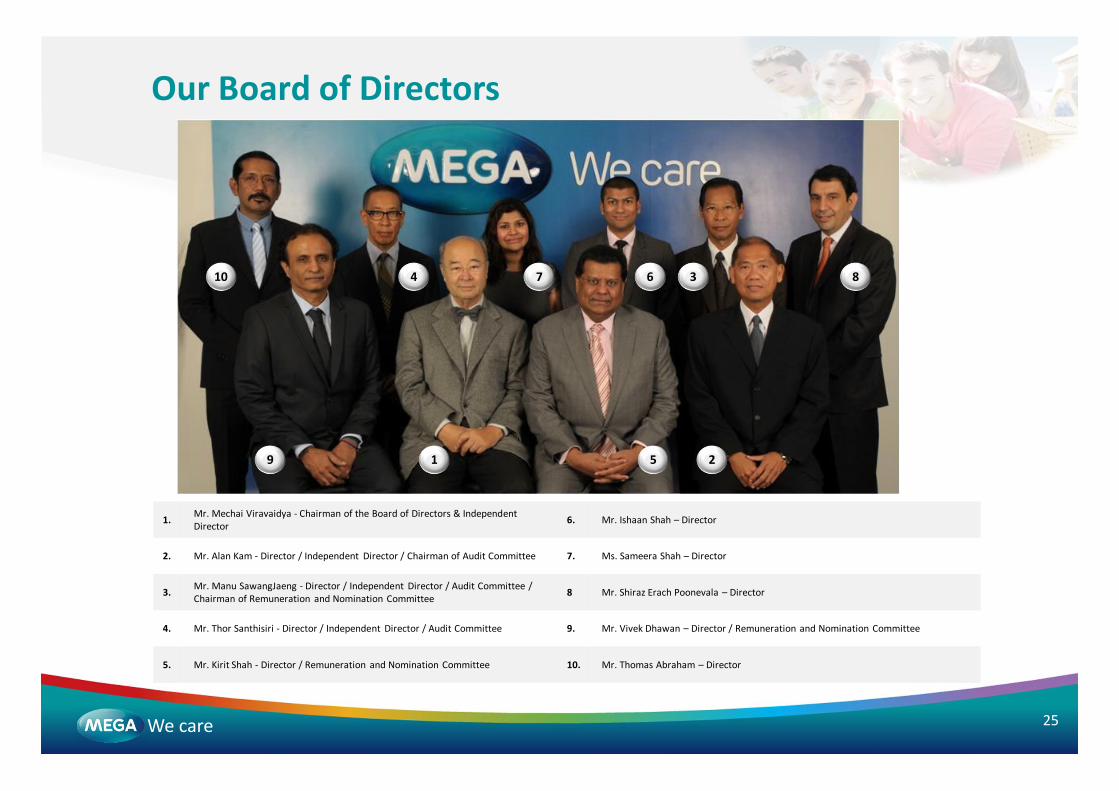
Our Board of Directors
10
1. Mr. Mechai Viravaidya - Chairman of the Board of Directors & Independent Director 6. Mr. Ishaan Shah – Director
2. Mr. Alan Kam - Director / Independent Director / Chairman of Audit Committee 7. Ms. Sameera Shah – Director
3. Mr. Manu SawangJaeng - Director / Independent Director / Audit Committee / Chairman of Remuneration and Nomination Committee 8 Mr. Shiraz Erach Poonevala – Director
4. Mr. Thor Santhisiri - Director / Independent Director / Audit Committee 9. Mr. Vivek Dhawan – Director / Remuneration and Nomination Committee
5. Mr. Kirit Shah - Director / Remuneration and Nomination Committee 10. Mr. Thomas Abraham – Director
1 2
34
5
67 8
9

We care
Section 3Financial OverviewFY 2013

27We care
Summarized Income Statement
1.Normalized for change in business model in Myanmar in 2012 and additional overheads in Australia in 2013.
2.Normalized for deferred tax and non- recurring expenses in 2013
All figures in THB mn 2013 2012
Operating Revenue 7,033.5 5,964.8 Gross Margin (GM) 2,959.4 2,633.3 % of GM to operating revenue 42.1% 44.1%
% of GM to operating revenue (Normalized) 142.5% 42.0%
Selling and Admin. exp (SGA) 2,235.8 1,980.0 % of SGA to operating revenue 31.8% 33.2%EBIDTA 884.5 798.3 Reported (PATMI) 624.0 577.7
Normalized2 PATMI before deferred tax adjustment 662.0 555.6

28We care
Strong growth in sales over time…
Branded products was the largest business segment
Revenue split by business segment
47.6% 47.3% 45.3% 48.4%
42.4% 43.6% 46.4% 44.9%
10.0% 9.1% 8.3% 6.7%
Brand Distribution OEM
2010 2011 2012 2013
Total revenues1 (THB mn)
4,159
4,857
5,965
7,034
2010 2011 2012 2013
1.Excludes Other Income
2.Thailand, Myanmar, Vietnam, Cambodia, Malaysia, Philippines, Indonesia and Singapore.
3 Thailand, Myanmar, Vietnam and Cambodia
Commentary
• The Company experienced growth in revenue with CAGR of 19.8% between 2010 and 2012 and a growth of 17.9% for 2013 over 2012
• Brand and distribution business continue to be major contributors to the Company’s revenue
• Southeast Asia2 and Indochina3 contribute 84.8% and 79.7% of the consolidated operating revenue in year 2013

29We care
…driven by growth in both branded products and..
Total branded products revenues1 (THB mn)
1,9782,297
2,700
3,403
2010 2011 2012 2013
Thailand is our largest market
Revenue split by geography
Commentary
• Thailand contributed the largest portion of revenue from brand business followed by Vietnam and Myanmar
• All key markets have continued to grow significantly in 2013. The low per capita consumption and penetration levels for our products in these markets as compared to developed markets enabled us to sustain the good growth rates by expanding the user base
• Indochina contributed approximately 69% of total brand business revenue for 2013
• Southeast Asia contributed approximately 79% of total brand business revenue for 2013
36.7% 35.8% 37.3% 37.0%
21.9% 18.8% 17.9% 19.2%
10.9% 14.6% 10.1% 9.6%
30.5% 30.8% 34.7% 34.2%
Thailand Vietnam Myanmar Others
2010 2011 2012 2013
1. After inter-segment charge (expense incurred by brand business for distribution of branded product, which will be booked as revenue under distribution business)

30We care
…distribution business revenues
Total distribution business revenues1 (THB mn)
1,765
2,117
2,767
3,157
2010 2011 2012 2013
Myanmar is our largest distribution market
Revenue split by geography
40.7%49.1% 55.0% 63.0%
45.5%41.5% 36.0%
31.1%
8.9% 6.8% 6.8% 5.9%4.9% 2.7% 2.1%
Myanmar Vietnam Cambodia Nigeria
2010 2011 2012 2013
Commentary
• All of Mega’s revenue from distribution business is derived from outside of Thailand• CAGR between 2010 and 2012 was 25.2% • Distribution revenue from Myanmar has experienced strong growth, with CAGR of over 45% between 2010 and 2012• The revenue growth of 14.1% between 2012 to 2013 is impacted by the change in distribution model with one of our principal in
Myanmar• Other factors which impacted growth in 2013 were that the revenue from new principals added is yet to stabilize and these incremental
revenues couldn’t fully compensate the discontinuance of certain principals in Nigeria & Vietnam
1.After inter-segment charge (expense incurred by brand business for distribution of branded product, which is booked as revenue under distribution business)

31We care
Commentary
• Normalized Gross margin in 2013 has moved in tandem with revenue growth
• Reported Gross margin slightly declined from 44.1% in 2012 to 42.1% in 2013 mainly due to the change in business model for one of our Principals in Myanmar as well as the additional overheads incurred in Australia due to the temporary stoppage of production for shifting to the newly constructed plant . Normalized for the above impact, Gross margins remained stable at 42% approximately.
• Comparison of PATMI before and after deferred tax impact and the normalized 1PATMI after adjusting for non-regular expenses are as follows
2,011
2,309
2,633
2,959
2010 2011 2012 2013
Profit after tax and minority interest (PATMI) (THB mn)
368
456
578624
2010 2011 2012 2013
Profits have grown in tandem with Sales
Gross Margin ( THB mn)
1. Normalized for deferred tax and non- recurring expenses in Australia (due to plant closure ) and IPO related expenses in 2013
All figures in THB mn 2013 2012 %Gr
Normalized1 PATMI before deferred tax
662.0 555.6 19.1%
PATMI before deferred tax adjustment 631.9 555.6 13.7%
Reported PATMI 624.0 577.7 8.0%

32We care
Branded products business – high and stable gross margins
468 529 592826
116152
202
216
117149
173
208
Raw Materials Direct Labor Overhead2010 2011 2012 2013
Gross Margin (THB mn) and margin (%) Commentary
• Growth in gross profits have tracked growth in sales – resulting in steady gross margins between c.63-65%
• Our steady gross margins reflect our ability to maintain the prices of our products while simultaneously controlling our costs
• Raw material costs contributed more than 60.0% of the total COGS and their proportion varies depending on product mix
1,2771,467
1,7342,154
64.5% 63.9% 64.2% 63.3%
0%
10%
20%
30%
40%
50%
60%
70%
0200400600800
1,0001,2001,4001,6001,8002,0002,2002,400
2010 2011 2012 2013
16.7% 16.6%
66.7%
17.9%
18.3%
63.8%
17.9%
20.9%
61.3%
16.6%
17.3%
66.1%
Note: Percentages denote respective item’s contribution as a % of total COGS
701
830966
1,249
Raw materials is the largest direct costCOGS break down (THB mn)

33We care
Distribution business – Gross margins have remained stable on a normalized basis
Profitability of our distribution business has remained stableGross Margin (THB mn)
623
733781
725
0
200
400
600
800
1,000
2010 2011 2012 2013
Commentary
• Reduction in Gross margin in absolute terms in 2013 is due to change in product/principal mix; however net margins as a % of fee earned remains steady
• Net margin (reflecting the gross fee earned by the distribution business net off distribution expenses) has remained steady over the years.
• Normalized Gross margin reflects the Gross fee earned by distribution business adjusted for the impact of change in business model for one of our principals in Myanmar. Change in normalized Gross margin reflects change in product/principal mix.
26.4% 25.4%23.0%
36.3% 35.4%
34.8%
0.0%
10.0%
20.0%
30.0%
40.0%
Reported gross margin Normalized gross margin Net Margin
2011 2012 2013

34We care
OEM business – financial overview
Raw materials is the largest direct cost element
COGS break down (THB mn)
Gross profit (THB mn) and margin (%)
185 193226 218
7490
107 1104651
47 64
Raw Materials Direct Labor Overhead
2010 2011 2012 2013
Total OEM revenues (THB mn)
15.1%
24.2%
60.8%
15.2%26.9%
12.3%
28.2%
59.4%
16.4%
28.1%
55.5%
Note: Percentages denote respective item’s contribution as a % of total COGSCommentary
• OEM revenue are mainly from customers in Thailand and Australia
• In 2013 Gross margin declined to 17.0% from 23.8% because of additional overheads incurred in Australia due to temporary stoppage of production for shifting to the newly constructed plant.
• Gross margin (post adjustment of additional overheads ) in 2013 was 23.4%.
112 109 118
81
26.8%24.7% 23.8%
17.0%
0%
5%
10%
15%
20%
25%
30%
0
20
40
60
80
100
120
140
2010 2011 2012 2013
Decline due to relocation of plant
in Australia
417 443498 473
2010 2011 2012 2013
26.9%
57.9%
305334
379 392
Decline due to relocation of plant
in Australia

35We care
Selling and administrative expenses – benefitting from increased scale
S&A expense has reduced as a % of total sales
35.1% 36.1%33.2% 31.8%
19.7%22.3%
19.3% 19.5%
15.4% 13.9% 13.9%12.3%
Selling & Admin Expenses (% of Sales)Selling Expense (% of Sales)Admin Expense (% of Sales)
2010 2011 2012 2013
Advertising is the largest component of selling expenses
Selling expenses (THB mn)
529695 653
833
170
220 308
353
41
6489
86
80
103103
100
Advertising Personnel Freight expense Others
5.0%20.7%
64.5%
5.9%20.4%
64.2%
7.7%
26.7%
56.7%
6.3%
25.7%
60.7%
9.8%
9.5%8.9%
7.3%
820.4
1,082.21,153.0
1,372.6c.3.3%
reduction since 2010
Personnel costs is the largest component of admin expenses
Administrative expenses (THB mn)
289.9 350.3 423.3 418.6 47.9
59.7 113.9 118.0 303.1
263.6
289.9 326.6
Personnel Travel & Trans. Others
2010 2011 2012 2013
47.3%
7.5%
45.2%
39.1%
8.9%
52.0%
35.1%
13.8%
51.2%
37.8%
13.7%
48.5%
640.9 673.6
827.0 863.1
Commentary
• On an overall basis , selling and administrative has continuously declined reflecting economies of scale
• Advertising comprised the largest of all selling expenses
• In 2013, the Company spent THB 833.1 mn (as against to THB 653.3 mn in 2012) as advertising costs to expand the market and further business
• Approximately 20% - 27% of selling expenses are human resources expenses related to sale force
2010 2011 2012 2013

36We care
Balance sheet and capex summary – significant investments already incurred to boost capacity
Total liabilities and equity (THB mn)Total assets (THB mn)
101 330 3541,540929
1,386 1,288
1,724
688
904 1,442
1,685
362
368
733
970
141
301
515
617
Cash AR Inventories PPE Others
2010 2011 2012 2013
2,221
3,290
4,332
6,536
566 738 1,198 997480
787769 1,145
289446
654 702
885
1,318
1,710
3,693
Debt AP Other liabilities Equities
2010 2011 2012 2013
2,221
3,290
4,332
6,536
IBD/E 0.64x 0.56x 0.70x 0.27x
Commentary
• In 2013, the Company invested for expansion of manufacturing facilities in Thailand and Australia
• Rise in equities was driven by fresh issue of ordinary shares as part of IPO
• Mega’s current manufacturing capacity will be sufficient for its businesses for the next 3 – 5 years
Capital expenditure in THB mn
3080
439
352
2010 2011 2012 2013 Note : Balance sheets elements of previous years are based on restated financials
37We care
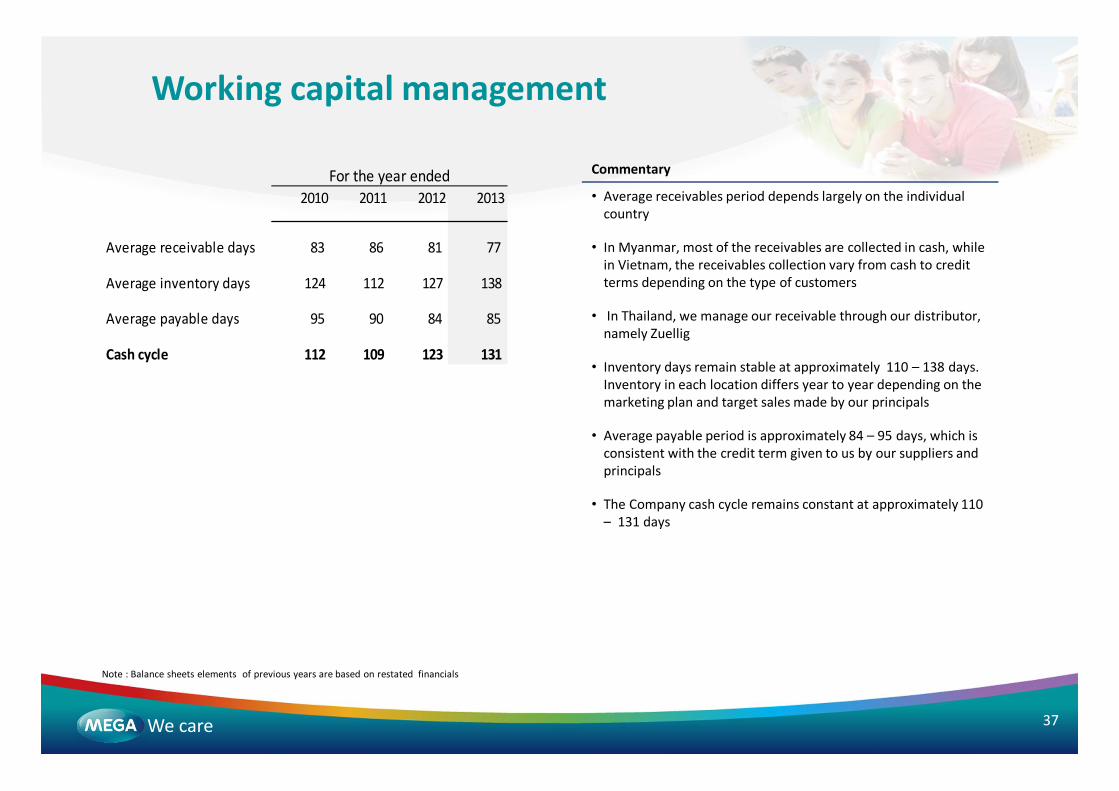
Working capital management
Commentary
• Average receivables period depends largely on the individual country
• In Myanmar, most of the receivables are collected in cash, while in Vietnam, the receivables collection vary from cash to credit terms depending on the type of customers
• In Thailand, we manage our receivable through our distributor, namely Zuellig
• Inventory days remain stable at approximately 110 – 138 days. Inventory in each location differs year to year depending on the marketing plan and target sales made by our principals
• Average payable period is approximately 84 – 95 days, which is consistent with the credit term given to us by our suppliers and principals
• The Company cash cycle remains constant at approximately 110 – 131 days
Note : Balance sheets elements of previous years are based on restated financials
2010 2011 2012 2013
Average receivable days 83 86 81 77
Average inventory days 124 112 127 138
Average payable days 95 90 84 85
Cash cycle 112 109 123 131
For the year ended

38We care
Strong operating cash flow generationCash flows from operations, investments and financing activities (THB mn)
Commentary
Operation continued to generate strong operating cash flows . Net cash from operations increased by 36.1% to THB 465.8 mn in 2013
In FY2013, net cash used in investing activities was THB 396.2 mm; the spent was driven by investment of THB 352.0 mn. in new property, plant, and equipment, which mainly include the expansion of production lines at our manufacturing facilities in Thailand which accounted for THB 256.7 million and the expansion of manufacturing facilities in Australia which accounted for THB 43.2 mn
In FY2013, net cash generated from financing activities was THB 1.10 billion, which mainly came from IPO issue of 129.79 mn ordinary shares of THB 17.5 per share amounting to THB 2.27 billion . Part of IPO proceeds were used for the repayment of term loans and working capital loans from financial institution amounting to THB 1.14 billion.
336 267
342 466
-37 -77
-626
-396(273)
40
304
1,103
26229
20
1,172
Operating cashflow Net cash from (used in) investing activities Net cash from (used in) financing activities Net change in cash
2010 2011 2012 2013

39We care
Taxation and BOI privileges
Board of Investment (“BOI”) privileges
• Exemption from corporate income tax on the net profits derived from the promoted activity (Manufacture of Drugs for Human use) in Thailand
• The amount of tax exemption is not to exceed 100 percent of the total investment (THB339.8 mn), excluding land costs and working capital ; THB 50.1 mn already used
• The period of exemption is for 5 years from the date such income is first derived (Aug 2012 to July 2017)
• Exemption from payment of imported duties on machinery as being approved by BOI and the import should be before Jan 2015
• Exemption from import duties on raw and essential materials imported for use in producing to export, for period of one year after the first import
• Exemption from import duties on items which are imported for re-export, period of one year after the first import
• Exemption from tax on dividend distributed from profits of promoted activity for a period of 5 years (Aug 2012 to July 2017)
Exemption from corporate income tax on profits from the manufacture of drugs in Thailand, for a period of 5 years and for a maximum amount of THB339.8mn (of which THB 59.3 mn has already been used)
(1) The company adopted Thai Accounting Standard for deferred tax (TAS 12) in 2013 with retrospective effect.
1
THB mn 2010 2011 2012 2013
Profit before tax 462.3 565.7 698.3 757.4
Current tax 92.6 107.4 141.2 125.5
Deferred tax - - (22.1) 7.9
Total tax expenses 92.6 107.4 119.1 133.4
Effective tax rate ( before deferred tax) 20.0% 19.0% 20.2% 16.6%
Effective tax rate ( after deferred tax) 20.0% 19.0% 17.1% 17.6%
For the year ended

40We care
Key financial elements
2010 2011 2012 2013
Return on assets (%) 15.8% 16.6% 15.2% 11.5%
Return on equity (%) 47.4% 41.6% 38.2% 23.1%
Debt to equity (times) 1.51 1.50 1.53 0.77
Interest bearing debt to equity (times) 0.64 0.56 0.70 0.27
Earning per share (THB)1 0.43 0.63 0.79 0.84
Note: Number of outstanding equity shares for 2010 ,2011 and 2012 have been adjusted for share split and issue of stock dividend made in 2013
41We care
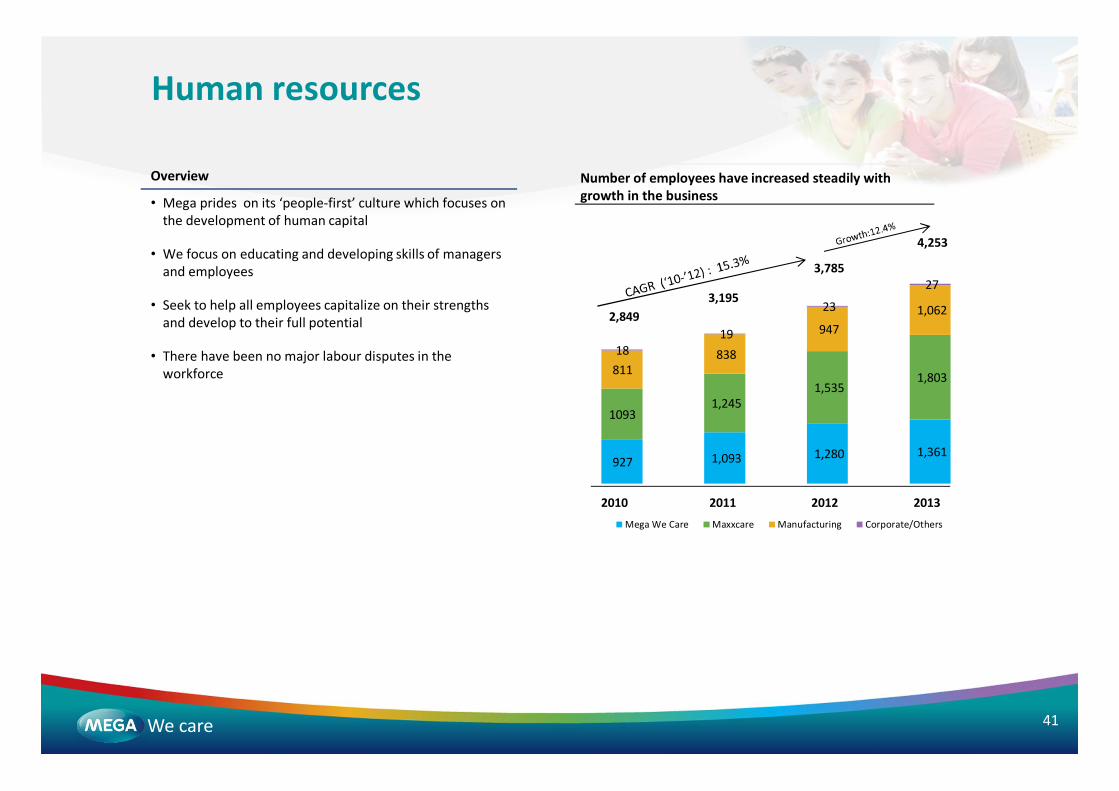
927 1,093 1,280 1,361
10931,245
1,535 1,803 811
838
947 1,062
1819
23
27
Mega We Care Maxxcare Manufacturing Corporate/Others
Number of employees have increased steadily with growth in the business
Human resources
Overview
• Mega prides on its ‘people-first’ culture which focuses on the development of human capital
• We focus on educating and developing skills of managers and employees
• Seek to help all employees capitalize on their strengths and develop to their full potential
• There have been no major labour disputes in the workforce
2,8493,195
3,785
4,253
2010 2011 2012 2013