Meeting the Challenge: Maintaining System Reliability While Meeting Both Economic System Performance...
29
NOVEMBER 4, 2014 | LAS VEGAS, NV Michael I. Henderson DIRECTOR, REGIONAL PLANNING & COORDINATION Transmission & Distribution Summit Improving Transmission Reliability in a Highly Changing Marketplace
-
Upload
marcus-evans -
Category
Business
-
view
166 -
download
1
Transcript of Meeting the Challenge: Maintaining System Reliability While Meeting Both Economic System Performance...
N O V E M B E R 4 , 2 0 1 4 | L A S V E G A S , N V
Michael I. Henderson D I R E C T O R , R E G I O N A L P L A N N I N G & C O O R D I N A T I O N
Transmission & Distribution Summit
Improving Transmission Reliability in a Highly Changing Marketplace
About ISO New England
2
• Private not-for-profit
• Regulated by the federal government
• Independent of companies doing business in market
• Primary Responsibilities – Operate the regional power system – Administer wholesale electricity markets – Power system planning
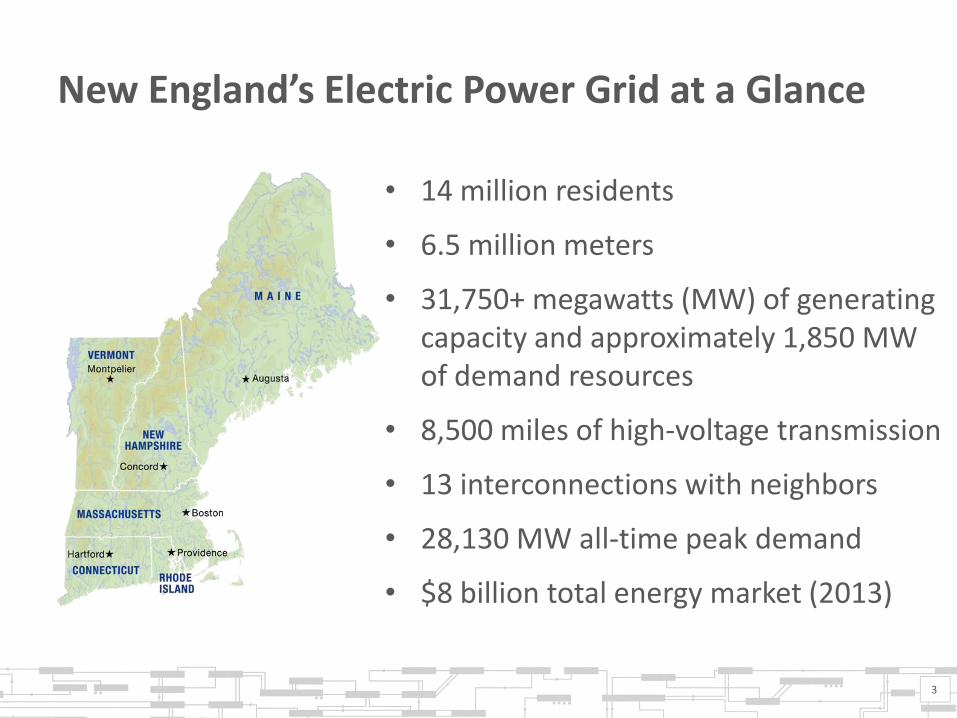
New England’s Electric Power Grid at a Glance
• 14 million residents
• 6.5 million meters
• 31,750+ megawatts (MW) of generating capacity and approximately 1,850 MW of demand resources
• 8,500 miles of high-voltage transmission
• 13 interconnections with neighbors
• 28,130 MW all-time peak demand
• $8 billion total energy market (2013)
3
Outline
• Order 1000
• Recent transmission investment
• Cost allocation
• Renewable policies and generator interconnection queue
• Challenges for the development of transmission in remote area (such as in Maine for wind)
• Illustration of elective transmission projects
• Reliance on natural gas
• Retirements
• Strategic Transmission Analysis
4

Order 1000 Process – Awaiting Final FERC Order
• New England region conducted numerous stakeholder meetings to discuss compliance with new requirements
2012-2013
• Addressed interregional planning requirements
• ISO built on the Planning Coordination Protocol
• Interregional cost allocation
July 10, 2013 Compliance Filing
• States that the region must “identify” and “consider” transmission plans in response to state and federal public policies, which may drive the need for transmission
• Removes arrangements that protect the right of first refusal (ROFR) in federal documents for incumbent transmission providers
November 15, 2013 Compliance Filing
5
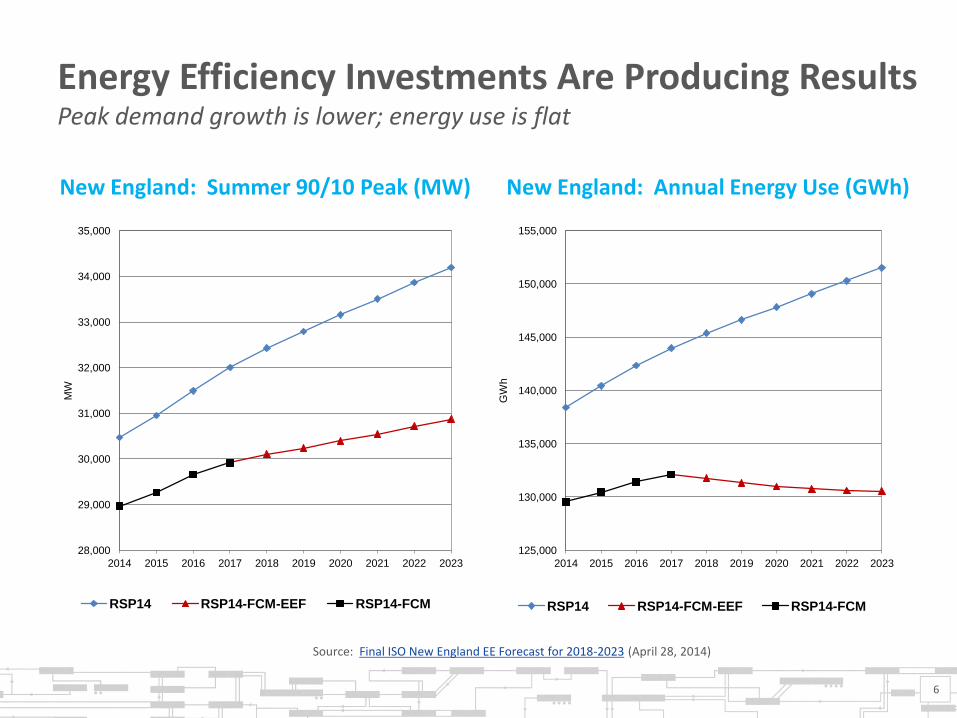
Energy Efficiency Investments Are Producing Results Peak demand growth is lower; energy use is flat
New England: Annual Energy Use (GWh) New England: Summer 90/10 Peak (MW)
Source: Final ISO New England EE Forecast for 2018-2023 (April 28, 2014)
28,000
29,000
30,000
31,000
32,000
33,000
34,000
35,000
2014 2015 2016 2017 2018 2019 2020 2021 2022 2023
MW
RSP14 RSP14-FCM-EEF RSP14-FCM
125,000
130,000
135,000
140,000
145,000
150,000
155,000
2014 2015 2016 2017 2018 2019 2020 2021 2022 2023
GW
h
RSP14 RSP14-FCM-EEF RSP14-FCM
6

Transmission Upgrades in New England
Generally Funded by
Entity Proposing Project
Funded by Region,
Localized Costs
Excluded
EXISTING
Generation Interconnection 100%
Elective Transmission 100%
Merchant Transmission 100%
Local Benefit Upgrades/ Localized Costs 100%
Regional Benefit Upgrades (Reliability & Market Efficiency) 100%
PROPOSED
Regional Benefit Upgrades (Public Policy)* *Order 1000 Compliance Filing Pending
30% 70%
7
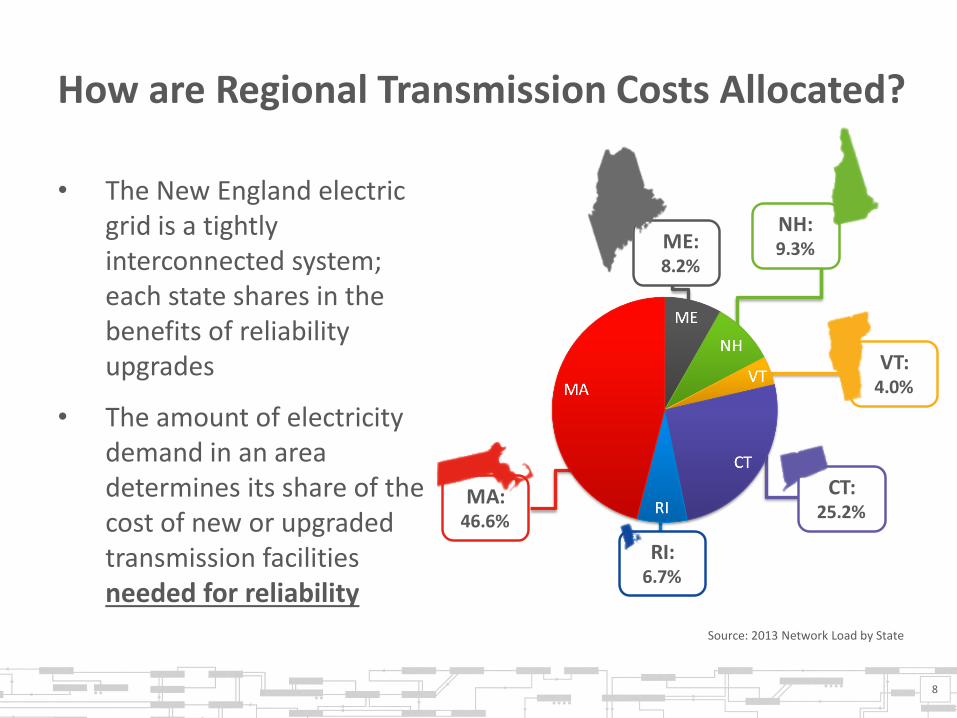
How are Regional Transmission Costs Allocated?
8
• The New England electric grid is a tightly interconnected system; each state shares in the benefits of reliability upgrades
• The amount of electricity demand in an area determines its share of the cost of new or upgraded transmission facilities needed for reliability
Source: 2013 Network Load by State
ME:8.2%
RI:6.7%
MA:46.6%
NH:9.3%
VT:4.0%
CT:25.2%
9
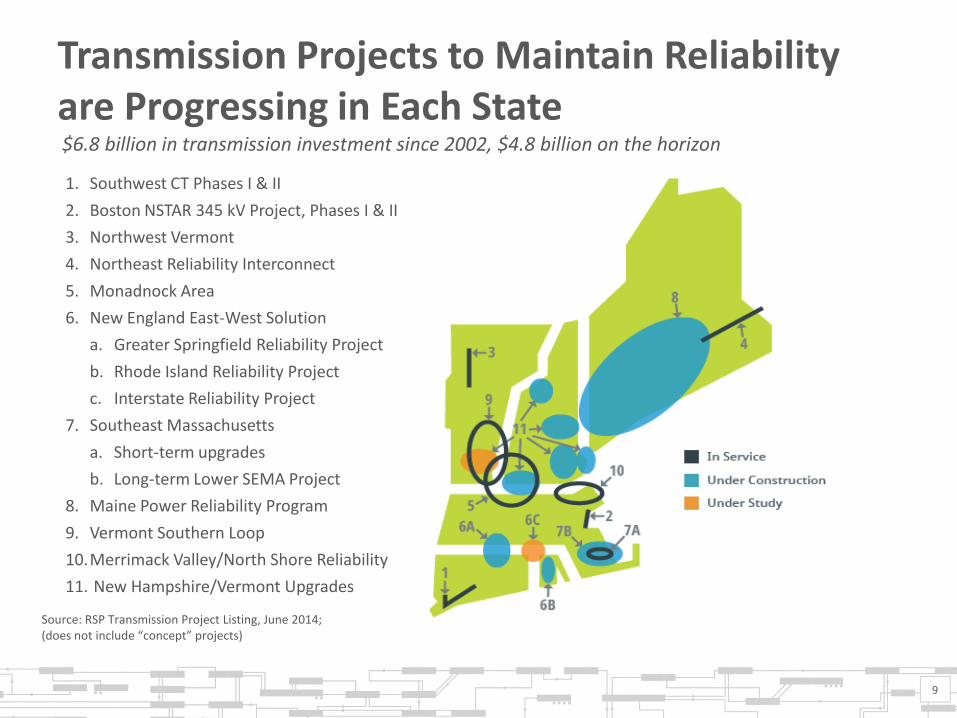
1. Southwest CT Phases I & II
2. Boston NSTAR 345 kV Project, Phases I & II
3. Northwest Vermont
4. Northeast Reliability Interconnect
5. Monadnock Area
6. New England East-West Solution
a. Greater Springfield Reliability Project
b. Rhode Island Reliability Project
c. Interstate Reliability Project
7. Southeast Massachusetts
a. Short-term upgrades
b. Long-term Lower SEMA Project
8. Maine Power Reliability Program
9. Vermont Southern Loop
10.Merrimack Valley/North Shore Reliability
11. New Hampshire/Vermont Upgrades
Transmission Projects to Maintain Reliability are Progressing in Each State $6.8 billion in transmission investment since 2002, $4.8 billion on the horizon
Source: RSP Transmission Project Listing, June 2014; (does not include “concept” projects)
Region Has Seen Growth in Wind Development
• Aggressive renewable portfolio standards and public policies have helped stimulate wind development
• 800 MW of large scale wind have begun commercial operation
• Additional efforts underway to: – Improve wind power forecasting tools – Allow negative bidding in energy market
(December 2014)
10
MA 480 MW
ME 3,080 MW
NH 65
MW
VT 30
MW
All Proposed Generation
11
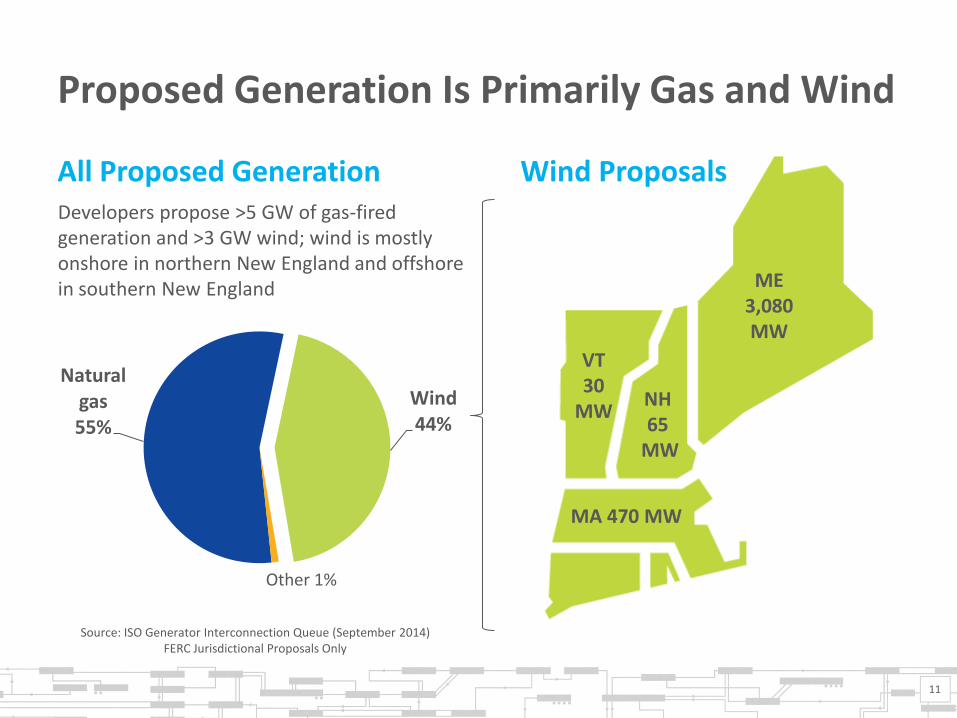
Developers propose >5 GW of gas-fired generation and >3 GW wind; wind is mostly onshore in northern New England and offshore in southern New England
Wind Proposals
Proposed Generation Is Primarily Gas and Wind
Source: ISO Generator Interconnection Queue (September 2014) FERC Jurisdictional Proposals Only
ME 3,080 MW
NH 65
MW
VT 30
MW
MA 470 MW
Natural gas 55%
Wind 44%
Other 1%
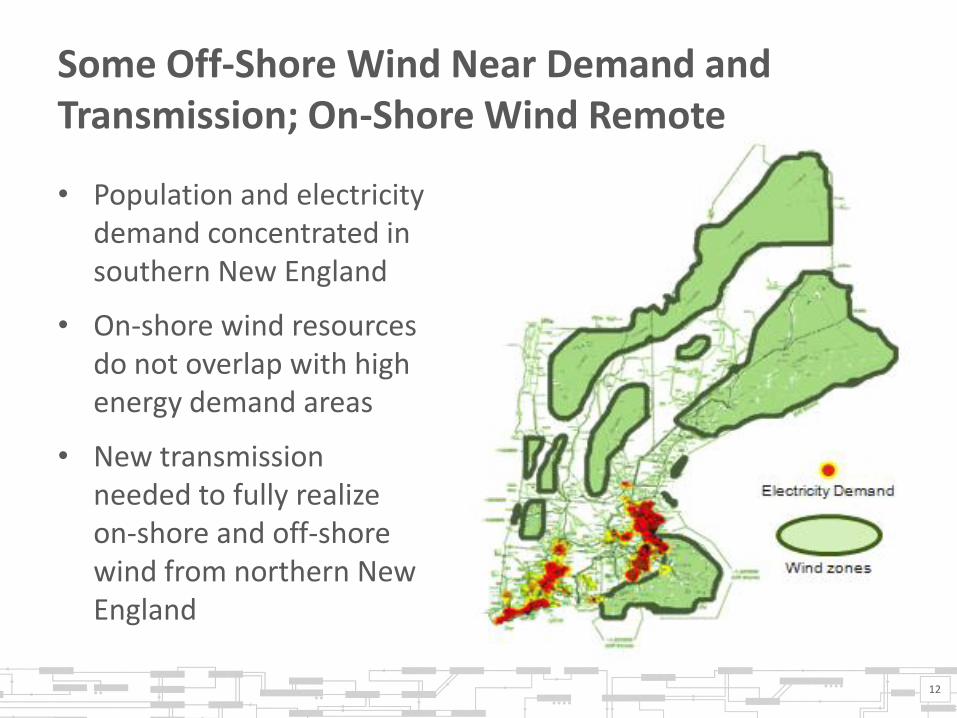
Some Off-Shore Wind Near Demand and Transmission; On-Shore Wind Remote
• Population and electricity demand concentrated in southern New England
• On-shore wind resources do not overlap with high energy demand areas
• New transmission needed to fully realize on-shore and off-shore wind from northern New England
12
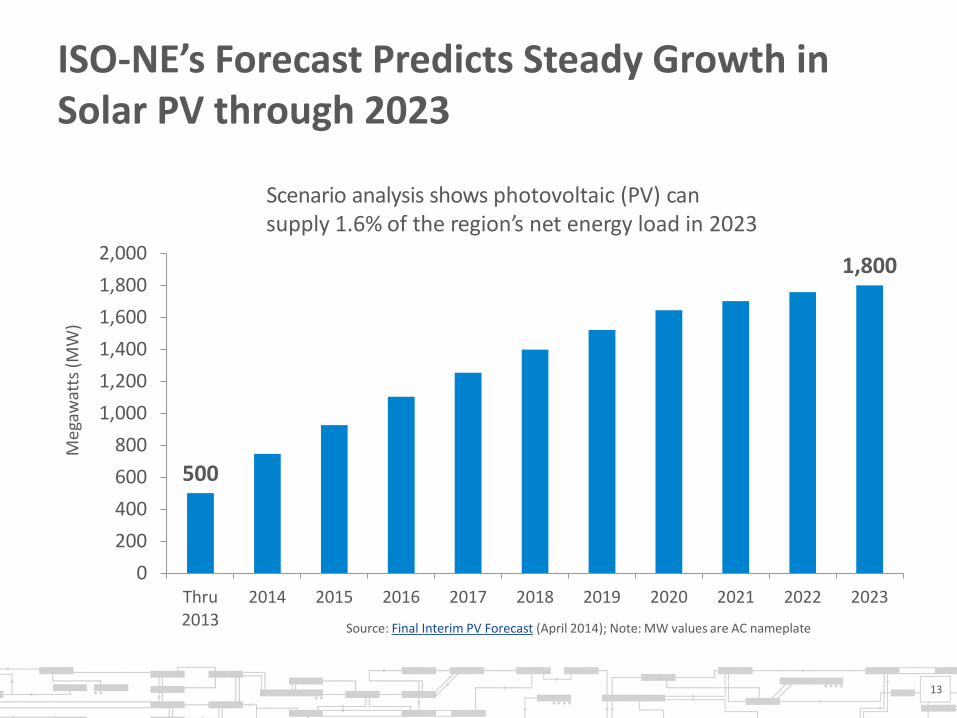
ISO-NE’s Forecast Predicts Steady Growth in Solar PV through 2023
500
1,800
0
200
400
600
800
1,000
1,200
1,400
1,600
1,800
2,000
Thru 2013
2014 2015 2016 2017 2018 2019 2020 2021 2022 2023
Meg
awat
ts (
MW
)
Source: Final Interim PV Forecast (April 2014); Note: MW values are AC nameplate
13
Scenario analysis shows photovoltaic (PV) can supply 1.6% of the region’s net energy load in 2023
Current State PV Interconnection Standards Pose Potential Reliability Concerns
• ISO is working with stakeholder groups to recommend changes to these standards to allow for: – Voltage ride-through – Frequency ride-through – Voltage support – Ramp rates – Soft-start capability
• All of these functionalities could be achieved with minor changes to existing inverter technology
14
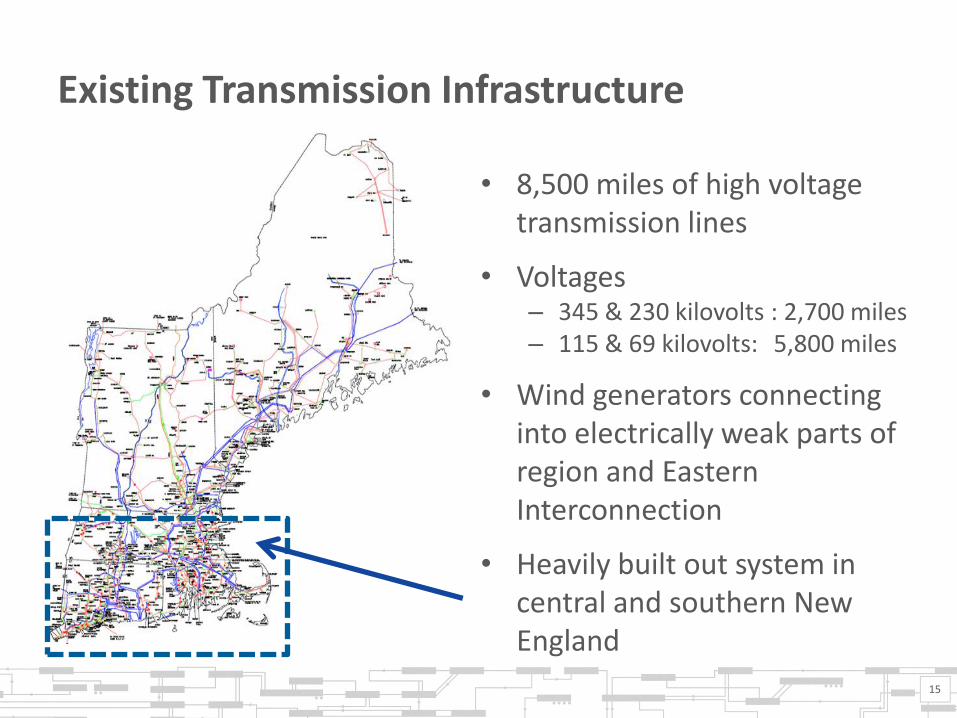
Existing Transmission Infrastructure
• 8,500 miles of high voltage transmission lines
• Voltages – 345 & 230 kilovolts : 2,700 miles – 115 & 69 kilovolts: 5,800 miles
• Wind generators connecting into electrically weak parts of region and Eastern Interconnection
• Heavily built out system in central and southern New England
15

Distances to New England Hub
• Greater distances require greater investment to get power to hub
• Off-shore wind resources in southern New England have shorter distances than resources in northern New England to get power to load
16
450 miles
250 miles
100 miles
17
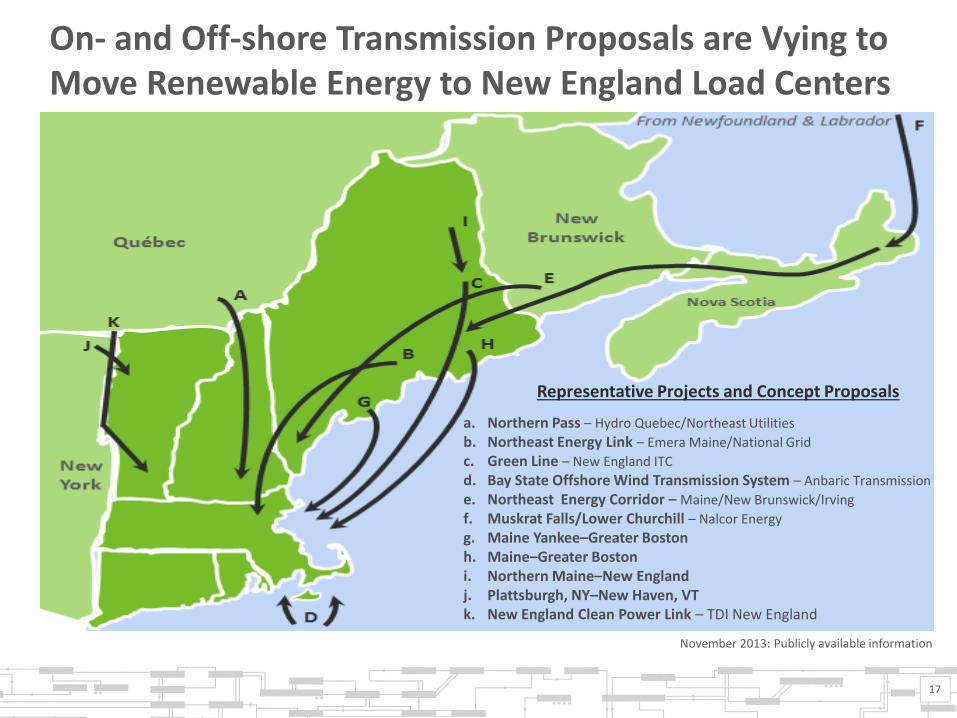
a. Northern Pass – Hydro Quebec/Northeast Utilities
b. Northeast Energy Link – Emera Maine/National Grid
c. Green Line – New England ITC
d. Bay State Offshore Wind Transmission System – Anbaric Transmission
e. Northeast Energy Corridor – Maine/New Brunswick/Irving
f. Muskrat Falls/Lower Churchill – Nalcor Energy
g. Maine Yankee–Greater Boston h. Maine–Greater Boston i. Northern Maine–New England j. Plattsburgh, NY–New Haven, VT k. New England Clean Power Link – TDI New England
Representative Projects and Concept Proposals
November 2013: Publicly available information
On- and Off-shore Transmission Proposals are Vying to Move Renewable Energy to New England Load Centers

New England Flexible Alternating Current Transmission Systems (FACTS)
18
HVDC VSC HVDC
A Highgate
D Cross Sound Cable B Comerford (Retired)
C Sandy Pond (Phase II)
SVC STATCOM
E Chester G Essex
F Barnstable H Glenbrook
DVAR Synchronous Condensor
I Stony Hill (2) M Granite (4)
J Bates Rock Planned Dynamic Devices
Generators in Northern VT and Western Maine
K Kibby (2)
L Granite Wind
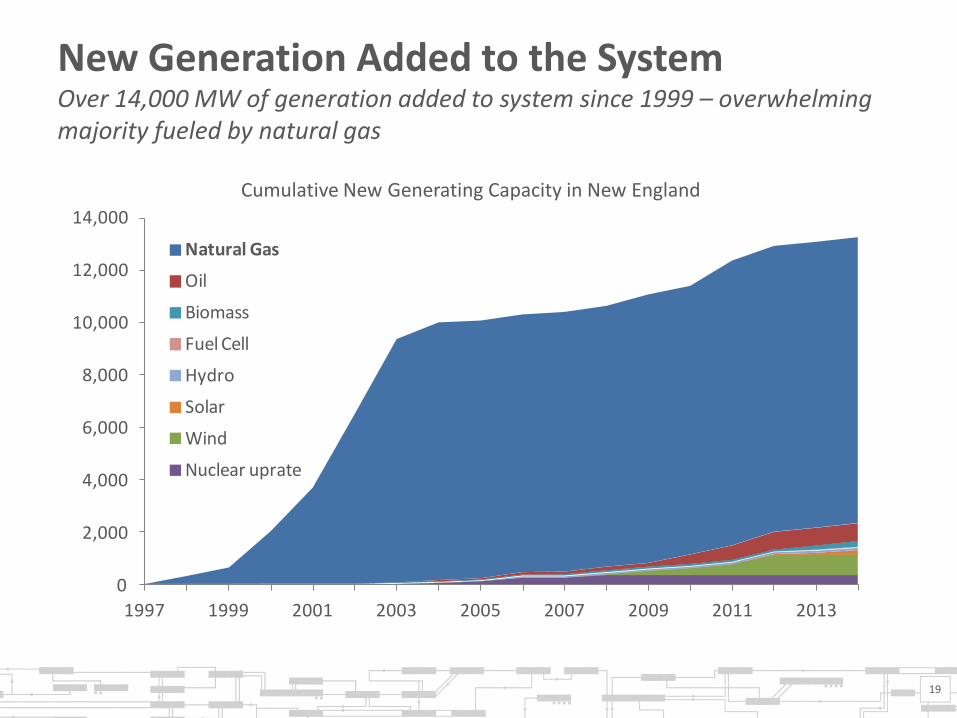
New Generation Added to the System Over 14,000 MW of generation added to system since 1999 – overwhelming majority fueled by natural gas
19
0
2,000
4,000
6,000
8,000
10,000
12,000
14,000
1997 1999 2001 2003 2005 2007 2009 2011 2013
Natural Gas
Oil
Biomass
Fuel Cell
Hydro
Solar
Wind
Nuclear uprate
Cumulative New Generating Capacity in New England
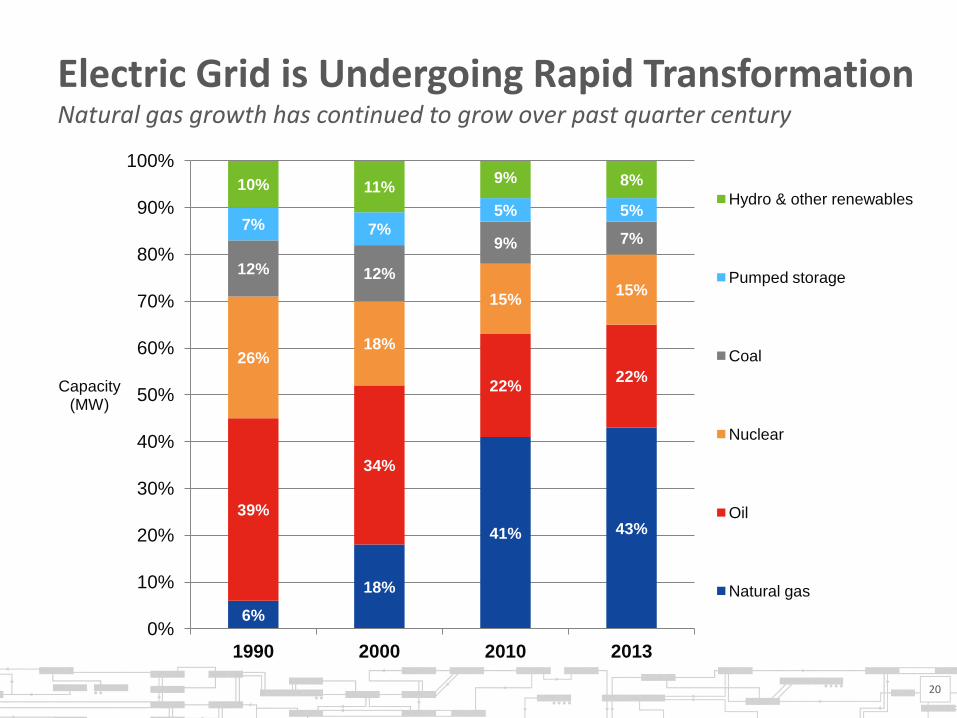
Electric Grid is Undergoing Rapid Transformation Natural gas growth has continued to grow over past quarter century
20
6%
18%
41% 43%
39%
34%
22% 22%
26% 18%
15% 15%
12% 12%
9% 7% 7% 7%
5% 5%
10% 11% 9% 8%
0%
10%
20%
30%
40%
50%
60%
70%
80%
90%
100%
1990 2000 2010 2013
Capacity (MW)
Hydro & other renewables
Pumped storage
Coal
Nuclear
Oil
Natural gas
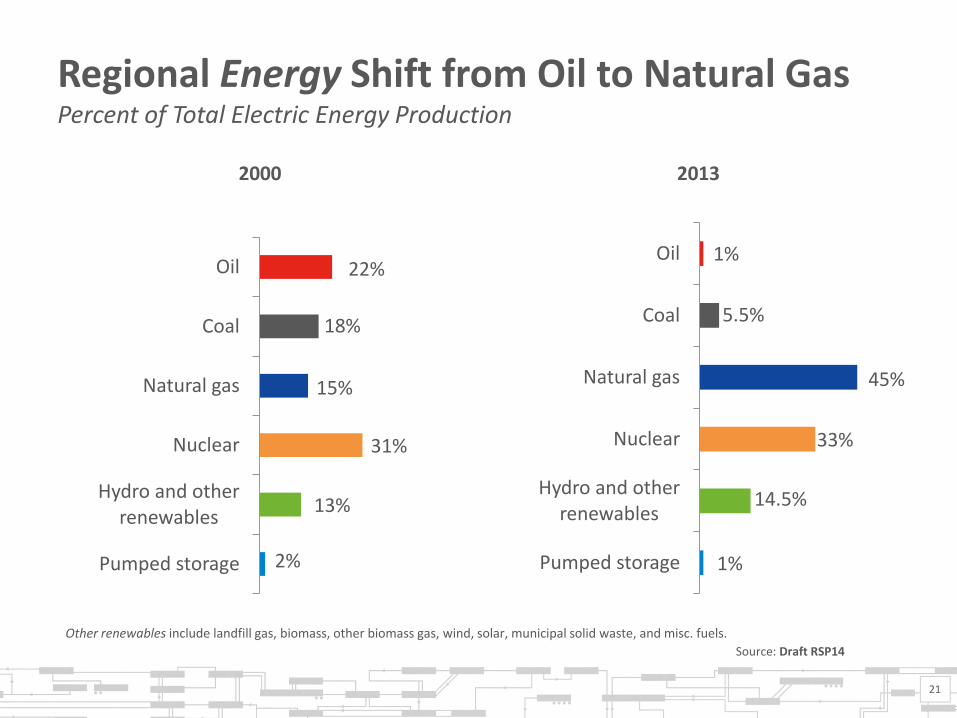
Regional Energy Shift from Oil to Natural Gas Percent of Total Electric Energy Production
2%
13%
31%
15%
18%
22%
Pumped storage
Hydro and other renewables
Nuclear
Natural gas
Coal
Oil
2000
1%
14.5%
33%
45%
5.5%
Pumped storage
Hydro and other renewables
Nuclear
Natural gas
Coal
Oil
2013
21
Other renewables include landfill gas, biomass, other biomass gas, wind, solar, municipal solid waste, and misc. fuels.
Source: Draft RSP14
1%
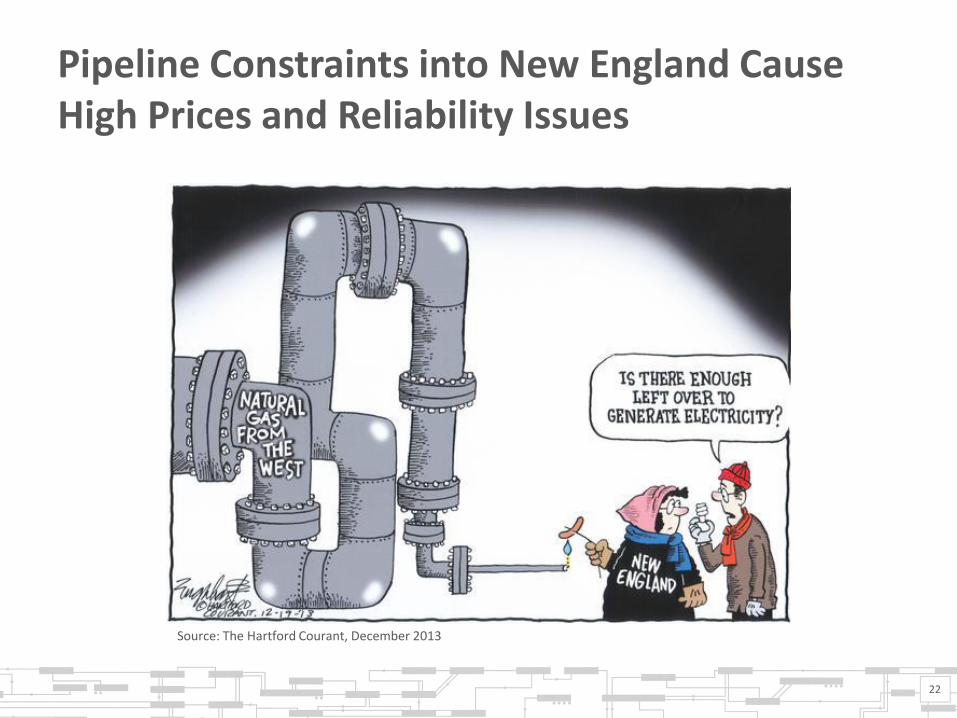
Pipeline Constraints into New England Cause High Prices and Reliability Issues
22
Source: The Hartford Courant, December 2013
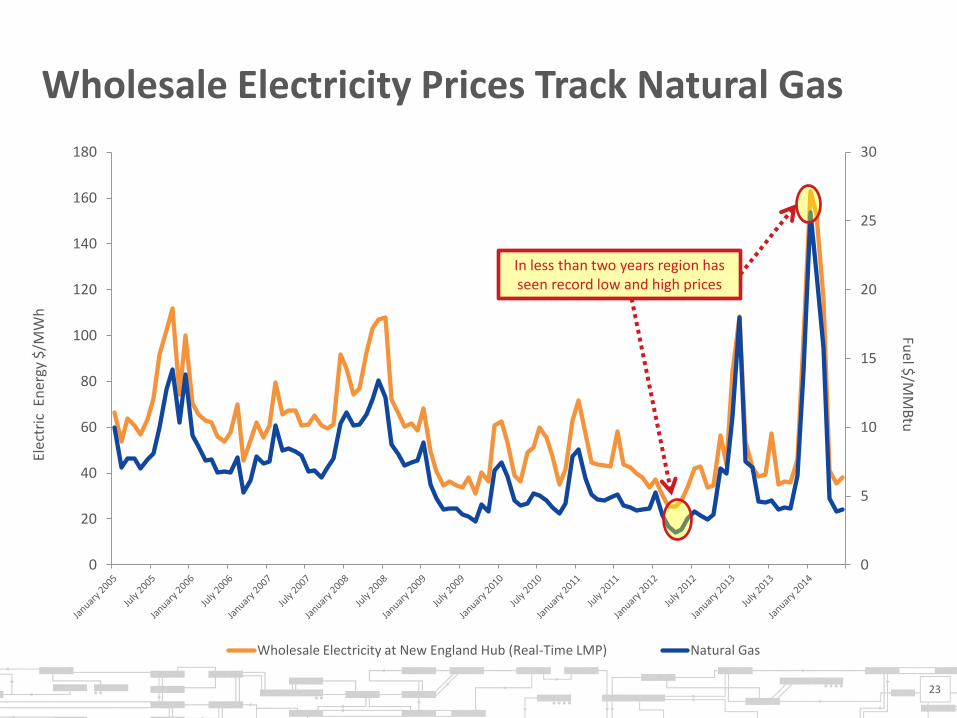
Wholesale Electricity Prices Track Natural Gas
23
0
5
10
15
20
25
30
0
20
40
60
80
100
120
140
160
180
Wholesale Electricity at New England Hub (Real-Time LMP) Natural Gas
Ele
ctri
c E
ner
gy $
/MW
h
Fuel $
/MM
Btu
In less than two years region has seen record low and high prices

Environmental Issues and Renewable Integration
24
• Challenges facing new and existing generation
– Over the past decade, average and marginal emissions rates have declined, in part due to the region’s increased use of natural gas
– Higher operating costs, reduced capacity or energy production
– Additional capital improvements and resource retirements
– Increased use of natural-gas-fired generation is likely
– Relicensing of nuclear and hydro facilities could reduce output and flexibility
• Public policy and regulation are driving the development of renewable resources, energy efficiency, and distributed generation
• Wind projects that interconnect to weak portions of the system are at risk of curtailment unless the transmission system is expanded
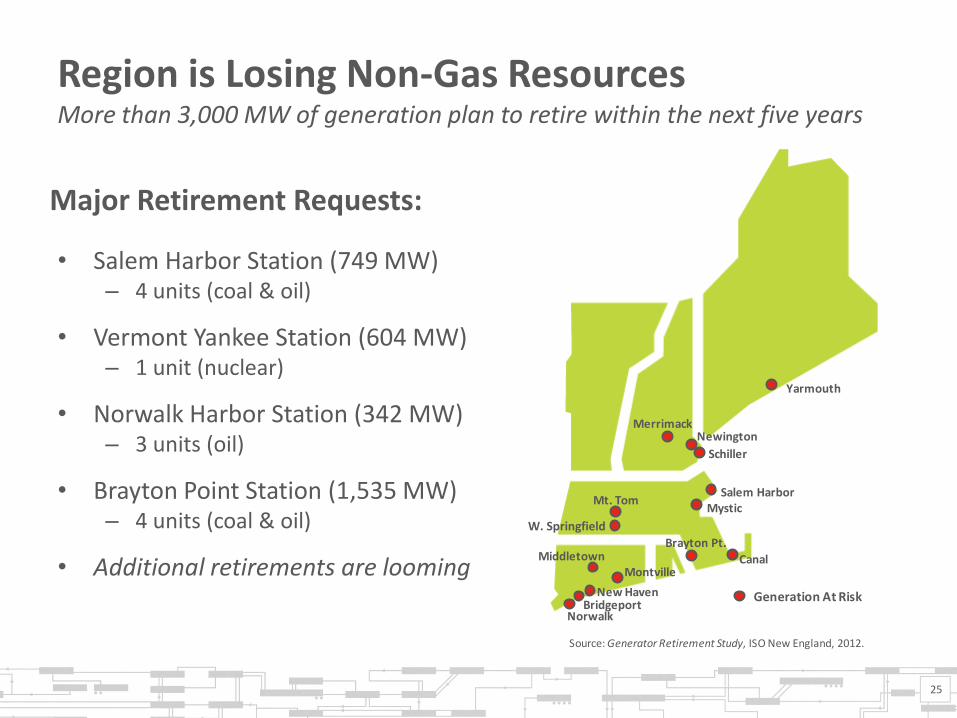
Region is Losing Non-Gas Resources More than 3,000 MW of generation plan to retire within the next five years
• Salem Harbor Station (749 MW) – 4 units (coal & oil)
• Vermont Yankee Station (604 MW) – 1 unit (nuclear)
• Norwalk Harbor Station (342 MW) – 3 units (oil)
• Brayton Point Station (1,535 MW) – 4 units (coal & oil)
• Additional retirements are looming
Major Retirement Requests:
25
Generation At Risk
Source: Generator Retirement Study, ISO New England, 2012.
Yarmouth
Newington
Schiller
Merrimack
Mt. Tom
Brayton Pt.
Canal
MysticSalem Harbor
BridgeportNorwalk
New Haven
MiddletownMontville
Generation At Risk
Source: Generator Retirement Study, ISO New England, 2012.
W. Springfield
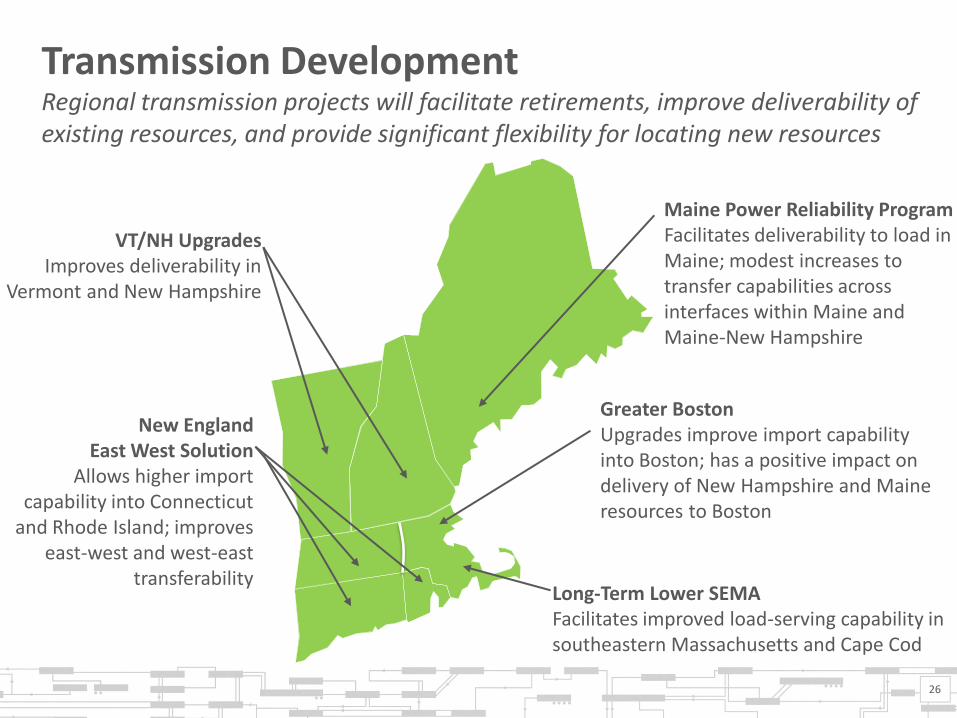
VT/NH Upgrades
Improves deliverability in Vermont and New Hampshire
Long-Term Lower SEMA Facilitates improved load-serving capability in southeastern Massachusetts and Cape Cod
Greater Boston Upgrades improve import capability into Boston; has a positive impact on delivery of New Hampshire and Maine resources to Boston
Maine Power Reliability Program Facilitates deliverability to load in Maine; modest increases to transfer capabilities across interfaces within Maine and Maine-New Hampshire
Transmission Development Regional transmission projects will facilitate retirements, improve deliverability of existing resources, and provide significant flexibility for locating new resources
New England East West Solution
Allows higher import capability into Connecticut
and Rhode Island; improves east-west and west-east
transferability
26
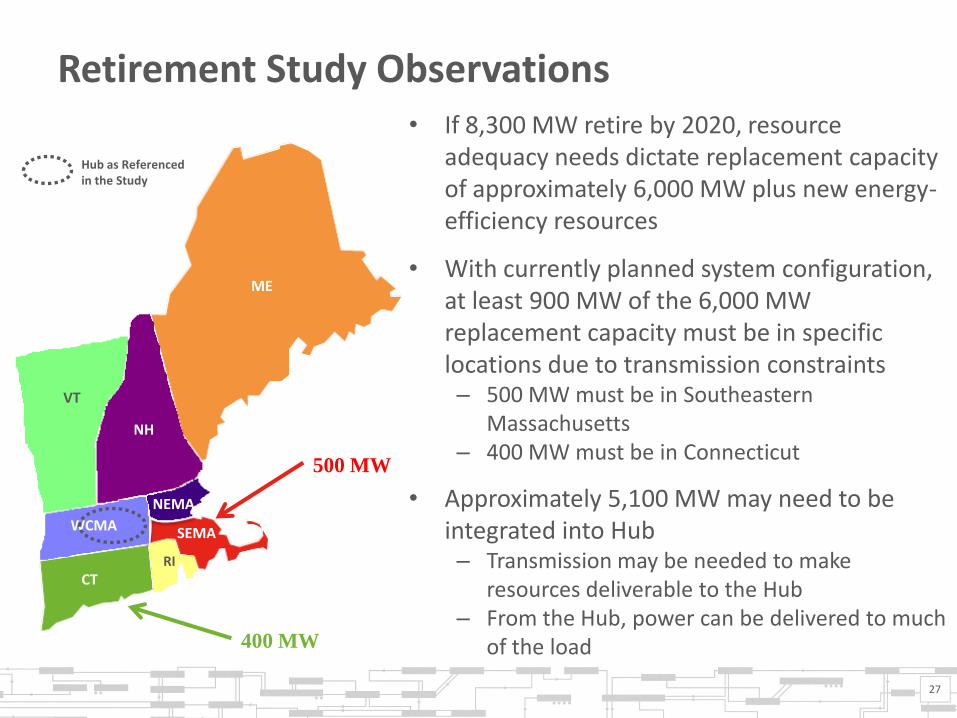
Retirement Study Observations • If 8,300 MW retire by 2020, resource
adequacy needs dictate replacement capacity of approximately 6,000 MW plus new energy-efficiency resources
• With currently planned system configuration, at least 900 MW of the 6,000 MW replacement capacity must be in specific locations due to transmission constraints – 500 MW must be in Southeastern
Massachusetts – 400 MW must be in Connecticut
• Approximately 5,100 MW may need to be integrated into Hub – Transmission may be needed to make
resources deliverable to the Hub – From the Hub, power can be delivered to much
of the load
27
VT
NH
ME
NEMA
CT
SEMA WCMA
RI
500 MW
400 MW
Hub as Referenced in the Study

Interregional Planning and Coordination Activities
28
U.S. Department of Energy
Congestion Study
Eastern Interconnection
Planning Collaborative (EIPC)
Electric Reliability Organization (ERO)
Northeast Power Coordinating
Council (NPCC)
ISO/RTO Council (IRC)
Northeastern ISO/RTO Planning
Coordination Protocol

29