Meeting of the University Budget Committee
83
Meeting of the University Budget Committee Thursday, March 18, 2021
Transcript of Meeting of the University Budget Committee

Meeting of the
University Budget Committee Thursday, March 18, 2021

Welcome from UBC co-chairs
Jennifer SummitProvost and Vice President
Academic Affairs
Jeff WilsonInterim Vice President & CFO
Administration & Finance
Budget Transparency Resources
SF State’s Budget Administration and Operations Officehttps://budget.sfsu.edu/
SF State University Budget Committee https://adminfin.sfsu.edu/ubc
CSU’s Transparency and Accountability portalhttps://www2.calstate.edu/csu-system/transparency-accountability/Pages/default.aspx

Reminder about tomorrow:
Friday, March 19th from 10:00 AM – 11:00AM
is the first
UBC member-hosted “Office Hours”via Zoom, offered by UBC members for their colleagues:
Staff – hosted by Mary Menees and Dylan MooneyFaculty – hosted by Genie Stowers and Jerry Shapiro
Students – hosted by Andrew CarrilloMPPs – hosted by Dean Amy Sueyoshi
Drop in, ask questions, share your feedback
RSVP for the Zoom link to [email protected]
Can’t attend? Feel free to submit feedback 24/7 on the UBC page: https://adminfin.sfsu.edu/ubc
remaining Spring dates: Friday, April 16th and Friday, May 21st

UBC dialogue and feedback resources:
• UBC email: [email protected]
• UBC webpage new “Feedback” button:
https://adminfin.sfsu.edu/ubc

Today’s Agenda:Welcome Co-Chairs Jeff Wilson & Jennifer Summit
1. Approval of minutes from Feb. 25, 2021 meeting IVP Jeff Wilson
2. Opening remarks President Lynn Mahoney
BUDGET TRANSPARENCY3. Carryforwards & Reserves Elena Stoian, Exec. Director, Budget A&O
PRESENTATIONS4. Enrollment Update; Challenges & Planning AP Sutee Sujitparapitaya, SAVP Katherine Lynch,
Dean Lori Beth Way
5. University Enterprises; proposed 2021-2022 Budget VP Jason Porth & AVP Tammie Ridgell
UPDATES AND INFORMATIONAL ITEM6. Federal Funding update IVP Jeff Wilson
ACTION ITEM FOR THE COMMITTEE(none for this meeting)
OPEN FORUM (20 minutes; three-minute limit per speaker)
ADJOURNMENT (next meeting Thursday, April 29th, 2021)

Approval of February 25th UBC Meeting Minutes___________
(Members, please request an edit or state your motion to approve)

Opening Remarks___________
President Lynn Mahoney

Budget Transparency topic:
Carryforwards & Reserves
Elena StoianExecutive Director
Budget Administration & Operations
Administration & Finance

AGENDA
• Terminology• Reporting Hierarchies• Designated Categories• 3 Yrs. of Data by Cabinets
10
Note: In all slides- data is presented in thousands

AGENDA
• Terminology• Reporting Hierarchies• Designated Categories• 3 Yrs. of Data by Cabinets
11
Note: In all slides- data is presented in thousands

TerminologyCARRY-FORWARD BALANCE: At the end of a prior fiscal year, the unexpended balance is posted as a budget in the new fiscal year, representing the prior year's cumulative results.
• Carryforwards may accumulate over a number of years based on the annual difference between budgeted expenditures and actual expenditures. The CSU's financial system requires expenditures to be budgeted and recorded by the department so carryforwards, unlike reserves, are attributable to divisions, colleges, and specific departments.
• Related to campus operating fund ( general fund)
12
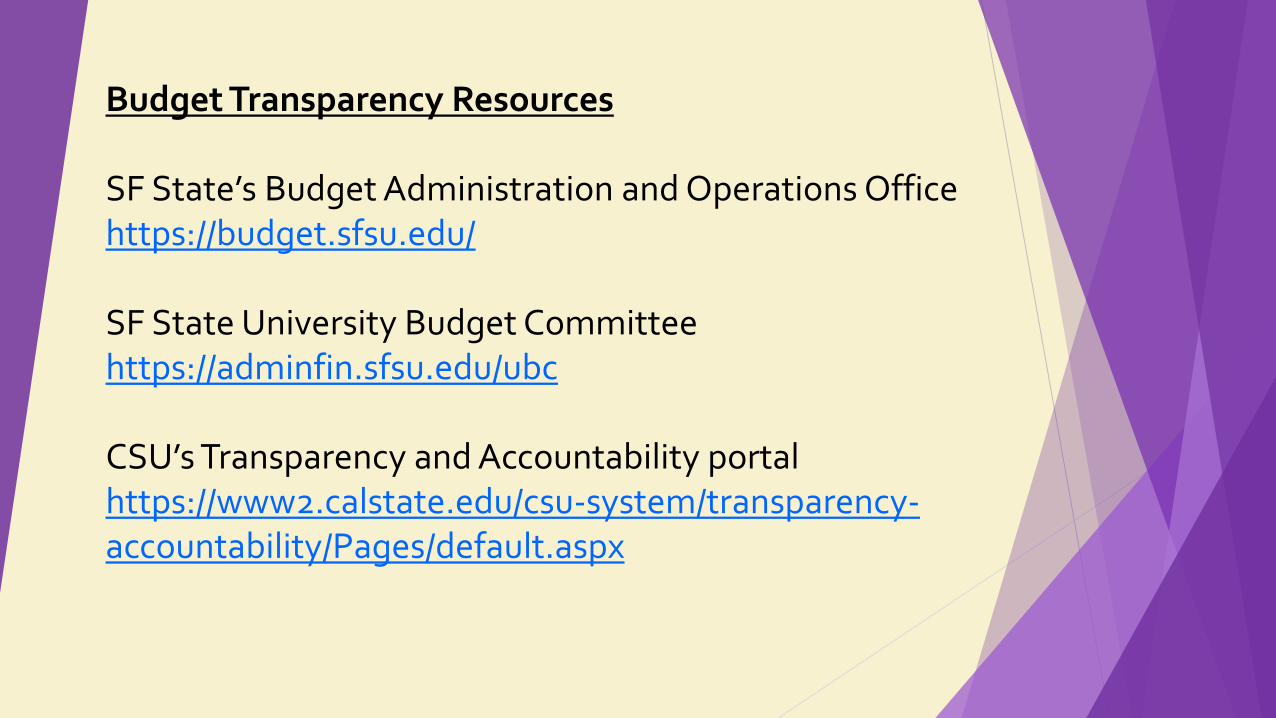
TerminologyDESIGNATED BALANCE & RESERVE: Designated balances and reserves ensure the University’s financial health and stability. In good economic and budgetary years, designated balances and reserves may be accumulated to prepare for uncertain or negative economic and budgetary years. During economic downturns, designated balances and reserves can provide a cushion to absorb the impact of reduced California state funding and reduced tuition and fee revenue due to declining enrollment. • Designated balances and reserves may also be used to cover
unanticipated costs.• Designated balances and reserves are recorded and reported at the
University-level per CSU reporting requirements. 13

AGENDA
• Terminology• Reporting Hierarchies• Designated Categories• 3 Yrs. of Data by Cabinets
14

Reporting Hierarchy by Fund
15
Units
Campus Fund
CSU Fund 485- Operating Fund
General Fund(NG)
Dep_1CFW
Dep_2CFW
Class Fees(TS)
Dep_1CFW
FUND - Identifies the source of revenue for the account.
Unit/Department - Identifies the area of the university in which expenditures occur and the hierarchy of
responsibility

AGENDA
• Terminology• Reporting Hierarchies• Designated Categories • 3 Yrs. of Data by Cabinets
16

Reporting Hierarchy by Category
17
1. Short-term Obligations Outstanding CommitmentsEncumbrancesProgram DevelopmentFuture Debt ServiceFinancial Aid
2. Capital Capital Improvements &Construction
Facilities Maintenance &RepairsEquipment Acquisition
3. Catastrophic Events Designated for Catastrophic Events
4. Reserves Reserve for Economic Uncertainty

Reporting Hierarchy by Category
18
1.Designated
Short-term Obligations
Capital
Catastrophic Events
2.Reserve Reserves

AGENDA
• Terminology• Reporting Hierarchies• Designated Categories• 3 Yrs. of Data by Cabinets
19

FY2020-21 CSU – 485 CFW by Cabinets
20
Cabinets FY17-18 FY18-19 FY19-20 YOY
Academic Affairs 24,795 23,925 22,610 -5%
Administration & Finance 14,544 15,914 -1,100 -107%
Office of the President 495 414 934 125%
Student Affairs & Enroll Mgmnt. 8,554 7,448 6,199 -17%
University Advancement 782 789 1,618 105%
University Enterprise 698 938 1,157 23%
University Wide 28,255 27,149 15,329 -44%
Total $78,123 $76,577 $46,747 -39%
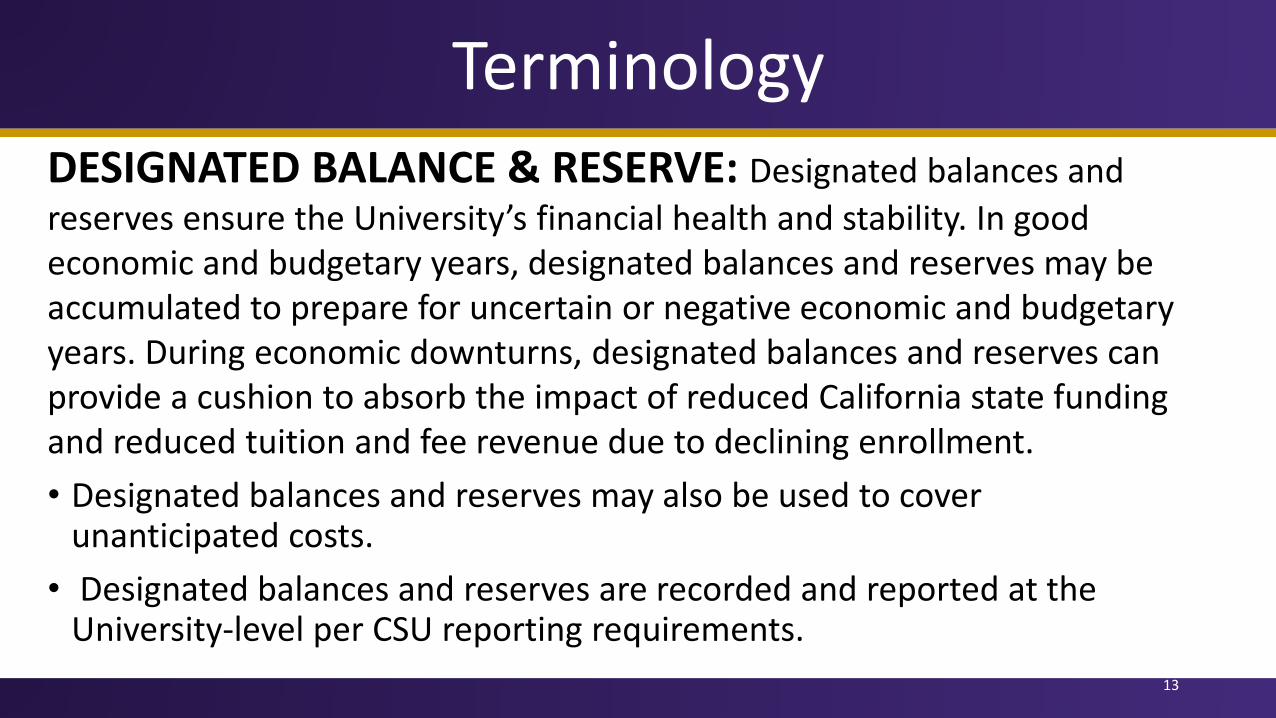
Designated & Reserves – Academic Affairs
21
Category FY17-18 FY18-19 FY19-20
Designated Equipment Acquisition 751 659 -
Designated Facilities Maintenance & Repair 135 115 -
Designated for Capital Improvement/Construction 60 - -
Designated for Encumbrance 1,398 2,041 1,178
Designated for Outstanding Commitments 2,351 10,647 21,432
Designated for Program Development 6,514 2,622 -
Reserve for Economic Uncertainty 13,586 7,841 -
Total $24,795 $23,925 $22,610

Designated & Reserves – Academic Affairs
22
Category FY17-18 FY18-19 FY19-20
Short Term Obligations 10,263 15,310 22,610Capital 946 774 -Reserves 13,586 7,841 -
Total $24,795 $23,925 $22,610
21500
22000
22500
23000
23500
24000
24500
25000
Carryforward
FY17-18
FY18-19
FY19-20

Designated & Reserves – Administration & Finance
23
Admin & Finance FY17-18 FY18-19 FY19-20
Designated Facilities Maintenance & Repair 658 - -Designated for Encumbrance 1,743 3,015 2,606Designated for Outstanding Commitments 3,333 3,011 -3,707Designated for Program Development 1,700 4,778 -Reserve for Economic Uncertainty 7,110 5,114 -
Total $14,544 $15,918 -$1,100

Designated & Reserves – Administration & Finance
24
Category FY17-18 FY18-19 FY19-20Short Term Obligations 6,776 10,804 -1,100Capital 658 - -Reserves 7,110 5,114 -
Total $14,544 $15,918 -$1,100
-5000
0
5000
10000
15000
20000
Carryforward
FY17-18
FY18-19
FY19-20

Designated & Reserves – The Office of President
25
Category FY17-18 FY18-19 FY19-20
Designated for Encumbrance 2 6 459
Designated for Outstanding Commitments - 1,493 2,071
Designated for Program Development - 837 511
Reserve for Economic Uncertainty 493 - -
Total $495 $2,336 $3,041

Designated & Reserves – The Office of President
26
Category FY17-18 FY18-19 FY19-20
Short Term Obligations 2 2,336 3,041Reserves 493 - -
Total $495 $2,336 $3,041
0
500
1000
1500
2000
2500
3000
3500
Carryforward
FY17-18
FY18-19
FY19-20
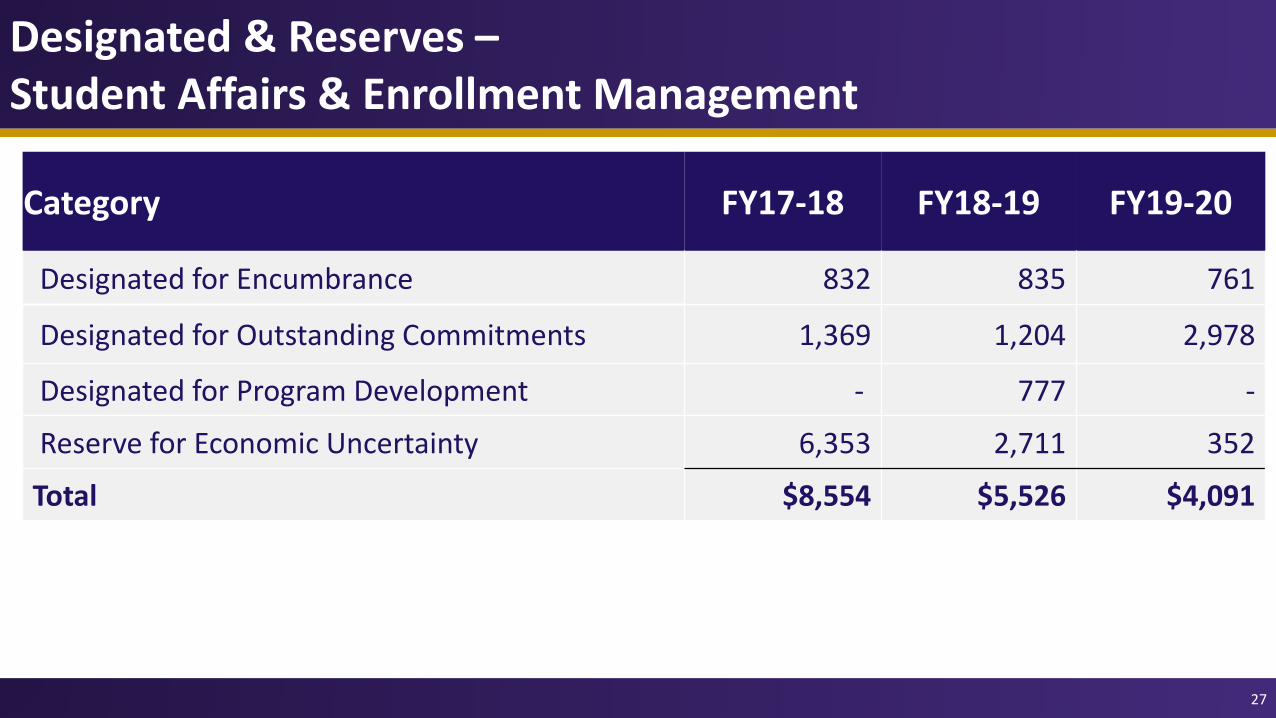
27
Category FY17-18 FY18-19 FY19-20
Designated for Encumbrance 832 835 761
Designated for Outstanding Commitments 1,369 1,204 2,978
Designated for Program Development - 777 -
Reserve for Economic Uncertainty 6,353 2,711 352
Total $8,554 $5,526 $4,091
Designated & Reserves –Student Affairs & Enrollment Management

Designated & Reserves –Student Affairs & Enrollment Management
28
Category FY17-18 FY18-19 FY19-20
Short Term Obligations 2,201 2,815 3,739
Reserves 6,353 2,711 352
Total $8,554 $5,526 $4,091
0100020003000400050006000700080009000
Carryforward
FY17-18
FY18-19
FY19-20
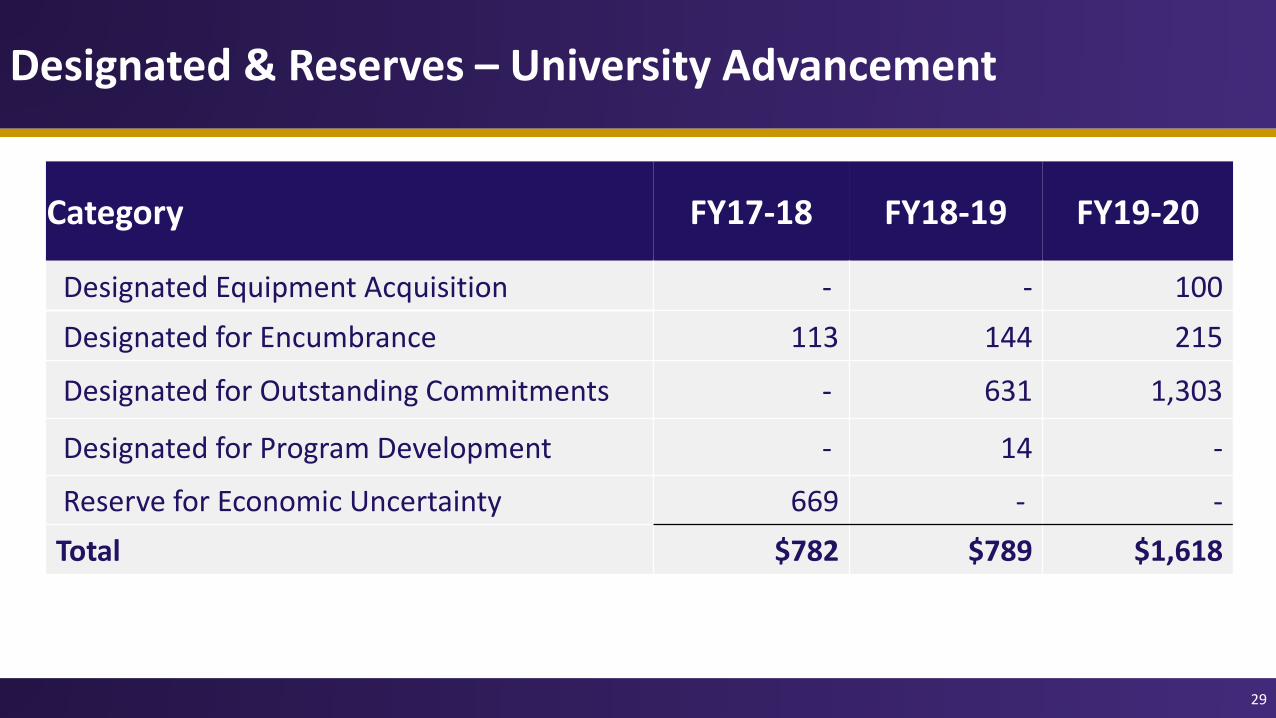
Designated & Reserves – University Advancement
29
Category FY17-18 FY18-19 FY19-20
Designated Equipment Acquisition - - 100Designated for Encumbrance 113 144 215
Designated for Outstanding Commitments - 631 1,303
Designated for Program Development - 14 -
Reserve for Economic Uncertainty 669 - -Total $782 $789 $1,618

Designated & Reserves – University Advancement
30
University Advancement FY17-18 FY18-19 FY19-20
Short Term Obligations 113 789 1,518Capital 100Reserves 669
Total $782 $789 $1,618
0200400600800
10001200140016001800
Carryforward
FY17-18
FY18-19
FY19-20

Designated & Reserves – University Enterprises
31
Category FY17-18 FY18-19 FY19-20
Designated for Encumbrance 315 41 88
Designated for Outstanding Commitments - 898 80
Reserve for Economic Uncertainty 383 - 989
Total $698 $939 $1,157

Designated & Reserves – University Enterprises
32
Category FY17-18 FY18-19 FY19-20
Short Term Obligations 315 939 168Reserves 383 - 989
Total $698 $939 $1,157
0
200
400
600
800
1000
1200
1400
Carryforward
FY17-18
FY18-19
FY19-20

Designated & Reserves – University Wide
33
Category FY17-18 FY18-19 FY19-20
Designated Facilities Maintenance & Repair - 2,000 -Designated for Capital Improvement/Construction - - 440Designated for Encumbrance 1,008 1,020 712Designated for Financial Aid - - 398Designated for Future Debt Service 1,500 - -Designated for Outstanding Commitments 3,428 1,126 711Reserve for Economic Uncertainty 22,320 23,000 13,068Total $28,256 $27,146 $15,329

Designated & Reserves – University Wide
34
Category FY17-18 FY18-19 FY19-20
Short Term Obligations 5,936 2,146 1,821Capital - 2,000 440Reserves 22,320 23,000 13,068
Total $28,256 $27,146 $15,329
0
5000
10000
15000
20000
25000
30000
Carryforward
FY17-18
FY18-19
FY19-20
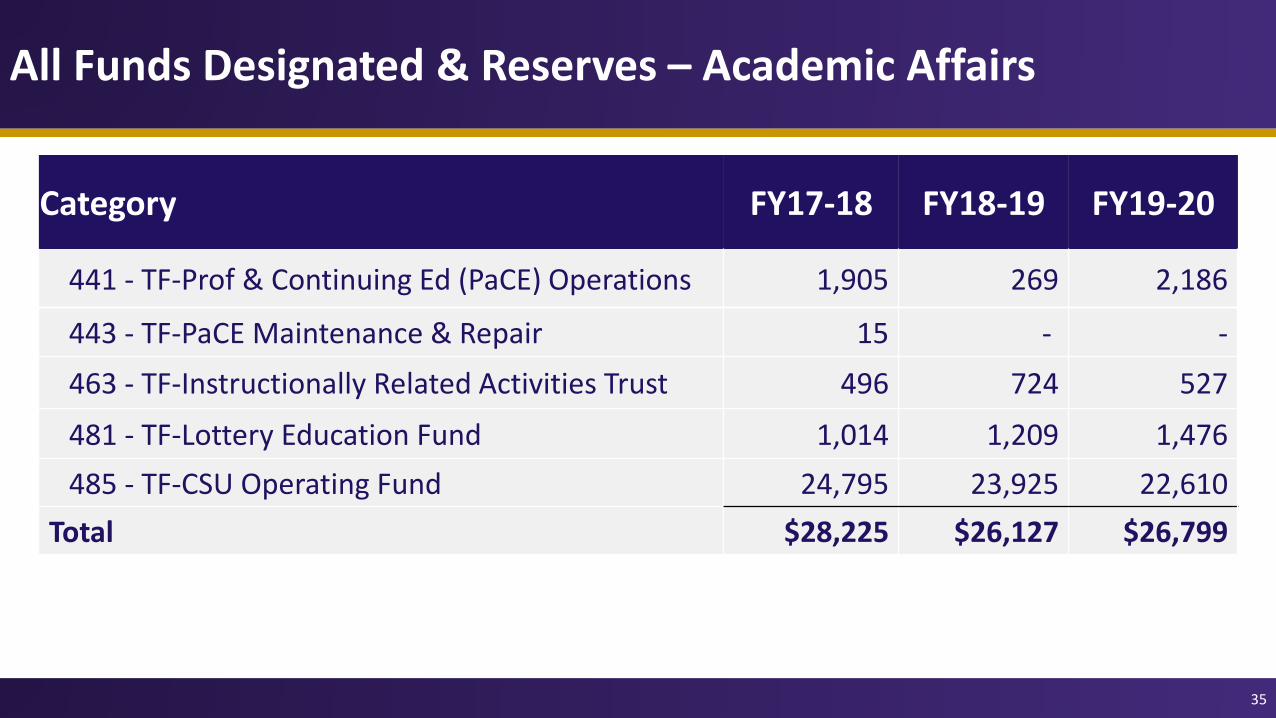
All Funds Designated & Reserves – Academic Affairs
35
Category FY17-18 FY18-19 FY19-20
441 - TF-Prof & Continuing Ed (PaCE) Operations 1,905 269 2,186
443 - TF-PaCE Maintenance & Repair 15 - -463 - TF-Instructionally Related Activities Trust 496 724 527
481 - TF-Lottery Education Fund 1,014 1,209 1,476485 - TF-CSU Operating Fund 24,795 23,925 22,610
Total $28,225 $26,127 $26,799

All Funds Designated & Reserves – Administration & Finance
36
Category FY17-18 FY18-19 FY19-20
463 - TF-Instructionally Related Activities Trust 109 109 109
485 - TF-CSU Operating Fund 14,544 15,914 -1,100
531 - TF-Housing-Operations and Revenue 27,615 31,110 15,794
Total $42,268 $47,133 $14,803

All Funds Designated & Reserves – The Office of President
37
Category FY17-18 FY18-19 FY19-20
463 - TF-Instructionally Related Activities Trust 1,825 1,811 1,994
485 - TF-CSU Operating Fund 495 414 934
Total $2,320 $2,225 $2,928

All Funds Designated & Reserves – Student Affairs & Enrollment Management
38
Category FY17-18 FY18-19 FY19-20
452 - TF-Facility Revenue Fund-Health Facilities Fees 102 180 235463 - TF-Instructionally Related Activities Trust 516 960 1,432471 - TF-Parking Revenue Fund-Fines and Forfeitures 58 43 145472 - TF-Parking Revenue Fund-Parking Fees 1,405 2,027 129
481 - TF-Lottery Education Fund 85 9 79
485 - TF-CSU Operating Fund 8,554 7,448 6,199
534 - TF-Campus Union-Operations and Revenue 16,034 19,340 11,177
Total $26,754 $30,007 $19,396

All Funds Designated & Reserves – University Advancement, University Enterprises, University Wide
39
Cabinets Category FY17-18 FY18-19 FY19-20
University Advancement 485 - TF-CSU Operating Fund 782 789 1,618
Total $782 $789 $1,618
University Enterprises 485 - TF-CSU Operating Fund 698 938 1,157
Total $698 $938 $1,157
University Wide 485 - TF-CSU Operating Fund 28,517 27,149 15,329
Total $28,517 $27,149 $15,329

All Funds Designated & Reserves – SF State University
40
Category FY17-18 FY18-19 FY19-20
441 - TF-Prof & Continuing Ed (PaCE) Operations 2,166 269 2,186443 - TF-PaCE Maintenance & Repair 15 - -452 - TF-Facility Revenue Fund-Health Facilities Fees 102 180 235463 - TF-Instructionally Related Activities Trust 2,946 3,604 4,061471 - TF-Parking Revenue Fund-Fines and Forfeitures 58 43 145472 - TF-Parking Revenue Fund-Parking Fees 1,405 2,027 129481 - TF-Lottery Education Fund 1,099 1,218 1,554485 - TF-CSU Operating Fund 78,124 76,577 46,746531 - TF-Housing-Operations and Revenue 27,615 31,110 15,794534 - TF-Campus Union-Operations and Revenue 16,034 19,340 11,177
Total $129,564 $134,368 $82,027

All Funds Designated & Reserves – SF State University
41
Category FY17-18 FY18-19 FY19-20
Short Term Obligations 55,607 60,307 56,992
Capital 10,524 21,912 6,803
Designated Balances 66,131 82,219 63,795
Reserves 63,434 52,150 18,232
Total $129,565 $134,369 $82,207

Presentation:
Enrollment Update;Challenges & Planning
Lori Beth WayDean
Undergraduate Education & Academic PlanningAcademic Affairs
Katherine LynchSenior Associate Vice President
Enrollment Management
Sutee SujitparapitayaAssociate Provost, Institutional Analytics
Academic Affairs

Enrollment Update
University Budget Committee MeetingMarch 18, 2021
By Sutee SujitparapitayaAssociate Provost, Institutional Analytics
Katie LynchSenior AVP, Enrollment Management
Lori Beth WayDean, Undergraduate Education and Academic Planning

Fall Total Headcount Trend – Pre and During COVID-192
# % Change # % Change # % ChangeFall 2015 26,815 3,082 30,256 Fall 2016 25,891 -3.4% 2,806 -9.0% 29,045 -4.0%Fall 2017 26,561 2.6% 2,722 -3.0% 29,607 1.9%Fall 2018 26,436 -0.5% 2,783 2.2% 29,586 -0.1%Fall 2019 25,839 -2.3% 2,748 -1.3% 28,880 -2.4%Fall 2020 23,926 -7.4% 2,821 2.7% 27,075 -6.3%
F15 to F19 (976) -3.6% (334) -10.8% (1,376) -4.5%
TotalUndergrad Graduates
Total included second and postbaccalaureate students
• Further decline during COVID (Fall 2020) about 6.3%
• Pre COVID (Fall 2015 to Fall 2019): We already faced an enrollment decline of about 4.5%

New Student Headcount Trend – Pre COVID-193
# % Change # % Change # % ChangeFall 2015 4,276 3,661 926 Fall 2016 3,642 -14.8% 2,928 -20.0% 881 -4.9%Fall 2017 4,323 18.7% 3,710 26.7% 976 10.8%Fall 2018 4,287 -0.8% 3,390 -8.6% 953 -2.4%Fall 2019 3,694 -13.8% 3,563 5.1% 926 -2.8%Fall 2020 2,779 -24.8% 3,016 -15.4% 1,033 11.6%
F15 to F19 (582) -13.6% (98) -2.7% - 0.0%
First-time Freshmen New UG Transfer New Graduates
COVID-19 (Fall 2020):• First-time Freshmen -24.8%• New Transfer -15.4%
Pre COVID-19 (Fall 2015 to Fall 2019):• First-time Freshmen -13.6%• New Transfer -2.7%

CA Resident Enrollment (FTES)4
• CO Target = Chancellor's Office assigned target for CA residents• FTES = Full-time Equivalent Students: 1 FTES = 15 credits per semester for undergrads and 12 for graduates
• CA resident enrollment (FTEs) had dropped 5% for the last 2 years (between 2018-2019 and 2020-2021)
• We came in 6.8% below the assigned target for this year.
CO Target
CA Resident FTES
% +/- CO Res Target
2015-16 23,836 23,580 -1.1%2016-17 24,099 23,237 -3.6%2017-18 24,099 24,042 -0.2%2018-19 24,099 24,173 0.3%2019-20 24,582 23,597 -4.0%2020-21 24,582 22,902 -6.8%
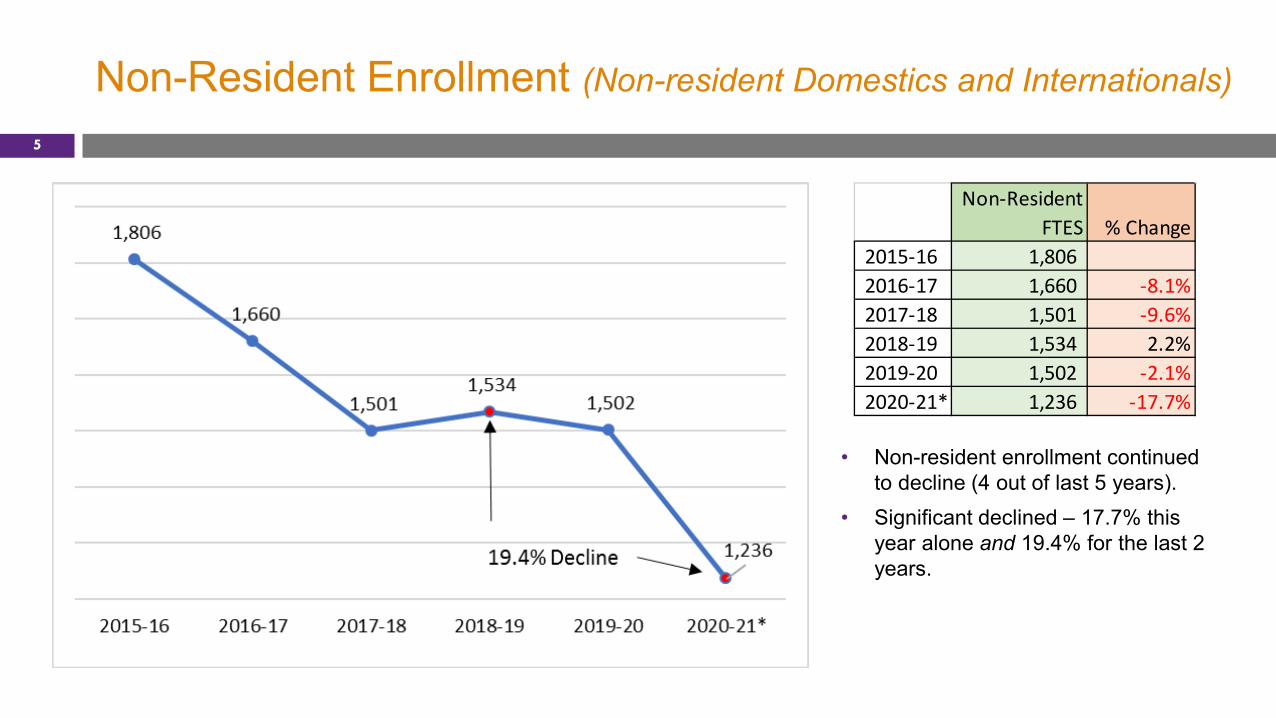
Non-Resident Enrollment (Non-resident Domestics and Internationals)
5
• Non-resident enrollment continued to decline (4 out of last 5 years).
• Significant declined – 17.7% this year alone and 19.4% for the last 2 years.
Non-Resident FTES % Change
2015-16 1,806 2016-17 1,660 -8.1%2017-18 1,501 -9.6%2018-19 1,534 2.2%2019-20 1,502 -2.1%2020-21* 1,236 -17.7%

Fall 2021 First-time Freshman Applications (Bay Area Campuses)
6
• First-time freshman applications continued to decline (e.g., increasing competition, raising cost at four-year institutions, and decreasing HS graduation from feeder schools)
• Our freshmen application trends have been very similar to East Bay
Fall 2021 Applications Submitted via Cal State Apply – Oct 1 through Dec 15, 2020
Fall 17 Fall 18 Fall 19 Fall 20 Fall 21 1 year 2 year 3 year 4 yearSF State 33,382 34,475 32,463 27,931 24,818 -11% -24% -28% -26%San Jose 30,639 35,711 34,844 31,959 29,711 -7% -15% -17% -3%East Bay 15,511 15,559 15,714 13,052 11,732 -10% -25% -25% -24%Sacramento 23,818 26,630 27,362 25,634 21,803 -15% -20% -18% -8%Sonoma 15,586 14,007 13,970 11,386 8,462 -26% -39% -40% -46%CSU 627,743 627,743 618,786 566,754 538,279 -5% -13% -14% -14%
Change

Fall 2021 New Undergrad Transfer Applications (Bay Area Campuses)7
• Undergrad transfer applications significantly declined among bay area campuses.
• The current trends continued this year. • Our new UG transfer trends very similar to
San Jose.
Fall 2021 Applications Submitted via Cal State Apply – Oct 1 through Dec 15, 2020
Fall 17 Fall 18 Fall 19 Fall 20 Fall 21 1 year 2 year 3 year 4 yearSF State 14,231 15,020 14,440 12,819 12,222 -5% -15% -19% -14%San Jose 16,122 16,619 16,114 14,727 13,776 -6% -15% -17% -15%East Bay 9,340 9,252 9,411 8,294 7,239 -13% -23% -22% -22%Sacramento 12,246 12,718 13,457 13,268 12,567 -5% -7% -1% 3%Sonoma 4,499 3,747 3,694 3,284 3,292 0% -11% -12% -27%CSU 256,070 271,865 281,300 268,983 256,543 -5% -9% -6% 0%
Change

Fall 2021 Applications and Admissions 8
• 89% completion of Fall 2021 undergraduate admissions on March 16, 2021 • Accepting Admission Offer (AAO) = April 1, 2021
* Information as of March 16
Fall 2020 Fall 2021 # Chg % Chg Fall 2020 Fall 2021 # Chg % ChgFirst-time Freshmen 28,873 25,941 (2,932) -10.2% 22,594 23,141 547 2.4%New Transfers 13,896 13,823 (73) -0.5% 9,380 12,135 2,755 29.4%New Graduates 3,413 4,318 905 26.5%
# Applied # Admitted

Immediate: Incoming Student Challenges and Opportunities9
• Challenges• Decline in freshman student applications• COVID effect on college going behavior• Lack of predictability tools and benchmarking
• Opportunities • Process Reengineering• Increased outreach and yield activities to drive enrollment• Summer melt prevention

Long Term: Incoming Student Challenges and Opportunities10
• Challenges• Demographic shifts over time• Dwindling community college enrollment• Lingering pandemic effects• Threat of rebenching to CO targets
• Opportunities • Development of Strategic Enrollment Management Plan• Market research and branding• Improved use of data in the recruitment and support planning

Student Retention - First-time Full-time Freshmen11

Retention Efforts12
• Substantial advising changes• All first year students provided an assigned advisor• Use of predictive analytics • Re-enrollment campaigns• Support for faculty advising
• Increased tutoring/academic assistance• Reduced registration barriers• Improved course planning tools
• Degree planner implementation• Electronic graduation process

We can all help with retention!13
• College SSGI plans reviewed by campus-wide SSGI committee• Other units’ plans?
• Faculty engagement• Contact outside of class• Clear and regular communication• Attention to equity gaps in their courses• Helping students see life after graduation
• Staff training being planned• FYE Faculty Director, Grace Yoo (DUEAP) and Interim Assistant Dean, Chris
Trudell (SAEM) lead campus FYE Committee

Presentation:
University Enterprises; proposed 2021-2022 Budget
Jason PorthVice President
University Enterprises
Tammie RidgellAssociate Vice President
Auxiliary Business Services and Director of Finance and Administration

San Francisco State UniversityGeneral Operating Fund BudgetMarch 18, 2021

University Budget Overview
48
University Enterprises
2020 – 2021 Budget Update2021 – 2022 Budget Planning
General Operating Fund

University Budget Overview
49
University Enterprises
• Cap. Planning, Design & Construction (15)
• Real Estate Development (1)
• Sustainability & Energy (2)
• Downtown Campus Operations (1)
• Office of the Vice President (2)
• University Corporation (18)
(number of employees)
University Enterprises– University Corporation (U Corp)
50
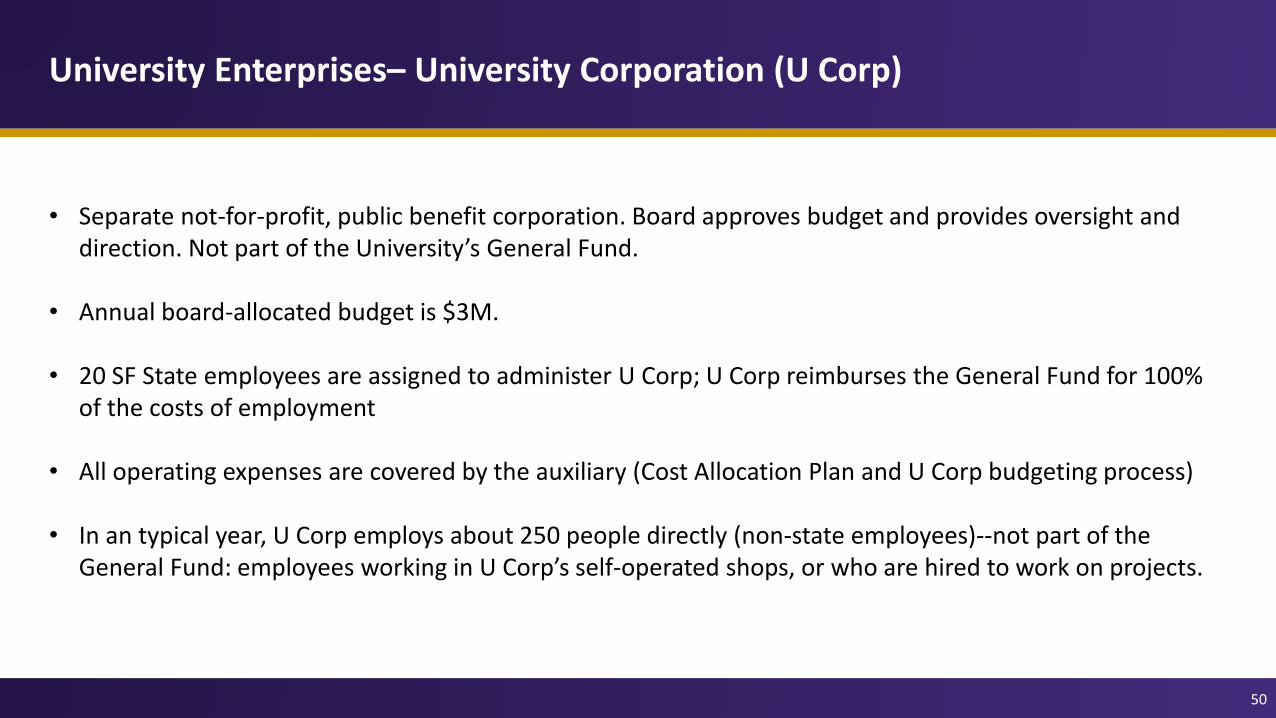
• Separate not-for-profit, public benefit corporation. Board approves budget and provides oversight and direction. Not part of the University’s General Fund.
• Annual board-allocated budget is $3M.
• 20 SF State employees are assigned to administer U Corp; U Corp reimburses the General Fund for 100% of the costs of employment
• All operating expenses are covered by the auxiliary (Cost Allocation Plan and U Corp budgeting process)
• In an typical year, U Corp employs about 250 people directly (non-state employees)--not part of the General Fund: employees working in U Corp’s self-operated shops, or who are hired to work on projects.

Enterprises Budget Overview
51
2020 – 2021 Cost Reductions
1. Between 2018 and 2020, six open positions went unfilled and the positions were eliminated (4 MPPs and 2 represented staff)
2. Leveraged open but funded positions from 2019-2020 to ensure cost saving for 2020-2021 and thereafter. Decreased base funding by 13%.
3. Two employee layoffs (1 MPP and 1 represented staff member).4. Reduced operating expenses. 5. Deferred some projects until a more suitable time.

Enterprises Budget Overview
52
2021 – 2022 Budget Assumptions and Planning1. Budget is flat, with exception of savings from loss of one general fund position.2. One new position will be added, but it is funded through project-related cost-recovery
rather than general fund.3. Some initiatives are on hold for now:
• Physical master plan and related environmental impact studies

University Enterprises - Summary
53
19-20Budget
19-20Actual
20-21Budget
Budget to Budget % Change
FY 20 Budget to FY 19 Actual %
Change
Revenue - - - - -
Salaries and wages 2,510 2,100 1,979 (21.2%) (5.7%)
Operating Expenses 191 178 136 (28.6%) (23.6%)
Total 2,700 2,277 2,115 (21.7%) (7.1%)
FY2020 – 2021 Budget Review

University Enterprises - Summary
54
20-21Budget
20-21Forecast
21-22Budget
(Iteration 0)
Budget to Budget % Change
FY 21 Budget to FY 20 Forecast %
Change
Revenue - - - - -
Salaries and wages 1,979 1,963 1,979 0% 1%
Operating Expenses 136 146 136 0% (7%)
Total 2,115 2,109 2,115 0% <1%
FY2020-2021 Update and FY2021 – 2022 Budget Planning

University Enterprises – Capital Planning, Design & Construction
55
19-20Budget
19-20Actual
20-21Budget
Budget to Budget % Change
FY 20 Budget to FY 19 Actual %
Change
Revenue - - - - -
Salaries and wages 2,187 1,780 1,668 (23.8%) (6.3%)
Operating Expenses 171 160 124 (27.5%) (22.4%)
Total 2,358 1,939 1,792 (24.0%) (7.6%)
FY2020-2021 Budget Review
Positions 19-20 Budget 20-21 Budget
MPP 5 4
Staff 10 10
Total 15 14

56
20-21Budget
20-21Forecast
21-22Budget
(Iteration 0)
Budget to Budget % Change
FY 21 Budget to FY 20 Forecast %
Change
Revenue - - - - -
Salaries and wages 1,668 1,652 1668 0% <1%
Operating Expenses 124 140 124 0% (11%)
Total 1,792 1,792 1,792 0% 0%
FY2020-2021 Update and FY2021-2022 Budget Planning
Positions 20-21 Budget 21-22 Budget
MPP 4 5*
Staff 10 10
Total 14 15
University Enterprises – [Cap. Planning, Design & Construction]
*Includes new position covered by cost-recovery from new science building project

University Enterprises – [Downtown Campus]
57
19-20Budget
19-20Actual
20-21Budget
Budget to Budget % Change
FY 20 Budget to FY 19 Actual %
Change
Revenue - - - - -
Salaries and wages 103 103 103 (0%) (0%)
Operating Expenses - - - (0%) (0%)
Total 103 103 103 (0%) (0%)
FY2020-2021 Budget Review
Positions 19-20 Budget 20-21 Budget
MPP 1 1
Staff - -
Total 1 1
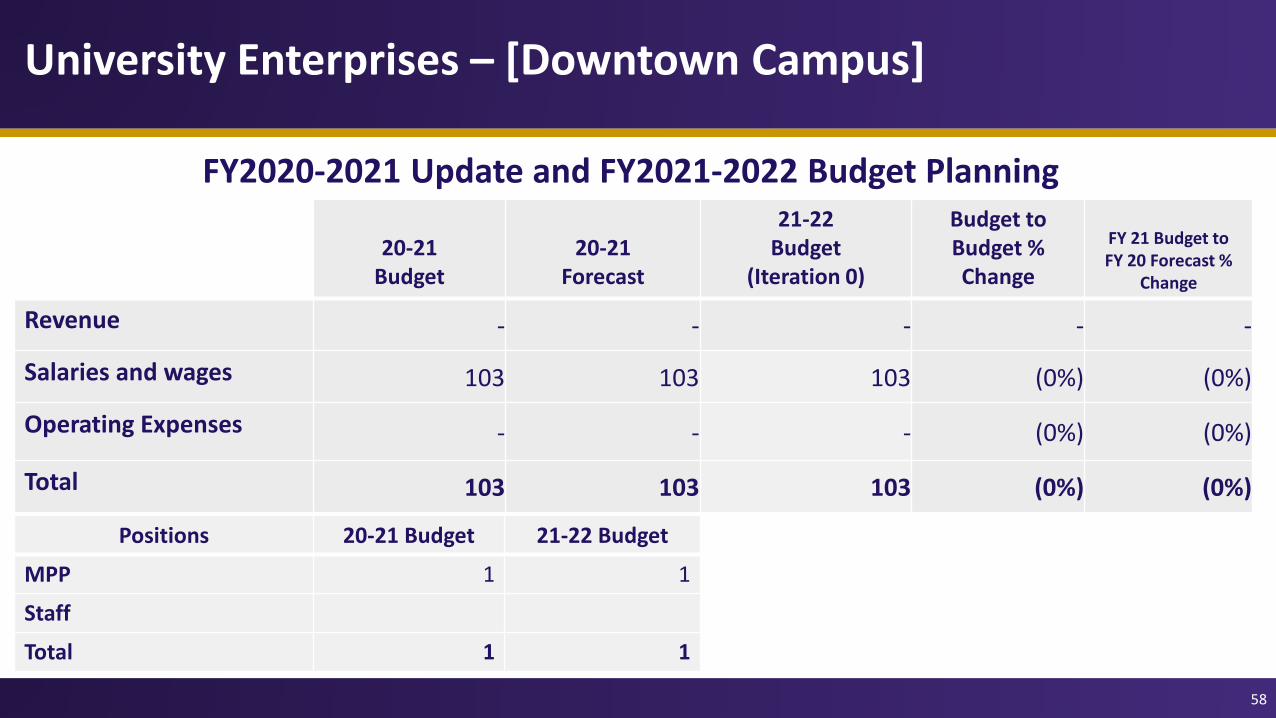
58
20-21Budget
20-21Forecast
21-22Budget
(Iteration 0)
Budget to Budget % Change
FY 21 Budget to FY 20 Forecast %
Change
Revenue - - - - -
Salaries and wages 103 103 103 (0%) (0%)
Operating Expenses - - - (0%) (0%)
Total 103 103 103 (0%) (0%)
FY2020-2021 Update and FY2021-2022 Budget Planning
Positions 20-21 Budget 21-22 Budget
MPP 1 1
Staff
Total 1 1
University Enterprises – [Downtown Campus]

University Enterprises – [Sustainability & Energy]
59
19-20Budget
19-20Actual
20-21Budget
Budget to Budget % Change
FY 20 Budget to FY 19 Actual %
Change
Revenue - - - - -
Salaries and wages 220 217 208 (5.2%) (4.0%)
Operating Expenses 20 18 12 (40%) (33%)
Total 239 235 220 (7.9%) (6.2%)
FY2020-2021 Budget Review
Positions 19-20 Budget 20-21 Budget
MPP 1 1
Staff 1 1
Total 2 2

60
20-21Budget
20-21Forecast
21-22Budget
(Iteration 0)
Budget to Budget % Change
FY 21 Budget to FY 20 Forecast %
Change
Revenue - - - - -
Salaries and wages 208 208 208 (0%) (0%)
Operating Expenses 12 6 6 (50%) (0%)
Total 220 214 214 (3%) (0%)
FY2020-2021 Update and FY2021-2022 Budget Planning
Positions 20-21 Budget 21-22 Budget
MPP 1 1
Staff 1 1
Total 2 2
University Enterprises – [Sustainability & Energy]

University Enterprises – Carryforward
61
Amount
Carryforward – July 1, 2019 479,640
Carryforward – July 1, 2020 759,094
Carryforward used – July 1, 2020 – June 30,2021 (forecast)• DTC space acquisition and relocation expenses• RTC planning project completion• Surge projects–campus wide
550,000
Carryforward – July 1, 2021 (forecast) 209,094
University Enterprises
62
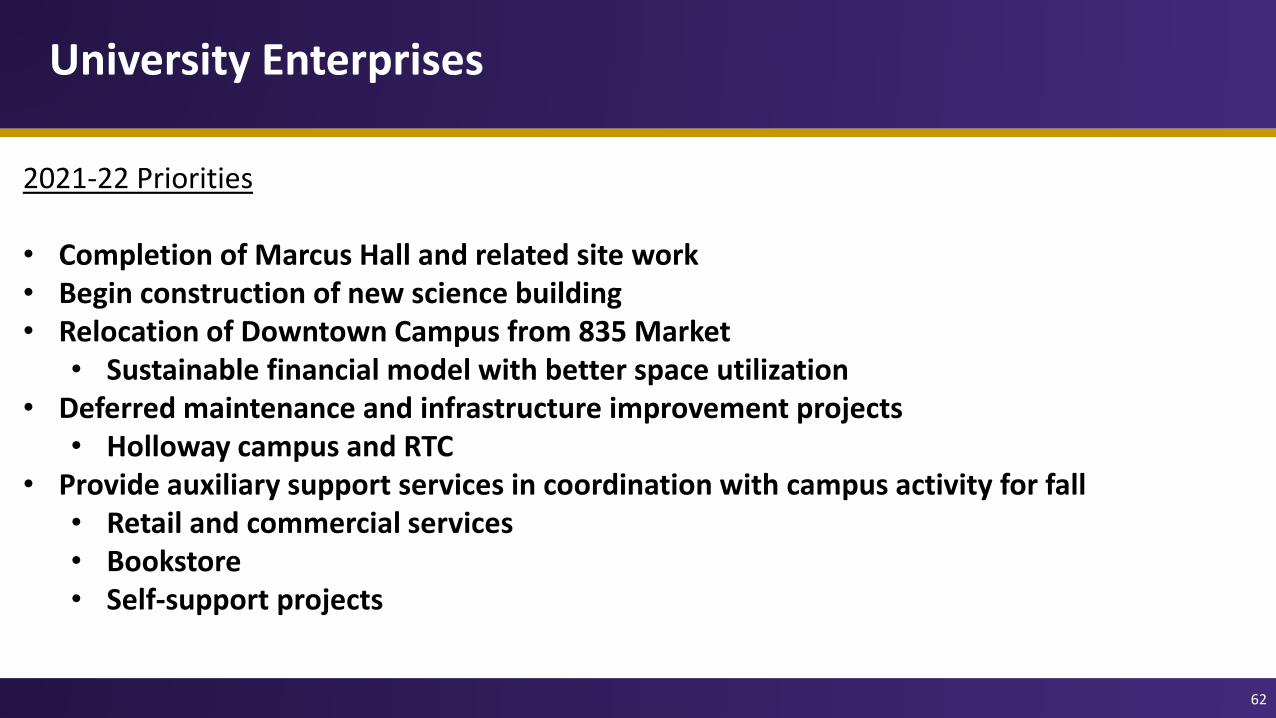
2021-22 Priorities
• Completion of Marcus Hall and related site work• Begin construction of new science building• Relocation of Downtown Campus from 835 Market
• Sustainable financial model with better space utilization• Deferred maintenance and infrastructure improvement projects
• Holloway campus and RTC• Provide auxiliary support services in coordination with campus activity for fall
• Retail and commercial services• Bookstore• Self-support projects

University Enterprises – Expenditure Components
63
FY2019-2020 FY2021-2022 FY2020-2021
72%
28%
Salary&Wages O&E
72%
28%
Salary&Wages O&E
72%
28%
Salary&Wages O&E

Updates and Informational Item:
Federal Funding update
Jeff WilsonInterim Vice President & CFO
Administration & Finance

Federal Funding Update
66
• Total of 3 Funding packages• For CSU, $3.1 billion in one-time funding • Higher Education Emergency Relief Fund (HEERF)
Funding Package Student Aid Portion Institutional Portion MSI Portion
HEERF 1 (Spring 2020) $262.7 $262.7 $38.3HEERF 2 (December 2020) 262.7 591.2 55.7HEERF 3 (March 2021) 757.5 749.7 93.7
Total $1,282.9 $1,603.6 $187.7
in millions

Federal Funding Update
67
• Total of 3 Funding packages• For SFSU, $169 million in one-time funding • Higher Education Emergency Relief Fund (HEERF)
Funding Package Student Aid Portion Institutional Portion MSI Portion
HEERF 1 (Spring 2020) $14.4 $14.4 $2.2HEERF 2 (December 2020) 14.4 32.2 3.2HEERF 3 (March 2021) 41.6 41.4 5.3
Total $70.4 $88.0 $10.7
in millions

Federal Funding Update
68
Three overarching categories for using institutional portion of funds:• Health and Safety• Instruction• Technology• Short-term Financial Stability and Resilience
Note: Institutional portion of HEERF 1 funds have been allocated; HEERF 2 and HEERF 3 funds have not been allocated.
Federal Funding Update
69
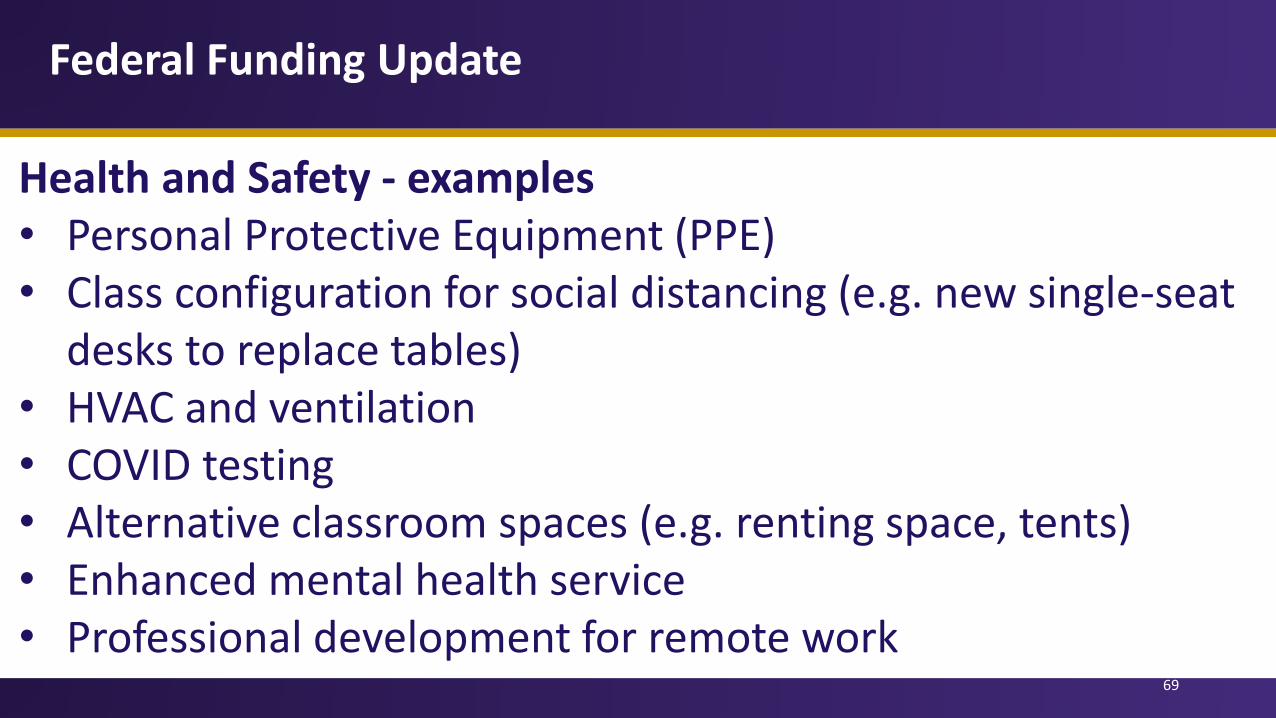
Health and Safety - examples• Personal Protective Equipment (PPE)• Class configuration for social distancing (e.g. new single-seat
desks to replace tables)• HVAC and ventilation• COVID testing• Alternative classroom spaces (e.g. renting space, tents)• Enhanced mental health service• Professional development for remote work

Federal Funding Update
70
Instruction - examples• Additional sections to achieve social distancing• Increasing campus hours of operation• Faculty professional development for remote instruction• Enhanced or extended counseling, tutoring, academic
advising

Federal Funding Update
71
Technology - examples• Online delivery of Library materials• Technology and connectivity for faculty and students• Technology and connectivity for staff during remote work
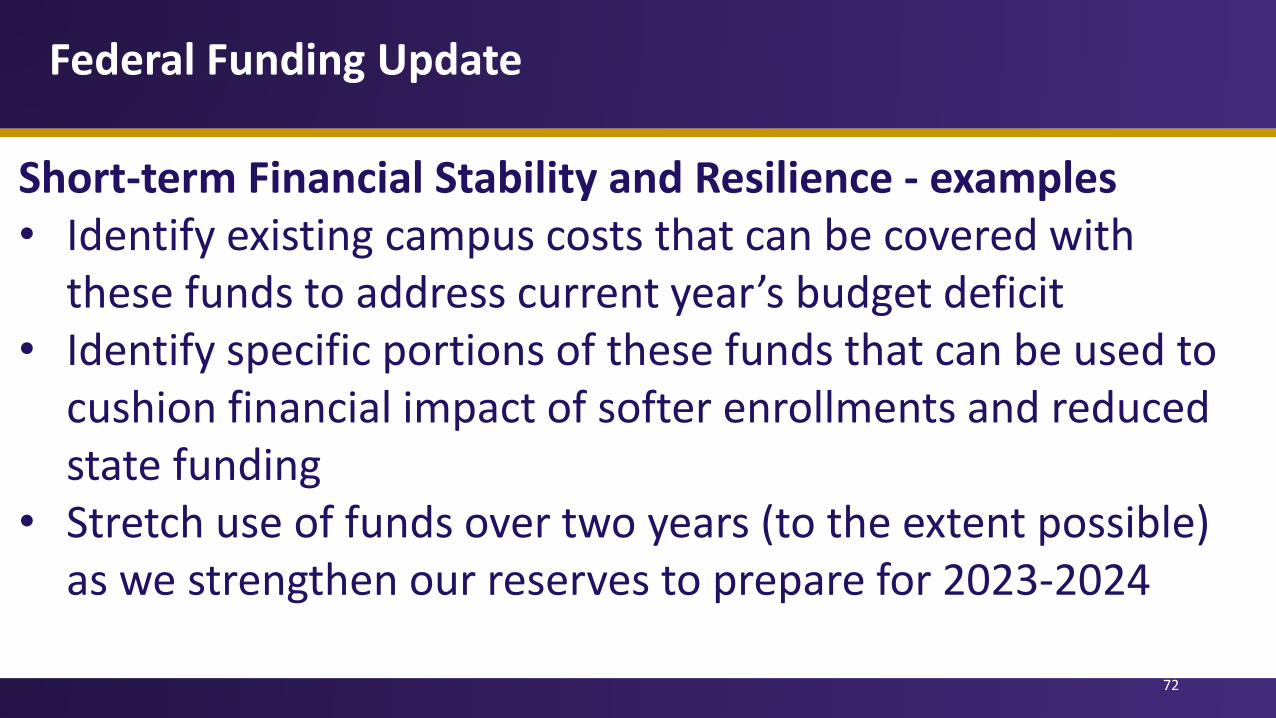
Federal Funding Update
72
Short-term Financial Stability and Resilience - examples• Identify existing campus costs that can be covered with
these funds to address current year’s budget deficit• Identify specific portions of these funds that can be used to
cushion financial impact of softer enrollments and reduced state funding
• Stretch use of funds over two years (to the extent possible) as we strengthen our reserves to prepare for 2023-2024

PUBLIC FORUM20 minutes, three minutes per speaker
Please: “Raise your Hand” (found on your Reactions menu, lower right corner)
Unmute yourself when called upon to speak. For transparency, please begin with yourname, title, department, then Mute when finished to reduce noise
Limit to one question, so everyone has a chance to speak. You can “Raise your Hand” again with a follow up question, if time allows.
Thank you for sharing this space respectfully with our community members ~

Check our UBC webpage for information, past meeting materials, meeting updates and how to contact the UBC:
https://adminfin.sfsu.edu/ubc
We appreciate your interest in our University’s
budget process and the service of our UBC members and guests,
in support of our students, and all our Gator families