MEETING OF THE SAN DIEGO METROPOLITAN TRANSIT SYSTEM · 4. MTS SEMI-ANNUAL SECURITY REPORT ......
35
Transcript of MEETING OF THE SAN DIEGO METROPOLITAN TRANSIT SYSTEM · 4. MTS SEMI-ANNUAL SECURITY REPORT ......

MEETING OF THE SAN DIEGO METROPOLITAN TRANSIT SYSTEM
PUBLIC SECURITY COMMITTEE 1255 Imperial Avenue, Suite 1000
San Diego, CA 92101
October 26, 2017
1. ROLL CALL
Mr. McWhirter called the meeting to order at 9:05 a.m. A roll call sheet listing Public Security Committee members’ attendance is attached.
2. APPROVAL OF MINUTES
Mr. McWhirter moved to approve the minutes of the March 3, 2017, Public Security Committee meeting. Mr. Sandke seconded the motion, and the vote was 3 in favor with Mr. Cunningham and Ms. Cole absent.
3. PUBLIC COMMENTS There were no public comments. 4. MTS SEMI-ANNUAL SECURITY REPORT
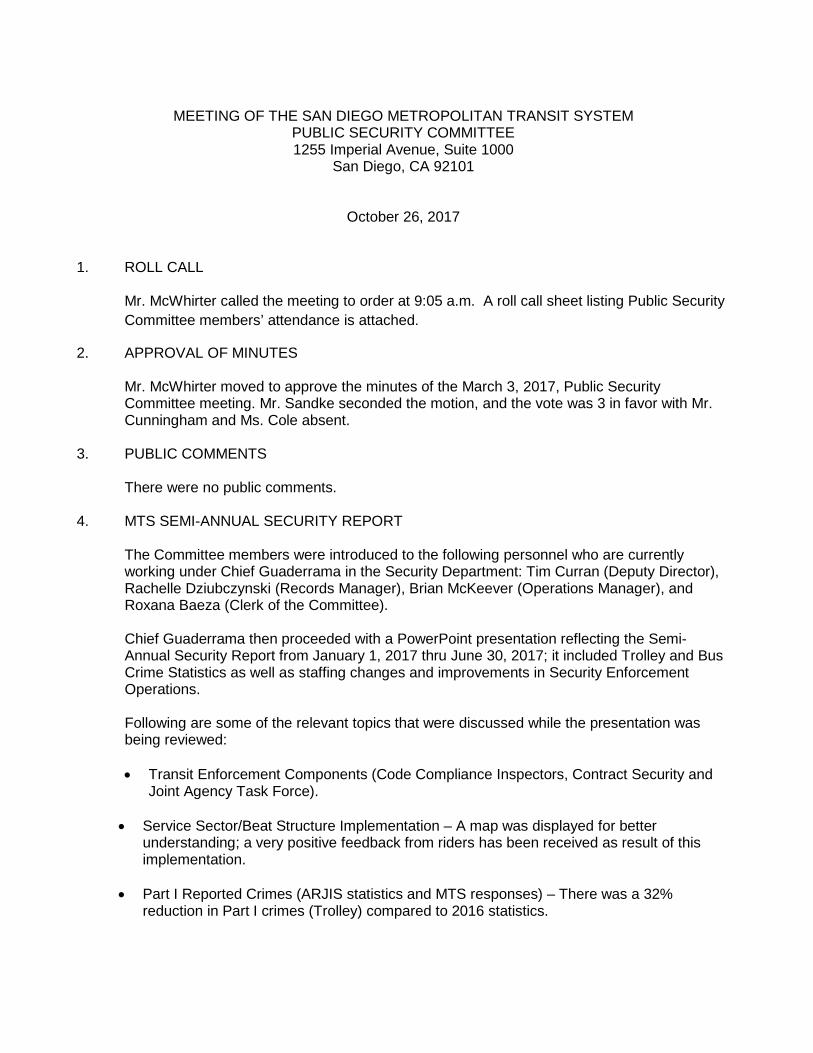
The Committee members were introduced to the following personnel who are currently working under Chief Guaderrama in the Security Department: Tim Curran (Deputy Director), Rachelle Dziubczynski (Records Manager), Brian McKeever (Operations Manager), and Roxana Baeza (Clerk of the Committee). Chief Guaderrama then proceeded with a PowerPoint presentation reflecting the Semi-Annual Security Report from January 1, 2017 thru June 30, 2017; it included Trolley and Bus Crime Statistics as well as staffing changes and improvements in Security Enforcement Operations. Following are some of the relevant topics that were discussed while the presentation was being reviewed: • Transit Enforcement Components (Code Compliance Inspectors, Contract Security and
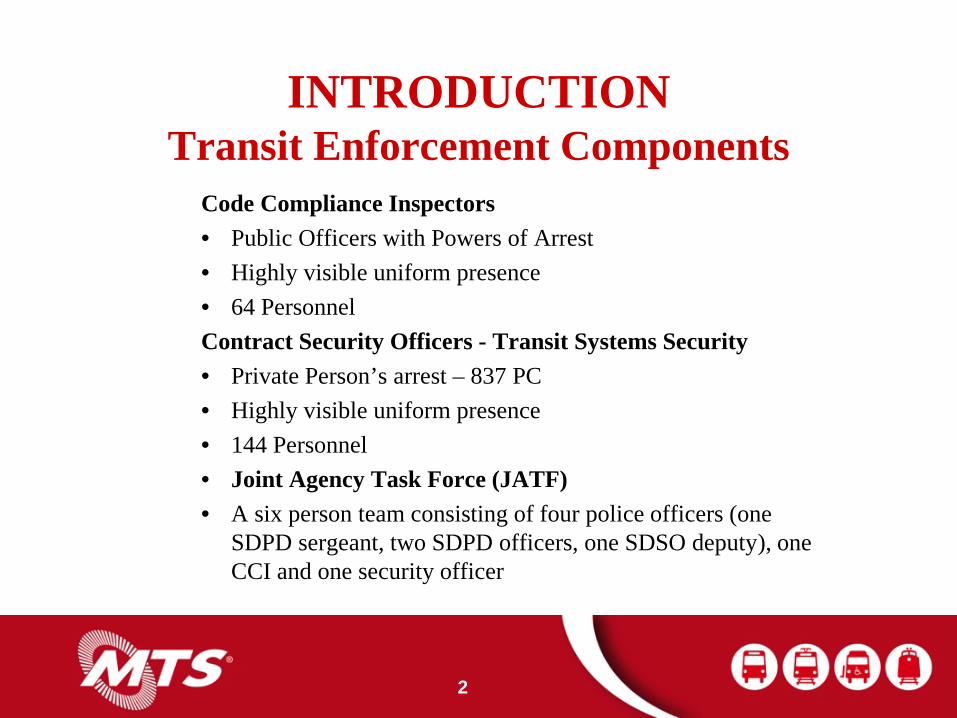
Joint Agency Task Force). • Service Sector/Beat Structure Implementation – A map was displayed for better
understanding; a very positive feedback from riders has been received as result of this implementation.
• Part I Reported Crimes (ARJIS statistics and MTS responses) – There was a 32% reduction in Part I crimes (Trolley) compared to 2016 statistics.

Public Security Meeting October 26, 2017 Page 2
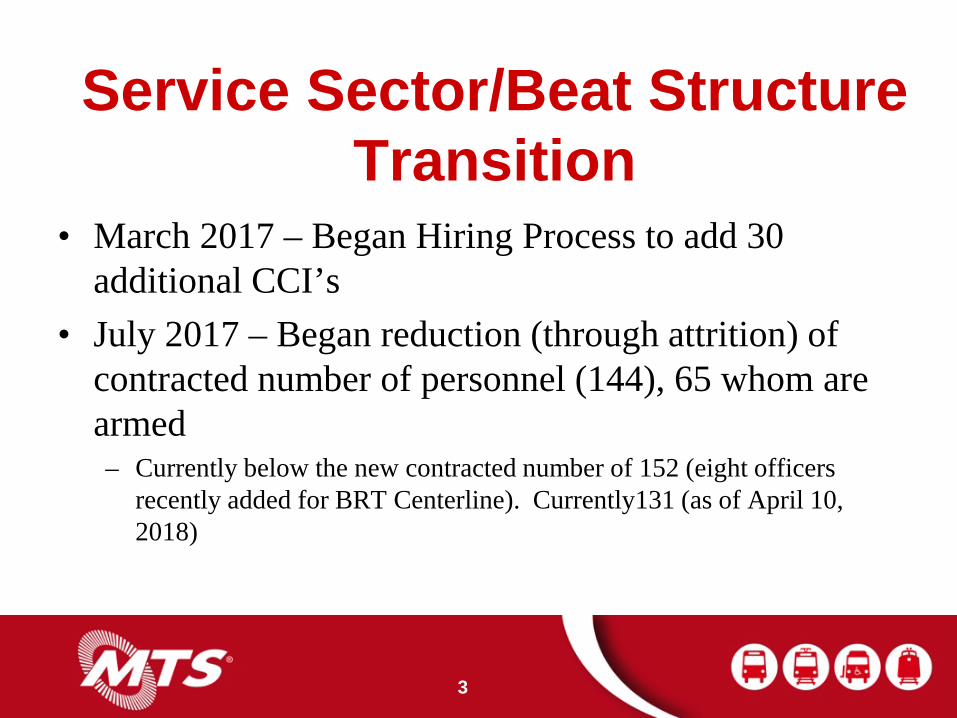
• MTS Response to Part II Crimes: Trolley – The majority of the cases were for vandalism followed by Drunk in Public.
• Calls for Service (Bus) decreased (227 in 2016 vs. 171 in 2017). The top three call types
are disturbance calls, vandalism and assaults. • MTS response to Part I and Part II Crimes (Bus) – There was a significant decline
compared to 2016 statistics. • Assaults (Part I and Part II – Trolley and Bus) – MTS responded to 88 assaults of which 50
of those were on MTS employees.
• Fare Inspections slightly declined (2.2%) but there was a 61.4% in the number of citations issued in 2017 (12,549 in 2016 vs. 20,249 in 2017); citations get entered in ARJIS system. The top three violations are Fare Evasion, Smoking and Failure to Comply.
• Special Enforcement Details (SEDs) - Trolley – The Code compliance officers conducted
21 controlled SEDs during the first half of 2017 with a fare evasion rate of 2.96%.
• Thirteen large scale Transient Encampment Details and 49 mini-details were conducted to address illegal lodging and other nuisance quality-of-life concerns on MTS properties.
The semi-annual security report was very well received by the committee members; a job well done.
5. COMMITTEE MEMBER COMMENTS
Mr. McWhirter mentioned that any company would be thrilled to hear about the MTS Semi-Annual Security report since incidents are going down and all efforts are being made in order to minimize accidents. In response to a question from Mr. Mathis, Chief Guaderrama mentioned that the beat structure implementation will be adjusted accordingly since more trains will eventually be put in service in the near future.
6. NEXT MEETING DATE Next meeting is to be determined based on the members’ availability. 7. ADJOURNMENT
At 9:55 a.m. the meeting was adjourned. /s/ Guy McWhirter
Chairman
Attachment: A. Roll Call Sheet


Agenda Item No. 6
MEETING OF THE SAN DIEGO METROPOLITAN TRANSIT SYSTEM PUBLIC SECURITY COMMITTEE MEETING
April 19, 2018
SUBJECT:
ANNUAL SECURITY REPORT (JANUARY1, 2017 THROUGH DECEMBER 31, 2017 (MANNY GUADERRAMA)
INFORMATIONAL ONLY:
Budget Impact
None with this action. DISCUSSION:
This annual security report covers the period from January 1, 2017 through December 31, 2017. Topics to be discussed will be the crime statistics for the calendar year and information regarding security and enforcement. Transit Enforcement staff utilized the Automated Regional Justice Information System (ARJIS) database to obtain/identify Part I crimes that were possibly transit related. All law enforcement agencies in the San Diego region report their crime information to ARJIS and this is the most reliable data. Crime statistics where MTS staff was notified/involved are tracked and maintained in the MTS database (eForce). Once a crime was identified as possibly transit related, crime reports were obtained/reviewed to determine if there was a nexus to MTS.

1
TRANSIT ENFORCEMENT 2017 ANNUAL SECURITY REPORT
January 1, 2017 to December 31, 2017
Manny Guaderrama
Chief of Police
April 19, 2018
2
INTRODUCTION Transit Enforcement Components
Code Compliance Inspectors • Public Officers with Powers of Arrest • Highly visible uniform presence • 64 Personnel Contract Security Officers - Transit Systems Security • Private Person’s arrest – 837 PC • Highly visible uniform presence • 144 Personnel • Joint Agency Task Force (JATF) • A six person team consisting of four police officers (one
SDPD sergeant, two SDPD officers, one SDSO deputy), one CCI and one security officer
3
Service Sector/Beat Structure Transition
• March 2017 – Began Hiring Process to add 30 additional CCI’s
• July 2017 – Began reduction (through attrition) of contracted number of personnel (144), 65 whom are armed – Currently below the new contracted number of 152 (eight officers
recently added for BRT Centerline). Currently131 (as of April 10, 2018)

4
Service Sector/Beat Structure Implementation
• July 2, 2017 – Beat System implemented during all evening shifts
• August 27, 2017 – Beat System fully implemented on all shifts

5

6
Part I Reported Crimes: Trolley ARJIS Data vs. MTS Response
January through December ARJIS Data MTS Response Data
There was a 26% reduction in Part I crimes * SDPD Case – Determined to be unfounded
Part I Crimes 2016 2017 Homicide 0 0
Rape 0 0
Robbery 17 9
Aggravated Assault 21 16
Burglary 0 1
Larceny/Theft 47 40
Motor Vehicle Theft 14 19
Arson 8 6
Total: 107 91
Part I Crimes 2016 2017 Homicide 0 0
Rape 3 *1*
Robbery 51 33
Aggravated Assault 66 40
Burglary 1 0
Larceny/Theft 119 93
Motor Vehicle Theft 93 81
Arson 4 3
Total: 337 251

7
Part I Crimes Onboard/Arrests
January through December
Part I Crimes 2016 Total
Crimes
2017 Total
Crimes
2016
Onboard 2017
Onboard
2016
Arrests 2017
Arrests
Homicide 0 0 0 0 0 0 Rape 0 0 0 0 0 0 Robbery 17 9 5 1 7 4 Aggravated Assault 21 16 4 2 13 11 Burglary 0 1 0 0 0 0 Larceny/Theft 47 40 12 2 2 1 Motor Vehicle Theft 14 19 0 0 0 0 Arson 8 6 0 0 4 2 Total: 107 91 21 5 26 18
MTS Data

8
PART I CRIMES BY SECTOR
January through December 2017
Metro East Sector North Sector South Sector
Homicide 0 0 0 0 Rape 0 1 0 0
Robbery 5 7 9 12 Agg Assault 12 9 14 5
Burglary 0 0 0 0 Larceny/Theft 20 10 33 30
Motor Vehicle Theft 0 4 20 57 Arson 1 0 1 1
Total: 38 31 77 105
ARJIS Data

9
Part I Reported Crime Comparison: Trolley
MTS and Los Angeles Metro - January through December 2017
MTS Los Angeles Ridership 37,208,641 112,783,075 Total Part I Crimes 251 1024 Incidents per 100,000 .67 .91
10
MTS Reporting of Part II Crimes: Trolley
January through December
Part II Incidents
2016 Total
Crimes
2017 Total
Crimes
2016
Onboard 2017
Onboard
2016
Arrests 2017 Arrests
Drunkenness 98 29 18 7 98 29
Drug Abuse Violations 71 29 8 4 71 29
Other Assaults 170 120 55 31 83 85
Vandalism 270 318 118 122 34 26
Sex Offenses 21 8 7 4 9 4
Total: 630 504 206 168 295 173

11
Copper Wire Thefts There were six incidents of copper wire thefts:
Date Location Trolley Line
10/24/2017 Alvarado Rd Green line
10/29/2017 N Marshall/Wagner St Green line
11/7/2017 Alvarado Rd Green line
11/14/2017 Camino del la Reina Green line
11/14/2017 Hazard Center Dr Green line
12/15/2017 Linda Vista Rd Green line
*No copper wire thefts reported prior to October ‘17

12

13
14

15
BUS
Calls for Service: January through December
Division Calls for Service 2016 2017 • MTS Bus 212 166 • TransDev E. County Division 43 37 • TransDev S. Bay Division 127 126 Total: 382 329 Top Three Call Types: • Disturbance Calls 229 • Assaults 51 • Vandalism 49
16
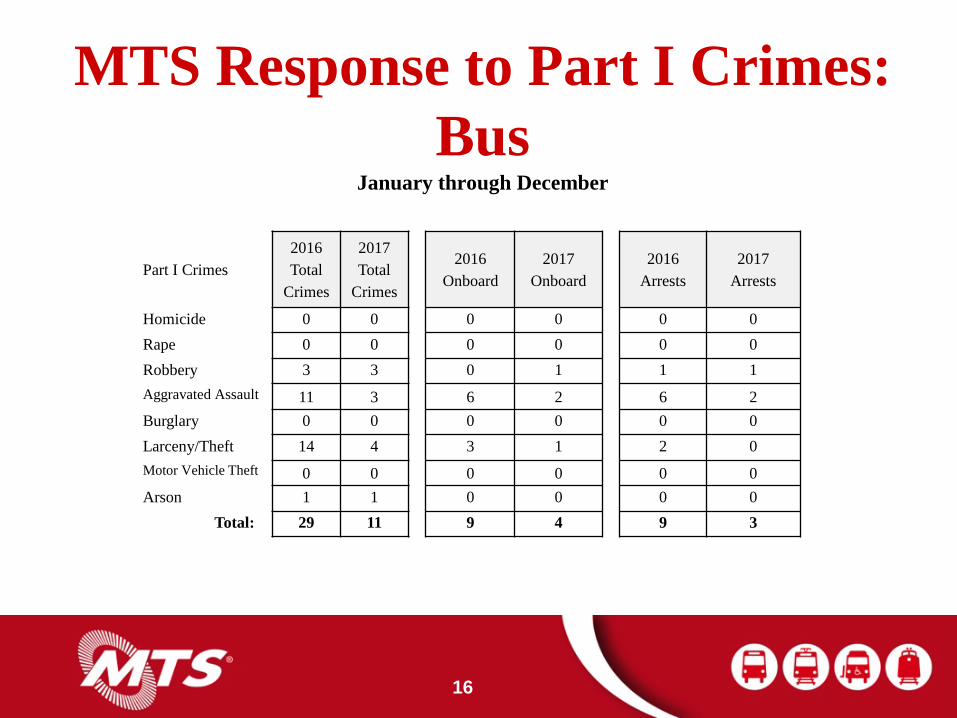
MTS Response to Part I Crimes: Bus
January through December
Part I Crimes 2016 Total
Crimes
2017 Total
Crimes
2016
Onboard 2017
Onboard
2016
Arrests 2017
Arrests
Homicide 0 0 0 0 0 0
Rape 0 0 0 0 0 0
Robbery 3 3 0 1 1 1 Aggravated Assault 11 3 6 2 6 2 Burglary 0 0 0 0 0 0
Larceny/Theft 14 4 3 1 2 0 Motor Vehicle Theft 0 0 0 0 0 0 Arson 1 1 0 0 0 0
Total: 29 11 9 4 9 3

17
MTS Response to Part II Crimes: Bus
January through December
Part II Incidents 2016 Total
Crimes
2017 Total
Crimes
2016 Onboard
2017 Onboard
2016 Arrests
2017 Arrests
Drunkenness 20 5 6 0 20 5
Drug Abuse Violations 5 3 1 0 5 3
Other Assaults 66 33 36 9 16 7
Vandalism 83 48 40 25 6 3
Sex Offenses 3 1 0 1 1 0
Total: 177 90 83 35 48 18

18
SECURITY & ENFORCEMENT

19
Assaults January through December
• MTS responded to 160 assaults, both Part I and Part II (275 in 2016), on both trolley and bus – 93 of those assaults were on MTS employees
(Security Officers, Code Compliance Inspectors, and Bus and Trolley Personnel)
20
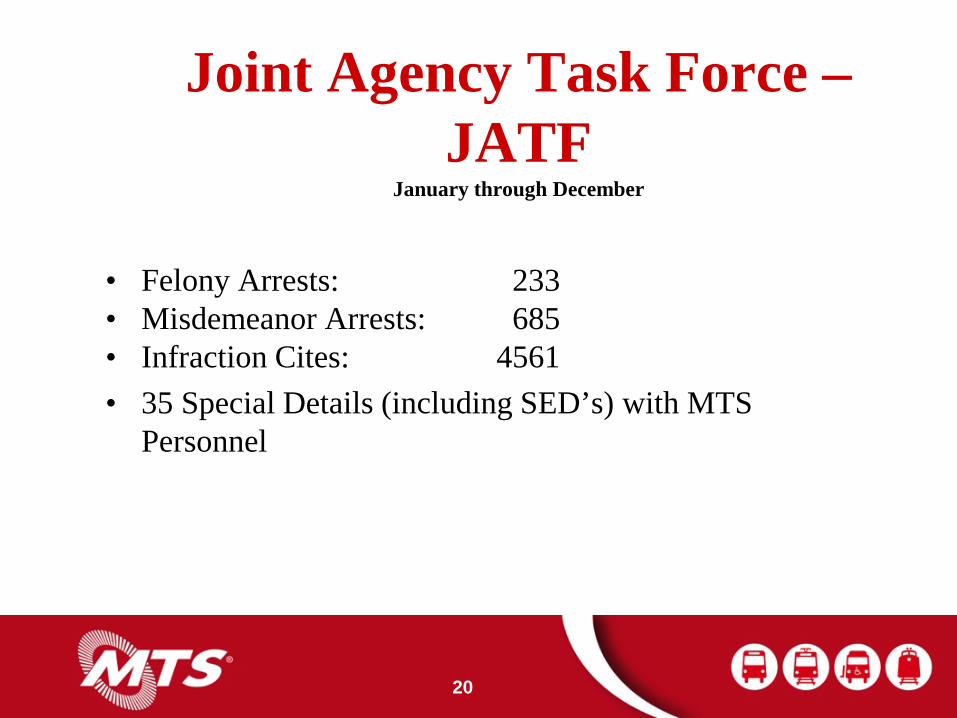
Joint Agency Task Force – JATF
January through December
• Felony Arrests: 233 • Misdemeanor Arrests: 685 • Infraction Cites: 4561 • 35 Special Details (including SED’s) with MTS
Personnel

21
Fare Inspections and Citations
Fare Inspections 2016 2017 8,596,500 7,641,711
There was a 11.1% decrease in fare inspections and a 92% increase in citations issued in 2017
Citations 31,948 61,286 The top three citation violation charges are for Fare Evasion, Smoking and Failure to Comply. 2016 2017 Percentage Change
Fare Evasion 25,452 45,722 + 80%
Smoking 2,674 6,165 + 131%
Failure to Comply 682 1,310 + 92%
22
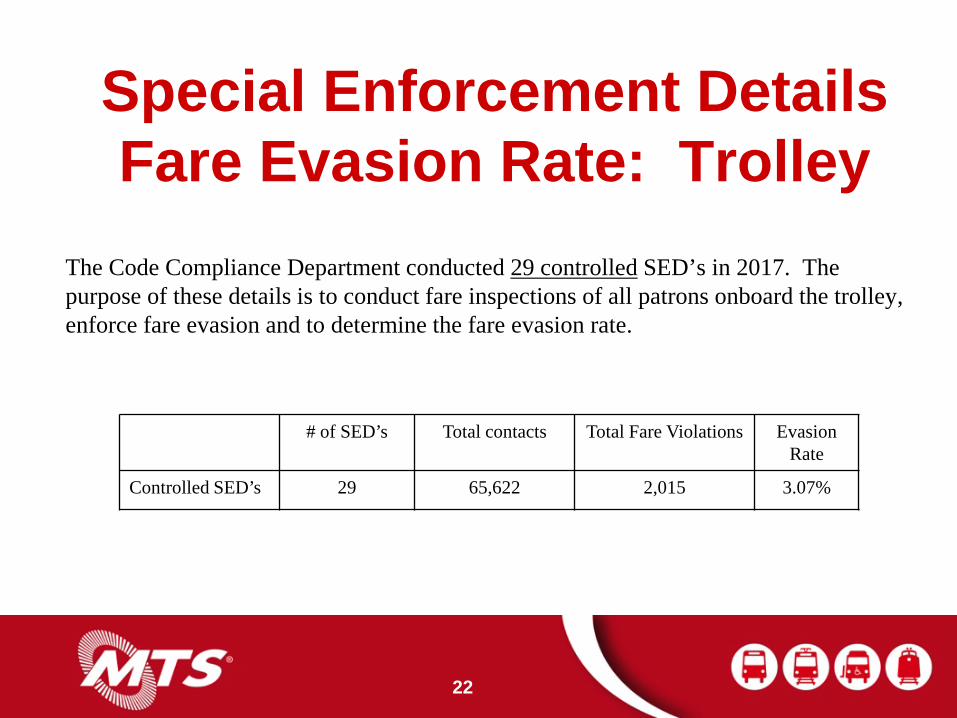
Special Enforcement Details Fare Evasion Rate: Trolley
The Code Compliance Department conducted 29 controlled SED’s in 2017. The purpose of these details is to conduct fare inspections of all patrons onboard the trolley, enforce fare evasion and to determine the fare evasion rate.
# of SED’s Total contacts Total Fare Violations Evasion Rate
Controlled SED’s 29 65,622 2,015 3.07%

23
SDM Inspections January through December 2017
Total Riders Inspected
Total SDMs Inspected
Citations Warnings Violation Rate
Trolley 7,641,711 1,071,800 1,315 87 0.13%
Bus 89,391 39,632 118 13 0.33%

24
Quality of Life – Transient Encampment Details
• Trespassing – 438 • Loitering – 89 • No Fare – 276 • Drug/Paraphernalia – 2 • Quality of Life* - 87
– *Includes smoking, alcohol violations and unruly conduct.
Twenty one large scale Transient Encampment details and 87 mini-details were conducted to address illegal lodging and other nuisance quality-of-life concerns on MTS properties. The following number of citations were issued (January through December):
25
Transient Encampment Details SD River
• Since December 19, 2017 through April 7, 2018, MTS personnel conducted 43 special details/patrols of MTS property located in the San Diego River area. – 64 citations were issued – Provided security for 11 clean-ups – Worked with City personnel to address
homeless activity/clean-up of island in river (March 27-29 2018)

26
Non-Compliant Arrests
CCI TSS Both CCI and TSS
Total
2016 79 429 NA 508 2017 77 165 531 773
There was a 52% increase in non-compliant arrests in 2017

27
Training
All Code Compliance Inspectors and Code Compliance Supervisors attended the following training: • De-escalation Training – Provided by the Sheriff’s Department at no
charge • Defensive Tactics Training – Taught by POST Certified Instructors
– no charge for Sheriff facilities • De-escalation Training – Taught by a licensed psychologist who is a
former La Mesa police captain (2018) • CPR (2017 – 2018)

28
Current Challenges • Issues involving Homeless
– San Diego River – Loitering, abuse of system
• Counterfeit Mobile App (Compass Class) – First identified – March 10, 2018
• Pets/Fake Service Animals • SDPD Records Overload
– SDSO will be assisting effective this week • AB109/Prop 47 related Issues

29
Security Contract Challenges • Allied Universal continues to be unable to meet armed guard staffing
levels due to a low contracted hourly rate. – Current pay rate for an armed guard is $13/hour
• Allied Universal believes they will be able to meet the required staffing levels by increasing the hourly pay rate for armed guards and have proposed the following rate increases:
– 2018 - $14.50/hour – 2019 - $15.00/hour – 2020 - $16.00/hour – 2021 - $17.00/hour
Each pay increase corresponds with the increase in minimum wage and maintains a $3.00 buffer over minimum wage. The fiscal impact of the proposal is $1.2M over the life of the contract

30
End of Presentation
Questions?