1 MTA Defined Benefit Pension Plan For Employees of Metro - North Railroad.

Meeting of the
Metro-North Railroad
Committee
January 2015
Members
J. Sedore, Chair
F. Ferrer, MTA Vice Chairman
J. Ballan
R. Bickford
N. Brown
J. Kay
S. Metzger
C. Moerdler
J. Molloy
M. Pally
A. Saul
C. Wortendyke
N. Zuckerman

Metro-North Railroad Committee Meeting 347 Madison Avenue 5th Floor Board Room New York, NY 10017 Tuesday, 1/20/2015 8:30 - 9:30 AM ET
1. Public Comments
2. Approval of Minutes
Approval of Minutes - Page 3
3. Approval of 2015 Work Plan
2015 MNR Committee Work Plan - Page 9
4. President's Reports
Safety Report
MNR-Safety Report - Page 15
a. Enhanced Safety Report
Enhanced Safety Report - Page 18
MTA Police Report
MTA Police Report - Page 19
5. Procurements
Procurements - Page 24
Competitive
Competitive - Page 27
Ratifications
Ratifications - Page 30
6. Operations Report
Operations Report - Page 32
7. Financial Report
Financial Report - Page 44
8. Ridership Report
Ridership Report - Page 68
9. Capital Program Report
Capital Program Report - Page 79 Date of next meeting: Joint meeting with Long Island Rail Road, Monday, February 23, 2015 @ 8:30 A.M.
Minutes of the Regular Meeting Metro-North Committee
Monday, December 15, 2014
Meeting Held at 347 Madison Avenue
New York, New York 10017
8:30 a.m. The following members were present: Hon. Fernando Ferrer, Vice Chairman, MTA Hon. James L. Sedore, Jr., Chairman of the Metro-North Committee Hon. Mitchell H. Pally, Chairman of the Long Island Committee Hon. Jonathan A. Ballan Hon. Robert C. Bickford Hon. Norman Brown Hon. Susan G. Metzger Hon. John J. Molloy Hon. Carl V. Wortendyke Hon. Neal Zuckerman Not Present: Hon. Jeffrey A. Kay Hon. Charles G. Moerdler Hon. Andrew M. Saul Also Present: Donna Evans – Chief of Staff Ralph Agritelley– Vice President, Labor Relations Michael R. Coan – Chief, MTA Police Department Susan J. Doering – Vice President, Customer Service and Stations Randall Fleischer – Vice President, GCT and Corporate Development James B. Henly – Vice President and General Counsel John Kesich– Senior Vice President Operations Anne Kirsch – Chief Safety Officer Timothy McCarthy – Vice President, Capital Programs Kim Porcelain – Vice President, Finance and Information Systems Robert Rodriguez – Director, Diversity and EEO Michael Shiffer – Vice President – Operations Planning Chairman Sedore called the meeting of the Metro-North Committee to order. He noted that President Giulietti is in Japan attending the East Japan Railroad Centennial Celebration of Tokyo
Master Page # 3 of 83 - Metro-North Railroad Committee Meeting 1/20/2015
________________________________________________________________________________

Station, Grand Central Terminal’s sister station in Japan and will be attending meetings with Kawasaki.
One public speaker addressed the Committee. Murray Bodin complimented Metro-North on recent station improvements. He discussed the blowing of train horns and the public address system. Additional details of the comments made by Mr. Bodin are contained in the video recording of the meeting produced by the MTA and maintained in the MTA records.
Upon motion duly made and seconded, the Committee approved the minutes of the
November 17, 2014 Committee meeting. There were no changes to the 2014 work plan.
MTA METRO-NORTH RAILROAD PRESIDENT’S REPORT John Kesich, Senior Vice President - Operations, reported on Metro-North operations in the absence of President Giulietti. Mr. Kesich noted that ongoing, aggressive track maintenance and improvement work, an increase in number of speed restrictions due to enhanced track inspections and delays related to slip-slide conditions were contributing factors in the significant increase in train delays of six to 10 minute duration in November 2014. Slip-slide conditions and speed restrictions have also created issues in the sequencing of trains at Woodlawn, where the New Haven and Harlem Lines converge, and at Mott Haven, where trains merge with the Hudson Line. He noted that the slip-slide condition is a typical fall occurrence which has begun to diminish in December. As a result of the above conditions, the east of Hudson overall on-time performance of 86.9% in November was 6.1% below goal. The AM Peak operated at 77% while the PM Peak continued to perform above goal across all three lines. The west of Hudson overall on-time performance was 94.4% in November and 95.4% year-to-date. Mr. Kesich reported on the preparations that Metro-North has taken to deal with potential inclement winter weather conditions. He noted that Metro-North is completing its winter preparations for the rolling stock fleet and the infrastructure. Metro-North has purchased additional snow-fighting equipment, including two additional cold air blowers (for a total of five) which will allow Metro-North to clean yard switches and the third rail simultaneously at more locations. Metro-North also purchased an additional front-end loader and backhoe which will enable Metro-North to plow more of the right-of-way in order to access track interlockings and power substation locations. In 2013, Metro-North received two high volume snow blowers from New York City Transit and has completed the retrofitting of three jet hot air blowers for greater power and fuel efficiency. Most importantly, Metro-North has taken steps to ensure that customers are well-informed before and during a storm event with timely and accurate information through station announcements, platform display signs, email alerts, special notices and service status box updates on the website. The Metro-North Train Time App also provides real-time service status on Smartphones or computers. These communication elements provide Metro-North with the ability to provide more information in a timelier manner during emergencies. Metro-North’s goal during severe weather events is to provide customers with the best and safest service available, and to return to regularly scheduled service as soon as possible. Mr. Kesich reported that, as a first step toward developing programs that improve employee wellness and safety, Metro-North has identified a health care company to provide medical testing
Master Page # 4 of 83 - Metro-North Railroad Committee Meeting 1/20/2015
________________________________________________________________________________
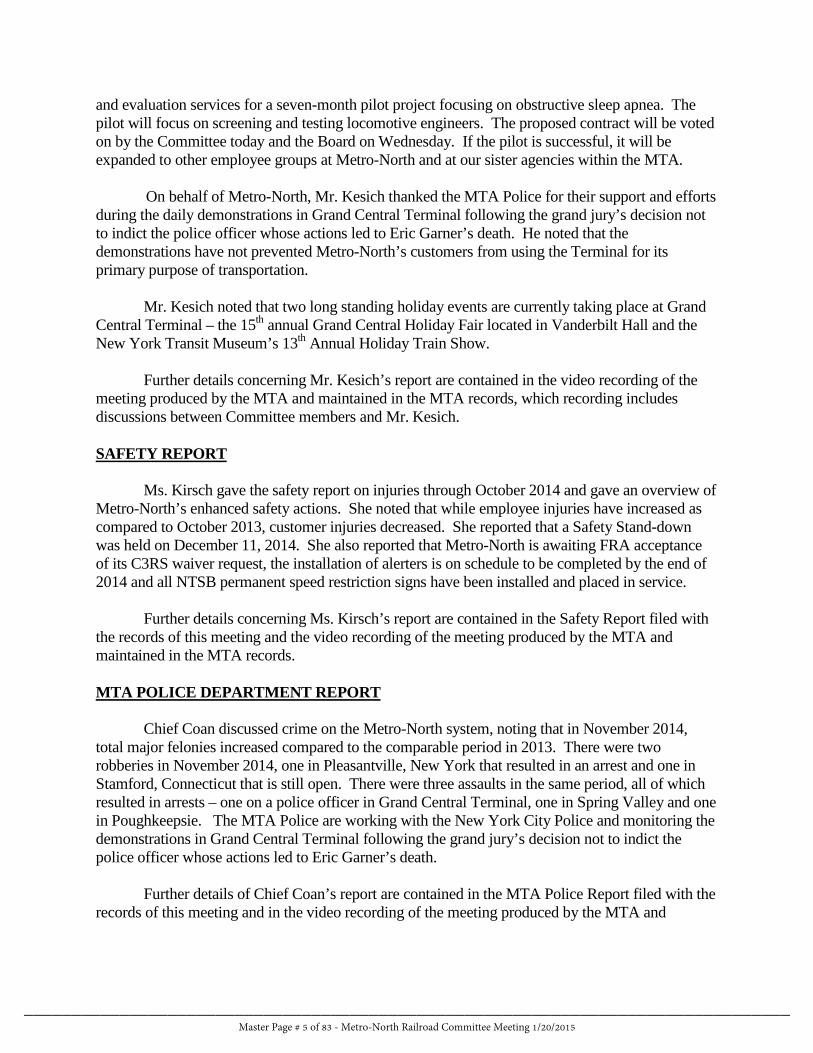
and evaluation services for a seven-month pilot project focusing on obstructive sleep apnea. The pilot will focus on screening and testing locomotive engineers. The proposed contract will be voted on by the Committee today and the Board on Wednesday. If the pilot is successful, it will be expanded to other employee groups at Metro-North and at our sister agencies within the MTA. On behalf of Metro-North, Mr. Kesich thanked the MTA Police for their support and efforts during the daily demonstrations in Grand Central Terminal following the grand jury’s decision not to indict the police officer whose actions led to Eric Garner’s death. He noted that the demonstrations have not prevented Metro-North’s customers from using the Terminal for its primary purpose of transportation. Mr. Kesich noted that two long standing holiday events are currently taking place at Grand Central Terminal – the 15th annual Grand Central Holiday Fair located in Vanderbilt Hall and the New York Transit Museum’s 13th Annual Holiday Train Show. Further details concerning Mr. Kesich’s report are contained in the video recording of the meeting produced by the MTA and maintained in the MTA records, which recording includes discussions between Committee members and Mr. Kesich. SAFETY REPORT Ms. Kirsch gave the safety report on injuries through October 2014 and gave an overview of Metro-North’s enhanced safety actions. She noted that while employee injuries have increased as compared to October 2013, customer injuries decreased. She reported that a Safety Stand-down was held on December 11, 2014. She also reported that Metro-North is awaiting FRA acceptance of its C3RS waiver request, the installation of alerters is on schedule to be completed by the end of 2014 and all NTSB permanent speed restriction signs have been installed and placed in service. Further details concerning Ms. Kirsch’s report are contained in the Safety Report filed with the records of this meeting and the video recording of the meeting produced by the MTA and maintained in the MTA records. MTA POLICE DEPARTMENT REPORT Chief Coan discussed crime on the Metro-North system, noting that in November 2014, total major felonies increased compared to the comparable period in 2013. There were two robberies in November 2014, one in Pleasantville, New York that resulted in an arrest and one in Stamford, Connecticut that is still open. There were three assaults in the same period, all of which resulted in arrests – one on a police officer in Grand Central Terminal, one in Spring Valley and one in Poughkeepsie. The MTA Police are working with the New York City Police and monitoring the demonstrations in Grand Central Terminal following the grand jury’s decision not to indict the police officer whose actions led to Eric Garner’s death. Further details of Chief Coan’s report are contained in the MTA Police Report filed with the records of this meeting and in the video recording of the meeting produced by the MTA and
Master Page # 5 of 83 - Metro-North Railroad Committee Meeting 1/20/2015
________________________________________________________________________________

maintained in the MTA records, which recording includes discussions between MTA Vice Chairman Ferrer, Director Raymond Diaz and Chief Coan. Action Item: Upon motion duly made and seconded, the following action item was approved for recommendation to the Board.
• Metro-North Railroad 2015 Budget and 2015-2018 Financial Plan – Board adoption of the MTA Metro-North Railroad 2014 November Forecast, 2015 Final Proposed Budget and 2015-2018 Financial Plan.
Details concerning the above item are contained in a staff summary and related documents filed with the records of this meeting and in the video recording of the meeting produced by the MTA and maintained in the MTA records. Information Item: One informational item was reported to the Committee:
• 2015 Proposed Metro-North Committee Work Plan – Chairman Sedore presented the proposed work plan that was prepared based upon reports that Metro-North and the Long Island Rail Road provided in 2014. He noted that the work plan is being coordinated with the Long Island Rail Road’s work plan for consistency in reporting to the Committee during the months that the Committees meet jointly and separately. The final 2015 work plan will be presented to the Committee for approval in January 2015.
The 2015 Proposed Metro-North Committee Work Plan is filed with the records of this meeting. Procurements: One non-competitive procurement was presented to the Committee:
• Approval to award a non-competitive, miscellaneous service contract to Smart Software, Inc. for a period of three years to provide maintenance and support of Metro-North’s Algorithmic Forecasting System.
Five competitive procurements were presented to the Committee.
• Approval of a 48-month competitively solicited and negotiated design contract with HNTB New York Engineering & Architecture, P.C. to design various customer communication systems at Grand Central Terminal and at outlying passenger stations.
• Approval to retain General Engineering Consultants to perform personal services for design, engineering, supervision inspection services and miscellaneous professional
Master Page # 6 of 83 - Metro-North Railroad Committee Meeting 1/20/2015
________________________________________________________________________________

services to support the 2015-2019 Capital Program and the needs of the operating divisions.
• Approval to award a competitively solicited and negotiated, seven month personal service contract to the firm of Persante Health Care, Inc. to screen, manage, coordinate, evaluate and monitor treatment for up to 250 locomotive engineers for obstructive sleep apnea.
• Approval for additional funding totaling $510,826 and a one-year extension to Gannet Fleming Engineers and Architects, P.C. for additional design services to advance the Grand Central Terminal escalator replacement drawings from 30% to 100% complete design.
• Approval for additional funding totaling $149,614 to Konecranes, Inc. to provide preventive maintenance, inspection and repair of all jib and overhead cranes located throughout Metro-North New York and Connecticut facilities.
Upon motion duly made and seconded, all the foregoing procurement items were approved for recommendation to the Board. Board member Ballan recused himself from voting with respect to the first two of the five competitive procurements identified above. The details of the above items are contained in staff summaries and reports filed with the records of this meeting and in the video recording of the meeting produced by the MTA and maintained in the MTA records which recording includes discussions between the Committee members and Mr. Kesich related to procurement matters. Operations Report: The details of Mr. Kesich’s report are contained in the President’s Report above and in the Operations Report filed with the records of this meeting and in the video recording of the meeting produced by the MTA and maintained in the MTA records. Financial Report: Ms. Porcelain presented the financial report for the period ending October 31, 2014. She noted that, as a result of the recent retroactive wage adjustments, the October 2014 adjusted Farebox Operating Ratio was 59.8% compared to the Farebox Operating Ratio of 69.4% in the comparable period of 2013. Further details of Ms. Porcelain’s report are contained in the financial reports filed with the records of this meeting and in the video recording of the meeting produced by the MTA and maintained in the MTA records. Ridership Report: Mr. Shiffer presented the October 2014 ridership report. He noted that total system ridership east of Hudson was 3.6% higher than in the comparable period of 2013, rail commutation ridership was 1.9% higher and rail non-commutation ridership was 6.4% higher. West of Hudson ridership was 9.2% higher in October 2014 than in the comparable period of
Master Page # 7 of 83 - Metro-North Railroad Committee Meeting 1/20/2015
________________________________________________________________________________

2013, Pt. Jervis Line ridership was 7% higher and Pascack Valley Line ridership was 12.8% higher. Year-to-date October 2014 total system ridership was 1.2% higher than in the comparable period of 2013 and .8% above forecast.
Further details of Mr. Shiffer' s report are contained in the December 2014 Ridership Report filed with the records of this meeting and in the video recording of the meeting produced by the MT A and maintained in the MT A records.
Capital Program Report:
Mr. McCarthy presented the capital program report. The details of that report are contained in the December 2014 Capital Program Report filed with the records of the meeting and in the video recording of the meeting produced by the MT A and maintained in the MTA records.
Adjournment
Upon motion duly made and seconded, the Committee unanimously voted to adjourn the meeting.
Dec 2014 Committee Minutes Legal/Corporate/Committee Minutes Current
Respectfully submitted,
;µ._~ Linda Montanino Assistant Secretary
Master Page # 8 of 83 - Metro-North Railroad Committee Meeting 1/20/2015
________________________________________________________________________________

2015 Metro-North Railroad Committee Work Plan I. RECURRING AGENDA ITEMS Responsibility
Approval of Minutes Committee Chairs & Members 2015 Committee Work Plan Committee Chairs & Members President’s Report President/Senior Staff
Safety Report MTA Police Report
Information Items (if any) Action Items (if any) Procurements Agency Reports Senior Staff
Operations Finance Ridership Capital Program
II. SPECIFIC AGENDA ITEMS Responsibility
January 2015
Approval of 2015 Committee Work Plan Committee Chairs & Members
February 2015 (Joint meeting with LIRR)
Adopted Budget/Financial Plan 2015 Finance 2014 Annual Operating Results Operations 2014 Annual Fleet Maintenance Report Operations Bi-Annual Report on PTC President Diversity/EEO Report – 4th Quarter 2014 Diversity and EEO March 2015
Annual Strategic Investments & Planning Studies Capital Planning 2015 Spring/Summer Schedule Change Operations Planning & Analysis Annual Elevator & Escalator Report Engineering April 2015 (Joint meeting with LIRR – MNR lead)
Final Review of 2014 Operating Budget Results Finance 2014 Annual Ridership Report Operations Planning & Analysis Annual Inventory Report Procurement Bi-Annual Report on M-9 Procurement President
May 2015
Diversity/EEO Report – 1st Quarter 2015 Diversity and EEO
Master Page # 9 of 83 - Metro-North Railroad Committee Meeting 1/20/2015
________________________________________________________________________________
June 2015 (Joint meeting with LIRR)
Grand Central Terminal Retail Development MTA Real Estate
July 2015
Environmental Audit Environmental Compliance
September 2015 (Joint meeting with LIRR – MNR lead)
2016 Preliminary Budget (Public Comment) Finance 2015 Mid-Year Forecast Finance Bi-Annual Report on M-9 Procurement President Diversity/EEO Report – 2nd Quarter 2015 Diversity and EEO
October 2015 2016 Preliminary Budget (Public Comment) Finance 2015 Fall Schedule Change Operations Planning & Analysis
November 2015 (Joint meeting with LIRR)
2016 Preliminary Budget (Public Comment) Finance Annual Committee Charter Review Committee Chairs & Members Holiday Schedule Operations Planning & Analysis Bi-Annual Report on PTC President Diversity/EEO Report – 3rd Quarter 2015 Diversity and EEO December 2015
2016 Final Proposed Budget Finance 2016 Proposed Committee Work Plan Committee Chairs & Members
Master Page # 10 of 83 - Metro-North Railroad Committee Meeting 1/20/2015
________________________________________________________________________________

METRO-NORTH RAIL ROAD COMMITTEE WORK PLAN _____________________________________________________________________________________________
DETAILED SUMMARY I. RECURRING AGENDA ITEMS
Approval of Minutes The Committee Chair will request a motion to approve the minutes of the prior month’s meeting. 2015 Work Plan The Work Plan will list, by month, the topics scheduled for review. The Committee will be advised if any changes have been made to the plan. President’s Report A monthly report will be provided highlighting major accomplishments and progress on key initiatives on performance indicators. Safety A monthly report will be provided highlighting key safety performance statistics and indicators and an update on enhanced safety actions throughout Metro-North’s system. Police Activity Report MTA Police will highlight the significant police activities incurred during the month reported. Information Items (if any) Materials presented to the Committee for review pertaining to certain agency initiatives and functions. Action Items (if any) Staff summary documents presented to the Board for approval of items affecting business standards and practices. Procurements List of procurement action items requiring Board approval. The Non-Competitive items will be first, followed by the Competitive items and then the Ratifications. The list will include items that need a 2/3 vote of the Board for approval. Operations A monthly report will be provided highlighting key operating and performance statistics and indicators. Finance A monthly report will be provided that compares the Railroad’s actual financial performance against its budget and/or forecast both on an accrual and cash basis. Ridership A monthly report will be provided that includes a comparison of actual monthly ticket sales, ridership and revenues with the budget and prior year results. Capital Program A monthly report will be provided highlighting significant capital program accomplishments in the month reported.
Master Page # 11 of 83 - Metro-North Railroad Committee Meeting 1/20/2015
________________________________________________________________________________
II. SPECIFIC AGENDA ITEMS
JANUARY 2015 Approval of 2015 Committee Work Plan The Committee will approve the Proposed Metro-North Railroad Committee Work Plan for 2015 that will address initiatives to be reported on throughout the year. FEBRUARY 2015 (Joint Meeting with LIRR) Adopted Budget/Financial Plan 2015 The Agency will present its revised 2015 Financial Plan. These plans will reflect the 2015 Adopted Budget and an updated Financial Plan for 2015 reflecting the out-year impact of any changes incorporated into the 2015 Adopted Budget. 2014 Annual Operating Results A review of the prior year’s performance of railroad service will be provided to the Committee. 2014 Annual Fleet Maintenance Report An annual report will be provided to the Committee on the Agency’s fleet maintenance plan to address fleet reliability and availability. Bi-Annual Report on PTC The Committee will be briefed on the status of PC, including activities to date and the current strategy to meet critical milestones identified in the Rail Safety Improvement Act of 2008. Highlights to include cost of PTC along with operation and implementation risks.
Diversity & EEO Report– 4th Quarter 2014 A quarterly report to the Committee providing data on key EEO and Human Resources indicators relating to MNR's Equal Employment Opportunity and Diversity efforts, such as composition of the agency’s workforce, new hires, and discrimination complaints. In alternating quarters, the report will include additional information on diversity initiatives. MARCH 2015 Annual Strategic Investments & Planning Studies A comprehensive annual report will be provided to the Committee of the Agency’s strategic investments & planning studies that will include fleet, facility, infrastructure, station projects, station access improvements, and environmental and feasibility studies. 2015 Spring/Summer Schedule Change The Committee will be informed of the schedule changes taking effect for train service on the Hudson, Harlem, New Haven, Pascack and Port Jervis lines during the spring and summer of 2015. APRIL 2015 (Joint Meeting with LIRR – MNR lead)
Final Review of 2014 Operating Results A review of the prior year’s budget results and their implications for current and future budget performance will be presented to the Committee. 2014 Annual Ridership Report A report will be presented to the Committee on Agency ridership trends during 2014 based on monthly ticket sales data and the results of train ridership counts conducted by the Agency.
Master Page # 12 of 83 - Metro-North Railroad Committee Meeting 1/20/2015
________________________________________________________________________________

Annual Elevator/Escalator Report Annual report to the Committee on system-wide reliability and availability for elevators and escalators throughout the system. Annual Inventory Report The Agency will present its annual report on Inventory. MAY 2015
RCM Fleet Maintenance An annual report will be provided to the Committee on the Agency’s fleet maintenance plan to address fleet reliability and availability. Diversity & EEO Report– 1st Quarter 2015 A quarterly report to the Committee providing data on key EEO and Human Resources indicators relating to MNR's Equal Employment Opportunity and Diversity efforts, such as composition of the agency’s workforce, new hires, and discrimination complaints. In alternating quarters, the report will include additional information on diversity initiatives. JUNE 2015 (Joint Meeting with LIRR)
Grand Central Terminal Retail Development MTA Real Estate will provide an annual report on leasing and construction opportunities and financial and marketing information related to retail development in Grand Central Terminal. JULY 2015
Environmental Audit Report The Committee will be briefed on the results of the 2015 environmental audit report which is submitted to NYS Department of Environmental Conservation as required by the Environmental Audit Act, as well as the actions implemented to enhance overall compliance, monitoring and reporting. SEPTEMBER 2015 (Joint Meeting with LIRR – MNR lead) 2015 Final Mid-Year Forecast The agency will provide the 2015 Mid-Year Forecast financial information for revenue and expense by month.
2016 Preliminary Budget Public comment will be accepted on the 2016 Budget.
Bi-Annual Report on M-9 Procurement The committee will be briefed on the status of the M-9 procurement, including design, fabrication and delivery status, plus budget and schedule performance. Diversity & EEO Report– 2nd Quarter 2015 A quarterly report to the Committee providing data on key EEO and Human Resources indicators relating to MNR's Equal Employment Opportunity and Diversity efforts, such as composition of the agency’s workforce, new hires, and discrimination complaints. In alternating quarters, the report will include additional information on diversity initiatives.
Master Page # 13 of 83 - Metro-North Railroad Committee Meeting 1/20/2015
________________________________________________________________________________

OCTOBER 2015
2016 Preliminary Budget Public comment will be accepted on the 2016 Budget. Bi-Annual Report on PTC The Committee will be briefed on the status of PC, including activities to date and the current strategy to meet critical milestones identified in the Rail Safety Improvement Act of 2008. Highlights to include cost of PTC along with operation and implementation risks. 2015 Fall Schedule Change The Committee will be informed of the schedule changes taking effect for train service on the Hudson, Harlem, New Haven, Pascack and Port Jervis lines for the Fall of 2015. NOVEMBER 2015
2016 Preliminary Budget Public comment will be accepted on the 2016 Budget. Review Committee Charter Annual review and approval of the MNR Committee Charter. Holiday Schedule The Committee will be informed of Agency’s service plans for the Thanksgiving and Christmas/New Year’s holiday periods. Diversity & EEO Report– 3rd Quarter 2015 A quarterly report to the Committee providing data on key EEO and Human Resources indicators relating to LIRR's Equal Employment Opportunity and Diversity efforts, such as composition of the agency’s workforce, new hires, and discrimination complaints. In alternating quarters, the report will include additional information on diversity initiatives. DECEMBER 2015
2016 Final Proposed Budget The Committee will recommend action to the Board on the Final Proposed Budget for 2016. Proposed 2016 Committee Work Plan The Committee Chair will present a draft Metro-North Committee Work Plan for 2016 that will address initiatives to be reported throughout the year.
Master Page # 14 of 83 - Metro-North Railroad Committee Meeting 1/20/2015
________________________________________________________________________________

Safety Report
January 2015
Master Page # 15 of 83 - Metro-North Railroad Committee Meeting 1/20/2015
________________________________________________________________________________

Year Total
2010 1672011 1992012 1842013 2102014 227
5.7%2.80
Year Total
2010 1392011 1622012 1492013 1732014 192
8.5%2.35
Year LT RD LT FI* RD FI* LT&RD FI*
2010 90 18 1.59 0.32 1.912011 95 27 1.66 0.47 2.132012 110 7 1.91 0.12 2.042013 135 6 2.26 0.10 2.362014 161 2 2.64 0.03 2.67
13.0%1.75
* - Injuries per 200,000 hours worked
2014 Total FI Goal
3.20
2014 LT&RD FI Goal
% change from last year:
% change from last year:
Employee Lost Time and Restricted Duty Injuries
Employee FRA Reportable Injuries
2014 FRA FI Goal
FRA FI*
2.452.832.592.903.14
MTA Metro-North RailroadSummary of Employee Injuries thru November
Total Employee Injuries
% change from last year:
Total FI*
3.523.72
2.953.48
2.95
3.483.20
3.523.72
0.00
1.00
2.00
3.00
4.00
5.00
2010 2011 2012 2013 2014
2.452.83
2.592.90
3.14
0.00
1.00
2.00
3.00
4.00
5.00
2010 2011 2012 2013 2014
1.912.13 2.04
2.362.67
0.00
1.00
2.00
3.00
4.00
5.00
2010 2011 2012 2013 2014
Master Page # 16 of 83 - Metro-North Railroad Committee Meeting 1/20/2015
________________________________________________________________________________
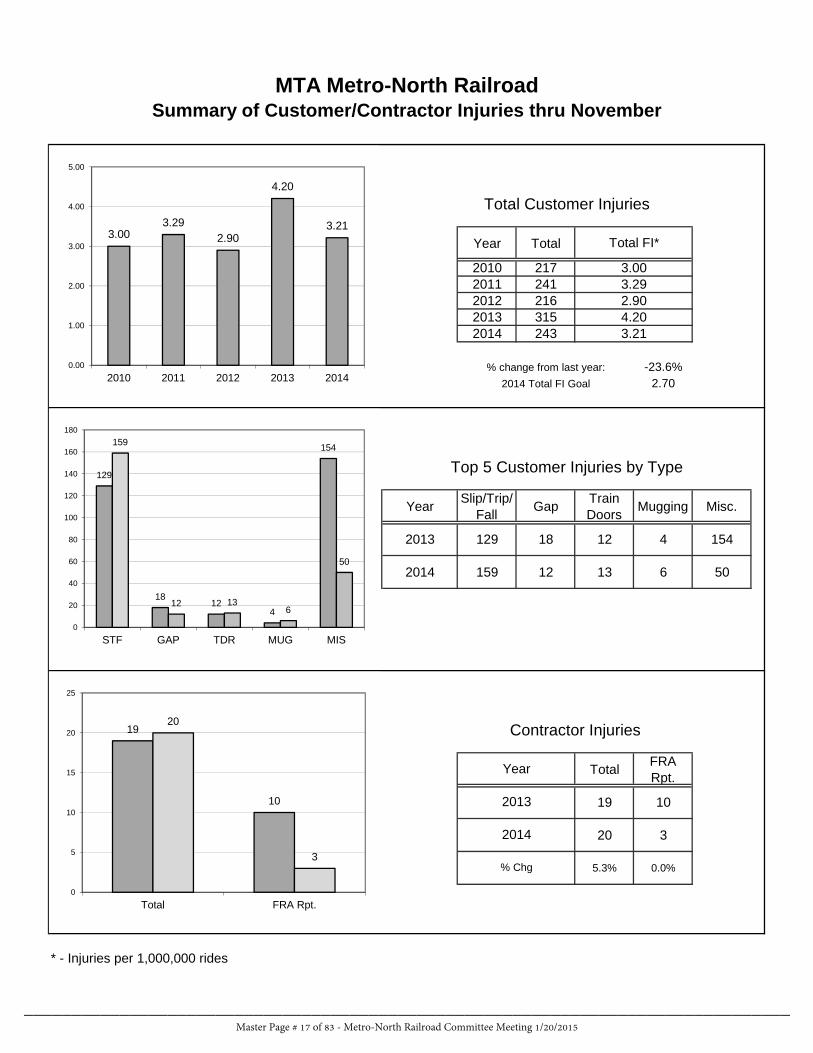
Year Total
2010 2172011 2412012 2162013 3152014 243
-23.6%2.70
Year Slip/Trip/Fall Gap Train
Doors Mugging Misc.
2013 129 18 12 4 154
2014 159 12 13 6 50
Total FRA Rpt.
19 10
20 3
5.3% 0.0%
* - Injuries per 1,000,000 rides
MTA Metro-North RailroadSummary of Customer/Contractor Injuries thru November
Total Customer Injuries
% change from last year:
Total FI*
3.003.292.904.203.21
2014 Total FI Goal
% Chg
2013
2014
Top 5 Customer Injuries by Type
Year
Contractor Injuries
129
1812
4
154159
12 136
50
0
20
40
60
80
100
120
140
160
180
STF GAP TDR MUG MIS
19
10
20
3
0
5
10
15
20
25
Total FRA Rpt.
3.003.29
2.90
4.20
3.21
0.00
1.00
2.00
3.00
4.00
5.00
2010 2011 2012 2013 2014
Master Page # 17 of 83 - Metro-North Railroad Committee Meeting 1/20/2015
________________________________________________________________________________

Memorandum Metro-North Railroad
Date: January, 2015 To: Metro-North Committee
From: Joseph Giulietti
Re: Enhanced Safety Action Update
This is to update you on Metro-North’s comprehensive efforts to enhance safety throughout our system:
• Our fourth quarter safety stand down was held on December 11, 2014, with a continued focus on motor vehicle
safety and winter safety preparedness. Our next stand down will be scheduled for March 5, 2015.
• Our waiver request was submitted to the FRA and we are awaiting their acceptance.
• Our C3RS Peer Review Team training for agreement, management and FRA participants was held on
January 14 – 16, 2014.
The following progress was made on speed compliance enhancements and Positive Train Control (PTC).
ACTION ITEM STATUS
Alerters • Modifications completed. The M3 fleet, the coach cab car fleet and the
M2 fleets are 100% complete.
NTSB
Recommendations
• We continue to implement NTSB recommendations, and will work with
the NTSB to close out each of these recommendations, while
coordinating with the other MTA agencies to ensure best practices are
shared.
Speed
Compliance
• For the month of December, 54 compliant radar observations were
performed and 153 event recorder Download Reviews with no failures.
There were a total of 2,029 downloads reviewed in 2014.
PTC
• The Systems Integrator (SI) is progressing Preliminary Design.
Communications design elements are lagging. Additional resources have
been obtained by the SI as part of mitigation. Radio compliance testing in
process. First Article Inspection (FAI) for Transponder brackets has been
completed. Delivery of brackets for early installation has been received,
and being prepared for installation.
Master Page # 18 of 83 - Metro-North Railroad Committee Meeting 1/20/2015
________________________________________________________________________________

Police Report
January 2015
Master Page # 19 of 83 - Metro-North Railroad Committee Meeting 1/20/2015
________________________________________________________________________________

METROPOLITAN TRANSPORTATION AUTHORITY
Police Department
Murder
Rape
Robbery
Felony Assault
Burglary
Grand Larceny
Grand Larceny Auto
Total Major Felonies
0
0
2
1
0
9
0
12
0
0
2
0
0
0
14
16
-5
0
0
0
1
0
0
-4
-36%
Murder
Rape
Robbery
Felony Assault
Burglary
Grand Larceny
Grand Larceny Auto
Total Major Felonies
103 103
1
16
13
20
0
0
153 146
6
6
13
17
1
0
0
-5
10
0
3
-1
0
7
0%
0%
0%
100%
0%
0%
-25%
0%
-100%
18%
0%
167%
0%
-83%
5%
2014 2013 Diff % Change
December 2014 vs. 2013
Metro North Railroad
FIGURES ARE PRELIMINARY AND SUBJECT TO FURTHER ANALYSIS AND REVISION
2014 2013 Diff % Change
Year to Date 2014 vs. 2013
Master Page # 20 of 83 - Metro-North Railroad Committee Meeting 1/20/2015
________________________________________________________________________________

METROPOLITAN TRANSPORTATION AUTHORITY
Police Department
December 2014 vs. 2013
System Wide
2014
Murder
Rape
Robbery
Felony Assault
Burglary
Grand Larceny
Grand Larceny Auto
Total Major Felonies
0
0
6
4
1
17
0
28
0
0
4
1
0
0
25
30
-8
0
0
2
3
1
0
-2
-32%
Murder
Rape
Robbery
Felony Assault
Burglary
Grand Larceny
Grand Larceny Auto
Total Major Felonies
Year to Date 2014 vs. 2013
240 239
2
21
38
64
0
0
365 330
7
10
28
44
1
1
1
-5
11
10
20
-1
-1
35
2013 Diff % Change
0%
0%
50%
300%
100%
0%
-7%
-100%
-100%
45%
36%
110%
0%
-71%
11%
2014 2013 Diff % Change
FIGURES ARE PRELIMINARY AND SUBJECT TO FURTHER ANALYSIS AND REVISION
Master Page # 21 of 83 - Metro-North Railroad Committee Meeting 1/20/2015
________________________________________________________________________________

MTA Police Department
1/1/2014 to 12/31/2014
Arrest Classification Total Arrests
Arrest Summary: Department Totals
2014 2013
Murder 0 2Robbery 58 47Felony Assault 33 35Burglary 10 10Grand Larceny 67 68Grand Larceny Auto 3 1Aggravated Harassment 4 2Aggravated Unlicensed Operator 34 50Assault-Misdemeanor 56 64Breach of Peace 10 12Child Endangerment 1 3Conspiracy 0 14Criminal Contempt 4 6Criminal Impersonation 2 10Criminal Mischief 29 45Criminal Possession Stolen Property 15 26Criminal Tampering 0 3Criminal Trespass 25 39Disorderly Conduct 2 11Drug Offenses 49 32DUI Offenses 12 17Failure to Appear 0 1Falsely Reporting an Incident 4 9Forgery 89 23Fraud 6 8Graffiti 10 6Harassment 6 6Identity Theft 0 1Issue a Bad Check 0 2Make Terrorist Threat 1 0Menacing 8 16Obstruct Government 6 11Panhandling 1 0Petit Larceny 103 94Public Lewdness 38 24Rail Road Rules & Regulations 1 0Reckless Endangerment 7 8Resisting Arrest 52 69Sex Offenses 12 10Stalking 2 1Theft of Services 139 101Unlawful Imprisonment/Kidnapping 0 2Unlawful Surveilance 2 1VTL Offenses 2 4Warrant Arrest 54 36Weapons Offenses 7 9Unauthorized Use Vehicle 0 1
Total Arrests 964 940
Master Page # 22 of 83 - Metro-North Railroad Committee Meeting 1/20/2015
________________________________________________________________________________

Systemwide LIRR MNRR SIRT
Murder 0 0 0 0
Rape 0 0 0 0
Robbery 6 3 2 1
Fel. Assault 4 3 1 0
Burglary 1 1 0 0
Grand Larceny 17 8 9 0
GLA 0 0 0 0
Total 28 15 12 1
Crimes Per Day 0.90 0.48 0.39 0.03
INDEX CRIME REPORTPer Day AverageDecember 2014
Master Page # 23 of 83 - Metro-North Railroad Committee Meeting 1/20/2015
________________________________________________________________________________

Subject Request for Authorization to Award Various Procurements
Department ·Procurement and Material Management f'..
Department Head Name .~ n ~ Al Muir, Acting Sr. Director ~~ Department Head Signature l
Project Manager Name
Order
2
To M-NComm. Mtl!. MT A Board Mtg.
· Board Action
Date A.tm roval x x
Info Other
D Metro-North Railroad Date January 6, 2015
Vendor Name Various Contract Number Various Contract Manager Name Various Table of Contents Ref#
Internj!i l Approvals Armroval A I A1mroval
X I President x Q V.P. Planning
X Sr. V.P. _)fleratidns /} .IL- Capital Programs _
X V.P. Fin~ll'lce .WlT / s:.K" X ..,,, _t tf.P. General Counsel \QI ~
X V.P. Englmering ( ~
Internal A 11i1l rovals (cont. ) ·-- "-
Order Approval Order Approval Order Approval Order Approval
Safety
Other
PURPOSE: I
To obtain approval of the Board to award various contracts/contract modifications and purchase orders, and to inform the MT A Metro-North Railroad Committee of these procurement actions.
DISCUSSION: MNR proposes to award non-competitive procurements in the following categories:
#of Actions $Amount
Schedules Requiring Two-Thirds Vote (or more, where noted)
Schedules Requiring Majority Vote
SUB TOTAL:
I of2
Master Page # 24 of 83 - Metro-North Railroad Committee Meeting 1/20/2015
________________________________________________________________________________
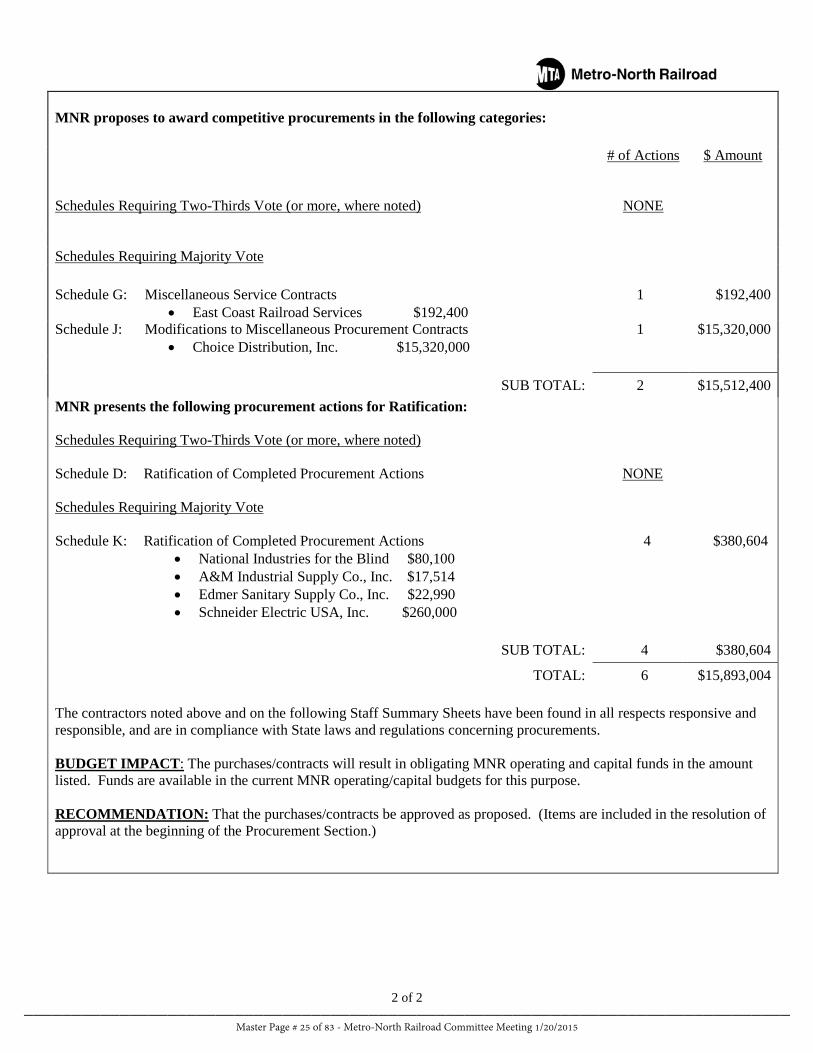
MNR proposes to award competitive procurements in the following categories: Schedules Requiring Two-Thirds Vote (or more, where noted)
# of Actions
NONE
$ Amount
Schedules Requiring Majority Vote Schedule G: Miscellaneous Service Contracts
• East Coast Railroad Services $192,400 1 $192,400
Schedule J: Modifications to Miscellaneous Procurement Contracts • Choice Distribution, Inc. $15,320,000
1 $15,320,000
SUB TOTAL: 2 $15,512,400
MNR presents the following procurement actions for Ratification: Schedules Requiring Two-Thirds Vote (or more, where noted) Schedule D: Ratification of Completed Procurement Actions NONE Schedules Requiring Majority Vote Schedule K: Ratification of Completed Procurement Actions 4 $380,604
• National Industries for the Blind $80,100 • A&M Industrial Supply Co., Inc. $17,514 • Edmer Sanitary Supply Co., Inc. $22,990 • Schneider Electric USA, Inc. $260,000
SUB TOTAL: 4 $380,604
TOTAL: 6 $15,893,004 The contractors noted above and on the following Staff Summary Sheets have been found in all respects responsive and responsible, and are in compliance with State laws and regulations concerning procurements. BUDGET IMPACT: The purchases/contracts will result in obligating MNR operating and capital funds in the amount listed. Funds are available in the current MNR operating/capital budgets for this purpose. RECOMMENDATION: That the purchases/contracts be approved as proposed. (Items are included in the resolution of approval at the beginning of the Procurement Section.)
2 of 2
Master Page # 25 of 83 - Metro-North Railroad Committee Meeting 1/20/2015
________________________________________________________________________________

METROPOLITAN TRANSPORTATION AUTHORITY WHEREAS, in accordance with Section 1265-a and Section 1209 of the Public Authorities law and the All Agency Procurement Guidelines, the Board authorizes the award of certain non-competitive purchase and public work contracts, and the solicitation and award of request for proposals in regard to purchase and public work contracts; and WHEREAS, in accordance with the All Agency Procurement Guidelines, the Board authorizes the award of certain non-competitive miscellaneous procurement contracts, and certain change orders to procurement, public work, and miscellaneous procurement contracts; and WHEREAS, in accordance with Section 2879 of the Public Authorities Law and the All Agency Guidelines for Procurement of Services, the Board authorizes the award of certain service contracts and certain change orders to service contracts. NOW, the Board resolves as follows: 1. As to each purchase and public work contract set forth in the annexed Schedule A, the Board declares competitive bidding to be impractical or inappropriate for the reasons specified therein and authorizes the execution of each such contract. 2. As to each request for proposals (for purchase and public work contracts) set forth in Schedule B for which it is deemed in the public interest to obtain authorization to solicit competitive proposals through a publicly advertised RFP for the reasons specified therein the Board declares it to be impractical or inappropriate to utilize a procurement process inviting sealed bids with award to the lowest responsive/responsible bidder. 3. As to each request for proposals (for purchase and public work contracts) set forth in Schedule C for which a recommendation is made to award the contract, the Board authorizes the execution of said contract. 4. The Board ratifies each action taken set forth in Schedule D for which ratification is requested. 5. The Board authorizes the execution of each of the following for which Board authorization is required: i) the miscellaneous procurement contracts set forth in Schedule E; ii) the personal service contracts set forth in Schedule F; iii) the miscellaneous service contracts set forth in Schedule G; iv) the modifications to personal/miscellaneous service contracts set forth in Schedule H; v) the contract modifications to purchase and public work contracts set forth in Schedule I; and vi) the modifications to miscellaneous procurement contracts set forth in Schedule J. 6. The Board ratifies each action taken set forth in Schedule K for which ratification is requested.
Master Page # 26 of 83 - Metro-North Railroad Committee Meeting 1/20/2015
________________________________________________________________________________

JANUARY 2015
METRO-NORTH RAILROAD
LIST OF COMPETITIVE PROCUREMENTS FOR BOARD APPROVAL
Schedules Requiring Majority Vote:
G. Miscellaneous Service Contracts
(Staff Summaries required for all items greater than: $100K Sole Source; $250K Other Non-Competitive; $1M RFP; No Staff Summary required if Sealed Bid Procurement.)
1. East Coast Railroad Services $192,400 (not-to-exceed) Re-Punching of Tie Plates
Approval is requested to award a competitively solicited (two bids received) three-year miscellaneous service contract to East Coast Railroad Services (ECRS), the lowest, responsive, responsible bidder to provide tie plate re-punching services. The scope of work includes material pick-up, re-punching of round holes over square holes on Pandrol Tie Plates, palletize using steel bands and delivery to specified Metro-North Railroad (MNR) location(s). In accordance with MNR and MTA procurement guidelines, an advertisement for the re-punching of tie plates was placed in the New York Post, the minority publications El Diario and The Daily Challenge, New York State Contract Reporter and posted on the MNR website. The all-inclusive low bid price of $3.70/per re-punched tie plate received from ECRS represents a 1.3% decrease from the prior unit price paid by MNR. By re-punching the tie plates, MNR will be offsetting the need to procure new tie plates over the contract period and will realize cost avoidance. The pricing (per plate) will remain fixed for the entire term of the contract. Therefore based on the above, the pricing offered by East Coast Railroad Services has been deemed fair and reasonable. The total cost of this procurement is not-to-exceed $192,400 and is to be funded by the MNR Operating Budget.
J. Modification to Miscellaneous Procurement Contracts
(Approvals/Staff Summaries required for individual change orders greater than $250K. Approval without Staff Summaries required for change orders greater than 15% of previously approved amount which are also at least $50K)
2. Choice Distribution, Inc. $15,320,000 (not-to-exceed) Staff Summary Attached Hardware Fastener Program
Approval is requested for a contract change for additional funding in the total not-to-exceed amount of $15,320,000 to an existing competitively-awarded miscellaneous purchase agreement with Choice Distribution, Inc. (Choice). Choice is the current All-Agency supplier of hardware and fasteners. The current agreement will expire in May 2016. In April 2011, MNR, on behalf of itself, New York City Transit, Long Island Rail Road, Staten Island Rapid Transit and MTA Bus awarded a competitively solicited, miscellaneous procurement contract for a five year base + two (2) year option period, for the provision and on-going replenishment of common hardware fasteners (nuts, bolts, washers, lock nuts etc.) to Choice. The various hardware fasteners are
Master Page # 27 of 83 - Metro-North Railroad Committee Meeting 1/20/2015
________________________________________________________________________________
required and are integral components throughout the MTA Agencies’ facilities to support maintenance and repair of all types of equipment (rail cars, locomotives, subway cars, buses, maintenance vehicles, communication apparatus, etc.). Choice is required to monitor and maintain on-site minimum/maximum material reorder levels and provide computerized reports detailing usage at each setup location.
Choice has also established and tailored cabinet setups at various locations within each Agency, based on the most frequently used material and on-going operational needs. Prior to award of the contract, each Agency maintained individual contracts for hardware fasteners, and material was delivered and maintained in centralized storeroom locations within each agency. Since the original award in the amount of $40,258,495 in 2011, usage of this contract by the operating agencies has been increasing with the addition of new railroad cars, subway cars and buses, as well as the expansion of rail / subway shops and facilities’ requirements and Choice has been able to meet these additional needs. As each agency has insufficient levels of funding remaining in its original authorization, at this time, on behalf of MNR and the MTA agencies, MNR requests additional funding to continue these services through the contract completion date of May, 2016. The agencies will be evaluating this hardware fastener program and current Vendor market prior to the consideration of the optional two years contained within the original award. The additional funding required by agency is as follows: NYCT Subways $2,300,000, NYCT Bus $5,500,000, MTA Bus $4,300,000, MNR $1,000,000, LIRR $2,200,000 and SIRTOA $20,000. The unit prices which were competitively established in 2011 will remain consistent with the original contract terms and conditions and are deemed fair and reasonable. This procurement is to be funded by each Agency’s respective Operating Budget.
Master Page # 28 of 83 - Metro-North Railroad Committee Meeting 1/20/2015
________________________________________________________________________________
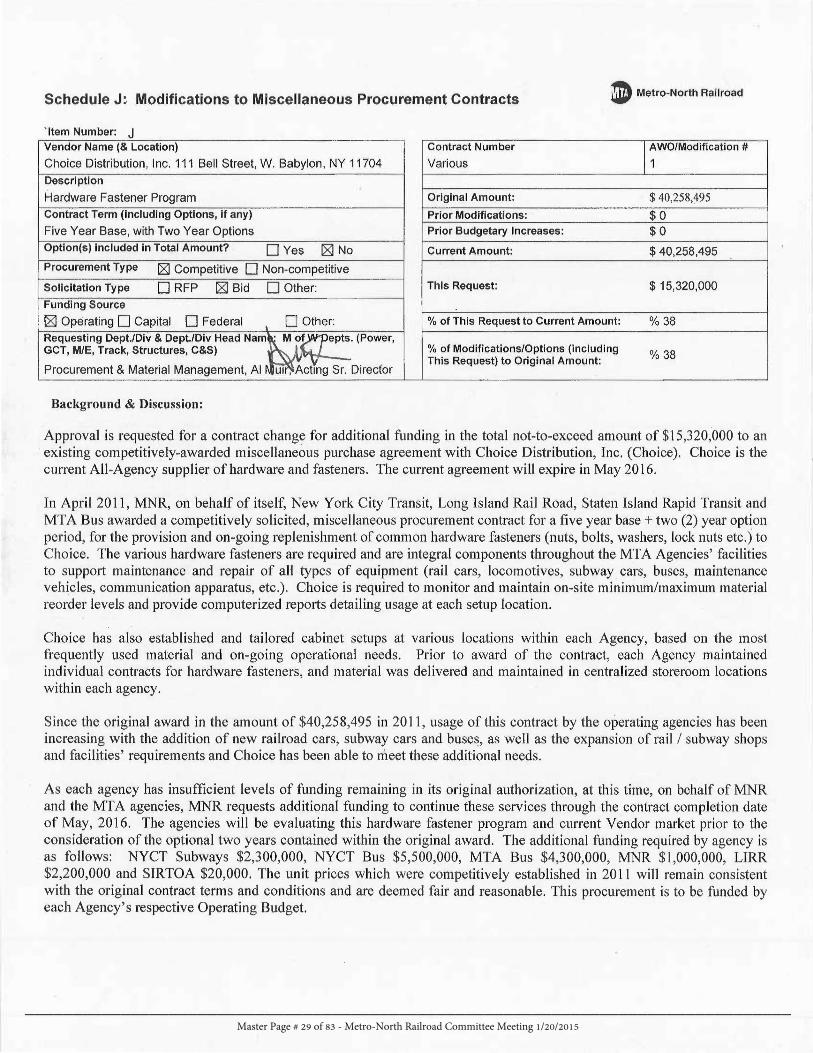
Schedule J~ Modifications to Miscellaneous Procurement Contracts I) Metro-North Rallroad
' Item Number: J Vendor Name (& Location) Contract Number I ~WO/Modification# Choice Distribution, Inc. 111 Bell Street, W . Babylon, NY 11704 Various Description
Hardware Fastener Program Original Amount: $ 40,258,495 Contract Term (including Options, if any) Prior Modifications: $0 Five Year Base, with Two Year Options Prior Budgetary Increases: $0 Option(s) Included in Total Amount? DYes 12$] No Current Amount: $ 40,258,495 Procurement Type 12$] Competitive D Non-competitive
Solicitation Type D RFP 12$] Bid D Other: This Request: $ 15,320,000
Funding Source
12$] Operating D Capital D Federal I
D Other: % of This Request to Current Amount: % 38 Requesting Dept./Div & Dept./Div Head Nam ~~epts. (Power, GCT, M/E, Track, Structures, C&S) % of Modifications/Options (including
%38 Procurement & Material Management, Al ~ ' Ac~ng s~ Director
This Request) to Original Amount:
Background & Discussion:
Approval is requested for a contract change for additional funding in the total not-to-exceed amount of $15,320,000 to an · existing competitively-awarded miscellaneous purchase agreement with Choice Distribution, Inc. (Choice). Choice is the current All-Agency supplier of hardware and fasteners. The current agreement will expire in May 2016.
In April 2011, MNR, on behalf of itself, New York City Transit, Long Island Rail Road, Staten Island Rapid Transit and MT A Bus awarded a competitively solicited, miscellaneous procurement contract for a five year base + two (2) year option period, for the provision and on-going replenishment of common hardware fasteners (nuts, bolts, washers, lock nuts etc.) to Choice. The various hardware fasteners are required and are integral components throughout the MTA Agencies' facilities to support maintenance and repair of all types of equipment (rail cars, locomotives, subway cars, buses, maintenance vehicles, communication apparatus, etc.). Choice is required to monitor and maintain on-site minimum/maximum material reorder levels and provide computerized reports detailing usage at each setup location.
Choice has also established and tailored cabinet setups at various locations within each Agency, based on the most frequently used material and on-going operational needs. Prior to award of the contract, each Agency maintained individual contracts for hardware fasteners, and material was delivered and maintained in centralized storeroom locations within each agency.
Since the original award in the amount of $40,258,495 in 2011, usage of this contract by the operating agencies has been increasing with the addition of new railroad cars, subway cars and buse~, as well as the expansion of rail I subway shops and facilities' requirements and Choice has been able to meet these additional needs.
As each agency has insufficient levels of funding remaining in its original authorization, at this time, on behalf of MNR and the MTA agencies, MNR requests additional funding to continue these services through the contract completion date of May, 2016. The agencies will be evaluating this hardware fastener program and current Vendor market prior to the consideration of the optional two years contained within the original award. The additional funding required by agency is as follows: NYCT Subways $2,300,000, NYCT Bus $5,500,000, MTA Bus $4,300,000, MNR $1,000,000, LIRR $2,200,000 and SIRTOA $20,000. The unit prices which were competitively established in 2011 will remain consistent with the original contract terms and conditions and are deemed fair and reasonable. This procurement is to be funded by each Agency's respective Operating Budget.
Master Page # 29 of 83 - Metro-North Railroad Committee Meeting 1/20/2015
________________________________________________________________________________

JANUARY 2015
METRO-NORTH RAILROAD
LIST OF RATIFICATIONS FOR BOARD APPROVAL
Schedules Requiring Majority Vote: K. Ratification of Completed Procurement Actions
(Staff Summaries required for unusually large or complex items which otherwise would require Board approval)
1. a) National Industries for the Blind $80,100 b) A&M Industrial Supply Co., Inc. $17,514 c) Edmer Sanitary Supply Co., Inc. $22,990
In an effort to proactively address potential health concerns related to the Ebola virus, MNR took immediate action in securing increased inventory quantities to support possible emergency actions. Expedited inventory purchases were conducted for medical waste trash bags, cloth disinfectant, gloves, and instant hand sanitizers for potential increased use throughout MNR’s operating territory. Under the MTA All-Agency Procurement Guidelines, expedited procurement actions were initiated in order to avoid any possible shortfalls of key materials that may have been necessitated by a local outbreak. All reasonable efforts were made to solicit quotes from more than one supplier with expedited delivery dates. Costs were reviewed in accordance with those agreements already in place, where feasible and are deemed fair and reasonable. This procurement is being funded by the MNR Operating Budget.
2. Schneider Electric USA, Inc. $260,000 Maintenance and Support for GCT Power Network and SCADA System
Emergency award for the maintenance and support for GCT power network and SCADA system. Schneider Electric USA Inc. was awarded a contract by the New York Power Authority for the design, fabrication, testing and commissioning of a new Supervisory Control and Data Acquisition (SCADA) system as part of the GCT Power Network. The GCT SCADA system automatically reacts to coordinate emergency power in the event of power loss for any reason and is the power management interface between MNR’s Power Director’s office and GCT’s electrical distribution network. It allows remote access and monitoring of the electrical distribution network serving the 48 acre, multi-level facility. As this recently commissioned system is now in operation, it has become the responsibility of MNR to provide maintenance and support.
The non-competitive procurement was advertised in the New York State Contractor Reporter, New York Post and Daily Challenge without any response received. In preparation for an emergency event, it is imperative that the GCT Power Network be in a ready state. Schneider, having been the firm that developed the SCADA system is the Original Equipment Manufacturer (OEM) and owner of the proprietary software. Schneider is the only qualified provider of these services. This five year service
Master Page # 30 of 83 - Metro-North Railroad Committee Meeting 1/20/2015
________________________________________________________________________________

contract will provide total SCADA support, 24/7 by phone and on-site support. The support will be for emergency response services, maintenance response services, managed support services and software support. It will include capability to troubleshoot system issues, support routine SCADA system maintenance, and inspect and report on the condition of the GCT Power Network. The cost of $260,000 represents $185,000 over a five year period for maintenance and support and a $75,000 allowance for emergency support, if required. A savings over five years of $9,250 or 5% is realized for the multi-year contract. This procurement is being funded by MNR Operating Budget.
Master Page # 31 of 83 - Metro-North Railroad Committee Meeting 1/20/2015
________________________________________________________________________________

Operations Report
January 2015
Master Page # 32 of 83 - Metro-North Railroad Committee Meeting 1/20/2015
________________________________________________________________________________
December 2015
MONTHLY OPERATING REPORT
Thursday, January 08, 2015
Date Issued:
Master Page # 33 of 83 - Metro-North Railroad Committee Meeting 1/20/2015
________________________________________________________________________________
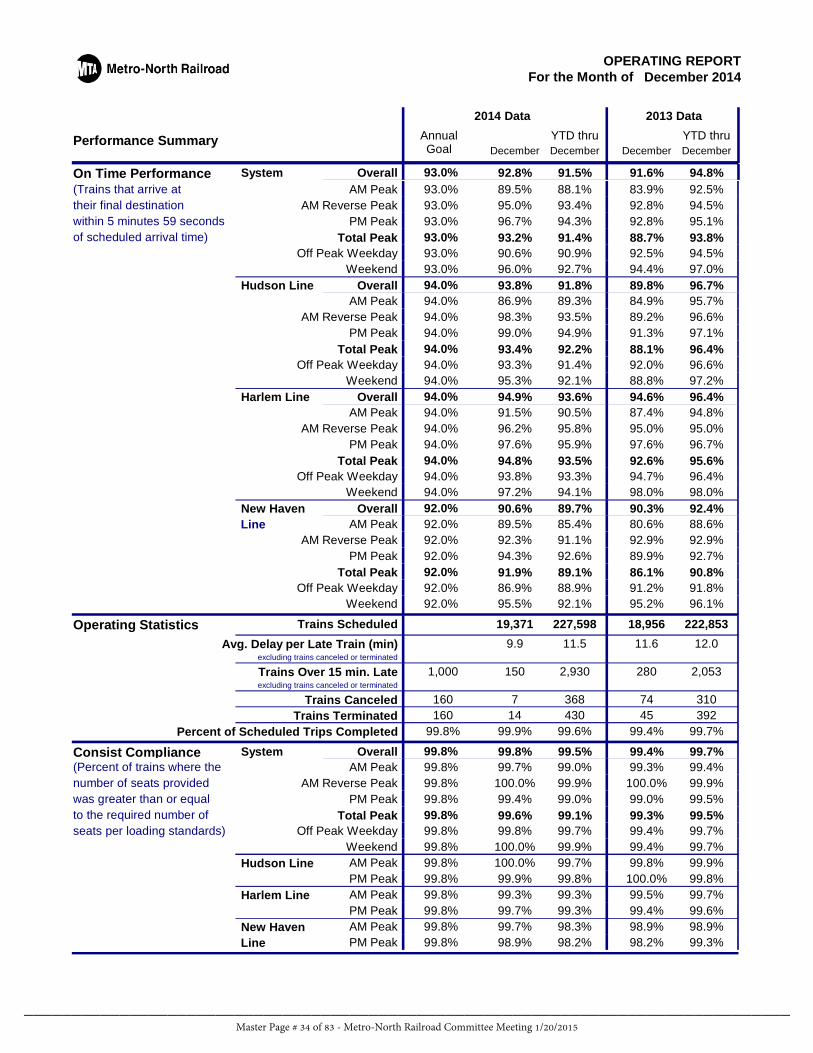
December 2014For the Month ofOPERATING REPORT
Performance Summary
2014 Data 2013 Data
AnnualGoal December DecemberDecember December
YTD thru YTD thru
OverallSystem 94.8%91.6%91.5%92.8%93.0%On Time PerformanceAM Peak 92.5%83.9%88.1%89.5%93.0%(Trains that arrive at
AM Reverse Peak 94.5%92.8%93.4%95.0%93.0%their final destinationPM Peak 95.1%92.8%94.3%96.7%93.0%within 5 minutes 59 seconds
Total Peak 93.8%88.7%91.4%93.2%93.0%of scheduled arrival time)Off Peak Weekday 94.5%92.5%90.9%90.6%93.0%
Weekend 97.0%94.4%92.7%96.0%93.0%OverallHudson Line 96.7%89.8%91.8%93.8%94.0%
AM Peak 95.7%84.9%89.3%86.9%94.0%AM Reverse Peak 96.6%89.2%93.5%98.3%94.0%
PM Peak 97.1%91.3%94.9%99.0%94.0%Total Peak 96.4%88.1%92.2%93.4%94.0%
Off Peak Weekday 96.6%92.0%91.4%93.3%94.0%Weekend 97.2%88.8%92.1%95.3%94.0%
OverallHarlem Line 96.4%94.6%93.6%94.9%94.0%AM Peak 94.8%87.4%90.5%91.5%94.0%
AM Reverse Peak 95.0%95.0%95.8%96.2%94.0%PM Peak 96.7%97.6%95.9%97.6%94.0%
Total Peak 95.6%92.6%93.5%94.8%94.0%Off Peak Weekday 96.4%94.7%93.3%93.8%94.0%
Weekend 98.0%98.0%94.1%97.2%94.0%OverallNew Haven 92.4%90.3%89.7%90.6%92.0%
AM Peak 88.6%80.6%85.4%89.5%92.0%LineAM Reverse Peak 92.9%92.9%91.1%92.3%92.0%
PM Peak 92.7%89.9%92.6%94.3%92.0%Total Peak 90.8%86.1%89.1%91.9%92.0%
Off Peak Weekday 91.8%91.2%88.9%86.9%92.0%Weekend 96.1%95.2%92.1%95.5%92.0%
222,85318,956227,598Operating Statistics 19,371Trains Scheduled
12.011.611.59.9Avg. Delay per Late Train (min)excluding trains canceled or terminated
2,0532802,930150Trains Over 15 min. Lateexcluding trains canceled or terminated
1,000
310743687Trains Canceled 1603924543014Trains Terminated 160
99.7%99.4%99.6%99.9%Percent of Scheduled Trips Completed 99.8%
OverallSystem 99.7%99.4%99.5%99.8%99.8%Consist ComplianceAM Peak 99.4%99.3%99.0%99.7%99.8%(Percent of trains where the
AM Reverse Peak 99.9%100.0%99.9%100.0%99.8%number of seats providedPM Peak 99.5%99.0%99.0%99.4%99.8%was greater than or equal
Total Peak 99.5%99.3%99.1%99.6%99.8%to the required number ofOff Peak Weekday 99.7%99.4%99.7%99.8%99.8%seats per loading standards)
Weekend 99.7%99.4%99.9%100.0%99.8%AM PeakHudson Line 99.9%99.8%99.7%100.0%99.8%PM Peak 99.8%100.0%99.8%99.9%99.8%AM PeakHarlem Line 99.7%99.5%99.3%99.3%99.8%PM Peak 99.6%99.4%99.3%99.7%99.8%AM PeakNew Haven 98.9%98.9%98.3%99.7%99.8%PM Peak 99.3%98.2%98.2%98.9%99.8%Line
Master Page # 34 of 83 - Metro-North Railroad Committee Meeting 1/20/2015
________________________________________________________________________________

OPERATING REPORTFor Month of
Categories of Delay YTD thru YTD thruNovember December December December December
Train Delay Incidents Maintenance of Way 4540 2514 29033 1727 13356
Resulting in Late Capital Projects 10 0 137 6 111
Trains. Maintenance of Equipment 289 229 3087 269 2020
(Each delay incurred by a late Operations Services 57 40 1188 87 395
train is considered a separate Police Incidents 72 94 1043 44 614
train delay incident. Therefore, the Other 10 0 137 6 240
number of train delay incidents is Customers 212 97 1984 158 843
higher than the number of late 3rd Party Operations 10 5 253 4 12
trains for the month.) (Other railroads, marine traffic, etc.)
Weather and Environmental 1105 124 3520 173 1233
2013 Data2014 Data
December 2014
Master Page # 35 of 83 - Metro-North Railroad Committee Meeting 1/20/2015
________________________________________________________________________________

OPERATING REPORTFor The Month of December 2014
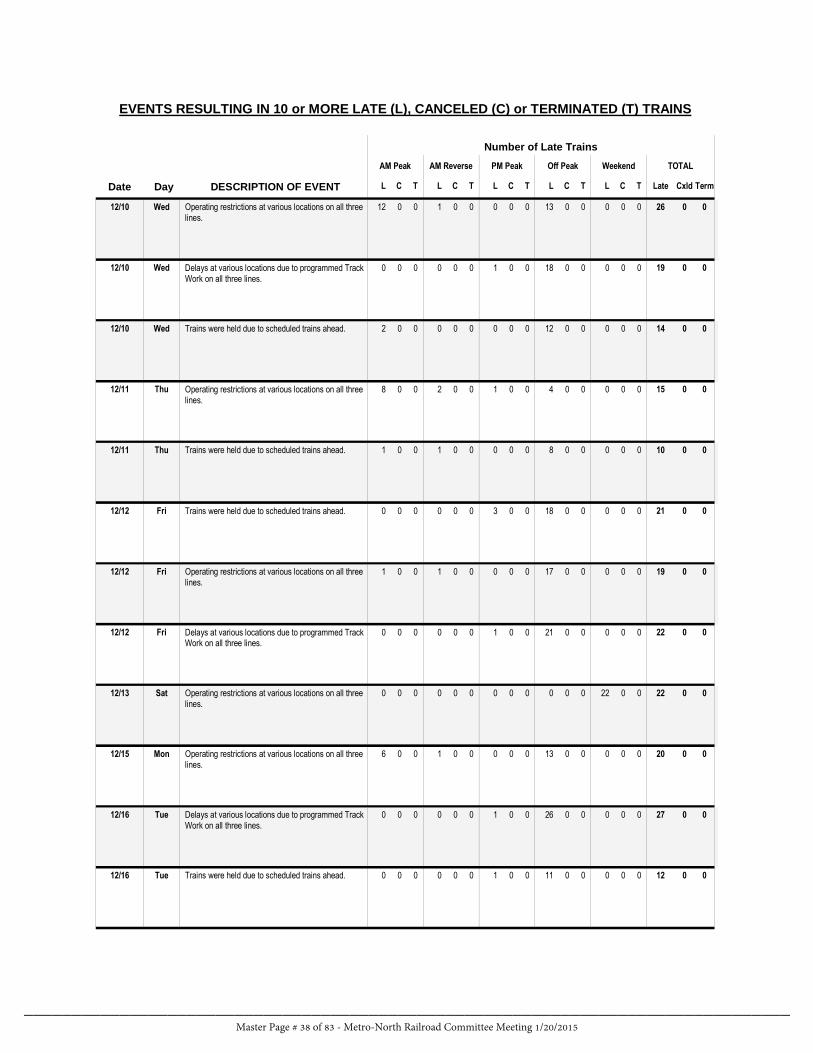
EVENTS RESULTING IN 10 or MORE LATE (L), CANCELED (C) or TERMINATED (T) TRAINS
Date
TOTALWeekend
Late Cxld Term
AM Peak
DESCRIPTION OF EVENT
Off Peak
Number of Late Trains
AM Reverse PM Peak
L C T L C T L C T L C T L C TDay
Mon 00340000032002000000Trains were held due to scheduled trains ahead.12/01
Mon 00280000025002001000Delays at various locations due to programmed Track Work on all three lines.
12/01
Mon 0012000008004000000Speed restriction en-route account LA-1 slippery rail in effect.
12/01
Mon 002600000150010000010Operating restrictions at various locations on all three lines.
12/01
Tue 00330000019002003009Delays at various locations due to programmed Track Work on all three lines.
12/02
Tue 004800000170050050021Operating restrictions at various locations on all three lines.
12/02
Tue 004200000200030010018Speed restriction en-route account slippery rail in effect.
12/02
Tue 00260000024002000000Trains were held due to scheduled trains ahead.12/02
Wed 006800000290030030033Operating restrictions at various locations on all three lines.
12/03
Wed 006300000320050030023Delays at various locations due to programmed Track Work on all three lines.
12/03
Wed 00230000020003000000Trains were held due to scheduled trains ahead.12/03
Master Page # 36 of 83 - Metro-North Railroad Committee Meeting 1/20/2015
________________________________________________________________________________

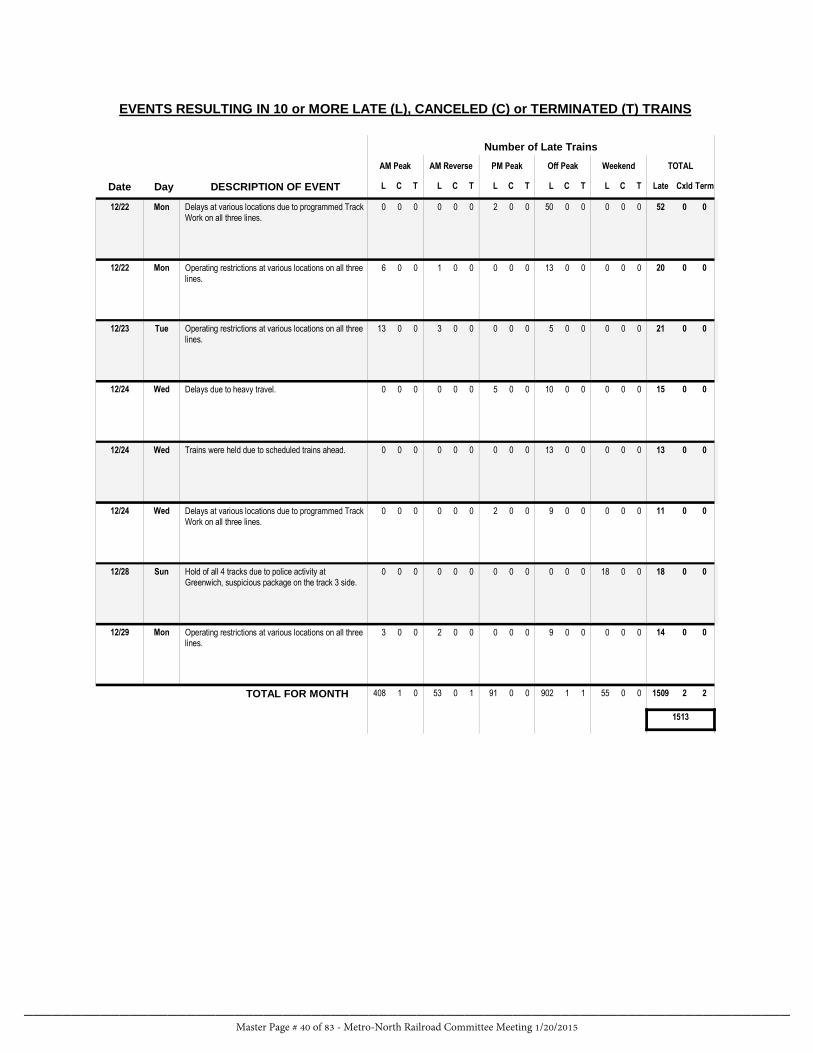
EVENTS RESULTING IN 10 or MORE LATE (L), CANCELED (C) or TERMINATED (T) TRAINS
Date
TOTALWeekend
Late Cxld Term
AM Peak
DESCRIPTION OF EVENT
Off Peak
Number of Late Trains
AM Reverse PM Peak
L C T L C T L C T L C T L C TDay
Thu 003500000180010000016Operating restrictions at various locations on all three lines.
12/04
Thu 005700000240020040027Delays at various locations due to programmed Track Work on all three lines.
12/04
Thu 00210000019000000002Trains were held due to scheduled trains ahead.12/04
Fri 00240000024000000000Trains were held due to scheduled trains ahead.12/05
Fri 005600000210020090024Operating restrictions at various locations on all three lines.
12/05
Fri 00370000026006001004Delays at various locations due to programmed Track Work on all three lines.
12/05
Mon 00190000000000000019Train 618 was disabled on track 2 at Plesantville due to no brake release light.
12/08
Mon 00130000012001000000Trains were held due to scheduled trains ahead.12/08
Mon 01140000010000000113Track circuit down on track 1 in CP19 interlocking.12/08
Mon 00170000016001000000Delays at various locations due to programmed Track Work on all three lines.
12/08
Mon 003900000120000010026Operating restrictions at various locations on all three lines.
12/08
Tue 00370000060000040027Operating restrictions at various locations on all three lines.
12/09
Master Page # 37 of 83 - Metro-North Railroad Committee Meeting 1/20/2015
________________________________________________________________________________
EVENTS RESULTING IN 10 or MORE LATE (L), CANCELED (C) or TERMINATED (T) TRAINS
Date
TOTALWeekend
Late Cxld Term
AM Peak
DESCRIPTION OF EVENT
Off Peak
Number of Late Trains
AM Reverse PM Peak
L C T L C T L C T L C T L C TDay
Wed 002600000130000010012Operating restrictions at various locations on all three lines.
12/10
Wed 00190000018001000000Delays at various locations due to programmed Track Work on all three lines.
12/10
Wed 00140000012000000002Trains were held due to scheduled trains ahead.12/10
Thu 0015000004001002008Operating restrictions at various locations on all three lines.
12/11
Thu 0010000008000001001Trains were held due to scheduled trains ahead.12/11
Fri 00210000018003000000Trains were held due to scheduled trains ahead.12/12
Fri 00190000017000001001Operating restrictions at various locations on all three lines.
12/12
Fri 00220000021001000000Delays at various locations due to programmed Track Work on all three lines.
12/12
Sat 00220022000000000000Operating restrictions at various locations on all three lines.
12/13
Mon 00200000013000001006Operating restrictions at various locations on all three lines.
12/15
Tue 00270000026001000000Delays at various locations due to programmed Track Work on all three lines.
12/16
Tue 00120000011001000000Trains were held due to scheduled trains ahead.12/16
Master Page # 38 of 83 - Metro-North Railroad Committee Meeting 1/20/2015
________________________________________________________________________________

EVENTS RESULTING IN 10 or MORE LATE (L), CANCELED (C) or TERMINATED (T) TRAINS
Date
TOTALWeekend
Late Cxld Term
AM Peak
DESCRIPTION OF EVENT
Off Peak
Number of Late Trains
AM Reverse PM Peak
L C T L C T L C T L C T L C TDay
Tue 00210000016000000005Operating restrictions at various locations on all three lines.
12/16
Wed 004800000370000010010Operating restrictions at various locations on all three lines.
12/17
Wed 00160000016000000000Delays at various locations due to programmed Track Work on all three lines.
12/17
Wed 11180001118000000000Congestion and delays from GCT to CP10 due to a Stop Signal Violation at ON3 signal by Eng. 104.
12/17
Thu 0010000006000000004Trains were held due to scheduled trains ahead.12/18
Thu 00350000031003000001Operating restrictions at various locations on all three lines.
12/18
Fri 0098000005200220010023Congestion due to broken rail on Track J.12/19
Fri 003400000110010000022Operating restrictions at various locations on all three lines.
12/19
Fri 0016000005001001009Congestion from CP5 to CP1 due to insulated joints on track 1 out of service and from CP112 to CP106 due to 4A track circuit down on track 4 at CP112.
12/19
Sat 00150015000000000000Delays at various locations due to programmed Track Work on all three lines.
12/20
Mon 00210000018002000001Trains were held due to scheduled trains ahead.12/22
Mon 1014000002000103009The 31 Switch was stuck on center at CP 248, necessary to single track on track 2 between CP 248 and CP 241.
12/22
Master Page # 39 of 83 - Metro-North Railroad Committee Meeting 1/20/2015
________________________________________________________________________________
EVENTS RESULTING IN 10 or MORE LATE (L), CANCELED (C) or TERMINATED (T) TRAINS
Date
TOTALWeekend
Late Cxld Term
AM Peak
DESCRIPTION OF EVENT
Off Peak
Number of Late Trains
AM Reverse PM Peak
L C T L C T L C T L C T L C TDay
Mon 00520000050002000000Delays at various locations due to programmed Track Work on all three lines.
12/22
Mon 00200000013000001006Operating restrictions at various locations on all three lines.
12/22
Tue 00210000050000030013Operating restrictions at various locations on all three lines.
12/23
Wed 00150000010005000000Delays due to heavy travel.12/24
Wed 00130000013000000000Trains were held due to scheduled trains ahead.12/24
Wed 0011000009002000000Delays at various locations due to programmed Track Work on all three lines.
12/24
Sun 00180018000000000000Hold of all 4 tracks due to police activity at Greenwich, suspicious package on the track 3 side.
12/28
Mon 0014000009000002003Operating restrictions at various locations on all three lines.
12/29
408 1 0 53 0 1 91 0 0 902 1 1 55 0 0 21509 2TOTAL FOR MONTH
1513
Master Page # 40 of 83 - Metro-North Railroad Committee Meeting 1/20/2015
________________________________________________________________________________

Nov YTD 12 month Nov YTDEquip- Total MDBF Nov Primary No. of MDBF thru MDBF Nov No. of MDBF thrument Fleet Goal MDBF Failure Primary Nov Rolling Avg MDBF Primary NovType Size (miles) (miles) Goal Failures (miles) (miles) (miles) Failures (miles)
Mean M246 91 60,000 42,263 7 6 33,180 30,948 75,654 9 65,547Distance M8 376 280,000 181,935 9 13 212,443 209,241 253,542 7 222,667Between M3 140 135,000 58,099 2 5 152,334 153,994 309,075 1 236,685Failures M7 336 460,000 240,015 4 8 373,595 369,281 387,073 5 668,616
Coach 213 295,000 343,525 5 4 255,962 249,874 348,595 4 346,609P-32 31 35,000 45,354 5 4 24,447 24,318 32,108 6 30,748
BL-20 12 12,000 18,166 3 2 17,878 17,953 13,060 2 12,656Fleet 1199 160,000 152,886 35 42 145,690 139,910 185,684 34 166,116
140,000 137,828 16 19 115,917 108,064 153,480 16 114,099320,000 170,047 6 13 309,616 307,771 374,073 6 530,765120,000 159,185 13 10 107,798 106,548 134,429 12 130,011
Mean Distance Between Failures (MDBF) is the average number of miles a railcar or locomotive travels in revenue servicebefore breaking down and causing a delay. The higher the MDBF, the more reliable the equipment and the service.
Diesel/Coach
2014 Data 2013 Data
M3/7M2/4/6/8
0
50000
100000
150000
200000
250000
300000
350000
400000
ALL FLEETSMean Distance Between Failures
2009 ‐ 2014
MDBF Monthly MDBF Target 12 Month MDBF
Master Page # 41 of 83 - Metro-North Railroad Committee Meeting 1/20/2015
________________________________________________________________________________

December 2014For the Month ofOPERATING REPORT
Performance Summary
2014 Data 2013 Data
AnnualGoal December DecemberDecember December
YTD thru YTD thruWest of Hudson
Overall 96.5%92.0%95.4%95.6%97.0%On Time Performance West of
PM Peak 96.6%93.0%94.5%92.0%96.3%their final destinationTotal Peak 97.0%92.6%95.0%95.1%within 5 minutes 59 seconds
Off Peak Weekday 96.1%90.4%95.5%95.1%97.1%of scheduled arrival time)Weekend 96.8%94.2%95.7%97.7%97.3%
OverallPascack Line 97.3%94.3%95.9%95.7%97.6%AM Peak 98.6%97.6%96.3%99.4%97.8%Valley LinePM Peak 97.3%95.9%94.5%89.6%97.3%
Total Peak 98.0%96.8%95.5%94.8%Off Peak Weekday 96.8%92.9%95.8%94.6%97.5%
Weekend 97.1%93.8%96.8%99.5%97.8%
AM Peak 97.4%92.2%95.4%98.1%97.1%(Trains that arrive at Hudson Total
OverallPort Jervis 95.6%88.5%94.6%95.4%96.2%AM Peak 95.8%84.9%94.3%96.2%96.2%LinePM Peak 95.7%89.6%94.4%94.7%95.2%
Total Peak 95.7%87.3%94.3%95.5%Off Peak Weekday 95.0%86.4%95.2%95.8%96.5%
Weekend 96.4%95.0%93.9%94.4%96.5%
19,5391,70320,139Operating Statistics 1,728Trains Scheduled
21.919.119.417.7Avg. Delay per Late Train (min)excluding trains canceled or terminated
2724636724Trains Over 15 min. Lateexcluding trains canceled or terminated
80
406807Trains Canceled6725546Trains Terminated
99.5%98.2%99.3%99.2%Percent of Scheduled Trips Completed 99.8%
Master Page # 42 of 83 - Metro-North Railroad Committee Meeting 1/20/2015
________________________________________________________________________________

DECEMBER 2014 STANDEE REPORTEast of Hudson DEC YTD DEC YTD
2013 2013 2014 2014
Daily Average Hudson Line Program Standees 0 0 0 0
AM Peak Add'l Standees 0 0 0 1Total Standees 0 0 0 1
Harlem Line Program Standees 0 0 0 0Add'l Standees 0 1 19 11
Total Standees 0 1 19 11New Haven Program Standees 0 0 0 0
Line Add'l Standees 42 24 2 46 Total Standees 42 24 2 46
EAST OF HUDSON TOTAL - AM PEAK 42 25 21 58Daily Average Hudson Line Program Standees 0 0 0 0
PM Peak Add'l Standees 0 3 2 2Total Standees 0 3 2 2
Harlem Line Program Standees 0 0 0 0Add'l Standees 4 4 7 6
Total Standees 4 4 7 6New Haven Program Standees 0 0 0 0
Line Add'l Standees 33 20 45 41 Total Standees 33 20 45 41
EAST OF HUDSON TOTAL - PM PEAK 37 27 54 49
West of Hudson DEC YTD DEC YTD2013 2013 2014 2014
Daily Average Port Jervis Program Standees 0 0 0 0
AM Peak Line Add'l Standees 0 0 0 0Total Standees 0 0 0 0
Pascack Program Standees 0 0 0 0Valley Line Add'l Standees 0 0 0 0
Total Standees 0 0 0 0WEST OF HUDSON TOTAL - AM PEAK 0 0 0 0
Daily Average Port Jervis Program Standees 0 0 0 0
PM Peak Line Add'l Standees 0 0 0 0Total Standees 0 0 0 0
Pascack Program Standees 0 0 0 0Valley Line Add'l Standees 0 0 0 0
Total Standees 0 0 0 0WEST OF HUDSON TOTAL - PM PEAK 0 0 0 0
Definitions
Weekday standees are calculated based on the most recent average weekday customer counts for the train's maximum load point. For Hudson, Harlem and most New Haven Line trains, this point occurs at GCT/125th St.. However, for certain New Haven Line trains, this maximum load point is east of Stamford.
"Program Standees" is the average number of customers in excess of programmed seating capacity. "Additional Standees" reflect the impact of reduced train car consists (as reported in the weekday equipment reports).
Notes: These statistics do not include the effects of daily ridership variation or uneven distribution of customers within trains. Annulled or terminated trains are not included in this report.Holidays and Special Events for which there are special equipment programs are not included.
The 2013 Year to Date averages for the New Haven Line do not include standees resulting from the Con Ed power failurebetween Sept. 25 and Oct. 4. If these standees are included, year to date New Haven Line standees are 66 for the AM Peak and 57 for the PM Peak.
Operations Planning and Analysis/pbb
Master Page # 43 of 83 - Metro-North Railroad Committee Meeting 1/20/2015
________________________________________________________________________________

Financial Report
January 2015
Master Page # 44 of 83 - Metro-North Railroad Committee Meeting 1/20/2015
________________________________________________________________________________

FINANCIAL STATEMENTS
MONTH ENDED: NOVEMBER 2014
OFFICE OF VICE PRESIDENT OF FINANCE & INFORMATION SYSTEMS
Master Page # 45 of 83 - Metro-North Railroad Committee Meeting 1/20/2015
________________________________________________________________________________

MTA METRO-NORTH RAILROAD NOVEMBER 2014 FINANCIAL AND RIDERSHIP REPORT
EXECUTIVE SUMMARY
November YTD financial results were 6.1% better than plan with a net operating deficit that was $48.3 million lower than the Mid-Year Forecast. Operating Revenues were $3.1 million higher than Forecast reflecting better than expected growth in non-commutation ridership and higher net GCT retail revenue. Operating expenses were $45.2 million or 3.2% lower than projected due to lower expenditures for contracted services, energy and material, as well as revised pension costs related to the estimated wage settlement accrual (which will be further adjusted pending year-end Actuarial Valuation report). These decreases were partially offset by West of Hudson employee claims payments and higher year-to-date overtime costs.
Reimbursable Capital program expenditures (and reimbursements) were $26.1 million lower than Forecast due to revised timing of several budgeted projects (Hurricane Sandy Infrastructure, Technology relocation, Positive Train Control, and Overhead Bridge support work) partially offset by higher wage settlement accruals vs. forecast. Ridership Total ridership was 6.7 million for November, and 77.2 million YTD which was 0.6% above the Mid-Year Forecast, reflecting higher non-commutation ridership.
East of Hudson
• YTD Ridership of 75.6 million was 0.6% higher than the Mid-Year Forecast and 1.2% above 2013 actuals results.
• November ridership of 6.6 million was 1.4% below the Mid-Year Forecast.
• YTD Commutation ridership was 0.3% above the Mid-Year Forecast and 0.4% lower for the month. November YTD commutation was 0.3% higher than 2013.
• YTD Non-commutation ridership was 1.0% higher than the Mid-Year Forecast and 2.6% lower for the month. Compared to 2013 YTD non-commutation was 2.5% higher.
West of Hudson
• YTD Ridership was higher than the Mid-Year Forecast by 1.4%. November ridership was 2.9% higher than the Mid-Year Forecast.
Revenue and Reimbursements Total YTD Revenue and Reimbursements through November was $818.3 million, or 2.7% lower than the Mid-Year Forecast:
• Fare Box Revenue of $592.6 million was $1.8 million higher than the Mid-Year Forecast due to the higher non-commutation ridership noted above.
• Other Operating Revenue of $50.7 million was $1.3 million higher than the Mid-Year Forecast due to higher GCT net retail revenue.
• Capital and Other Reimbursements of $175.0 million was $26.1 million lower than the Mid-Year Forecast due to project timing previously discussed.
Expenses Total YTD non-reimbursable and reimbursable expenses of $1,559.6 million through November were $71.3 million (4.4%) lower than the Mid-Year Forecast:
• $57.7 million was attributable to lower non-labor costs. These were primarily driven by timing differences in capital project activity, lower material usage, and contractual services expenditures, in addition to lower energy cost.
• Total Labor costs (operating and capital) were $15.8 million lower than the Mid-Year Forecast primarily due to a lower pension actuarial estimate than forecasted, lower employee claims, and vacancies, offset by higher overtime costs.
Financial Performance Measures The YTD performance indicators reflect lower overall expenses and higher non-commutation ridership:
• Adjusted Farebox Operating Ratio of 61.1% through November was 3.4% higher than the Mid-Year Forecast (68.0% excluding retroactive wage settlement accruals).
• Adjusted Cost per Passenger of $14.31 for the period was $0.86 lower than the Mid-Year Forecast (would be $12.86 excluding retroactive wage settlement accruals).
• Revenue per Passenger of $7.92 for the period was slightly lower than the Mid-Year Forecast.
Master Page # 46 of 83 - Metro-North Railroad Committee Meeting 1/20/2015
________________________________________________________________________________

MTA METRO-NORTH RAILROAD NOVEMBER 2014 FINANCIAL REPORT
YEAR-TO-DATE ACTUAL VERSUS MID-YEAR FORECAST REVENUE Total Revenue and reimbursements were $23.0 million (2.7%) lower than the Mid-Year Forecast through November:
� Farebox Revenue – year-to-date was higher than the Mid-Year Forecast by $1.8 million due to higher non-commutation ridership. For the month, Farebox revenue was $1.3 million lower than the Mid-Year Forecast.
� Other Operating Revenue – year-to-date and the month were higher than the Mid-Year Forecast by $1.3 million and $0.6 million, respectively, primarily due to higher GCT net retail revenue.
� Capital and Other Reimbursements – year-to-date was lower by $26.1 million due to timing differences/rescheduling of capital projects (Hurricane Sandy Infrastructure, Technology relocation, Positive Train Control, Cyclical Track Program and Overhead Bridge support work), partially offset by timing differences in recording retroactive wage adjustment (RWA) accruals. For the month, reimbursements were $1.8 million below the Mid-Year Forecast.
EXPENSES Total Expenses – Year-to-date expenses of $1,559.6 million were $71.3 million (4.4%) lower than the Mid-Year Forecast. For the month, expenses were $14.1 million (10.1%) lower than the Mid-Year Forecast.
� Labor expenses (including fringes and overhead recoveries) were $927.7 million YTD. This was $15.8 million below the Mid-Year Forecast primarily due to a lower than forecasted increase in the Annual Required Contribution (ARC) for Pensions (pension cost may differ based upon the pending year-end Actuarial Valuation report), lower employee claims expenses and vacancies. Higher overtime costs ($5.9 million) offset these favorable results due to higher reimbursable retroactive wage settlements estimates ($2.7 million), accelerated repair and coverage for fire-damaged Cos Cob signal house (completed in September), comprehensive track program work and holiday and vacation coverage of must-fill positions.
� Non–Labor Expenses YTD non-labor expenses were $358.6 million, $57.7 million lower than Mid-Year Forecast and $9.5 million lower for the month. � Electric Power – $8.8 million lower year-to-date than the Mid-Year Forecast primarily due to
lower than projected usage across all lines. For the month, expenses were $1.9 million lower than the Mid-Year Forecast.
� Fuel – year-to-date was $0.2 million unfavorable due to higher pricing primarily on the New Haven Line. For the month, expenses were $0.3 million lower than the Mid-Year Forecast.
� Claims – $3.4 million higher year-to-date mainly due to settlement of NJT employee injury claims on West of Hudson service. For the month, expenses were $0.2 million lower than the Mid-Year Forecast.
� Maintenance & Other Operating Contracts – year-to-date was $12.0 million below the Mid-Year Forecast primarily due to lower expenditures for utilities and service contract costs, timing differences in payments for locomotive overhauls as well as scheduling changes in reimbursable project activity (West of Hudson Signal Improvement and Overhead Bridge work). For the month, expenses were $1.2 million lower than the Mid-Year Forecast.
� Professional Services – YTD was $14.4 million below the Mid-Year Forecast primarily due to timing differences in expenditures for IT services, outside training, legal fees, a market share study as well as reimbursable project activity. For the month, expenses were favorable by $3.6 million compared to the Mid-Year Forecast.
� Materials & Supplies – year-to-date and month expenditures were $25.1 million and $1.9 million below the Mid-Year Forecast, respectively, primarily due to timing differences in reimbursable project activity (Hurricane Sandy work, Technology relocation, PTC and Track Program projects) lower rolling stock material usage and inventory accounting adjustments.
� Other Business Expenses –YTD was slightly higher than the Mid-Year Forecast due to higher than budgeted material purchases for reimbursable capital projects partially offset by lower NJT subsidy payments. For the month, expenses were $0.5 million lower than the Mid-Year Forecast.
� Depreciation and Other Non-Cash Liability Adjustments – $2.2 million higher than the Mid-Year Forecast primarily due to fixed asset write-offs.
Master Page # 47 of 83 - Metro-North Railroad Committee Meeting 1/20/2015
________________________________________________________________________________

CASH DEFICIT The Cash Deficit through November of $399 million was $28.2 million favorable to the Mid-Year Forecast mainly due to the overall lower expenses partly offset by lower capital reimbursements (timing).
Master Page # 48 of 83 - Metro-North Railroad Committee Meeting 1/20/2015
________________________________________________________________________________

Mid-Year
Forecast Actual Variance Percent
Mid-Year
Forecast Actual Variance Percent
Mid-Year
Forecast Actual Variance Percent
Revenue
Farebox Revenue $56.225 $54.898 ($1.327) (2.4) $0.000 $0.000 $0.000 - $56.225 $54.898 ($1.327) (2.4)
Vehicle Toll Revenue 0.000 0.000 0.000 - 0.000 0.000 0.000 - 0.000 0.000 0.000 -
Other Operating Revenue 5.473 6.045 0.572 10.5 0.000 0.000 0.000 - 5.473 6.045 0.572 10.5Capital & Other Reimbursements:
MTA 0.000 0.000 0.000 - 9.463 9.479 0.016 0.2 9.463 9.479 0.016 0.2
CDOT 0.000 0.000 0.000 - 8.172 6.051 (2.121) (26.0) 8.172 6.051 (2.121) (26.0)
Other 0.000 0.000 0.000 - 1.747 2.035 0.288 16.5 1.747 2.035 0.288 16.5
Total Capital and Other Reimbursements 0.000 0.000 0.000 - 19.383 17.565 (1.817) (9.4) 19.383 17.565 (1.817) (9.4)
Total Revenue/Receipts $61.698 $60.943 ($0.755) (1.2) $19.383 $17.565 ($1.817) (9.4) $81.080 $78.508 ($2.572) (3.2)
Expenses
Labor:
Payroll $36.516 $34.330 $2.187 6.0 $3.471 $3.250 $0.220 6.4 $39.987 $37.580 $2.407 6.0
Overtime 6.021 6.396 (0.375) (6.2) 1.449 1.611 (0.162) (11.2) 7.470 8.007 (0.537) (7.2)
Health and Welfare 7.827 7.231 0.597 7.6 1.230 1.058 0.172 14.0 9.057 8.289 0.768 8.5
OPEB Current Payment 1.977 2.058 (0.080) (4.1) 0.000 0.000 0.000 - 1.977 2.058 (0.080) (4.1)
Pensions 7.086 6.064 1.022 14.4 0.807 0.676 0.130 16.2 7.893 6.740 1.153 14.6
Other Fringe Benefits 8.571 8.042 0.529 6.2 0.921 0.801 0.121 13.1 9.492 8.843 0.649 6.8
Reimbursable Overhead (3.521) (3.972) 0.452 12.8 3.388 3.885 (0.497) (14.7) (0.133) (0.088) (0.045) (34.1)
Total Labor $64.478 $60.148 $4.330 6.7 $11.266 $11.282 ($0.016) (0.1) $75.744 $71.429 $4.315 5.7
Non-Labor:
Electric Power $7.013 $5.156 $1.857 26.5 $0.000 $0.004 ($0.004) - $7.013 $5.160 $1.853 26.4
Fuel 2.368 2.109 0.260 11.0 0.000 0.000 0.000 - 2.368 2.109 0.260 11.0
Insurance 1.584 1.620 (0.036) (2.3) 0.355 0.313 0.042 11.9 1.939 1.933 0.006 0.3
Claims 0.122 (0.087) 0.210 * 0.000 0.000 0.000 - 0.122 (0.087) 0.210 *
Paratransit Service Contracts 0.000 0.000 0.000 - 0.000 0.000 0.000 - 0.000 0.000 0.000 -
Maintenance and Other Operating Contracts 8.799 5.207 3.591 40.8 1.286 3.719 (2.433) * 10.085 8.926 1.159 11.5
Professional Service Contracts 2.962 2.010 0.953 32.2 3.234 0.575 2.659 82.2 6.196 2.584 3.612 58.3
Materials & Supplies 6.233 6.381 (0.148) (2.4) 3.198 1.129 2.070 64.7 9.432 7.510 1.922 20.4
Other Business Expenses 2.219 1.206 1.013 45.7 0.043 0.545 (0.502) * 2.262 1.751 0.511 22.6
Total Non-Labor $31.301 $23.601 $7.699 24.6 $8.117 $6.284 $1.833 22.6 $39.418 $29.885 $9.532 24.2
Other Adjustments:
Other 0.000 0.000 0.000 - 0.000 0.000 0.000 - 0.000 0.000 0.000 -
Total Other Adjustments $0.000 $0.000 $0.000 - $0.000 $0.000 $0.000 - $0.000 $0.000 $0.000 -
Total Expenses before Non-Cash Liability Adjs. $95.779 $83.749 $12.030 12.6 $19.383 $17.565 $1.817 9.4 $115.161 $101.314 $13.847 12.0
Depreciation 19.044 18.753 0.291 1.5 0.000 0.000 0.000 - 19.044 18.753 0.291 1.5
OPEB Obligation 5.425 5.425 0.000 0.0 0.000 0.000 0.000 - 5.425 5.425 0.000 0.0
Environmental Remediation 0.000 0.000 0.000 - 0.000 0.000 0.000 - 0.000 0.000 0.000 -
Total Expenses $120.247 $107.927 $12.320 10.2 $19.383 $17.565 $1.817 9.4 $139.630 $125.492 $14.138 10.1
Net Surplus/(Deficit) ($58.550) ($46.984) $11.566 19.8 $0.000 $0.000 $0.000 - ($58.550) ($46.984) $11.566 19.8
Cash Conversion Adjustments:
Depreciation 19.044 18.753 (0.291) (1.5) 0.000 0.000 0.000 - 19.044 18.753 (0.291) (1.5)
Operating/Capital (3.806) (0.854) 2.952 77.6 0.000 0.000 0.000 - (3.806) (0.854) 2.952 77.6
Other Cash Adjustments 20.489 (0.318) (20.807) * 0.000 0.000 0.000 - 20.489 (0.318) (20.807) *
Total Cash Conversion Adjustments $35.727 $17.581 ($18.146) (50.8) $0.000 $0.000 $0.000 - $35.727 $17.581 ($18.146) (50.8)
Net Cash Surplus/(Deficit) ($22.822) ($29.403) ($6.581) (28.8) $0.000 $0.000 $0.000 - ($22.822) ($29.403) ($6.581) (28.8)
-- Results are preliminary and subject to audit review.
-- Differences are due to rounding.
* Variance exceeds 100%.
SCHEDULE I - A
ACCRUAL STATEMENT of OPERATIONS by CATEGORY
MTA METRO-NORTH RAILROAD
JULY FINANCIAL PLAN - 2014 MID-YEAR FORECAST
November 2014
($ in millions)
Favorable
(Unfavorable)
TotalNonreimbursable
Favorable
(Unfavorable)
Reimbursable
Favorable
(Unfavorable)
Master Page # 49 of 83 - M
etro-North Railroad C
omm
ittee Meeting 1/20/2015
________________________________________________________________________________

Mid-Year
Forecast Actual Variance Percent
Mid-Year
Forecast Actual Variance Percent
Mid-Year
Forecast Actual Variance Percent
Revenue
Farebox Revenue $590.762 $592.572 $1.810 0.3 $0.000 $0.000 $0.000 - $590.762 $592.572 $1.810 0.3
Vehicle Toll Revenue 0.000 0.000 0.000 - 0.000 0.000 0.000 - 0.000 0.000 0.000 -
Other Operating Revenue 49.443 50.702 1.258 2.5 0.000 0.000 0.000 - 49.443 50.702 1.258 2.5Capital & Other Reimbursements:
MTA 0.000 0.000 0.000 - 113.649 86.813 (26.837) (23.6) 113.649 86.813 (26.837) (23.6)
CDOT 0.000 0.000 0.000 - 68.841 71.873 3.032 4.4 68.841 71.873 3.032 4.4
Other 0.000 0.000 0.000 - 18.625 16.325 (2.300) (12.3) 18.625 16.325 (2.300) (12.3)
Total Capital and Other Reimbursements 0.000 0.000 0.000 - 201.116 175.011 (26.105) (13.0) 201.116 175.011 (26.105) (13.0)
Total Revenue/Receipts $640.205 $643.273 $3.068 0.5 $201.116 $175.011 ($26.105) (13.0) $841.321 $818.284 ($23.037) (2.7)
Expenses
Labor:
Payroll $471.385 $469.424 $1.961 0.4 $41.502 $40.182 $1.320 3.2 $512.887 $509.606 $3.281 0.6
Overtime 85.625 89.165 (3.540) (4.1) 17.201 19.565 (2.364) (13.7) 102.826 108.730 (5.904) (5.7)
Health and Welfare 90.598 88.681 1.917 2.1 12.361 11.162 1.199 9.7 102.959 99.843 3.116 3.0
OPEB Current Payment 21.689 22.066 (0.378) (1.7) 0.000 0.000 0.000 - 21.689 22.066 (0.378) (1.7)
Pensions 85.600 76.507 9.093 10.6 8.483 7.579 0.904 10.7 94.083 84.086 9.997 10.6
Other Fringe Benefits 100.800 95.568 5.231 5.2 9.447 9.526 (0.079) (0.8) 110.247 105.095 5.152 4.7
Reimbursable Overhead (40.064) (45.298) 5.234 13.1 38.825 43.555 (4.731) (12.2) (1.240) (1.743) 0.503 40.6
Total Labor $815.632 $796.114 $19.518 2.4 $127.818 $131.569 ($3.751) (2.9) $943.450 $927.683 $15.767 1.7
Non-Labor:
Electric Power $82.683 $73.878 $8.806 10.6 $0.000 $0.052 ($0.052) - $82.683 $73.930 $8.754 10.6
Fuel 25.495 25.684 (0.189) (0.7) 0.000 0.000 0.000 - 25.495 25.684 (0.189) (0.7)
Insurance 16.583 15.712 0.871 5.3 3.302 3.109 0.192 5.8 19.885 18.821 1.064 5.3
Claims 1.876 5.264 (3.388) * 0.000 0.000 0.000 - 1.876 5.264 (3.388) *
Paratransit Service Contracts 0.000 0.000 0.000 - 0.000 0.000 0.000 - 0.000 0.000 0.000 -
Maintenance and Other Operating Contracts 96.112 87.953 8.159 8.5 15.791 11.905 3.886 24.6 111.903 99.858 12.046 10.8
Professional Service Contracts 28.444 19.170 9.275 32.6 17.986 12.865 5.121 28.5 46.430 32.035 14.395 31.0
Materials & Supplies 68.429 65.232 3.197 4.7 34.102 12.220 21.883 64.2 102.532 77.452 25.080 24.5
Other Business Expenses 23.423 22.284 1.140 4.9 2.117 3.292 (1.175) (55.5) 25.540 25.575 (0.035) (0.1)
Total Non-Labor $343.047 $315.176 $27.870 8.1 $73.298 $43.442 $29.856 40.7 $416.345 $358.619 $57.726 13.9
Other Adjustments
Other 0.000 0.000 0.000 - 0.000 0.000 0.000 - 0.000 0.000 0.000 -
Total Other Adjustments $0.000 $0.000 $0.000 - $0.000 $0.000 $0.000 - $0.000 $0.000 $0.000 -
Total Expenses before Non-Cash Liability Adjs. $1,158.679 $1,111.290 $47.389 4.1 $201.116 $175.011 $26.105 13.0 $1,359.795 $1,286.301 $73.493 5.4
Depreciation 208.193 212.011 (3.818) (1.8) 0.000 0.000 0.000 - 208.193 212.011 (3.818) (1.8)
OPEB Obligation 59.673 59.673 0.000 0.0 0.000 0.000 0.000 - 59.673 59.673 0.000 0.0
Environmental Remediation 3.214 1.594 1.620 50.4 0.000 0.000 0.000 - 3.214 1.594 1.620 50.4
Total Expenses $1,429.759 $1,384.568 $45.191 3.2 $201.116 $175.011 $26.105 13.0 $1,630.874 $1,559.579 $71.296 4.4
Net Surplus/(Deficit) ($789.553) ($741.294) $48.259 6.1 $0.000 $0.000 $0.000 - ($789.553) ($741.294) $48.259 6.1
Cash Conversion Adjustments:
Depreciation 208.193 212.011 3.818 1.8 0.000 0.000 0.000 - 208.193 212.011 3.818 1.8
Operating/Capital (33.095) (18.474) 14.621 44.2 0.000 0.000 0.000 - (33.095) (18.474) 14.621 44.2
Other Cash Adjustments 187.302 148.805 (38.497) (20.6) 0.000 0.000 0.000 - 187.302 148.805 (38.497) (20.6)
Total Cash Conversion Adjustments $362.400 $342.341 ($20.059) (5.5) $0.000 $0.000 $0.000 - $362.400 $342.341 ($20.059) (5.5)
Net Cash Surplus/(Deficit) ($427.153) ($398.953) $28.200 6.6 $0.000 $0.000 $0.000 - ($427.153) ($398.953) $28.200 6.6
-- Results are preliminary and subject to audit review.
-- Differences are due to rounding.
* Variance exceeds 100%.
Favorable Favorable Favorable
(Unfavorable) (Unfavorable) (Unfavorable)
ACCRUAL STATEMENT of OPERATIONS by CATEGORY
($ in millions)
Nonreimbursable Reimbursable Total
MTA METRO-NORTH RAILROAD
JULY FINANCIAL PLAN - 2014 MID-YEAR FORECAST
November Year-To-Date
SCHEDULE I - B
Master Page # 50 of 83 - M
etro-North Railroad C
omm
ittee Meeting 1/20/2015
________________________________________________________________________________

Generic Revenue Non Reimb.
or Expense Category or Reimb. $ % Reason for Variance $ % Reason for Variance
OTHER OPERATING REVENUE Non-Reimb $0.572 10.5% Primarily due to higher net GCT retail revenue. $1.258 2.5%
CAPITAL AND OTHER
REIMBURSEMENTS
Reimb ($1.817) (9.4%) Lower reimbursements reflect scheduling changes in
capital project expenditures.
($26.105) (13.0%) Lower reimbursements reflect scheduling changes in
capital project expenditures.
PAYROLL Non-Reimb $2.187 6.0% Primarily due to vacancies and timing differences related
to payroll and calendar cutoff dates.
$1.961 0.4%
Reimb $0.220 6.4% Reflects vacant administrative positions, timing of the
following projects: 2013 & 2014 Cyclical Track Programs,
West of Hudson Track Program, Positive Train Control,
Replace 3rd Rail Brackets and the H & H Lines Power
Imp., and lower activity on Harmon Shop Improvements.
$1.320 3.2% Reflects delays on the Cyclical Track Program and
lower activity on the Misc. I&C on the NHL & Branch
Lines.
OVERTIME Non-Reimb ($0.375) (6.2%) Primarily due to higher requirements for improved track
maintenance programs, winter storm coverage, and
unscheduled emergency responses (Yonkers mudslide).
($3.540) (4.1%) Primarily due to higher requirements for improved
track/infrastructure maintenance programs, station
enhancements, the implementation of safety
enhancements and emergency responses (Cos Cob
Fire, Yonkers mudslide and Danbury Branch grade
crossing issues), vacancy and sick time coverage
partially offset by accrual RWA adjustments.
Reimb ($0.162) (11.2%) Reflects higher activity on the Mainline High Speed
Turnouts and Catenary C1 & C2 projects.
($2.364) (13.7%) Unfavorable variance primarily reflects a higher
overtime RWA accrual estimate for reimbursable
projects.
HEALTH AND WELFARE Non-Reimb $0.597 7.6% Primarily due to lower than projected premiums and
vacancies.
$1.917 2.1%
Reimb $0.172 14.0% Reflects lower project activity. $1.199 9.7% Reflects lower project activity.
OPEB CURRENT PAYMENT Non-Reimb ($0.080) (4.1%) Reflects higher level of retirees than anticipated. ($0.378) (1.7%)
PENSIONS Non-Reimb $1.022 14.4% Favorable variance reflects a lower than forecasted
increase in the Annual Required Contribution (ARC) as a
result of the wage settlement. However, annual pension
cost may differ based upon the pending year-end
Actuarial Valuation report.
$9.093 10.6% Favorable variance reflects a lower than forecasted
increase in the Annual Required Contribution (ARC) as a
result of the wage settlement. However, annual pension
cost may differ based upon the pending year-end
Actuarial Valuation report.
Reimb $0.130 16.2% Reflects lower project activity. $0.904 10.7% Reflects lower project activity.
Variance Variance
MTA METRO-NORTH RAILROAD
EXPLANATION OF VARIANCE BETWEEN MID-YEAR FORECAST AND ACTUAL RESULTS
JULY FINANCIAL PLAN - 2014 MID-YEAR FORECAST
ACCRUAL STATEMENT OF OPERATIONS BY CATEGORY
Fav (Unfav) Fav (Unfav)
NOVEMBER 2014
($ in millions)
Current Month vs. Mid-Year Forecast Year to Date vs. Mid-Year Forecast
Master Page # 51 of 83 - M
etro-North Railroad C
omm
ittee Meeting 1/20/2015
________________________________________________________________________________

Generic Revenue Non Reimb.
or Expense Category or Reimb. $ % Reason for Variance $ % Reason for Variance
Variance Variance
MTA METRO-NORTH RAILROAD
EXPLANATION OF VARIANCE BETWEEN MID-YEAR FORECAST AND ACTUAL RESULTS
JULY FINANCIAL PLAN - 2014 MID-YEAR FORECAST
ACCRUAL STATEMENT OF OPERATIONS BY CATEGORY
Fav (Unfav) Fav (Unfav)
NOVEMBER 2014
($ in millions)
Current Month vs. Mid-Year Forecast Year to Date vs. Mid-Year Forecast
OTHER FRINGE BENEFITS Non-Reimb $0.529 6.2% Primarily reflects lower payroll expense for the period. $5.231 5.2% Primarily reflects a reclassification of claims related
medical payments against the prior year accrued liability
for the Spuyten Duyvil and Bridgeport incidents.
Reimb $0.121 13.1% Reflects rate differentials and project adjustments. ($0.079) (0.8%)
REIMBURSABLE OVERHEAD Non-Reimb $0.452 12.8% The non-reimbursable and reimbursable variances reflect
the reclassification of operating expenses for ferry
services for 2013 and 2014 to the reimbursable budget,
partially offset by the timing of activity for Positive Train
Control.
$5.234 13.1% The non-reimbursable and reimbursable variances
reflect higher activity due to the timing of reimbursable
payroll retroactive wage adjustment (RWA) partially
offset by lower activity/timing on the following projects:
Hurricane Sandy Infrastructure, Positive Train Control,
and MNR Technology Move.
Reimb ($0.497) (14.7%) ($4.731) (12.2%)
ELECTRIC POWER Non-Reimb $1.857 26.5% Primarily reflects lower rates and consumption on the
Harlem and Hudson lines.
$8.806 10.6% Reflects lower electric power consumption across all
lines.
FUEL Non-Reim $0.260 11.0% Primarily reflects lower rates and consumption across all
lines.
($0.189) (0.7%)
INSURANCE Non-Reimb ($0.036) (2.3%) $0.871 5.3% Lower liability insurance expense.
Reimb $0.042 11.9% Reflects lower project activity. $0.192 5.8% Reflects lower project activity.
CLAIMS Non-Reimb $0.210 * Primarily reflects a reclassification of claims expense
against the accrued liability for the Spuyten Duyvil and
Bridgeport incidents.
($3.388) * Primarily reflects an accrual for a $5.4M claim
settlement for NJT employees injured on MNR property
partially offset by a reclassification of claims expense
against the accrued liability for the Spuyten Duyvil and
Bridgeport incidents.
MAINTENANCE AND OTHER
OPERATING CONTRACTS
Non-Reimb $3.591 40.8% Favorable variance reflects the reclassification of
operating expenses for ferry services for 2013 and 2014
to the reimbursable budget and timing of expenses for
facility maintenance contracts and GCT utilities.
$8.159 8.5% Favorable variance primarily reflects the reclassification
of operating expenses for ferry services for 2013 and
2014 to the reimbursable budget and timing of expenses
for the Genesis locomotive overhaul, facility
maintenance contracts, and GCT utilities.
Reimb ($2.433) * Unfavorable variance reflects the reclassification of
operating expenses for ferry services for 2013 and 2014
to the reimbursable budget.
$3.886 24.6% Reflects delay on the WoH Signal Improvements and
Overhead Bridge Program - EOFH partially offset by the
reclassification of operating expenses for ferry services
for 2013 and 2014 to the reimbursable budget.
Master Page # 52 of 83 - M
etro-North Railroad C
omm
ittee Meeting 1/20/2015
________________________________________________________________________________
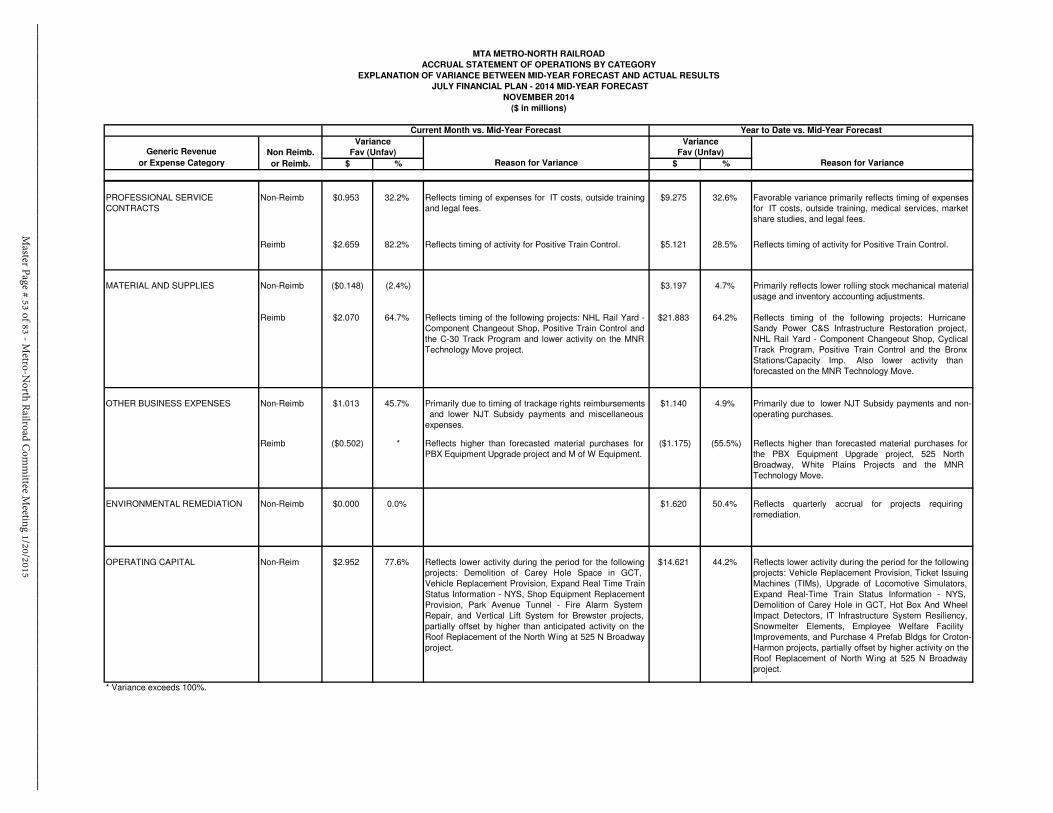
Generic Revenue Non Reimb.
or Expense Category or Reimb. $ % Reason for Variance $ % Reason for Variance
Variance Variance
MTA METRO-NORTH RAILROAD
EXPLANATION OF VARIANCE BETWEEN MID-YEAR FORECAST AND ACTUAL RESULTS
JULY FINANCIAL PLAN - 2014 MID-YEAR FORECAST
ACCRUAL STATEMENT OF OPERATIONS BY CATEGORY
Fav (Unfav) Fav (Unfav)
NOVEMBER 2014
($ in millions)
Current Month vs. Mid-Year Forecast Year to Date vs. Mid-Year Forecast
PROFESSIONAL SERVICE
CONTRACTS
Non-Reimb $0.953 32.2% Reflects timing of expenses for IT costs, outside training
and legal fees.
$9.275 32.6% Favorable variance primarily reflects timing of expenses
for IT costs, outside training, medical services, market
share studies, and legal fees.
Reimb $2.659 82.2% Reflects timing of activity for Positive Train Control. $5.121 28.5% Reflects timing of activity for Positive Train Control.
MATERIAL AND SUPPLIES Non-Reimb ($0.148) (2.4%) $3.197 4.7% Primarily reflects lower rolling stock mechanical material
usage and inventory accounting adjustments.
Reimb $2.070 64.7% Reflects timing of the following projects: NHL Rail Yard -
Component Changeout Shop, Positive Train Control and
the C-30 Track Program and lower activity on the MNR
Technology Move project.
$21.883 64.2% Reflects timing of the following projects: Hurricane
Sandy Power C&S Infrastructure Restoration project,
NHL Rail Yard - Component Changeout Shop, Cyclical
Track Program, Positive Train Control and the Bronx
Stations/Capacity Imp. Also lower activity than
forecasted on the MNR Technology Move.
OTHER BUSINESS EXPENSES Non-Reimb $1.013 45.7% Primarily due to timing of trackage rights reimbursements
and lower NJT Subsidy payments and miscellaneous
expenses.
$1.140 4.9% Primarily due to lower NJT Subsidy payments and non-
operating purchases.
Reimb ($0.502) * Reflects higher than forecasted material purchases for
PBX Equipment Upgrade project and M of W Equipment.
($1.175) (55.5%) Reflects higher than forecasted material purchases for
the PBX Equipment Upgrade project, 525 North
Broadway, White Plains Projects and the MNR
Technology Move.
ENVIRONMENTAL REMEDIATION Non-Reimb $0.000 0.0% $1.620 50.4% Reflects quarterly accrual for projects requiring
remediation.
OPERATING CAPITAL Non-Reim $2.952 77.6% Reflects lower activity during the period for the following
projects: Demolition of Carey Hole Space in GCT,
Vehicle Replacement Provision, Expand Real Time Train
Status Information - NYS, Shop Equipment Replacement
Provision, Park Avenue Tunnel - Fire Alarm System
Repair, and Vertical Lift System for Brewster projects,
partially offset by higher than anticipated activity on the
Roof Replacement of the North Wing at 525 N Broadway
project.
$14.621 44.2% Reflects lower activity during the period for the following
projects: Vehicle Replacement Provision, Ticket Issuing
Machines (TIMs), Upgrade of Locomotive Simulators,
Expand Real-Time Train Status Information - NYS,
Demolition of Carey Hole in GCT, Hot Box And Wheel
Impact Detectors, IT Infrastructure System Resiliency,
Snowmelter Elements, Employee Welfare Facility
Improvements, and Purchase 4 Prefab Bldgs for Croton-
Harmon projects, partially offset by higher activity on the
Roof Replacement of North Wing at 525 N Broadway
project.
* Variance exceeds 100%.
Master Page # 53 of 83 - M
etro-North Railroad C
omm
ittee Meeting 1/20/2015
________________________________________________________________________________

MTA Metro-North Railroad
July Financial Plan - 2014 Mid Year Forecast -
Non-Reimbursable/Reimbursable Overtime
($ in millions)
NON-REIMBURSABLE OVERTIME Hours $ Hours $ Hours $ Hours $ Hours $ Hours $
Scheduled Service 1
58,067 2.5$ 53,742 2.5$ 4,325 0.0$ 520,210 26.4$ 490,389 26.8$ 29,821 (0.5)$
7.4% 0.3% 5.7% -1.8%
Unscheduled Service 0 -$ 600 -$ (600) -$ 0 -$ 1,237 -$ (1,237) -$
- - - -
Programmatic/Routine Maintenance 51,403 2.4$ 54,138 2.6$ (2,735) (0.2)$ 502,182 23.5$ 537,305 25.0$ (35,123) (1.5)$
-5.3% -9.2% -7.0% -6.3%
Unscheduled Maintenance 1,222 0.1$ 2,538 0.1$ (1,316) (0.1)$ 8,468 0.4$ 23,150 1.5$ (14,682) (1.1)$
* * * *
Vacancy/Absentee Coverage 2
18,383 1.1$ 26,017 1.2$ (7,634) (0.1)$ 212,100 11.6$ 282,270 12.9$ (70,170) (1.3)$
-41.5% -11.5% -33.1% -11.0%
Weather Emergencies 1,280 0.1$ 5,219 0.2$ (3,939) (0.2)$ 85,432 4.0$ 90,408 4.2$ (4,976) (0.1)$
* * -5.8% -3.6%
Safety/Security/Law Enforcement 3
0 -$ 0 -$ 0 -$ 0 -$ 0 -$ 0 -$
- - - -
Other 4
1,057 (0.1)$ 244 (0.3)$ 813 0.2$ 18,821 19.7$ 16,221 18.8$ 2,600 0.9$
76.9% * 13.8% 4.7%
Subtotal 131,412 6.0$ 142,498 6.4$ (11,086) (0.4)$ 1,347,213 85.6$ 1,440,981 89.2$ (93,767) (3.5)$
-8.4% -6.2% -7.0% -4.1%
REIMBURSABLE OVERTIME 26,922 1.4$ 29,532 1.6$ (2,610) (0.2)$ 303,718 17.2$ 315,153 19.6$ (11,435) (2.4)$
-9.7% -11.1% -3.8% -13.7%
TOTAL OVERTIME 158,334 7.5$ 172,030 8.0$ (13,695) (0.5)$ 1,650,932 102.8$ 1,756,134 108.7$ (105,202) (5.9)$
-8.6% -7.2% -6.4% -5.7%
Totals may not add due to rounding.
NOTE: Percentages are based on each type of Overtime and not on Total Overtime.
* Exceeds 100%
1 Includes Service Delay and Tour Length related overtime.
2 Excludes T&E crew coverage (included in Scheduled Service category)
3 Not Applicable
4 Reflects overtime for administrative functions. Also reflects timing differences related to payroll and calendar cutoff dates.
November November Year-to-Date
Forecast Actuals Var. - Fav./(Unfav) Forecast Actuals Var. - Fav./(Unfav)
Master Page # 54 of 83 - M
etro-North Railroad C
omm
ittee Meeting 1/20/2015
________________________________________________________________________________

MTA Metro-North Railroad
July Financial Plan - 2014 Mid-Year Forecast
Non-Reimbursable/Reimbursable Overtime
($ in millions)
Var. - Fav./(Unfav) Var. - Fav./(Unfav)
Hours $ Explanations Hours $ Explanations
NON-REIMBURSABLE OVERTIME
Scheduled Service 1 4,325 $0.0 29,821 ($0.5) Reflects service coverage versus available staff and
train dispatchment needs.
7.4% 0.3% 5.7% -1.8%
Unscheduled Service (600) $0.0 (1,237) $0.0
- - - -
Programmatic/Routine Maintenance (2,735) ($0.2) Higher requirements to support Infrastructure
Improvement Program.
(35,123) ($1.5) Higher requirements to support Infrastructure
Improvement and Station Enhancement programs.
-5.3% -9.2% -7.0% -6.3%
Unscheduled Maintenance (1,316) ($0.1) Right-of-way maintenance related to the Yonkers mud
slide.
(14,682) ($1.1) Right-of-way maintenance related to the Yonkers mud
slide, repairs and operations coverage for the Cos Cob
signal house fire and grade crossing repairs on the
Danbury Branch.
* * * *
Vacancy/Absentee Coverage 2 (7,634) ($0.1) (70,170) ($1.3) Reflects vacation and sick coverage for must-fill
positions within MofE required to perform FRA
mandated functions and periodic maintenance
requirements.
-41.5% -11.5% -33.1% -11.0%
Weather Emergencies (3,939) ($0.2) M of W Storm related OT due to winter storm
coverage primarily for the Wednesday before
Thanksgiving.
(4,976) ($0.1)
* * -5.8% -3.6%
Safety/Security/Law Enforcement 3 0 $0.0 0 $0.0
- - - -
Other 4 813 $0.2 Accrual adjustments for retroactive wage agreement
(RWA).
2,600 $0.9 Accrual adjustments for retroactive wage agreement
(RWA).
76.9% * 13.8% 4.7%
Subtotal (11,086) ($0.4) (93,767) ($3.5)
-8.4% -6.2% -7.0% -4.1%
REIMBURSABLE OVERTIME (2,610) ($0.2) (11,435) ($2.4)
-9.7% -11.1% -3.8% -13.7%
TOTAL OVERTIME (13,695) ($0.5) (105,202) ($5.9)
NOTE: Percentages are based on each type of Overtime and not on Total Overtime.
* Exceeds 100%
1 Includes Service Delay and Tour Length related overtime.
2 Excludes T&E crew coverage (included in Scheduled Service category)
3 Not Applicable
4 Reflects overtime for Customer Service and Material Management Depts. as well as other administrative functions. Also reflects timing differences related to payroll and calendar cutoff dates.
November November Year To Date
Master Page # 55 of 83 - M
etro-North Railroad C
omm
ittee Meeting 1/20/2015
________________________________________________________________________________
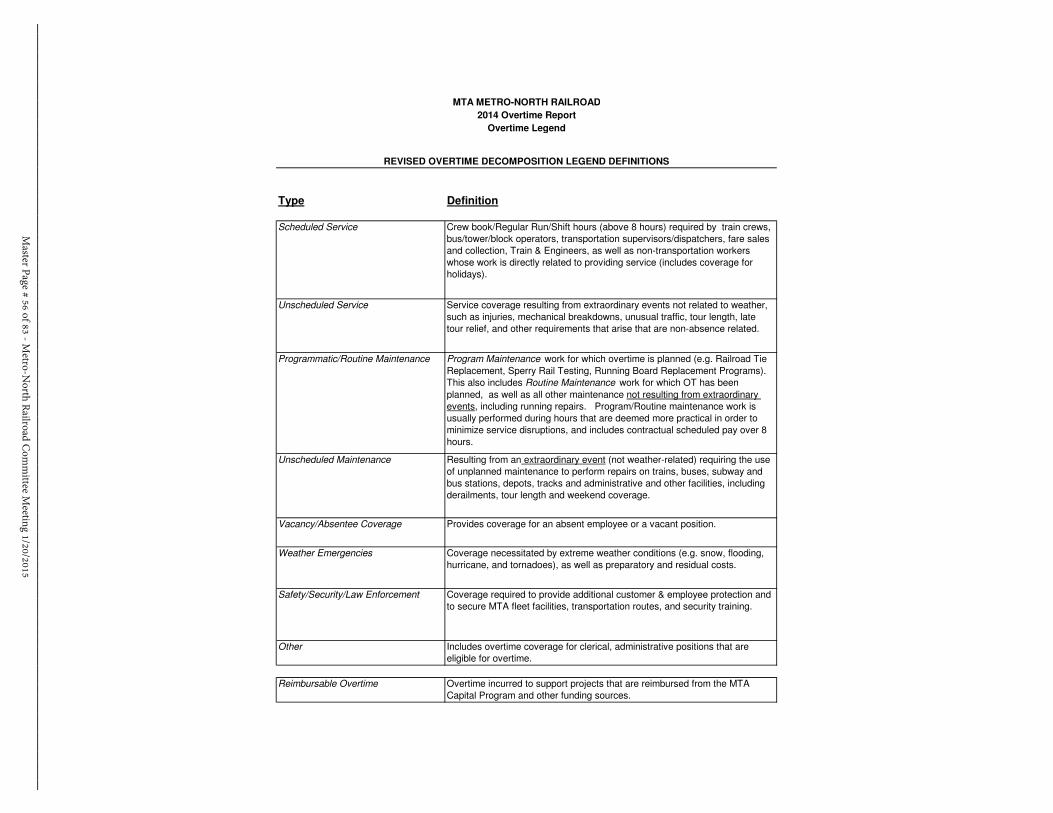
MTA METRO-NORTH RAILROAD
2014 Overtime Report
Overtime Legend
Type Definition
Scheduled Service Crew book/Regular Run/Shift hours (above 8 hours) required by train crews,
bus/tower/block operators, transportation supervisors/dispatchers, fare sales
and collection, Train & Engineers, as well as non-transportation workers
whose work is directly related to providing service (includes coverage for
holidays).
Unscheduled Service Service coverage resulting from extraordinary events not related to weather,
such as injuries, mechanical breakdowns, unusual traffic, tour length, late
tour relief, and other requirements that arise that are non-absence related.
Programmatic/Routine Maintenance Program Maintenance work for which overtime is planned (e.g. Railroad Tie
Replacement, Sperry Rail Testing, Running Board Replacement Programs).
This also includes Routine Maintenance work for which OT has been
planned, as well as all other maintenance not resulting from extraordinary
events, including running repairs. Program/Routine maintenance work is
usually performed during hours that are deemed more practical in order to
minimize service disruptions, and includes contractual scheduled pay over 8
hours.
Unscheduled Maintenance Resulting from an extraordinary event (not weather-related) requiring the use
of unplanned maintenance to perform repairs on trains, buses, subway and
bus stations, depots, tracks and administrative and other facilities, including
derailments, tour length and weekend coverage.
Vacancy/Absentee Coverage Provides coverage for an absent employee or a vacant position.
Weather Emergencies Coverage necessitated by extreme weather conditions (e.g. snow, flooding,
hurricane, and tornadoes), as well as preparatory and residual costs.
Safety/Security/Law Enforcement Coverage required to provide additional customer & employee protection and
to secure MTA fleet facilities, transportation routes, and security training.
Other Includes overtime coverage for clerical, administrative positions that are
eligible for overtime.
Reimbursable Overtime Overtime incurred to support projects that are reimbursed from the MTA
Capital Program and other funding sources.
REVISED OVERTIME DECOMPOSITION LEGEND DEFINITIONS
Master Page # 56 of 83 - M
etro-North Railroad C
omm
ittee Meeting 1/20/2015
________________________________________________________________________________

Mid-Year
Forecast Actual Variance Percent
Mid-Year
Forecast Actual Variance Percent
Receipts
Farebox Receipts $56.678 $49.942 ($6.736) (11.9) $595.920 $594.495 ($1.425) (0.2)
Toll Receipts 0.000 0.000 0.000 - 0.000 0.000 0.000 -
Other Operating Receipts 5.969 5.450 (0.519) (8.7) 65.538 66.279 0.741 1.1
Capital & Other Reimbursements:
MTA 15.948 7.572 (8.376) (52.5) 99.818 75.162 (24.656) (24.7)
CDOT 9.475 0.127 (9.348) (98.7) 65.806 48.422 (17.384) (26.4)
Other 1.621 1.090 (0.531) (32.7) 16.852 11.830 (5.022) (29.8)
Total Capital and Other Reimbursements 27.044 8.789 (18.255) (67.5) 182.476 135.414 (47.062) (25.8)
Total Receipts $89.691 $64.181 ($25.510) (28.4) $843.933 $796.188 ($47.745) (5.7)
Expenditures
Labor:
Payroll $35.241 $34.242 $0.999 2.8 $434.179 $413.321 $20.858 4.8
Overtime 7.258 7.450 (0.192) (2.6) 81.691 85.694 (4.003) (4.9)
Health and Welfare 9.908 0.859 9.049 91.3 107.577 98.390 9.187 8.5
OPEB Current Payment 1.723 1.090 0.633 36.7 21.943 22.473 (0.530) (2.4)
Pensions 7.185 6.923 0.262 3.6 65.443 64.098 1.345 2.1
Other Fringe Benefits 6.424 6.607 (0.183) (2.9) 101.425 101.246 0.179 0.2
GASB Account 0.000 0.000 0.000 - 4.450 4.458 (0.008) (0.2)
Reimbursable Overhead 0.000 0.000 0.000 - 0.000 0.000 0.000 -
Total Labor $67.738 $57.171 $10.567 15.6 $816.708 $789.680 $27.028 3.3
Non-Labor:
Electric Power --
$7.715 $7.428 $0.287 3.7 $82.134 $75.151 $6.983 8.5
Fuel 1.711 1.965 (0.254) (14.9) 22.640 25.913 (3.273) (14.5)
Insurance 0.509 0.000 0.509 100.0 18.005 18.486 (0.481) (2.7)
Claims 0.622 6.173 (5.551) * 6.999 26.975 (19.976) *
Paratransit Service Contracts 0.000 0.000 0.000 - 0.000 0.000 0.000 -
Maintenance and Other Operating Contracts 10.916 7.236 3.680 33.7 118.938 91.111 27.827 23.4
Professional Service Contracts --
7.151 2.066 5.085 71.1 52.470 33.586 18.884 36.0
Materials & Supplies 11.256 7.744 3.512 31.2 106.857 86.670 20.187 18.9
Other Business Expenditures 4.896 3.801 1.095 22.4 46.335 47.569 (1.234) (2.7)
Total Non-Labor $44.775 $36.413 $8.362 18.7 $454.378 $405.461 $48.917 10.8
Other Adjustments:
Other 0.000 0.000 0.000 - 0.000 0.000 0.000 -
Other Post Employment Benefits 0.000 0.000 0.000 - 0.000 0.000 0.000 -
Total Other Adjustments $0.000 $0.000 $0.000 - $0.000 $0.000 $0.000 -
Total Expenditures $112.513 $93.584 $18.929 16.8 $1,271.086 $1,195.141 $75.945 6.0
Net Cash Deficit ( excludes Opening Cash Balance) ($22.822) ($29.403) ($6.581) (28.8) ($427.153) ($398.953) $28.200 6.6
Subsidies
MTA 16.458 22.774 6.316 38.4 333.825 297.680 (36.145) (10.8)
CDOT 6.364 3.404 (2.960) (46.5) 91.260 89.711 (1.549) (1.7)
Total Subsidies $22.822 $26.178 $3.356 14.7 $425.085 $387.391 ($37.694) (8.9)
Cash Timing and Availability Adjustment $0.000 $3.225 $3.225 - $0.000 $11.562 $11.562 -
-- Results are preliminary and subject to audit review.
-- Differences are due to rounding.
* Variance exceeds 100%.
--Year to date actuals reflects reclassication of $2,977K from Prof. Service Contracts to Traction and Propulsion
SCHEDULE III
CASH RECEIPTS AND EXPENDITURES
JULY FINANCIAL PLAN - 2014 MID-YEAR FORECAST
MTA METRO-NORTH RAILROAD
(Unfavorable) (Unfavorable)
November 2014 Year-to-Date
Favorable Favorable
($ in millions)
Master Page # 57 of 83 - M
etro-North Railroad C
omm
ittee Meeting 1/20/2015
________________________________________________________________________________

$ Detail
Generic Receipt or Expense Category $ % Reason for Variance $ % Reason for Variance
FARE REVENUE (6.736) (11.9%) Timing of cash receipts partially offset by higher non-
commuter ridership.
(1.425) (0.2%)
OTHER OPERATING REVENUE (0.519) (8.7%) Timing of receipts of Amtrak reimbursement and lower
miscellaneous revenue partially offset by timing of LAZ
parking receipts.
0.742 1.1%
CAPITAL AND OTHER REIMBURSEMENTS:
MTA (8.376) (52.5%) Lower cash receipts due to lower project activity combined
with timing of payments.
(24.655) (24.7%) Lower cash receipts due to lower project activity combined with
timing of payments.
CDOT (9.348) (98.7%) Lower cash receipts due to timing of payments combined with
lower project activity.
(17.385) (26.4%) Lower cash receipts due to timing of payments partially offset by
higher project activity.
OTHER (0.531) (32.8%) Lower cash receipts due to timing of payments partially offset
by higher project activity.
(5.023) (29.8%) Lower cash receipts due to timing of payments combined with lower
project activity.
PAYROLL 0.999 2.8% 20.858 4.8% Timing of estimated RWA payments to agreement personnel
combined with vacancy and delays in hiring.
OVERTIME (0.192) (2.6%) (4.003) (4.9%)
HEALTH & WELFARE 9.050 * Timing of November payments made in October for NYSHIP
combined with headcount and rate favorability.
9.187 8.5% Combination of rate favorability, timing of payments and headcount
favorability.
OPEB CURRENT PAYMENT 0.633 36.7% Timing of November payment made in October. (0.530) (2.4%)
PENSIONS 0.262 3.6% 1.345 2.1%
OTHER FRINGE BENEFITS (0.183) (2.8%) 0.179 0.2%
GASB ACCOUNT 0.000 0.0% 0.000 0.0%
ELECTRIC POWER 0.287 3.7% 6.983 8.5% Supplier portion of Conn. Light & Power for June - November
combined with favorable rate variance.
FUEL (0.255) (14.9%) Change in NHL locomotive fueling procedures. (3.273) (14.5%) Change in NHL locomotive fueling procedures combined with timing
of payments.
MTA METRO-NORTH RAILROAD
JULY FINANCIAL PLAN - 2014 MID-YEAR FORECAST
EXPLANATION OF VARIANCE BETWEEN FORECAST AND ACTUAL RESULTS
CASH RECEIPTS AND EXPENDITURES
Fav (Unfav)
($ in millions)
Variance
Fav (Unfav)
November Month vs Mid-Year Forecast Year-To-Date as of November 30, 2014
Variance
Master Page # 58 of 83 - M
etro-North Railroad C
omm
ittee Meeting 1/20/2015
________________________________________________________________________________
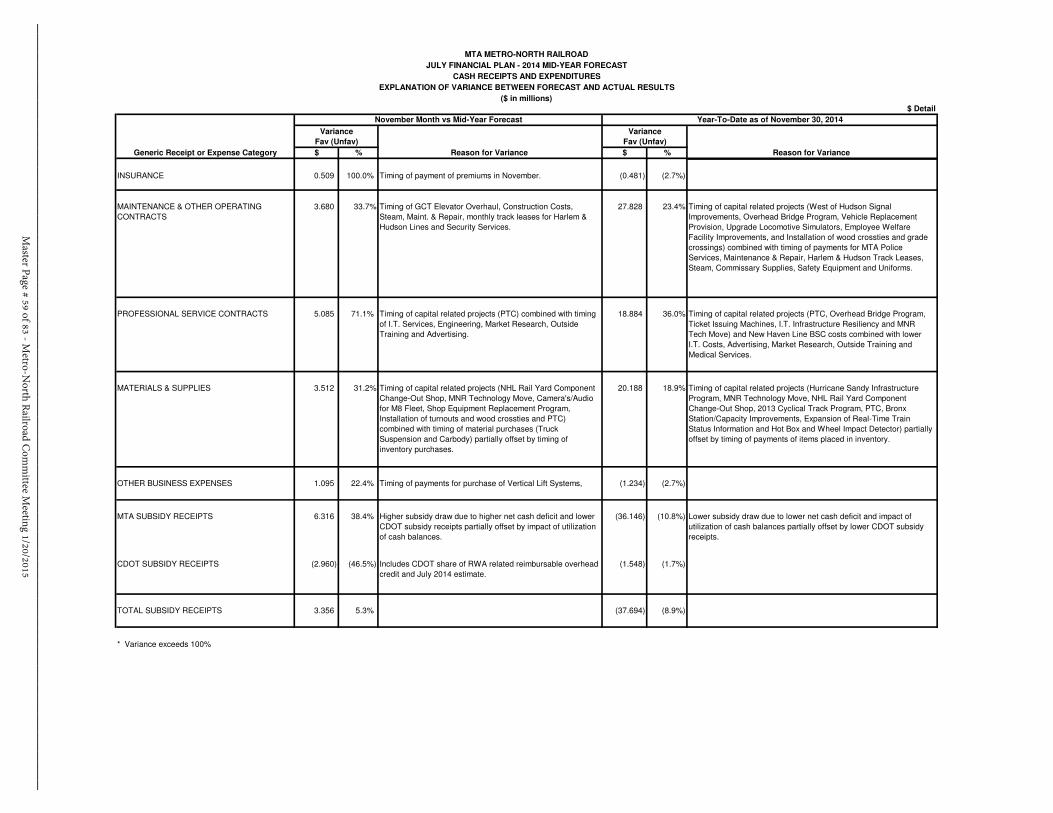
$ Detail
Generic Receipt or Expense Category $ % Reason for Variance $ % Reason for Variance
MTA METRO-NORTH RAILROAD
JULY FINANCIAL PLAN - 2014 MID-YEAR FORECAST
EXPLANATION OF VARIANCE BETWEEN FORECAST AND ACTUAL RESULTS
CASH RECEIPTS AND EXPENDITURES
Fav (Unfav)
($ in millions)
Variance
Fav (Unfav)
November Month vs Mid-Year Forecast Year-To-Date as of November 30, 2014
Variance
INSURANCE 0.509 100.0% Timing of payment of premiums in November. (0.481) (2.7%)
MAINTENANCE & OTHER OPERATING
CONTRACTS
3.680 33.7% Timing of GCT Elevator Overhaul, Construction Costs,
Steam, Maint. & Repair, monthly track leases for Harlem &
Hudson Lines and Security Services.
27.828 23.4% Timing of capital related projects (West of Hudson Signal
Improvements, Overhead Bridge Program, Vehicle Replacement
Provision, Upgrade Locomotive Simulators, Employee Welfare
Facility Improvements, and Installation of wood crossties and grade
crossings) combined with timing of payments for MTA Police
Services, Maintenance & Repair, Harlem & Hudson Track Leases,
Steam, Commissary Supplies, Safety Equipment and Uniforms.
PROFESSIONAL SERVICE CONTRACTS 5.085 71.1% Timing of capital related projects (PTC) combined with timing
of I.T. Services, Engineering, Market Research, Outside
Training and Advertising.
18.884 36.0% Timing of capital related projects (PTC, Overhead Bridge Program,
Ticket Issuing Machines, I.T. Infrastructure Resiliency and MNR
Tech Move) and New Haven Line BSC costs combined with lower
I.T. Costs, Advertising, Market Research, Outside Training and
Medical Services.
MATERIALS & SUPPLIES 3.512 31.2% Timing of capital related projects (NHL Rail Yard Component
Change-Out Shop, MNR Technology Move, Camera's/Audio
for M8 Fleet, Shop Equipment Replacement Program,
Installation of turnouts and wood crossties and PTC)
combined with timing of material purchases (Truck
Suspension and Carbody) partially offset by timing of
inventory purchases.
20.188 18.9% Timing of capital related projects (Hurricane Sandy Infrastructure
Program, MNR Technology Move, NHL Rail Yard Component
Change-Out Shop, 2013 Cyclical Track Program, PTC, Bronx
Station/Capacity Improvements, Expansion of Real-Time Train
Status Information and Hot Box and Wheel Impact Detector) partially
offset by timing of payments of items placed in inventory.
OTHER BUSINESS EXPENSES 1.095 22.4% Timing of payments for purchase of Vertical Lift Systems, (1.234) (2.7%)
MTA SUBSIDY RECEIPTS 6.316 38.4% Higher subsidy draw due to higher net cash deficit and lower
CDOT subsidy receipts partially offset by impact of utilization
of cash balances.
(36.146) (10.8%) Lower subsidy draw due to lower net cash deficit and impact of
utilization of cash balances partially offset by lower CDOT subsidy
receipts.
CDOT SUBSIDY RECEIPTS (2.960) (46.5%) Includes CDOT share of RWA related reimbursable overhead
credit and July 2014 estimate.
(1.548) (1.7%)
TOTAL SUBSIDY RECEIPTS 3.356 5.3% (37.694) (8.9%)
* Variance exceeds 100%
Master Page # 59 of 83 - M
etro-North Railroad C
omm
ittee Meeting 1/20/2015
________________________________________________________________________________

Mid-Year
Forecast Actual Variance Percent
Mid-Year
Forecast Actual Variance Percent
Receipts
Farebox Revenue $0.453 ($4.956) ($5.409) * $5.158 $1.923 ($3.235) (62.7)
Toll Revenue 0.000 0.000 0.000 - 0.000 0.000 0.000 -
Other Operating Revenue 0.496 (0.595) (1.091) * 16.094 15.577 (0.517) (3.2)
Capital & Other Reimbursements: 0.000 0.000 0.000
MTA 6.485 (1.907) (8.392) * (13.832) (11.651) 2.181 15.8
CDOT 1.303 (5.924) (7.227) * (3.034) (23.451) (20.416) *
Other (0.127) (0.945) (0.818) * (1.774) (4.495) (2.722) *
Total Capital and Other Reimbursements 7.662 (8.776) (16.438) * (18.640) (39.597) (20.957) *
Total Revenue/Receipts $8.611 ($14.327) ($22.938) * $2.612 ($22.096) ($24.709) *
Expenditures
Labor:
Payroll $4.746 $3.338 ($1.408) (29.7) $78.708 $96.285 $17.577 22.3
Overtime 0.212 0.557 0.345 * 21.134 23.036 1.901 9.0
Health and Welfare (0.851) 7.430 8.280 * (4.618) 1.453 6.071 *
OPEB Current Payment 0.255 0.968 0.000 (0.255) (0.407) (0.152) (59.6)
Pensions 0.708 (0.183) (0.891) * 28.640 19.988 (8.652) (30.2)
Other Fringe Benefits 3.068 2.236 (0.832) (27.1) 8.822 3.849 (4.973) (56.4)
GASB Account 0.000 0.000 0.000 - (4.450) (4.458) (0.008) (0.2)
Reimbursable Overhead (0.133) (0.088) 0.045 34.1 (1.240) (1.743) (0.503) (40.6)
Total Labor $8.005 $14.258 $6.253 78.1 $126.742 $138.003 $11.261 8.9
Non-Labor:
Electric Power ($0.702) ($2.268) ($1.566) * $0.550 ($1.221) ($1.771) *
Fuel 0.658 0.144 (0.514) (78.2) 2.854 (0.229) (3.083) *
Insurance 1.430 1.933 0.503 35.2 1.880 0.335 (1.545) (82.2)
Claims (0.500) (6.260) (5.760) * (5.123) (21.711) (16.588) *
Paratransit Service Contracts 0.000 0.000 0.000 - 0.000 0.000 0.000 -
Maintenance and Other Operating Contracts (0.831) 1.690 2.521 * (7.035) 8.747 15.782 *
Professional Service Contracts (0.955) 0.518 1.473 * (6.040) (1.551) 4.488 74.3
Materials & Supplies (1.824) (0.234) 1.590 87.2 (4.326) (9.218) (4.892) *
Other Business Expenses (2.633) (2.050) 0.583 22.2 (20.794) (21.994) (1.199) (5.8)
Total Non-Labor ($5.357) ($6.528) ($1.170) (21.8) ($38.034) ($46.842) ($8.809) (23.2)
Other Adjustments:
Other 0.000 0.000 0.000 - 0.000 0.000 0.000 -
Total Other Adjustments $0.000 $0.000 $0.000 - $0.000 $0.000 $0.000 -
Total Expenditures Adjustments before Non-Cash
Liability Adjs. $2.648 $7.730 $5.083 * $88.708 $91.160 $2.452 2.8
Depreciation 19.044 18.753 (0.291) (1.5) 208.193 212.011 3.818 1.8
OPEB Obligation 5.425 5.425 0.000 0.0 59.673 59.673 0.000 0.0
Environmental Remediation 0.000 0.000 0.000 - 3.214 1.594 (1.620) 50.4
Total Expenditures Adjustments $27.117 $31.908 $4.792 17.7 $359.788 $364.438 $4.650 1.3
Total Cash Conversion Adjustments $35.727 $17.581 ($18.146) (50.8) $362.400 $342.341 ($20.059) (5.5)
-- Results are preliminary and subject to audit review.
-- Differences are due to rounding.
* Variance exceeds 100%.
CASH CONVERSION (CASH FLOW ADJUSTMENT)
JULY FINANCIAL PLAN - 2014 MID-YEAR FORECAST
MTA METRO-NORTH RAILROAD
(Unfavorable) (Unfavorable)
November 2014 Year-to-Date
Favorable Favorable
($ in millions)
Master Page # 60 of 83 - M
etro-North Railroad C
omm
ittee Meeting 1/20/2015
________________________________________________________________________________

Mid-Year
Forecast Actual Amount %
Mid-Year
Forecast Actual Amount %
Farebox Revenue
Harlem Line $16.535 $16.197 ($0.338) -2.0 $175.893 $175.492 ($0.401) -0.2
Hudson Line $12.065 $11.829 ($0.236) -2.0 $127.029 $128.325 $1.296 1.0
New Haven Line $27.592 $26.838 ($0.754) -2.7 $287.450 $288.372 $0.922 0.3
Total Farebox Revenue $56.192 $54.865(1)
($1.327) -2.4 $590.372 $592.189(1)
$1.817 0.3
Ridership
Harlem Line 2.175 2.139 (0.037) -1.7 24.700 24.729 0.030 0.1
Hudson Line 1.288 1.272 (0.016) -1.2 14.660 14.817 0.157 1.1
New Haven Line 3.184 3.144 (0.039) -1.2 35.814 36.072 0.259 0.7
Total Ridership East of Hudson 6.647 6.555 (0.092) -1.4 75.173 75.619 0.445 0.6
West of Hudson 0.127 0.131 0.004 2.9 1.517 1.538 0.021 1.4
Total Ridership 6.774 6.686 (0.088) -1.3 76.691 77.157 0.466 0.6
East of Hudson:
(1) Excludes West of Hudson Mail & Ride revenue totaling $0.033 million for the month and $0.383 million year-to-date.
Year-to-Date November Variance
Fav (Unfav)Fav (Unfav)
VarianceMonth of November
MTA METRO-NORTH RAILROAD
JULY FINANCIAL PLAN - 2014 MID-YEAR FORECAST
UTILIZATION
(in millions)
West of Hudson ridership was higher by 1.4% YTD and 2.9% for the month respectively vs. the Mid-Year Forecast and 6.8% better than 2013
reflecting an improving regional economy and a continuation of the recovery from the ridership losses experienced from Hurricane Irene and
Superstorm Sandy.
East of Hudson YTD ridership of 75.6 million was 0.6% higher than the Mid-Year Forecast reflecting an improving regional economy. Results
for the month, however were 1.4% below the forecast reflecting decreases of 1.7% on the Harlem Line, 1.2% on the Hudson Line and 1.2% on
the New Haven Line. As compared to 2013, overall ridership increased 1.2% year-to-date and 2.8% for the month.
Commutation ridership was 0.3% higher for the year-to-date and 0.4% lower for the month vs. the Mid-Year Forecast. Compared to 2013,
November year-to-date commutation ridership was 0.3% higher. Non-commutation ridership was 1.0% higher than Mid-Year Forecast year-to-
date and 2.5% higher than 2013. For the month, non-commutation ridership was 2.6% lower than Mid-Year Forecast, and 3.7% better than
2013.
West of Hudson:
Master Page # 61 of 83 - M
etro-North Railroad C
omm
ittee Meeting 1/20/2015
________________________________________________________________________________

MTA METRO-NORTH RAILROAD
2014 MID YEAR FORECAST VS. ACTUALS
TOTAL FULL-TIME POSITIONS AND FULL-TIME EQUIVALENTS
November 30, 2014
Department
Mid-Year
Forecast Actual
Favorable
(Unfavorable)
Variance
Administration
President 3 2 1
Labor Relations 10 7 3
Safety (1) 57 36 22
COS/Corporate & Public Affairs 17 15 2
Legal (2) 17 18 (1)
Claims Services 14 10 4
Environmental Compliance & Svce 8 7 1
VP Administration 2 2 -
VP Human Resources 6 6 1
Human Resources (3) 29 25 4
Training (1) 77 51 26
Employee Relations & Diversity 5 5 1
VP Planning 2 2 -
Operations Planning & Analysis 18 15 3
Capital Planning & Programming 15 14 1
GCT & Corporate Development 32 32 -
Long Range Planning 7 6 1
VP Finance & Information Systems 3 1 2
Controller (3) 81 74 7
Information Technology & Project Mgmt (3) 125 95 30
Budget 18 18 0
Customer Service 46 44 2
Procurement & Material Mgmt 30 28 2
Corporate - - 0
Total Administration 622 511 111
Operations
Operations Administration (1) 65 51 15
Operations Services (1) 1,467 1,449 18
Customer Service (3) 237 228 9
GCT & Corporate Development 34 32 2
Metro-North West (4) 29 34 (5)
Total Operations 1,832 1,794 38
Maintenance
GCT & Corporate Development (3) 173 156 17
Maintenance of Equipment (3) 1,713 1,609 105
Maintenance of Way (3) 1,967 1,855 112
Procurement & Material Mgmt 121 119 2
Total Maintenance 3,974 3,739 235
Engineering/Capital
Construction Management 34 30 4
Engineering & Design 62 60 2
Total Engineering/Capital 96 90 6
Total Positions 6,523 6,133 390
Non-Reimbursable 5,887 5,679 208
Reimbursable 637 455 182
Total Full-Time 6,522 6,132 390
Total Full-Time-Equivalents 1 1 -
(of part-time positions)
(1) Variance reflects new and existing vacant positions.
(2) Variance reflects early hiring of vacant positions.
(3) Variance reflects existing vacant positions.
(4) Metro-North West unfavorable variance is due to the transfer of Operation Services T&E staff to perform flag
work on various West of Hudson projects.
Master Page # 62 of 83 - Metro-North Railroad Committee Meeting 1/20/2015
________________________________________________________________________________

MTA METRO-NORTH RAILROAD
2014 MID YEAR FORECAST VS. ACTUALS
TOTAL FULL-TIME POSITIONS AND FULL-TIME EQUIVALENTS
November 30, 2014
FUNCTION/OCCUPATION Mid-Year Forecast Actual
Favorable
(Unfavorable)
Variance
Administration (1)
Managers/Supervisors 188 153 36
Professional, Technical, Clerical 434 359 75
Operational Hourlies - - -
Total Administration 622 511 111
Operations (1)
Managers/Supervisors 152 131 21
Professional, Technical, Clerical 242 223 20
Operational Hourlies 1,438 1,440 (2)
Total Operations 1,832 1,794 38
Maintenance (1)
Managers/Supervisors 516 490 26
Professional, Technical, Clerical 509 505 3
Operational Hourlies 2,949 2,744 206
Total Maintenance 3,974 3,739 235
Engineering/Capital
Managers/Supervisors 41 40 1
Professional, Technical, Clerical 55 50 5
Operational Hourlies - - -
96 90 6
Public Safety
Managers/Supervisors - - -
Professional, Technical, Clerical - - -
Operational Hourlies - - -
Total Public Safety - - -
Total Positions
Managers/Supervisors 897 813 84
Professional, Technical, Clerical 1,240 1,137 103
Operational Hourlies 4,387 4,184 203
Total Positions 6,523 6,133 390
Notes
(1) Reflects allocation of Customer Service, GCT & Corporate Development and Procurement & Material Management
functions between Administration, Operations and Maintenance categories.
Master Page # 63 of 83 - M
etro-North Railroad C
omm
ittee Meeting 1/20/2015
________________________________________________________________________________

MTA METRO-NORTH RAILROAD
2014 MID YEAR FORECAST VS. ACTUALS
November 30, 2014
Agency-wide (Non-Reimbursable and
Reimbursable)
Mid-Year
Forecast Actual
Favorable
(Unfavorable)
Variance Explanation of Variances
Functional Classification:
Operations (1) 1,832 1,794 38 Reflects vacancies in Operation Services (train
operations staff), Operations Administration and
Customer Service (custodians).
Maintenance (1) 3,974 3,739 235 Reflects vacancies in Maintenance of Way
(trackmen, mechanics, vehicle & machine
operators and signal maintainers) and
Maintenance of Equipment positions
(electricians, carmen, machinists and
sheetmetal workers).
Administration (1) 622 511 111 Reflects vacancies in Information Technology
(computer support analysts, application
developers and network analysts), and timing
differences on the hiring of new Training and
Safety positions.
Engineering / Capital 96 90 6 Reflects delayed attrition in Construction
Management positions.
Total Agency-wide Headcount 6,523 6,133 390
Non-Reimbursable 5,887 5,679 208
Reimbursable 637 455 182
Notes(1) Reflects allocation of Customer Service, GCT & Corporate Development and Procurement & Material
Management functions between Administration, Operations and Maintenance categories.
Master Page # 64 of 83 - M
etro-North Railroad C
omm
ittee Meeting 1/20/2015
________________________________________________________________________________
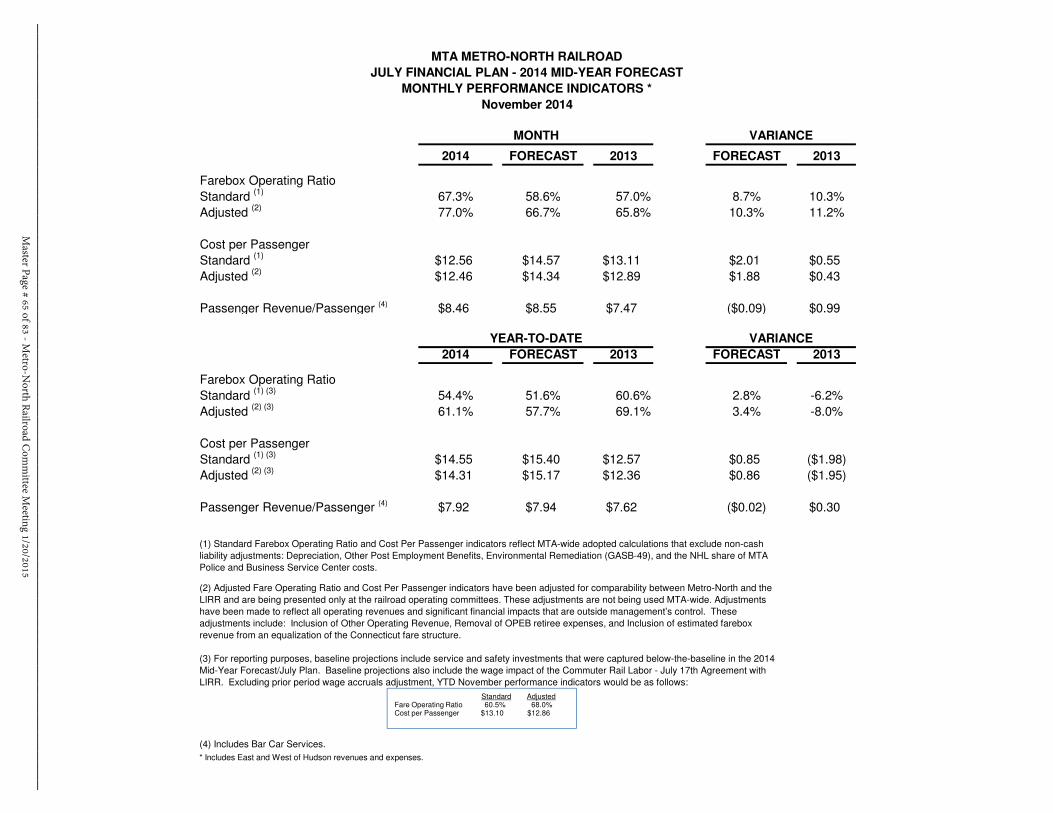
VARIANCE
2014 FORECAST 2013 FORECAST 2013
Farebox Operating Ratio
Standard (1)
67.3% 58.6% 57.0% 8.7% 10.3%
Adjusted (2)
77.0% 66.7% 65.8% 10.3% 11.2%
Cost per Passenger
Standard (1)
$12.56 $14.57 $13.11 $2.01 $0.55
Adjusted (2)
$12.46 $14.34 $12.89 $1.88 $0.43
Passenger Revenue/Passenger (4) $8.46 $8.55 $7.47 ($0.09) $0.99
VARIANCE
2014 FORECAST 2013 FORECAST 2013
Farebox Operating Ratio
Standard (1) (3)
54.4% 51.6% 60.6% 2.8% -6.2%
Adjusted (2) (3)
61.1% 57.7% 69.1% 3.4% -8.0%
Cost per Passenger
Standard (1) (3)
$14.55 $15.40 $12.57 $0.85 ($1.98)
Adjusted (2) (3)
$14.31 $15.17 $12.36 $0.86 ($1.95)
Passenger Revenue/Passenger (4) $7.92 $7.94 $7.62 ($0.02) $0.30
(4) Includes Bar Car Services.
* Includes East and West of Hudson revenues and expenses.
(2) Adjusted Fare Operating Ratio and Cost Per Passenger indicators have been adjusted for comparability between Metro-North and the
LIRR and are being presented only at the railroad operating committees. These adjustments are not being used MTA-wide. Adjustments
have been made to reflect all operating revenues and significant financial impacts that are outside management’s control. These
adjustments include: Inclusion of Other Operating Revenue, Removal of OPEB retiree expenses, and Inclusion of estimated farebox
revenue from an equalization of the Connecticut fare structure.
(1) Standard Farebox Operating Ratio and Cost Per Passenger indicators reflect MTA-wide adopted calculations that exclude non-cash
liability adjustments: Depreciation, Other Post Employment Benefits, Environmental Remediation (GASB-49), and the NHL share of MTA
Police and Business Service Center costs.
MTA METRO-NORTH RAILROAD
JULY FINANCIAL PLAN - 2014 MID-YEAR FORECAST
MONTHLY PERFORMANCE INDICATORS *
November 2014
MONTH
YEAR-TO-DATE
(3) For reporting purposes, baseline projections include service and safety investments that were captured below-the-baseline in the 2014
Mid-Year Forecast/July Plan. Baseline projections also include the wage impact of the Commuter Rail Labor - July 17th Agreement with
LIRR. Excluding prior period wage accruals adjustment, YTD November performance indicators would be as follows:
Standard AdjustedFare Operating Ratio 60.5% 68.0%Cost per Passenger $13.10 $12.86
Master Page # 65 of 83 - M
etro-North Railroad C
omm
ittee Meeting 1/20/2015
________________________________________________________________________________

$ $ $ $ % $ %
Total Revenue 640.2 644.4 643.3 3.1 0.5 (1.1) (0.2)
Total Expenses before Non-Cash Liability Adjs 1,158.7 1,145.2 1,111.3 47.4 4.1 33.9 3.0
Depreciation 208.2 208.7 212.0 (3.8) (1.8) (3.4) (1.6)
OPEB Obligation 59.7 59.7 59.7 - 0.0 - 0.0
Environmental Remediation 3.2 2.9 1.6 1.6 50.4 1.3 44.2
Total Expenses 1,429.8 1,416.4 1,384.6 45.2 3.2 31.8 2.2
Net Surplus/(Deficit) (789.6) (772.0) (741.3) 48.3 6.1 30.7 4.0
Note: Totals may not add due to rounding
November Forecast
MTA METRO-NORTH RAILROAD
MID-YEAR FORECAST AND NOVEMBER FORECAST vs. ACTUAL RESULTS (NON-REIMBURSABLE)
NOVEMBER 2014 YEAR-TO-DATE
($ in millions)
November Year-to-Date Favorable(Unfavorable) Variance
Mid-Year ForecastNovember
ForecastActual Mid-Year Forecast
Master Page # 66 of 83 - M
etro-North Railroad C
omm
ittee Meeting 1/20/2015
________________________________________________________________________________

Variance ExplanationVariance Percent
Total Revenue ($1.1) (0.2) Lower non-commutation farebox revenues
Total Expenses $31.8 2.2
NOTE: Mid-Year Forecast vs. Actual Variance explanations are provided in the monthly report to the Finance Committee
Favorable/(Unfavorable)
Variance comprised of favorable fringe costs (pension, taxes
and employee claims), contracts and materials offset by
accelerated depreciation expenses
MTA METRO-NORTH RAILROAD
EXPLANATION OF VARIANCES BETWEEN NOVEMBER FORECAST AND ACTUAL RESULTS
NON-REIMBURSABLE
NOVEMBER 2014 YEAR-TO-DATE
($ in millions)
Master Page # 67 of 83 - M
etro-North Railroad C
omm
ittee Meeting 1/20/2015
________________________________________________________________________________
Ridership Report
January 2015
Master Page # 68 of 83 - Metro-North Railroad Committee Meeting 1/20/2015
________________________________________________________________________________

MTA METRO-NORTH RAILROAD
MONTHLY RIDERSHIP REPORT NOVEMBER 2014
Operations Planning & Analysis Department January, 2015
Master Page # 69 of 83 - Metro-North Railroad Committee Meeting 1/20/2015
________________________________________________________________________________

NOVEMBER 2014 RIDERSHIP REPORT MTA METRO-NORTH RAILROAD
EXECUTIVE SUMMARY
November
• November 2014 Total MNR System Ridership was 6.727 million vs. 6.536 million in November 2013, an increase of 190,905 passengers (+2.9%).
• November 2014 Total Rail Ridership was 6.686 million vs. 6.495 million in November
2013, an increase of 191,083 passengers (+2.9%). - Rail Commutation Ridership was +2.2% vs. 2013 - Rail Non-commutation Ridership was +3.9% vs. 2013
• November 2014 East of Hudson Ridership was 6.555 million vs. 6.377 million in
November 2013, an increase of 178,531 passengers (+2.8%). • November 2014 West of Hudson Ridership was 0.131 million vs. 0.118 million in
November 2013, an increase of 12,552 passengers (+10.6%). • November 2014 Connecting Services Ridership was 0.041 million vs. 0.041 million in
November 2013, a decrease of 178 passengers (-0.4%).
• November 2014 Rail Revenue was $56.0 million vs. $49.8 million in November 2013, an increase of $6,240,393 (+12.5%).
Year To Date
• 2014 YTD Total MNR System Ridership was 1.3% above 2013 and 0.6% above forecast.
• 2014 YTD Total Rail Ridership was 1.3% above 2013 and 0.6% above forecast. • 2014 YTD East of Hudson Ridership was 1.2% above 2013 and 0.6% above forecast. • 2014 YTD West of Hudson ridership was 7.1% above 2013 and 1.4% above
forecast. • 2014 YTD Connecting Services Ridership was 2.3% below 2013 and 4.8% below
forecast.
• 2014 YTD Rail Revenue was 5.0% above 2013 and 0.3% above forecast.
Master Page # 70 of 83 - Metro-North Railroad Committee Meeting 1/20/2015
________________________________________________________________________________

November's Total Rail Ridership was 2.9% above 2013 and 1.3% below forecast.
Y-T-DJan Feb Mar Apr May Jun Jul Aug Sep Oct Nov Dec Total6.53 5.96 6.82 7.16 7.17 7.36 7.52 7.08 7.22 7.65 6.69 77.166.68 6.00 6.96 7.11 7.04 7.26 7.30 6.96 6.97 7.38 6.49 76.14
-2.3% -0.5% -2.0% 0.7% 1.9% 1.4% 3.0% 1.7% 3.5% 3.7% 2.9% 1.3%
1) Includes East and West of Hudson.
NOVEMBER RAIL RIDERSHIP (1)
20142013
PCT CHG.
5.50
6.00
6.50
7.00
7.50
8.00
Rid
ersh
ip in
Mill
ions
.
2014 2013
Master Page # 71 of 83 - M
etro-North Railroad C
omm
ittee Meeting 1/20/2015
________________________________________________________________________________
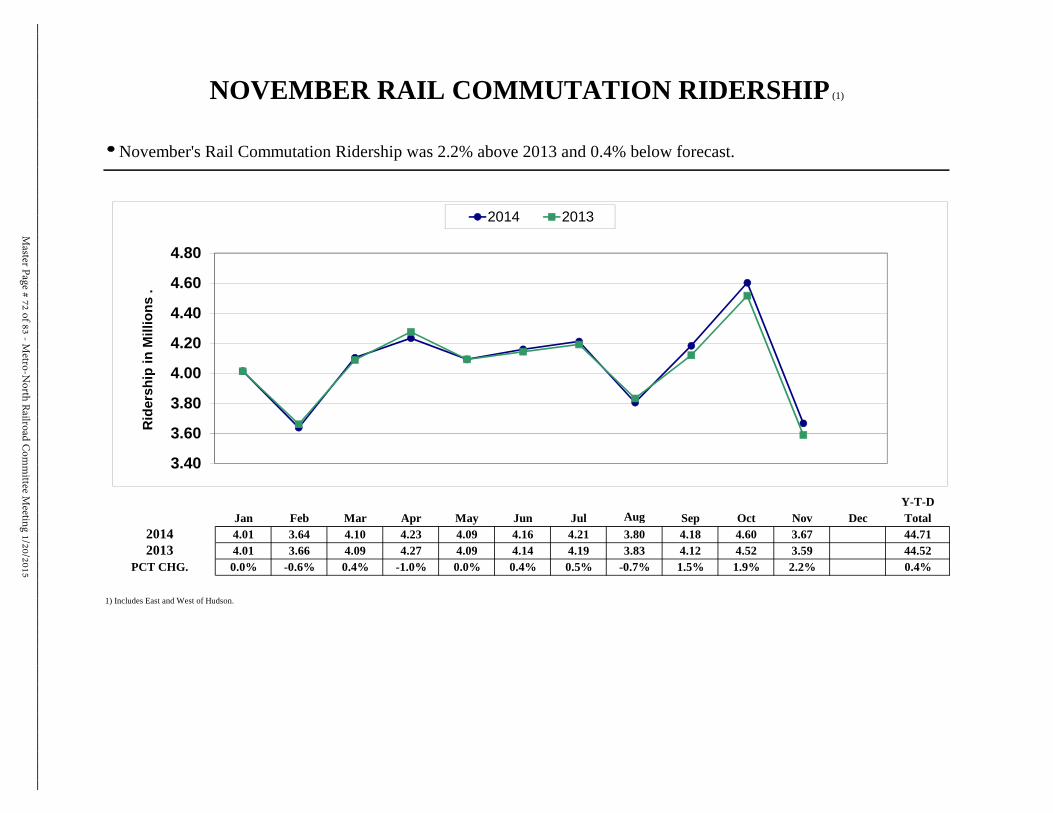
November's Rail Commutation Ridership was 2.2% above 2013 and 0.4% below forecast.
Y-T-DJan Feb Mar Apr May Jun Jul Aug Sep Oct Nov Dec Total4.01 3.64 4.10 4.23 4.09 4.16 4.21 3.80 4.18 4.60 3.67 44.714.01 3.66 4.09 4.27 4.09 4.14 4.19 3.83 4.12 4.52 3.59 44.520.0% -0.6% 0.4% -1.0% 0.0% 0.4% 0.5% -0.7% 1.5% 1.9% 2.2% 0.4%
1) Includes East and West of Hudson.
NOVEMBER RAIL COMMUTATION RIDERSHIP (1)
20142013
PCT CHG.
3.40
3.60
3.80
4.00
4.20
4.40
4.60
4.80
Rid
ersh
ip in
Mill
ions
.
2014 2013
Master Page # 72 of 83 - M
etro-North Railroad C
omm
ittee Meeting 1/20/2015
________________________________________________________________________________

November's Rail Non-Commutation Ridership was 3.9% above 2013 and 2.4% below forecast.
Y-T-DJan Feb Mar Apr May Jun Jul Aug Sep Oct Nov Dec Total2.51 2.33 2.72 2.93 3.08 3.20 3.31 3.27 3.03 3.05 3.02 32.452.66 2.34 2.87 2.83 2.94 3.11 3.11 3.13 2.85 2.87 2.91 31.62
-5.7% -0.4% -5.3% 3.3% 4.5% 2.8% 6.4% 4.6% 6.4% 6.4% 3.9% 2.6%
1) Includes East and West of Hudson.
NOVEMBER RAIL NON-COMMUTATION RIDERSHIP (1)
20142013
PCT CHG.
2.002.202.402.602.803.003.203.403.60
Rid
ersh
ip in
Mill
ions
.
2014 2013
Master Page # 73 of 83 - M
etro-North Railroad C
omm
ittee Meeting 1/20/2015
________________________________________________________________________________

November's Total Rail Revenue was 12.5% above 2013 and 2.3% below forecast.
Y-T-DJan Feb Mar Apr May Jun Jul Aug Sep Oct Nov Dec Total
$50.7 $48.4 $52.8 $54.5 $56.2 $58.0 $58.8 $56.6 $56.0 $56.9 $56.0 $605.0$48.2 $45.1 $53.2 $52.7 $53.7 $56.1 $55.8 $54.9 $52.7 $53.7 $49.8 $576.05.1% 7.3% -0.7% 3.4% 4.7% 3.4% 5.4% 3.1% 6.3% 5.9% 12.5% 5.0%
1) Includes East and West of Hudson.
NOVEMBER RAIL REVENUE (1)
20142013
PCT CHG.
$44.0$46.0$48.0$50.0$52.0$54.0$56.0$58.0$60.0
($ In
Mill
ions
).
2014 2013
Master Page # 74 of 83 - M
etro-North Railroad C
omm
ittee Meeting 1/20/2015
________________________________________________________________________________
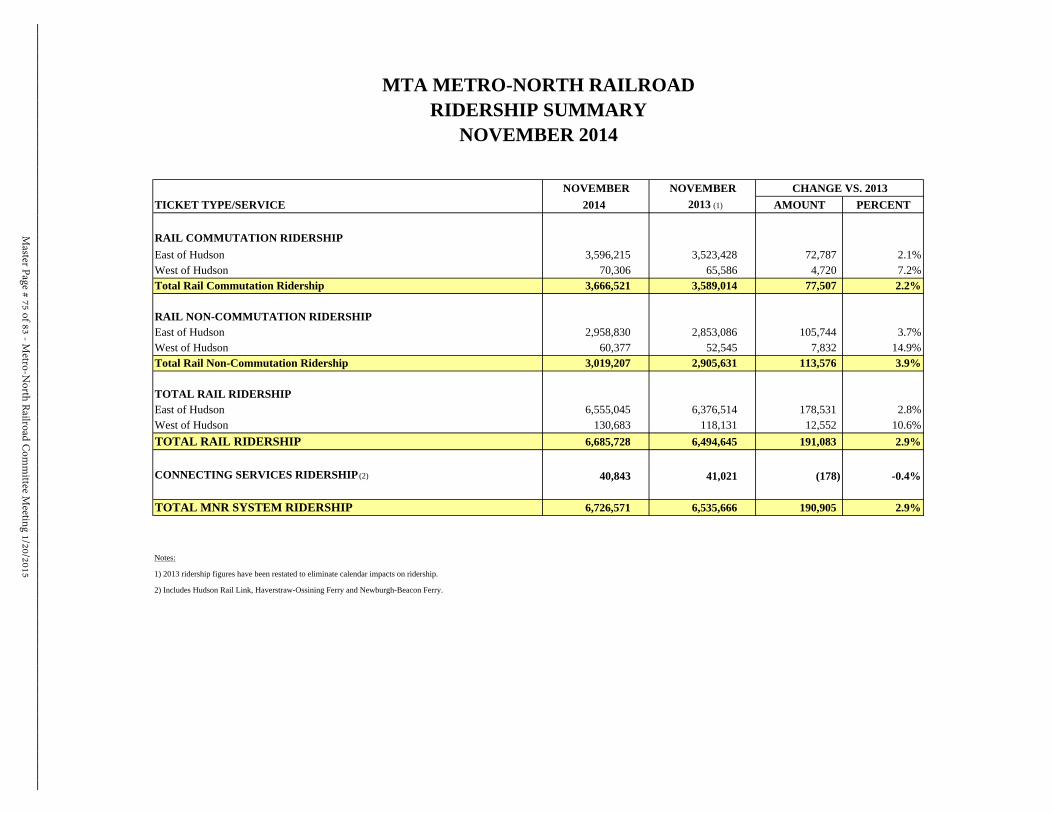
TICKET TYPE/SERVICE 2014 AMOUNT PERCENT
RAIL COMMUTATION RIDERSHIP East of Hudson 3,596,215 3,523,428 72,787 2.1%West of Hudson 70,306 65,586 4,720 7.2%Total Rail Commutation Ridership 3,666,521 3,589,014 77,507 2.2%
RAIL NON-COMMUTATION RIDERSHIPEast of Hudson 2,958,830 2,853,086 105,744 3.7%West of Hudson 60,377 52,545 7,832 14.9%Total Rail Non-Commutation Ridership 3,019,207 2,905,631 113,576 3.9%
TOTAL RAIL RIDERSHIPEast of Hudson 6,555,045 6,376,514 178,531 2.8%West of Hudson 130,683 118,131 12,552 10.6%TOTAL RAIL RIDERSHIP 6,685,728 6,494,645 191,083 2.9%
CONNECTING SERVICES RIDERSHIP (2) 40,843 41,021 (178) -0.4%
TOTAL MNR SYSTEM RIDERSHIP 6,726,571 6,535,666 190,905 2.9%
Notes:
1) 2013 ridership figures have been restated to eliminate calendar impacts on ridership.
2) Includes Hudson Rail Link, Haverstraw-Ossining Ferry and Newburgh-Beacon Ferry.
2013 (1)
MTA METRO-NORTH RAILROADRIDERSHIP SUMMARY
NOVEMBER 2014
NOVEMBER NOVEMBER CHANGE VS. 2013
Master Page # 75 of 83 - M
etro-North Railroad C
omm
ittee Meeting 1/20/2015
________________________________________________________________________________

TICKET TYPE/SERVICE AMOUNT PERCENT
RAIL COMMUTATION RIDERSHIP East of Hudson 43,822,598 43,688,630 133,968 0.3%West of Hudson 885,517 830,581 54,936 6.6%Total Rail Commutation Ridership 44,708,115 44,519,211 188,904 0.4%
RAIL NON-COMMUTATION RIDERSHIPEast of Hudson 31,796,079 31,018,510 777,569 2.5%West of Hudson 652,777 605,350 47,427 7.8%Total Rail Non-Commutation Ridership 32,448,856 31,623,860 824,996 2.6%
TOTAL RAIL RIDERSHIPEast of Hudson 75,618,677 74,707,140 911,537 1.2%West of Hudson 1,538,294 1,435,931 102,363 7.1%TOTAL RAIL RIDERSHIP 77,156,971 76,143,071 1,013,900 1.3%
CONNECTING SERVICES RIDERSHIP (2) 491,430 502,840 (11,410) -2.3%
TOTAL MNR SYSTEM RIDERSHIP 77,648,401 76,645,911 1,002,490 1.3%
Notes:
1) 2013 ridership figures have been restated to eliminate calendar impacts on ridership.
2 Includes Hudson Rail Link, Haverstraw-Ossining Ferry and Newburgh-Beacon Ferry.
RIDERSHIP SUMMARY2014 YEAR-TO-DATE
2014 2013 CHANGE VS. 2013
MTA METRO-NORTH RAILROAD
YTD YTD (1)
Master Page # 76 of 83 - M
etro-North Railroad C
omm
ittee Meeting 1/20/2015
________________________________________________________________________________
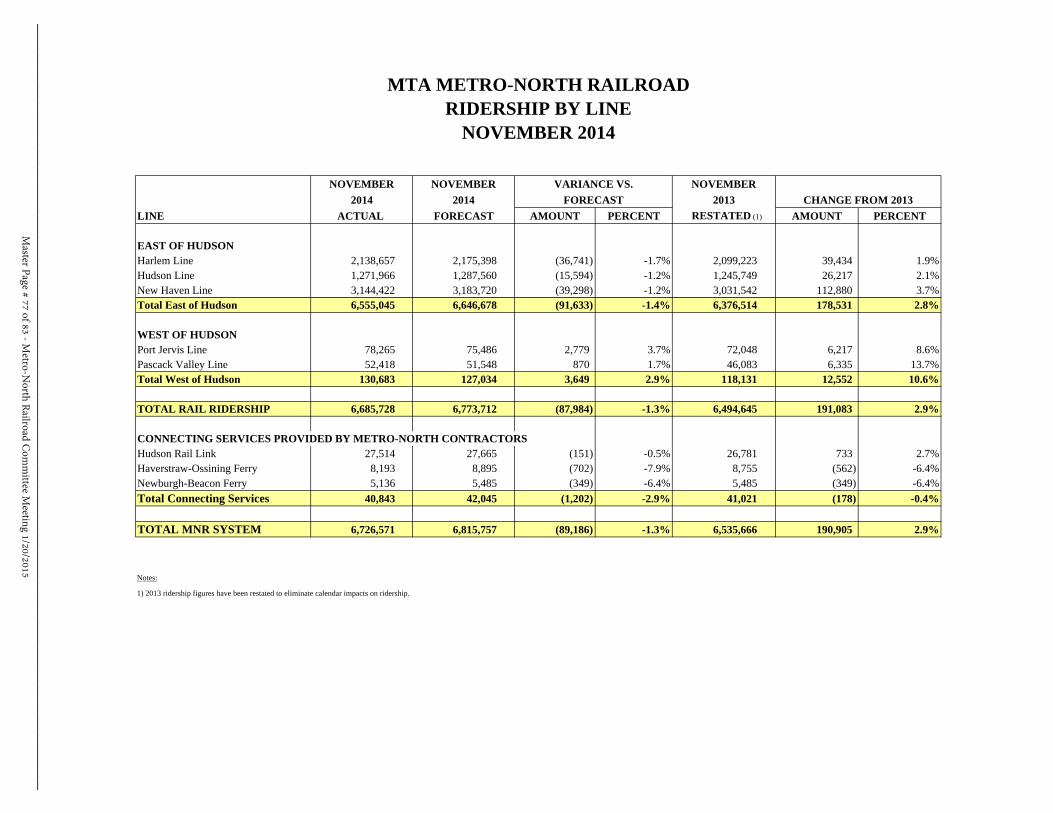
LINE AMOUNT PERCENT AMOUNT PERCENT
EAST OF HUDSONHarlem Line 2,138,657 2,175,398 (36,741) -1.7% 2,099,223 39,434 1.9%Hudson Line 1,271,966 1,287,560 (15,594) -1.2% 1,245,749 26,217 2.1%New Haven Line 3,144,422 3,183,720 (39,298) -1.2% 3,031,542 112,880 3.7%Total East of Hudson 6,555,045 6,646,678 (91,633) -1.4% 6,376,514 178,531 2.8%
WEST OF HUDSONPort Jervis Line 78,265 75,486 2,779 3.7% 72,048 6,217 8.6%Pascack Valley Line 52,418 51,548 870 1.7% 46,083 6,335 13.7%Total West of Hudson 130,683 127,034 3,649 2.9% 118,131 12,552 10.6%
TOTAL RAIL RIDERSHIP 6,685,728 6,773,712 (87,984) -1.3% 6,494,645 191,083 2.9%
CONNECTING SERVICES PROVIDED BY METRO-NORTH CONTRACTORSHudson Rail Link 27,514 27,665 (151) -0.5% 26,781 733 2.7%Haverstraw-Ossining Ferry 8,193 8,895 (702) -7.9% 8,755 (562) -6.4%Newburgh-Beacon Ferry 5,136 5,485 (349) -6.4% 5,485 (349) -6.4%Total Connecting Services 40,843 42,045 (1,202) -2.9% 41,021 (178) -0.4%
TOTAL MNR SYSTEM 6,726,571 6,815,757 (89,186) -1.3% 6,535,666 190,905 2.9%
Notes:
1) 2013 ridership figures have been restated to eliminate calendar impacts on ridership.
CHANGE FROM 2013ACTUAL FORECAST RESTATED (1)
2014 2014 FORECAST 2013
MTA METRO-NORTH RAILROADRIDERSHIP BY LINE
NOVEMBER 2014
NOVEMBER NOVEMBER VARIANCE VS. NOVEMBER
Master Page # 77 of 83 - M
etro-North Railroad C
omm
ittee Meeting 1/20/2015
________________________________________________________________________________

TICKET TYPE/SERVICE AMOUNT PERCENT AMOUNT PERCENT
EAST OF HUDSONHarlem Line 24,729,186 24,699,605 29,581 0.1% 24,589,666 139,520 0.6%Hudson Line 14,817,206 14,660,011 157,195 1.1% 14,588,969 228,237 1.6%New Haven Line 36,072,285 35,813,578 258,707 0.7% 35,528,505 543,780 1.5%Total East of Hudson 75,618,677 75,173,194 445,483 0.6% 74,707,140 911,537 1.2%
WEST OF HUDSONPort Jervis Line 930,367 926,192 4,175 0.5% 896,923 33,444 3.7%Pascack Valley Line 607,927 591,273 16,654 2.8% 539,008 68,919 12.8%Total West of Hudson 1,538,294 1,517,465 20,829 1.4% 1,435,931 102,363 7.1%
TOTAL RAIL RIDERSHIP 77,156,971 76,690,659 466,312 0.6% 76,143,071 1,013,900 1.3%
CONNECTING SERVICES PROVIDED BY METRO-NORTH CONTRACTORSHudson Rail Link 332,436 335,411 (2,975) -0.9% 323,700 8,736 2.7%Haverstraw-Ossining Ferry 101,566 118,540 (16,974) -14.3% 116,673 (15,107) -12.9%Newburgh-Beacon Ferry 57,428 62,467 (5,039) -8.1% 62,467 (5,039) -8.1%Total Connecting Services 491,430 516,418 (24,988) -4.8% 502,840 (11,410) -2.3%
TOTAL MNR SYSTEM 77,648,401 77,207,077 441,324 0.6% 76,645,911 1,002,490 1.3%
Notes:
1) 2013 ridership figures have been restated to eliminate calendar impacts on ridership.
ACTUAL FORECAST RESTATED (1)
FORECAST YTD
2014 YEAR-TO-DATE
2014 2014 VARIANCE VS. 2013CHANGE FROM 2013YTD YTD
MTA METRO-NORTH RAILROADRIDERSHIP BY LINE
Master Page # 78 of 83 - M
etro-North Railroad C
omm
ittee Meeting 1/20/2015
________________________________________________________________________________
Capital Program Report
January 2015
Master Page # 79 of 83 - Metro-North Railroad Committee Meeting 1/20/2015
________________________________________________________________________________

CAPITAL PROGRAM
HIGHLIGHTS
January 20, 2015
STATIONS/PARKING/FACILITIES
North White Plains Station Access and Parking Garage (Design-Build) Construction of the new utility building rooms is substantially complete. Switchover of utilities for the new utility building is ongoing: installation of new Con Edison gas meter and activation of new gas service are complete; testing and commissioning of fire alarm and suppression systems are complete; and commissioning of the boilers is underway. Station improvements work: station entrance sign and gutter and fascia installation is pending. Poughkeepsie Station Improvements
Design consultant submitted 30% design documents and are under review by MNR stakeholders. Fordham Station Improvements At the inbound platform: Canopy steel, platform gutter, timber rub board and roof installation are complete. Permanent conduit installation continues. At the outbound platform: canopy steel installation, concrete pedestal placement, and compacted sub-base for platform widening are in progress. Concrete curb installation, permanent conduit installation and roofing continue. Harlem Line Station Renewal for Select Components
Phase I Stations (Botanical Gardens, Williams Bridge, and Woodlawn): Design continues to advance to the 95% level. Construction of Phase I Stations is deferred to first quarter of 2016; until after the completion of CP109. Phase II stations design (Wakefield, Mount Vernon West, Fleetwood, Bronxville, and Tuckahoe): design has been put on hold at this time and will be resumed in the third quarter of 2016.
POWER
Power & Communication & Signals Infrastructure Restoration Phase I & II – Sandy The procurement process to acquire a design-build team to perform the required infrastructure restoration services continues. Power Infrastructure Restoration – Substations – Sandy Construction contract was executed in December, 2014.
Master Page # 80 of 83 - Metro-North Railroad Committee Meeting 1/20/2015
________________________________________________________________________________
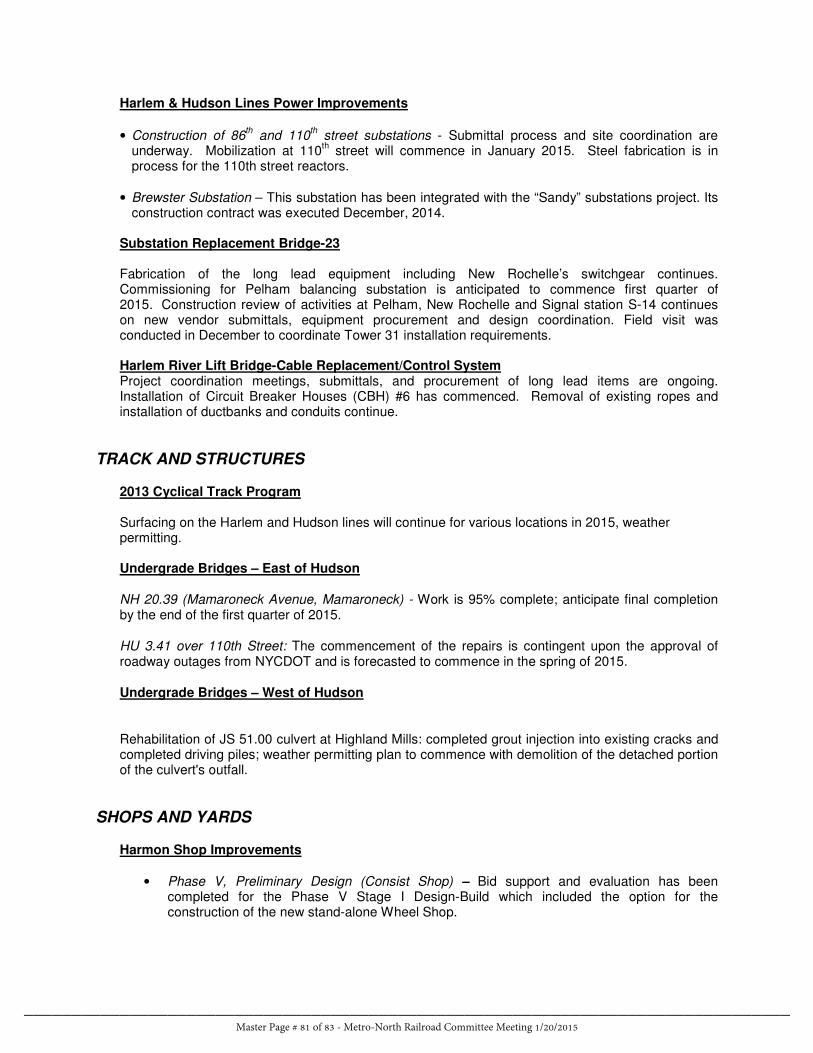
Harlem & Hudson Lines Power Improvements
• Construction of 86th and 110
th street substations - Submittal process and site coordination are
underway. Mobilization at 110th street will commence in January 2015. Steel fabrication is in
process for the 110th street reactors.
• Brewster Substation – This substation has been integrated with the “Sandy” substations project. Its construction contract was executed December, 2014.
Substation Replacement Bridge-23 Fabrication of the long lead equipment including New Rochelle’s switchgear continues. Commissioning for Pelham balancing substation is anticipated to commence first quarter of 2015. Construction review of activities at Pelham, New Rochelle and Signal station S-14 continues on new vendor submittals, equipment procurement and design coordination. Field visit was conducted in December to coordinate Tower 31 installation requirements. Harlem River Lift Bridge-Cable Replacement/Control System Project coordination meetings, submittals, and procurement of long lead items are ongoing. Installation of Circuit Breaker Houses (CBH) #6 has commenced. Removal of existing ropes and installation of ductbanks and conduits continue.
TRACK AND STRUCTURES
2013 Cyclical Track Program Surfacing on the Harlem and Hudson lines will continue for various locations in 2015, weather permitting.
Undergrade Bridges – East of Hudson
NH 20.39 (Mamaroneck Avenue, Mamaroneck) - Work is 95% complete; anticipate final completion by the end of the first quarter of 2015.
HU 3.41 over 110th Street: The commencement of the repairs is contingent upon the approval of roadway outages from NYCDOT and is forecasted to commence in the spring of 2015.
Undergrade Bridges – West of Hudson
Rehabilitation of JS 51.00 culvert at Highland Mills: completed grout injection into existing cracks and completed driving piles; weather permitting plan to commence with demolition of the detached portion of the culvert's outfall.
SHOPS AND YARDS
Harmon Shop Improvements
• Phase V, Preliminary Design (Consist Shop) – Bid support and evaluation has been completed for the Phase V Stage I Design-Build which included the option for the construction of the new stand-alone Wheel Shop.
Master Page # 81 of 83 - Metro-North Railroad Committee Meeting 1/20/2015
________________________________________________________________________________

• Phase V, Stage I Design-Build – Contract was executed to design-build team in December, 2014. Kickoff meeting has been scheduled for January 2015. The Construction Management contract was also executed in December 2014 with an early January 2015 kick-off meeting.
Employee Welfare & Storage Facilities Work is 100% complete for the replacement of the lower roofs of the Maintenance of Way building. The Maintenance of Equipment facility roof is 95% complete.
GRAND CENTRAL TERMINAL
Grand Central Terminal Train Shed Rehabilitation Project kicked-off and submittal process is underway. Mobilization to commence with start of construction planned for February 2015. GCT Elevators Rehabilitation Phase 4
Submittal process and site coordination are underway. Mobilization is scheduled to commence mid-January 2015. GCT Utilities Domestic Water System - The 49th Street Tank and its pump set were successfully tested, commissioned, and is online. Installation of the pipe bypasses in the service plant is underway in preparation for decommissioning the 43rd Street tank.
Fire Suppression Design – 90% fire suppression design continues. GCT Leaks Remediation Repair work commenced at the northern part of GCT old Taxi stand. Removal of existing asphalt paver in old Taxi stand and the asbestos at 45th Street Bridge will commence in January 2015.
ROLLING STOCK
M-8 Car Program As of December 31, 2014, 189 Married pairs or 378 cars have been conditionally accepted and placed into revenue service. As of December 31, 2014, 2 Single Cars (S-Cars) have been conditionally accepted and placed into revenue service.
Master Page # 82 of 83 - Metro-North Railroad Committee Meeting 1/20/2015
________________________________________________________________________________

2014 MNR Capital Program Goals
As of December 31, 2014In Millions
$264.4
$542.4
$173.3$170.6
$143.8$106.4
Commitments Completions Closeouts
2014 Goals Actual as of December 31, 2014 Forecast : December 31, 2014
AnnualGoal
AnnualGoal
Actual 2014(205% of Goal)
Actual 2014 (98 % of Goal)
AnnualGoal
Actual 2014(74% of Goal)
Master Page # 83 of 83 - M
etro-North Railroad C
omm
ittee Meeting 1/20/2015
________________________________________________________________________________