Meeting Between Federa Reservl Boare d Staf anf d ... · Meeting Between Federa Reservl Boare d...
23
Meeting Between Federal Reserve Board Staff and Representatives of Lazard November 2, 2010 Participants: Scott G. Alvarez, William E. Charwat, Kieran J. Fallon, Michael Schussler, and Mark Van Der Weide (Federal Reserve Board) Michael J. Castellano (Lazard), Scott D. Hoffman (Lazard), Sara A. Kelsey (WilmerHale), Elizabeth Derbes (WilmerHale), H. Rodgin Cohen (Sullivan & Cromwell) Summary: Staff of the Federal Reserve Board met with representatives of Lazard to discuss the application of Section 618 of the Dodd-Frank Wall Street Reform and Consumer Protection Act, providing for the registration with the Board of securities holding companies. A copy of the handout provided by Lazard is attached below.
Transcript of Meeting Between Federa Reservl Boare d Staf anf d ... · Meeting Between Federa Reservl Boare d...

Meeting Between Federal Reserve Board Staff and Representatives of Lazard
November 2, 2010
Participants: Scott G. Alvarez, William E. Charwat, Kieran J. Fallon, Michael Schussler, and Mark Van Der Weide (Federal Reserve Board)
Michael J. Castellano (Lazard), Scott D. Hoffman (Lazard), Sara A. Kelsey (WilmerHale), Elizabeth Derbes (WilmerHale), H. Rodgin Cohen (Sullivan & Cromwell)
Summary: Staff of the Federal Reserve Board met with representatives of Lazard to discuss the application of Section 618 of the Dodd-Frank Wall Street Reform and Consumer Protection Act, providing for the registration with the Board of securities holding companies. A copy of the handout provided by Lazard is attached below.

Lazard Company Over view October 2010

Disclaimer
This presentation contains certain statements, estimates and forecasts with respect to future performance and events. These statements, estimates and forecasts are "forward-looking statements". In some cases, forward-looking statements can be identified by the use of forward-looking terminology such as "may," "might/' "will/' "should," "expect," "plan," "anticipate," "believe," "estimate," "predict/7 "potential" or "continue" or the negatives thereof or variations (hereon or similar terminology. Ml statements other than statements of historical fact included in this presentation are forward-looking statements and are based on various underlying assumptions and expectations and are subject to known and unknown risks and uncertainties, and may include projections of our future financial performance based on our growth strategies and anticipated trends in our business. These statements are based on our current expectations and projections about future events. There are important factors that could cause our actual results, level of activity, performance or achievements to differ materially from the results, level o f activity, performance or achievements expressed or implied in the forward-looking statements. These factors include, but are not limited to, those discussed in our Annual Report on Form 10-K under Item 1A "Risk Factors," and also disclosed from time to time in our quarterly reports on Form 10-Q and current reports on Form 8-K, including the following: (a) a decline in general economic conditions or the global financial markets, (b) losses caused by financial or other problems experienced by third parties, (c) losses due to unidentified or unanticipated risks, (d) a lack o f liquidity, i.e.. ready access to funds for use in our businesses, and (e) competitive pressure on our business and on out ability to retain our employees. As a result, there can be no assurance that the forward-looking statements included in this presentation will prove to be accurate or correct. In light of these risks, uncertainties and assumptions, the future performance or events described in the forward-looking statements in this presentation might not occur. Accordingly, vou should not relv upon forward-looking statements as a prediction of actual results and we do not assume any responsibility for the accuracy or completeness of any o f these forward-looking statements. We do not undertake any obligation to, and will nor, update any forward-looking statements, whether as a result of new information, future events or otherwise.

Key Investment Highlights
Leadership team committed to model, strategy and vision
Simple model of Financial Advisory and Asset Management has proven powerful and resilient over time
Performance underscores the power of our advice driven, intellectual capital, low risk model
Record revenue for the first nine months of 2010, with nearly 30% growth in M&A and Strategic Advisory and record assets under management
Positioned well for long-term growth in both developed and developing markets
Strong financial and liquidity position
Positioned to Drive Value For Shareholders

Intellectual Capital Model - Positioned for Growth Lazard Established 1848
Financial Advisory- Largest global independent financial advisory firm
Deep and wide reservoir of senior bankers globally
Geographic reach and industry coverage comparable to much larger firms and broader than boutiques
Market-leading Restructuring practice
Asset Management-World class global institutional asset manager
90% institutional; 82% equities
Geographically balanced client base (46%/54% International/US)
Record AUM1 of $143.6bn
$l.lbn in net inflows in 3Q2010, with $6.2bn in YTD through 3Q2010
Strong Franchise — Simple and Powerful Strategy

Global Presence, Local Relationships Lazard Global Presence, Local Relationships United States- New York, San Francisco, Chicago, Houston, Los Angeles, Boston, Washington, D.C., Minneapolis, Charlotte,N.C. China- Hong Kong, Beijing. Canada, United Kingdom,Japan, Singapore France-Paris, Bordeaux, Lyon Korea, Italy, India Germany-Frankfurt, Hamburg United Arab Emirates Spain, Sweden Australia-Syndney, Melbourne, Perth Benelux, SwitzerlandBrazil-Signaturalzard 50:50 JV Latin America-Buenos Aires, Montevideo Santiago, Panama City, Bogota, Lima, MBA Lazard. Financial Advisory-130 MDs North America 402 Professionals Europe/Middle East 335 Professionals Asia Australia 73 Professionals Strategic Alliances for Central Eastern Europe Mexico Russia. Asset Management 64 MDs North America 195 Professionals Europe 139 Professionals Asia Australia 42 Professionals
Only Global-Scale Independent Advisory Firm

Balanced Across Geography And Business Lines
LTM 1 Revenue by Geography Balanced Across Geography and Business lines LTM Revenue By Geography Footnote 1. (Footnote listed below). North America 56%. Europe 37% Rest of World 7%. (Note: Represents operating revenue from Financial Advisory and Asset Management segments (excludes Corporate). Latest twelve months ended September 30, 2010. LMT Revenue by Business Line. Foot note 1. (Footnote listed below). Asset Management 42%. Financial Advisory 58%. (Note: Represents operating revenue from Financial Advisory and Asset Management segments (excludes Corporate). Latest twelve months ended September 30, 2010. Unique World Glass Advisory Firm With scale.

Continued Improvement in Revenue and AUM
Quarterly Operating Revenue ($mm) 4Q 2008:Advisory Revenue:$240:Management Fees:$108:Other:$50 1Q 2009:Advisory Revenue:$157:Management Fees:$94:Other:$10 2Q 2009:Advisory Revenue:$228:Management Fees:$107:Other:$45 3Q 2009:Advisory Revenue:$244:Management Fees:$133:Other:$35 4Q 2009:Advisory Revenue:$274:Management Fees:$153:Other:$110 1Q 2010:Advisory Revenue:$269:Management Fees:$162:Other:$6 2Q 2010:Advisory Revenue:$246:Management Fees:$167:Other:$4 3Q 2010:Advisory Revenue:$254:Management Fees:$184:Other:$25 Quarterly AUM ($BN) 4Q 2008:$91 1Q 2009:$81 2Q 2009:$98 3Q 2009:$120 4Q 2009:$130 1Q 2010:$135 2Q 2010:$123 3Q 2010:$144 Net Flows: 4Q 2008:($2.2) 1Q 2009:($2.4) 2Q 2009:$0.4 3Q 2009:$7.7 4Q 2009:$4.6 1Q 2010:$3.0 2Q 2010:$2.1 3Q 2010:$1.1

Opportunities For Growth
Revenue Growth
Global platform capturing capital shifts and M&A activity in developed and developing markets
Meeting demand for independent, unconflicted advice
Broadening range of strategic advisory services
Expanding reach in emerging geographies
Capturing benefits of global diversification in Asset Management
Building client relationships and winning new mandates
Providing a wide range of investment solutions
Strong Financial And Liquidity Position
Solid low-risk balance sheet
Over $1 billion in cash and liquid investments
N o scheduled long-term debt maturities before May 2015
N o principal trading or lending book
Long-term debt of $1,227, down $511 since April 2008
Stockholders' equity of $488'
Business model generates significant annual cash flow

Financial Advisory

Financial Advisory Summary Operating Revenue:YTD (First 9 Months) 2005:$627 2006:$671 2007:$847 2008:$772 2009:$677 YTD 10:$769
Summary Operating revenue up 14% over first nine months 2009
Increase of $119.5 in M&A, Strat. Adv., Capital Markets and Other Adv. revenue (up 30%), partially offset by $27.2 decrease in Restructuring revenue (down 10%)
Long-established, experienced local Leadership in each region globally
Global leader in restructuring advisory
Involved in some of the most important government and sovereign assignments

D i v e r s i f i e d F i n a n c i a l A d v i s o r y B u s i n e s s LTM 1 (Footnote under the following information) M&A Revenue by Industry:Real Estate: 5% Government 6% Power and Energy 8%Healthcare 10% Industrials 26% FIG 14% Consumer 15%TMT 16% Diversified geographically with 55% in North America, 40% in Europe and 5% in Rest of World. Diversified client base2:475 total clients 177 clients > $1 million in fees, Top ten fee paying clients constituted 22% of segment net revenues Industry coverage bolstered since 2008 with senior hires in Capital Structure Advisory; Financial Sponsors; Retail; Aerospace & Defense; Metals & Mining; Healthcare; Power, Energy & Infrastructure; Telecom. Foot note 1: Latest twelve months ended September 30, 2010 Foot note 2: For the nine months ended September 30, 2010.
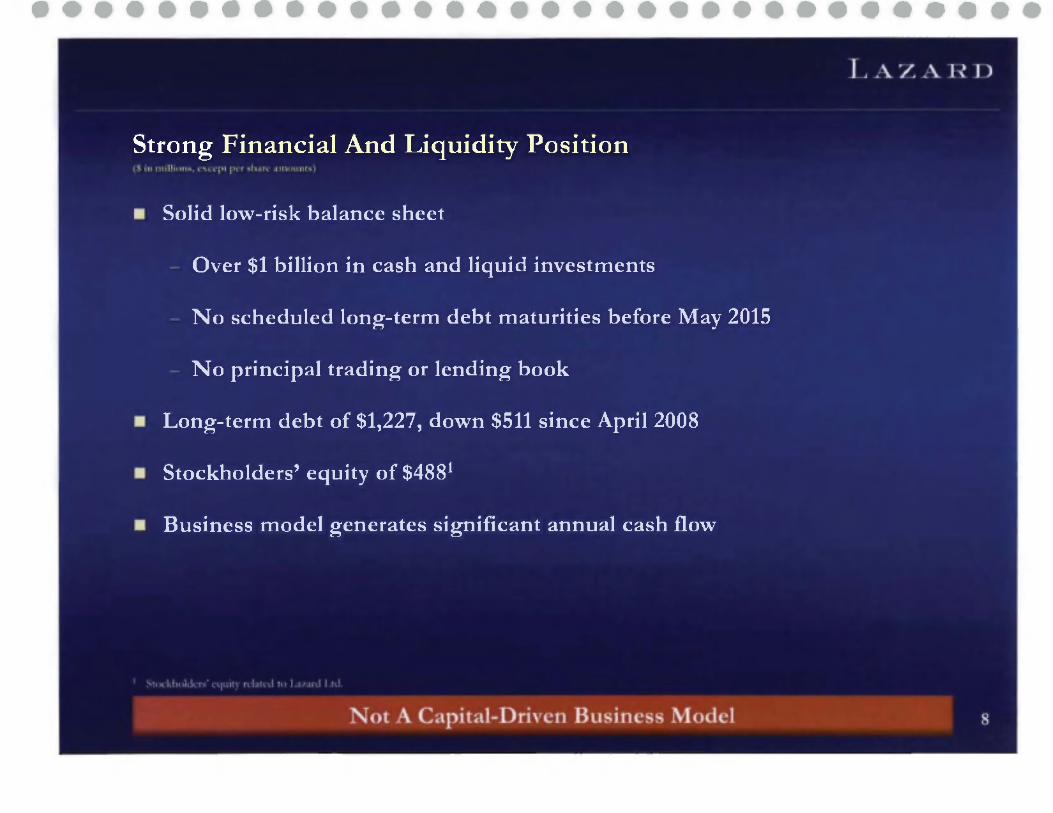
Market Leading Restructuring Practice Debtor Market Share 25 Largest Chapter 11 Bankruptcies 1 (Foot note one listed below) Lazard 40% Miller Buckfire 12% Moelis 12% Evercore 8% Perella Weinberg 8% Greenhill 8% Rothschild 4% Blackstone 4% Houlihan Lokey 4% Most experienced team advised on more than 500 restructurings world wide over the past decade. Strategic focus on large debtor side assignments Leading market share: advised on: 19 of the 25 1 (See foot note one listed after this information). largest bankruptcies since the beginning of 2009, including 10 (40%) of the debtors. All of the 10 foot note 1 (See foot note one listed after this information) largest 2009 bankruptcies, including 5 (50%) of the debtors. Majority of assignments are non-bankruptcy and one-third are outside the U.S. 60 assignments currently active. Foot note: Source Bankruptcy data.com Foot note 1: Reflects largest public Chapter 11s since 2009, excludes Banks and Savings and Loans.

Asset Management

A s s e t M a n a g e m e n t S u m m a r y Operating Revenue YTD (First 9 Months) 2005:$324 2006:$374 2007:$486 2008:$5032009:$392 YTD10:$579 Summary Record operating revenue and continued positive net inflows. 3Q10 operating revenue increased 32% over 3Q09 and nine months ended 3Q10 operating revenue increased 48% over nine months ended 3Q09. Net inflows of $6.2 billion in nine months ended 3Q10 across a broad range of products. Assets under management of $143.6 billion Up 19% since September 30, 2009.

A s s e t s U n d e r M a n a g e m e n t 1 ($ in billions)
I m p r o v i n g i n v e s t m e n t p e r f o r m a n c e a n d l a u n c h o f n e w s t r a t e g i e s l e d t o $ 3 7 . 4 i n
n e t i n f l o w s p o s t 2 0 0 5 v s . $ 1 0 . 8 i n n e t o u t f l o w s i n t h e f i v e y e a r s p r i o r t o 2 0 0 5
N e t i n f l o w s o f $ 6 . 2 i n n i n e m o n t h s e n d e d 3 Q 1 0 2001:$73 2002:$64 2003:$782004:$86 2005:$88 2006:$110 2007:$141 2008:$91 2009:$130 YTD10:$144 Net Inflows/ (Outflows) 2001:$1.6 2002:($3.6) 2003:($1.1) Outflow of ($10.8) 2004:($3.5) 2005:($4.2) 2006:$2.8 2007:$16.72008:$1.4 Outflow of $37.4 2009:$10.3 YTD10:$6.2 (Foot note one as of period one.)
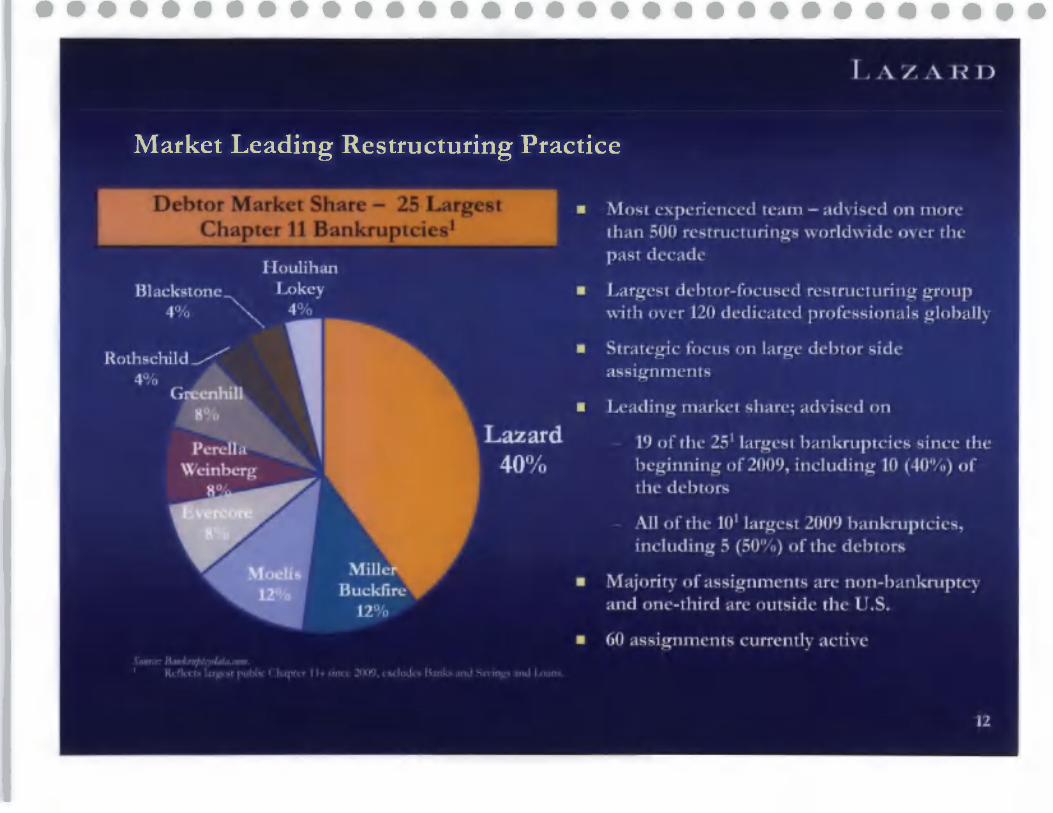
Increasingly Global Client Base1 (Foot note information is listed below) AUM in 2004: $86.4 bn North America:58% Europe: 31% Asia-Pacific:11% UK: 9% France:12% Germany: 9% Italy:1%Australia:8% Japan:3% AUM Today:$143.6 bn North America:54% UK:15% Europe:31% France:9%Germany:7% Korea:1% Asia-Pacific:15%Australia:11% Japan:3% Selected Offices: Asia Pacific:Hong Kong,Seoul,Sydney,Tokyo Europe:Frankfurt/Hamburg,London,Milan,ParisNorth America:Boston,New York,San Francisco Europe and Asia-Pacific AUM (% of Total) UK:2004:9% UK:Today:15% France:2004:12% France:Today:9 Germany:2004:9%Germany:Today:7%Italy:2004:1% Italy:Today:0% Australia:2004:8% Australia:Today:11% Japan:2004:3%Japan:Today:3%Korea:2004:0% Korea:Today:1% Foot note one: Represents AUM by domicile (refers to location of client servicing office). "Today" breakdown as of September 30, 2010.

Summary Financials

Note
Lazard believes that pro forma results assuming full exchange of outstanding exchangeable interests and results excluding special charges provide the most meaningful basis for comparison among present, historical and future periods.
The Company's quarterly revenue and profits can fluctuate materially depending on the number, size and timing of completed transactions on which it advised, as well as seasonality and other factors. Accordingly, the revenues and profits in any particular quarter may not be indicative of future results. As such, Lazard management believes that annual results are the most meaningful.
Lazard discloses certain non-GAAP financial information, which management believes provides the most meaningful basis for comparison among present, historical and future periods. The following are non-GAAP measures used in the accompanying financial information: net income assuming full exchange of exchangeable interests (or fully exchanged basis); operating revenue; non-controlling interests assuming full exchange of exchangeable interests; and net income excluding restructuring charge.
A reconciliation to GAAP is provided in the schedules attached to our third-quarter 2010 earnings release which can be found on our website at www.Lazard.com.

Selected Financial Data ($ in Millions, except per share values)
Operating Revenue header row col1: Selected Financial Data: Operating Revenue: ($ in millions, except per share values.) Col2:Nine Months:2010 A 1(Foot note listed below) col3:Nine Months:2009 A 1 (Foot note listed below) col4: Percentages: Inc/Dec Col5:Full Year: 2009A: col6: Full Year:2008A: col7: % Inc/Dec end header row Operating Revenue:Financial Advisory:Nine Months 2010 A:$769.1, Nine Months 2009A:$676.8,% Inc/Dec:14%, Full Year 2009A:$990.3, Full Year 2008A:$1,024.0, % Inc/Dec:(3%). Operating Revenue:Asset Management:Nine Months 2010A:$578.9, Nine Months 2009A:$391.8,% Inc/Dec:48%,Full Year 2009A:596.0, Full Year 2008A:628.6,% Inc/Dec:(5%). Operating Revenue:Core Operating Business Revenue 2 (Foot note listed below): Nine Months 2010A:1,348.0,Nine Months 2009A: 1068.6,% Inc/Dec:26%,Full Year 2009A:1586.3, Full Year 2008A: 1652.6, $ Inc/Dec:(4%). Operating Revenue: Total Operating Revenue:Nine Months 2010A: 1368.4, Nine Months 2009A: 1103.2,% Inc/Dec:24%, Full Year 2009A:1617.6, Full Year 2008A:1675.1,% Inc/Dec: (3%). Operating Income:Nine Months 2010A:$224.0, Nine Months 2009A: $101.9, % Inc/Dec:120%,Full Year 2009A:$27.3,Full Year 2008A: $224.7,% Inc/Dec:(88%) Operating Revenue:Pro Forma Fully Exchanged Basis:Net Income 3 (foot note below):Nine Months 2010A:$176.6, Nine Months 2009A:$65.9,% Inc/Dec:NM, Full Year 2009A: $11.1, Full year 2008A:$196.4:% Inc/Dec:(94%). Operating Revenue:Pro Forma Fully Exchanged Basis:Net Income Per Share 3 (foot note below):Nine Months 2010A:$1.30, Nine Months 2009A:$0.53, % Inc/Dec:NM,Full year 2009A: $0.09, Full Year 2008A:$1.65, %Inc/Dec:(95%) Operating Revenue:Pro Forma Fully Exchanged Basis: Assets Under Managments (in billions):Nine Months 2009A:$143.6,2008A: $120.2:$:19%:2009A:$129.5, 2008A:$91.1:% Inc/Dec:42%. Note: Financials are unaudited. Foot note one: Excludes the restructuring charge in 1Q10 and 1Q09 and acceleration of RSUs in connection with the amendment of the Company's retirement policy in 1Q10. Foot note two:Includes the results of Financial Advisory and Asset Management business, and excludes the results of all investments in Corporate.Foot note three: Refers to net income attributable to Lazard Ltd.

L A Z A R D
C o n d e n s e d B a l a n c e S h e e t
i s i n m i i ( i . . n . s ) header row col1: Condensed Balance Sheet: Assets: ($ in millions, except per share values.) Col2:Sept 30,2010 col3:December 31,2009 end header row Assets:Cash & Cash Equivalents:Sept 30,2010:$847: December 31,2009:$917 Assets:Cash Segregated for Regulatory Purposes:Sept 30,2010:$24 December 31,2009:$20 Assets:Receivables:Sept 30,2010:$788 December 31,2009:$670 Assets:Investments:Sept 30,2010:$712 December 31,2009:$808 Assets:Goodwill and other intangible assets:Sept 30, 2010:$319 December 31,2009:$318 Assets:Other assets:Sept 30,2010:$434 December 31,2009:$415 Assets:total assets:Sept 30,2010:$3,124 December 31,2009:$3148 Liabilities & Stockholders' Deficiency:Deposits and Other Customer Payables:Sept 30,2010:$409: December 31,2009:$322 Liabilities & Stockholders' Deficiency:Accrued Compensation and Benefits: Sept 30,2010:$321:December 31,2009:$515 Liabilities & Stockholders' Deficiency:Miscellaneous Other Liabilities:Sept 30,2010:$531:December 31,2009:$551 Liabilities & Stockholders' Deficiency:Lazard Group Senior Notes:Sept 30,2010:$1,077:December 31,2009:$1,087 Liabilities & Stockholders' Deficiency:Subordinated Loans:Sept 30,2010:$150:December 31,2009:$150 Liabilities & Stockholders' Deficiency:Total Stockholder's Equity 1(foot note one listed below)Sept 30,2010:$636 December 31,2009:$523 Liabilities & Stockholders' Deficiency:Total Liabilities and Stockholders Equity:Sept 30,2010:$3124:December 31,2009:$3148 Note: Financials are unaudited. Foot note one. Attributable to Lazard Ltd: $489 at September 30, 2010 and $355 at December 31, 2009.

L A Z A R D