Meeting africa's infrastructure needs
22
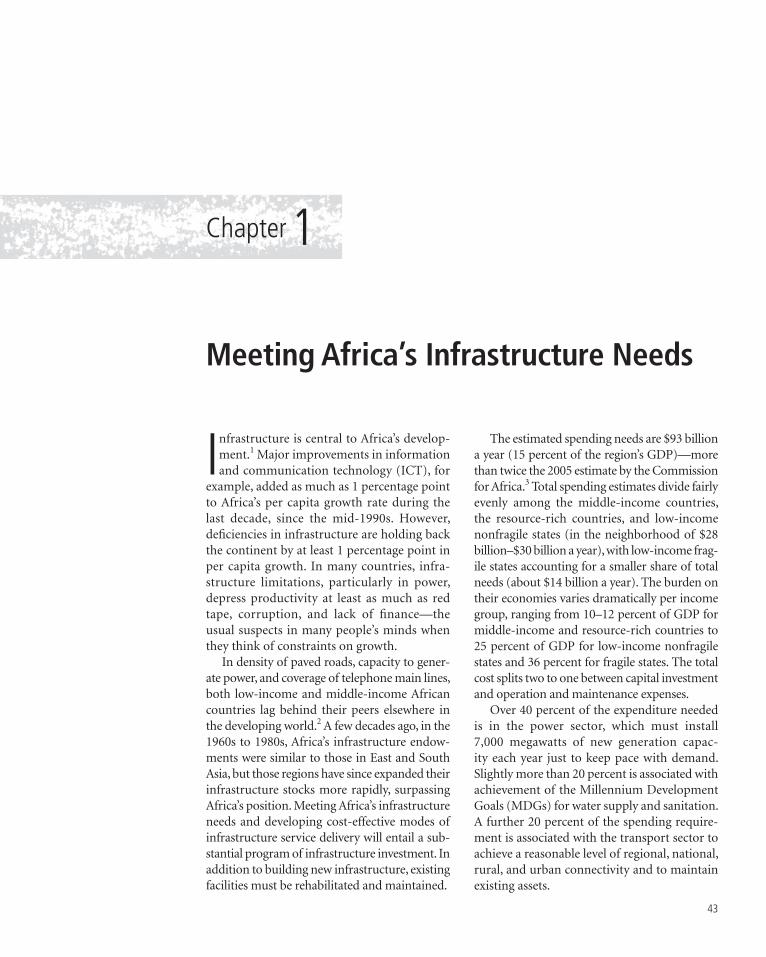
43 Meeting Africa’s Infrastructure Needs I nfrastructure is central to Africa’s develop- ment. 1 Major improvements in information and communication technology (ICT), for example, added as much as 1 percentage point to Africa’s per capita growth rate during the last decade, since the mid-1990s. However, deficiencies in infrastructure are holding back the continent by at least 1 percentage point in per capita growth. In many countries, infra- structure limitations, particularly in power, depress productivity at least as much as red tape, corruption, and lack of finance—the usual suspects in many people’s minds when they think of constraints on growth. In density of paved roads, capacity to gener- ate power, and coverage of telephone main lines, both low-income and middle-income African countries lag behind their peers elsewhere in the developing world. 2 A few decades ago, in the 1960s to 1980s, Africa’s infrastructure endow- ments were similar to those in East and South Asia, but those regions have since expanded their infrastructure stocks more rapidly, surpassing Africa’s position. Meeting Africa’s infrastructure needs and developing cost-effective modes of infrastructure service delivery will entail a sub- stantial program of infrastructure investment. In addition to building new infrastructure, existing facilities must be rehabilitated and maintained. The estimated spending needs are $93 billion a year (15 percent of the region’s GDP)—more than twice the 2005 estimate by the Commission for Africa. 3 Total spending estimates divide fairly evenly among the middle-income countries, the resource-rich countries, and low-income nonfragile states (in the neighborhood of $28 billion–$30 billion a year), with low-income frag- ile states accounting for a smaller share of total needs (about $14 billion a year). The burden on their economies varies dramatically per income group, ranging from 10–12 percent of GDP for middle-income and resource-rich countries to 25 percent of GDP for low-income nonfragile states and 36 percent for fragile states. The total cost splits two to one between capital investment and operation and maintenance expenses. Over 40 percent of the expenditure needed is in the power sector, which must install 7,000 megawatts of new generation capac- ity each year just to keep pace with demand. Slightly more than 20 percent is associated with achievement of the Millennium Development Goals (MDGs) for water supply and sanitation. A further 20 percent of the spending require- ment is associated with the transport sector to achieve a reasonable level of regional, national, rural, and urban connectivity and to maintain existing assets. Chapter 1
-
Upload
dr-lendy-spires -
Category
Government & Nonprofit
-
view
256 -
download
1
Transcript of Meeting africa's infrastructure needs
43
Meeting Africa’s Infrastructure Needs
Infrastructure is central to Africa’s develop-ment.1 Major improvements in information and communication technology (ICT), for
example, added as much as 1 percentage point to Africa’s per capita growth rate during the last decade, since the mid-1990s. However, defi ciencies in infrastructure are holding back the continent by at least 1 percentage point in per capita growth. In many countries, infra-structure limitations, particularly in power, depress productivity at least as much as red tape, corruption, and lack of fi nance—the usual suspects in many people’s minds when they think of constraints on growth.
In density of paved roads, capacity to gener-ate power, and coverage of telephone main lines, both low-income and middle-income African countries lag behind their peers elsewhere in the developing world.2 A few decades ago, in the 1960s to 1980s, Africa’s infrastructure endow-ments were similar to those in East and South Asia, but those regions have since expanded their infrastructure stocks more rapidly, surpassing Africa’s position. Meeting Africa’s infrastructure needs and developing cost-effective modes of infrastructure service delivery will entail a sub-stantial program of infrastructure investment. In addition to building new infrastructure, existing facilities must be rehabilitated and maintained.
The estimated spending needs are $93 billion a year (15 percent of the region’s GDP)—more than twice the 2005 estimate by the Commission for Africa.3 Total spending estimates divide fairly evenly among the middle-income countries, the resource-rich countries, and low-income nonfragile states (in the neighborhood of $28 billion–$30 billion a year), with low-income frag-ile states accounting for a smaller share of total needs (about $14 billion a year). The burden on their economies varies dramatically per income group, ranging from 10–12 percent of GDP for middle-income and resource-rich countries to 25 percent of GDP for low-income nonfragile states and 36 percent for fragile states. The total cost splits two to one between capital investment and operation and maintenance expenses.
Over 40 percent of the expenditure needed is in the power sector, which must install 7,000 megawatts of new generation capac-ity each year just to keep pace with demand. Slightly more than 20 percent is associated with achievement of the Millennium Development Goals (MDGs) for water supply and sanitation. A further 20 percent of the spending require-ment is associated with the transport sector to achieve a reasonable level of regional, national, rural, and urban connectivity and to maintain existing assets.
Chapter1
44 AFRICA’S INFRASTRUCTURE: A TIME FOR TRANSFORMATION
Infrastructure: The Key to Africa’s Faster Growth
African economies have grown at a solid 4 percent annual average in recent years. The fastest growth has been in resource-rich countries, which have benefi ted from rising commodity prices. In almost all cases, how-ever, that performance still falls short of the 7 percent growth needed to achieve substan-tial poverty reduction and attain the MDGs. Although infrastructure has contributed to Africa’s recent economic turnaround, it will need to do even more to reach the continent’s development targets.
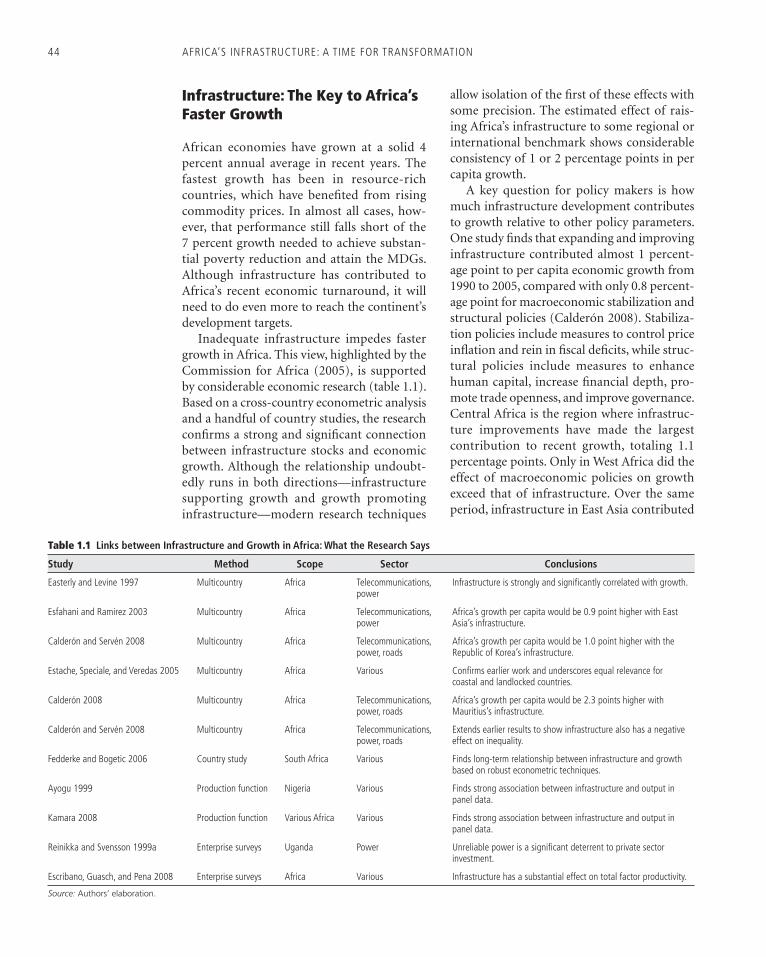
Inadequate infrastructure impedes faster growth in Africa. This view, highlighted by the Commission for Africa (2005), is supported by considerable economic research (table 1.1). Based on a cross-country econometric analysis and a handful of country studies, the research confi rms a strong and signifi cant connection between infrastructure stocks and economic growth. Although the relationship undoubt-edly runs in both directions—infrastructure supporting growth and growth promoting infrastructure—modern research techniques
allow isolation of the fi rst of these effects with some precision. The estimated effect of rais-ing Africa’s infrastructure to some regional or international benchmark shows considerable consistency of 1 or 2 percentage points in per capita growth.
A key question for policy makers is how much infrastructure development contributes to growth relative to other policy parameters. One study fi nds that expanding and improving infrastructure contributed almost 1 percent-age point to per capita economic growth from 1990 to 2005, compared with only 0.8 percent-age point for macroeconomic stabilization and structural policies (Calderón 2008). Stabiliza-tion policies include measures to control price infl ation and rein in fi scal defi cits, while struc-tural policies include measures to enhance human capital, increase fi nancial depth, pro-mote trade openness, and improve governance. Central Africa is the region where infrastruc-ture improvements have made the largest contribution to recent growth, totaling 1.1 percentage points. Only in West Africa did the effect of macroeconomic policies on growth exceed that of infrastructure. Over the same period, infrastructure in East Asia contributed
Table 1.1 Links between Infrastructure and Growth in Africa: What the Research Says
Study Method Scope Sector Conclusions
Easterly and Levine 1997 Multicountry Africa Telecommunications, power
Infrastructure is strongly and signifi cantly correlated with growth.
Esfahani and Ramirez 2003 Multicountry Africa Telecommunications, power
Africa’s growth per capita would be 0.9 point higher with East Asia’s infrastructure.
Calderón and Servén 2008 Multicountry Africa Telecommunications, power, roads
Africa’s growth per capita would be 1.0 point higher with the Republic of Korea’s infrastructure.
Estache, Speciale, and Veredas 2005 Multicountry Africa Various Confi rms earlier work and underscores equal relevance for coastal and landlocked countries.
Calderón 2008 Multicountry Africa Telecommunications, power, roads
Africa’s growth per capita would be 2.3 points higher with Mauritius’s infrastructure.
Calderón and Servén 2008 Multicountry Africa Telecommunications, power, roads
Extends earlier results to show infrastructure also has a negative effect on inequality.
Fedderke and Bogetic 2006 Country study South Africa Various Finds long-term relationship between infrastructure and growth based on robust econometric techniques.
Ayogu 1999 Production function Nigeria Various Finds strong association between infrastructure and output in panel data.
Kamara 2008 Production function Various Africa Various Finds strong association between infrastructure and output in panel data.
Reinikka and Svensson 1999a Enterprise surveys Uganda Power Unreliable power is a signifi cant deterrent to private sector investment.
Escribano, Guasch, and Pena 2008 Enterprise surveys Africa Various Infrastructure has a substantial effect on total factor productivity.
Source: Authors’ elaboration.
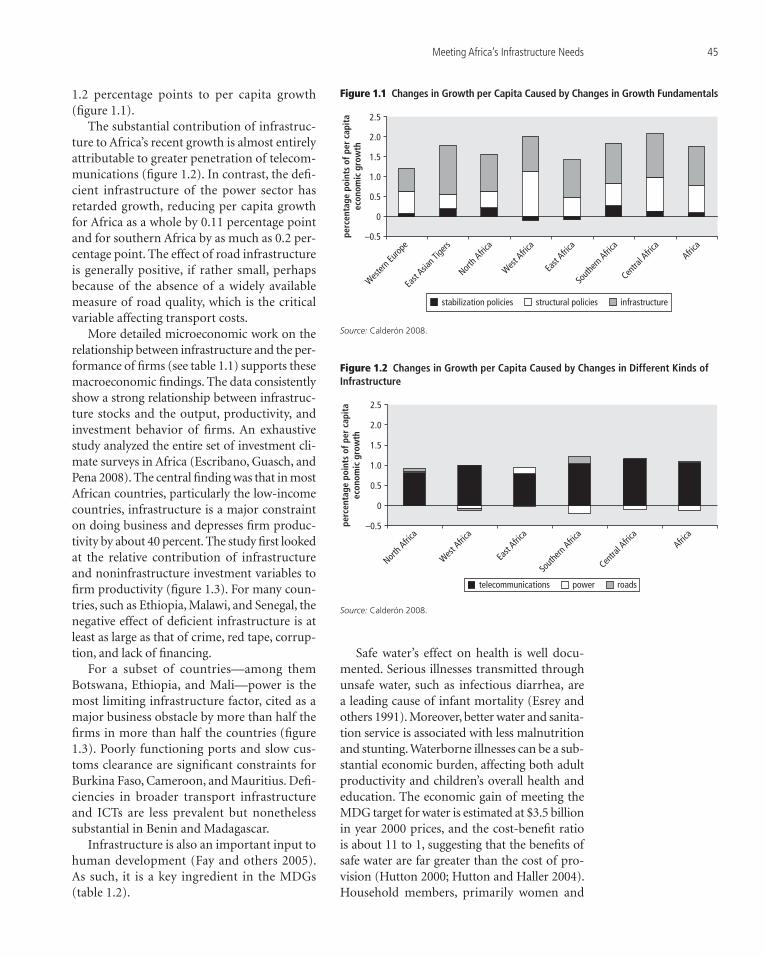
Meeting Africa’s Infrastructure Needs 45
1.2 percentage points to per capita growth (fi gure 1.1).
The substantial contribution of infrastruc-ture to Africa’s recent growth is almost entirely attributable to greater penetration of telecom-munications (fi gure 1.2). In contrast, the defi -cient infrastructure of the power sector has retarded growth, reducing per capita growth for Africa as a whole by 0.11 percentage point and for southern Africa by as much as 0.2 per-centage point. The effect of road infrastructure is generally positive, if rather small, perhaps because of the absence of a widely available measure of road quality, which is the critical variable affecting transport costs.
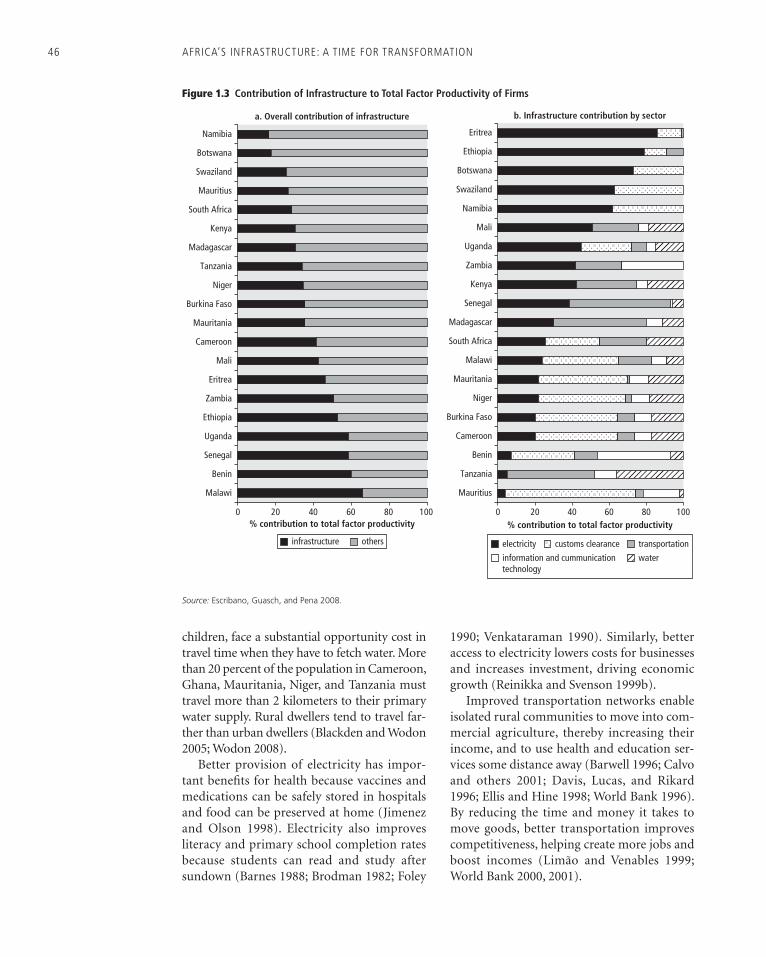
More detailed microeconomic work on the relationship between infrastructure and the per-formance of fi rms (see table 1.1) supports these macroeconomic fi ndings. The data consistently show a strong relationship between infrastruc-ture stocks and the output, productivity, and investment behavior of fi rms. An exhaustive study analyzed the entire set of investment cli-mate surveys in Africa (Escribano, Guasch, and Pena 2008). The central fi nding was that in most African countries, particularly the low-income countries, infrastructure is a major constraint on doing business and depresses fi rm produc-tivity by about 40 percent. The study fi rst looked at the relative contribution of infrastructure and noninfrastructure investment variables to fi rm productivity (fi gure 1.3). For many coun-tries, such as Ethiopia, Malawi, and Senegal, the negative effect of defi cient infrastructure is at least as large as that of crime, red tape, corrup-tion, and lack of fi nancing.
For a subset of countries—among them Botswana, Ethiopia, and Mali—power is the most limiting infrastructure factor, cited as a major business obstacle by more than half the fi rms in more than half the countries (fi gure 1.3). Poorly functioning ports and slow cus-toms clearance are signifi cant constraints for Burkina Faso, Cameroon, and Mauritius. Defi -ciencies in broader transport infrastructure and ICTs are less prevalent but nonetheless substantial in Benin and Madagascar.
Infrastructure is also an important input to human development (Fay and others 2005). As such, it is a key ingredient in the MDGs (table 1.2).
Safe water’s effect on health is well docu-mented. Serious illnesses transmitted through unsafe water, such as infectious diarrhea, are a leading cause of infant mortality (Esrey and others 1991). Moreover, better water and sanita-tion service is associated with less malnutrition and stunting. Waterborne illnesses can be a sub-stantial economic burden, affecting both adult productivity and children’s overall health and education. The economic gain of meeting the MDG target for water is estimated at $3.5 billion in year 2000 prices, and the cost-benefi t ratio is about 11 to 1, suggesting that the benefi ts of safe water are far greater than the cost of pro-vision (Hutton 2000; Hutton and Haller 2004). Household members, primarily women and
–0.5
0
0.5
perc
enta
ge p
oint
s of
per
cap
ita
econ
omic
gro
wth
1.0
1.5
2.0
2.5
stabilization policies structural policies infrastructure
Western
Europ
e
East
Asian T
igers
North A
frica
West Afric
a
East
Africa
South
ern Afric
a
Centra
l Afric
aAfric
a
Figure 1.1 Changes in Growth per Capita Caused by Changes in Growth Fundamentals
Source: Calderón 2008.
2.5
2.0
1.5
1.0
0.5
–0.5
0
North A
frica
West Afric
a
East
Africa
South
ern Afric
a
Centra
l Afric
aAfric
a
perc
enta
ge p
oint
s of
per
cap
ita
econ
omic
gro
wth
telecommunications power roads
Figure 1.2 Changes in Growth per Capita Caused by Changes in Different Kinds of Infrastructure
Source: Calderón 2008.
46 AFRICA’S INFRASTRUCTURE: A TIME FOR TRANSFORMATION
children, face a substantial opportunity cost in travel time when they have to fetch water. More than 20 percent of the population in Cameroon, Ghana, Mauritania, Niger, and Tanzania must travel more than 2 kilometers to their primary water supply. Rural dwellers tend to travel far-ther than urban dwellers (Blackden and Wodon 2005; Wodon 2008).
Better provision of electricity has impor-tant benefi ts for health because vaccines and medications can be safely stored in hospitals and food can be preserved at home (Jimenez and Olson 1998). Electricity also improves literacy and primary school completion rates because students can read and study after sundown (Barnes 1988; Brodman 1982; Foley
1990; Venkataraman 1990). Similarly, better access to electricity lowers costs for businesses and increases investment, driving economic growth (Reinikka and Svenson 1999b).
Improved transportation networks enable isolated rural communities to move into com-mercial agriculture, thereby increasing their income, and to use health and education ser-vices some distance away (Barwell 1996; Calvo and others 2001; Davis, Lucas, and Rikard 1996; Ellis and Hine 1998; World Bank 1996). By reducing the time and money it takes to move goods, better transportation improves competitiveness, helping create more jobs and boost incomes (Limão and Venables 1999; World Bank 2000, 2001).
a. Overall contribution of infrastructure
0 20 40% contribution to total factor productivity
60 80 100 0 20 40% contribution to total factor productivity
60 80 100
Malawi
Benin
Senegal
Uganda
Ethiopia
Zambia
Eritrea
Mali
Cameroon
Mauritania
Burkina Faso
Niger
Tanzania
Madagascar
Kenya
South Africa
Mauritius
Swaziland
Botswana
Namibia
b. Infrastructure contribution by sector
Mauritius
Tanzania
Benin
Cameroon
Burkina Faso
Niger
Mauritania
Malawi
South Africa
Madagascar
Senegal
Kenya
Zambia
Uganda
Mali
Namibia
Swaziland
Botswana
Ethiopia
Eritrea
infrastructure others electricity customs clearance transportation
information and cummunicationtechnology
water
Figure 1.3 Contribution of Infrastructure to Total Factor Productivity of Firms
Source: Escribano, Guasch, and Pena 2008.
Meeting Africa’s Infrastructure Needs 47
The expansion of ICT networks democra-tizes access to information. It can be particu-larly critical for rural populations otherwise cut off from important technological know-how or critical information about market prices (Kenny 2002; Saunders, Warford, and Wellenius 1994). In many cases, telecommunication improve-ments also reduce transportation spending by allowing people to avoid fruitless journeys or to perform transactions remotely (Telecommuni-cation Development Bureau 1999).
Africa’s Infrastructure Deficit
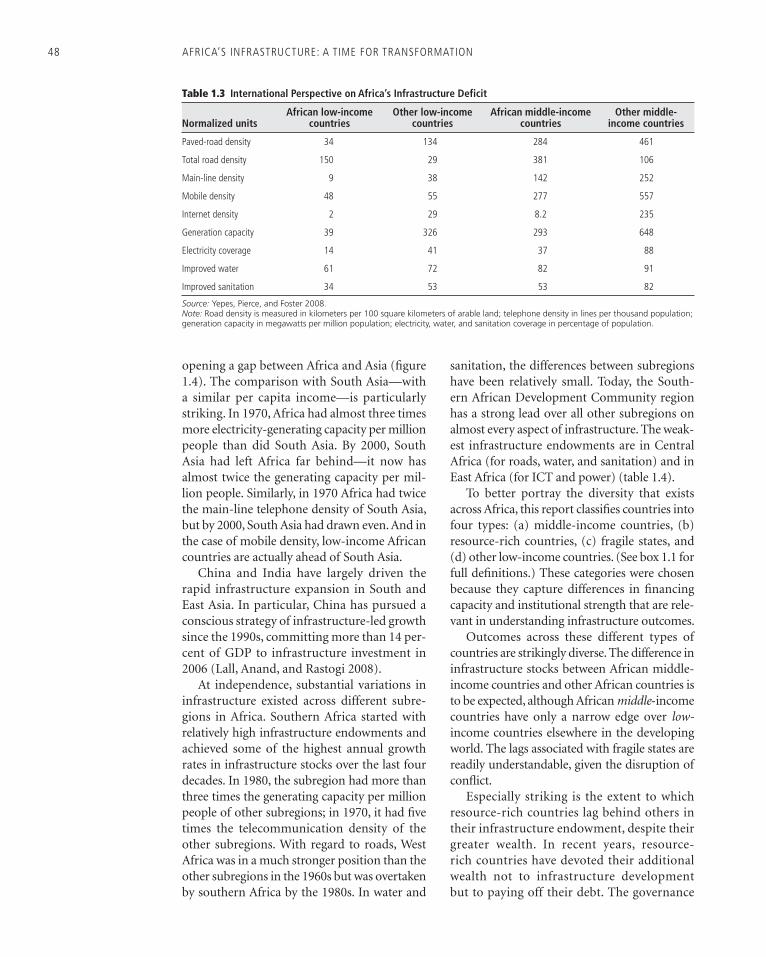
By just about every measure of infrastructure coverage, African countries lag behind their peers in other parts of the developing world (see table 1.3; Yepes, Pierce, and Foster 2008).
The differences are particularly large for paved-road density, telephone main lines, and power generation. The gap exists for both low-income and middle-income groups.
Was Africa’s current infrastructure defi -cit caused by a low historic starting point? Has it always been worse-off than the rest of the world? In the 1960s (roads), 1970s (tele-phones), and 1980s (power), Africa’s stocks were quite similar to those of South or East Asia. (The one exception was paved-road den-sity, in which South Asia already enjoyed a huge advantage over both Africa and East Asia as far back as the 1960s. For household cov-erage of electricity, both South and East Asia were already far ahead of Africa in the early 1990s, and this gap has widened over time.)
Africa expanded its infrastructure stocks more slowly than other developing regions,
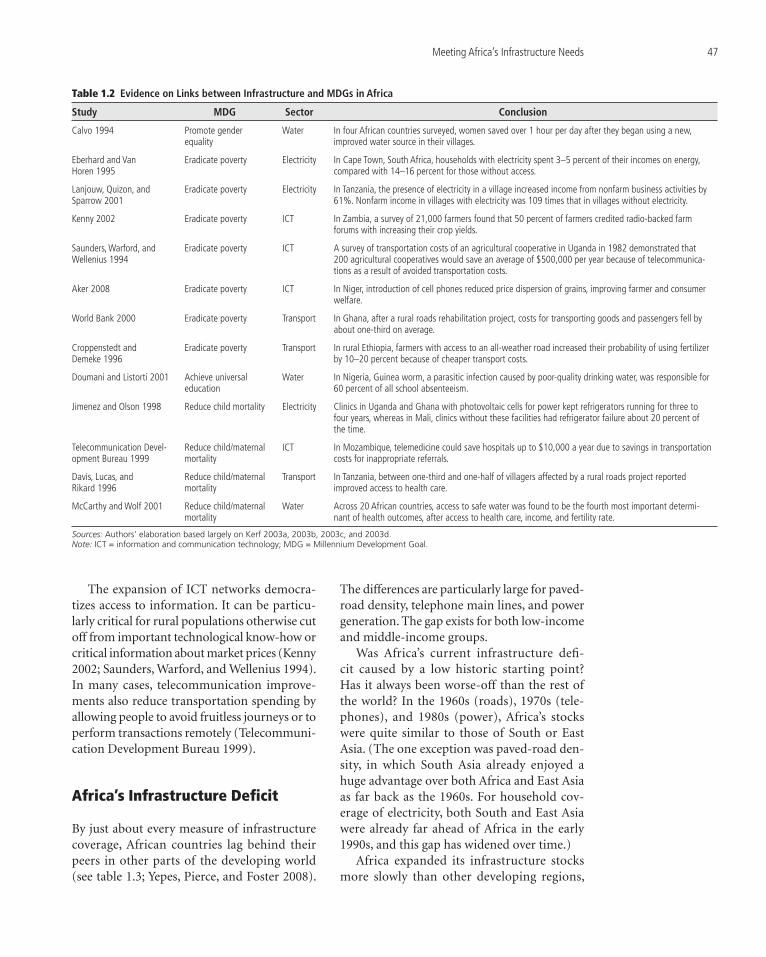
Table 1.2 Evidence on Links between Infrastructure and MDGs in Africa
Study MDG Sector Conclusion
Calvo 1994 Promote gender equality
Water In four African countries surveyed, women saved over 1 hour per day after they began using a new, improved water source in their villages.
Eberhard and Van Horen 1995
Eradicate poverty Electricity In Cape Town, South Africa, households with electricity spent 3–5 percent of their incomes on energy, compared with 14–16 percent for those without access.
Lanjouw, Quizon, and Sparrow 2001
Eradicate poverty Electricity In Tanzania, the presence of electricity in a village increased income from nonfarm business activities by 61%. Nonfarm income in villages with electricity was 109 times that in villages without electricity.
Kenny 2002 Eradicate poverty ICT In Zambia, a survey of 21,000 farmers found that 50 percent of farmers credited radio-backed farm forums with increasing their crop yields.
Saunders, Warford, and Wellenius 1994
Eradicate poverty ICT A survey of transportation costs of an agricultural cooperative in Uganda in 1982 demonstrated that 200 agricultural cooperatives would save an average of $500,000 per year because of telecommunica-tions as a result of avoided transportation costs.
Aker 2008 Eradicate poverty ICT In Niger, introduction of cell phones reduced price dispersion of grains, improving farmer and consumer welfare.
World Bank 2000 Eradicate poverty Transport In Ghana, after a rural roads rehabilitation project, costs for transporting goods and passengers fell by about one-third on average.
Croppenstedt and Demeke 1996
Eradicate poverty Transport In rural Ethiopia, farmers with access to an all-weather road increased their probability of using fertilizer by 10–20 percent because of cheaper transport costs.
Doumani and Listorti 2001 Achieve universal education
Water In Nigeria, Guinea worm, a parasitic infection caused by poor-quality drinking water, was responsible for 60 percent of all school absenteeism.
Jimenez and Olson 1998 Reduce child mortality Electricity Clinics in Uganda and Ghana with photovoltaic cells for power kept refrigerators running for three to four years, whereas in Mali, clinics without these facilities had refrigerator failure about 20 percent of the time.
Telecommunication Devel-opment Bureau 1999
Reduce child/maternal mortality
ICT In Mozambique, telemedicine could save hospitals up to $10,000 a year due to savings in transportation costs for inappropriate referrals.
Davis, Lucas, and Rikard 1996
Reduce child/maternal mortality
Transport In Tanzania, between one-third and one-half of villagers affected by a rural roads project reported improved access to health care.
McCarthy and Wolf 2001 Reduce child/maternal mortality
Water Across 20 African countries, access to safe water was found to be the fourth most important determi-nant of health outcomes, after access to health care, income, and fertility rate.
Sources: Authors’ elaboration based largely on Kerf 2003a, 2003b, 2003c, and 2003d.Note: ICT = information and communication technology; MDG = Millennium Development Goal.
48 AFRICA’S INFRASTRUCTURE: A TIME FOR TRANSFORMATION
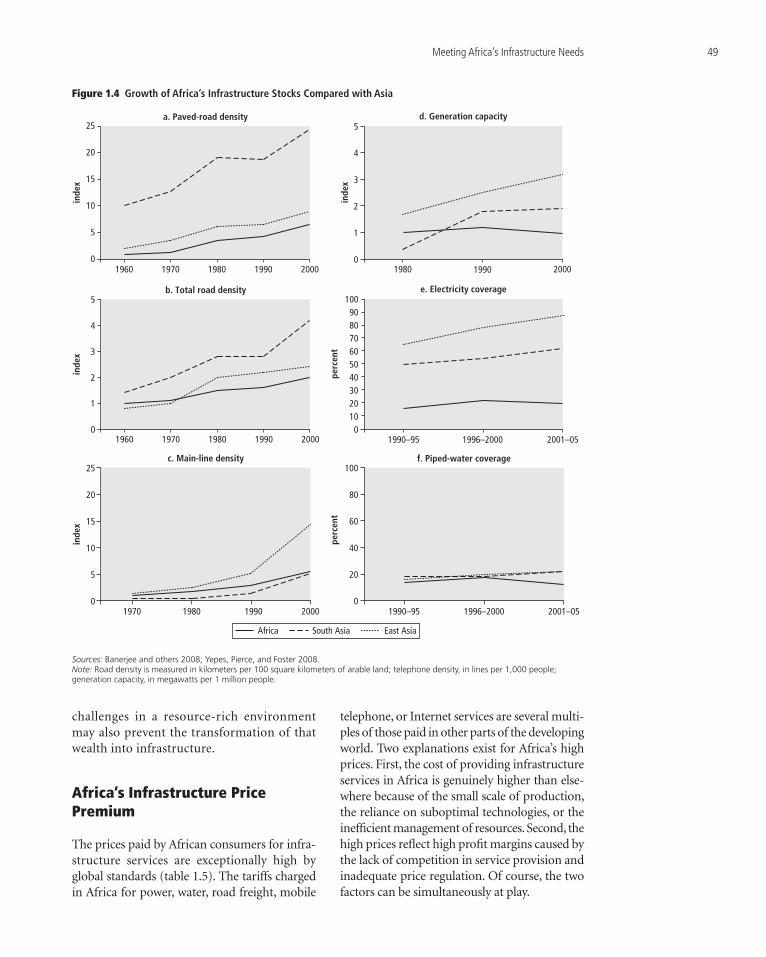
opening a gap between Africa and Asia (fi gure 1.4). The comparison with South Asia—with a similar per capita income—is particularly striking. In 1970, Africa had almost three times more electricity-generating capacity per million people than did South Asia. By 2000, South Asia had left Africa far behind—it now has almost twice the generating capacity per mil-lion people. Similarly, in 1970 Africa had twice the main-line telephone density of South Asia, but by 2000, South Asia had drawn even. And in the case of mobile density, low-income African countries are actually ahead of South Asia.
China and India have largely driven the rapid infrastructure expansion in South and East Asia. In particular, China has pursued a conscious strategy of infrastructure-led growth since the 1990s, committing more than 14 per-cent of GDP to infrastructure investment in 2006 (Lall, Anand, and Rastogi 2008).
At independence, substantial variations in infrastructure existed across different subre-gions in Africa. Southern Africa started with relatively high infrastructure endowments and achieved some of the highest annual growth rates in infrastructure stocks over the last four decades. In 1980, the subregion had more than three times the generating capacity per million people of other subregions; in 1970, it had fi ve times the telecommunication density of the other subregions. With regard to roads, West Africa was in a much stronger position than the other subregions in the 1960s but was overtaken by southern Africa by the 1980s. In water and
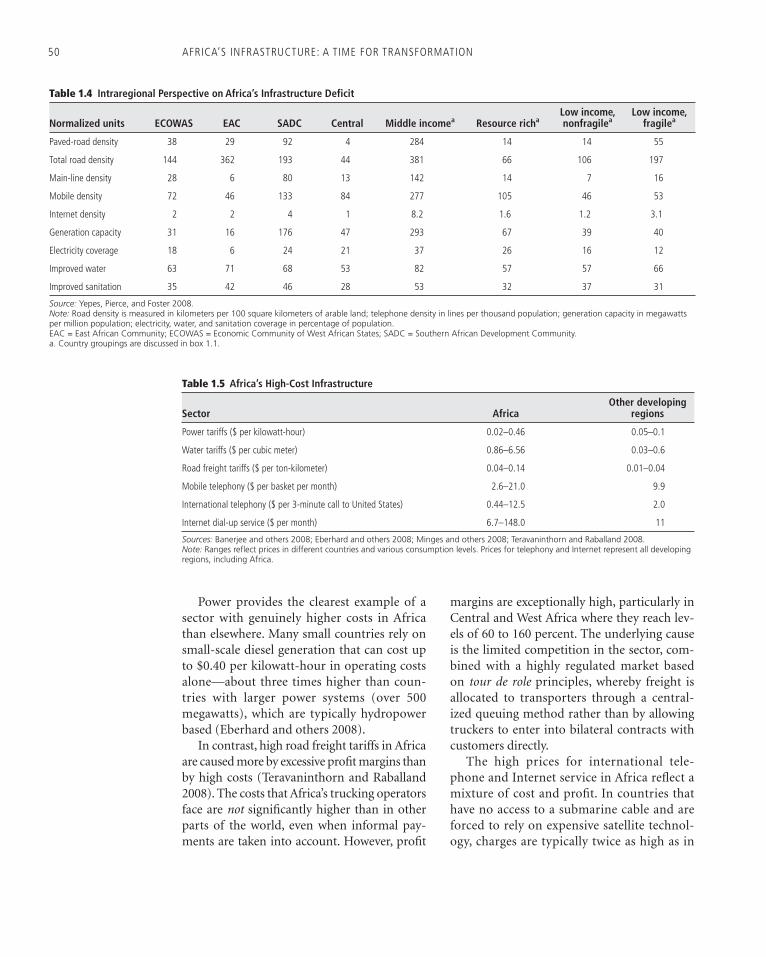
sanitation, the differences between subregions have been relatively small. Today, the South-ern African Development Community region has a strong lead over all other subregions on almost every aspect of infrastructure. The weak-est infrastructure endowments are in Central Africa (for roads, water, and sanitation) and in East Africa (for ICT and power) (table 1.4).
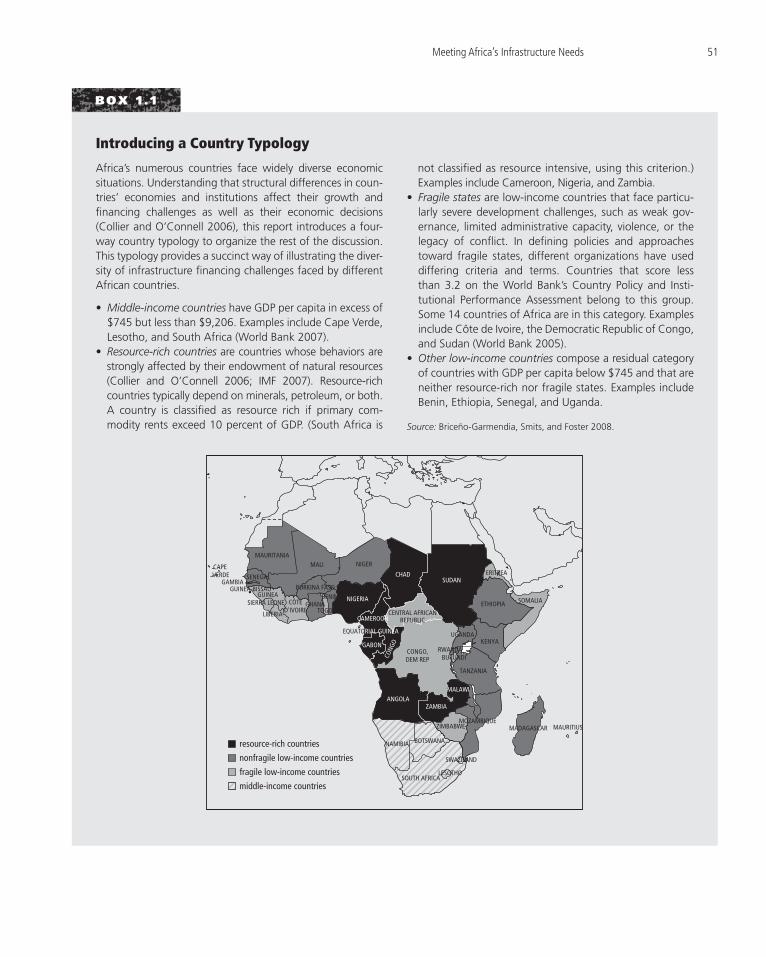
To better portray the diversity that exists across Africa, this report classifi es countries into four types: (a) middle-income countries, (b) resource-rich countries, (c) fragile states, and (d) other low-income countries. (See box 1.1 for full defi nitions.) These categories were chosen because they capture differences in fi nancing capacity and institutional strength that are rele-vant in understanding infrastructure outcomes.
Outcomes across these different types of countries are strikingly diverse. The difference in infrastructure stocks between African middle-income countries and other African countries is to be expected, although African middle-income countries have only a narrow edge over low-income countries elsewhere in the developing world. The lags associated with fragile states are readily understandable, given the disruption of confl ict.
Especially striking is the extent to which resource-rich countries lag behind others in their infrastructure endowment, despite their greater wealth. In recent years, resource-rich countries have devoted their additional wealth not to infrastructure development but to paying off their debt. The governance
Table 1.3 International Perspective on Africa’s Infrastructure Deficit
Normalized unitsAfrican low-income
countriesOther low-income
countriesAfrican middle-income
countriesOther middle-
income countries
Paved-road density 34 134 284 461
Total road density 150 29 381 106
Main-line density 9 38 142 252
Mobile density 48 55 277 557
Internet density 2 29 8.2 235
Generation capacity 39 326 293 648
Electricity coverage 14 41 37 88
Improved water 61 72 82 91
Improved sanitation 34 53 53 82
Source: Yepes, Pierce, and Foster 2008. Note: Road density is measured in kilometers per 100 square kilometers of arable land; telephone density in lines per thousand population; generation capacity in megawatts per million population; electricity, water, and sanitation coverage in percentage of population.
Meeting Africa’s Infrastructure Needs 49
challenges in a resource-rich environment may also prevent the transformation of that wealth into infrastructure.
Africa’s Infrastructure Price Premium
The prices paid by African consumers for infra-structure services are exceptionally high by global standards (table 1.5). The tariffs charged in Africa for power, water, road freight, mobile
telephone, or Internet services are several multi-ples of those paid in other parts of the developing world. Two explanations exist for Africa’s high prices. First, the cost of providing infrastructure services in Africa is genuinely higher than else-where because of the small scale of production, the reliance on suboptimal technologies, or the ineffi cient management of resources. Second, the high prices refl ect high profi t margins caused by the lack of competition in service provision and inadequate price regulation. Of course, the two factors can be simultaneously at play.
a. Paved-road density
b. Total road density
01960
inde
xin
dex
inde
xpe
rcen
t
1970 1980 1990 2000
5
4
3
2
1
01980
1990–95 1996–2000 2001–05
20001990
1960 1970 1980 1990 2000
5
10
15
20
25
0
1
2
3
4
5 1009080706050403020100
d. Generation capacity
e. Electricity coverage
Africa South Asia East Asia
c. Main-line density
inde
x
perc
ent
1990–95 1996–2000 2001–051970 1980 1990 2000
100
80
60
40
20
00
5
10
15
20
25f. Piped-water coverage
Figure 1.4 Growth of Africa’s Infrastructure Stocks Compared with Asia
Sources: Banerjee and others 2008; Yepes, Pierce, and Foster 2008. Note: Road density is measured in kilometers per 100 square kilometers of arable land; telephone density, in lines per 1,000 people; generation capacity, in megawatts per 1 million people.
50 AFRICA’S INFRASTRUCTURE: A TIME FOR TRANSFORMATION
Power provides the clearest example of a sector with genuinely higher costs in Africa than elsewhere. Many small countries rely on small-scale diesel generation that can cost up to $0.40 per kilowatt-hour in operating costs alone—about three times higher than coun-tries with larger power systems (over 500 megawatts), which are typically hydropower based (Eberhard and others 2008).
In contrast, high road freight tariffs in Africa are caused more by excessive profi t margins than by high costs (Teravaninthorn and Raballand 2008). The costs that Africa’s trucking operators face are not signifi cantly higher than in other parts of the world, even when informal pay-ments are taken into account. However, profi t
margins are exceptionally high, particularly in Central and West Africa where they reach lev-els of 60 to 160 percent. The underlying cause is the limited competition in the sector, com-bined with a highly regulated market based on tour de role principles, whereby freight is allocated to transporters through a central-ized queuing method rather than by allowing truckers to enter into bilateral contracts with customers directly.
The high prices for international tele-phone and Internet service in Africa refl ect a mixture of cost and profi t. In countries that have no access to a submarine cable and are forced to rely on expensive satellite technol-ogy, charges are typically twice as high as in
Table 1.5 Africa’s High-Cost Infrastructure
Sector AfricaOther developing
regions
Power tariffs ($ per kilowatt-hour) 0.02–0.46 0.05–0.1
Water tariffs ($ per cubic meter) 0.86–6.56 0.03–0.6
Road freight tariffs ($ per ton-kilometer) 0.04–0.14 0.01–0.04
Mobile telephony ($ per basket per month) 2.6–21.0 9.9
International telephony ($ per 3-minute call to United States) 0.44–12.5 2.0
Internet dial-up service ($ per month) 6.7–148.0 11
Sources: Banerjee and others 2008; Eberhard and others 2008; Minges and others 2008; Teravaninthorn and Raballand 2008.Note: Ranges reflect prices in different countries and various consumption levels. Prices for telephony and Internet represent all developing regions, including Africa.
Table 1.4 Intraregional Perspective on Africa’s Infrastructure Deficit
Normalized units ECOWAS EAC SADC Central Middle incomea Resource richaLow income, nonfragilea
Low income, fragilea
Paved-road density 38 29 92 4 284 14 14 55
Total road density 144 362 193 44 381 66 106 197
Main-line density 28 6 80 13 142 14 7 16
Mobile density 72 46 133 84 277 105 46 53
Internet density 2 2 4 1 8.2 1.6 1.2 3.1
Generation capacity 31 16 176 47 293 67 39 40
Electricity coverage 18 6 24 21 37 26 16 12
Improved water 63 71 68 53 82 57 57 66
Improved sanitation 35 42 46 28 53 32 37 31
Source: Yepes, Pierce, and Foster 2008. Note: Road density is measured in kilometers per 100 square kilometers of arable land; telephone density in lines per thousand population; generation capacity in megawatts per million population; electricity, water, and sanitation coverage in percentage of population. EAC = East African Community; ECOWAS = Economic Community of West African States; SADC = Southern African Development Community.a. Country groupings are discussed in box 1.1.
Meeting Africa’s Infrastructure Needs 51
Africa’s numerous countries face widely diverse economic situations. Understanding that structural differences in coun-tries’ economies and institutions affect their growth and fi nancing challenges as well as their economic decisions (Collier and O’Connell 2006), this report introduces a four-way country typology to organize the rest of the discussion. This typology provides a succinct way of illustrating the diver-sity of infrastructure fi nancing challenges faced by different African countries.
• Middle-income countries have GDP per capita in excess of $745 but less than $9,206. Examples include Cape Verde, Lesotho, and South Africa (World Bank 2007).
• Resource-rich countries are countries whose behaviors are strongly affected by their endowment of natural resources (Collier and O’Connell 2006; IMF 2007). Resource-rich countries typically depend on minerals, petroleum, or both. A country is classifi ed as resource rich if primary com-modity rents exceed 10 percent of GDP. (South Africa is
not classifi ed as resource intensive, using this criterion.) Examples include Cameroon, Nigeria, and Zambia.
• Fragile states are low-income countries that face particu-larly severe development challenges, such as weak gov-ernance, limited administrative capacity, violence, or the legacy of confl ict. In defi ning policies and approaches toward fragile states, different organizations have used differing criteria and terms. Countries that score less than 3.2 on the World Bank’s Country Policy and Insti-tutional Performance Assessment belong to this group. Some 14 countries of Africa are in this category. Examples include Côte de Ivoire, the Democratic Republic of Congo, and Sudan (World Bank 2005).
• Other low-income countries compose a residual category of countries with GDP per capita below $745 and that are neither resource-rich nor fragile states. Examples include Benin, Ethiopia, Senegal, and Uganda.
Source: Briceño-Garmendia, Smits, and Foster 2008.
Introducing a Country Typology
BOX 1 . 1
MAURITANIA
CAPE VERDE
GAMBIAGUINEA-BISSAU
SENEGAL
SIERRA LEONEGUINEA
LIBERIA
CÔTED'IVOIRE TOGO
GHANABENIN NIGERIA
GABON
resource-rich countries
nonfragile low-income countries
fragile low-income countries
middle-income countries
CONG
O
ANGOLA
MALI NIGER
CHADSUDAN
ETHIOPIA SOMALIA
KENYAUGANDA
RWANDABURUNDI
TANZANIA
CONGO,DEM REP
ZAMBIA
MALAWI
ZIMBABWEMOZAMBIQUE
MADAGASCAR MAURITIUS
LESOTHO
SWAZILAND
BURKINA FASO
ERITREA
EQUATORIAL GUINEA
SOUTH AFRICA
NAMIBIA BOTSWANA
CENTRAL AFRICANREPUBLICCAMEROON
52 AFRICA’S INFRASTRUCTURE: A TIME FOR TRANSFORMATION
countries that enjoy cable access. Even when access to a submarine cable is obtained, coun-tries with a monopoly on this international gateway have tariffs that are substantially higher than those without a monopoly (Min-ges and others 2008).
How Much Does Africa Need to Spend on Infrastructure?
Meeting Africa’s infrastructure needs and developing cost-effective modes of infra-structure service delivery call for a substantial program of investment, rehabilitation, and dis-ciplined maintenance combined. The physical infrastructure requirements are the grounds for a new set of estimates for spending require-ments that are the foundation of this report. In all cases, the estimated spending takes into account both growth-related and social demands for infrastructure, and it incorporates the costs of maintenance and rehabilitation as well as new investment.
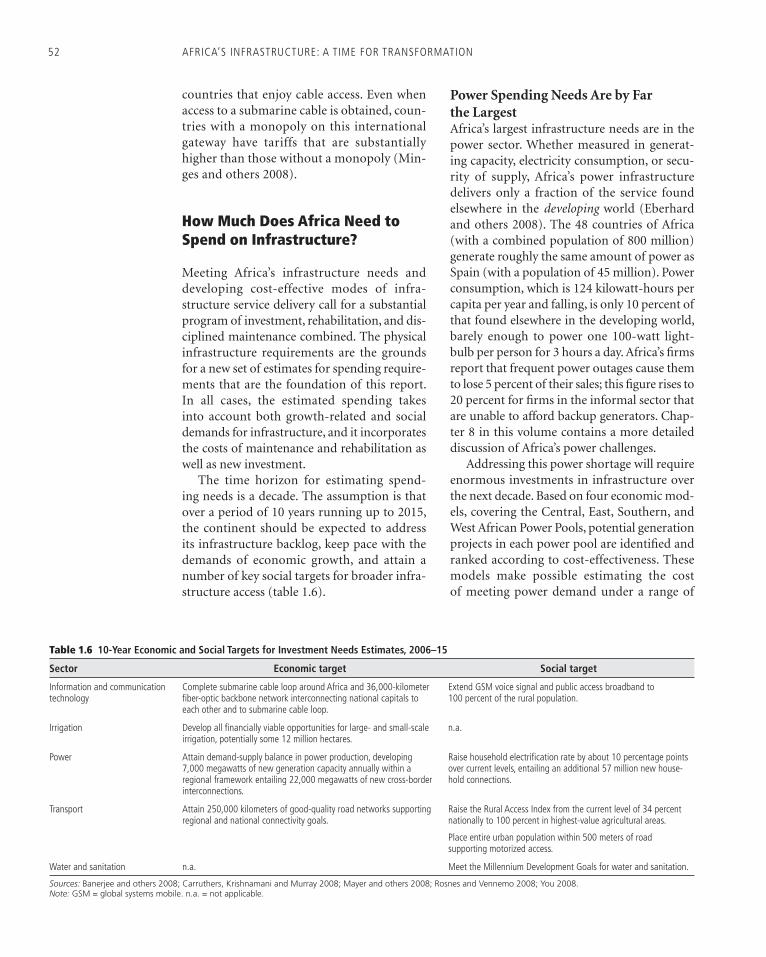
The time horizon for estimating spend-ing needs is a decade. The assumption is that over a period of 10 years running up to 2015, the continent should be expected to address its infrastructure backlog, keep pace with the demands of economic growth, and attain a number of key social targets for broader infra-structure access (table 1.6).
Power Spending Needs Are by Far the LargestAfrica’s largest infrastructure needs are in the power sector. Whether measured in generat-ing capacity, electricity consumption, or secu-rity of supply, Africa’s power infrastructure delivers only a fraction of the service found elsewhere in the developing world (Eberhard and others 2008). The 48 countries of Africa (with a combined population of 800 million) generate roughly the same amount of power as Spain (with a population of 45 million). Power consumption, which is 124 kilowatt-hours per capita per year and falling, is only 10 percent of that found elsewhere in the developing world, barely enough to power one 100-watt light-bulb per person for 3 hours a day. Africa’s fi rms report that frequent power outages cause them to lose 5 percent of their sales; this fi gure rises to 20 percent for fi rms in the informal sector that are unable to afford backup generators. Chap-ter 8 in this volume contains a more detailed discussion of Africa’s power challenges.
Addressing this power shortage will require enormous investments in infrastructure over the next decade. Based on four economic mod-els, covering the Central, East, Southern, and West African Power Pools, potential generation projects in each power pool are identifi ed and ranked according to cost-effectiveness. These models make possible estimating the cost of meeting power demand under a range of
Table 1.6 10-Year Economic and Social Targets for Investment Needs Estimates, 2006–15
Sector Economic target Social target
Information and communication technology
Complete submarine cable loop around Africa and 36,000-kilometer fi ber-optic backbone network interconnecting national capitals to each other and to submarine cable loop.
Extend GSM voice signal and public access broadband to 100 percent of the rural population.
Irrigation Develop all fi nancially viable opportunities for large- and small-scale irrigation, potentially some 12 million hectares.
n.a.
Power Attain demand-supply balance in power production, developing 7,000 megawatts of new generation capacity annually within a regional framework entailing 22,000 megawatts of new cross-border interconnections.
Raise household electrifi cation rate by about 10 percentage points over current levels, entailing an additional 57 million new house-hold connections.
Transport Attain 250,000 kilometers of good-quality road networks supporting regional and national connectivity goals.
Raise the Rural Access Index from the current level of 34 percent nationally to 100 percent in highest-value agricultural areas.
Place entire urban population within 500 meters of road supporting motorized access.
Water and sanitation n.a. Meet the Millennium Development Goals for water and sanitation.
Sources: Banerjee and others 2008; Carruthers, Krishnamani and Murray 2008; Mayer and others 2008; Rosnes and Vennemo 2008; You 2008.Note: GSM = global systems mobile. n.a. = not applicable.
Meeting Africa’s Infrastructure Needs 53
alternative scenarios that consider access tar-gets, fuel prices, unit costs of investment, and feasibility of cross-border trade (Vennemo and Rosnes 2008).
Demand for power is almost directly pro-portional to economic growth. Installed capac-ity will need to grow by more than 10 percent annually—or more than 7,000 megawatts a year—just to meet Africa’s suppressed demand, keep pace with projected economic growth, and provide additional capacity to support the rollout of electrifi cation. Since 1995, expan-sion of the sector has averaged barely 1 per-cent annually, or less than 1,000 megawatts a year. Most of that power would go to meet nonresidential demands from the commercial and industrial sectors.
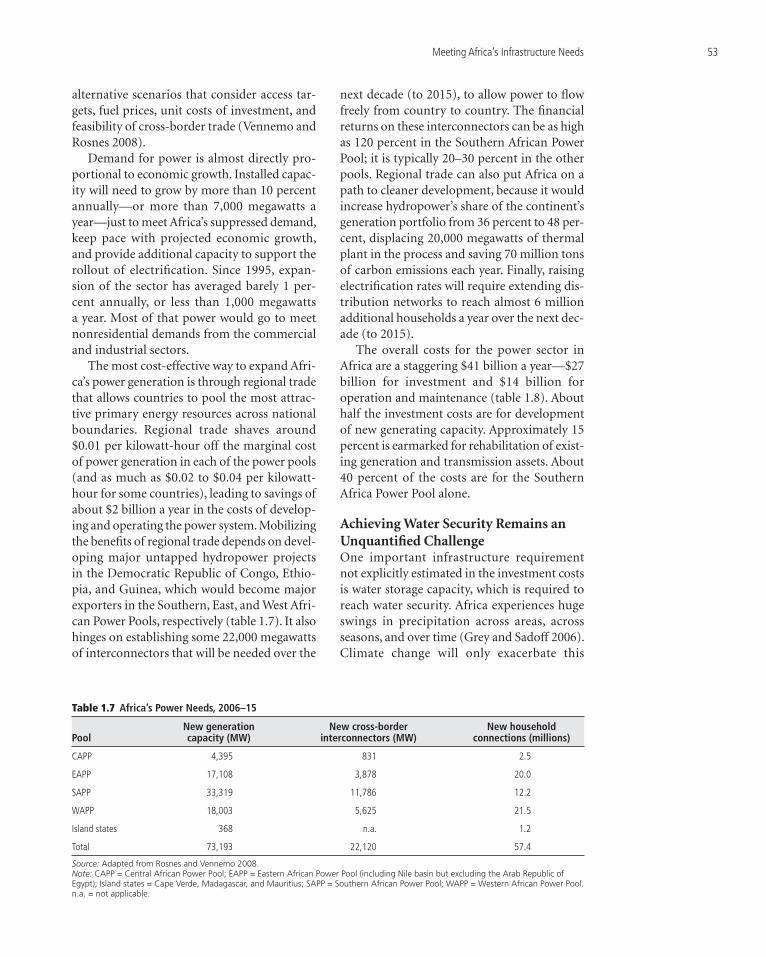
The most cost-effective way to expand Afri-ca’s power generation is through regional trade that allows countries to pool the most attrac-tive primary energy resources across national boundaries. Regional trade shaves around $0.01 per kilowatt-hour off the marginal cost of power generation in each of the power pools (and as much as $0.02 to $0.04 per kilowatt-hour for some countries), leading to savings of about $2 billion a year in the costs of develop-ing and operating the power system. Mobilizing the benefi ts of regional trade depends on devel-oping major untapped hydropower projects in the Democratic Republic of Congo, Ethio-pia, and Guinea, which would become major exporters in the Southern, East, and West Afri-can Power Pools, respectively (table 1.7). It also hinges on establishing some 22,000 megawatts of interconnectors that will be needed over the
next decade (to 2015), to allow power to fl ow freely from country to country. The fi nancial returns on these interconnectors can be as high as 120 percent in the Southern African Power Pool; it is typically 20–30 percent in the other pools. Regional trade can also put Africa on a path to cleaner development, because it would increase hydropower’s share of the continent’s generation portfolio from 36 percent to 48 per-cent, displacing 20,000 megawatts of thermal plant in the process and saving 70 million tons of carbon emissions each year. Finally, raising electrifi cation rates will require extending dis-tribution networks to reach almost 6 million additional households a year over the next dec-ade (to 2015).
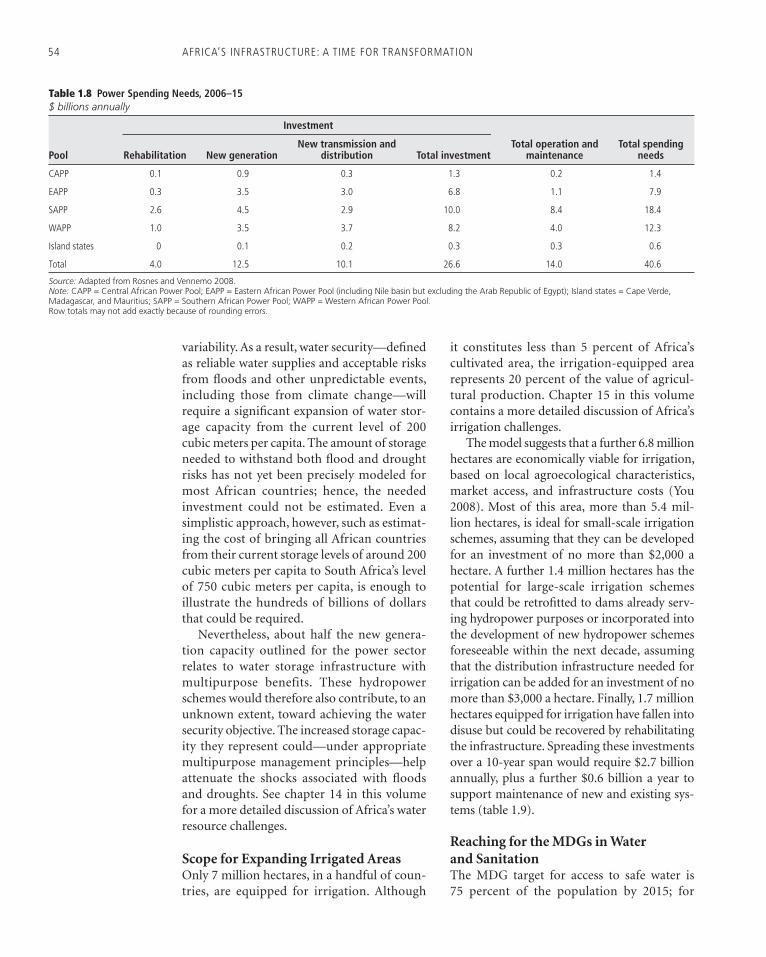
The overall costs for the power sector in Africa are a staggering $41 billion a year—$27 billion for investment and $14 billion for operation and maintenance (table 1.8). About half the investment costs are for development of new generating capacity. Approximately 15 percent is earmarked for rehabilitation of exist-ing generation and transmission assets. About 40 percent of the costs are for the Southern Africa Power Pool alone.
Achieving Water Security Remains an Unquantifi ed ChallengeOne important infrastructure requirement not explicitly estimated in the investment costs is water storage capacity, which is required to reach water security. Africa experiences huge swings in precipitation across areas, across seasons, and over time (Grey and Sadoff 2006). Climate change will only exacerbate this
Table 1.7 Africa’s Power Needs, 2006–15
PoolNew generation capacity (MW)
New cross-border interconnectors (MW)
New household connections (millions)
CAPP 4,395 831 2.5
EAPP 17,108 3,878 20.0
SAPP 33,319 11,786 12.2
WAPP 18,003 5,625 21.5
Island states 368 n.a. 1.2
Total 73,193 22,120 57.4
Source: Adapted from Rosnes and Vennemo 2008.Note: CAPP = Central African Power Pool; EAPP = Eastern African Power Pool (including Nile basin but excluding the Arab Republic of Egypt); Island states = Cape Verde, Madagascar, and Mauritius; SAPP = Southern African Power Pool; WAPP = Western African Power Pool. n.a. = not applicable.
54 AFRICA’S INFRASTRUCTURE: A TIME FOR TRANSFORMATION
variability. As a result, water security—defi ned as reliable water supplies and acceptable risks from fl oods and other unpredictable events, including those from climate change—will require a signifi cant expansion of water stor-age capacity from the current level of 200 cubic meters per capita. The amount of storage needed to withstand both fl ood and drought risks has not yet been precisely modeled for most African countries; hence, the needed investment could not be estimated. Even a simplistic approach, however, such as estimat-ing the cost of bringing all African countries from their current storage levels of around 200 cubic meters per capita to South Africa’s level of 750 cubic meters per capita, is enough to illustrate the hundreds of billions of dollars that could be required.
Nevertheless, about half the new genera-tion capacity outlined for the power sector relates to water storage infrastructure with multipurpose benefits. These hydropower schemes would therefore also contribute, to an unknown extent, toward achieving the water security objective. The increased storage capac-ity they represent could—under appropriate multipurpose management principles—help attenuate the shocks associated with fl oods and droughts. See chapter 14 in this volume for a more detailed discussion of Africa’s water resource challenges.
Scope for Expanding Irrigated AreasOnly 7 million hectares, in a handful of coun-tries, are equipped for irrigation. Although
it constitutes less than 5 percent of Africa’s cultivated area, the irrigation-equipped area represents 20 percent of the value of agricul-tural production. Chapter 15 in this volume contains a more detailed discussion of Africa’s irrigation challenges.
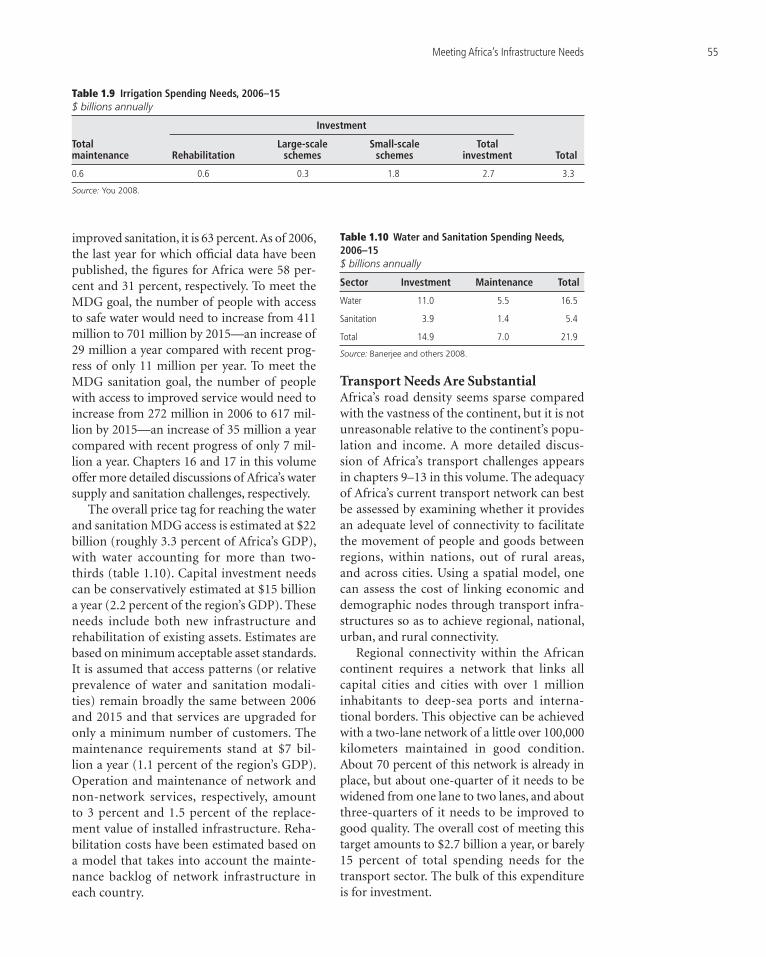
The model suggests that a further 6.8 million hectares are economically viable for irrigation, based on local agroecological characteristics, market access, and infrastructure costs (You 2008). Most of this area, more than 5.4 mil-lion hectares, is ideal for small-scale irrigation schemes, assuming that they can be developed for an investment of no more than $2,000 a hectare. A further 1.4 million hectares has the potential for large-scale irrigation schemes that could be retrofi tted to dams already serv-ing hydropower purposes or incorporated into the development of new hydropower schemes foreseeable within the next decade, assuming that the distribution infrastructure needed for irrigation can be added for an investment of no more than $3,000 a hectare. Finally, 1.7 million hectares equipped for irrigation have fallen into disuse but could be recovered by rehabilitating the infrastructure. Spreading these investments over a 10-year span would require $2.7 billion annually, plus a further $0.6 billion a year to support maintenance of new and existing sys-tems (table 1.9).
Reaching for the MDGs in Water and SanitationThe MDG target for access to safe water is 75 percent of the population by 2015; for
Table 1.8 Power Spending Needs, 2006–15$ billions annually
Pool
Investment
Total operation and maintenance
Total spending needsRehabilitation New generation
New transmission and distribution Total investment
CAPP 0.1 0.9 0.3 1.3 0.2 1.4
EAPP 0.3 3.5 3.0 6.8 1.1 7.9
SAPP 2.6 4.5 2.9 10.0 8.4 18.4
WAPP 1.0 3.5 3.7 8.2 4.0 12.3
Island states 0 0.1 0.2 0.3 0.3 0.6
Total 4.0 12.5 10.1 26.6 14.0 40.6
Source: Adapted from Rosnes and Vennemo 2008.Note: CAPP = Central African Power Pool; EAPP = Eastern African Power Pool (including Nile basin but excluding the Arab Republic of Egypt); Island states = Cape Verde, Madagascar, and Mauritius; SAPP = Southern African Power Pool; WAPP = Western African Power Pool. Row totals may not add exactly because of rounding errors.
Meeting Africa’s Infrastructure Needs 55
improved sanitation, it is 63 percent. As of 2006, the last year for which offi cial data have been published, the fi gures for Africa were 58 per-cent and 31 percent, respectively. To meet the MDG goal, the number of people with access to safe water would need to increase from 411 million to 701 million by 2015—an increase of 29 million a year compared with recent prog-ress of only 11 million per year. To meet the MDG sanitation goal, the number of people with access to improved service would need to increase from 272 million in 2006 to 617 mil-lion by 2015—an increase of 35 million a year compared with recent progress of only 7 mil-lion a year. Chapters 16 and 17 in this volume offer more detailed discussions of Africa’s water supply and sanitation challenges, respectively.
The overall price tag for reaching the water and sanitation MDG access is estimated at $22 billion (roughly 3.3 percent of Africa’s GDP), with water accounting for more than two-thirds (table 1.10). Capital investment needs can be conservatively estimated at $15 billion a year (2.2 percent of the region’s GDP). These needs include both new infrastructure and rehabilitation of existing assets. Estimates are based on minimum acceptable asset standards. It is assumed that access patterns (or relative prevalence of water and sanitation modali-ties) remain broadly the same between 2006 and 2015 and that services are upgraded for only a minimum number of customers. The maintenance requirements stand at $7 bil-lion a year (1.1 percent of the region’s GDP). Operation and maintenance of network and non-network services, respectively, amount to 3 percent and 1.5 percent of the replace-ment value of installed infrastructure. Reha-bilitation costs have been estimated based on a model that takes into account the mainte-nance backlog of network infrastructure in each country.
Transport Needs Are SubstantialAfrica’s road density seems sparse compared with the vastness of the continent, but it is not unreasonable relative to the continent’s popu-lation and income. A more detailed discus-sion of Africa’s transport challenges appears in chapters 9–13 in this volume. The adequacy of Africa’s current transport network can best be assessed by examining whether it provides an adequate level of connectivity to facilitate the movement of people and goods between regions, within nations, out of rural areas, and across cities. Using a spatial model, one can assess the cost of linking economic and demographic nodes through transport infra-structures so as to achieve regional, national, urban, and rural connectivity.
Regional connectivity within the African continent requires a network that links all capital cities and cities with over 1 million inhabitants to deep-sea ports and interna-tional borders. This objective can be achieved with a two-lane network of a little over 100,000 kilometers maintained in good condition. About 70 percent of this network is already in place, but about one-quarter of it needs to be widened from one lane to two lanes, and about three-quarters of it needs to be improved to good quality. The overall cost of meeting this target amounts to $2.7 billion a year, or barely 15 percent of total spending needs for the transport sector. The bulk of this expenditure is for investment.
Table 1.10 Water and Sanitation Spending Needs, 2006–15$ billions annually
Sector Investment Maintenance Total
Water 11.0 5.5 16.5
Sanitation 3.9 1.4 5.4
Total 14.9 7.0 21.9
Source: Banerjee and others 2008.
Table 1.9 Irrigation Spending Needs, 2006–15$ billions annually
Total maintenance
Investment
RehabilitationLarge-scale
schemesSmall-scale
schemesTotal
investment Total
0.6 0.6 0.3 1.8 2.7 3.3
Source: You 2008.
56 AFRICA’S INFRASTRUCTURE: A TIME FOR TRANSFORMATION
Regional connectivity also requires a rail network, ports with adequate capacity, and airports. For railways, the main costs are for rehabilitation of the existing track. For ports, more container berths are needed to keep pace with the growth of international trade. For air transport, the model does not suggest any need for new terminals, but some expansion is pro-vided based on passenger traffi c projects. For runways, the investments primarily relate to improving the condition of existing runways. No need was found for building new runways, although in a few cases lengthening existing runways to support the use of larger aircraft was relevant.
Connectivity within a country requires extending the regional network to link capital cities to their corresponding provincial cen-ters and to other cities with more than 25,000 inhabitants by at least a one-lane paved road. The overall regional network and such national networks would encompass 250,000 kilome-ters to meet this objective. About half of this network already exists in the form of paved roads, whereas the other half would need to be upgraded to a paved network. The cost of meeting this target is $2.9 billion a year. A sub-stantial share of that amount is for upgrading existing unpaved roads to paved surfaces.
Rural connectivity is defi ned as providing accessibility to all-season roads in high-value agricultural areas. Only one-third of rural Afri-cans live close to an all-season road, compared with two-thirds of the population in other developing regions. Because of low popula-tion densities in rural Africa, raising this Rural Access Index to 100 percent for Africa would be essentially unaffordable. An alternative approach is to provide 100 percent rural con-nectivity to those areas with the highest agri-cultural land value. Limiting access attention to areas with 80 percent of the highest agri-cultural production value, the cost would be a signifi cant $2.5 billion a year, or close to 13 percent of the overall spending requirement. About half of that sum is for maintenance, whereas the remainder is devoted to improving the condition of existing rural roads, upgrad-ing road surfaces to ensure all-season accessi-bility, and to a lesser extent, adding new roads to reach isolated populations.
Urban connectivity is defi ned as ensur-ing that the entire urban population lives no farther than 500 meters from a paved road capable of supporting motorized access. Afri-can cities today have paved-road densities well below the average for well-provided cities in other developing countries, which typically have densities of 300 meters per 1,000 inhab-itants. Meeting the objective of 500 meters would require adding 17,000 kilometers to the current urban road network, and upgrading and improving 70,000 kilometers of the exist-ing network, costing $1.6 billion a year, which serves to underscore the signifi cance of urban roads within Africa’s overall transport require-ments. Most of this sum is needed to widen and pave existing urban roads.
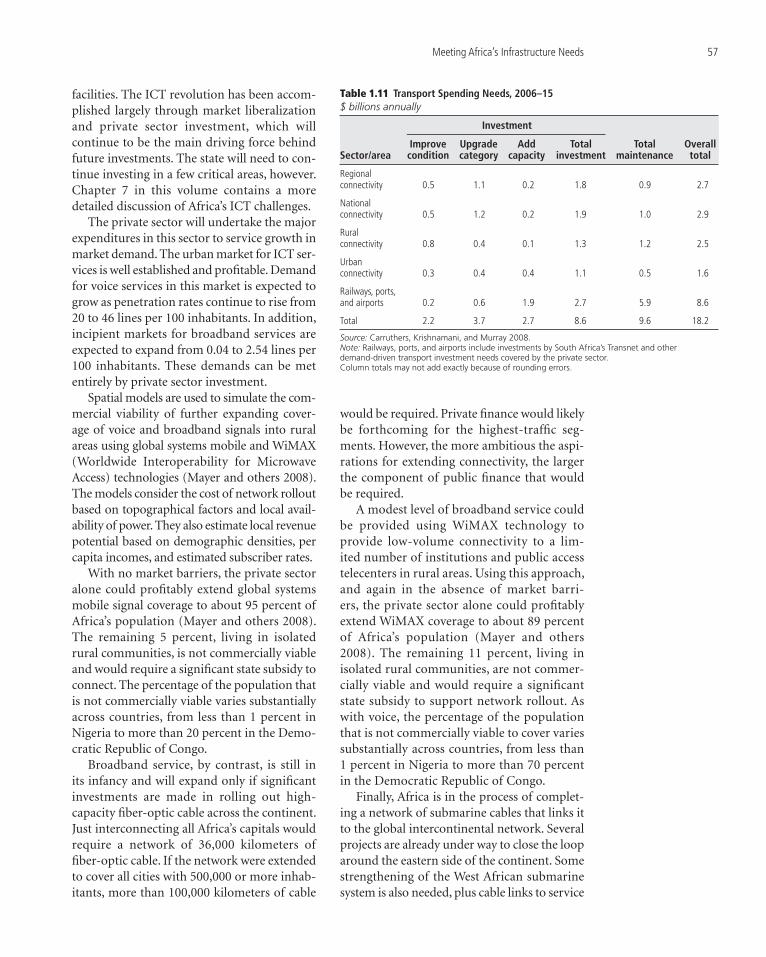
To create a transport network that provides adequate regional, national, rural, and urban road connectivity complemented by adequate rail, port, and airport infrastructure will require signifi cant spending—$18 billion a year, half of which is related to maintenance (table 1.11). Investment requirements are driven primarily by spending needed to upgrade the category of existing assets (for example, from a gravel to a paved road), to improve the condition of exist-ing assets (from poor to good or fair condition), and to expand the capacity of existing assets (for example, from one lane to two lanes). Just over half of this spending would be directed at nonroad transport modes, particularly for their maintenance. The remainder is roughly evenly spread among national connectivity, urban connectivity, and rural connectivity.
ICT Spending Needs Look More ManageableAfrica’s progress in ICT is close to that seen else-where in the developing world. The percentage of Africa’s population living within range of a global systems mobile signal rose from 5 per-cent in 1999 to 57 percent in 2006 (Minges and others 2008). Over the same period, more than 100 million Africans became mobile telephone subscribers. Indeed, in some countries, house-hold access to mobile telephone services now exceeds that of piped water. Internet penetra-tion lags considerably, with little more than 2 million subscribers and a further 12 million estimated to be making use of public access
Meeting Africa’s Infrastructure Needs 57
facilities. The ICT revolution has been accom-plished largely through market liberalization and private sector investment, which will continue to be the main driving force behind future investments. The state will need to con-tinue investing in a few critical areas, however. Chapter 7 in this volume contains a more detailed discussion of Africa’s ICT challenges.
The private sector will undertake the major expenditures in this sector to service growth in market demand. The urban market for ICT ser-vices is well established and profi table. Demand for voice services in this market is expected to grow as penetration rates continue to rise from 20 to 46 lines per 100 inhabitants. In addition, incipient markets for broadband services are expected to expand from 0.04 to 2.54 lines per 100 inhabitants. These demands can be met entirely by private sector investment.
Spatial models are used to simulate the com-mercial viability of further expanding cover-age of voice and broadband signals into rural areas using global systems mobile and WiMAX (Worldwide Interoperability for Microwave Access) technologies (Mayer and others 2008). The models consider the cost of network rollout based on topographical factors and local avail-ability of power. They also estimate local revenue potential based on demographic densities, per capita incomes, and estimated subscriber rates.
With no market barriers, the private sector alone could profi tably extend global systems mobile signal coverage to about 95 percent of Africa’s population (Mayer and others 2008). The remaining 5 percent, living in isolated rural communities, is not commercially viable and would require a signifi cant state subsidy to connect. The percentage of the population that is not commercially viable varies substantially across countries, from less than 1 percent in Nigeria to more than 20 percent in the Demo-cratic Republic of Congo.
Broadband service, by contrast, is still in its infancy and will expand only if signifi cant investments are made in rolling out high-capacity fi ber-optic cable across the continent. Just interconnecting all Africa’s capitals would require a network of 36,000 kilometers of fi ber-optic cable. If the network were extended to cover all cities with 500,000 or more inhab-itants, more than 100,000 kilometers of cable
would be required. Private fi nance would likely be forthcoming for the highest-traffi c seg-ments. However, the more ambitious the aspi-rations for extending connectivity, the larger the component of public fi nance that would be required.
A modest level of broadband service could be provided using WiMAX technology to provide low-volume connectivity to a lim-ited number of institutions and public access telecenters in rural areas. Using this approach, and again in the absence of market barri-ers, the private sector alone could profi tably extend WiMAX coverage to about 89 percent of Africa’s population (Mayer and others 2008). The remaining 11 percent, living in isolated rural communities, are not commer-cially viable and would require a signifi cant state subsidy to support network rollout. As with voice, the percentage of the population that is not commercially viable to cover varies substantially across countries, from less than 1 percent in Nigeria to more than 70 percent in the Democratic Republic of Congo.
Finally, Africa is in the process of complet-ing a network of submarine cables that links it to the global intercontinental network. Several projects are already under way to close the loop around the eastern side of the continent. Some strengthening of the West African submarine system is also needed, plus cable links to service
Table 1.11 Transport Spending Needs, 2006–15$ billions annually
Sector/area
Investment
Total maintenance
Overall total
Improve condition
Upgrade category
Add capacity
Total investment
Regional connectivity 0.5 1.1 0.2 1.8 0.9 2.7
National connectivity 0.5 1.2 0.2 1.9 1.0 2.9
Rural connectivity 0.8 0.4 0.1 1.3 1.2 2.5
Urban connectivity 0.3 0.4 0.4 1.1 0.5 1.6
Railways, ports, and airports 0.2 0.6 1.9 2.7 5.9 8.6
Total 2.2 3.7 2.7 8.6 9.6 18.2
Source: Carruthers, Krishnamani, and Murray 2008.Note: Railways, ports, and airports include investments by South Africa’s Transnet and other demand-driven transport investment needs covered by the private sector.Column totals may not add exactly because of rounding errors.
58 AFRICA’S INFRASTRUCTURE: A TIME FOR TRANSFORMATION
outlying islands, such as the Comoros, Mada-gascar, and the Seychelles. The private sector is showing considerable appetite to take on this kind of investment.
The investment costs of this additional ICT infrastructure, beyond what would be purely driven by market demand, are relatively mod-est when compared with other infrastructure sectors. Achieving universal rural access for both voice service and limited broadband ser-vice based on WiMAX technology could be accomplished for an investment of $1.7 billion a year, the bulk of which could come from the private sector, with additional public fund-ing amounting to no more than $0.4 billion a year. Completing the submarine and intrare-gional fi ber-optic backbone would entail an annual (private sector) investment of less than $0.2 billion, although this sum would more than double if a more ambitious network con-necting all cities with over 500,000 inhabitants were envisaged (table 1.12). Factoring in the market-driven investments needed to keep pace with demand in established urban markets, the estimated ICT sector annual investment need rises to $7 billion a year, plus another $2 billion annually for operation and maintenance.
Overall Price Tag
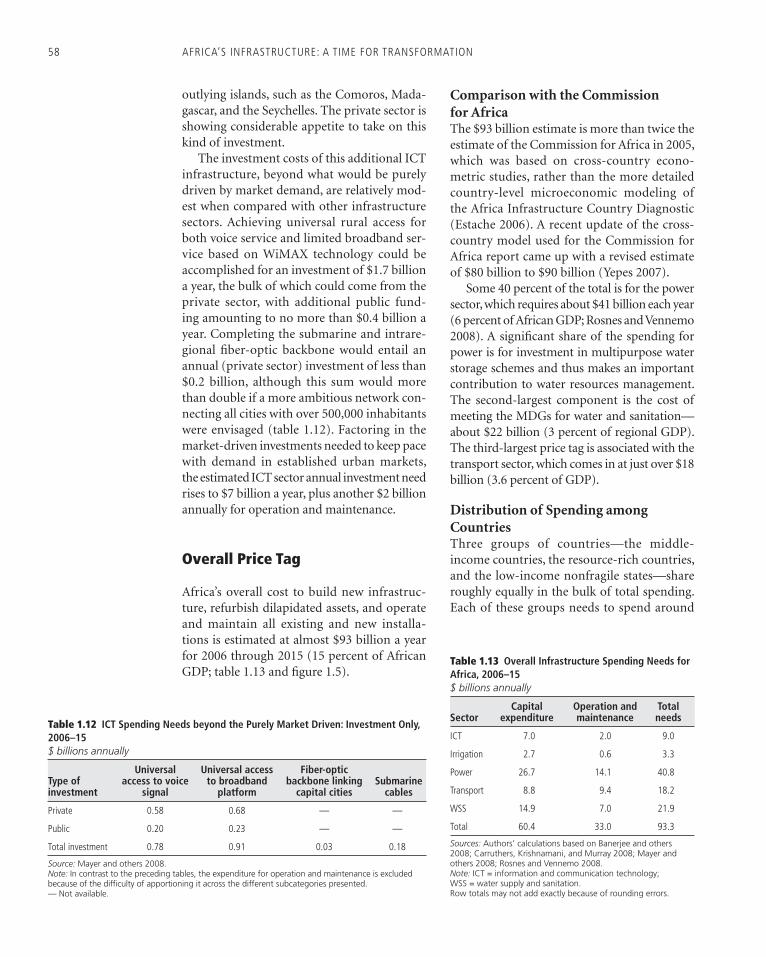
Africa’s overall cost to build new infrastruc-ture, refurbish dilapidated assets, and operate and maintain all existing and new installa-tions is estimated at almost $93 billion a year for 2006 through 2015 (15 percent of African GDP; table 1.13 and fi gure 1.5).
Comparison with the Commission for AfricaThe $93 billion estimate is more than twice the estimate of the Commission for Africa in 2005, which was based on cross-country econo-metric studies, rather than the more detailed country-level microeconomic modeling of the Africa Infrastructure Country Diagnostic (Estache 2006). A recent update of the cross-country model used for the Commission for Africa report came up with a revised estimate of $80 billion to $90 billion (Yepes 2007).
Some 40 percent of the total is for the power sector, which requires about $41 billion each year (6 percent of African GDP; Rosnes and Vennemo 2008). A signifi cant share of the spending for power is for investment in multipurpose water storage schemes and thus makes an important contribution to water resources management. The second-largest component is the cost of meeting the MDGs for water and sanitation—about $22 billion (3 percent of regional GDP). The third-largest price tag is associated with the transport sector, which comes in at just over $18 billion (3.6 percent of GDP).
Distribution of Spending among CountriesThree groups of countries—the middle-income countries, the resource-rich countries, and the low-income nonfragile states—share roughly equally in the bulk of total spending. Each of these groups needs to spend around
Table 1.13 Overall Infrastructure Spending Needs for Africa, 2006–15$ billions annually
SectorCapital
expenditureOperation and maintenance
Total needs
ICT 7.0 2.0 9.0
Irrigation 2.7 0.6 3.3
Power 26.7 14.1 40.8
Transport 8.8 9.4 18.2
WSS 14.9 7.0 21.9
Total 60.4 33.0 93.3
Sources: Authors’ calculations based on Banerjee and others 2008; Carruthers, Krishnamani, and Murray 2008; Mayer and others 2008; Rosnes and Vennemo 2008.Note: ICT = information and communication technology; WSS = water supply and sanitation.Row totals may not add exactly because of rounding errors.
Table 1.12 ICT Spending Needs beyond the Purely Market Driven: Investment Only, 2006–15$ billions annually
Type of investment
Universal access to voice
signal
Universal access to broadband
platform
Fiber-optic backbone linking
capital citiesSubmarine
cables
Private 0.58 0.68 — —
Public 0.20 0.23 — —
Total investment 0.78 0.91 0.03 0.18
Source: Mayer and others 2008.Note: In contrast to the preceding tables, the expenditure for operation and maintenance is excluded because of the difficulty of apportioning it across the different subcategories presented.— Not available.
Meeting Africa’s Infrastructure Needs 59
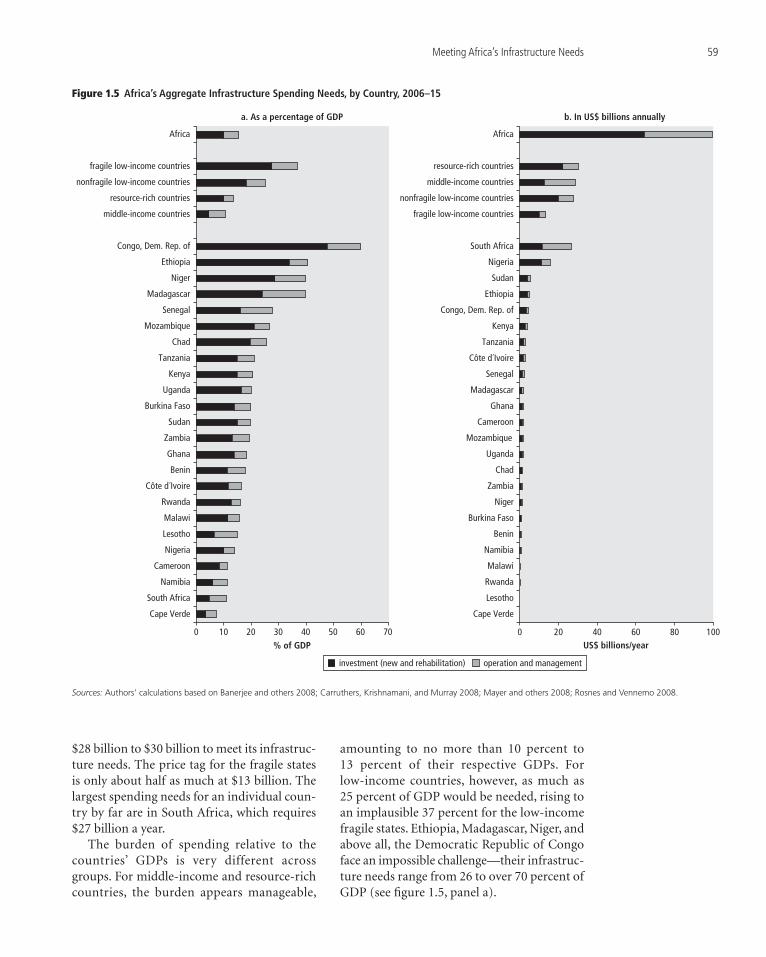
$28 billion to $30 billion to meet its infrastruc-ture needs. The price tag for the fragile states is only about half as much at $13 billion. The largest spending needs for an individual coun-try by far are in South Africa, which requires $27 billion a year.
The burden of spending relative to the countries’ GDPs is very different across groups. For middle-income and resource-rich countries, the burden appears manageable,
amounting to no more than 10 percent to 13 percent of their respective GDPs. For low-income countries, however, as much as 25 percent of GDP would be needed, rising to an implausible 37 percent for the low-income fragile states. Ethiopia, Madagascar, Niger, and above all, the Democratic Republic of Congo face an impossible challenge—their infrastruc-ture needs range from 26 to over 70 percent of GDP (see fi gure 1.5, panel a).
Figure 1.5 Africa’s Aggregate Infrastructure Spending Needs, by Country, 2006–15
Sources: Authors’ calculations based on Banerjee and others 2008; Carruthers, Krishnamani, and Murray 2008; Mayer and others 2008; Rosnes and Vennemo 2008.
a. As a percentage of GDP
0 10 20 30 40 50 60 70
Cape Verde
Namibia
Cameroon
South Africa
Malawi
Nigeria
Lesotho
Rwanda
Côte d´Ivoire
Benin
Ghana
Burkina Faso
Zambia
Sudan
Uganda
Kenya
Tanzania
Chad
Mozambique
Senegal
Niger
Madagascar
Ethiopia
Congo, Dem. Rep. of
middle-income countries
resource-rich countries
nonfragile low-income countries
fragile low-income countries
Africa
% of GDP
b. In US$ billions annually
0 20 40 60 80 100
Cape Verde
Lesotho
Rwanda
Malawi
Burkina Faso
Benin
Namibia
Chad
Niger
Uganda
Zambia
Cameroon
Ghana
Madagascar
Mozambique
Senegal
Côte d´Ivoire
Tanzania
Kenya
Congo, Dem. Rep. of
Ethiopia
Sudan
Nigeria
South Africa
fragile low-income countries
nonfragile low-income countries
resource-rich countries
middle-income countries
Africa
US$ billions/year
investment (new and rehabilitation) operation and management
60 AFRICA’S INFRASTRUCTURE: A TIME FOR TRANSFORMATION
Distribution of Spending—Investment versus MaintenanceThe overall spending requirements break down two to one between investment and operation and maintenance, with the balance between them shifting across country groupings. In the middle-income countries, the spending needs are skewed toward maintenance, which absorbs more than half the total. These countries have already put in place much of the infrastruc-ture they need, and their main challenge is to preserve it in good condition. Across the three other country groupings, almost three-quarters of spending needs are associated with invest-ment and only one-quarter with operation and maintenance. These countries have a vast con-struction (and reconstruction) agenda to com-plete before they will have much to maintain.
Will the Price Tag Grow—or Shrink?These estimates of investment are based on costs prevailing in 2006, the base year for all of the African Infrastructure Country Diag-nostic fi gures. It is well known that the unit costs of infrastructure provision have escalated signifi cantly during the last few years (Africon 2008).
The most reliable evidence available comes from the road sector, where cost overruns reported on multilateral agency projects in 2007 averaged 60 percent. The higher costs are not just from infl ation in petroleum and asso-ciated input prices, but they also refl ect a lack of competition for civil works contracts and the tight position of the global construction industry, as well as lengthy delays in project implementation. Similar escalations in unit costs have been reported anecdotally in other areas of infrastructure, notably power. Pos-sibly, the recent upward pressure on the costs of infrastructure may be reversed as the cur-rent global downturn takes its toll, but that is hard to predict. Based on the situation in 2006, the preceding estimates likely represent a conservative lower boundary for the cost of developing infrastructure assets at today’s prices.
The global fi nancial crisis of 2008 can be expected to reduce demand for some types of infrastructures, but it would not hugely alter the estimated spending needs. A large share
of the spending needs are driven by targets rather than economic growth; this applies, for example, to the transport spending needs (which are largely based on connectivity objec-tives) and to the water and sanitation spend-ing needs (which are based on the MDGs). The spending needs with the strongest direct link to economic growth are those for the power sector. However, because of the large backlog in that sector, estimated spending needs con-tain a strong component of refurbishment and catch-up. Thus, even halving economic growth estimates for the region would reduce esti-mated power spending needs by only 20 per-cent. The global recession could be expected to affect demand for ICT services and trade-related infrastructure, such as railways and ports. However, the weight of those infrastruc-tures in the total spending needs is not much more than 10 percent.
Notes The authors of this chapter are Vivien Foster and
Cecilia Briceño-Garmendia, who drew on back-ground material and contributions from César Calderón, Alvaro Escribano, J. Luis Guasch, Paul Lombard, Siobhan Murray, Jorge Pena, Justin Pierce, Tito Yepes, and Willem van Zyl.
1. Although the Africa Infrastructure Country Diagnostic project is limited to the study of Sub-Saharan African countries, this book sometimes substitutes Africa for Sub-Saharan Africa. The reader should bear in mind, however, that the information refers only to Sub-Saharan Africa.
2. Road density is measured in kilometers per 100 square kilometers; telephone density in lines per thousand population; electricity generation in megawatts per million population; and electric-ity, water, and sanitation coverage in percentage of population.
3. Monetary fi gures are in U.S. dollars unless oth-erwise noted.
ReferencesAfricon. 2008. “Unit Costs of Infrastructure Proj-
ects in Sub-Saharan Africa.” Background Paper 11, Africa Infrastructure Sector Diagnostic, World Bank, Washington, DC.
Aker, Jenny. 2008. “Does Digital Divide or Provide? The Impact of Cell Phones on Grain Markets in Niger.” Center for International and Devel-opment Economics Research, University of California, Berkeley.
Meeting Africa’s Infrastructure Needs 61
Ayogu, Melvin. 1999. “Before Prebendalism: A Positive Analysis of Core Infrastructure Invest-ment in a Developing Fiscal Federalism.” African Development Review 11 (2): 169–98.
Banerjee, Sudeshna, Quentin Wodon, Amadou Diallo, Taras Pushak, Hellal Uddin, Clarence Tsimpo, and Vivien Foster. 2008. “Access, Afford-ability, and Alternatives: Modern Infrastructure Services in Africa.” Background Paper 2, Africa Infrastructure Sector Diagnostic, World Bank, Washington, DC.
Barnes, Douglas F. 1988. Electric Power for Rural Growth: How Electricity Affects Rural Life in Devel-oping Countries. Boulder, CO: Westview Press.
Barwell, Ian. 1996. “Transport and the Village: Findings from African Village-Level Travel and Transport Surveys and Related Studies.” Discussion Paper 344, World Bank, Washington, DC.
Blackden, Mark, and Quentin Wodon, eds. 2005. “Gender, Time Use and Poverty in Sub-Saharan Africa.” Working Series Paper 73, World Bank, Washington, DC.
Briceño-Garmendia, Cecilia, Karlis Smits, and Vivien Foster. 2008. “Financing Public Infra-structure in Sub-Saharan Africa: Patterns, Issues, and Options.” AICD Background Paper 15, Africa Infrastructure Sector Diagnostic, World Bank, Washington, DC.
Brodman, Janice. 1982. “Rural Electrifi cation and the Commercial Sector in Indonesia.” Discus-sion Paper D-73L, Resources for the Future, Washington, DC.
Calderón, César. 2008. “Infrastructure and Growth in Africa.” Working Paper 3, Africa Infrastruc-ture Country Diagnostic, World Bank, Washington, DC.
Calderón, César, and Luis Servén. 2008. “Infra-structure and Economic Development in Sub-Saharan Africa.” Policy Research Working Paper 4712, World Bank, Washington, DC.
Calvo, Christina Malmberg. 1994. “Case Study on the Role of Women in Rural Transport: Access of Women to Domestic Facilities.” Sub-Saharan Africa Transport Policy Program Working Paper 11, World Bank, Washington, DC.
Calvo, Christina Malmberg, Colin Gannon, Kenneth M. Gwilliam, and Zhi Liu. 2001. “Transport: Infrastructure and Services—Technical Notes.” PRSP Toolkit, World Bank, Washington, DC.
Carruthers, Robin, Ranga R. Krishnamani, and Siobhan Murray. 2008. “Improving Connectiv-ity: Investing in Transport Infrastructure in Sub-Saharan Africa.” Background Paper 7, Africa Infrastructure Country Diagnostic, World Bank, Washington, DC.
Collier, Paul, and Stephen O’Connell. 2006. “Opportunities and Choices.” Draft chapter for the synthesis volume of the Explaining African Economic Growth PRoject of Oxford University and Swarthmore College, Centre for Study of African Economies.
Commission for Africa. 2005. Our Common Inter-est: Report of the Commission for Africa. London: Commission for Africa.
Croppenstedt, Andre, and Mulat Demeke. 1996. “Determinants of Adoption and Levels of Demand for Fertiliser for Cereal Growing Farmers in Ethiopia.” Working Paper 96-3, Centre for the Study of African Economies, Oxford, U.K.
Davis, Tony, Kimberly Lucas, and Ken Rikard. 1996. Agricultural Transport Assistance Program: Impact Study. Washington, DC: United States Agency for International Development.
Doumani, Fadi M., and James A. Listorti. 2001. “Environmental Health: Bridging the Gaps.” World Bank Discussion Paper 422, World Bank, Washington, DC.
Easterly, William, and Ross Levine. 1997. “Africa’s Growth Tragedy: Policies and Ethnic Divisions.” Quarterly Journal of Economics 112 (4): 1203–50. http://ssrn.com/abstract=88828.
Eberhard, Anton, Vivien Foster, Cecilia Briceño-Garmendia, Fatimata Ouedraogo, Daniel Camos, and Maria Shkaratan. 2008. “Under-powered: The State of the Power Sector in Sub-Saharan Africa.” Background Paper 6, Africa Infrastructure Sector Diagnostic, World Bank, Washington, DC.
Eberhard, Anton, and Clive Van Horen. 1995. Poverty and Power: Energy and the South African State. London: UCT and Pluto.
Ellis, Simon, and John Hine. 1998. “The Provi-sion of Rural Transport Services: Approach Paper.” Sub-Saharan Africa Transport Policy Program Working Paper 37, World Bank, Washington, DC.
Escribano, Alvaro, J. Luis Guasch, and Jorge Pena. 2008. “Impact of Infrastructure Constraints on Firm Productivity in Africa.” Working Paper 9, Africa Infrastructure Sector Diagnostic, World Bank, Washington, DC.
Esfahani, Hadi Salehi, and Maria Teresa Ramirez. 2003. “Institutions, Infrastructure, and Economic Growth.” Journal of Develop-ment Economics 70: 443–77. http://ssrn.com/abstract=310779.
Esrey, S. A., J. B. Potash, L. Roberts, and C. Shiff. 1991. “Effects of Improved Water Supply and Sanitation on Ascariasis, Diarrhea, Dracunculia-sis, Hookworm Infection, Schistosomiasis and
62 AFRICA’S INFRASTRUCTURE: A TIME FOR TRANSFORMATION
Trachoma.” Bulletin of the World Health Organi-zation 89 (5): 609–21.
Estache, Antonio. 2006. “Africa’s Infrastructure: Challenges and Opportunities.” Paper pre-sented at “Realizing the Potential for Profi table Investment in Africa” seminar, IMF Institute and Joint Africa Institute, Tunis, February 28–March 1.
Estache, Antonio, Biagio Speciale, and David Vere-das. 2005. “How Much Does Infrastructure Mat-ter for Growth in Sub-Saharan Africa?” World Bank, Washington, DC.
Fay, Marianne, Danny Leipziger, Quentin Wodon, and Tito Yepes. 2005. “Achieving Child-Health-Related Millennium Development Goals: The Role of Infrastructure.” World Development 33 (8): 1267–84.
Fedderke, Johannes W., and Zeljko Bogetic. 2006. “Infrastructure and Growth in South Africa: Direct and Indirect Productivity Impacts of 19 Infrastructure Measures.” Policy Research Work-ing Paper 3989, World Bank, Washington, DC.
Foley, Gerald. 1990. Electricity for Rural People. London: Panos Institute.
Grey, David, and Claudia Sadoff. 2006 “Water for Growth and Development: A Framework for Analysis.” Theme Document of the 4th World Water Forum, Mexico City, March.
Hutton, Guy. 2000. Considerations in Evaluating the Cost-Effectiveness of Environmental Health Inter-ventions. Geneva: World Health Organization.
Hutton, Guy, and Laurence Haller. 2004. Evalu-ation of the Costs and Benefi ts of Water and Sanitation Improvements at the Global Level: Water, Sanitation and Health Protection of the Human Environment. Geneva: World Health Organization.
IMF (International Monetary Fund). 2007. Regional Economic Outlook: Sub-Saharan Africa. Washington, DC: IMF.
Jimenez, Antonio, and Ken Olson. 1998. Renew-able Energy for Rural Health Clinics. Golden, CO: National Renewable Energy Laboratory. http://www.nrel.gov/docs/legosti/fy98/25233.pdf.
Kamara, Samura. 2008. “Restoring Economic Growth and Stability in Fragile and Post-Confl ict Low Income States: Views from the Trench.” Paper presented at World Bank Poverty Reduction and Economic Management confer-ence, Washington, DC, April 15–16.
Kenny, Charles. 2002. “The Costs and Benefi ts of ICTs for Direct Poverty Alleviation.” Develop-ment Policy Review 20: 141–57.
Kerf, Michel. 2003a. “Linkages between Energy and Poverty Alleviation.” World Bank, Washington, DC.
———. 2003b. “Linkages between ICT and Pov-erty Alleviation.” World Bank, Washington, DC.
———. 2003c. “Linkages between Transport and Poverty Alleviation.” World Bank, Washington, DC.
———. 2003d. “Linkages between Water and Sani-tation and Poverty Alleviation.” World Bank, Washington, DC.
Lall, Rajiv, Ritu Anand, and Anupam Rastogi. 2008. “Developing Physical Infrastructure: A Com-parative Perspective on the Experience of the People’s Republic of China and India.” Asian Development Bank, Manila.
Lanjouw, Peter, Jamie Quizon, and Robert Spar-row. 2001. “Non-Agricultural Earnings in Peri-Urban Areas of Tanzania: Evidence from Household Survey Data.” Food Policy 26: 385–403.
Limão, Nuno, and Anthony Venables. 1999. “Infra-structure, Geographical Disadvantage and Transportation Costs.” Policy Research Working Paper 2257, World Bank, Washington, DC.
Mayer, Rebecca, Ken Figueredo, Mike Jensen, Tim Kelly, Richard Green, and Alvaro Federico Barra. 2008. “Costing the Needs for Investment in ICT Infrastructure in Africa.” Background Paper 3, Africa Infrastructure Sector Diagnostic, World Bank, Washington, DC.
McCarthy, F. Desmond, and Holger Wolf. 2001. “Comparative Life Expectancy in Africa.” Policy Research Working Paper 2668, World Bank, Washington, DC.
Minges, Michael, Cecila Briceño-Garmendia, Mark Williams, Mavis Ampah, Daniel Camos, and Maria Shkratan. 2008. “Information and Com-munications Technology in Sub-Saharan Africa: A Sector Review.” Background Paper 10, Africa Infrastructure Sector Diagnostic, World Bank, Washington, DC.
Reinikka, Ritva, and Jakob Svensson. 1999a. “Confronting Competition: Firms’ Investment Response and Constraints in Uganda.” In Assessing an African Success: Farms, Firms, and Government in Uganda’s Recovery, ed. Paul Col-lier and Ritva Reinikka. Washington, DC: World Bank.
——. 1999b. “How Inadequate Provision of Pub-lic Infrastructure and Services Affects Private Investment.” Policy Research Working Paper 2262, World Bank, Washington, DC.
Rosnes, Orvika, and Haakon Vennemo. 2008. “Powering Up: Costing Power Infrastructure Investment Needs in Southern and Eastern Africa.” Background Paper 5, Africa Infra-structure Sector Diagnostic, World Bank, Washington, DC.

Meeting Africa’s Infrastructure Needs 63
Saunders, Robert J., Jeremy Warford, and Bjorn Wellenius. 1994. Telecommunications and Economic Development. 2nd ed. Baltimore: Johns Hopkins University Press for the World Bank.
Telecommunication Development Bureau. 1999. Telemedicine and Developing Countries—Lessons Learned. Geneva: International Telecommunica-tion Union.
Teravaninthorn, Supee, and Gaël Raballand. 2008. “Transport Prices and Costs in Africa: A Review of the Main International Corri-dors.” Working Paper 14, Africa Infrastructure Sector Diagnostic, World Bank, Washington, DC.
Venkataraman, K. 1990. “Rural Electrifi cation in the Asian and Pacifi c Region.” In Power Systems in Asia and the Pacifi c, with Emphasis on Rural Electrifi cation, ed. Economic and Social Com-mission for Asia and the Pacifi c, 310–32. New York: United Nations.
Vennemo, Haakon, and Ornica Rosnes. 2008. “Powering-Up: Costing Power Infrastructure Investment Needs in Africa.” Background Paper 5, Africa Infrastructure Country Diagnostic, World Bank, Washington, DC.
Wodon, Quentin, ed. 2008. “Electricity Tariffs and the Poor: Case Studies from Sub-Saharan Africa.” Working Paper 11, Africa Infrastruc-ture Country Diagnostic, World Bank, Washington, DC.
World Bank. 1996. “Socio-Economic Impact of Rural Roads: Impact Evaluation Report for the Fourth Highway Project in Morocco.” OED Report 15808-MOR, World Bank, Washington, DC.
———. 2000. “Ghana: Building a Stronger Transportation System.” Precis 189, Washington, DC.
———. 2001. Cities on the Move: A World Bank Urban Transport Strategy Review. Washington, DC: World Bank.
———. 2005. Global Monitoring Report 2005. Washington, DC: World Bank.
———. 2007. DEPweb glossary. Development Education Program, World Bank. http://www.worldbank.org/depweb/english/modules/glossary.html#middle-income.
Yepes, Tito. 2007. “New Estimates of Infrastructure Expenditure Requirements.” World Bank, Washington, DC.
Yepes, Tito, Justin Pierce, and Vivien Foster. 2008. “Making Sense of Sub-Saharan Africa’s Infrastructure Endowment: A Benchmarking Approach.” Working Paper 1, Africa Infra-structure Country Diagnostic, World Bank, Washington, DC.
You, Liang Zhi. 2008. “Irrigation Investment Needs in Sub-Saharan Africa.” Background Paper 9, Africa Infrastructure Country Diagnostic, World Bank, Washington, DC.