Technical Bulletin: NYSERDA Solar Photovoltaic System Labeling ...

Transportation Advisory PanelMeeting 12
March 18, 2021
www.Climate.ny.gov

• Welcome/Introductions
• Review of Cadmus policy briefs on hydrogen/biofuel
• Review recommendation templates for Clean Fuels and Market Based/Finance strategies
• Provide overview - of Existing New York State Electric Vehicle Programs
• Plans for additional expert input/research
• Open discussion/next steps
www.Climate.ny.gov
Agenda

Meeting Procedures
Before beginning, a few reminders to ensure a smooth discussion:
• Panel members should be on mute when not speaking
• Video is encouraged for Panel members, in particular when speaking
• We will not be muting individuals for this discussion; the chair will call on members individually, at which time please unmute
• If technical problems arise, please contact: [email protected]

Transportation Advisory Panel Members
Paul Allen, M. J. Bradley &
Associates
Jared SnyderNYSDEC
Marie Therese Dominguez, Chair
NYSDOT
Dimitris Assanis, Stony Brook University
Steve Finch, AAA Western & Central
New York
Albert Gore III, Tesla
Kendra Hems, Trucking Association
of New York
Elgie Holstein, Environmental Defense Fund
Renae Reynolds, New York City Environmental
Justice Alliance
Porie Saikia-Eapen, Metropolitan Transit
Authority
John Samuelsen, Transport Workers Union of America
AFL-CIO
Vacant
Kerene Tayloe, WE ACT for
Environmental Justice
Craig Turner, Buffalo Niagara
International Trade Gateway
Organization
Nancy Young, Airlines for America
Bob Zerrillo, New York Public Transit
Association
Julie Tighe, NYS League of
Conservation Voters

6
Transportation Advisory PanelOpportunities and Policies for Hydrogen and Biofuels
Dr. Geoff MorrisonThe Cadmus Group
March 18, 2021
Outline
7
1. Project Status
2. State of Hydrogen and Biofuels in NYS
3. Role of Hydrogen and Biofuels in Deeply Decarbonized Sector
4. Policy Insights

Status of NYS Clean Transportation RoadmapModel calibration complete. Currently generating preliminary results.
Model Calibration
Model DevelopmentData Collection
Finalize Results
Preliminary Results
Final Report
2020 Q1 2020 Q2 2020 Q3 2020 Q4 2021 Q1 2021 Q2

Agenda
9
1. Project Status
2. State of Hydrogen and Biofuels in NYS
3. Role of Hydrogen and Biofuels in Deeply Decarbonized Sector
4. Policy Insights

State of H2 & Biofuels | Barriers to AdoptionBarriers vary by vehicle and fuel type (High implies barrier is larger)
Source: Author analysisLow / Medium / High refer to the level of complexity, cost, risk, etc.
Barriers Hydrogen BiofuelsAvailability of low- and zero-carbon feedstocks/resources High Medium
Access to distribution and fueling infrastructure High Low
Cost of compatible vehicles High today, Low projected Low
Fuel cost High today, Low projected Medium
Public awareness/familiarity Medium Medium
Tunnels/bridges restrictions Medium N/A
Station permitting process Medium N/A
Cold weather N/AMedium
(Biodiesel gelling)

State of H2 & Biofuels | Fuel Availability
Fueling Station Type New York Share of U.S.Year Data Collected
E85 68 stations 1.8% 2021
Motor Gasoline 4,974 stations 4.4% 2018
Electricity 5,744 plugs 5.8% 2021
Hydrogen 0 dispensers* N/A 2021
Active fueling stations by type in NYS.
*There is one non-public hydrogen dispenser in New York State

Agenda
12
1. Project Status
2. State of Hydrogen and Biofuels in NYS
3. Role of Hydrogen and Biofuels in Deeply Decarbonized Sector
4. Policy Insights

Role of H2 & Biofuels | Electrification StrategyGrid carbon, timing, and technology availability important factors in when to electrify
Source: ClimateWorks (2018) www.climateworks.org/blog/2050-priorities-for-climate-action-electrify-everything-is-too-simple/
Scale Now: activities that can quickly and cost-effectively benefit from electrification with available technologies at current or expected levels of emissions intensity.
Scale Later: activities that (1) will benefit from electrification at future expected emissions intensity levels and/or (2) rely on technologies still under development.
Hard to Electrify: activities require alternative approaches because at present they face very high barriers to electrification and those that (1) might never benefit from electrification in terms of emissions reductions or (2) lack a counterpart technology or application that is readily electrified.

Role of H2 & Biofuels | Hard to Electrify Sub-sectorsDaily energy requirements and stock turnover rates of some MHDV, Non-Road, Marine, and Air use cases driver hydrogen and biofuels.
Source: CALSTART and FIER Automotive & Mobility (October 2020) https://globaldrivetozero.org/site/wp-content/uploads/2020/12/Moving-Zero-Emission-Freight-Toward-Commercialization.pdf

Role of H2 & Biofuels | Vehicle Lifetimes
0 5 10 15 20 25 30
Aircraft
Marine Freight
Ferries
Long Haul Trucks
Intercity Buses
Refuse Trucks
Vans
Transit Buses
Equipment Lifespan (yrs)
2020 2035 2050
3 Replacements
3 Replacements
2-3 Replacements
2-3 Replacements
2 Replacements
1-2 Replacements
1-2 Replacements
1-2 Replacements
Longer lifetimes mean fewer replacement cycles and greater need for drop-in fuel options (e.g., new aircraft built in 2030 may still be used in 2050).

Agenda
16
1. Project Status
2. State of Hydrogen and Biofuels in NYS
3. Role of Hydrogen and Biofuels in Deeply Decarbonized Sector
4. Policy Insights

Policy Insights | High-Priority PoliciesMatrix shows suitability of policies across three dimensions
Equity & Public Health
BiofuelsHydrogen
FCEVs
Little Benefitc
Large Benefitd
Mixed Benefits
N/ALarge
Benefit
N/ALarge
Benefit
Note: a Liquid biofuels; b Hydrogen and renewable natural gas; c Similar to petroleum-based fuels; d Hydrogen for MHD fuel cell vehicles.
PolicyEffectiveness
BiofuelsHydrogen
FCEVs
Incentives for Distribution and Fueling Infrastructure
Low Medium
Low Carbon Fuel Standard
Medium
Advanced Clean Cars II N/A Medium
Advanced Clean Trucks Rule
N/AHigh
Economics & Finance
BiofuelsHydrogen
FCEVs
$a $$$b
$
N/A $
N/A $
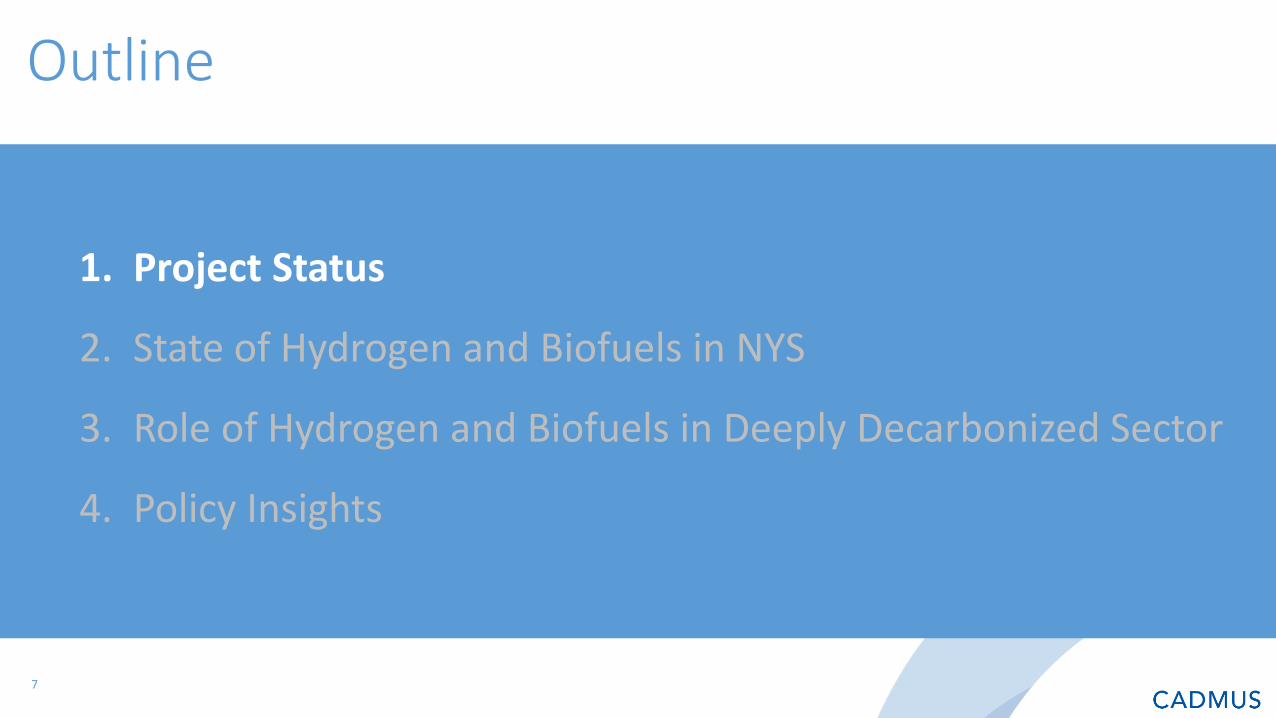
Policy Insights | California FCEV and Station Deployment
18
California has taken five years to reach ~6,000 FCEVs deployed.
Actual registrations have lagged OEM projections since 2015
Key Points• 48 publicly-accessible H2
refueling stations in California and 42 additional stations under construction
• CARB estimates $300M required to get to self-sufficiency of stations (beyond original $135M investment) (CARB 2021)
• FCEVs have not met OEM projections each year since 2015.
• FCEV deployment is no longer on track to meet California’s 2025 and 2030 FCEV goals.
Source (CARB, 2020)
Blue band shows OEM projections
5/22/2020 draft of ongoing analysis – not for distribution

Policy Insights | LCFS Growth PathPROVISIONAL FINDINGS – FINAL RESULTS STILL UNDER REVIEW
By Year 9, BMBD (Ren. Diesel & Biodiesel) grew to ~25% of diesel pool
0%0%20%
8%
72%
0%
Year 1
0%
1%
19%
8%
72%
0%
Year 4
1%4%
15%
8%
71%
1%Year 9
0%
2%30%
8%60%
0%
Year 1
0%3%
29%
7%61%
0%Year 4
California LCFS(Fuel Volume)
Oregon CFS(Fuel Volume)
Fuel Volumes (Gals Equiv)

Policy Insights | Equity and LCFS
Policy Design Choices to Enhance Equity
Least-cost GHG reductions may not spread benefits evenly across communities
Pair GHG programs with programs that specifically target co-pollutants to ensure local impacts are addressed
Uniform price signals may have disproportionate impacts on LMI households
Focus investment of program revenues in disadvantaged communities
Equity Challenge Design Solution

Policy Insights | Tailpipe Emissions of BiofuelsConflicting studies on tailpipe emissions of biofuels make it challenging to gauge health and equity impacts
• Biodiesel. Most studies show lower tailpipe emissions except NOx
• Renewable Diesel. Most studies show reduction across all pollutants. Some studies show increase in NOx.
• Renewable Natural Gas. Tailpipe emissions very similar to CNG.
Source of graphic: Na et al. (2015) Impact of biodiesel and renewable diesel on emissions of regulated pollutants and greenhouse gases on a 2000 heavy duty diesel truck. Atmospheric Environment 107, 307-314.

Review of Advisory Panel Recommendations Template
• Fuels
• Market Based Policies/Funding and Finance

24
Mitigation strategy summary Financing and Market-Based PoliciesDraft Material
Initiative #
Description Action type Emissions impact
Ease of implementation
Cost
Facilitating Private Financing Enabling N/A medium $
Cap&Invest (TCI-P) or Carbon Pricing Mitigation/Enabling medium medium $
Clean Fuel Standard Mitigation/Enabling medium hard/medium $
Feebates (electrification) Enabling N/A medium $
Curb Pricing Mitigation low medium $
Congestion/Variable/Demand Parking Pricing
Mitigation/Enabling low hard $
Mileage Based User Fees Enabling N/A hard $$$
Tax Increment Financing/Special Assessment Districts
Enabling N/A medium $
Registration Fees Enabling N/A Easy $

25
Mitigation Strategy – Clean Fuel StandardDraft Material
Description: Implement a Clean Fuel Standard to support electrification of transportation, achieve near-term emission reductions while the transition to electrification is underway and provide cleaner fuels for hard-to-electrify subsectors.
Action type: Regulatory (DEC)
GHG reduction by 2030: Medium (and enables electrification) GHG reduction by 2050: Low (enabling for electrification)
Cost and funding considerations:
Agency costs for program management and additional staff will be sizable if using NY-specific methodology. A substantial annual transfer would be expected from fossil fuel producers/ consumers to bioenergy producers, electric/hydrogen vehicle owners, charging infrastructure owners, and transit operators.
Ease of implementation: Hard if using NY-specific carbon intensity calculations instead of CARB pathways.
Example case studies: California Low Carbon Fuel Standard and Oregon Clean Fuel Standard
Risks / Barriers to success Possible mitigants
1. Some biofuels would not generate credits under CLCPA accounting.
2. Low income citizens, who are less able to afford electric vehicles, may bear the costs of petroleum fuels longer.
3. Lack of regulatory infrastructure (staff/ITS systems)4. Out-of-state waste emission reductions/sequestered
emissions may not be creditable under CLCPA methodology
1. Consider adopting CARB carbon intensity; set program stringency to align with achievable reductions.
2. Provide enhanced incentives for lower-income consumers; disadvantaged communities will benefit from ZEV and ZEVSE deployment for medium and heavy duty fleets.
3. Staff will need to be increased and IT systems developed; adoption of CARB carbon intensity would reduce the burden.
4. Apply CARB methodology.

26
Mitigation Strategy – Clean Fuel StandardDraft Material
Components required for delivery(Brief description of action required)
Implementation lead(Entity responsible for completing)
Time to implement(Time required to implement)
Other key stakeholders(Entities that need to be engaged)
Program DevelopmentOption 1: CLCPA-compliant gross emission methodologyOption 2: CARB net emission methodology
DEC/DPS/NYSERDA 1 year Fuel producers and suppliers, airline and oil heat industries, utilities, MTA
Regulation Promulgation DEC 1 year Regulated industry
Develop staff and IT systems DEC unknown ITS, DOB
Investment in green H2 infrastructure NYSERDA (Ag&Mkts?, ESD?)
2-3 years Fuel distributors, service station owners, clean energy providers

27
Mitigation strategy – Clean Fuel StandardDraft Material
Anticipated Benefits and Impacts
Disadvantaged communities
Reduction in localized air pollution in disadvantaged communities from electrification and lower-emission fuels. Benefits will be enhanced by complementary policies to support LMI access to affordable EVs and medium- and heavy-duty vehicle electrification.
Health and co-benefits In the near term there may be modest reductions in some air pollutants (particularly particulate matter) due to fuel changes. Long term major health benefits will follow from vehicle electrification, the expansion of which may be accelerated by a Clean Fuel Standard
Just transition: businesses and industries, workers
Little initial impact on transportation fuel supply industries. Long term, fossil fuel industries will contract due to increased deployment of low carbon fuels, including vehicle electrification, with electricity and biofuels (and possibly hydrogen) supply industries expanding in their place. Workers from the conventional fossil fuel industry can transition to employment in the low carbon fuel industries, especially liquid biomass-based diesel substitutes.
Other Implementation of CARB approach would be much simpler from an administrative perspective; CLCPA methodology would still have to be applied in determining progress towards CLCPA emission limits. Transfer of money from petroleum suppliers to electric rail transit operators (primarily MTA) would help fund transit priorities.

28
Enabling initiative – Electrification Financing: Overview Draft Material
Description: Public & private approaches to electrification financing
Action type: Financial; NYS agencies’ programs & policies that augment public & private fleet electrification financing and EVSE investment and expansion.
Cost and funding considerations:
$$; A combination of existing funding (MHD EV incentive programs, NY Green Bank financing, PSC Make-Ready Program) and new funding (additional MHD EV incentives targeting DACs, financial support to subsidize FLPP, support for electrification transition feasibility studies, support for residual value risk analysis, and financing market gap solutions) will support this effort
Ease of implementation: Medium; new programs need to be established, but can be based on proven models
Example case studies: Financial markets (first loss protection); NY Green Bank financing of distribution center electrification project; Highland Electric: Maryland school bus electrification program
Risks / Barriers to success Possible mitigants
1. Need to find the right NYS entity to serve as product sponsor for first loss protection (FLP)2. Current MHD EV program qualifications and restrictions are difficult for lower-income truck owners and small fleets to meet.3. School districts & transit agencies’ hesitancy to transition; statutory inability to 1) convert from CapEx-oriented procurement to OpEx long term service procurement; and 2) commit to long term bus electrification projects.4. EV stakeholders find NY Green Bank’s financing products & terms unattractive. EVSE projects have unfinanceable utilization risk.
1. Enabling rules/legislation; collaboration with existing private market FLP providers.2. Liberalized income-criteria & scrappage voucher-program qualifications to facilitate financing in disadvantaged communities.3. Offer grants for evaluation/feasibility studies; enabling legislation for multi-year Energy Services Agreement (ESA) commitments.4. Expansion of NYGB programs (incl. beyond NY State-only nexus); capital allocations (through expanded charter) to higher-risk electrification categories. NYSERDA provides a minimum level of revenue certainty to EVSE projects with high level of utilization risk.

29
Components required for delivery(Brief description of action required)
Implementation lead(Entity responsible for completing)
Time to implement(Time required to implement)
Other key stakeholders(Entities that need to be engaged)
Establish a First Loss Protection product based on existing financial market instrument and practice• Identify a product sponsor (NY State agency/entity) and identify size
and type of subsidy/incentive/authorization required to make this product marketable
• Conduct Residual Value (RV) risk analysis to price the insurance product
• Secure private-market practitioner involvement
NYSERDA, NY Green Bank
1-2 years Commercial banks & insurance co’s; fleet operators; EVSE developers, US DOE LPO; National Climate Bank
Expand MHD EV incentive programs, with a focus on higher incentives for fleets in DACs and small fleets
NYSERDA, DEC, NYSDOT
1-3 years Fleet operators; EJ stakeholders
Enabling initiative – Electrification Financing: Components of the strategyDraft Material

30
Components required for delivery(Brief description of action required)
Implementation lead(Entity responsible for completing)
Time to implement(Time required to implement)
Other key stakeholders(Entities that need to be engaged)
Support feasibility studies for MHD fleets, including school districts & transit agencies, to identify benefits, costs, logistical challenges, financing options, other barriers to electrification• In addition to utility fleet assessment services, which focus primarily
on charging of EVs
NYSERDA, State Ed, NYSDOT
6 months - 1 year Utilities, OEMs & EVSE stakeholders; fleet operators; engineering firms; ESD & REDCs
Support additional financing options that expand EVSE adoption• Expand NYGB’s mission to take on more risk in defined categories of
electrification financing• Supplement CapEx financial support for EVSE (e.g., rebates) with
revenue support (e.g. minimum revenue coverage) to qualifying EVSE infrastructure projects
NYSERDA, NY Green Bank, DPS
1-2 years OEMs & EVSE stakeholders; commercial banks; utilities
Enabling initiative – Electrification Financing: Components of the strategy Draft Material

31
Enabling initiative –Electrification Financing: Benefits and impacts Draft Material
Anticipated Benefits and Impacts
Disadvantaged communities
Liberalizing voucher qualifications for low-income applicants will drive EV adoption in these communities, and accelerate development of a liquid & deep used-EV commercial vehicle market.
Health and other co-benefits
Collectively, these initiatives will accelerate fleets’ electrification transition. Since air quality around ICE/diesel fleet depots is generally impaired by diesel truck emissions, this will bring cleaner air and related health benefits to populations living in vicinity of depots (which are generally disadvantaged communities).
Just transition: businesses and industries, workers
Collectively, these initiatives will bring economic, employment and health benefits to disadvantaged communities: their businesses, employees, and populations. Job training programs are to be considered as complementary initiatives.
Other These strategies complement public funding to support electrification and modernize transit bus fleets; more successful financing strategies can reduce the public funding needed for electrification incentives.

32
Mitigation strategy –Cap & Invest/Carbon Pricing OverviewDraft MaterialDescription: Policies reduce emissions directly and support further emission reductions and the transition to a cleaner, more
efficient transportation system. Transportation Panel recommends potential participation in TCI-P unless the Climate Action Council opts for a multi-sector carbon pricing approach that provides at least the same level of support for reducing transportation sector emissions.
Action type: Regulatory (NY Joins TCI-P); legislative (economy-wide carbon pricing policy)
GHG reduction by 2030:
Medium (and enables other strategies) GHG reduction by 2050: Medium (and enables other strategies)
Cost and funding considerations:
This policy will directly reduce emissions and raise revenues by placing an auctioned allowance fee on fossil fuel component of on-road motor fuels. Fuel providers may choose to pass this cost onto consumers. Proceeds from the auction of allowances would be reinvested into improving infrastructure and reducing emissions. Efficient investment of revenues would yield a net positive to society, including improved public health. These policies would constitute an inter-economy transfer and would not impose a net resource cost.
Ease of implementation:
Medium to hard. Transportation has been part of economy-wide cap-and-invest programs and the TCI-P program provides a regional transportation sector model to adopt, similar in many ways to RGGI. Many stakeholders are supportive with notable exception of some environmental justice organizations and their allies.
Example case studies: Carbon prices in Canada and Europe. Economy-wide cap-and-Invest in California and Quebec.Risks / Barriers to success Possible mitigants1. Potential for funds to be used for unrelated purposes.2. Some EJ stakeholders are distrustful of market-based programs.3. The level of the TCI-P cap may fall short of the level of
transportation reductions needed to meet CLCPA targets and may not raise enough proceeds to fully fund the TAP recommendations that require funding.
1. A legislative “lock box” could ensure that proceeds can only be spent on clean transportation or other program purposes.
2. Ensure investments reduce emissions and provide other benefits in disadvantagedcommunities and areas with high levels of transportation emissions.
3. Increase program stringency at program review or establish a separate program; target funding to most impactful investments.

33
Mitigation strategy –Cap&Invest/Carbon Pricing Components of the strategyDraft Material
Components required for delivery(Brief description of action required)
Implementation lead(Entity responsible for completing)
Time to implement(Time required to implement)
Other key stakeholders(Entities that need to be engaged)
Option 1: Potential for New York to join TCI-P DEC, NYSERDA, DOT
1 year Fuel industry, disadvantaged communities, public health practitioners
Option 2: multi-sector economy-wide carbon pricing or cap-and-invest policy – if included by Climate Action Council in Scoping Plan
NA NA NA
34
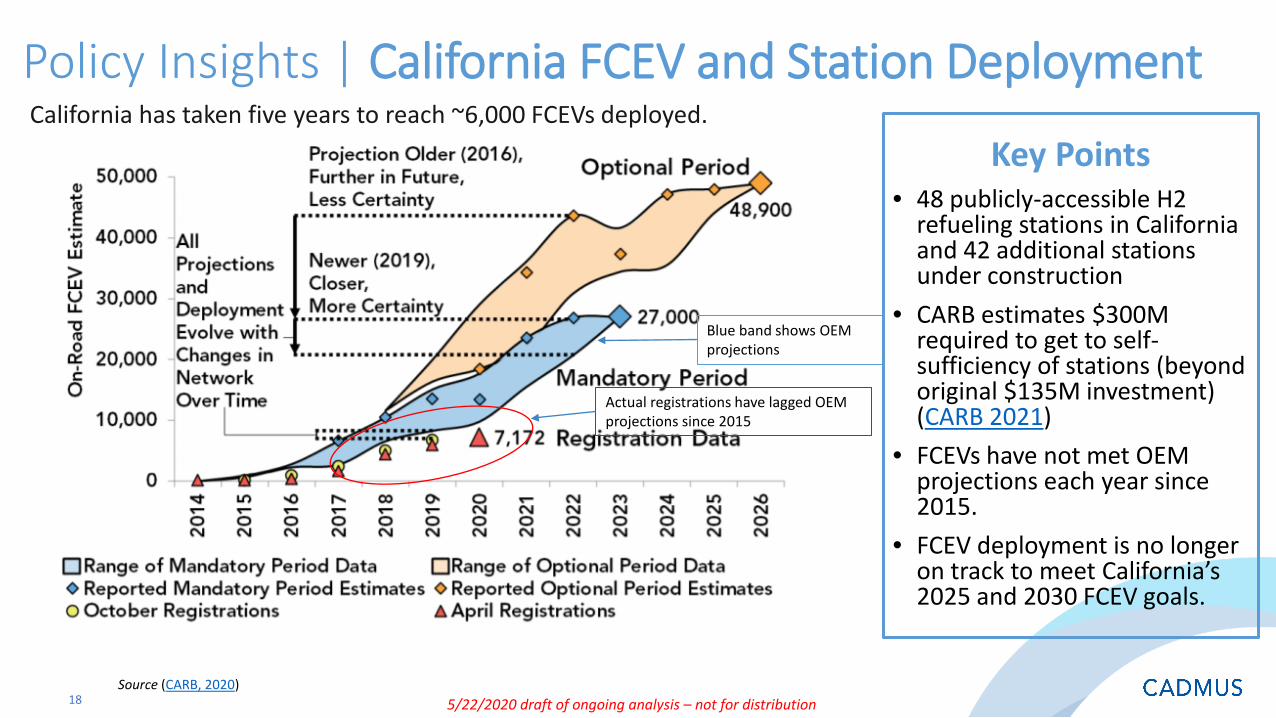
Mitigation strategy – Cap&Invest/Carbon Pricing Benefits and impactsDraft Material
Anticipated Benefits and Impacts
Disadvantaged communities
Although a cap-and-invest policy does not necessarily achieve emissions reductions in specific locations, the investments can be targeted to achieve that goal. The highest and best use of the proceeds would be to invest more than at least 35-40% of the proceeds in programs that specifically reduce emissions and provide other benefits in disadvantaged communities. Engage disadvantaged communities in developing investment priorities.
Health and co-benefits Health benefits will come from the investment of proceeds. Prioritizing investments in electric trucks and buses in areas of high pollution or high population density can maximize the reductions in air pollutants.
Just transition: businesses and industries, workers
Proceeds can be invested in ways that support a just transition for workers and disadvantaged communities. Investments can also lessen the impact on businesses such as helping convenience stores transition to providing EVSE and can also help ease the transition to new fuels technologies by funding opportunities to train mechanics to service new vehicles. Participation in the regional TCI-P maintains level playing field for NY businesses in regional economy.
Other Cap-and-invest programs ensure emissions reductions; carbon pricing does not. As a regional program, TCI-P ensures a designated level of regional reductions, but resulting reductions might vary among the participating states. Implementation of a cap-and-invest program should not be considered to preclude other strategies to fund maintenance of current infrastructure.

35
Mitigation strategy – Various market-based/financing policies OverviewDraft Material
Description: Various market-based policies will support electrification, public transportation, smart growth and other transportation goals. These policies complement the other more specified strategies, including recommendations for TCI-P participation, clean fuel standard, private financing strategies and feebates
Action type: Regulatory, financing, legislative
GHG reduction by 2030: low GHG reduction by 2050: low
Cost and funding considerations:
All policies are intended to be self-funding and will provide financial support for other policies and goals
VariousEase of implementation:
Example case studies: Oregon - VMT/MBUF pilot; London - Congestion Pricing; Seattle - Curb Pricing; Hudson Yards/#7 Line Extension -Tax Increment Financing; Demand Parking Pricing – Washington DC; California – registration fees to fund EVSE
Risks / Barriers to success Possible mitigants
1. Individuals may object to paying for services, like parking, that were previously free or lower cost
2. Drivers may object to incurring fees for access to locations that were previously complimentary, especially in EJ Communities
3. Home rule will preclude state action without local partnership for some policies
1. Fees can fund access to improved transit service and other alternatives to driving
2. Provides more livable communities3. Engage with localities; provide them with portion of proceeds

36
Mitigation strategy – Various market-based/financing policies Components of the strategyDraft Material
Components required for delivery(Brief description of action required)
Implementation lead(Entity responsible for completing)
Time to implement(Time required to implement)
Other key stakeholders(Entities that need to be engaged)
Congestion/Variable Pricing/Demand Parking – coordinate with municipalities; State Legislature; Federal Highway Administration
DOT, municipalities 1-3 years Municipalities, parking authorities,
Vehicle registration fees. Legislation would be required. DMV 1 year Car dealers, AAA
Mileage-Based User Fees – evaluate pricing level to maintain investment level first with and eventually without gas tax revenues. Legislation would be required
DOT, DTF 3-years Fuel/charging providers, AAA, public transportation sponsors
Tax Increment Financing/Special Assessment Districts Municipalities/DTF 1-2 years Municipalities, public transportation sponsors, developers
Curb Pricing Municipalities/DTF 1-2 years Public transportation sponsors, developers

37
Mitigation strategy – Various market-based/financing policies Benefits and impactsDraft Material
Anticipated Benefits and Impacts
Disadvantaged communities
As a direct result of these funding mechanisms, disadvantaged communities will benefit from reduced pollution in congested urban areas, increased infrastructure investment and from enhanced transit access. These funding mechanisms can raise revenue to support emission reduction activities put forward in the other Transportation Advisory Panel recommendations, which are targeted toward disadvantaged communities.
Health and co-benefits As a direct result of these funding mechanisms, there would be a decline in peak hour pollution with resulting public health benefits. These funding mechanisms can raise revenue to support emission reduction activities put forward in the other Transportation Advisory Panel recommendations, which will result in broader health and economic benefits.
Just transition: businesses and industries, workers
Projects funded by tax increment financing will create jobs; may potentially drive-up housing costs
Other

NYS Electric Vehicle Programs

• $53.9M incentive pool supporting medium and heavy-duty trucks, transit buses, school buses, and repowers
• Funded by VW Settlement, DOT CMAQ program
• Point-of-sale discounts (vouchers) to reduce the cost of all-electric and alternative fuel trucks and buses
• Brings together vehicle manufacturers, dealers, and fleets to get cleaner trucks and buses on the road
• Scrappage ensures removal of the oldest, dirtiest diesel engines from New York State roads
New York Truck Voucher Incentive Program

1 CMAQ $10M
2 $3.6M
3 $4.8M
4 $33.0M
5 $2.0M
6 $0.5MTOTAL $53.9M
Amount
Volkswagen Settlement
# Funding Source Vehicle Types
Class 3-8 Battery Electric Vehicles
Class 8 Trucks
Class 4-8 Electric Transit Buses
Class 4-8 Propane & CNG School Buses
Class 4-7 Trucks
Class 4-8 Electric School Buses (Round 1)
Current Funding

3 4 5 6 7 8BEV 95% $ - 100,000$ 110,000$ 125,000$ 150,000$ 185,000$
FCEV 95% -$ 100,000$ 110,000$ 125,000$ 150,000$ 185,000$ PHEV 90% -$ 55,000$ 60,000$ 70,000$ 100,000$ 120,000$ HEV 90% -$ 25,000$ 35,000$ 45,000$ 50,000$ 55,000$ CNG 90% -$ 30,000$ 40,000$ 50,000$ 55,000$ 60,000$
Propane 90% -$ 30,000$ 40,000$ 50,000$ 55,000$ 60,000$ BEV 100% -$ 100,000$ 125,000$ 150,000$ 250,000$ 385,000$
FCEV 100% -$ 100,000$ 125,000$ 150,000$ 250,000$ 385,000$ BEV 100% -$ 100,000$ 120,000$ 150,000$ 200,000$ 220,000$ CNG 90% -$ 30,000$ 40,000$ 50,000$ 55,000$ 60,000$
Propane 90% -$ 10,000$ 10,000$ 10,000$ 10,000$ 10,000$
90,000$ 100,000$ 110,000$ 120,000$ 150,000$
Transit Buses
Other Buses and Trucks
BEV 80% 60,000$
School Buses
On-Road Trucks
Voucher Amounts and Caps
Fuel TypeIncremental
Cost %Vehicle Weight Class (GVWR)
Vehicle Type
Voucher Amounts

> Original Program (2014 through June 2018)
> Current Program (since Sept 2019, includes pending and completed vouchers)
Technology # Fleets # Vehicles Voucher FundsEV 18 65 $5,673,093CNG 4 71 $3,033,524CNG Conversion 4 15 $334,272Hybrid (HEV) 22 83 $1,198,179HEV Conversion 3 236 $1,830,776DPF 9 124 $2,452,305Total 60 594 $14,522,149
NY Truck Voucher Incentive Program
Technology # Fleets # Vehicles Voucher FundsEV 13 43 $10,910,045CNG 2 42 $2,357,742Total 15 85 $13,267,787
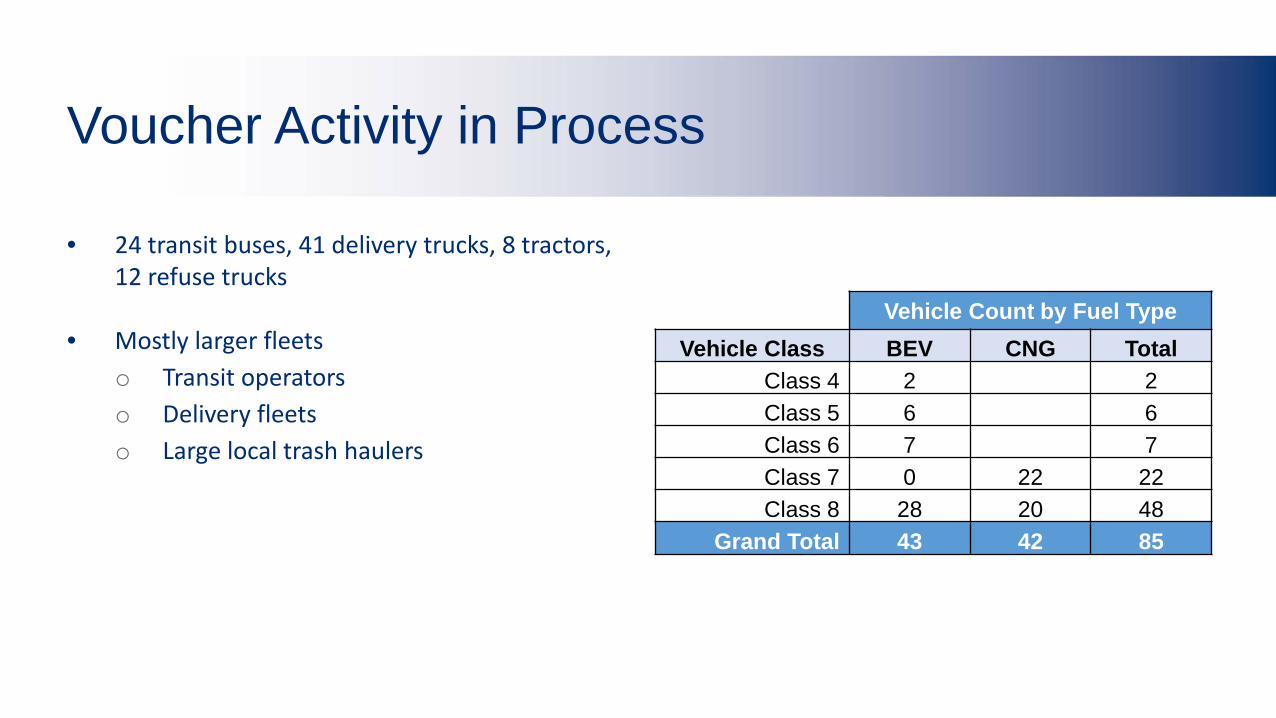
Vehicle Count by Fuel TypeVehicle Class BEV CNG Total
Class 4 2 2Class 5 6 6Class 6 7 7Class 7 0 22 22Class 8 28 20 48
Grand Total 43 42 85
• 24 transit buses, 41 delivery trucks, 8 tractors, 12 refuse trucks
• Mostly larger fleetso Transit operatorso Delivery fleetso Large local trash haulers
Voucher Activity in Process

• Program launched in March 2017
• Over 50 models from 23 manufacturers to choose from
• Applications approved for over 35,000 EVs (as of Dec 2020)
o 49% Plug-in hybrid electric vehicles (PHEVs)
o 51% Battery electric vehicles (BEVs)
• $52.5 million provided to date
• $2.5 million remaining
Drive Clean Rebate Program for EVs

Drive Clean Rebate Program for EVs


> PSC Make-Ready Program• $701M in ratepayer-funded investments across NY’s six IOUs to install over 50,000 EV
charging stations by 2025, support truck and bus charging• Over $200M targeting disadvantaged communities, including $85M prize competition
> NYPA EVolve NY• $250M investment in DC fast chargers, fleet charging statewide, EV outreach
> NYSERDA Charge Ready NY• $17M in rebates for Level 2 charging stations at public, workplace, MUD locations - $7M
remaining> NYSERDA DCFC Program
• $11M in grants for DC fast chargers in upstate regions, funded by VW Settlement
NYS EV Charging Programs

• Applications approved for over 2,400 charging ports
• Of these, more than 1,900 charging ports completed at 400 locations
• Installed cost range from $3,500 -$9,000 per port
Charge Ready NY Data to Date

Next Steps/Open Discussion
www.Climate.ny.gov
• Incorporate refinements to the recommendations based on public input and cross panel/work group coordination
• Coordinate with Land Use and Local Government/other on integration of adaptation/resilience strategies
• Aggregate emissions impact of Panel recommendations
• Finalize/adopt recommendations for submission to the Climate Action Council

Future Meetings
www.Climate.ny.gov
• April 9, 2021 from 1:00 PM to 3:00 PM
• Equity and Public Health Roundtable – tentatively scheduled for first week in April (details to follow)
• Expert Freight Roundtable – tentatively scheduled for last week of April/first week of May (details to follow)

www.Climate.ny.gov
• Electrification - presented on February 18, 21
• Public Transportation - presented on March 9, 2021
• Smart Growth - presented on March 9, 2021
Draft Recommendations Previously Presented to the Advisory Panel

52
Mitigation Strategy Summary
Initiative #
Description Action type Emissions impact
Ease of implementation
Cost
1 Transition to 100% zero-emission light duty vehicle sales
Regulatory, Financial, Legislative
High Medium $$$
2 Transition to zero emission Medium/Heavy Duty Vehicles & Non-Road Vehicles
Regulatory, Financial, Legislative
Medium Medium $$$
Draft Material
*Note: Draft recommendations and associated timeframes that include regulations will depend on the type of regulation and its governing body and legislation, State Administrative Procedure Act rulemaking requirements and timelines, an ongoing assessment of feasibility, impacts and analysis of what timeframes are needed to meet New York State's climate goals.

53
Mitigation Strategy: 100% Zero Emission Passenger Vehicles -- Overview
Description: Transition to 100% zero-emission light duty vehicle sales
Action type: Regulatory, Financial, Legislative
GHG reduction by 2030: Medium GHG reduction by 2050: High
Cost and funding considerations:
$$$ - Nearly $1B in ratepayer and NYPA funding is already committed for EV charging station installations. ZEV incentives can be supported through a revenue-neutral feebate, but additional assistance may be needed to help LMI New Yorkers replace old gasoline vehicles with ZEVs
Medium – some elements of this strategy have already been implemented in NYS; others are new to NYS but have been tried elsewhereEase of implementation:
Example case studies:Risks / Barriers to success Possible mitigants
1. Lack of consumer awareness/interest and consumer concerns about technology & charging
2. Potentially high cost of supporting charging infrastructure and ZEV incentives
3. Unmanaged charging could have significant costs for electric grid operators/ratepayers
1. Coordinated and cooperative marketing campaign with industry partners
2. ZEVs are expected to reach price parity with gasoline cars by 2028; charging stations are better investments with more ZEVs on the road
3. Utility managed charging programs and TOU rates can help shift charging to lower cost off-peak times
Draft Material

54
Mitigation Strategy: 100% Zero Emission Passenger Vehicles – Components of the Strategy
Components required for delivery(Brief description of action required)
Implementation lead(Entity responsible for completing)
Time to implement(Time required to implement)
Other key stakeholders(Entities that need to be engaged)
Adopt Zero Emission Vehicle sales regulations DEC 1-2 years NYSERDA, OEMs, car dealers, utilities
Fuel-related regulations that support ZEV technology deployment DEC/NYSERDA 1-2 years Fuel producers, utilities, fleet users
EV Charging/Fueling Station investments, focused on disadvantaged communities, multiunit dwellings, fast charging, EV-ready building codes
DPS/NYPA/Utilities/ NYSERDA/NYGB
3-12 months EV charging station developers
Feebate/ZEV purchase incentives, higher for LMI ZEV purchases; include used ZEVs
DEC/NYSERDA/ DOB 1-2 years Car dealers, OEMs
ZEV Awareness-Building Activities NYPA/NYSERDA 6-12 months Car dealers, OEMs, utilities, local businesses
Utility Rate Design Changes DPS 6 months-2 years NYPA, NYSERDA, utilities, technology providers, EV charging station developers
Reduce ZEV sales barriers (direct-to-consumer sales by ZEV-only manufacturers, dealer incentives)
Legislature/DMV 3-6 months OEMs, car dealers
Draft Material

55
Mitigation strategy: 100% Zero Emission Passenger Vehicles – Benefits and Impacts
Anticipated Benefits and Impacts
Disadvantaged communities
Enhanced incentives for residents of disadvantaged communities are essential for faster ZEV adoption in disadvantaged communities. Incentives that support used ZEV purchases and EV charging at multifamily buildings can be especially effective at increasing ZEV adoption among underserved populations. Local ownership of EV charging stations and workforce development can support economic opportunities in disadvantaged communities.
Health and co-benefits Zero emission vehicles improve local air quality, with public benefits including improved public health, including a reduction in asthma and other respiratory illnesses
Just transition: businesses and industries, workers
Some ZEV components are made in NYS. New jobs will be created to service and fuel EVs. Installing charging stations will provide employment opportunities. Current repair technicians will likely need to be trained to service EVs. Businesses such as vehicle dealerships, parts manufacturing, gas stations, repair shops, and parts retailers may be adversely impacted as vehicle sales shift from internal combustion vehicles to ZEVs. Workforce development in disadvantaged communities.
Other Regulatory strategies are aligned with other jurisdictions.
Draft Material

56
Mitigation Strategy: Zero Emission Trucks, Buses and Heavy Equipment – Overview
Description: Transition to zero emission Medium/Heavy Duty Vehicles & Non-Road Vehicles
Action type: Regulatory, Financial, Legislative
GHG reduction by 2030: Medium GHG reduction by 2050: Medium
Cost and funding considerations:
$$$ - Incentives will be needed to encourage fleets to buy zero-emission trucks and help them install ZEV charging/fueling infrastructure until total cost of ownership improves compared to diesel trucks and private financing becomes more widely available
Medium – some elements of this strategy have already been implemented in NYS; others are new to NYS but have been tried elsewhereEase of implementation:
Risks / Barriers to success Possible mitigants
1. High upfront costs of electric trucks, buses, and equipment2. Fleets and private financial institutions have very little
experience with the technology3. High-powered charging and hydrogen fueling can be
expensive to install and can lead to high demand charges that make operating ZEVs expensive compared to diesel
1. Total cost of ownership parity is expected by 2030 or sooner; private financing can mitigate upfront costs
2. Data collection and reports from early state-funded projects3. Support for installing charging infrastructure from utilities,
others; creative approaches to utility rates that create appropriate rate options for high-powered charging
Draft Material

57
Mitigation Strategy : Zero Emission Trucks, Buses and Heavy Equipment - Components of the Strategy
Components required for delivery(Brief description of action required)
Implementation lead(Entity responsible for completing)
Time to implement(Time required to implement)
Other key stakeholders(Entities that need to be engaged)
Adopt Zero Emission Vehicle sales regulations DEC 1-2 years NYSERDA, OEMs, utilities
Fuel-related regulations that support ZEV technology deployment DEC/NYSERDA 1-2 years Fuel producers, utilities, fleet users, airlines
ZEV purchase incentives DEC/DOT/NYSERDA 1-2 years OEMs, fleet users
Utility Rate Design Changes DPS 6 months-2 years NYPA, NYSERDA, utilities, technology providers, fleet users
ZEV Charging/Fueling Station investments DPS/NYPA/Utilities/ NYSERDA/NYGB
3-12 months Fleet users
ZEV Equipment Use Requirements for State Fleet, Contractors DEC/DOT/OGS/Other State Agencies
3-5 years Construction companies, manufacturers
Fleet-based ZEV Use Requirements (e.g. ports) DEC, PANYNJ, other port facilities
3-5 years Fleet users, airlines
Draft Material

58
Mitigation strategy: Zero Emission Trucks, Buses and Heavy Equipment – Benefits and Impacts
Anticipated Benefits and Impacts
Disadvantaged communities Diesel trucks and port equipment are one of the largest sources of local air pollution in disadvantaged communities. Removing diesel trucks and port equipment from use and replacing them with ZEV trucks and equipment would have a sizable impact on improving air quality in disadvantaged communities. Local ownership of electric trucks and buses and their associated infrastructure can support economic opportunities in disadvantaged communities. Incentives can be targeted to disadvantaged communities.
Health and co-benefits Although they comprise only a small portion of total vehicles in the state, diesel trucks and buses are responsible for 30% of total PM and NOx emissions from mobile sources. Policies that encourage electrification of trucks, buses, and non-road equipment will generate significant public health benefits. These benefits will accrue across the state but will be especially noticeable along major highways and thoroughfares and in areas proximate to heavy industrial traffic, such as warehouse districts and ports which are often located near disadvantaged communities.
Just transition: businesses and industries, workers
Some ZEV trucks, buses, and construction equipment and their components are made in NYS. New jobs will be created to service and fuel ZEVs; training needed for current service technicians. Installing charging stations will provide employment opportunities. Businesses such as vehicle dealerships, parts manufacturing, gas stations, repair shops, and parts retailers may need to adapt as vehicle sales shift from internal combustion vehicles to ZEVs. Workforce development in disadvantaged communities.
Other Regulatory strategies are aligned with other jurisdictions.
Draft Material

59
Mitigation Strategy – Enhanced Public Transportation/MobilityInitiative # Description Action type Emissions
impactEase of
implementationCost
1 Identify implementable strategies to significantly enhance the availability; accessibility; reliability; and affordability of public transportation services with an emphasis on unserved/underserved communities. This includes:
• Doubling the service availability/accessibility of municipally sponsored upstate and downstate suburban public transportation services statewide; and.
• Implementing policies and programs that support system reliability/network expansion projects identified by the Metropolitan Transportation Authority (MTA) in their current five-year capital pan/twenty-year needs study.
Legislative, Regulatory, Financial
Low-Medium Medium $$$$
Draft Material

60
Transportation Oriented Development - Overview
Description: Transportation Oriented Development
Action type: Legislative, Regulatory, Financial
GHG reduction by 2030: Low-Medium GHG reduction by 2050: Medium
Cost and funding considerations:
• Requires new incentives to incorporate community/public transportation friendly development/redevelopment. • Disincentivizing auto dependency/congestion through pricing/parking strategies.• Compels - as a condition of funding/environmental approval - Industrial Development Agencies (IDA) and Metropolitan Planning
Organizations (MPO) to participate in the development/implementation of integrated transportation/land-use plans.
Ease of implementation: Medium/High – May infringe upon exiting local “Home Rule” governance authority.
Example case studies:Risks / Barriers to success Possible mitigants1. Requires fundamental changes to local land use planning/local home rule.2. May separate the construction/purchase of parking spaces from
residential/commercial development.3. Funding and finance policies to support recommended strategies.
1. Rely on incentives to encourage community-based development approach as opposed to requirements.
2. Develop integrated transportation/land-use plans.3. Create special assessments/districts to support projects (e.g., TIF,
Congestion/Parking Pricing, proceeds from market-based policies).
Draft Material

61
Convenience/Connectivity - Overview
Description: Convenience/Connectivity
Action type: Legislative, Regulatory, Financial
GHG reduction by 2030: Low-Medium GHG reduction by 2050: Medium
Cost and funding considerations:
• Operating and capital costs to: Provide first mile/last mile connectivity through accessible and integrated infrastructure. Increase the number of destinations that are accessible by public transportation, walking and biking. Provide high-quality amenities at public transportation facilities/stops. Accelerating new phone/app-based application technologies that provide real-time schedule information/makes transit easier to
use.
Ease of implementation: Medium – Requires expanding travel technology development/deployment to public transportation.
Example case studies:Risks / Barriers to success Possible mitigants1. Access to/understanding of new technology/trip planning platforms.2. Funding and finance policies to support recommended strategies.3. Influences of emerging technologies on services, workforce, deployment of new
technologies.
1. Partner with State/county departments of labor and health and human service organizations to create neighborhood-based mobility management/travel training centers.
2. Create special assessments/districts to support projects (e.g., TIF, Congestion/Parking Pricing, proceeds from market-based policies).
3. Develop/partner with existing community-based organizations on STEM initiatives.
Draft Material

62
Fleet Modernization - Overview
Description: Fleet Modernization
Action type: Legislative, Regulatory, Financial
GHG reduction by 2030: Medium GHG reduction by 2050: High
Cost and funding considerations:
• Procuring new zero-emission public transportation vehicles appropriate for the community being served.• Partnering with utility companies to consider opportunities for transportation right-of-way to generate energy for public transportation
services. • Investigating developments in hydrogen fuel cell bus technologies/other renewable fuels.
Ease of implementation: Medium – Requires new workforce skills to operate/maintain rollingstock; manufacturer capacity/capability to support.
Example case studies:Risks / Barriers to success Possible mitigants1. Funding and finance policies to support recommended strategies.2. Influences of emerging technologies on services, workforce, deployment of new
technologies.3. Availability of parts/supplies.
1. Create special assessments/districts to support projects (e.g., TIF, Congestion/Parking Pricing, proceeds from market-based policies).
2. Develop/partner with existing community-based organizations on STEM initiatives. 3. Establish price signals to suppliers/manufactures to ensure availability.
Draft Material

63
Mitigation strategies – Components of the Initiatives
Components required for delivery(Brief description of action required)
Implementation lead(Entity responsible for completing)
Time to implement(Time required to implement)
Other key stakeholders(Entities that need to be engaged)
Procure/deploy all-electric/zero-emission public transportation vehicles/recharging capacity.
DOT/OGS 7-10 years NYSDEC, NYSOGS, NYSERDA, Manufacturers utilities, municipal sponsors/authorities.
Provide new incentives to incorporate community-based/public transportation friendly development/redevelopment that mitigates harmful GHG emissions.
DOS/NYSERDA 1-2 years DEC, DOT, OGS, municipal sponsors/authorities, NYS Commercial Association of Realters, Environmental Justice Alliance, NYS Association for Affordable Housing, other.
Enhance service availability; accessibility; and affordability. DOT, municipal sponsors/authorities
2-5 years Federal Transit Administration, Industrial Development Agencies.
Make ready costs for support facilities. NYPA/Utilities 1-2 years DEC, NYSERDA, DOT.
Utility Rate Design Changes DPS 6 months-2 years NYPA, NYSERDA, Utilities.
Develop market-based policies to support transit use/generate funding. DEC 3-years NYSERDA
Require inclusion of public transportation considerations early in local/regional planning and development processes.
DOS 3-years DOT, municipalities, developers/realters.
Draft Material

64
Mitigation strategies - Benefits and Impacts
Anticipated Benefits and Impacts
Disadvantaged communities
• Mitigating transportation related pollution levels in overburdened communities by accelerating the deployment of zero-emission bus fleets/modernizing rollingstock support facilities.
• Enhancing service availability; accessibility; and affordability; of public transportation services for individuals in rural and urbanized areas.• Making public transportation easier to use/understand.• Providing direct connectivity to longer-distance bus/passenger rail services.
Health and co-benefits • Reducing harmful pollutants/enhancing air quality.• Mitigating higher asthma/other respiratory illnesses caused by carbon/pollutants. • Facilitating a holistic approach to community development/reducing the environmental footprint of transportation on communities.• Reducing per capita growth in vehicle miles traveled.
Just transition: businesses and industries, workers
• Creating new targeted opportunities/investments in STEM initiatives/disadvantaged communities. • Developing new supply chain/manufacturing capability/capacity and workforce.• Accelerating deployment/implementation of new technologies that support travelers/makes transit easier to use. • Developing/implementing new sustainable building practices and renewable energy innovation into stations/support facilities.
Other • Provide increased access to existing/attract new retail, hospitality, entertainment venues located within an enhanced transportation improvement district.
Draft Material

65
Enabling Strategy Summary
Initiative # Description Action type Ease of implementation
Cost
1 Align state and local policies and funding, as well as roadways and development, around Public Transportation-Oriented Development (PTOD)
Legislative, Agency/Program
Hard $$
2 Expand partnerships with businesses, economic development authorities, and local government to increase smart growth and transit use
Agency/Program Medium $
3 Expand low carbon transportation modes (biking, walking, carpooling, ride-sharing, micro-transit) for first/last mile connections to transit and destinations; encourage the business and economic development community to work more closely with public transportation officials in business location and expansion projects
Agency/Program Medium $
Draft Material

66
Enabling Initiative – Public Transportation Oriented Development - OverviewDescription: Broaden the traditional concept of Transit-Oriented Development (TOD) into the concept of Public
Transportation-Oriented Development (PTOD) for purposes of aligning land use, development and transportation funding with the goals of doubling public transportation expansion goals; support TOD in the process.
Action type: Legislative, Agency/Program
Cost and funding considerations:
$$; will require considerable alignment and coordination and inclusion of supportive services in programs.
Ease of implementation: Hard
Example case studies: See AppendixRisks / Barriers to success Possible mitigants
Will require a great deal of inter-governmental, inter-program coordination. The regional, multi-municipal nature of the effort may invoke Home Rule concerns.
Consider building off of existing regional entities and plans, such as the REDCs, NYSERDA Regional Sustainability Plans, NYSERDA Clean Energy Regional Coordinators and DEC Climate Smart Regional Coordinators.
Draft Material

67
Components required for delivery(Brief description of action required)
Implementation lead(Entity responsible for completing)
Time to implement(Time required to implement)
Other key stakeholders(Entities that need to be engaged)
Encourage and/or require collaboration among local authorities, transit operators, freight operators and economic development entities to more closely incorporate transportation options into land use planning, transportation planning, and economic development decisions
DOS, DOT, NYSERDA, DEC, ESD
1-2 years Municipalities, planners, developers, Chambers, transit operators, freight operators, economic development authorities
Provide technical support for local governments to improve their planning and zoning process to reflect transportation oriented development
DOT, DOS 1 year REDCs, Chambers, planners, transit operators
Encourage and/or require local governments to offer density bonuses around transit, reduced parking requirements, complete streets, other programs that improve transportation system
DOS, DOT 1-3 years Municipalities, planners, developers
Adopt alternative traffic data analysis systems in addition to Level-of-Service (LOS) for evaluating transportation investment decisions
DOT 1-2 years Planners, researchers
Produce research and materials that demonstrate links between planning & transportation, impacts on local finances
DOT, DOS, DEC, NYSERDA
1-2 years REDCs, Chambers, municipalities, developers, transit operators
Enabling Initiative – PTODComponents of the StrategyDraft Material

68
Components required for delivery(Brief description of action required)
Implementation lead(Entity responsible for completing)
Time to implement(Time required to implement)
Other key stakeholders(Entities that need to be engaged)
Encourage businesses seeking economic development incentives to consult transit agencies early and locate or expand in an area locate in areas with existing multi-modal options or provide services for employees
ESD 2-3 years REDCs, Transit operators, planners, regional planning councils
Prioritize, incentivize and expand access to funding for bike, pedestrian and complete streets projects that serve employment centers.
DOT 1-2 years Transit operators, mobility providers, municipalities
Support the infrastructure required to shift freight to lower-emission modes, like rail
DOT 1-2 years Freight operators, municipalities
Support local projects to establish low-emission transportation zones, car-free streets, and similar concepts
DOT, DOS, NYSERDA
2-3 years Municipalities
Support the inclusion of freight considerations in planning and zoning decisions
DOS, DOT 2-3 years Freight operators, municipalities
Enabling Initiative – PTODComponents of the Strategy (continued)Draft Material

69
Components required for delivery(Brief description of action required)
Implementation lead(Entity responsible for completing)
Time to implement(Time required to implement)
Other key stakeholders(Entities that need to be engaged)
Establish a definition and criteria for PTOD to be used by state, regional and local entities to evaluate projects and project funding; incorporate the definition of PTOD into the State Smart Growth Public Infrastructure Policy Act.
DOT/DOS 6-9 months Transit agencies, developers
Achieve Horizontal, Regional coordination—possibly built around or within the REDCs--among Public Transportation entities and Planning, Economic Development and Sustainability/Climate interests (including DOS Smart Growth, REDCs, Regional Planning Councils, NYSERDA and DEC Regional Coordinators, universities, CBOs and other relevant public and private entities).
DOS/DOT/NYSERDA/DEC
1 year REDCs, Chambers
Work with IDAs to and transit agencies to develop and proliferate tax incentive policies that incentivize transit planning, infrastructure and access.
ESD/DOT/Transit Agencies
1-2 years IDAs, Chambers, developers, planners
Ensure that transit entities and MPOs (where relevant) are consulted on any plan or GEIS/EIS being produced by a municipality for a development project or re-zoning that is proximate to, or impacts, public transit (rail station or BRT hub).
DOS/DOT 1 year Transit agencies, planners/regional planning councils
Adopt alternative traffic data analysis systems in addition to Level-of-Service (LOS) track daily travel behavior—i.e., when, where, how far people drive and how many individual car trips they take
DOT 6 months Think tanks
Enabling Initiative – PTODComponents of the StrategyDraft Material

70
Components required for delivery(Brief description of action required)
Implementation lead(Entity responsible for completing)
Time to implement(Time required to implement)
Other key stakeholders(Entities that need to be engaged)
Create policies that support local efforts to reduce parking requirements to support infill development near public transportation.
DOT/DOS 1-2 years Municipalities
Incentivize location of intermodal facilities (i.e. rail/truck) near transportation corridors eliminating need for longer- distance deliveries.
DOT 1 year Truckers, transit agencies
Expand/emulate the MTA’s policies with New York City Zoning Department to require easements and access improvements in exchange for density bonuses for projects around rail to other areas and transit entities in the State.
DOT/MTA 1-2 years
Create a revolving fund or grant program to support GEIS’ for re-zonings and projects in TOD districts or overlay zones—if a developer agrees to build according to the TOD zoning and accepts certain community benefits components, such as affordable housing, green infrastructure, green building or public spaces, the developer will pay back into the fund a portion of the cost of the GEIS.
DOT/DOS 1-2 years Municipalities
consider using TIFs for this purpose. DOT 2 years IDAs, municipalities
Support and inform the MTA’s efforts to develop a “First-Mile/Last-Mile Toolkit”; adapt the tool-kit to Upstate transit areas.
DOT 2 years Truckers, municipalities
Enabling Initiative – PTODComponents of the Strategy (continued)Draft Material

71
Enabling Initiative – PTODBenefits and Impacts
Anticipated Benefits and Impacts
Disadvantaged communities
Expanding Public transportation, with concomitant land use alignment and coordination, will help lower-income households that spend a disproportionate amount of income and time commuting. Both TOD and PTOD provide enhanced opportunities for affordable/mixed-income housing within existing communities, which helps address displacement and gentrification.
Health and other co-benefits
Any reduction in VMT/transportation-based GHG emissions will improve air quality and help reduce the incidence of disease caused or exacerbated by air pollution. Communities that are walkable/bikeable and provide safe and accessible outdoor spaces promote greater physical activity, which yields concomitant health outcomes (often referred to as “Active Living by Design”).Communities that enable and promote social interaction, partly through safe and accessible public gathering spaces and walkable design, will generate positive mental health outcomes by reducing social isolation, particularly for older New Yorkers who suffer greater incidences of depression and anxiety due to isolation.
Access to health care facilities will also be enhanced. The health care system, like the energy system, has become more dispersed and distributed. Locating health clinics and other facilities within communities, and ensuring proximity and access to such services through walkable, bikeable and transit-friendly infrastructure, will help overcome health disparities if disadvantaged communities/communities of color.
Just transition: businesses and industries, workers
As jobs and job locations shift, public transportation and land use will need to align with those changes. In the past, lower-paying/-skilled jobs were an afterthought, leaving disadvantaged communities behind; this initiative allows the state to plan simultaneously with the transition to a clean energy economy.
Other Investments in smart growth—particularly re-development of existing buildings in developed areas—yields significantly greater tax revenues per acre for a municipality and requires significantly less infrastructure costs (construction and maintenance) than sprawling development.
Draft Material

72
Enabling Initiative – Business/Transit/Local Planner Partnerships and CollaborationOverviewDescription: Launch an Expansive, Multi-Dimensional, Grass-Roots Public Education Campaign on the Links Among Land Use
(Smart Growth), Public Transportation and Housing and their roles in reversing climate change.
Action type: Agency/Program
Cost and funding considerations:
$; will utilize existing programs and resources, but would likely require consultant services.
Ease of implementation: Medium
Example case studies: See AppendixRisks / Barriers to success Possible mitigants
None None
Draft Material

73
Components required for delivery(Brief description of action required)
Implementation lead(Entity responsible for completing)
Time to implement(Time required to implement)
Other key stakeholders(Entities that need to be engaged)
Develop public relations and marketing materials for the public, municipalities and stakeholders that cogently explains the links among municipal/county/regional planning and public transportation infrastructure, jobs, housing, equity and climate change, among others. Incorporate these materials and messages into all relevant state, regional and local venues.
DOT/DOS/DEC/NYSERDA
1 year REDCs, Chambers, transit agencies
Help develop fiscal impact analyses of smart growth compared with sprawl, regarding both public infrastructure investments for each and tax revenues generated.
DOS 1-2 years REDCs, Chambers, municipalities, developers
Work with and support the LULG AP’s recommendation to create an on-line, iterative, interactive Sustainable Development/Climate Handbook with case studies to help municipalities, CBOs and developers navigate and integrate state assistance
DOS 1 year Municipalities
Enabling Initiative – Business/Transit/Local Planner Partnerships and Collaboration Components of the strategyDraft Material

74
Enabling Initiative – Business/Transit/Local Planner Partnerships and CollaborationBenefits and Impacts
Anticipated Benefits and Impacts
Disadvantaged communities
Smart growth and expanded public transportation provides enhanced opportunities for affordable/mixed-income housing within existing communities, which helps address displacement and gentrification. A comprehensive, aggressive and persistent educational and awareness campaign provides greater opportunities to teach and infuse the concepts of equity into planning, development and public transportation.
Health and other co-benefits
Any reduction in VMT/transportation-based GHG emissions will improve air quality and help reduce the incidence of disease caused or exacerbated by air pollution. Communities that are walkable/bikeable and provide safe and accessible outdoor spaces promote greater physical activity, which yields concomitant health outcomes (often referred to as “Active Living by Design”). Communities that enable and promote social interaction, partly through safe and accessible public gathering spacesand walkable design, will generate positive mental health outcomes by reducing social isolation, particularly for older New Yorkers who suffer greater incidences of depression and anxiety due to isolation.
Access to health care facilities will also be enhanced. The health care system, like the energy system, has become more dispersed and distributed. Locating health clinics and other facilities within communities, and ensuring proximity and access to such services through walkable, bikeable and transit-friendly infrastructure, will help overcome health disparities if disadvantaged communities/communities of color.
Just transition: businesses and industries, workers
As jobs and job locations shift, public transportation and land use will need to align with those changes. In the past, lower-paying/-skilled jobs were an afterthought, leaving disadvantaged communities behind; this initiative allows the state to plan simultaneously with the transition to a clean energy economy. An educational component to this transition will raise public awareness about this esoteric and misunderstood concept.
Other This educational campaign provides an ideal forum in which to raise awareness of the fiscal benefits of smart growth.
Draft Material

75
Enabling Initiative – Expand Low Carbon ModesOverviewDescription: Encourage the business and economic development community to work more closely with public transportation
officials in business location and expansion projects
Action type: Agency/Program, Legislative
Cost and funding considerations:
$; requires inter-agency coordination and public/private coordination.
Ease of implementation: Medium
Example case studies: See Appendix
Risks / Barriers to success Possible mitigants
Some might view this as an impediment to business recruitment by adding another requirement or consideration as businesses make location decisions. Absence of a dedicated funding source.
Handle this as an educational matter, not a mandate; provide incentives, where feasible, such as in IDA tax policies, local planning/zoning incentives and enhanced programmatic assistance.
Draft Material

76
Components required for delivery(Brief description of action required)
Implementation lead(Entity responsible for completing)
Time to implement(Time required to implement)
Other key stakeholders(Entities that need to be engaged)
Increase communication, coordination and mutual assistance among ESD, the IDAs, local transit entities and local planners early in the business recruitment and location process to incorporate public transit planning, service and accommodations into projects and locate along existing transit routes.
ESD 1 year REDCs, Transit agencies, planners, regional planning councils
Provide assistance and incentives to businesses seeking to locate or expand in an area to provide public transportation access to employees (Employee-Based Trip Reduction programs, transit/micro-transit services, ride-sharing, bike-sharing, cycling accommodations, free/reduced transit passes…)
ESD 6 months REDCs, Transit agencies, planners, regional planning councils
Expand micro-transit options and ride-sharing. DOT 3 years Transit agencies
Develop partnerships with truck freight in community planning, particularly complete streets, to find a balance between walkable/bikeable streets and trucking accommodations.
DOT 1 year Truckers, municipalities
Enabling Initiative – Expand Low Carbon ModesComponents of the StrategyDraft Material
77
Components required for delivery(Brief description of action required)
Implementation lead(Entity responsible for completing)
Time to implement(Time required to implement)
Other key stakeholders(Entities that need to be engaged)
Provide assistance and incentives to businesses seeking to locate or expand in an area to provide public transportation access to employees (Employee-Based Trip Reduction programs, transit/micro-transit services, ride-sharing, bike-sharing, cycling accommodations, free/reduced transit passes…)
Expand Micro-transit options and ride-sharing.
Support and inform the MTA’s efforts to develop a “First-Mile/Last-Mile Toolkit.”
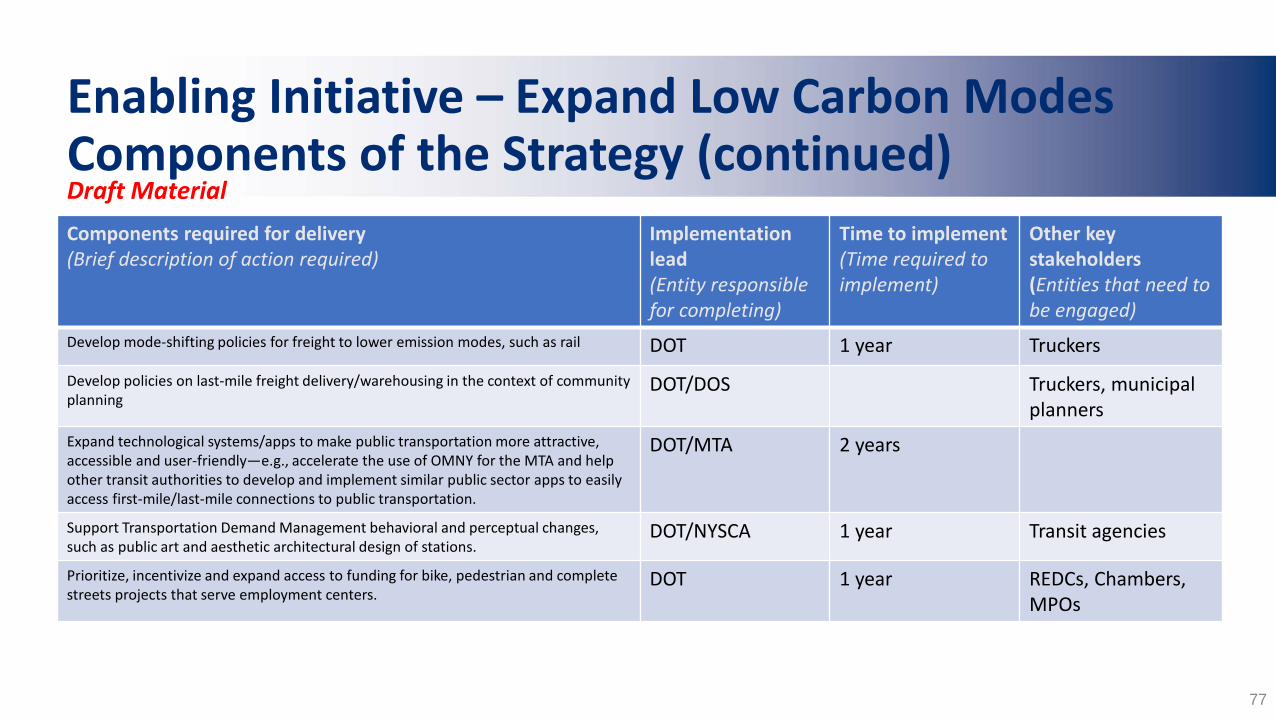
Enabling Initiative – Expand Low Carbon ModesComponents of the Strategy (continued)Components required for delivery(Brief description of action required)
Implementation lead(Entity responsible for completing)
Time to implement(Time required to implement)
Other key stakeholders(Entities that need to be engaged)
Develop mode-shifting policies for freight to lower emission modes, such as rail DOT 1 year Truckers
Develop policies on last-mile freight delivery/warehousing in the context of community planning
DOT/DOS Truckers, municipal planners
Expand technological systems/apps to make public transportation more attractive, accessible and user-friendly—e.g., accelerate the use of OMNY for the MTA and help other transit authorities to develop and implement similar public sector apps to easily access first-mile/last-mile connections to public transportation.
DOT/MTA 2 years
Support Transportation Demand Management behavioral and perceptual changes, such as public art and aesthetic architectural design of stations.
DOT/NYSCA 1 year Transit agencies
Prioritize, incentivize and expand access to funding for bike, pedestrian and complete streets projects that serve employment centers.
DOT 1 year REDCs, Chambers, MPOs
Draft Material

78
Enabling Initiative – Expand Low Carbon ModesBenefits and ImpactsAnticipated Benefits and Impacts
Disadvantaged communities
Providing and expanding access to public transportation in the context of business location and economic development will largely help provide access to jobs among lower-income/lower-skilled employees since those individuals often need to travel the farthest and spend more money to commute to those jobs.
Health and other co-benefits
Any reduction in VMT/transportation-based GHG emissions will improve air quality and help reduce the incidence of disease caused or exacerbated by air pollution. Communities that are walkable/bikeable and provide safe and accessible outdoor spaces promote greater physical activity, which yields concomitant health outcomes (often referred to as “Active Living by Design”). Communities that enable and promote social interaction, partly through safe and accessible public gathering spaces and walkable design, will generate positive mental health outcomes by reducing social isolation, particularly for older New Yorkers who suffer greater incidences of depression and anxiety due to isolation.
Access to health care facilities will also be enhanced. The health care system, like the energy system, has become more dispersed and distributed. Locating health clinics and other facilities within communities, and ensuring proximity and access to such services through walkable, bikeable and transit-friendly infrastructure, will help overcome health disparities if disadvantaged communities/communities of color.
Just transition: businesses and industries, workers
As jobs move and change in the transition to a clean energy economy, businesses will need to accommodate their employees’ commuting needs.
Other
Draft Material