MEDITERRANEAN ECOLOGICAL FOOTPRINT TRENDS...
46
MEDITERRANEAN ECOLOGICAL FOOTPRINT TRENDS
-
Upload
truongliem -
Category
Documents
-
view
216 -
download
0
Transcript of MEDITERRANEAN ECOLOGICAL FOOTPRINT TRENDS...

MEDITERRANEAN ECOLOGICAL FOOTPRINT TRENDS

Global Footprint Network Foreword Foreword Plan Blue Introduction
The Ecological Footprint of World Regions
Drivers of Mediterranean Ecological Footprint and biocapacity changes over time
Mapping consumption, production and trade activities for the Mediterranean Region
Mediterranean Ecological Footprint of nations
Linking ecological assets and economic competitiveness
Toward sustainable development: human welfare and planetary limits
National Case Studies
Conclusions
Appendix A Calculating the Ecological Footprint
Appendix B The carbon-plus approach
Appendix C Ecological Footprint: Frequently asked questions
Glossary of Ecological Footprint terms
References
Biocapacity and Ecological Footprint Data
CONTENT
Global Footprint NetworkPromotes a sustainable economy by advancing the Ecological Footprint, a tool that makes sustainability measureable.
Funded by:MAVA FoundationEstablished in 1994, it is a family-led, Swiss-based philanthropic foundation whose mission is to engage in strong partnerships to conserve biodiversity for future generations.
In collaboration with:WWF MediterraneanIts mission is to build a future in which people live in harmony with nature. The WWF Mediterranean initiative aims at conserving the natural wealth of the Mediterranean and reducing human footprint on nature for the benefi t of all.
UNESCO VeniceIs developing an educational and training platform on the application of the Ecological Footprint in SEE and Mediterranean countries, using in particular the network of MAB Biosphere Reserves as special demonstration and learning places.
Plan BleuPlan Bleu aims to produce information and knowledge in order to alert decision-makers and other stakeholders to environmental risks and sustainable development issues in the Mediterranean, and to shape future scenarios to guidedecision-making processes.
1
2
3
8
10
13
17
20
22
24
28
32
35
36
38
40
42
EDITOR
Alessandro GalliScott Mattoon
AUTHORS
Alessandro GalliDavid MooreNina BrooksKatsunori IhaGemma Cranston
CONTRIBUTORS AND REVIEWER
Jean-Pierre GiraudSteve Goldfi ngerMartin HallePati PobleteAnders ReedMathis Wackernagel
DESIGN
MaddoxDesign.net
ADVISORS
Deanna KarapetyanHannes Kunz (Institute for Integrated Economic Research - www.iier.ch)Paolo Lombardi (WWF Mediterranean Programme) André Schneider (André Schneider Global Advisory SA)Yves de Soye
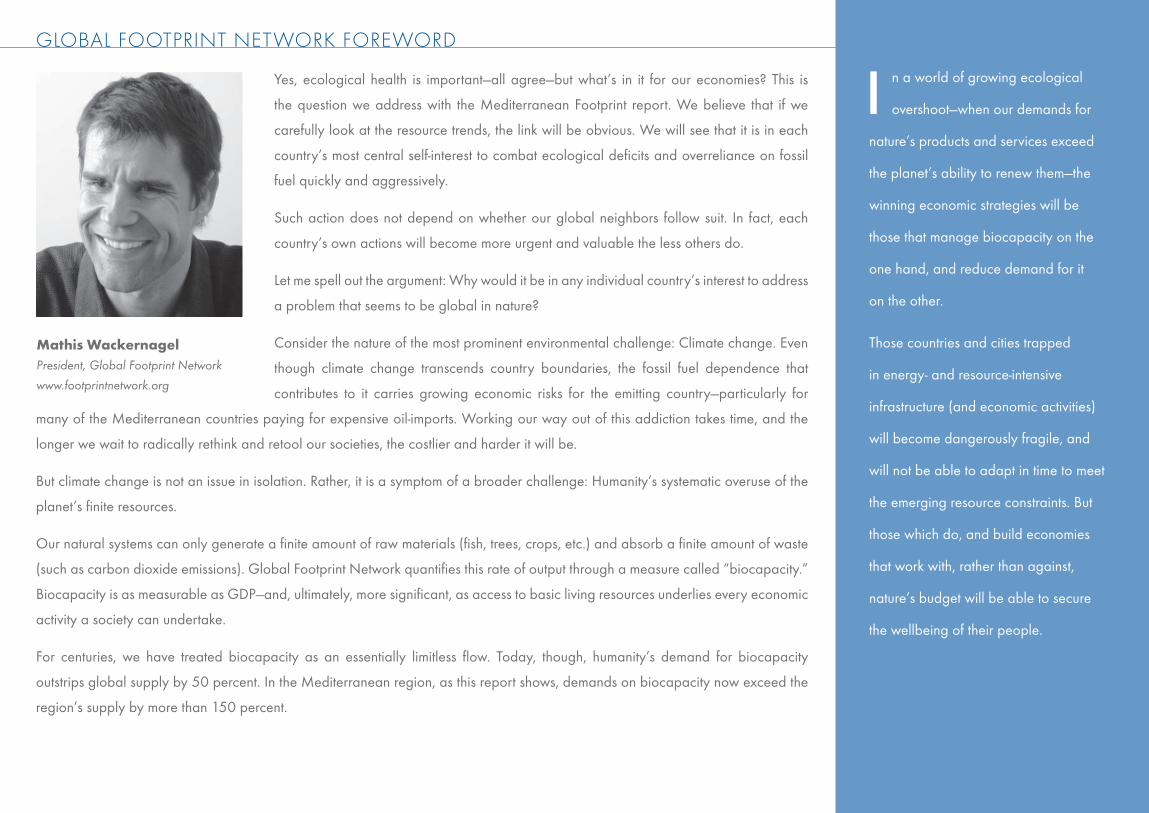
Yes, ecological health is important—all agree—but what’s in it for our economies? This is
the question we address with the Mediterranean Footprint report. We believe that if we
carefully look at the resource trends, the link will be obvious. We will see that it is in each
country’s most central self-interest to combat ecological defi cits and overreliance on fossil
fuel quickly and aggressively.
Such action does not depend on whether our global neighbors follow suit. In fact, each
country’s own actions will become more urgent and valuable the less others do.
Let me spell out the argument: Why would it be in any individual country’s interest to address
a problem that seems to be global in nature?
Consider the nature of the most prominent environmental challenge: Climate change. Even
though climate change transcends country boundaries, the fossil fuel dependence that
contributes to it carries growing economic risks for the emitting country—particularly for
many of the Mediterranean countries paying for expensive oil-imports. Working our way out of this addiction takes time, and the
longer we wait to radically rethink and retool our societies, the costlier and harder it will be.
But climate change is not an issue in isolation. Rather, it is a symptom of a broader challenge: Humanity’s systematic overuse of the
planet’s fi nite resources.
Our natural systems can only generate a fi nite amount of raw materials (fi sh, trees, crops, etc.) and absorb a fi nite amount of waste
(such as carbon dioxide emissions). Global Footprint Network quantifi es this rate of output through a measure called “biocapacity.”
Biocapacity is as measurable as GDP—and, ultimately, more signifi cant, as access to basic living resources underlies every economic
activity a society can undertake.
For centuries, we have treated biocapacity as an essentially limitless fl ow. Today, though, humanity’s demand for biocapacity
outstrips global supply by 50 percent. In the Mediterranean region, as this report shows, demands on biocapacity now exceed the
region’s supply by more than 150 percent.
GLOBAL FOOTPRINT NETWORK FOREWORD
Mathis WackernagelPresident, Global Footprint Network
www.footprintnetwork.org
n a world of growing ecological
overshoot—when our demands for
nature’s products and services exceed
the planet’s ability to renew them—the
winning economic strategies will be
those that manage biocapacity on the
one hand, and reduce demand for it
on the other.
Those countries and cities trapped
in energy- and resource-intensive
infrastructure (and economic activities)
will become dangerously fragile, and
will not be able to adapt in time to meet
the emerging resource constraints. But
those which do, and build economies
that work with, rather than against,
nature’s budget will be able to secure
the wellbeing of their people.
I

2
In 1989, Plan Bleu published a pioneering report on “Futures for the Mediterranean
Basin” which recommended a design for the Mediterranean Strategy for
Sustainable Development (MSSD). With the issuance of an update in 2005,
entitled “A sustainable future for the Mediterranean: the Blue Plan’s environment
and development outlook” the report’s recommendations were adopted by the
Barcelona Convention Contracting Parties at their 14th conference in Portoroz,
Slovenia, 8-11 November 2005.
Plan Bleu’s key function as the “Mediterranean Environment and Development
Observatory” (MEDO), draws heavily upon its expertise in sustainable
development indicators. Within MEDO, 134 initial indicators were selected
and adapted to the follow-up of the implementation of Agenda 21 in the
Mediterranean. Of these, 34 priority indicators were subsequently chosen to
monitor the progress made by the Mediterranean countries focusing upon the
objectives defi ned for 9 MSSD priority issues including:
Improving integrated water resource and water demand management;
Ensuring sustainable management of energy;
Mitigating and adapting to the effects of climate change.
In addition, some composite indicators such as the Human Development Index (HDI) and Ecological Footprint were
considered to monitor overall progress in terms of sustainable development.
The MSSD priority indicators are unable to fully describe the complexity and diversity of sustainable development
issues in the Mediterranean regions. Some additional indicators were thus selected, defi ned and populated in order to
tackle priority issues such as: water, energy, tourism, the conservation of rural and coastal areas. These analyses, widely
disseminated in Plan Bleu publications and continuously updated, are nicely complemented by the analysis of Ecological
Footprint and biocapacity trends in the Mediterranean region that is included in this report.
PLAN BLEU FOREWORD
Hugues RavenelDirector, Plan Bleu
www.planbleu.org
he “State of the Environment and
Development in the Mediterranean”,
published by Plan Bleu in 2009, attempted to
provide answers regarding water and energy.
The promotion of water demand management
and the use of related indicators, such as
effi ciency demand per sector and exploitation
index of the renewable resources, should aid
better inclusion of water scarcity. The main
responses to the growth of the major
socio-economic drivers and environmental
pressures are a) to develop more sustainable
energy consumption and b) encourage
diversifi cation of energy sources with a bigger
share of renewable energy.
The MSSD and the related indicators are being
revised by taking into account the impact of
climate change on the Mediterranean environment
and society. All this work on indicators and MSSD
is also linked to the activities of the Centre for
Mediterranean Integration in Marseille and the
priority areas of the Union for the Mediterranean.
T

3
MEDITERRANEAN ECOLOGICAL FOOTPRINT TRENDS
W H A T ’ S A T S T A K E
Since the rise of agriculture, the
Mediterranean region has been shaped
by its diverse and vast ecological
resources. Ecological changes, from
forest loss to desertifi cation, have
always been part of its history, but
never has human pressure on the
Mediterranean’s ecological assets been
as intense as it is today.
Growing demands on the Mediterranean
region’s limited ecological resources and
services now threaten the foundation
of its social and economic well-being.
In 2008, every country in the region
but one demanded more ecological
resources and services than were
available within their respective borders.
Simply stated, the Mediterranean region
is running a severe ecological defi cit,
a situation that will only worsen unless
effective resource management becomes
central to policy-making.
To achieve lasting socio-economic
success, solutions are needed that
manage Earth’s limited ecological assets.
Instead, however, we see that many of
the actions taken by Greece, Italy and
other Mediterranean countries to improve
INTRODUCTION
the performance of their economies are
undermining the health of their ecological
assets and mortgaging their long-term
security.
Never has the situation been so critical:
The Mediterranean’s accessibility to
essential life-supporting ecological
resources and services is increasingly at
risk. At a time when the world is going
further into ecological overshoot, failure
to take action is becoming a fundamental
threat.
T R A C K I N G H U M A N D E M A N D O N
B I O C A P A C I T Y :
I N T R O D U C I N G T H E E C O L O G I C A L F O O T P R I N T
Pursuing a more sustainable approach to development and economic prosperity means better understanding the choices before us. For this, governments need the knowledge and tools to manage their ecological assets as well as their demand for renewable resources and ecological services. The Ecological Footprint methodology offers a way to do so, globally and at the regional and country level.
The Ecological Footprint is an accounting tool that measures one aspect of sustainability: How much of the planet’s regenerative capacity humans demand to produce the resources and ecological services for their daily lives and how much regenerative capacity they have available from existing ecological assets. It does so by means of two indicators:
ON THE DEMAND S IDE the Ecological Footprint measures the biologically productive land and sea area—the ecological assets—that a population requires to produce the renewable resources and ecological services it uses.
ON THE SUPPLY SIDE Biocapacity tracks the ecological assets available in countries, regions or at the global level and their capacity to produce renewable resources and ecological services.
In economic terms, assets are often defi ned as something durable that is not directly consumed, but yields a fl ow of products and services that people do consume. Ecological assets are thus here defi ned as the biologically productive land and sea areas that generate the renewable resources and ecological services that humans demand. They include: cropland for the provision of plant-based food and fi ber products; grazing land and cropland for animal products; fi shing grounds (marine and inland) for fi sh products; forests for timber and other forest products; uptake land to sequester waste (CO2, primarily from fossil fuel burning); and space for shelter and other urban infrastructure (see box 1).

4Box 1: Land use categories comprising the Ecological Footprint (see Borucke et al., 2013 for additional information on the calculation methodology for each of these categories).
BUILT-UP LAND
represents the area of land covered by human infrastructure such as
transportation, housing, industrial structures and reservoirs for
hydroelectric power generation.
FISHING GROUNDS
represent the area of marine and inland waters necessary to generate the annual
primary production required to support catches of aquatic species (fish and
seafood) and from aquaculture.
GRAZING LAND
represents the area of grassland used, in addition to crop feeds, to raise livestock for meat, diary, hide and wool products.
It comprises all grasslands used to provide feed for animals, including cultivated pastures as well as wild
grasslands and prairies.
CARBON
accounts for the amount of forest land required to accommodate for the carbon Footprint, meaning to sequester CO2 emissions, primarily from fossil fuels burning, international trade and land use practices, that are not uptake by oceans.
FOREST
represents the area of forests required to support the annual harvest of fuel wood, pulp and timber products.
CROPLAND
consists of the area required to grow all crop products required for human consumption (food and fibre), as well as to grow livestock feeds, fish meals, oil crops, and rubber.

5
MEDITERRANEAN ECOLOGICAL FOOTPRINT TRENDS
Box 2: Tracking production, consumption and net trade with the Ecological Footprint: The Ecological Footprint associated with each country’s total consumption is calculated by summing the Footprint of its imports and its production, and subtracting the Footprint of its exports. This means that the resource use and emissions associated with producing a car that is manufactured in China, but sold and used in Italy, will contribute to Italy’s rather than China’s Ecological Footprint of consumption.
Ecological Footprint of Consumption Ecological Footprint of Production Net Ecological Footprint of Trade
The Ecological Footprint of consumption
indicates the consumption of biocapacity
by a country’s inhabitants.
In order to assess the total domestic demand for
resources and ecological services of a
population, we use the Ecological Footprint of
consumption (EFc). EFc accounts for both the
export of national resources and ecological
services for use in other countries, and the
import of resources and ecological services for
domestic consumption.
EFc is most amenable to change by individuals
through changes in their consumption behavior.
The Ecological Footprint of production indicates the
consumption of biocapacity resulting from production
processes within a given geographic area, such as a
country or region.
It is the sum of all the bioproductive areas within a country
necessary for supporting the actual harvest of primary
products (cropland, pasture land, forestland and fishing
grounds), the country’s built-up area (roads, factories,
cities), and the area needed to absorb all fossil fuel carbon
emissions generated within the country.
This measure mirrors the gross domestic product (GDP),
which represents the sum of the values of all goods and
services produced within a country’s borders.
The Ecological Footprint of imports and exports indicate the use of biocapacity within international trade.
Embedded in trade between countries is a use of biocapacity, the net Ecological Footprint of trade (the Ecological Footprint of imports minus the Ecological Footprint of exports). If the Ecological Footprint embodied in exports is higher than that of imports, then a country is a net exporter of renewable resources and ecological services.
Conversely, a country whose Footprint of imports is higher than that embodied in exports depends on the renewable resources and ecological services generated by ecological assets from outside its geographical boundaries.
A country’s Ecological Footprint of consumption is derived by tracking the ecological assets demanded to absorb its waste and to generate all the commodities it produces, imports and exports (see box 2).
All commodities (or CO2 waste) carry with them an embedded amount of bioproductive land and sea area necessary to produce (or sequester) them; international trade fl ows can thus be seen as fl ows of embedded Ecological Footprint.

6
Both Ecological Footprint and biocapacity results are
expressed in a globally comparable, standardized unit
called a “global hectare” (gha)—a hectare of biologically
productive land or sea area with world average
bioproductivity in a given year (see Borucke et al., 2013
for details).
While the Ecological Footprint quantifi es human
demand, biocapacity acts as an ecological benchmark
and quantifi es nature’s ability to meet this demand. A
population’s Ecological Footprint can be compared
with the biocapacity that is available—domestically or
globally—to support that population, just as expenditure is
compared with income in fi nancial terms. If a population’s
demand for ecological assets exceeds the country’s
supply, that country is defi ned as running an ecological—or
more precisely, a biocapacity—defi cit. Conversely, when
demand for ecological assets is less than the biocapacity
available within a country’s borders, the country is said to
have an ecological—or biocapacity—reserve.
The total Ecological Footprint of a country is a function
of the average consumption pattern of each individual,
the effi ciency in production and resource transformation,
and the number of individuals in the country. Biocapacity
is determined by the available biologically productive
land and sea areas and the capacity of these assets
to produce resources and services useful for humans
(this is determined by the prevailing technology and
management practices implemented in these areas).
GLOBAL ECOLOGICAL OVERSHOOT
While ecological assets have long been ignored as
irrelevant to a country’s economy, the goods and services
that sustain a healthy human society (access to food, safe
water, sanitation, manufactured goods and economic
opportunity) all depend on the functioning of healthy
ecosystems.
According to Global Footprint Network’s most recent
National Footprint Accounts, in 2008 humanity consumed
resources and ecological services 1.5 times faster than
Earth could renew them—a 100 percent jump from
1961, when approximately 74 percent of the planet’s
biocapacity was consumed (Global Footprint Network,
2011). In other words, in 2008 human demand on the
Earth’s ecological assets was 50 percent greater than
their capacity to keep up with this demand.
This situation is known as “ecological overshoot” and its
consequences can be seen in the form of climate change,
water scarcity, land use change and land degradation,
declining fi sheries, loss of biodiversity, food crises and
soaring energy costs.
If human demand on nature continues to exceed what
Earth can regenerate, then substantial changes in
the resource base may occur, undermining economic
performance and human welfare.
Figure 1: Trends in total Ecological Footprint and biocapacity between 1961 and 2008. The increase in biocapacity is due to an increase in land bioproductivity as well as in the areas used for human purposes. However, the increase in the Earth’s productivity is not enough to compensate for the demands of a growing global population.
0
5
10
15
20
2005200019951990198519801975197019651960
Glo
bal H
ecta
res
(bill
ions
)
BIOCAPACITY = Area x Yield
(SUPPLY)
ECOLOGICAL FOOTPRINT = Population x Consumption x Resource
(SUPPLY) per person intensity
OVERSHOOT

7
MEDITERRANEAN ECOLOGICAL FOOTPRINT TRENDS
Humanity crossed the threshold in
1971, when the world went into global
ecological overshoot. Recent studies
(Moore et al., 2012) project that, if we
continue on a “business-as-usual” path, it
will take twice the ecological assets of the
biosphere to meet our demands by the
early 2030s. This level of overshoot is
physically impossible in the long run. With
growing resource scarcity and exceeded
planetary boundaries, leaders need to
be informed not only by value-added
measures of economic activities, but also
asset balances and how they impact our
quality of life.
Global Footprint Network launched its
Mediterranean initiative to bring the
reality of ecological constraints to the
center of Mediterranean policy debate,
and to support decision-makers with tools
that will help them weigh policy trade-offs.
These tools will enable policy analysts
and decision-makers to more fully identify
the risks that resource and ecosystem
limitations pose to their countries’
economic and social well-being.
In this report, we examine the nature of
and trends in the demands that residents
in the Mediterranean region are placing
on the Earth’s ecological assets. The
chapter on Greece, Italy, Portugal and
Spain offer a particular example of the
interplay between ecological constraints
and economic performance. Using the
Ecological Footprint and biocapacity
measures, we investigate the main drivers
of increased human pressure in the
region and explore the likely implications
of growing ecological defi cits for the
Mediterranean region’s ecosystems and
economies.
Global Footprint Network published this
report in October 2012 as a foundation for
the debate on the strategies and policies
required to best guarantee a sustainable
future for all in the region. Key fi ndings of
the report that were published in advance
in “Why Are Resource Limits Now
Undermining Economic Performance?”
(Global Footprint Network, 2012) might
be considered the fi rst discussion on this
critical issue. Global Footprint Network
now invites governments and other
decision-makers to join the dialogue, and
act to safeguard their economies and
their peoples’ well-being.
In this report, the Mediterranean region
is defi ned as those countries that directly border
the Mediterranean Sea plus three countries, Jordan,
Macedonia and Portugal, which are ecologically
characterized by biomes that are typical of
the Mediterranean region. Only countries with
populations greater than 500,000 are included in
Ecological Footprint results.

8
THE ECOLOGICAL FOOTPRINT OF WORLD REGIONS
In less than 50 years, humanity doubled its demand for renewable resources and ecological services (see Figure 2). At a global level, the causes are easily identifi ed. Population growth recorded a 118 percent increase from 1961 to 2008, the period studied for this report, while the world’s per capita Ecological Footprint increased by 15 percent (from 2.4 to 2.7 gha per person).
0.0
0.5
1.0
1.5
2.0
200820001990198019701960
Ecol
ogic
al F
ootp
rint (
# o
f Ear
ths)
Built-up Land CroplandForest Land Fishing Grounds Grazing Land Carbon
World biocapacity 0
1
2
3
4
5
6
7
8
Ecol
ogic
al F
ootp
rint (
gha
per c
apita
)
0 654321 7
Population (billions)
0
1
2
3
4
5
6
7
8
Ecol
ogic
al F
ootp
rint (
gha
per c
apita
)
0 654321 7
Population (billions)
North AmericaEUOther EuropeLatin AmericaMiddle East/Central Asia
Africa
Figure 2: Humanity’s Ecological Footprint by land use type, 1961-2008. The largest component of the Ecological Footprint today is the carbon Footprint (55 percent). This component represents more than half the Ecological Footprint for one-quarter of the countries tracked, and it is the largest component for approximately half the countries tracked. All Ecological Footprint and biocapacity values provided in this study are reported in constant 2008 global hectare value. Details on constant gha can be found in Borucke et al., 2013.
These global trends, however, hide the huge variability that exists at the regional level. Europe and Middle East/Central Asia experienced the largest increase in their per capita Ecological Footprint (+1.2 and +1.1 gha per person, respectively), but while Europe’s population growth was relatively slow (+29 percent), population grew 330 percent in Middle East/Central Asia. North America had a smaller increase in per capita consumption (+ 0.6 gha per person) and a 63 percent growth in population. At the other end of the spectrum, Africa saw its per capita Ecological Footprint decline (-0.1 gha per person), while its population increased by 255 percent. In the Asia-Pacifi c region, per capita Ecological Footprint increased slightly (+0.6 gha per person), while population grew by 136 percent (See Figure 3).
Figure 3: Ecological Footprint and population by world’s regions in 1961 and 2008.The area within each bar represents the total Ecological Footprint for each region.
1961
2008

9
MEDITERRANEAN ECOLOGICAL FOOTPRINT TRENDS
The Mediterranean region experienced signifi cant increases in both population and per capita consumption. From 1961 to 2008, the region’s population grew from 242 million to 478 million, a 96 percent increase, while its per capita Ecological Footprint increased by 52 percent. Together these increases led to a 197 percent increase of the Mediterranean’s
0
300
600
900
1200
1500
200820001990198019701960
Ecol
ogic
al F
ootp
rint (
mill
ion
gha)
Built-up Land CroplandForest Land Fishing Grounds Grazing Land Carbon
Figure 4: Mediterranean’s total Ecological Footprint, by land-use type, 1961-2008. The largest component of the Ecological Footprint today is the carbon Footprint (47 percent), followed by cropland (28 percent). In 1961, cropland was the largest component (33 percent), followed by the carbon Footprint (25 percent).
Figure 5: Distribution of Ecological Footprint and population by national income in 1961 and 2008. Per capita Footprint ranges are indicated on the x-axis, while the height of each bar is proportional to the number of people in that range. Mediterranean countries are here divided in income groups according to their per capita GNI values in 2008, as indicated by the World Bank. Additional information on the income thresholds used in defi ning groups can be found in the Glossary section.
total demand for ecological resources and services during the 47-year period studied for this report (see Figure 4). The region’s income levels indicate how population and per capita Footprint values go hand in hand with the Mediterranean’s growing demand for ecological resources and services (Figure 5). While Mediterranean high-income countries’ total Footprint grew primarily because of an increase in individual consumption levels—that is, an increase in their per capita Footprint—middle-income countries’ growing total Footprint was driven by both an increase in per capita consumption levels and population growth. But these different patterns of change were also marked by shifts in residents’ access to ecological assets. Growing per capita consumption trends in high-income countries was accompanied by greater equality in access to ecological resources and services—by 2008, almost all residents in Mediterranean high-income countries (approximately 178 million people) had a per capita Footprint ranging from 4.5 to 5.0 gha.
Changes in middle-income countries brought the opposite effect, however. While in 1961 residents in middle-income countries (approximately 95 million people) fell into two per capita Footprint ranges (0.5 to 1.0 gha and 1.5 to 2.0 gha), almost 50 years
later, residents in this income group (approximately 279 million people) fell into more Footprint ranges, suggesting a greater disparity in access to ecological resources and services. (Despite this increased variability, approximately 126 million people living in middle-income countries in 2008 had a per capita Ecological Footprint ranging from 1.5 to 2.0 gha, evidence of a higher consumption level for more people).
0
50
100
150
200
5.5 - 6.05.0 - 5.54.5 - 5.04.0 - 4.53.5 - 4.03.0 - 3.52.5 - 3.02.0 - 2.51.5 - 2.01.0 - 1.50.5 - 1.00.0 - 0.5
Pop
ulat
ion
(mill
ions
)
ECOLOGICAL FOOTPRINT (GHA PER CAPITA) 2008
0
20
40
60
80
100
5.5 - 6.05.0 - 5.54.5 - 5.04.0 - 4.53.5 - 4.03.0 - 3.52.5 - 3.02.0 - 2.51.5 - 2.01.0 - 1.50.5 - 1.00.0 - 0.5
Pop
ulat
ion
(mill
ions
)
Middle incomeHigh income
ECOLOGICAL FOOTPRINT (GHA PER CAPITA) 1961

10
From 1961 to 2008, the Mediterranean’s per capita
Ecological Footprint grew by 52 percent (from 2.1 to
3.1 gha), mainly because of the region’s 185 percent
increase in the carbon Footprint component.
Per capita biocapacity decreased by 16 percent—from
1.5 gha to 1.3 gha—from 1961 to 2008.
Between 1961 and 2008, the Mediterranean region’s
ecological defi cit had increased by 230 percent.
DRIVERS OF MEDITERRANEAN ECOLOGICAL FOOTPRINT AND BIOCAPACITY CHANGES OVER TIME
The Mediterranean region is characterized by its geographic, climatic and cultural diversity. Countries in the region have varying development levels and a wide range of economic activities. A crossroads of the East and West, the region has lived and still lives through a turbulent, intertwined history. But every country in the Mediterranean shares an environmental fragility, with residents demand for ecological resources and services far exceeding the regenerative capacity of their own ecological assets.
From 1961 to 2008, the Mediterranean’s per capita Ecological Footprint grew by 52 percent (from 2.1 to 3.1 gha), mainly because of the region’s 185 percent increase in the carbon Footprint component. Demand on other ecological assets increased only slightly or even decreased—cropland +29 percent; forest +23 percent; grazing -6 percent; fi shing -54 percent. Demand for built-up land increased 20 percent (see Figure 6).
Figure 6: Per capita Ecological Footprint within the Mediterranean region, by component, 1961-2008 (top) and the role of per capita Footprint and population in determining the total regional Footprint (bottom).
0.0
0.5
1.0
1.5
2.0
2.5
3.0
3.5
200820001990198019701960
Ecol
ogic
al F
ootp
rint (
gha
per c
apita
)
Built-up Land CroplandForest Land Fishing Grounds Grazing Land Carbon
0
1
2
3
200820001990198019701960
Rela
tive
valu
e (1
961=
1)
Total Ecological Footprint PopulationEcological Footprint per capita

11
MEDITERRANEAN ECOLOGICAL FOOTPRINT TRENDS
During this time, improvements in agricultural practices and other environmental factors slightly increased the productivity of the Mediterranean region’s ecological assets, thus contributing to an increase in the region’s total biocapacity. However, as population growth outstripped gains in productivity (Figure 7), per capita biocapacity decreased by 16 percent—from 1.5 gha to 1.3 gha—from 1961 to 2008.
These changes in biocapacity, consumption and population trends had a profound impact on the region’s ability to meet its own demands. In 1961, residents in the region had already used more resources and ecosystem services than the Mediterranean ecosystems’ could renew. Less than 50 years later, the region’s ecological defi cit had increased by 230 percent (Figure 8).
0
1
2
3
4
2005200019951990198519801975197019651960
Glo
bal h
ecta
res
per c
apita
Figure 8: Mediterranean region’s per capita Ecological Footprint (red line), and biocapacity (green line). The widening gap between demand and supply expanded the ecological defi cit (shaded red) 230 percent from 1961 to 2008, ever increasing the region’s ecological debt over time.
Figure 7: Per capita biocapacity within the Mediterranean region, by component, 1961-2008 (top) and its contributing factors (bottom).
0
1
2
3
200820001990198019701960
Rela
tive
valu
e (1
961=
1)
Area PopulationYieldBioccapacity per capita
0.0
0.5
1.0
1.5
2.0
200820001990198019701960
Glo
bal H
ecta
res
Per C
apita
Built-up Land CroplandForest Land Fishing Grounds Grazing Land
Today, the Mediterranean region’s total Ecological
Footprint exceeds local biocapacity by more
than 150 percent.

12
Figure 9: Breakdown of the per capita Ecological Footprint of an average Mediterranean resident, in 2008. The left chart indicates how much of the Ecological Footprint of consumption is paid for directly by household for short-lived goods (HH), how much by government, and how much is for expenditure of long-lasting goods (GFCF). The second graph breaks down the consumption directly paid for by households (HH) into its main categories.
Gross Fixed Capital Formation
Government
Households
Other
Recreation and culture
Alcoholic beverages, tobacco and narcotics
Transportation
Housing, water, electricity, gas and other fuels
Food and non-alcoholic beverages
Decisions made by governments and businesses have a substantial infl uence on the region’s Ecological Footprint. Citizens have no direct control over how a country produces its electricity, for example, or the intensity of its agricultural production. However, individuals’ daily activities are also primary Footprint drivers: Socio-economic factors, development level and wealth, the food, goods and services consumed, as well as the wastes generated, all contribute to the region’s per capita Footprint.
Figure 9 and 10 further break down the Ecological Footprint of Mediterranean residents. They indicate who is demanding what and where the pressures (Ecological Footprint hotspots) lie.
Among the daily consumption and service categories shaping the “household” component, those that contributed the most to the Ecological Footprint of the average Mediterranean resident were “Food and non-alcoholic beverages” (35 percent of the household total), “Housing, water, electricity, gas and other fuels” (19 percent) and human “Transportation” (19 percent). While “Food and non-alcoholic beverages” put more demand on cropland assets than it did on other land-use types, the other two household activities caused a demand mainly on the carbon sequestration capacity of the planet (see Figure 10).
Figure 10: Percentage contribution to the household Ecological Footprint of an average Mediterranean resident of each category of biologically productive land, in 2008. Footprint values by land category for government consumptions as well as capital formation are also provided as reference.
0% 20% 40% 60% 80% 100%GFCFGov.
Miscellaneous goods and servicesRestaurants and hotels
EducationRecreation and culture
CommunicationTransportation
HealthFurnishings, household equipment and routine household maintenance
Housing, water, electricity, gas and other fuelsClothing and footwear
Alcoholic beverages, tobacco and narcoticsFood and non-alcoholic beverages
Built-up LandCroplandForest LandFishing Grounds
Grazing LandCarbon
IN 2008, THE COMPONENTS
OF THE MEDITERRANEAN’S
ECOLOGICAL FOOTPRINT
WERE:
short-lived goods and services
directly paid by households
(driven by individual behavior,
78 percent of the total Footprint);
consumption of ecological
resource and services due to
long-term capital investments
undertaken by households,
businesses and governments
(Gross Fixed Capital Formation,
or GFCF, 15 percent);
services directly paid by
government, which ultimately
benefi t households, that are not
for long-term investments, such
as law enforcement, education,
public health, and defense
(7 percent of the total Footprint).

MAPPING CONSUMPTION PRODUCTION AND TRADE ACTIVITIES FOR THE MEDITERRANEAN REGION
0
1
2
3
4
200820001990198019701960
Glo
bal h
ecta
res
per c
apita
Ecological Footprint of consuption BiocapacityEcological Footprint of production
Figure 11: Mediterranean region’s Ecological Footprint of production (EFP) and consumption (EFC) compared to available biocapacity (BC), 1961-2008. EFP can be said to represent the biocapacity used for producing GDP within a country while EFC represents the biocapacity embedded in all commodities, goods and services consumed by the residents of that country. Comparing EFC vs. BC indicates the extent of the total ecological defi cit, which is made up by trade, resource overuse and use of global commons as carbon sinks. The difference between EFC and EFP indicates the Footprint embedded in net trade activities.
Evaluating a country or region’s demand for biocapacity does not completely inform us of the risks to domestic production systems, since an ecological defi cit can be maintained not only through domestic overuse, but also through imports and/or a reliance on the global commons as a sink for carbon emissions. To more fully understand a population’s resource demands, then, means to track both local production and consumption trends, as well as trends in trade.
Trends in the Ecological Footprint embedded in Mediterranean’s production (EFP) and consumption (EFC) activities are
reported in Figure 11 and compared with the region’s biocapacity trend for the period 1961–2008.
In 1961, Mediterranean biocapacity met only 73 percent of the region’s demand—its Ecological Footprint of consumption—for renewable resources and ecological services. By 2008, only 40 percent of the region’s Footprint of consumption was met by local biocapacity.
Production activities within the Mediterranean geographical boundaries have demanded more resources and services than are regionally available for
more than 50 years. From 1961 to 2008, Mediterranean countries’ gap between Ecological Footprint of production and biocapacity more than tripled from 0.3 gha per person (14 percent of the total demand) to 1.1 gha per person (34 percent of total demand).
Already by 1961, Mediterranean trade patterns had made the region a net importer of Ecological Footprint, with 13 percent of local demand (EFC) satisfi ed by resources and ecological services generated by ecological assets from outside the region’s geographical boundaries. The Mediterranean’s dependence on trade continuously increased over the decades, so much that by 2008 the Ecological Footprint embedded in net trade imports accounted for 26 percent of total Footprint of consumption.
Comparing EFC and EFP indicates the net fl ows of Ecological Footprint embedded in trade among countries. However, it does not inform us of the actual imports and exports fl ows and the Ecological Footprint embedded in each of them.
Figure 12 shows the detailed breakdown of the Ecological Footprint embedded in exports from the Mediterranean region to its top ten trading partners for the year 1977 and 20081; Figure 13 illustrates the Footprint embedded in Mediterranean’s imports from top ten trading partners and its changes over the same period.
In 1977, resources and ecological services worth approximately 24 million
gha of Mediterranean ecological assets were exported to the top ten trading partners. Of these, the biggest exports of biocapacity were to the Netherlands (6.5 million gha), the United States (6.2 million gha) and the United Kingdom (5.3 million gha). Netherlands’ imports were mostly composed of renewable resources from cropland (50 percent) and fi shing grounds assets (49 percent); the carbon Footprint embedded in electricity, fossil fuels and energy-intensive commodities was the biggest component of the exports to United States and United Kingdom (93 percent and 88 percent of the total).
From 1977 to 2008, growth in the physical quantity of exports—and their embedded Footprint—was particularly strong, especially to the EU. In 2008, the Ecological Footprint embedded in exports to the top ten trading partners was approximately 88 million gha. The biggest Footprint export fl ows were to Belgium (26 million gha), the United Kingdom (17 million gha) and the United States (11 million gha). Footprint exports to Belgium were composed of carbon Footprint (50 percent) as well as cropland (25 percent) and fi shing grounds assets (25 percent). Carbon Footprint was also the biggest component for the United Kingdom (90 percent of total) and the United States (95 percent).
11977 is the fi rst year that comprehensive data is available to run the multi-lateral trade analysis.

14
Figure 12: Ecological Footprint exports to major trade partners of the Mediterranean region in 1977 (inset) and 2008, and the ecological defi cit (red) or reserve (green) status of those partners. UN COMTRADE and FAO bilateral trade data were used to calculate the Ecological Footprint embedded in exports. Intra-regional trade was not included in the analysis.
E C O L O G I C A L F O O T P R I N T E X P O R T S I N 1 9 7 7 2 4 M I L L I O N G H A
E C O L O G I C A L F O O T P R I N T E X P O R T S I N 2 0 0 8 8 8 M I L L I O N G H A
E C O L O G I C A L F O O T P R I N T
Carbon
Fishing Grounds
Cropland
The size of the arrows is a function of the extent of the trade fl ows, and the color represents the corresponding land use type. For ease in visualization only the main three traded Foot-print components are reported in the maps
E C O L O G I C A L D E B T O R S
F O O T P R I N T I S
0-50% larger than Biocapacity
50-100% larger than Biocapacity
100-150% larger than Biocapacity
150% larger than Biocapacity
Data not available
E C O L O G I C A L C R E D I T O R S
B I O C A P A C I T Y I S
0-50% larger than Footprint
50-100% larger than Footprint
100-150% larger than Footprint
150% larger than Footprint
Data not available

15
MEDITERRANEAN ECOLOGICAL FOOTPRINT TRENDS
The large contribution of the carbon Footprint in the region’s exports, and the fact that export revenues are needed to pay for imports, suggest that the region is highly exposed to energy price volatility. Such volatility is likely to expand with oil shortages or carbon pricing.
At the same time, carbon Footprint exposes importing countries to risk as well: The increasing costs of imported fossil fuels are already a signifi cant burden on economies depending on importing them; carbon taxes would cause even more stress on economies, with the greatest impact on those countries with a high carbon Footprint demand.
The Ecological Footprint embedded in imports to the Mediterranean from the region’s top ten trading partners also changed signifi cantly from 1977 to 2008, from approximately 30 million global hectares to approximately 142 million gha (see Figure 13).
Of the 30 million global hectares imported in 1977, 38 percent was composed of renewable resources from cropland assets followed by fi shing grounds assets (37 percent) and carbon Footprint (25 percent). Renewable resources were imported primarily from Norway (3.7 million gha), Argentina (2.1 million gha) and United Kingdom (2.0 million gha), while electricity, fossil fuels and energy-intensive commodities (determining carbon Footprint imports) were imported from mainly the United States (2.1 million
gha) and Saudi Arabia (1.8 million gha).
The Ecological Footprint embedded in the Mediterranean’s imports increased to 142 million gha in 2008, primarily because of the carbon Footprint component. In 2008, carbon Footprint accounted for 52 percent of the total imports, followed by imports of resources from cropland and fi shing grounds assets (24 percent each). Electricity, fossil fuels and energy-intensive commodities (determining carbon Footprint imports) were mostly imported from Germany (19 million gha), China (15 million gha) and the Russian Federation (11 million gha), while renewable resources were imported primarily from Belgium (7.5 million gha), Netherlands (7 million gha) and Germany (6 million gha).
As the region increased its Ecological Footprint imports, trade patterns shifted and the Mediterranean’s major trade partners moved toward larger ecological defi cits. In a few instances, trade relationships from 1977 to 2008 shifted from countries that had ecological reserves (Canada, Argentina, and Saudi Arabia) to countries with ecological defi cits (Germany, Belgium, the Netherlands and China).
This situation exposes the Mediterranean region to risks: Growing dependence on exporting countries that themselves run ever larger ecological defi cits may amplify possibilities for future resource disruptions in the region.
The same situation, however, also offers opportunity. The majority of the region’s ecological resource and service exports are now to countries that are experiencing ecological defi cits (Brazil and the Russian Federation are the primary exceptions). In an era of tightening resource constraints, Mediterranean countries that improve their resource effi ciency and sustain a positive ecological trade balance would benefi t from increased commodity prices and improve their economic performance and the well-being of their populations.
Between 1977 and 2008, the Ecological Footprint
embedded in the Mediterranean’s imports
increased from 30 to 142 million global hectares.
During this same period, trade patterns shifted and
the Mediterranean’s major trade partners moved
toward larger ecological defi cits.

16
Figure 13: Ecological Footprint imports from major trade partners of the Mediterranean region in 1977 (inset) and 2008, and the ecological defi cit (red) or reserve (green) status of those partners. UN COMTRADE and FAO bilateral trade data were used to calculate the Ecological Footprint embedded in imports. Intra-regional trade was not included in the analysis.
E C O L O G I C A L F O O T P R I N T
Carbon
Fishing Grounds
Cropland
E C O L O G I C A L F O O T P R I N T I M P O R T S I N 1 9 7 7 3 0 M I L L I O N G H A
E C O L O G I C A L F O O T P R I N T I M P O R T S I N 2 0 0 8 1 4 2 M I L L I O N G H A
The size of the arrows is a function of the extent of the trade fl ows, and the color represents the corresponding land use type. For ease in visualization only the main three traded Foot-print components are reported in the maps
E C O L O G I C A L D E B T O R S
F O O T P R I N T I S
0-50% larger than Biocapacity
50-100% larger than Biocapacity
100-150% larger than Biocapacity
150% larger than Biocapacity
Data not available
E C O L O G I C A L C R E D I T O R S
B I O C A P A C I T Y I S
0-50% larger than Footprint
50-100% larger than Footprint
100-150% larger than Footprint
150% larger than Footprint
Data not available

17
MEDITERRANEAN ECOLOGICAL FOOTPRINT TRENDSMEDITERRANEAN ECOLOGICAL FOOTPRINT OF NATIONS
Figure 14: Ecological defi cit (red) or reserve (green) status of the Mediterranean countries in 1961 (top) and 2008 (bottom). Ecological reserve is defi ned as a domestic Ecological Footprint of consumption less than domestic biocapacity; ecological defi cit as a domestic Ecological Footprint of consumption greater than domestic biocapacity.
In 1961, only six countries in the Mediterranean region had more ecological assets available to produce the resources and services, on aggregate, than their residents consumed. All other countries consumed signifi cantly more than their domestic ecosystems produced (see Figure 14).
By 2008, the defi cit situation had spread to every Mediterranean country but the possible exception of Montenegro (data set for this country is not suffi ciently reliable).
Algeria experienced the largest change in per capita ecological defi cit, moving from a reserve of +0.7 gha per person in 1961 to an ecological defi cit of -1.1 gha per person in 2008. This was due to both consumption increases (causing the total Ecological Footprint to grow) and population growth (which decreased the per capita biocapacity budget). Only Algeria’s oil revenues allowed it to maintain its ecological defi cit for the fi rst few decades after independence. But by the late 1980s, declining oil prices took a toll on Algeria’s petroleum-based economy, diminishing its capacity to pay for importing external ecological resources and services. As revenues and imports declined, Algeria’s Ecological Footprint stabilized limiting residents’ access to ecological resources and services.
Morocco, Libya, Syria, Tunisia and Turkey also shifted from ecological creditor to
debtor status during this period, while the other Mediterranean countries saw a worsening of their ecological defi cits. Cyprus’ ecological defi cit grew by 3.1 gha per capita, the largest defi cit increase in the region. Jordan reported the smallest defi cit increase, at + 0.3 gha per capita.
The large variability in the per capita Footprints of individual countries refl ects the existing socio-economic differences in the region—the more affl uent a country, the greater its demand for ecological resources and services (and the higher its per capita consumption). On the supply side, differences in per capita biocapacity are mainly due to biophysical and climatic conditions—for example, water shortages affecting land productivity—as well as population density.
In 2008, the Former Yugoslavian Republic of Macedonia was found to have the highest per capita Ecological Footprint value (5.4 gha) among the Mediterranean countries (Figure 15), followed by Slovenia (5.2 gha), Greece (4.9 gha), France (4.9 gha) and Spain (4.7 gha). In all of these countries, carbon was the main Footprint component, ranging from 46 percent (France) to 72 percent (Macedonia TFYR) of the total value. The second highest component was cropland, with a contribution ranging from 15 percent (Macedonia TFYR) to 27 percent (Spain).
The fi ve countries with the smallest per capita Ecological Footprint in 2008
were Algeria (1.6 gha), Syria (1.5 gha), Morocco (1.3 gha), Montenegro (1.2 gha) and the Occupied Palestinian Territories (0.5 gha). Carbon was the main Footprint component for Algeria (37 percent)
and Syria (49 percent), cropland for Morocco (45 percent) and the Occupied Palestinian Territories (71 percent), and forest for Montenegro (39 percent).
1961
2008
Biocapacity more than 150% greater than Footprint
Biocapacity 0-50% greater than FootprintBiocapacity 50-100% greater than FootprintBiocapacity 100-150% greater than Footprint
Footprint more than 150% greater than biocapacityFootprint 100-150% greater than biocapacityFootprint 50-100% greater than biocapacityFootprint 0-50% greater than biocapacity

18
Mac
edon
ia T
FYR
Slov
enia
Gre
ece
Fran
ce
Spai
n
Italy
Cyp
rus
Mal
ta
Cro
atia
Portu
gal
Isra
el
Libya
Med
iterr
anea
n re
gion
Leba
non
Bosn
ia a
nd
Her
zego
vina
Turk
ey
Jord
an
Alb
ania
Tuni
sia
Egyp
t
World average per capita Ecological Footprint
World average per capita Biocapacity
6.0
5.0
4.0
3.0
2.0
1.0
0.0
Glo
bal h
ecta
res
per c
apita
Figure 15: Per capita Ecological Footprint and biocapacity values for Mediterranean countries, by land use type, in 2008. Average Ecological Footprint and biocapacity values for the Mediterranean region (in columns) as well as the world (horizontal lines) are given for comparison. The Ecological Footprint measures demand for six types of ecological assets (see box 1); this is contrasted with fi ve supply categories tracked by biocapacity. The reason for this discrepancy is that carbon dioxide sequestration (or carbon Footprint) is assumed to take place in forests where CO2 can be absorbed in the largest quantities. However, reliable global data sets on the extent of forest areas legally protected and dedicated to long-term carbon uptake are not yet available. As such, a carbon uptake category is currently not included within the biocapacity calculation, so forest Footprint and carbon Footprint are two demands both placed on a forest’s ecological assets.
BIOCAPACIT Y
Built up land
Fish Ground
Forest Land
Grazing Land
Cropland
E C O L O G I C A L F O O T P R I N T
Built up land
Carbon Footprint
Fish Footprint
Forest product Footprint
Grazing Footprint
Cropland Footprint
19
MEDITERRANEAN ECOLOGICAL FOOTPRINT TRENDS
France
Turkey
Italy
Spain
Egypt
Other
BIOCAPACITY
COUNTRY
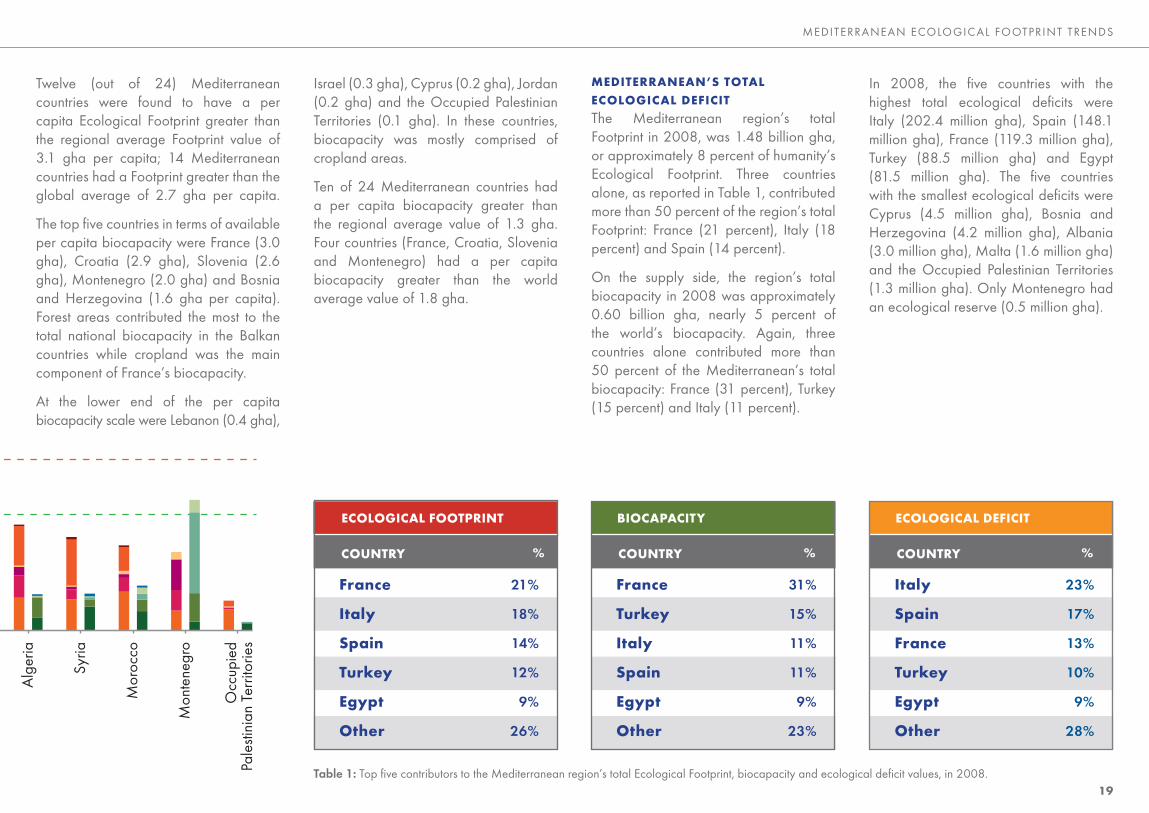
Twelve (out of 24) Mediterranean countries were found to have a per capita Ecological Footprint greater than the regional average Footprint value of 3.1 gha per capita; 14 Mediterranean countries had a Footprint greater than the global average of 2.7 gha per capita.
The top fi ve countries in terms of available per capita biocapacity were France (3.0 gha), Croatia (2.9 gha), Slovenia (2.6 gha), Montenegro (2.0 gha) and Bosnia and Herzegovina (1.6 gha per capita). Forest areas contributed the most to the total national biocapacity in the Balkan countries while cropland was the main component of France’s biocapacity.
At the lower end of the per capita biocapacity scale were Lebanon (0.4 gha),
Israel (0.3 gha), Cyprus (0.2 gha), Jordan (0.2 gha) and the Occupied Palestinian Territories (0.1 gha). In these countries, biocapacity was mostly comprised of cropland areas.
Ten of 24 Mediterranean countries had a per capita biocapacity greater than the regional average value of 1.3 gha. Four countries (France, Croatia, Slovenia and Montenegro) had a per capita biocapacity greater than the world average value of 1.8 gha.
Table 1: Top fi ve contributors to the Mediterranean region’s total Ecological Footprint, biocapacity and ecological defi cit values, in 2008.
Alg
eria
Syria
Mor
occo
Mon
tene
gro
Occ
upie
d Pa
lesti
nian
Ter
ritor
ies
%
31%
15%
11%
11%
9%
23%
MEDITERRANEAN’S TOTAL ECOLOGICAL DEFICIT
The Mediterranean region’s total Footprint in 2008, was 1.48 billion gha, or approximately 8 percent of humanity’s Ecological Footprint. Three countries alone, as reported in Table 1, contributed more than 50 percent of the region’s total Footprint: France (21 percent), Italy (18 percent) and Spain (14 percent).
On the supply side, the region’s total biocapacity in 2008 was approximately 0.60 billion gha, nearly 5 percent of the world’s biocapacity. Again, three countries alone contributed more than 50 percent of the Mediterranean’s total biocapacity: France (31 percent), Turkey (15 percent) and Italy (11 percent).
In 2008, the fi ve countries with the highest total ecological defi cits were Italy (202.4 million gha), Spain (148.1 million gha), France (119.3 million gha), Turkey (88.5 million gha) and Egypt (81.5 million gha). The fi ve countries with the smallest ecological defi cits were Cyprus (4.5 million gha), Bosnia and Herzegovina (4.2 million gha), Albania (3.0 million gha), Malta (1.6 million gha) and the Occupied Palestinian Territories (1.3 million gha). Only Montenegro had an ecological reserve (0.5 million gha).
Italy
Spain
France
Turkey
Egypt
Other
ECOLOGICAL DEFICIT
COUNTRY
France
Italy
Spain
Turkey
Egypt
Other
ECOLOGICAL FOOTPRINT
COUNTRY %
23%
17%
13%
10%
9%
28%
%
21%
18%
14%
12%
9%
26%

20
Economic theory considers three primary factors of production: labor, capital and land. Labor refers to the use of human effort and expertise in production. Capital encompasses humanly constructed items, such as machinery and buildings, which can facilitate further production. Land (or ecological assets) generates the resource and services fl ows that are used as inputs into the production system.
Ecological assets provide the food required for labor, while capital formation requires labor and natural resource inputs. As such, any change in ecological assets and the resource and services fl ows they generate has a direct impact on the economic sub-system.
During most of the 20th century, when resources were relatively cheap and easily available, the economies of most countries (in the world as well as the Mediterranean region) became increasingly dependent on large amounts of renewable and nonrenewable resources and ecological services. Cheap energy made the extraction and harvesting of resources much more economical and led to an increase in individual consumption. However, as population and consumption trends increased, the production of resources failed to keep pace.
Now, in the early 21st century, natural resource fl ows that once seemed inexhaustible are running into limits: Food and energy shortages, freshwater scarcity and topsoil depletion, for example, are inescapable realities, as are their costs.
Some are calling this new era of constraints “peak everything” (Heinberg, 2007).
The Mediterranean region is a particularly salient example of such transitions (Figure 16). When the Mediterranean region was running a relatively small ecological defi cit 50 years ago, the world was still able to provide more renewable resources and services than humanity required. Access to ecological assets was relatively easy during this phase, and Mediterranean residents could thus rely on global resources and ecological services to satisfy their demands.
Even when the world went into ecological overshoot in 1971, a decline in global commodity prices masked the risk of incurring a negative ecological assets balance. Meanwhile, the Mediterranean’s ecological defi cit continued to grow, and humanity’s demand for natural resources and services overtook the planet’s ability to produce them.
Since 2000, a systemic risk has become evident (see Figure 16). As the gap between supply and demand widens, more resources are being demanded and more CO2 is released in the atmosphere, causing even greater pressure on
LINKING ECOLOGICAL ASSETS AND ECONOMIC COMPETITIVENESS
Glo
bal H
ecta
res
per c
apita
20052000199519901985198019751970196519600
1
2
3
4
World: Ecological Footprint BiocapacityMediterranean: Ecological Footprint Biocapacity
Figure 16: Trends in the per capita Ecological Footprint (red) and biocapacity (green) of the world (solid lines) and Mediterranean region (dashed lines), from 1961 to 2008 (top). Commodity prices for selected commodities (solid lines) from 1961 to 2008, indexed to 2000, derived from World Bank commodity price data (bottom). General price trend-line (dashed line) also provided for ease in visualization.
Com
mod
ity p
rices
inde
xed
to 2
000
20052000199519901985198019751970196519600
50
100
150
200
250
300
350
400
FoodEnergy
Raw MaterialsMetals and Minerals

21
MEDITERRANEAN ECOLOGICAL FOOTPRINT TRENDS
AlbaniaAlgeriaBosnia and HerzegovinaCroatiaCyprusEgyptFranceGreeceIsraelItalyJordanLebanonLibyaMacedonia TFYRMaltaMontenegroMoroccoPortugalSloveniaSpainSyriaTunisiaTurkey
3.0 37.4 4.2 5.6 4.5
81.5 119.3
37.7 26.0
202.4 11.1 10.2 15.5
7.8 1.6
(0.5) 19.6 30.0
5.3 148.1
17.4 8.3
88.5
Table 2: Ecological assets balance and current account balance for each Mediterranean country, in 2008. Ecological assets balance values are calculated as total Ecological Footprint of consumption minus total biocapacity. Current account balance values are drawn from the World Bank (2011). No data were available for the Occupied Palestinian Territories.
ecosystems and biodiversity. The growing mismatch between global demand and supply of ecological resources and services has led to a gradual tightening of international commodity markets, resulting in rising prices and heightened price volatility.
With consumption exceeding local availability, dependence on biocapacity from outside the region’s geographical boundaries will likely continue and push the region to increasingly turn toward international trade for access to ecological resources and services. But as countries become more dependent on external ecosystems, they expose their economies to price volatility and possible supply disruption. Access to ecological resources and services become subject not only to “physical limits” (the total amount globally available) but also “economic limits” (the ability of countries to purchase these resources and services).
Over the last fi ve decades, many of the world’s limited resources have become more expensive (World Bank, 2012). Prices have become highly reactive to supply-demand imbalances. During the Russian droughts and wildfi res of 2010, a drop in grain production led to a 70 percent increase in wheat prices over a single month. The drought experienced by the U.S. Midwest in the summer of 2012 will also likely impact prices. Such price or supply shocks can cause severe economic imbalances in countries and sometimes lead to social unrest. The high volatility of commodity prices in recent years is at
least partly due to ecological overshoot, as the economic sub-system is susceptible to changes in the availability of both renewable and non-renewable resources.
Non-renewable resources’ supply and demand are highly inelastic. Large price variations—as demonstrated by the international oil and mineral prices—are needed to balance supply and demand, especially for fossil fuels. Renewable natural resources, in contrast, have historically experienced supply increase in response to additional demand, and their prices are thus highly susceptible to supply-demand imbalances.
The increasing scarcity of global renewable resources—as well as the increased price of fossil resources used for their extraction—caused prices to reach historic highs in 2008. As global renewable resource availability diminishes and oil prices keep climbing, this volatility will increase, with severe implications for the trade balance of many Mediterranean countries.
The degree of dependence on external ecological assets for imports of resources makes responding to important price hikes challenging and could further negatively affect a country’s capacity to maintain its economic output. Over the past few decades, economic success has translated into higher resource consumption levels that are no longer sustainable. Countries’ efforts to drive their competitive advantage could lead to a race to disaster, as they maintain their
income (or GDP levels) by liquidating their ecological or fi nancial assets, or both. Table 2 shows the ecological assets balance and the current account balance
for each Mediterranean country in 2008. Results show that ecological defi cits are coupled with fi scal defi cits (indicated by the negative account balance) in the majority of the Mediterranean countries. Any economic actor who is both highly dependent on external resources and
ecological services, as well as weakened fi nancially through large debts, will face growing diffi culties in accessing the required resources and services. This might have crippling effects for its future economic performance. To ensure long-term economic prosperity and competitiveness, decisions are needed that recognize ecological assets—both dependence on and access to—as among the key drivers of economic success.
2.0 (34.4)
2.6 6.1 3.9 1.4
49.9 51.3 (1.8) 66.3
2.0 4.1
(35.7) 1.2 0.5
- 4.5
31.9 3.8
154.5 (0.5)
1.7 41.5
[Million gha] [Billion USD]COUNTRY
Financial Deficit (surplus)Ecological Deficit (Reserve)

22
Mediterranean countries’ ability to harvest local primary resources and import commodities from the global market has played an important role in guaranteeing their citizens a high degree of well-being. However, in a world of growing ecological overshoot, neither continued access to primary resources nor long-term improvements in human welfare are guaranteed. Countries that pursue a path toward sustainable development will be best positioned to meet their future needs.
Caring for the Earth, published in 1991 by IUCN, WWF and UNEP, defi ned sustainable development as a commitment to “improving the quality of human life while living within the carrying capacity of supporting ecosystems.” One way to assess countries’ progress toward sustainability (represented by the lower-right “sustainable consumption” quadrant of Figure 17) is by using the Ecological Footprint and biocapacity metrics to measure supply of and demand on supporting ecosystems, and the United Nations Development Programme’s (UNDP) Human Development Index (HDI) to measure quality of life.
The HDI index is comprised of three elements: Education, health, and living standards, with each component weighted equally. Education is approximated by years of schooling; health is approximated by life expectancy; living standards are approximated by Gross National Income per capita. UNDP considers countries
TOWARDS SUSTAINABLE DEVELOPMENT: HUMAN WELFARE AND PLANETARY LIMITS
above the median value to have “High Human Development.”
According to Global Footprint Network calculations, there were 1.8 global hectares per person of biocapacity available on the planet in 2008 (this amount should also provide for wild species which are in competition with human demands). Therefore, a minimum condition for global sustainability would be a per capita Ecological Footprint of less than 1.8 gha on average (and less if the population increases). Future generations’ ability to meet their own demands is compromised if this biocapacity budget is exceeded.
UNDP’s latest Human Development Report (UNDP, 2011) estimates that human development in the Mediterranean region increased greatly from 1980 to 2008—from Medium (the regional average HDI value in 1980 was 0.58) to Very High (regional HDI value in 2008 was 0.75).
In 2008, seven Mediterranean countries (Algeria, Egypt, Jordan, Morocco, Syria, Tunisia and Turkey) were classifi ed as having Medium Human Development, that is a value of HDI between the 25th and 50th percentile of all countries; seven countries (Albania, Bosnia and Herzegovina, Croatia, Lebanon, Libya, Macedonia TFYR and Montenegro) were classifi ed as having High Human Development, that is a value of HDI between the 50th and 75th percentile of all countries; and nine countries (Cyprus,
France, Greece, Israel, Italy, Malta, Portugal, Slovenia and Spain) had Very High Human Development (above 75th percentile). No data were available for the Occupied Palestinian Territories.
During the same period, the Mediterranean’s per capita Ecological Footprint increased by 7 percent (reaching the value of 3.1 gha in 2008), causing the average regional consumption habits to move away from the sustainable consumption quadrant. In 2008, only six Mediterranean countries (Algeria, Egypt, Montenegro, Morocco, Syria and Tunisia) had a Footprint of less than the global average available per capita biocapacity of 1.8 global hectares.
The Mediterranean region has made noticeable progress the last 30 years in implementing policies that enable residents to improve the quality of their life. But this has come at the cost of growing ecological overshoot.
Exceeding the regenerative capacity of the global ecological assets compromises future generations’ ability to meet their own demands. With the apparent increase in resource shortages, even current generations might be unable to replicate the improvements in human welfare seen in the recent past. If rapid progress is not made toward living within the means of the planet, governments will not be able to safeguard recent achievements and move toward sustainable development.
Human development in the Mediter-ranean region increased from 1980 to 2008—from Medium to Very High. In 2008, Mediterranean countries were classifi ed as follow:
· Medium Human Development: Algeria, Egypt, Jordan, Morocco, Syria, Tunisia and Turkey;· High Human Development: Albania, Bosnia and Herzegovina, Croatia, Lebanon, Libya, Macedonia TFYR and Montenegro; · Very High Human Develop-ment: Cyprus, France, Greece, Israel, Italy, Malta, Portugal, Slovenia and Spain.
Only Algeria, Egypt, Montenegro, Morocco, Syria and Tunisia had a Foot-print of less than the global average available per capita biocapacity of 1.8 global hectares.
Human development in the
Mediterranean region increased
from 1980 to 2008—from
Medium to Very High. In 2008,
Mediterranean countries
were classifi ed as follows:
MEDIUM HUMAN
DEVELOPMENT
Algeria, Egypt, Jordan, Morocco,
Syria, Tunisia and Turkey;
HIGH HUMAN
DEVELOPMENT
Albania, Bosnia and
Herzegovina, Croatia, Lebanon,
Libya, Macedonia TFYR and
Montenegro;
VERY HIGH HUMAN
DEVELOPMENT
Cyprus, France, Greece, Israel,
Italy, Malta, Portugal, Slovenia
and Spain.
Only Algeria, Egypt, Montenegro,
Morocco, Syria and Tunisia had
a Footprint of less than the global
average available per capita
biocapacity of 1.8 global hectares.

23
MEDITERRANEAN ECOLOGICAL FOOTPRINT TRENDS
0.2 0.4 0.6 0.80
22
4
6
8
10
12
United Nations Human Development Index
1.0
ILESIT
GR FRSI
PT
CYMTHV
LYBA
LB
MK
ALDZ
JOTN
SYMA
EG
Low
HD
Med
ium
HD
Hig
h H
D
Very
hig
h H
D
TR
World biocapacity (2008)
PS
World’s Sustainable Development Quadrant
Ecol
ogic
al F
ootp
rint (
glob
al h
ecta
res
per p
erso
n)
Figure 17: Human Development Index (x-axis) and per capita Ecological Footprint (y-axis) for Mediterranean countries. HDI and Footprint positions in 2008 are highlighted with blue dots. The Mediterranean region’s overall trend from 1980 to 2008 is shown with the red dotted line. A low average Ecological Footprint and a high HDI score are the necessary minimum conditions for globally replicable sustainable human development (indicated by the bottom-right quadrant).

24
Greece, Italy, Portugal and Spain have historically contributed a large share of the economic output of the Mediterranean region (in 2008, the group had a combined GDP of over US $2.2 trillion, compared with the region’s total GDP of $4.8 trillion). These same four countries were also responsible for 40 percent of the Mediterranean’s total Ecological Footprint, with Italy and Spain having the highest total ecological defi cits in the region in 2008.
Among the group, Greece had both the highest per capita Ecological Footprint of consumption (4.9 gha) and the highest per capita biocapacity (1.6 gha) in 2008 (Figure 18). It was followed by Spain (4.7 gha), Italy (4.5 gha) and Portugal (4.1 gha) in Footprint size, and by Spain (1.5 gha), Portugal (1.3 gha) and Italy (1.1 gha) in available biocapacity.
All countries in the group had large ecological defi cits from 1961 to 2008; by 2008, Greece, Italy, and Spain all had similar-sized per capita defi cits (approximately 3.3 gha), while Portugal had the smallest (2.8 gha). Portugal was also the sole country in the group to signifi cantly narrow its ecological defi cit in the last decade, from 3.4 gha per capita in 1998 to 2.8 gha per capita in 2008 (-18 percent).
Biocapacity from local assets was found to contribute less to each country’s total ecological resource and service demand than the regional average (40 percent) in 2008: 32 percent of the total Ecological Footprint of consumption in Greece, 31 percent in Portugal and Spain, and 25 percent in Italy.
Among the group, Greece and Spain had the highest per capita Ecological Footprint of production (3.5 gha and 3.7 gha, respectively) and the gap between this latter and biocapacity contributed to 40 percent (Greece) and 47 percent (Spain) of the total demand. This indicates a
NATIONAL CASE STUDIES
0
1
2
3
4
5
6
200820001990198019701960
Glo
bal h
ecta
res
per c
apita
EF-consumption BiocapacityEF-production
Figure 18: Ecological Footprint of production (EFP) and consumption activities (EFC) compared to available biocapacity (BC), for Greece, Italy, Portugal and Spain, 1961-2008.
relatively high reliance on local production activities to meet the demand for ecological resources and services of their residents. The Footprint embedded in net trade activities contributed the least to the Ecological Footprint of consumption (28 percent in Greece and 22 percent in Spain).
Conversely, the Ecological Footprint embedded in trade activities contributed to 37 percent of Italy’s total
Ecological Footprint of consumption, and to 34 percent of Portugal’s. This indicates a higher degree of dependence on ecological resources and services from outside national geographical borders compared to Greece and Spain. The gap between Ecological Footprint of production and biocapacity contributed to 37 percent (Italy) and 34 percent (Portugal) of the total Ecological Footprint.
0
1
2
3
4
5
6
200820001990198019701960
Glo
bal h
ecta
res
per c
apita
EF-consumption BiocapacityEF-production
0
1
2
3
4
5
6
200820001990198019701960
Glo
bal h
ecta
res
per c
apita
EF-consumption BiocapacityEF-production
0
1
2
3
4
5
6
200820001990198019701960
Glo
bal h
ecta
res
per c
apita
EF-consumption BiocapacityEF-production
GREECE ITALY
PORTUGAL SPAIN

25
MEDITERRANEAN ECOLOGICAL FOOTPRINT TRENDS
A FOCUS ON TRADE FLOWS
The fl ow of resources through a country’s economy is illustrated by Figure 19, where the size of the economy can be viewed as either the sum of inputs or the sum of outputs, which are equal. Inputs into the economy take the form of imports and domestic production, while outputs are either exported or consumed domestically.
Over the last fi ve decades, growing populations and consumption levels have caused Greece, Italy, Portugal and Spain to increasingly turn to imports of ecological resources and services to fuel economic growth. As of 2008, the Ecological Footprint embedded in imports constituted approximately half of the total Footprint inputs to their domestic economies, with values ranging from 40 percent (Greece and Spain) to 46 percent (Italy and Portugal). At the same time, the Ecological Footprint embedded in exports contributed less than one-fi fth of the total Footprint outputs, with values ranging from 11 percent (Italy) to 17 percent (Portugal).
Figure 19: Flow of resources through a country’s economy. Inputs to a country’s economy can be in the form of local production or imports. Outputs from a country’s economy can be in the form of exports or internal consumption. The sum of the inputs is equal to the sum of outputs; from the Ecological Footprint point of view this relationship can be expressed as EFP + EFI = EFC + EFE.
0
10
20
30
40
50
60
70
80
Perc
enta
ge o
f res
ourc
e in
puts
from
impo
rts
Greece PortugalItaly Spain
Figure 20: Percentage contribution to total resource and services inputs (in global hectares) to countries’ economy from Ecological Footprint of production and the Footprint embedded in imports, by region in 2008. Each region is shaded according to its ecological defi cit situation, from dark red (large defi cit) to dark green (large reserve).
EXPORTS
CONSUMPTION
ECONOMY
IMPORTS
PRODUCTION
Africa
EULatin America
Middle-East/Central AsiaNorth AmericaOther EuropeDomestic Production

26
Several of the trading partners on which Greece, Italy, Portugal and Spain rely for essential inputs are themselves experiencing growing resource constraints. As Figure 20 illustrates, the EU was the largest source of imports in 2008. But the large ecological defi cit of this region suggests that these trade fl ows cannot be easily maintained long-term, risking price volatility or supply disruptions for importing countries.
Spain’s relatively low reliance on imports, and a trade pattern with a greater weighting toward ecological creditor regions (such as Latin America), makes it the least exposed of the group to such shocks. Italy appears to have the greatest exposure, with a relatively high reliance on imports and a trade pattern that includes a large percentage of imports from the ecological debtor Asia-Pacifi c region.
Exporters of resources and services are also vulnerable. Volatile commodity prices can impede effective revenue management. The greatest risk, however, is to those countries whose Footprint of production highly exceeds the local biocapacity, increasing the likelihood of a gradual reduction in the bioproductive capacity of their ecological assets. This situation is common for all four countries in the group, and particularly relevant in Spain.
Figure 21 shows that all four countries predominantly export embedded Footprint to the EU, with Greece also exporting 13 percent of the production of its ecological assets to the Asia-Pacifi c region. Spain has the greatest fraction of resource outputs going to exports rather than to domestic consumption; this suggests that the country is best placed to take advantage of higher resource prices, but it also exposes Spain to a worsening trade balance should the country experience sudden drops in its ability to produce resources.
Figure 21: Percentage of total resource and services outputs (in global hectares) from the economy going to domestic consumption (EFC) and exports (EFE) by region, in 2008. Each region is shaded according to its ecological defi cit situation, from dark red (large defi cit) to dark green (large remainder). The vast majority of resource outputs go to support domestic consumption in all four countries, with little being exported.
IDENTIFYING FOOTPRINT HOTSPOTS
Events since 2008 have highlighted structural weaknesses in the group’s economies. However, while the fi nancial risks of Greece, Italy, Portugal and Spain have become evident to analysts, the rapid growth of their ecological defi cits has remained largely unnoticed.
Figure 22 highlights the group’s consumption patterns in 2008 by showing the Ecological Footprint of an average resident broken down into its main categories of consumption.
While “Food and non-alcoholic beverages” dominated the
consumption profi le of all four countries, the breakdown provided in Figure 22 indicates that this category had a lower contribution toward the total Footprint in Italy and Spain than the regional average (18 percent versus 27 percent). In Spain, this was largely counterbalanced by the greater contribution to the Ecological Footprint from “Recreation and culture” and government consumption (Gov.) categories; a greater contribution from the “Restaurants and hotels” category was found in Italy.
Portugal’s low contribution from the “Housing, water, electricity, gas and other fuels” consumption category was anomalous, whereas it exceeded the regional
0
20
40
60
80
100
Perc
enta
ge o
f res
ourc
e ou
tput
s go
ing
to e
xpor
ts
Greece PortugalItaly Spain
Africa
EULatin America
Middle-East/Central AsiaNorth AmericaOther EuropeDomestic Consumption

27
MEDITERRANEAN ECOLOGICAL FOOTPRINT TRENDS
Figure 22: Breakdown of the per capita Ecological Footprint of an average resident in Greece, Italy, Portugal and Spain, in 2008, as a percentage of the Mediterranean average. The chart indicates how much of the Ecological Footprint of consumption is paid for directly by government (Gov.), how much is for expenditure of long-lasting goods (GFCF) and how much is directly paid for by household for short-lived goods within 6 main consumption categories.
average in the “Alcoholic beverages, tobacco and narcotics” category. Greece saw a large contribution to its Ecological Footprint from private and public investment (GFCF), and a correspondingly low contribution from government consumption.
The “Transportation” category was a signifi cant contributor to all four countries’ Ecological Footprint.
Household - food and non-alcoholic beverages
Household - transportation
Household - housing, water, electricity, gas and other fuels
Household - alcoholic beverages, tobacco and narcotics
Household - recreation and culture
Household - other Household
Government
Gross Fixed Capital Formation
Examination of the group’s specifi c
areas of ecological resource
dependence identifi es Footprint hotspots
and indicates potential areas of
intervention for government and private
sector decision-makers. With differences
among Greece, Italy, Portugal and
Spain, the analysis identifi ed “Food and
non-alcoholic beverages”, personal
“Transportation” and “Housing, water,
electricity, gas and other fuels” as the
consumption categories with the highest
Ecological Footprint, which would
benefi t from timing government and
businesses actions.
MEDITERRANEAN REGION
PORTUGAL ITALY GREECE SPAIN

28
CONCLUSIONS
Global Footprint Network’s Ecological Footprint Initiative in the Mediterranean Region is based on a simple premise: Human societies and economies depend on the biosphere’s many resources and life-supporting ecological services. As demand on these ecological resources and services increases, accelerating global ecological overshoot and pushing more countries into large ecological defi cits, economic success can no longer be secured without carefully managing and tracking the demand on, and availability of, the regenerative capacity of Earth’s ecological assets. Tools are thus needed to illustrate the scale of change we are witnessing, and to provide a platform for weighing the policy options that will help nations remain competitive in an increasingly resource-constrained world.
This report aimed at providing an overview of the ecological demand and supply situation for the Mediterranean region and its countries—their ecological bank statements—through use of the Ecological Footprint and biocapacity indicators. Global Footprint Network has published this report and its executive summary, “Why Are Resource Limits Now Undermining Economic Performance?”, to stimulate a deeper investigation into the implications of growing ecological defi cits for the Mediterranean region’s ecosystems and economies.
Key fi ndings show the socio-economic implications of resource constraints in the Mediterranean and the precarious position of individual countries and the region as a whole:
DEMAND OUTSTRIPS SUPPLY From 1961 to 2008, the Mediterranean’s per capita Ecological Footprint grew by 52 percent (from 2.1 to 3.1 gha) while per capita biocapacity decreased by 16 percent (from 1.5 gha to 1.3 gha). In less than 50 years, the Mediterranean region nearly tripled its demands for ecological resources and services, and increased its ecological defi cit by 230 percent.
SUPPLY AND DEMAND TODAYAs of 2008, the region’s Ecological Footprint exceeds its local biocapacity by more than 150 percent, and the ecological defi cit situation had spread to every Mediterranean country (Montenegro is a possible exception, but data is incomplete).
INCOME AND FOOTPRINT SIZE The higher the income of a country, the greater was its demand for ecological resources and services. Three countries alone contributed more than 50 percent of the region’s total Ecological Footprint in 2008: France (21 percent), Italy (18 percent) and Spain (14 percent).
BIOCAPACITY IS UNEQUALLY DISTRIBUTEDThree countries alone provided more than 50 percent of the biocapacity of the region: France (31 percent), Turkey (15 percent) and Italy (11 percent).
PER CAPITA ECOLOGICAL FOOTPRINT RANKINGS The Former Yugoslavian Republic of Macedonia had the region’s largest per capita Ecological Footprint (5.4 gha) in 2008, followed by Slovenia (5.2 gha) and Greece (4.9 gha). The smallest per capita Footprint were found in Morocco (1.3 gha), Montenegro (1.2 gha) and the Occupied Palestinian Territories (0.5 gha).
“Global Footprint Network,
MAVA Foundation, Plan Bleu,
WWF Mediterranean and
UNESCO Offi ce in Venice
call on governments and
international institutions to
consider Ecological Footprint
and biocapacity to assess the
state of ecological assets, and
to measure progress towards
sustainable development
and green economy in the
Mediterranean region.”

The Mediterranean region has been running an ecological defi cit for more than 50 years, with its Ecological Footprint increasingly exceeding biocapacity. With local ecological constraints, economic growth has therefore depended ever more on importing biocapacity. The disparity between demand and supply—the ecological defi cit—has made the economic stability of the Mediterranean region and countries highly dependent on the availability of healthy global ecological assets, and the fi nancial capacity to pay for these assets.
However, Global Footprint Network’s data show that global ecological overshoot also increased during the 47-year period analyzed for this study. By 2008, humanity was using 52 percent more resources and ecological services than were available globally. A global competition for biocapacity is heating up.
These trends have led Mediterranean economies into a particularly vulnerable position, as the region’s ongoing economic crisis further constrains its ability to meet resource and ecological service needs.
How can the region address these risks? Even in this resource-constrained world, countries can remain economically successful. Indeed, with the right tools, leaders can choose strategies that both reverse the trends of shrinking supply and growing demand and help their populations thrive in this new era. But how
Mediterranean countries manage their supply of and demand on biocapacity will be central to their long-term ability to remain economically competitive and to provide for the well-being of their people.
PER CAPITA BIOCAPACITY RANKINGS France (3.0 gha), Croatia (2.9 gha) and Slovenia (2.6 gha) had the most per capita biocapacity available, while Cyprus (0.2 gha), Jordan (0.2 gha) and the Occupied Palestinian Territories (0.1 gha) had the least. The disparity in per capita biocapacity is mainly due to biophysical and climatic conditions—for example, water shortages affecting land productivity—as well as population density.
INDIVIDUAL COUNTRY TRENDSAlgeria experienced the most signifi cant change, moving from the largest ecological reserve in the region in 1961 to an ecological defi cit in 2008. Morocco, Libya, Syria, Tunisia and Turkey also shifted from ecological creditor to debtor status during this period, while the other Mediterranean countries saw an increase in their ecological defi cits. Cyprus experienced the largest defi cit increase, and Jordan the smallest.
REGION’S BIGGEST ECOLOGICAL DEBTORSIn 2008, the fi ve Mediterranean countries with the highest total ecological defi cits were Italy, Spain, France, Turkey and Egypt. Italy alone, with an ecological defi cit of more than 200 million global hectares, contributed to almost a quarter of the Mediterranean’s total ecological defi cit.
ONE EXCEPTION TO REGIONAL TRENDSPortugal is the sole country in the Mediterranean region to have signifi cantly narrowed its ecological defi cit in recent years (an 18 percent decrease between 1998 and 2008). But the country’s per capita defi cit (2.8 gha) is still higher than the regional average (1.9 gha).
HUMAN DEVELOPMENTHuman development (as measured by the HDI) has signifi cantly increased in the Mediterranean region over the last 30 years. But this has come at the cost of growing ecological defi cits, as an increasing per capita Footprint has caused regional consumption habits to exceed minimum conditions for global sustainability.
FOOTPRINT HOTSPOTS AND MITIGATION OPPORTUNITIES“Food and non-alcoholic beverages”, “Transportation” and “Housing, water, electricity, gas and other fuels” are the consumption categories most contributing to the Ecological Footprint of Mediterranean’s residents. Actions and policies are needed in these priority areas to improve effi ciency in the use of ecological assets and to start reversing ecological defi cits.
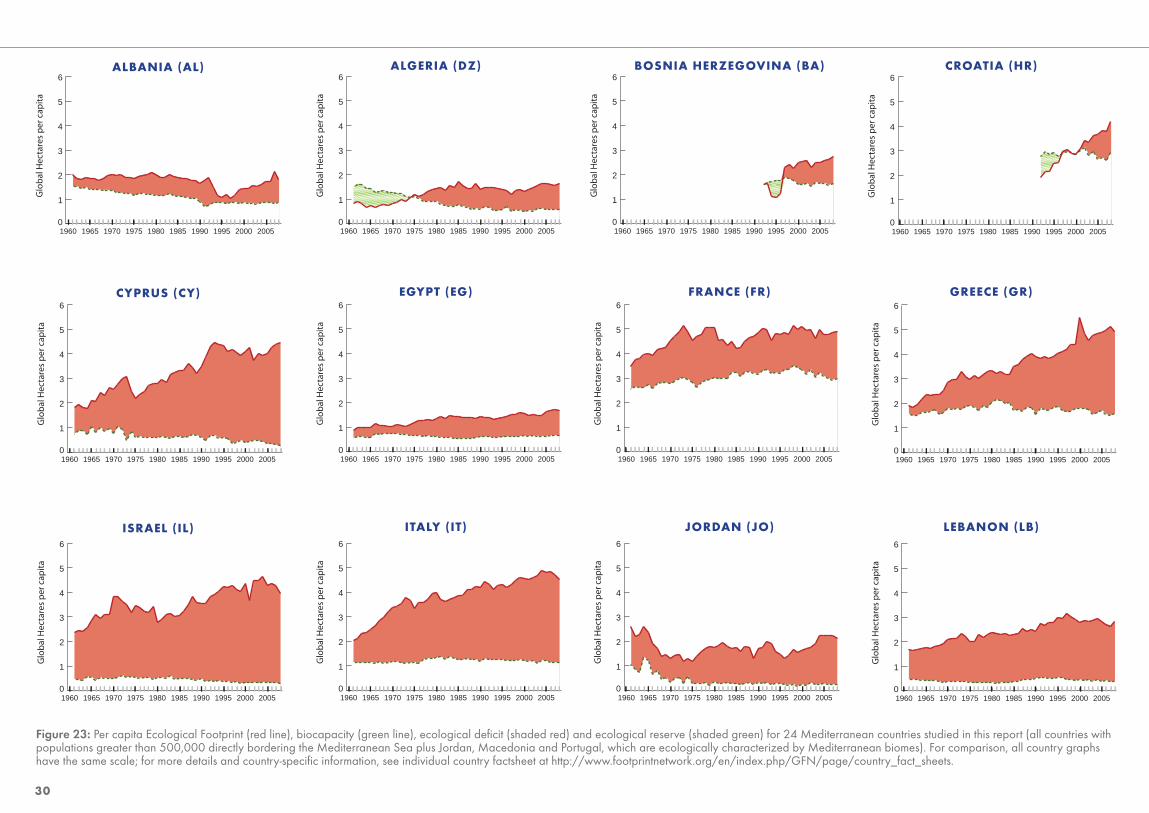
30
Figure 23: Per capita Ecological Footprint (red line), biocapacity (green line), ecological defi cit (shaded red) and ecological reserve (shaded green) for 24 Mediterranean countries studied in this report (all countries with populations greater than 500,000 directly bordering the Mediterranean Sea plus Jordan, Macedonia and Portugal, which are ecologically characterized by Mediterranean biomes). For comparison, all country graphs have the same scale; for more details and country-specifi c information, see individual country factsheet at http://www.footprintnetwork.org/en/index.php/GFN/page/country_fact_sheets.
0
1
2
3
4
5
6
2005200019951990198519801975197019651960
Glo
bal
Hec
tare
s p
er c
apit
a
0
1
2
3
4
5
6
2005200019951990198519801975197019651960
Glo
bal
Hec
tare
s p
er c
apit
a
0
1
2
3
4
5
6
2005200019951990198519801975197019651960
Glo
bal
Hec
tare
s p
er c
apit
a
0
1
2
3
4
5
6
2005200019951990198519801975197019651960
Glo
bal
Hec
tare
s p
er c
apit
a
0
1
2
3
4
5
6
2005200019951990198519801975197019651960
Glo
bal
Hec
tare
s p
er c
apit
a
0
1
2
3
4
5
6
2005200019951990198519801975197019651960
Glo
bal
Hec
tare
s p
er c
apit
a
0
1
2
3
4
5
6
2005200019951990198519801975197019651960
Glo
bal
Hec
tare
s p
er c
apit
a
0
1
2
3
4
5
6
2005200019951990198519801975197019651960
Glo
bal
Hec
tare
s p
er c
apit
a
0
1
2
3
4
5
6
2005200019951990198519801975197019651960
Glo
bal
Hec
tare
s p
er c
apit
a
0
1
2
3
4
5
6
2005200019951990198519801975197019651960
Glo
bal
Hec
tare
s p
er c
apit
a
0
1
2
3
4
5
6
2005200019951990198519801975197019651960
Glo
bal
Hec
tare
s p
er c
apit
a
0
1
2
3
4
5
6
2005200019951990198519801975197019651960
Glo
bal
Hec
tare
s p
er c
apit
a
ALBANIA (AL) ALGERIA (DZ) BOSNIA HERZEGOVINA (BA) CROATIA (HR)
CYPRUS (CY) EGYPT (EG) FRANCE (FR) GREECE (GR)
ISRAEL (IL) ITALY (IT) JORDAN (JO) LEBANON (LB)

31
MEDITERRANEAN ECOLOGICAL FOOTPRINT TRENDS
0
1
2
3
4
5
6
2005200019951990198519801975197019651960
Glo
bal
Hec
tare
s p
er c
apit
a
0
1
2
3
4
5
6
2005200019951990198519801975197019651960
Glo
bal
Hec
tare
s p
er c
apit
a
0
1
2
3
4
5
6
2005200019951990198519801975197019651960
Glo
bal
Hec
tare
s p
er c
apit
a
0
1
2
3
4
5
6
2005200019951990198519801975197019651960
Glo
bal
Hec
tare
s p
er c
apit
a
0
1
2
3
4
5
6
2005200019951990198519801975197019651960
Glo
bal
Hec
tare
s p
er c
apit
a
0
1
2
3
4
5
6
2005200019951990198519801975197019651960
Glo
bal
Hec
tare
s p
er c
apit
a
0
1
2
3
4
5
6
2005200019951990198519801975197019651960
Glo
bal
Hec
tare
s p
er c
apit
a
0
1
2
3
4
5
6
2005200019951990198519801975197019651960
Glo
bal
Hec
tare
s p
er c
apit
a
0
1
2
3
4
5
6
2005200019951990198519801975197019651960
Glo
bal
Hec
tare
s p
er c
apit
a
0
1
2
3
4
5
6
2005200019951990198519801975197019651960
Glo
bal
Hec
tare
s p
er c
apit
a
0
1
2
3
4
5
6
2005200019951990198519801975197019651960
Glo
bal
Hec
tare
s p
er c
apit
a
0
1
2
3
4
5
6
2005200019951990198519801975197019651960
Glo
bal
Hec
tare
s p
er c
apit
a
Ecological Footprint
Biocapacity
LIBYA (LY) FYR OF MACEDONIA (MK) MALTA (MT) MONTENEGRO (ME)
MOROCCO (MA) OCCUPIED PALESTINIANTERRITORIES (PS)
PORTUGAL (PT) SLOVENIA (SI)
SPAIN (ES) SYRIA (SY) TUNISIA (TN) TURKEY (TR)

32
The National Footprint Accounts track countries’ use of ecological services and resources as well as the biocapacity available in each country. As with any resource accounts, they are static, quantitative descriptions of outcomes, for any given year in the past for which data exist. The detailed calculation methodology of the most updated Accounts—the National Footprint Accounts 2011 Edition—is described in Borucke et al. (2013). The National Footprint Accounts 2011 Edition calculates the Ecological Footprint and biocapacity for about 150 countries and regions, from 1961 to 2008. A short description of the methodology and the data needs is also provided below. ECOLOGICAL FOOTPRINT The National Footprint Accounts 2011 Edition track human demand for resources and ecological services in terms of six major land use types (cropland, grazing land, forest land, carbon Footprint, fi shing grounds, and built-up land). With the exception of built-up land and forest for carbon dioxide uptake, the Ecological Footprint of each major land use type is calculated by summing the contributions of a variety of specifi c products. Built-up land refl ects the bioproductivity compromised by infrastructure and hydropower. Forest land for carbon dioxide uptake represents the carbon absorptive capacity of a world average hectare of forest needed to absorb anthropogenic CO2 emissions, after having considered the ocean sequestration capacity (also called the carbon Footprint).
The Ecological Footprint calculates the combined demand for ecological resources and services wherever they are located and presents them as the global average area needed to support a specifi c human activity. This quantity is expressed in units of global hectares, defi ned as hectares of bioproductive area with world average bioproductivity. By expressing all results in a common unit, biocapacity and Footprints can be directly compared across land use types and countries.
Demand for resource production and waste assimilation are translated into global hectares by dividing the total amount of a resource consumed by the yield per hectare, or dividing the waste emitted by the absorptive capacity per hectare. Yields are calculated based on various international statistics, primarily those from the United Nations Food and Agriculture Organization (FAO ResourceSTAT Statistical Databases). Yields are mutually exclusive: If two crops are grown at the same time on the same hectare, one portion of the hectare is assigned to one crop, and the remainder to the other. This avoids double counting. This follows the same logic as measuring the size of a farm: Each hectare is only counted once, even though it might provide multiple services.
The Ecological Footprint, in its most basic form, is calculated by the following equation:
where D is the annual demand of a product and Y is the annual yield of the same product (Monfreda et al., 2004; Galli et al., 2007). Yield is expressed in global hectares. In practice, global hectares are estimated with the help of two factors: The yield factors (that compare national average yield per hectare to world average yield in the same land category) and the equivalence factors (which capture the relative productivity among the various land and sea area types).
Therefore, the formula of the Ecological Footprint becomes:
where P is the amount of a product harvested or waste emitted (equal to D above), YN is the national average yield for P, and YF and EQF are the yield factor and equivalence factor, respectively, for the country and land use type in question. The yield factor is the ratio of national- to world-average yields. It is calculated as the annual availability of usable products and varies by country and year. Equivalence factors translate the area supplied or demanded of a specifi c land use type (e.g., world average cropland, grazing land, etc.) into units of world average biologically productive area (global hectares) and vary by land use type and year.
Annual demand for manufactured or derivative products (e.g., fl our or wood pulp), is converted into primary product equivalents (e.g., wheat or roundwood) through the use of extraction rates. These quantities of primary product equivalents are then translated into an Ecological Footprint. The Ecological Footprint also embodies the energy required for the manufacturing process.
CONSUMPTION, PRODUCTION, AND TRADE
The National Footprint Accounts calculate the Footprint of a population from a number of perspectives. Most commonly reported is the Ecological Footprint of consumption of a population, typically just called the Ecological Footprint. The Ecological Footprint of consumption for a given country measures the biocapacity demanded by the fi nal consumption of all the residents of the country. This includes their household consumption as well as their collective consumption, such as schools, roads, fi re brigades, etc., which serve the household, but may not be directly paid for by the households.
In contrast, a country’s primary production Ecological Footprint is the sum of the Footprints for all resources harvested and waste generated within the country’s geographical borders. This includes all the area within a country necessary for supporting the actual harvest of primary products (cropland, grazing land, forest land, and fi shing grounds), the country’s infrastructure and hydropower (built-up
APPENDIX A: CALCULATING THE ECOLOGICAL FOOTPRINT

33
MEDITERRANEAN ECOLOGICAL FOOTPRINT TRENDS
land), and the area needed to absorb fossil fuel carbon dioxide emissions generated within the country (carbon Footprint).
The difference between the production and consumption Footprint is trade, shown by the following equation:
where EFC is the Ecological Footprint of consumption, EFP is the Ecological Footprint of production, and EFI and EFE are the Footprints of imported and exported commodity fl ows, respectively.
BIOCAPACITY
A national biocapacity calculation starts with the total amount of bioproductive land—or ecological assets¬—available. “Bioproductive” refers to land and water that supports signifi cant photosynthetic activity and accumulation of biomass, ignoring barren areas of low, dispersed productivity. This is not to say that areas such as the Sahara Desert, Antarctica, or Alpine mountaintops do not support life; their production is simply too widespread to be directly harvestable by humans. Biocapacity is an aggregated measure of the amount of land available, weighted by the productivity of that land. It represents the ability of the biosphere to produce crops, livestock (pasture), timber products (forest), and fi sh, as well as to uptake carbon dioxide in forests. It also includes how much of this regenerative
capacity is occupied by infrastructure (built-up land). In short, it measures the ability of available terrestrial and aquatic areas to provide ecological resources and services. A country’s biocapacity for any land use type is calculated as:
where BC is the biocapacity, A is the area available for a given land use type, and YF and EQF are the yield factor and equivalence factor, respectively, for the country land use type in question.
ENVIRONMENTALLY EXTENDED INPUT-OUTPUT ANALYSIS FOR THE ECOLOGICAL FOOTPRINT
Two sets of data are utilized to link Greece, Italy, Portugal and Spain’s Ecological Footprint with economic activities: (1) National Footprint Accounts and (2) national input-output tables presented in basic prices.
Monetary input-output tables were fi rst proposed by Wassily Leontief in the early 20th century. The use of input-output analysis to support physical fl ow accounting gained early acceptance for energy and pollution analysis in the 1970s. Environmentally Extended Input-Output (EEIO) models have been utilized for material and energy fl ow accounting and land use accounting to forecast trends and measure eco-effi ciency.
For the analysis in this report, we utilize the Global Trade, Assistance, and Production (GTAP) data from Purdue University
Center for Global Trade Analysis. The GTAP 7 Data Base contains data for 113 global regions and 57 industry sectors. Environmentally extended input-output analysis for the Ecological Footprint requires three key calculations in order to obtain results by industry sectors and fi nal demand: (1) Leontief inverse, (2) physical intensity for Ecological Footprint, and (3) total Footprint intensity.
The Leontief inverse calculation provides the direct and indirect requirements of any industry supplied by other industries to deliver one unit of output for fi nal demand. The physical intensity for the Ecological Footprint is calculated by dividing the Ecological Footprint by each land use type reported in the National Footprint Accounts by the total output for fi nal demand, including imports. This represents the direct required Footprint per unit of currency spent. The total Footprint intensity provides the direct and indirect Footprints of industrial sectors to provide one unit of production to fi nal demand—including the entire supply chain. This total Footprint intensity is calculated by multiplying the physical intensity by the Leontief inverse.
Results are then presented according to the fi nal demand categories such as household consumption, government consumption, and gross fi xed capital formation. The household consumption results can be further disaggregated according to the Classifi cation of Individual Consumption by Purpose (COICOP). A Consumption Land Use Matrix (CLUM) can be created
by combining the Ecological Footprint of household consumption, government consumption, and gross fi xed capital with the results from the National Footprint Accounts by land use type.
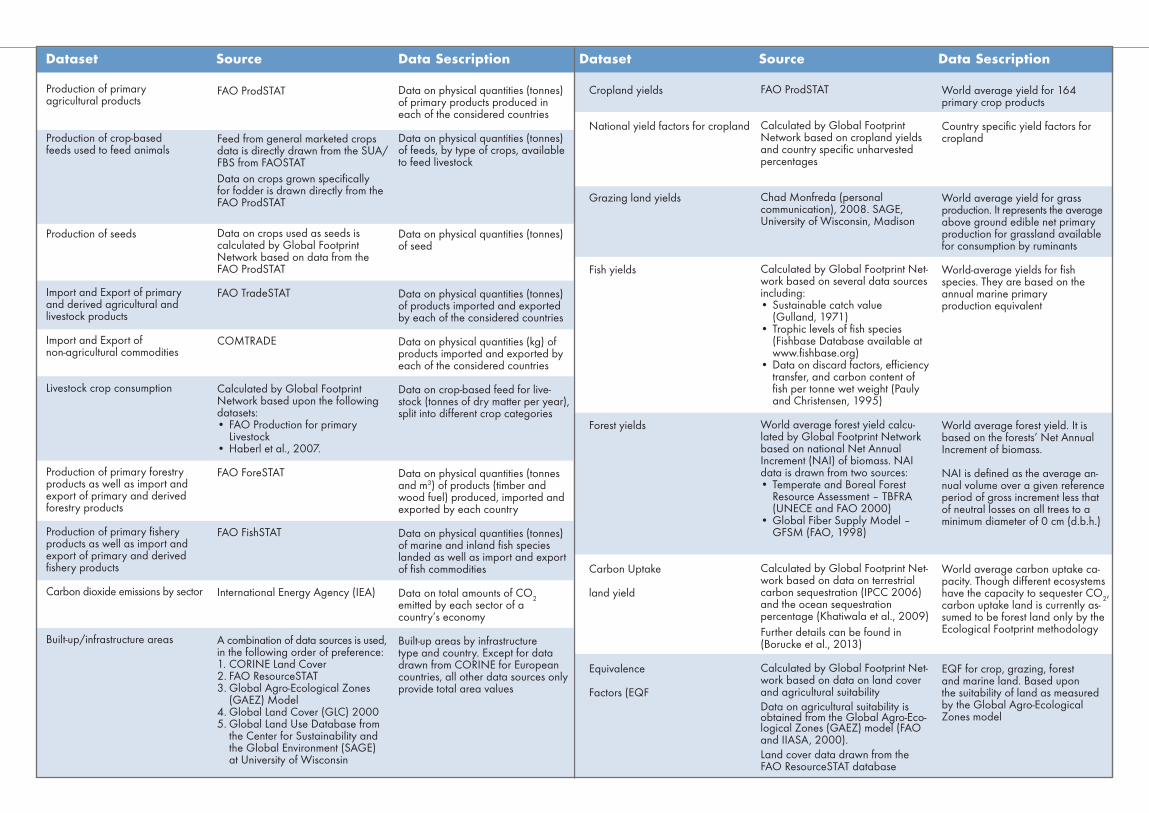
Dataset Source Data Sescription
Production of primary agricultural products
Production of crop-based feeds used to feed animals
Production of seeds
Import and Export of primary and derived agricultural and livestock products
Import and Export of non-agricultural commodities
Livestock crop consumption
Production of primary forestry products as well as import and export of primary and derived forestry products
Production of primary fi shery products as well as import and export of primary and derived fi shery products
Carbon dioxide emissions by sector
Built-up/infrastructure areas
FAO ProdSTAT
Feed from general marketed crops data is directly drawn from the SUA/FBS from FAOSTATData on crops grown specifi cally for fodder is drawn directly from the FAO ProdSTAT
Data on crops used as seeds is calculated by Global Footprint Network based on data from the FAO ProdSTAT
FAO TradeSTAT
COMTRADE
Calculated by Global Footprint Network based upon the following datasets:• FAO Production for primary Livestock• Haberl et al., 2007.
FAO ForeSTAT
FAO FishSTAT
International Energy Agency (IEA)
A combination of data sources is used, in the following order of preference:1. CORINE Land Cover2. FAO ResourceSTAT3. Global Agro-Ecological Zones (GAEZ) Model4. Global Land Cover (GLC) 20005. Global Land Use Database from the Center for Sustainability and the Global Environment (SAGE) at University of Wisconsin
Data on physical quantities (tonnes) of primary products produced in each of the considered countries
Data on physical quantities (tonnes) of feeds, by type of crops, available to feed livestock
Data on physical quantities (tonnes) of seed
Data on physical quantities (tonnes) of products imported and exported by each of the considered countries
Data on physical quantities (kg) of products imported and exported by each of the considered countries
Data on crop-based feed for live-stock (tonnes of dry matter per year), split into different crop categories
Data on physical quantities (tonnes and m3) of products (timber and wood fuel) produced, imported and exported by each country
Data on physical quantities (tonnes) of marine and inland fi sh species landed as well as import and export of fi sh commodities
Data on total amounts of CO2 emitted by each sector of a country’s economy
Built-up areas by infrastructure type and country. Except for data drawn from CORINE for European countries, all other data sources only provide total area values
Cropland yields
National yield factors for cropland
Grazing land yields
Fish yields
Forest yields
Carbon Uptake
land yield
Equivalence
Factors (EQF
FAO ProdSTAT
Calculated by Global Footprint Network based on cropland yields and country specifi c unharvested percentages
Chad Monfreda (personal communication), 2008. SAGE, University of Wisconsin, Madison
Calculated by Global Footprint Net-work based on several data sources including:• Sustainable catch value (Gulland, 1971)• Trophic levels of fi sh species (Fishbase Database available at www.fi shbase.org)• Data on discard factors, effi ciency transfer, and carbon content of fi sh per tonne wet weight (Pauly and Christensen, 1995)
World average forest yield calcu-lated by Global Footprint Network based on national Net Annual Increment (NAI) of biomass. NAI data is drawn from two sources:• Temperate and Boreal Forest Resource Assessment – TBFRA (UNECE and FAO 2000)• Global Fiber Supply Model – GFSM (FAO, 1998)
Calculated by Global Footprint Net-work based on data on terrestrial carbon sequestration (IPCC 2006) and the ocean sequestration percentage (Khatiwala et al., 2009) Further details can be found in (Borucke et al., 2013)
Calculated by Global Footprint Net-work based on data on land cover and agricultural suitabilityData on agricultural suitability is obtained from the Global Agro-Eco-logical Zones (GAEZ) model (FAO and IIASA, 2000).Land cover data drawn from the FAO ResourceSTAT database
World average yield for 164 primary crop products
Country specifi c yield factors for cropland
World average yield for grass production. It represents the average above ground edible net primary production for grassland available for consumption by ruminants
World-average yields for fi sh species. They are based on the annual marine primary production equivalent
World average forest yield. It is based on the forests’ Net Annual Increment of biomass. NAI is defi ned as the average an-nual volume over a given reference period of gross increment less that of neutral losses on all trees to a minimum diameter of 0 cm (d.b.h.)
World average carbon uptake ca-pacity. Though different ecosystems have the capacity to sequester CO2, carbon uptake land is currently as-sumed to be forest land only by the Ecological Footprint methodology
EQF for crop, grazing, forest and marine land. Based upon the suitability of land as measured by the Global Agro-Ecological Zones model
Dataset Source Data Sescription

APPENDIX B: THE CARBON-PLUS APPROACH
Trends in Figure 2 illustrate the rapid growth of human demand for ecological assets: Human demand is primarily made of, though not limited to, demand for the biosphere’s capacity to sequester carbon. Earth’s natural carbon cycle is out of balance. CO2 molecules are being released into the atmosphere faster than they can be sequestered, and a larger surface of photosynthetic lands is now required to absorb the extra CO2 responsible for this imbalance (Kitzes et al., 2009). Demand for carbon sequestration is growing unabated—as global population grows, standards of living improve and demand for energy and energy-intensive products increases (Krausmann et al, 2009).
However, while signifi cant, carbon sequestration accounted for just over half of total world-average demand on the planet’s ecological assets in 2008. The world’s appetite for water, food, timber, marine and many other resources is also highly relevant to the overall health of the biosphere. Climate change is currently seen as the most impending environmental issue, but it is just one of the many symptoms of humanity’s overconsumption of Earth’s ecological assets.
Solving the sustainability challenge therefore requires a holistic approach, one that can tackle multiple issues concurrently. Without a way of measuring the status (and human rate of use) of our ecological assets, it is easy for policy-makers to
ignore the impossibility of infi nite growth and remain entangled in ideological debates over the “affordability of sustainability.” Clear metrics are needed to change these ideological debates into discussions based on empirical facts, and the Ecological Footprint could be one of them. Understanding what the real risks are will then facilitate building consensus over the actions needed to address them.
Former French President Nicolas Sarkozy’s “Commission on the Measurement of Economic Performance and Social Progress” (also known as the “Stiglitz Commission”) emphasized the importance of complementing GDP with physical indicators for monitoring environmental sustainability. Their report highlighted the Ecological Footprint and one of its most signifi cant components, the carbon Footprint.
While the Stiglitz Commission favored a focus only on the Carbon Footprint—due to current carbon interest and the already established carbon accounting practices—for the reasons above Global Footprint Network argues that a “carbon plus” view is necessary to understand the signifi cance of current environmental trends and to take a comprehensive, more effective approach that tackles the full palette of human demands on the biosphere’s regenerative capacity.
Global Footprint Network argues that
a “carbon plus” view is necessary to
understand the signifi cance of current
environmental trends and to take a
comprehensive, more effective approach
that tackles the full palette of human
demands on the biosphere’s
regenerative capacity.
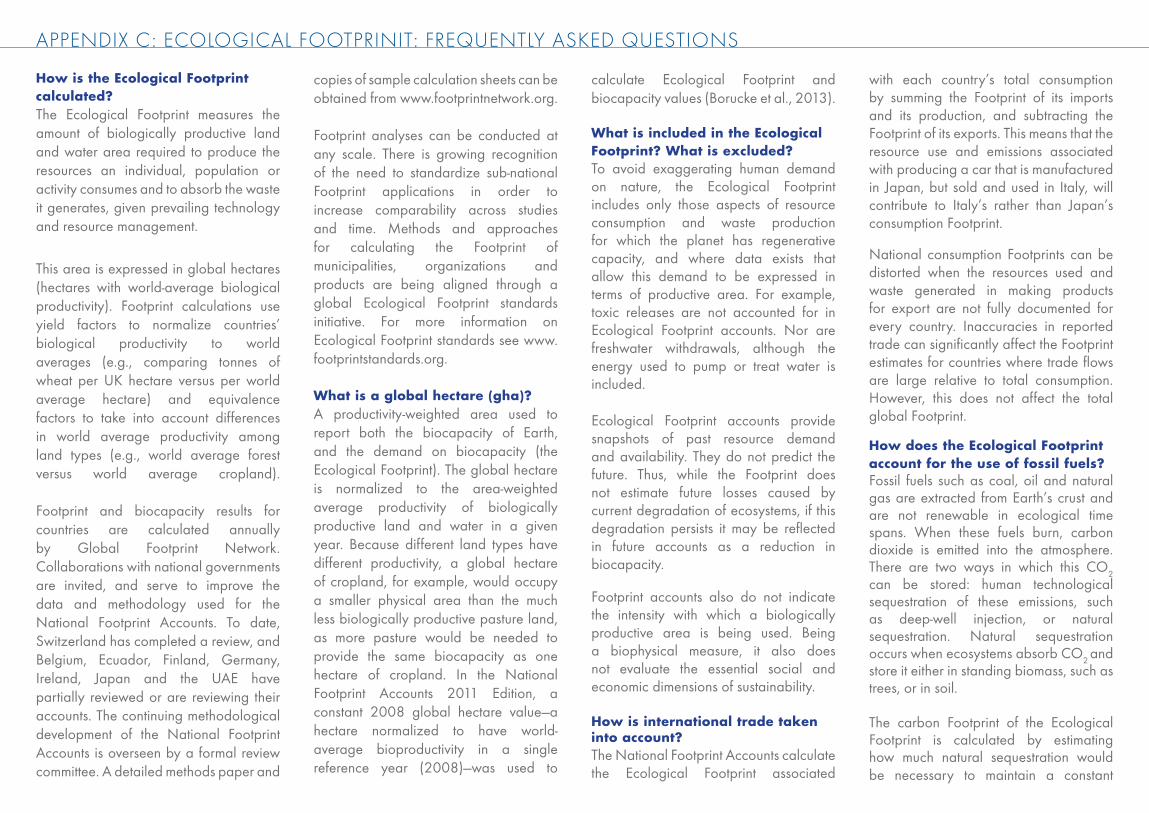
APPENDIX C: ECOLOGICAL FOOTPRINIT: FREQUENTLY ASKED QUESTIONS
How is the Ecological Footprint calculated?The Ecological Footprint measures the amount of biologically productive land and water area required to produce the resources an individual, population or activity consumes and to absorb the waste it generates, given prevailing technology and resource management.
This area is expressed in global hectares (hectares with world-average biological productivity). Footprint calculations use yield factors to normalize countries’ biological productivity to world averages (e.g., comparing tonnes of wheat per UK hectare versus per world average hectare) and equivalence factors to take into account differences in world average productivity among land types (e.g., world average forest versus world average cropland).
Footprint and biocapacity results for countries are calculated annually by Global Footprint Network. Collaborations with national governments are invited, and serve to improve the data and methodology used for the National Footprint Accounts. To date, Switzerland has completed a review, and Belgium, Ecuador, Finland, Germany, Ireland, Japan and the UAE have partially reviewed or are reviewing their accounts. The continuing methodological development of the National Footprint Accounts is overseen by a formal review committee. A detailed methods paper and
copies of sample calculation sheets can be obtained from www.footprintnetwork.org. Footprint analyses can be conducted at any scale. There is growing recognition of the need to standardize sub-national Footprint applications in order to increase comparability across studies and time. Methods and approaches for calculating the Footprint of municipalities, organizations and products are being aligned through a global Ecological Footprint standards initiative. For more information on Ecological Footprint standards see www.footprintstandards.org. What is a global hectare (gha)?A productivity-weighted area used to report both the biocapacity of Earth, and the demand on biocapacity (the Ecological Footprint). The global hectare is normalized to the area-weighted average productivity of biologically productive land and water in a given year. Because different land types have different productivity, a global hectare of cropland, for example, would occupy a smaller physical area than the much less biologically productive pasture land, as more pasture would be needed to provide the same biocapacity as one hectare of cropland. In the National Footprint Accounts 2011 Edition, a constant 2008 global hectare value—a hectare normalized to have world-average bioproductivity in a single reference year (2008)—was used to
calculate Ecological Footprint and biocapacity values (Borucke et al., 2013). What is included in the Ecological Footprint? What is excluded?To avoid exaggerating human demand on nature, the Ecological Footprint includes only those aspects of resource consumption and waste production for which the planet has regenerative capacity, and where data exists that allow this demand to be expressed in terms of productive area. For example, toxic releases are not accounted for in Ecological Footprint accounts. Nor are freshwater withdrawals, although the energy used to pump or treat water is included. Ecological Footprint accounts provide snapshots of past resource demand and availability. They do not predict the future. Thus, while the Footprint does not estimate future losses caused by current degradation of ecosystems, if this degradation persists it may be refl ected in future accounts as a reduction in biocapacity. Footprint accounts also do not indicate the intensity with which a biologically productive area is being used. Being a biophysical measure, it also does not evaluate the essential social and economic dimensions of sustainability.
How is international trade taken into account?The National Footprint Accounts calculate the Ecological Footprint associated
with each country’s total consumption by summing the Footprint of its imports and its production, and subtracting the Footprint of its exports. This means that the resource use and emissions associated with producing a car that is manufactured in Japan, but sold and used in Italy, will contribute to Italy’s rather than Japan’s consumption Footprint. National consumption Footprints can be distorted when the resources used and waste generated in making products for export are not fully documented for every country. Inaccuracies in reported trade can signifi cantly affect the Footprint estimates for countries where trade fl ows are large relative to total consumption. However, this does not affect the total global Footprint. How does the Ecological Footprint account for the use of fossil fuels?Fossil fuels such as coal, oil and natural gas are extracted from Earth’s crust and are not renewable in ecological time spans. When these fuels burn, carbon dioxide is emitted into the atmosphere. There are two ways in which this CO2 can be stored: human technological sequestration of these emissions, such as deep-well injection, or natural sequestration. Natural sequestration occurs when ecosystems absorb CO2 and store it either in standing biomass, such as trees, or in soil. The carbon Footprint of the Ecological Footprint is calculated by estimating how much natural sequestration would be necessary to maintain a constant

concentration of CO2 in the atmosphere. After subtracting the amount of CO2 absorbed by the oceans, Ecological Footprint accounts calculate the area required to absorb and retain the remaining carbon based on the average sequestration rate of the world’s forests. CO2 sequestered by artifi cial means would also be subtracted from the Ecological Footprint total, but at present, this quantity is negligible. Expressing CO2 emissions in terms of an equivalent bioproductive area does not imply that carbon sequestration in biomass is the key to resolving global climate change. On the contrary, it shows that the biosphere has insuffi cient capacity to offset current rates of anthropogenic CO2 emissions. The contribution of CO2 emissions to the total Ecological Footprint is based on an estimate of world average forest yields. This sequestration capacity may change over time. As forests mature, their CO2 sequestration rates tend to decline. If these forests are degraded or cleared, they may become net emitters of CO2.
Carbon emissions from some sources other than fossil fuel combustion are incorporated in the National Footprint Accounts at the global level. These include fugitive emissions from the fl aring of gas in oil and natural gas production, carbon released by chemical reactions in cement production and emissions from tropical forest fi res.
How does the Ecological Foot-print account for carbon emissions absorbed by the oceans versus uptake by forests?The National Footprint Accounts calculate the carbon Footprint component of the Ecological Footprint by considering sequestration from the world’s oceans and forests. Annual ocean uptake values are taken from Khatiwala et al. (2009) and used with the anthropogenic carbon emissions taken from CDIAC (2011). There is a relatively constant percentage uptake for oceans, varying between 28 per cent and 35 per cent over the period 1961–2008. The remaining CO2 requires land based sequestration. Due to the limited availability of large-scale datasets, the calculation assumes the world average sequestration rate for uptake of carbon dioxide into forests. The carbon Footprint, as calculated within the Ecological Footprint methodology, is thus a measure of the area of world average forest land that is necessary to sequester the carbon dioxide emissions that are not absorbed into the world’s oceans.
Does the Ecological Footprint take into account other species?The Ecological Footprint compares human demand on biodiversity with the natural world’s capacity to meet this demand. It thus serves as an indicator of human pressure on local and global ecosystems. In 2008, humanity’s demand exceeded the biosphere’s regeneration rate by more than 50 percent. This overshoot
may result in depletion of ecosystems and overloading of waste sinks. This ecosystem stress may negatively affect biodiversity. However, the Footprint does not measure this latter impact directly, nor does it specify how much overshoot must be reduced if negative impacts are to be avoided.
Does the Ecological Footprint say what is a “fair” or “equitable” use of resources?The Footprint documents what has happened in the past. It can quantitatively describe the ecological resources used by an individual or a population, but it does not prescribe what they should be using. Resource allocation is a policy issue, based on societal beliefs about what is or is not equitable. While Footprint accounting can determine the average biocapacity that is available per person, it does not stipulate how this biocapacity should be allocated among individuals or countries. However, it does provide a context for such discussions.
How relevant is the Ecological Footprint if the supply of renewable resources can be increased and advances in technology can slow the depletion of non-renewable resources?The Ecological Footprint measures the current state of resource use and waste generation. It asks: In a given year, did human demands on ecosystems exceed the ability of ecosystems to meet these demands? Footprint analysis refl ects both increases in the productivity of renewable
resources and technological innovation (for example, if the paper industry doubles the overall effi ciency of paper production, the footprint per tonne of paper will halve). Ecological Footprint Accounts capture these changes once they occur and can determine the extent to which these innovations have succeeded in bringing human demand within the capacity of the planet’s ecosystems. If there is a suffi cient increase in ecological supply and a reduction in human demand due to technological advances or other factors, National Footprint Accounts will show this as the elimination of global overshoot.
For additional information about
current Ecological Footprint
methodology, data sources,
assumptions and results, please
refer to Borucke et al., 2013:
“Accounting for demand and
supply of the Biosphere’s
regenerative capacity: the National
Footprint Accounts’ underlying
methodology and framework”.
Ecological Indicators, 24, 518-533.

GLOSSARY OF ECOLOGICAL FOOTPRINT TERMS
ASSETSDurable capital that is either owned or able to be used in production, whether natural, manufactured, or human. Assets are not directly consumed, but yield prod-ucts and/or services that people do con-sume. Ecological assets are defi ned as the biologically productive land and sea areas that generate the renewable resources and ecological services that humans demand.
BIOCAPACIT YThe ability of ecological assets to produce useful biological materials and ecological services such as absorbing CO2 emissions generated by humans, using current man-agement schemes and extraction technolo-gies. Biocapacity is measured in global hectares. Useful biological materials are defi ned as those materials that the human economy actually demanded in a given year. Biocapacity includes only biologi-cally productive land: cropland, forest, fi sh-ing grounds, grazing land, built-up land; deserts, glaciers, and the open ocean are excluded.
CARBON FOOTPRINTWhen used in Ecological Footprint studies, it indicates the demand on biocapacity required to sequester (through photosyn-thesis) the carbon dioxide (CO2) emissions from fossil fuel combustion. Although fossil fuels are extracted from Earth’s crust and are not regenerated in human time scales, their use demands ecological services if the resultant CO2 is not to accumulate in the atmosphere. The Ecological Footprint therefore includes a carbon Footprint com-ponent, which represents the biocapacity (typically that of unharvested forests) need-ed to absorb that fraction of fossil CO2 that is not absorbed by the ocean. The carbon Footprint component of the Ecological
Footprint should not be confused with the “Carbon Footprint” indicator used in the climate change debate. This latter indicates the tonnes of carbon (or tonnes of carbon per euro) that are directly and indirectly caused by an activity or are accumulated over the life stages of a product, rather than demand on bioproductive area (see Galli et al., 2012 for details).
COMPETITIVENESSThe ability of a country to maintain and secure its prosperity.
CONSUMPTIONUse of goods or services. The term con-sumption has two different meanings, depending on context. As commonly used in Footprint analyses, it refers to the use of goods or services. A consumed good or service embodies all the resources, includ-ing energy, necessary to provide it to the consumer (aka embedded Footprint). In full life-cycle accounting, everything used along the production chain is taken into ac-count, including any losses along the way. For example, consumed food includes not only the plant or animal matter people eat or waste in the household, but also that lost during processing or harvest, as well as all the energy used to grow, harvest, process and transport the food. As used in Input Output analysis, consump-tion has a strict technical meaning. Two types of consumption are distinguished: intermediate and fi nal. According to (economic) System of National Accounts terminology, intermediate consumption refers to the use of goods and services by a business in providing goods and services to other businesses. Final consumption refers to non-productive use of goods and services by households, the government, the capital sector, and foreign entities.
CONSUMPTION COMPONENTS (also consumption categories)Ecological Footprint analyses can allocate total Footprint among consumption com-ponents, typically Food, Shelter, Mobility, Goods, and Services—often with further resolution into sub-components. Consistent categorization across studies allows for comparison of the Footprint of individual consumption components across regions, and the relative contribution of each cat-egory to the region’s overall Footprint.
COUNTRY INCOME CATEGORIESCountries are assigned to high-, middle- or low-income categories based on World Bank income thresholds; for this report, the 2008 Gross National Income (GNI) per person was used as threshold. This is calculated by dividing the gross national income of each country (converted to US dollars using the World Bank Atlas method), by the mid-year population (for more information see The World Bank, 2012). The categories are: Low income: ≤US$1,026 GNI per person; Middle in-come: US$1,026 -12,475 GNI per person (combines World Bank categories of lower middle and upper middle income); High income: ≥US$12,475 GNI per person.
CURRENT ACCOUNT BAL ANCEIt indicates the difference between a coun-try’s savings and its investment. When the balance is positive (Current account sur-plus), it measures the portion of a country’s saving invested abroad; conversely, when the balance is negative (Current account defi cit), it measures the portion of domestic investment fi nanced by foreigners’ savings.
ECOLOGICAL DEFICIT (or biocapacity defi cit)he difference between the biocapacity and the Ecological Footprint of consumption of a region or country. An ecological defi cit occurs when the Ecological Footprint of a population exceeds the biocapacity pro-duced by the ecological assets available in the country where that population lives. If there is a regional or national ecological defi cit, it means that the region is importing biocapacity through trade or liquidating regional ecological assets. In contrast, eco-logical overshoot cannot be compensated through trade.
ECOLOGICAL RESERVE (or Biocapacity reserve): Again determined by the comparison between the biocapacity and the Ecologi-cal Footprint of consumption of a region or country, an ecological reserve exists when the biocapacity of a region exceeds its population’s Ecological Footprint of consumption. Ecological reserve is thus the converse of ecological defi cit. Although a country in ecological reserve may still im-port natural resources, over-use individual components of domestic resources, and emit carbon dioxide to the global com-mons, an ecological reserve indicates that a country may be capable of maintaining its current lifestyle utilizing only domesti-cally available ecological assets.
ECOLOGICAL FOOTPRINTA measure of the biologically productive land and sea area—the ecological as-sets—that a population requires to produce the renewable resources and ecological services it uses.

ECOLOGICAL FOOTPRINT OF CONSUMPTIONThe Ecological Footprint of consumption is the most commonly reported type of Ecological Footprint. It is the area used to support a defi ned population’s consump-tion. The Ecological Footprint of consump-tion (in global hectares) includes the area needed to produce the materials con-sumed and the area needed to absorb the waste. The consumption Footprint of a na-tion is calculated in the National Footprint Accounts as a nation’s primary production Footprint plus the Footprint of imports minus the Footprint of exports, and is thus, strictly speaking, a Footprint of apparent consumption. The national average or per capita Ecological Footprint of consumption is equal to a country’s Ecological Footprint of consumption divided by its population.
ECOLOGICAL FOOTPRINT OF PRODUCTION In contrast to the Ecological Footprint of consumption, a nation’s Ecological Footprint of production is the sum of the Footprints for all of the resources harvested and all of the waste generated within the defi ned geographical region. It repre-sents the amount of ecological demand associated with generating the country’s national income. The Footprint of produc-tion includes all the area within a country necessary for supporting the actual harvest of primary products (cropland, pasture land, forestland and fi shing grounds), the country’s built-up area (roads, factories, cities), and the area needed to absorb all fossil fuel carbon emissions generated by production activities within the country’s geographical boundaries. For example, if a country grows cotton for export, the ecological resources and services required to produce such cotton are included in that
country’s Ecological Footprint of produc-tion but are not included in its Ecological Footprint of consumption; rather, they are included in the Ecological Footprint of con-sumption of the country that imports the t-shirts.
ECOLOGICAL OVERSHOOTGlobal ecological overshoot occurs when humanity’s demand on the natural world exceeds the biosphere’s supply, or regen-erative capacity. Such overshoot leads to a depletion of Earth’s life-supporting natural capital and a build-up of waste. At the global level, ecological defi cit and over-shoot are the same, since there is no net-import of resources to the planet. Local overshoot oc-curs when a local ecosystem is exploited more rapidly than it can renew itself.
EMBEDDED FOOTPRINTThe Ecological Footprint embedded in a product represents the amount of eco-logical assets demanded to produce that product. In the trade Footprint analysis, the Footprint embedded in a traded products represent the amount of global hectares needed to produce such product and/or sequester the CO2 released during its processing in the country of production.
GLOBAL HECTARES (GHA)A global hectare is defi ned as a hectare with world-average productivity for all biologically productive land and water in a given year. Biologically productive land includes areas such as cropland, forest, and fi shing grounds, and excludes deserts, glaciers, and the open ocean. Global hectares are the common, standardized unit used for reporting Ecological Footprint and biocapacity across time and for areas
throughout the world. The use of global hectares recognizes that different types of land have a different ability to produce useful goods and services for humans. One hectare of cropland can produce a greater quantity of useful and valuable food prod-ucts than a single hectare of grazing land, for example. By converting both cropland and pasture into global hectares, they can be compared on an equal basis. Addition-al information on the global hectares and the way they are calculated is provided in Borucke et al., (2013).
HUMAN DEVELOPMENT INDEX (HDI)HDI is a summary composite index that measures a country’s average achieve-ments in three basic aspects of human de-velopment: Health—Life expectancy at birth (number of years a newborn infant would live if prevailing patterns of mortality at the time of birth were to stay the same through-out the child’s life); Knowledge—The adult literacy rate and the combined primary, secondary and tertiary gross enrolment ratio; and Standard of living—GDP per capita (PPP US$).
INPUT-OUTPUT ANALYSISInput-Output (IO) analysis is a math-ematical tool widely used in economics to analyze the fl ows of goods and services between sectors in an economy, using data from IO tables. IO analysis assumes that everything produced by one industry is consumed either by other industries or by fi nal consumers, and that these consump-tion fl ows can be tracked. If the relevant data are available, IO analyses can be used to track both physical and fi nancial fl ows. Combined economic-environment models use IO analysis to trace the direct and indirect environmental impacts of in-
dustrial activities along production chains, or to assign these impacts to fi nal demand categories. In Ecological Footprint studies, IO analysis is used to apportion Ecologi-cal Footprints among production activities, or among categories of fi nal demand (or consumption categories).
NATIONAL FOOTPRINT ACCOUNTSThe central data set that calculates the Ecological Footprints and biocapacities of the world, and roughly 150 nations and territories from 1961 to the present (gen-erally with a three-year lag due to data availability). The ongoing development, maintenance and upgrades of the Na-tional Footprint Accounts are coordinated by Global Footprint Network and its 70+ partners.
NET ECOLOGICAL FOOTPRINT OF TRADEEmbedded in trade among countries is a use of ecological resources and services needed to produce traded commodi-ties (their embedded Footprint); the net Ecological Footprint of trade is defi ned as the Ecological Footprint of imports minus the Ecological Footprint of exports. When the Footprint embodied in exports is higher than that of imports, then a country is a net Footprint exporter; conversely, a country in which Footprint of imports is higher than that of exports is a net Footprint importer.

40
REFERENCES
Abdullatif, L., Alam, T., 2011. The UAE Ecological Footprint Initiative: Summary report 2007-2010. Available at: http://awsassets.panda.org/downloads/en_fi nal_report_ecological_footprint.pdf
Barnard, L., Cooney, H., Edwards, C., Etherington, K., Imwold, D., Jackson, H., Lord, M., Nally, J., Savage, A., Taylor, M. 2010. All of History. Elanora Heights, Australia: Millenium House.
Barnosky, A.D., Hadly, E.A., Bascompte, J., Berlow, E.L., et al., 2012. Approaching a state shift in Earth’s biosphere. Nature, 486, 52-58.
Blainey, G. 2005. A Short History of the 20th Century. Chicago: Ivan R. Dee Publisher.
Borucke, M., Moore, D., Cranston, G., Gracey, K., Iha, K., Larson, J., Lazarus, E., Morales, J.C., Wackernagel, M., Galli, A. 2013. Accounting for demand and supply of the Biosphere’s regenerative capacity: the National Footprint Accounts’ underlying methodology and framework. Ecological Indicators, 24, 518-533. Also available at: http://www.footprintnetwork.org/images/uploads/Methods_Paper_2011.pdf
Butchart, S.H.M., Walpole, M., Collen, B., van Strien, A., et al., 2010. Global biodiversity: indicators of recent declines. Science, 328, 1164–1168.
Costanza, R. 1997. The value of the world’s ecosystem services and natural capital. Nature, 387, 253-260.
Daniels, P., Hyslop, S. 2006. Almanac of World History. Washington, D.C.: National Geographic Society.
DeFries, R.S., Foley, J.A., Asner, G.P., 2004. Land-use choices: balancing human needs and ecosystem function. Front. Ecol. Environ., 2 (5), 249–257.
Diamond, J. 2006. Collapse: How Societies Choose to Succeed or Fail. London: Penguin Books.
DG Environment, 2008. Potential of the Ecological Footprint for monitoring environmental impact from natural resource use. Available on-line: http://ec.europa.eu/ environment/natres/studies.htm
Dobbs, R., Oppenheim, J., Thompson, F., Brinkman, M., Zornes, M. 2011. Resource Revolution: Meeting the World’s energy, material, food and water needs. McKinsey & Company.
Eurostat 2006. http://epp.eurostat.ec.europa.eu/cache/ITY_OFFPUB/KS-AU-06-001/EN/KS-AU-06-001-EN.PDF
Ewing B., S. Goldfi nger, A. Oursler, A. Reed, D. Moore, M. Wackernagel. 2010. The Ecological Footprint Atlas 2010. Oakland: Global Footprint Network.
Galli, A., Kitzes, J., Wermer, P., Wackernagel, M., Niccolucci, V., Tiezzi, E., 2007. An Exploration of the Mathematics behind the Ecological Footprint. International Journal of Ecodynamics, 2(4), 250-257.
Galli, A., Wiedmann, T., Ercin, E., Knoblauch, D., Ewing, B., Giljum, S. 2012. Integrating Ecological, Carbon and Water footprint into a “Footprint Family” of indicators: Defi nition and role in tracking human pressure on the planet. Ecological Indicators, 16, 100-112.
Global Footprint Network, 2011. National Footprint Accounts 2011 Edition. Available at: www. footprintnetwork.org.
Global Footprint Network, 2011. Resource Constraints and Economic Performance in Eastern Europe and Central Asia. Report to UNDP Bratislava, Global Footprint Network, Oakland, and UNDP, Bratislava. Available at: http://www.undp.org/
Global Footprint Network, 2012. Why Are Recourse Limits Now Undermining Economic Performance? Available at: www.footprintnetwork.org/med
Heinberg, R. 2007. Peak Everything: Waking Up to the Century of Decline in Earth’s Resources. Forest Row: Clairview Books Ltd.
Hoekstra, A.Y., 2009. Human appropriation of natural capital: a comparison of ecological footprint and water footprint analysis. Ecological Economics, 68, 1963–1974.
Huchet-Bourdon, M., 2011. Agricultural Commodity Price Volatility: An Overview. OECD Food, Agriculture
and Fisheries Working Papers, No. 52, OECD Publishing. http://dx.doi.org/10.1787/5kg0t00nrthc-en
Khatiwala, S. et al., 2009. Reconstruction of the history of anthropogenic CO2 concentrations in the ocean. Nature, 462, 346-350.
Kitzes, J., A. Galli, S.M. Rizk, A. Reed and M. Wackernagel. 2008. Guidebook to the National Footprint Accounts: 2008 Edition. Oakland: Global Footprint Network.
Kitzes, J., Galli, A, Bagliani, M., Barrett, J., et al., 2009. A Research Agenda for Improving National Ecological Footprint Accounts. Ecological Economics, 68 (7), 1991– 2007.
Krausmann, F., Gingrich, S., Eisenmenger, N., Erb, K.H., Haberl, H., Fischer-Kowalski, M., 2009. Growth in global materials use, GDP and population during the 20th century. Ecological Economics, 68(10), 2696–2705.
Monfreda, C., Wackernagel, M., Deumling, D., 2004. Establishing national natural capital accounts based on detailed Ecological Footprint and biological capacity assessments. Land Use Policy, 21(3), 231-246.
Moore, D., Galli, A., Cranston, G.R., Reed, A. 2012. Projecting future human demand on the Earth’s regenerative capacity. Ecological Indicators, 16, 3-10.

41
MEDITERRANEAN ECOLOGICAL FOOTPRINT TRENDS
Robinson, J., Bradley, M., Busby, P., Connor, D., et al., 2006. Climate Change and Sustainable Development: Realizing the Opportunity. Ambio, 35(1), 2-8.
Rockström, R., Steffen, W., Noone, K., Persson, A., et al., 2009. A safe operating space for humanity. Nature, 461, 472-475.
Sen, A. 2001. Development as freedom. Oxford University Press, Oxford.
Turner, G.H., 2008. A comparison of The Limits to Growth with 30 years of reality. Global Environmental Change, 18, 397-411.
UNDP (United Nations Development Programme), 2011. Human Development Report 2011. Sustainability and Equity: A Better Future for All. Published for the United Nations Development Programme (UNDP).
UNEP (United Nations Environment Programme), 2007. GEO4 Global Environment Outlook: environment for development. Progress Press Ltd, Malta.
UNEP Mediterranean Strategy for Sustainable development: a framework for environmental sustainability and shared prosperity. Mediterranean Action Plan (MAP), Mediterranean Commission on Sustainable Development (MCSD), 2006
UNEP/MAP-Plan Bleu State of the Environment and Development in the
Mediterranean, UNEP/MAP, Athens, October 2009.
UNEP/MAP-Plan Bleu , Benoit Guillaume (dir.), Comeau Aline (dir.) (2005). A sustainable future for the Mediterranean: the Blue Plan’s environment and development outlook. Earthscan
Wackernagel, M., B. Schulz, D. Deumling, A. Callejas Linares, M. Jenkins, V. Kapos, C. Monfreda, J. Loh, N. Myers, R. Norgaard and J. Randers. 2002. Tracking the ecological overshoot of the human economy. Proc. Natl. Acad. Sci., 99(14), 9266-9271.
Wackernagel, M., L. Onisto, P. Bello, Al. C. Linares, I. S. L. Falfán, J. M. García, A. I. S. Guerrero, Ma. G. S. Guerrero. 1999a. National natural capital accounting with the ecological footprint concept. Ecological Economics, 29, 375-390.
Wackernagel, M., Lewan, L., Hansson, C.B., 1999b. Evaluating the use of natural capital with the ecological footprint. Ambio, 28, 604–612.
World Bank, 2011. World Development Indicators & Global Development Finance (World
Bank, Washington, DC, December 2011. Available at: http://databank.worldbank.org.
World Bank, 2012. Commodity Price Data (a.k.a. Pink Sheet). Available
at http://data.worldbank.org/data-catalog/commodity-price-data [Accessed May 2012].

42
Population
[-]
Total Ecological
Footprint
[million gha]
Per capita Ecological
Footprint
[gha per capita]
Cropland Footprint
[gha per capita]
Grazing land Footprint
[gha per capita]
Forest Footprint
[gha per capita]
Fishing ground
Footprint
[gha per capita]
Carbon Footprint
[gha per capita]
Built up Footprint
[gha per capita]
ECOLOGICAL FOOTPRINT COMPONENTS
Albania
Algeria
Bosnia and Herzegovina
Croatia
Cyprus
Egypt
France
Greece
Israel
Italy
Jordan
Lebanon
Libya
Macedonia TFYR
Malta
Montenegro
Morocco
Occupied Palestinian Territories
Portugal
Slovenia
Spain
Syria
Tunisia
Turkey
COUNTRY
3,181,000
34,428,000
3,774,000
4,418,000
1,077,000
78,323,000
62,098,000
11,292,000
7,092,000
59,891,000
5,849,000
4,167,000
6,150,000
2,053,000
414,000
629,000
31,321,000
3,827,000
10,635,000
2,018,000
45,146,000
19,694,000
10,247,000
70,924,000
5.76
56.74
10.34
18.53
4.78
132.80
304.96
55.57
28.07
271.00
12.46
11.87
19.60
11.01
1.81
0.77
41.45
1.77
43.78
10.52
214.00
28.64
18.08
181.20
1.81
1.65
2.74
4.19
4.44
1.70
4.91
4.92
3.96
4.52
2.13
2.85
3.19
5.36
4.38
1.22
1.32
0.46
4.12
5.21
4.74
1.45
1.76
2.55
0.71
0.51
0.78
1.02
1.19
0.66
1.25
1.26
0.86
1.03
0.66
0.66
0.65
0.79
0.77
0.31
0.60
0.33
0.96
0.94
1.26
0.48
0.65
0.92
0.21
0.35
0.22
0.13
0.23
0.07
0.39
0.53
0.36
0.40
0.41
0.48
0.54
0.21
0.76
0.32
0.21
0.05
-
0.25
0.31
0.16
0.12
0.08
0.09
0.13
0.48
0.66
0.41
0.16
0.60
0.38
0.33
0.46
0.18
0.28
0.12
0.33
0.31
0.48
0.06
-
0.14
0.61
0.35
0.05
0.21
0.28
0.02
0.02
0.04
0.07
0.07
0.03
0.18
0.13
0.01
0.14
0.05
0.05
0.04
0.07
-
0.11
0.05
0.00
0.95
0.04
0.38
0.01
0.10
0.03
0.71
0.62
1.16
1.89
2.54
0.59
2.24
2.53
2.33
2.39
0.74
1.33
1.82
3.87
2.55
-
0.37
0.09
2.01
3.22
2.39
0.71
0.66
1.17
0.06
0.02
0.05
0.43
0.00
0.18
0.25
0.11
0.06
0.10
0.09
0.05
0.02
0.09
-
-
0.03
-
0.05
0.15
0.06
0.04
0.03
0.07
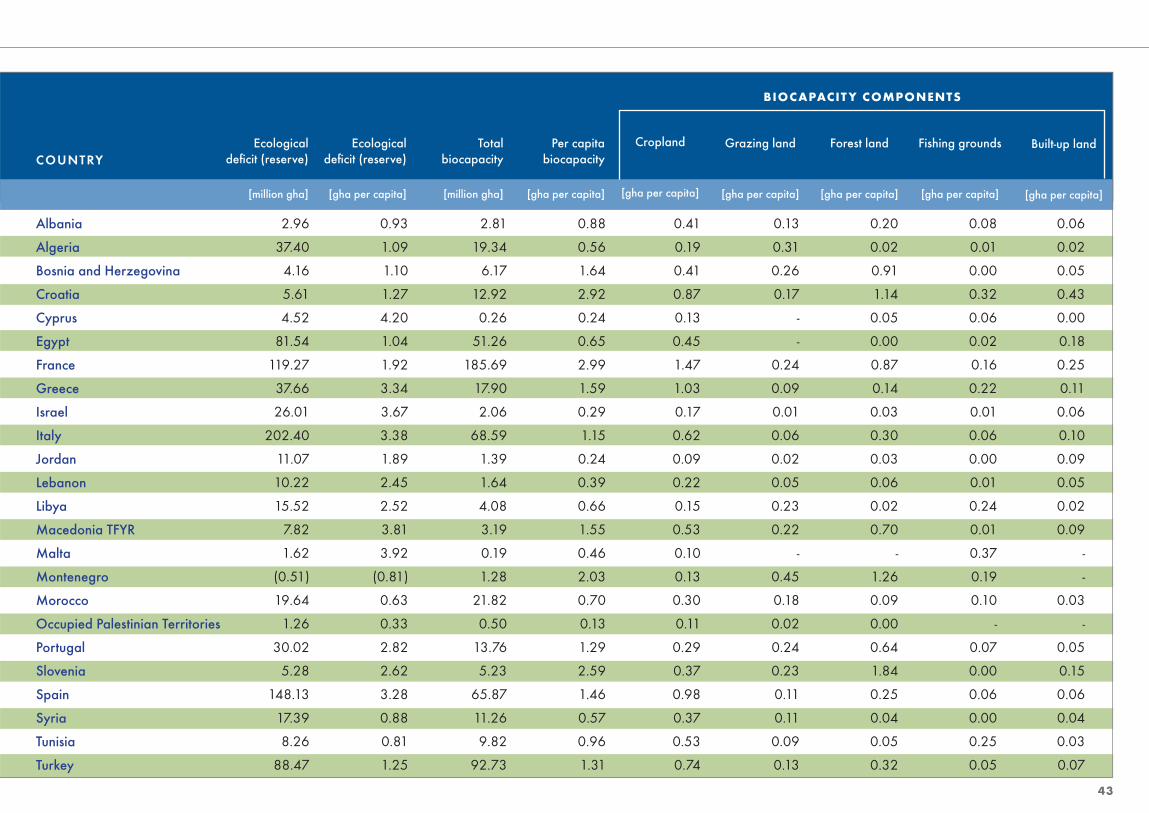
43
Ecological defi cit (reserve)
[million gha]
Ecological defi cit (reserve)
[gha per capita]
Total biocapacity
[million gha]
Per capita biocapacity
[gha per capita]
BIOCAPACIT Y COMPONENTS
Cropland
[gha per capita]
Grazing land
[gha per capita]
Forest land
[gha per capita]
Fishing grounds
[gha per capita]
Built-up land
[gha per capita]
Albania
Algeria
Bosnia and Herzegovina
Croatia
Cyprus
Egypt
France
Greece
Israel
Italy
Jordan
Lebanon
Libya
Macedonia TFYR
Malta
Montenegro
Morocco
Occupied Palestinian Territories
Portugal
Slovenia
Spain
Syria
Tunisia
Turkey
2.96
37.40
4.16
5.61
4.52
81.54
119.27
37.66
26.01
202.40
11.07
10.22
15.52
7.82
1.62
(0.51)
19.64
1.26
30.02
5.28
148.13
17.39
8.26
88.47
0.93
1.09
1.10
1.27
4.20
1.04
1.92
3.34
3.67
3.38
1.89
2.45
2.52
3.81
3.92
(0.81)
0.63
0.33
2.82
2.62
3.28
0.88
0.81
1.25
2.81
19.34
6.17
12.92
0.26
51.26
185.69
17.90
2.06
68.59
1.39
1.64
4.08
3.19
0.19
1.28
21.82
0.50
13.76
5.23
65.87
11.26
9.82
92.73
0.88
0.56
1.64
2.92
0.24
0.65
2.99
1.59
0.29
1.15
0.24
0.39
0.66
1.55
0.46
2.03
0.70
0.13
1.29
2.59
1.46
0.57
0.96
1.31
0.41
0.19
0.41
0.87
0.13
0.45
1.47
1.03
0.17
0.62
0.09
0.22
0.15
0.53
0.10
0.13
0.30
0.11
0.29
0.37
0.98
0.37
0.53
0.74
0.13
0.31
0.26
0.17
-
-
0.24
0.09
0.01
0.06
0.02
0.05
0.23
0.22
-
0.45
0.18
0.02
0.24
0.23
0.11
0.11
0.09
0.13
0.20
0.02
0.91
1.14
0.05
0.00
0.87
0.14
0.03
0.30
0.03
0.06
0.02
0.70
-
1.26
0.09
0.00
0.64
1.84
0.25
0.04
0.05
0.32
0.08
0.01
0.00
0.32
0.06
0.02
0.16
0.22
0.01
0.06
0.00
0.01
0.24
0.01
0.37
0.19
0.10
-
0.07
0.00
0.06
0.00
0.25
0.05
0.06
0.02
0.05
0.43
0.00
0.18
0.25
0.11
0.06
0.10
0.09
0.05
0.02
0.09
-
-
0.03
-
0.05
0.15
0.06
0.04
0.03
0.07
COUNTRY

Global Footprint Network is an international science and policy institute working
to advance sustainability through use of the Ecological Footprint, a resource
accounting tool that measures how much nature we have, how much we use,
and who uses what. By making ecological limits central to decision making, we
are working to end overshoot and create a society where all people can live
well, within the means of our one planet. Global Footprint Network has offi ces
in Oakland (California, USA), Brussels (Belgium), Zurich (Switzerland), Geneva
(Switzerland), and Washington, DC (USA).
U.S. OFFICE
312 Clay Street, Suite 300
Oakland, CA 94607-3510 USA
1 (510) 839 8879
EUROPE OFFICE
International Environment House 2
7-9 chemin de Balexert
1219 Chatelaine (Geneva)
SWITZERLAND
T: +41 22 797 41 08
www.footprintnetwork.org