Medicare Risk Adjustment Models: DxCG vs....
22
Page1 Medicare Risk Adjustment Models: DxCG vs. CMS-HCC Jing Chen * , Randall P. Ellis †* , Katherine H. Toro * and Arlene S. Ash ‡* * Verisk Health, Inc., Waltham, MA. † Department of Economics, Boston University, Boston, MA. ‡ Department of Quantitative Health Sciences, University of Massachusetts Medical School, Worcester, MA. Corresponding author: Jing Chen, Ph.D, MBA, Verisk Health, Inc., 201 Jones Road, Waltham, MA 02451. Tel: (781)693-3728. Fax: (781)478-0217. Email: [email protected] Acknowledgement: We would like to thank Ron Russell, Matt Siegel, Deb Bradley, Jo Anne Lutz, Tim Layton and Wenjia Zhu for their comments and Timur Turkdogan and Punam Mahajan for preparing the data for this analysis. Financial Disclosure: Chen is a Research Scientist at Verisk Health, Inc. Ash and Ellis are senior scientists at Verisk Health, Inc., where they consult on developing health-based predictive models; neither has any ownership interest in Verisk Health, Inc. Toro is a Director of Product Management at Verisk Health, Inc. Complete Author Information: Jing Chen, Ph.D, MBA, Verisk Health, Inc., 201 Jones Road, Waltham, MA 02451. Tel: (781) 693-3728. Fax: (781) 478-0217. Email: [email protected] Randall P. Ellis, Ph.D, Department of Economics, Room 442, Boston University, 270 Bay State Road, Boston, MA 02215. Tel: (617) 353-2741. Fax: (617) 353-4449. Email: [email protected] Katherine H. Toro, M.A., Verisk Health, Inc., 6802 Paragon Place, Suite 500, Richmond, VA 23230. Tel: (781) 693-2986. Fax: (804) 254-4166. Email: [email protected] Arlene S. Ash, Ph.D, University of Massachusetts Medical School, Department of Quantitative Health Sciences, ASC 9.2071, 368 Plantation St., Worcester, MA 01604. Tel: (508) 856-8922/8999. Fax: (508) 856-8993. Email: [email protected]
Transcript of Medicare Risk Adjustment Models: DxCG vs....
Page1
Medicare Risk Adjustment Models: DxCG vs. CMS-HCC
Jing Chen*, Randall P. Ellis†*, Katherine H. Toro* and Arlene S. Ash‡*
* Verisk Health, Inc., Waltham, MA. † Department of Economics, Boston University, Boston, MA. ‡ Department of Quantitative Health Sciences, University of Massachusetts Medical School, Worcester, MA.
Corresponding author: Jing Chen, Ph.D, MBA, Verisk Health, Inc., 201 Jones Road,
Waltham, MA 02451. Tel: (781)693-3728. Fax: (781)478-0217. Email:
Acknowledgement: We would like to thank Ron Russell, Matt Siegel, Deb Bradley, Jo Anne Lutz, Tim Layton and Wenjia Zhu for their comments and Timur Turkdogan and Punam Mahajan for preparing the data for this analysis.
Financial Disclosure: Chen is a Research Scientist at Verisk Health, Inc. Ash and Ellis are senior scientists at Verisk Health, Inc., where they consult on developing health-based predictive models; neither has any ownership interest in Verisk Health, Inc. Toro is a Director of Product Management at Verisk Health, Inc.
Complete Author Information:
Jing Chen, Ph.D, MBA, Verisk Health, Inc., 201 Jones Road, Waltham, MA 02451. Tel: (781) 693-3728. Fax: (781) 478-0217. Email: [email protected]
Randall P. Ellis, Ph.D, Department of Economics, Room 442, Boston University, 270 Bay State Road, Boston, MA 02215. Tel: (617) 353-2741. Fax: (617) 353-4449. Email: [email protected]
Katherine H. Toro, M.A., Verisk Health, Inc., 6802 Paragon Place, Suite 500, Richmond, VA 23230. Tel: (781) 693-2986. Fax: (804) 254-4166. Email: [email protected]
Arlene S. Ash, Ph.D, University of Massachusetts Medical School, Department of Quantitative Health Sciences, ASC 9.2071, 368 Plantation St., Worcester, MA 01604. Tel: (508) 856-8922/8999. Fax: (508) 856-8993. Email: [email protected]
Page2
Medicare Risk Adjustment Models: DxCG vs. CMS-HCC
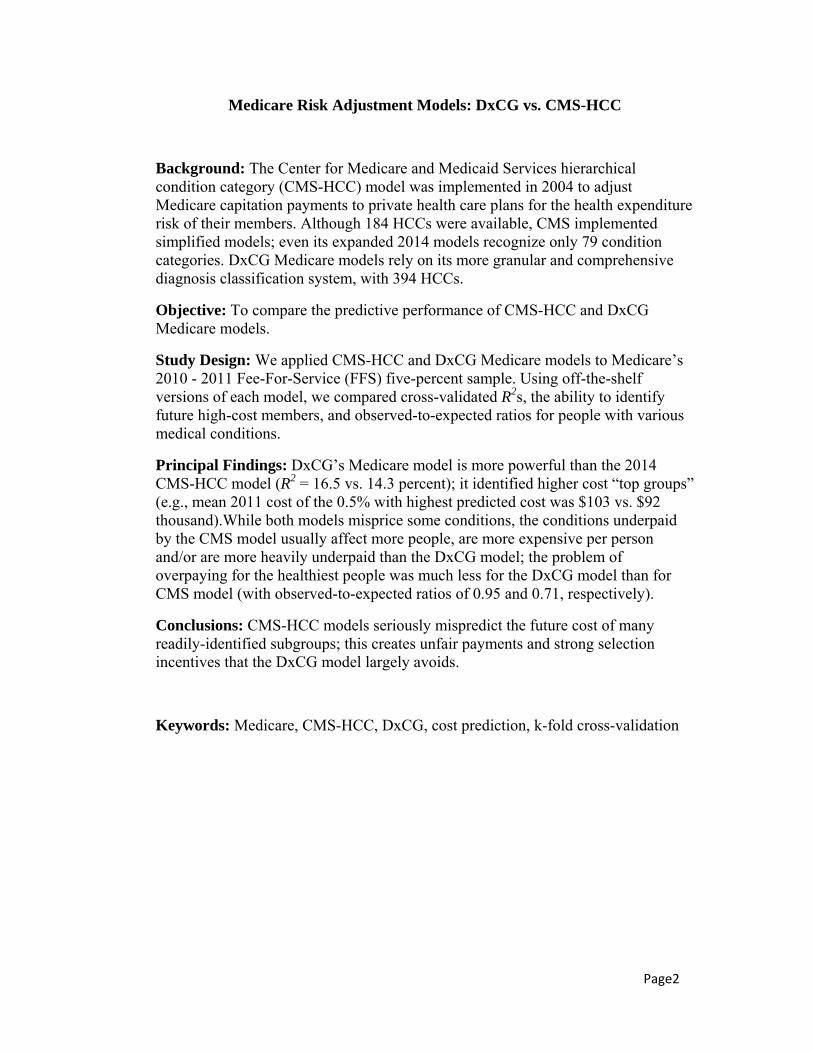
Background: The Center for Medicare and Medicaid Services hierarchical condition category (CMS-HCC) model was implemented in 2004 to adjust Medicare capitation payments to private health care plans for the health expenditure risk of their members. Although 184 HCCs were available, CMS implemented simplified models; even its expanded 2014 models recognize only 79 condition categories. DxCG Medicare models rely on its more granular and comprehensive diagnosis classification system, with 394 HCCs.
Objective: To compare the predictive performance of CMS-HCC and DxCG Medicare models.
Study Design: We applied CMS-HCC and DxCG Medicare models to Medicare’s 2010 - 2011 Fee-For-Service (FFS) five-percent sample. Using off-the-shelf versions of each model, we compared cross-validated R2s, the ability to identify future high-cost members, and observed-to-expected ratios for people with various medical conditions.
Principal Findings: DxCG’s Medicare model is more powerful than the 2014 CMS-HCC model (R2 = 16.5 vs. 14.3 percent); it identified higher cost “top groups” (e.g., mean 2011 cost of the 0.5% with highest predicted cost was $103 vs. $92 thousand).While both models misprice some conditions, the conditions underpaid by the CMS model usually affect more people, are more expensive per person and/or are more heavily underpaid than the DxCG model; the problem of overpaying for the healthiest people was much less for the DxCG model than for CMS model (with observed-to-expected ratios of 0.95 and 0.71, respectively).
Conclusions: CMS-HCC models seriously mispredict the future cost of many readily-identified subgroups; this creates unfair payments and strong selection incentives that the DxCG model largely avoids.
Keywords: Medicare, CMS-HCC, DxCG, cost prediction, k-fold cross-validation
Page3
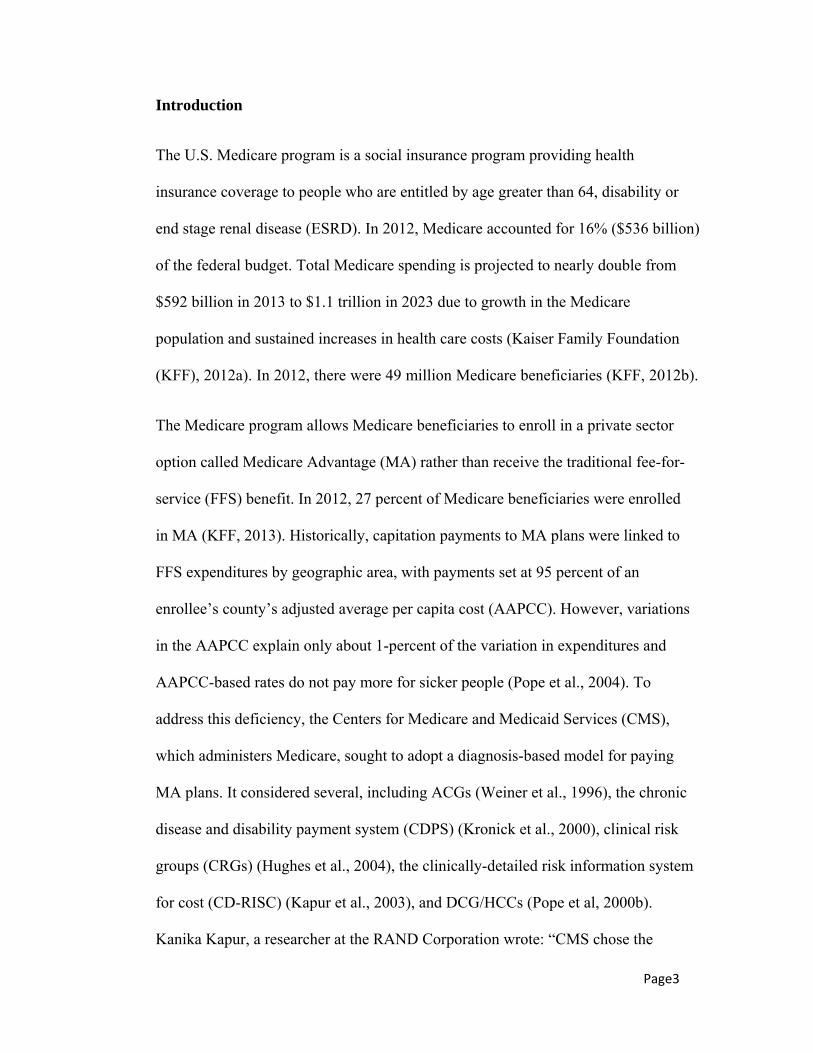
Introduction
The U.S. Medicare program is a social insurance program providing health
insurance coverage to people who are entitled by age greater than 64, disability or
end stage renal disease (ESRD). In 2012, Medicare accounted for 16% ($536 billion)
of the federal budget. Total Medicare spending is projected to nearly double from
$592 billion in 2013 to $1.1 trillion in 2023 due to growth in the Medicare
population and sustained increases in health care costs (Kaiser Family Foundation
(KFF), 2012a). In 2012, there were 49 million Medicare beneficiaries (KFF, 2012b).
The Medicare program allows Medicare beneficiaries to enroll in a private sector
option called Medicare Advantage (MA) rather than receive the traditional fee-for-
service (FFS) benefit. In 2012, 27 percent of Medicare beneficiaries were enrolled
in MA (KFF, 2013). Historically, capitation payments to MA plans were linked to
FFS expenditures by geographic area, with payments set at 95 percent of an
enrollee’s county’s adjusted average per capita cost (AAPCC). However, variations
in the AAPCC explain only about 1-percent of the variation in expenditures and
AAPCC-based rates do not pay more for sicker people (Pope et al., 2004). To
address this deficiency, the Centers for Medicare and Medicaid Services (CMS),
which administers Medicare, sought to adopt a diagnosis-based model for paying
MA plans. It considered several, including ACGs (Weiner et al., 1996), the chronic
disease and disability payment system (CDPS) (Kronick et al., 2000), clinical risk
groups (CRGs) (Hughes et al., 2004), the clinically-detailed risk information system
for cost (CD-RISC) (Kapur et al., 2003), and DCG/HCCs (Pope et al, 2000b).
Kanika Kapur, a researcher at the RAND Corporation wrote: “CMS chose the
Page4
DCG/HCC model for Medicare risk adjustment, largely on the basis of transparency,
ease of modification, and good clinical coherence.” (Kapur, 2005)
In this paper, we compare the performance of CMS-HCC and DxCG Medicare
models by examining predictive accuracy for individuals (R2), the actual costs of
groups predicted to be most expensive, observed-to-expected (O/E) ratios for
subgroups with various medical conditions, and O/E ratios for people with classes
of diagnoses that are not recognized in the CMS-HCC model.
CMS-HCC Medicare Models
The CMS-HCC Medicare risk adjustment models are prospective—they use
demographic information (age, sex, Medicaid dual eligibility, and current and
original reasons for Medicare eligibility) and profiles of major medical conditions
in a “base” year to predict costs that would be covered by Medicare’s Part A and
Part B benefit in the following “target” year. Developing risk adjustment models
requires detail on medical conditions (ICD-9 diagnosis codes) cared for in the base
year and costs to Medicare in the target year. The FFS claims contain such data,
which can also be derived from encounter records (known as “dummy claims”), that
follow the same rules as claims for coding patient diagnoses and the medical
procedures provided (CPT4 codes) for each encounter – from which Medicare
payments can be inferred. However, when CMS was developing its models and
even quite recently, some MA plans have argued against submitting dummy claims;
indeed, until the Affordable Care Act, MA plans were exempted from doing so
(CMS, 2011; Park, 2011). Instead, CMS agreed to build its models on FFS data and
Page5
to make risk-adjusted payments to MAs based on a submitted “short list” of the
medical conditions present for each person in each year. Determining which codes
to include, how to group them, and what interactions to include were critical steps
in developing the DCG/HCC models for CMS (Pope et al., 2011).
The framework for any HCC model is its diagnostic classification system. CMS-
HCC models rely on classifying about 15,000 ICD-9-CM diagnosis codes into 184
Condition Categories, or CCs. Each CC contains groups of diagnoses, such as colon
cancer and rectal cancer, which are clinically related and have similar cost
implications. Hierarchies are then imposed, so that a person is coded for only the
most severe manifestation among related diseases (e.g, a person with cystic fibrosis
would not also be coded for “chronic obstructive lung disease”). After the
hierarchies have been imposed, the CCs become Hierarchical Condition Categories,
or HCCs (Pope et al., 2011).
CMS-HCC models also include some interactions between pairs of disease groups
(e.g., diabetes and congestive heart failure (CHF)) and between diseases and
disability status (e.g., disability and CHF), that make sense to clinicians and
strongly predict additional costs (Pope et al., 2011).
The decision to pay MA plans based on a short list of conditions required that CMS
drastically simplify its models. CMS’s original payment models included only 70
HCCs, and even in 2014, CMS’s model will include only 79 HCCs (87 HCCs for its
ESRD models). The new HCCs are either previously unrecognized conditions
Page6
(among the 184 HCCs available) or splits of previously included HCCs (Shafrin,
2011).
Medicare beneficiaries encompass several distinct subpopulations; thus, improving
fairness and reducing selection incentives requires predicting expenditures
accurately for policy-relevant subgroups. For example, CMS-HCC models
differentiate among those entitled by age, disability and ESRD, between
community-residing and long-term institutional (nursing home) enrollees, and
between continuing and new Medicare enrollees, defined as members enrolled for
less than 12 months in a base year (here, 2010). Additionally, there are important
subgroups for whom a standard risk adjustment model does not fully predict
expenditures (e.g., the frail elderly), and hence an additional risk adjustment factor
is applied (Pope et al., 2011).
DxCG Risk Solutions Medicare Models
Verisk Health Version 7 DxCG Risk Solutions Medicare (henceforth, DxCG)
models extend the original full (184 HCCs) CMS-HCC model, principally by
relying on a more complete and granular classification system; these models
currently include 394 HCCs and 86 disease interactions. Predictions are also
modified within subgroups, e.g., separately for the disabled (age <65) and the
elderly (age≥65). The current models were developed on data for FFS beneficiaries
with both hospital insurance (Part A) and supplementary medical insurance (Part B)
in Medicare’s 2005-2006 5-percent sample.
Page7
The Data
The study data pertains to about 1.5 million enrollees from Medicare’s 2010-2011
FFS 5- percent sample, enrolled exclusively in FFS, present for at least one month
in each year, and not currently entitled to the ESRD program1. (See Exhibit 1.)
<<Exhibit 1 about here>>
We used 2010 data to predict weighted annualized allowed cost (that is, expected
Medicare allowed cost that would be covered by Part A and Part B benefit) in 2011,
which is also the dependent variable in DxCG Medicare models. Weighting is used
so that members who are eligible for only part of the target year, whether due to
death or disenrollment, only contribute according to the fraction of the year that
they are eligible. Annualization ensures that the weighted average of the dependent
variable exactly matches the true sum of actual spending. The dependent variable
used in CMS-HCC models is the weighted annualized paid amount for capitation
payment purposes. The main reason that DxCG models use allowed amount rather
than paid amount is that the paid amount is affected by cost-sharing (e.g. the
distribution of allowed amount between the payer and the member) while allowed
amount is less subject to variation due to member cost-sharing. Paid amount is
highly correlated with allowed amount, (here, ρ=0.998); thus, predictions evaluated
with either outcome can be expected to perform similarly with the other.
1 Even after removing members with ESRD as their current reason for entitlement in 2010, the study sample still contains 10,428 members with an ESRD diagnosis in 2010.
Page8
Both the CMS and DxCG models generate relative risk scores (RRS) that must be
converted to dollars. In practice, the CMS-HCC model needs to set the dollar
weight (i.e. the payment associated with a risk score of 1.00) before actual costs are
known, which introduces a forecasting error. In this study we eliminate this forecast
error, and level the playing field among models, by choosing multiplicative factors
that make each model’s weighted mean predictions exactly match the weighted
mean actual cost in the 2011 sample.
The CMS-HCC model software automatically generates three RRSs for each person:
one each for new enrollees, continuing enrollees living in the community, and those
living in institutions (generally, nursing homes), letting the user select the
appropriate score for that person. We do not examine the institutional model.
Instead, we evaluate the CMS model in two ways: 1) following CMS’s approach of
using the new enrollee model RRS for members enrolled for less than 12 months in
2010, and using the risk score from the community model for everyone else; or 2)
using the RRS from the community model for every enrollee. Algorithm 1) is how
CMS implements its risk scores. For simplicity, from now on in this paper,
algorithm 1) using the 2013 classification system will be referred to as the “2013
CMS Implemented model”, while the corresponding model using algorithm 2) will
be named “2013 CMS Improved model.” Analogous names are used for the 2014
CMS-HCC models. For the 2014 models, we ignore the fact that actual payments
are calculated as 75% using the 2014 model, 25% using the 2013 model and use the
fully-phased-in 2014 model prediction.
Page9
Two DxCG prospective Medicare models are evaluated. The “DxCG Dx model”
uses only demographic and diagnostic information to predict the Medicare
allowable cost for every enrollee (numbered DxCG Model 121 by the software),
while the “DxCG Dx+Utilization model” uses spending information as well (DxCG
Model 125). This model is not appropriate for payment, where the goal is to pay
more for caring for sicker people, rather than for higher spending (van de Ven and
Ellis, 2000). Still, this last model’s predictions can be computed by anyone with
access to encounter data, and a conscientious plan can use it to reduce costs and
improve its members’ health through proactive medical management. This model
also provides a measure of the information readily available to plans to influence
enrollments and disenrollments that may bias their Medicare enrolments.
Results
Exhibit 2 compares six models: CMS Implemented and Improved models from both
year 2013 and 2014, plus the two DxCG models. The overall R2 from the each
model is shown in the first row, with subsequent rows showing the R2 for subgroups
of the sample: new enrollees and continuing enrollees, based on CMS’s definition
of new enrollees (less than 12 months of eligibility in the base year).
<<Exhibit 2 about here>>
The first row of the exhibit shows that there is negligible improvement in the R2
made in the 2014 CMS Implemented model over the 2013 CMS Implemented
Page10
model. Simple improvements in how new enrollee predictions are calculated (CMS
Implemented model vs. CMS Improved model), discussed further below, would
yield larger improvements (about 0.4 – 0.5 percentage points). In contrast, the
DxCG Dx model has a 2 percentage point advantage in R2 over CMS-HCC
Implemented models, while the R2 for the Dx+Utilitzation model is over 5
percentage points higher than that for either CMS-HCC Implemented model.
The R2 improvement achieved by the DxCG models is mainly due to its use of a
more detailed diagnostic classification (394 HCCs) and not to overfitting, since all
results in Exhibit 2 are generated using regressions with just one degree of freedom;
that is, they use a single number (the RRS) from off-the-shelf software to predict
Medicare cost. To illustrate how insensitive these models are to overfitting, we
compared the performance of linear regression models developed using four distinct
HCC sets: 1) the 70 HCCs in the 2013 CMS-HCC model; 2) the 79 HCCs in the
2014 CMS-HCC model; 3) the 184 HCCs from which CMS developed their risk
adjustment models; and, 4) the 394 HCCs used in DxCG models. We used K-fold
cross-validation to examine the magnitude of overfitting associated with regressing
Medicare cost on each HCC set plus the 18 age/gender band indicators that the
DxCG models employ for this population (Stone, 1974; Ellis et al., 2009).
Specifically, the research data were randomly split into K=10 equal, disjoint parts,
from which we formed 10 distinct but overlapping “development” data sets, each
containing all but one of the K parts (that is, 90% of the data). We then estimated a
model on each of the 10 development data sets and used it to predict costs on the
Page11
excluded (10%) validation sample; finally, we combined all ten validation samples
to calculate an out-of-sample, validated R2 measure.
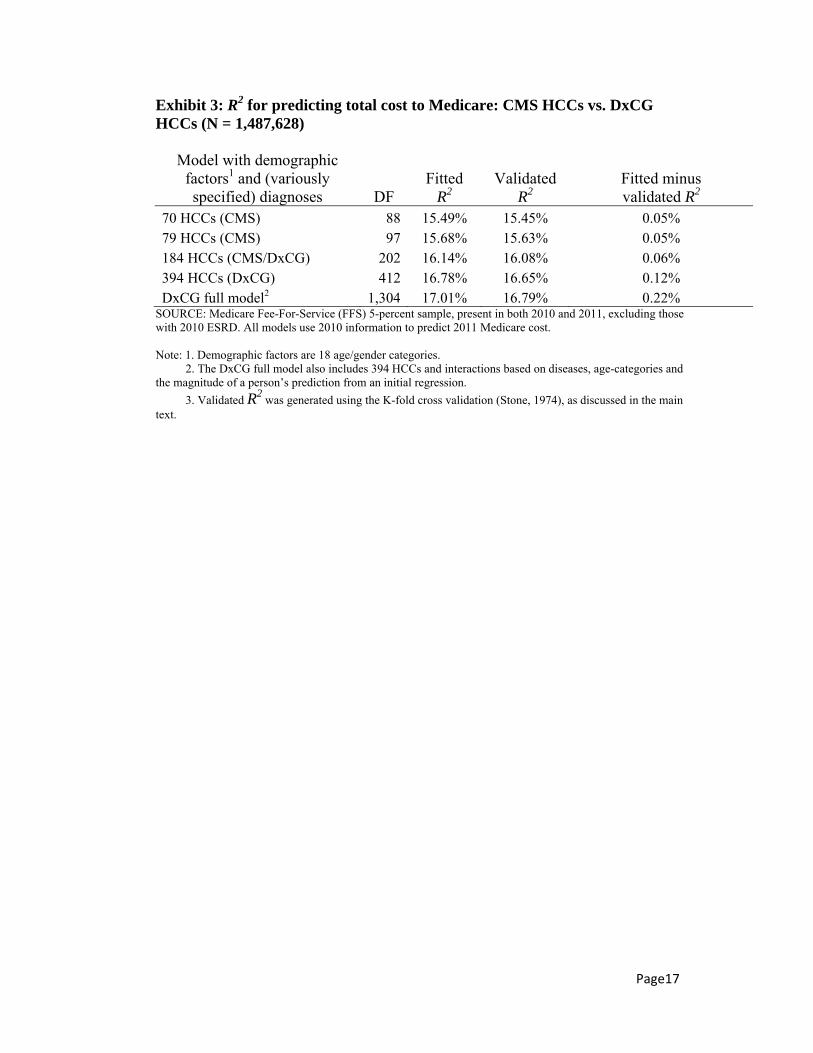
Exhibit 3 shows results from the 10-fold validated regressions. The model built on
the DxCG classification (394 HCCs) had a higher R2 than the models using only
some, or even all, of the 184 HCCs. The column “fitted minus validated R2”
quantifies model overfitting. While overfitting does increase with the number of
parameters, for even the largest model (with 394 HCCs), overfitting contributes
only about 1/10 of 1 percentage point. In Exhibit 3, we also evaluate a DxCG “full”
model, which, in addition to 394 HCCs, includes interactions based on diseases,
age-categories and the magnitude of a person’s prediction from an initial regression
(for a total of 1286 degrees of freedom). Although this model has fully 1,304
degrees of freedom, only 2/10 of 1% of its development sample R2 appears to be
due to overfitting. Furthermore, its validated R2 of 16.8% is only a little larger than
the 16.5% R2 achieved when the DxCG Dx model developed on 5-years-earlier data
is applied to 2010-2011 data (Exhibit 2). This supports the plausibility that the new
DxCG Dx model will be able to achieve an R2 approaching 17% in a completely
new sample.
<<Exhibit 3 about here>>
Medicare uses risk models to ensure that healthcare resources are distributed
rationally and that plans that enroll members with serious conditions that
predictably generate high costs receive adequate funds to care for them. With this in
mind, we examined the ability of models to identify high cost members.
Page12
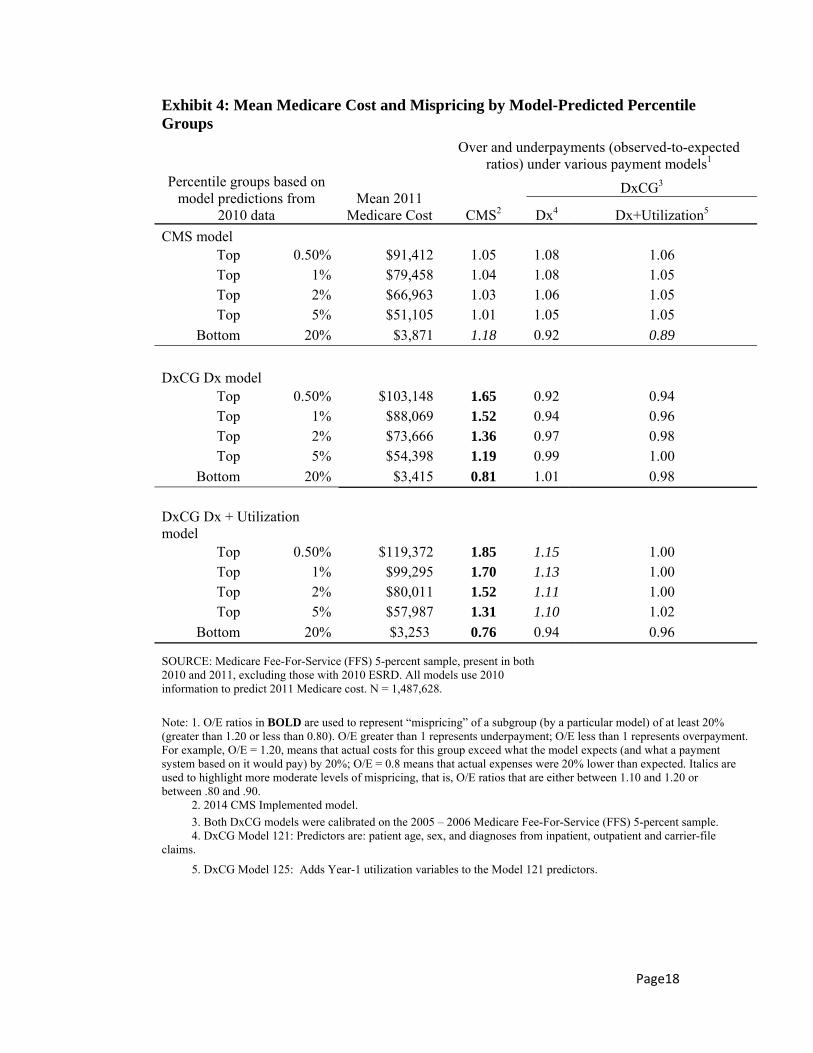
1) Mean Medicare cost (and mispricing) of those predicted to be high or low cost,
using various predictive models. First, we examine model discrimination; at the top
of the prediction range, the most predictive models identify “top group” of people
who will cost the most next year, with the reverse being true for the “bottom groups”
of the prediction range. Exhibit 4 shows the actual year-2 costs of those predicted to
be highest cost using each of 3 models: CMS-HCC and DxCG Dx-only and
Dx+Utilization. Both DxCG models identify “top groups” whose members cost
more than the CMS-HCC-identified top groups (and low cost members in their
“bottom groups”). For example, the groups of members thought to be “most costly”
by the DxCG Dx and the Dx+Utilization models, are respectively, 13%
(103,148/91,412) and 31% (119,372/91,412), more expensive, while their bottom
groups are 12% (3,415/3,871) and 16% (3,253/3,871) less costly, than those
identified using the 2014 CMS-HCC models. Another important measure of model
performance is “calibration” – the extent to the model’s predictions across the range
from low to high, agree with actual costs. An observed-to-expected (O/E) ratio
shows how well a model’s total predictions’ for a subgroup match the group’s
actual costs. Values of O/E greater than 1.0 indicate underpayment (e.g., 1.2 means
that the actual costs are 20% higher than the model predicts) and values of O/E less
than 1, overpayment. The three columns on the right of Exhibit 4 show O/Es for
each of the models for the top- and bottom-predicted subgroups identified by each
model. For example, the O/E ratio of 1.18 in the last row of the top block of
numbers means that the CMS model overpays people that it identifies as being the
20% least costly, by 18%; it even more misprices those identified as most and least
Page13
likely to be costly by either DxCG model, underpaying the top 0.5% by 65% or
more and underpaying the bottom 20% by 20 to 30%. Levels of mispricing are
much lower for the DxCG models. The worst mispricing for the DxCG Dx-only
model occurs when it underpays the Dx+Utilization’s 0.5% top group by 15%.
<<Exhibit 4 about here>>
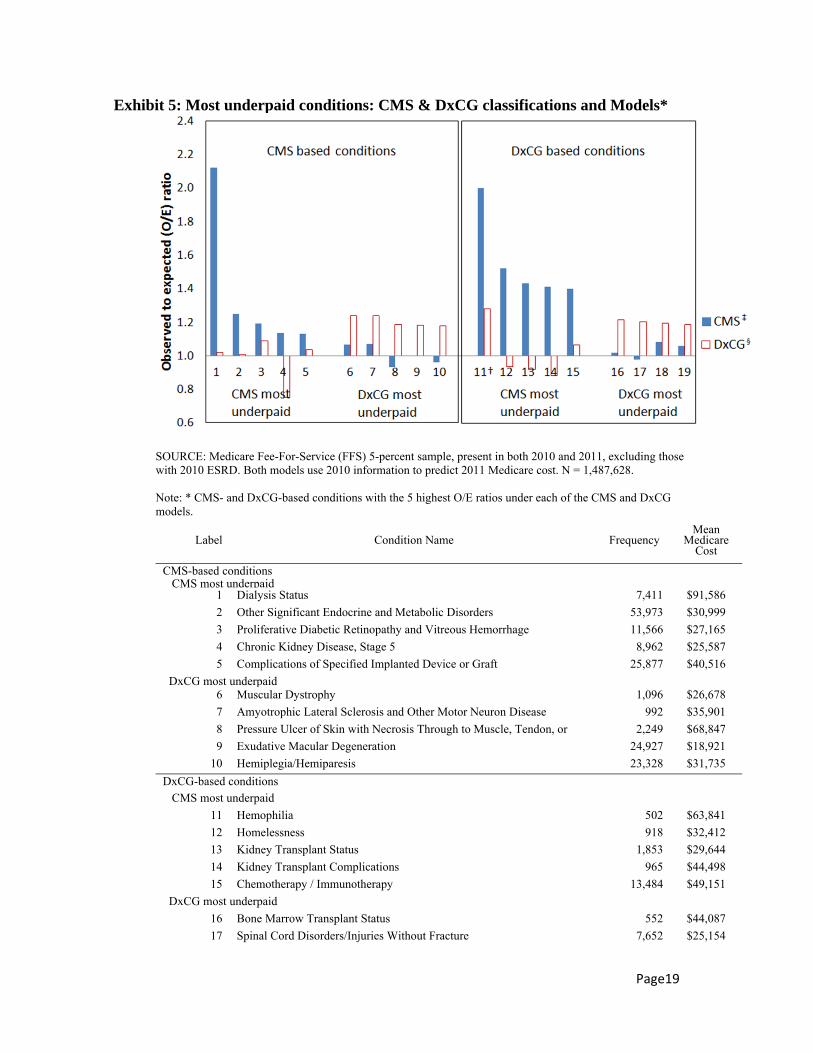
2) We also computed O/E ratios for people with various clinical conditions, as
identified by each of the CMS HCC and DxCG HCC classifications, excluding
HCCs experienced by less than 500 people (out of 1.5 million studied). For each
classification system, we examined the 5 conditions with the highest O/E ratios by
either the 2014 CMS-HCC Implemented model or the DxCG Dx model. Altogether
19 unique conditions were identified (see Exhibit 5). There are 19 rather than 20
conditions because hemophilia was among the conditions with the highest O/E ratio
in both classification systems. Each model performs at least somewhat better than
the other in about half the condition categories. However, on average, the
conditions underpaid by the CMS model affect more people, are more expensive
per person and/or are more heavily underpaid than those that are underpaid by the
DxCG model.
<<Exhibit 5 about here>>
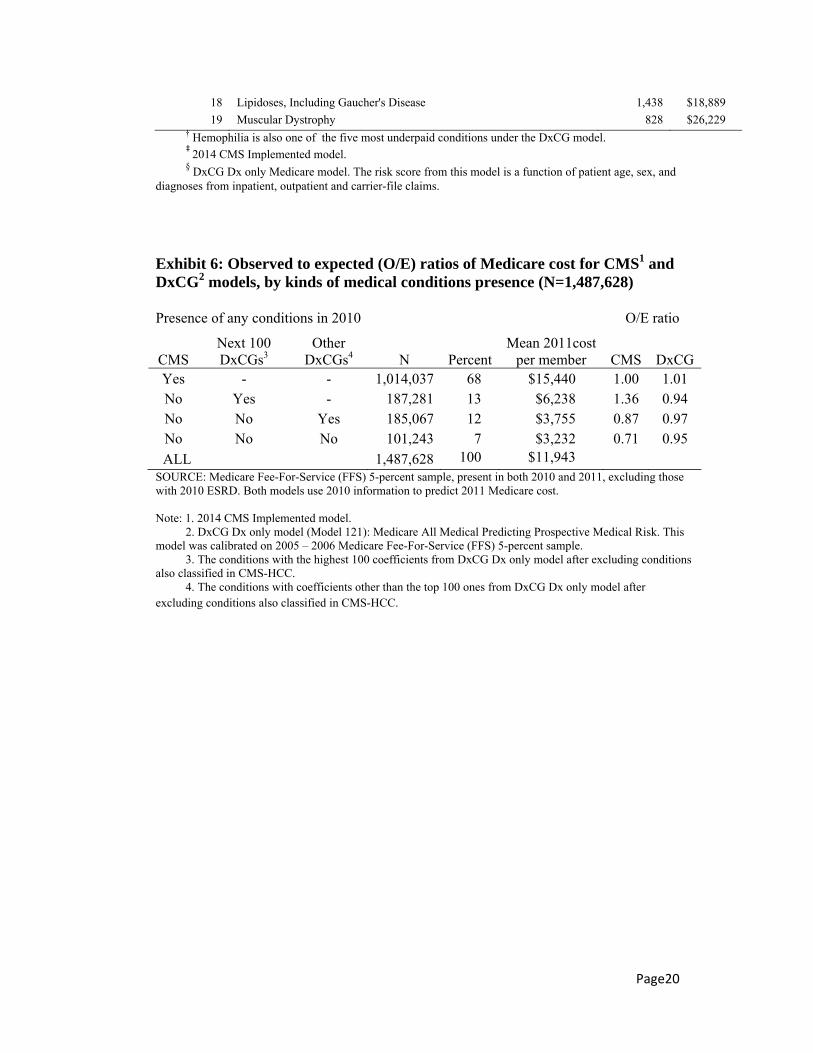
A final useful comparison is to calculate O/E ratios by models separately for
members who have and do not have any diagnoses recognized by the CMS
classification system. As shown in Exhibit 6, both the 2014 CMS-HCC model and
the DxCG Dx model do about equally well on those members who can be classified
Page14
using the CMS system (68 percent of all enrollees), with O/E ratios for either model
being close to 1. For the 7% of members with no HCC in either system, the CMS
model overpays much more than the DxCG model (with O/Es of 0.71 and 0.95,
respectively). We split the remaining 25% of members with at least one DxCG
diagnosis but no CMS diagnosis into two similarly-sized subgroups: one containing
members with at least one of the next 100 most expensive conditions after the
conditions also classified in the CMS system, and another containing members with
none of the top 100 most expensive conditions. For the first subgroup, the CMS
model underpaid by about 36% and the DxCG model overpaid them by about 6%;
for the second subgroup, the CMS model overpaid by about 13%, and the DxCG
model, by about 3%. Overall the O/E ratios for the DxCG model remain much
closer to the desired value of 1.0, including for the 7% of members with no
diagnoses recognized by either system.
<<Exhibit 6 about here>>
Discussion and Conclusions
We examined CMS and DxCG Medicare models in Medicare FFS data and identify
two changes that Medicare could implement to significantly improve the predictive
power (R2) of their models. These are: using whatever diagnoses are present to
calculate Medicare cost for enrollees with less than 12 months of base year data,
and broadening the classification system to use 184, rather than 70 or 79, CMS-
HCCs. The first change is purely administrative and could be implemented instantly,
while the second would take more work, but is feasible now that MA plans are
Page15
required to submit dummy claims. With full claims data available, the DxCG
models that use more comprehensive and more granular condition categories can be
applied. These models do an even better job of identifying people whose future
costs will be particularly high and they meaningfully improve predictive power
beyond what will be achieved with CMS’ 2014 models. Indeed, the CMS-HCC
models seriously under-predict costs for people with a range of common conditions,
and lead to overpayments of nearly 30% for people with no recorded medical
problems. Such prediction errors, which could be substantially dampened by using
the DxCG models create unfair payments and undesirable selection incentives.
Finally, we note that MA plans have access to their own dummy claims, enabling
them to calculate not only the CMS payment for each enrollee, but also the much
more accurate predictions of models such as the DxCG Dx+Utilization model.
Unless CMS also has such data it will not even be able to detect plans that actively
exploit weaknesses in its payment system.
Page16
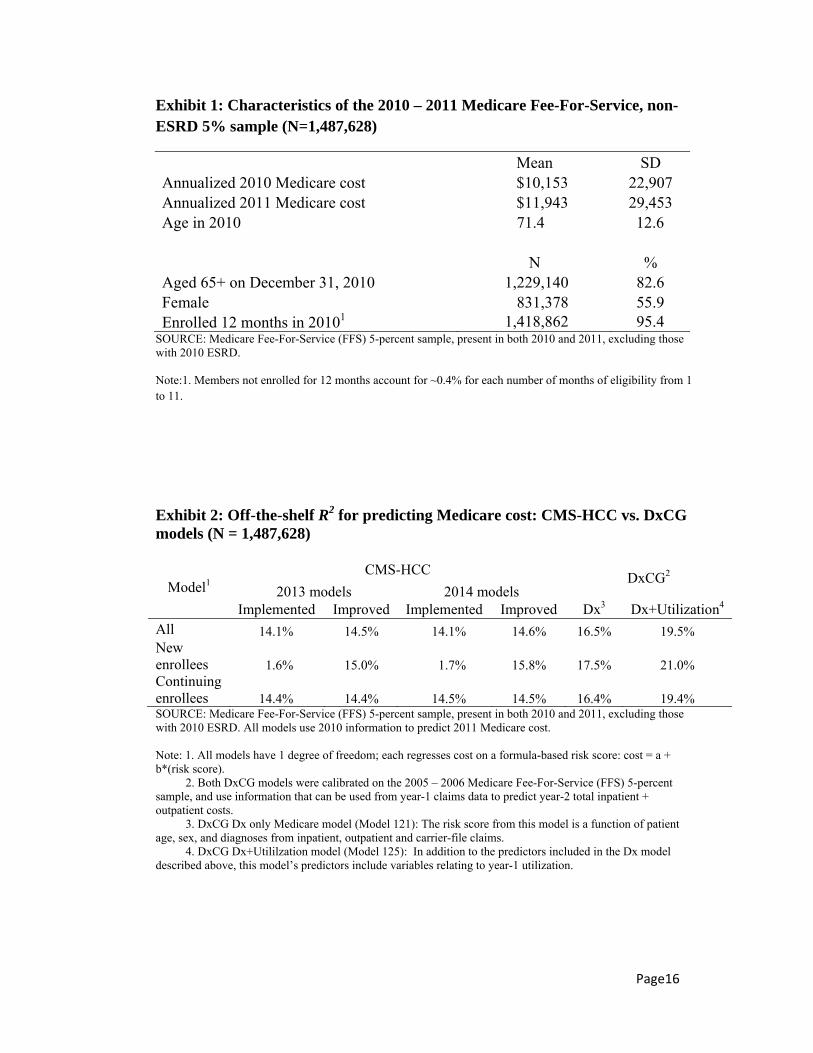
Exhibit 1: Characteristics of the 2010 – 2011 Medicare Fee-For-Service, non-ESRD 5% sample (N=1,487,628)
Mean SD Annualized 2010 Medicare cost $10,153 22,907 Annualized 2011 Medicare cost $11,943 29,453 Age in 2010 71.4 12.6
N % Aged 65+ on December 31, 2010 1,229,140 82.6 Female 831,378 55.9 Enrolled 12 months in 20101 1,418,862 95.4
SOURCE: Medicare Fee-For-Service (FFS) 5-percent sample, present in both 2010 and 2011, excluding those with 2010 ESRD. Note:1. Members not enrolled for 12 months account for ~0.4% for each number of months of eligibility from 1 to 11.
Exhibit 2: Off-the-shelf R2 for predicting Medicare cost: CMS-HCC vs. DxCG models (N = 1,487,628)
Model1 CMS-HCC
DxCG2
2013 models 2014 models Implemented Improved Implemented Improved Dx3 Dx+Utilization4
All 14.1% 14.5% 14.1% 14.6% 16.5% 19.5% New enrollees 1.6% 15.0% 1.7% 15.8% 17.5% 21.0% Continuing enrollees 14.4% 14.4% 14.5% 14.5% 16.4% 19.4% SOURCE: Medicare Fee-For-Service (FFS) 5-percent sample, present in both 2010 and 2011, excluding those with 2010 ESRD. All models use 2010 information to predict 2011 Medicare cost. Note: 1. All models have 1 degree of freedom; each regresses cost on a formula-based risk score: cost = a + b*(risk score). 2. Both DxCG models were calibrated on the 2005 – 2006 Medicare Fee-For-Service (FFS) 5-percent sample, and use information that can be used from year-1 claims data to predict year-2 total inpatient + outpatient costs. 3. DxCG Dx only Medicare model (Model 121): The risk score from this model is a function of patient age, sex, and diagnoses from inpatient, outpatient and carrier-file claims. 4. DxCG Dx+Utililzation model (Model 125): In addition to the predictors included in the Dx model described above, this model’s predictors include variables relating to year-1 utilization.
Page17
Exhibit 3: R2 for predicting total cost to Medicare: CMS HCCs vs. DxCG HCCs (N = 1,487,628)
Model with demographic factors1 and (variously specified) diagnoses DF
Fitted R2
Validated R2
Fitted minus validated R2
70 HCCs (CMS) 88 15.49% 15.45% 0.05% 79 HCCs (CMS) 97 15.68% 15.63% 0.05% 184 HCCs (CMS/DxCG) 202 16.14% 16.08% 0.06% 394 HCCs (DxCG) 412 16.78% 16.65% 0.12% DxCG full model2 1,304 17.01% 16.79% 0.22%
SOURCE: Medicare Fee-For-Service (FFS) 5-percent sample, present in both 2010 and 2011, excluding those with 2010 ESRD. All models use 2010 information to predict 2011 Medicare cost. Note: 1. Demographic factors are 18 age/gender categories. 2. The DxCG full model also includes 394 HCCs and interactions based on diseases, age-categories and the magnitude of a person’s prediction from an initial regression.
3. Validated R2 was generated using the K-fold cross validation (Stone, 1974), as discussed in the main
text.
Page18
Exhibit 4: Mean Medicare Cost and Mispricing by Model-Predicted Percentile Groups
Over and underpayments (observed-to-expected ratios) under various payment models1
Percentile groups based on model predictions from
2010 data Mean 2011
Medicare Cost CMS2
DxCG3
Dx4 Dx+Utilization5
CMS model Top 0.50% $91,412 1.05 1.08 1.06 Top 1% $79,458 1.04 1.08 1.05 Top 2% $66,963 1.03 1.06 1.05 Top 5% $51,105 1.01 1.05 1.05
Bottom 20% $3,871 1.18 0.92 0.89
DxCG Dx model Top 0.50% $103,148 1.65 0.92 0.94 Top 1% $88,069 1.52 0.94 0.96 Top 2% $73,666 1.36 0.97 0.98 Top 5% $54,398 1.19 0.99 1.00
Bottom 20% $3,415 0.81 1.01 0.98
DxCG Dx + Utilization model
Top 0.50% $119,372 1.85 1.15 1.00 Top 1% $99,295 1.70 1.13 1.00 Top 2% $80,011 1.52 1.11 1.00 Top 5% $57,987 1.31 1.10 1.02
Bottom 20% $3,253 0.76 0.94 0.96
SOURCE: Medicare Fee-For-Service (FFS) 5-percent sample, present in both 2010 and 2011, excluding those with 2010 ESRD. All models use 2010 information to predict 2011 Medicare cost. N = 1,487,628.
Note: 1. O/E ratios in BOLD are used to represent “mispricing” of a subgroup (by a particular model) of at least 20% (greater than 1.20 or less than 0.80). O/E greater than 1 represents underpayment; O/E less than 1 represents overpayment. For example, O/E = 1.20, means that actual costs for this group exceed what the model expects (and what a payment system based on it would pay) by 20%; O/E = 0.8 means that actual expenses were 20% lower than expected. Italics are used to highlight more moderate levels of mispricing, that is, O/E ratios that are either between 1.10 and 1.20 or between .80 and .90. 2. 2014 CMS Implemented model.
3. Both DxCG models were calibrated on the 2005 – 2006 Medicare Fee-For-Service (FFS) 5-percent sample. 4. DxCG Model 121: Predictors are: patient age, sex, and diagnoses from inpatient, outpatient and carrier-file claims.
5. DxCG Model 125: Adds Year-1 utilization variables to the Model 121 predictors.
Page19
Exhibit 5: Most underpaid conditions: CMS & DxCG classifications and Models*
SOURCE: Medicare Fee-For-Service (FFS) 5-percent sample, present in both 2010 and 2011, excluding those with 2010 ESRD. Both models use 2010 information to predict 2011 Medicare cost. N = 1,487,628. Note: * CMS- and DxCG-based conditions with the 5 highest O/E ratios under each of the CMS and DxCG models.
Label Condition Name Frequency Mean
Medicare Cost
CMS-based conditions CMS most underpaid 1 Dialysis Status 7,411 $91,586
2 Other Significant Endocrine and Metabolic Disorders 53,973 $30,999
3 Proliferative Diabetic Retinopathy and Vitreous Hemorrhage 11,566 $27,165
4 Chronic Kidney Disease, Stage 5 8,962 $25,587
5 Complications of Specified Implanted Device or Graft 25,877 $40,516
DxCG most underpaid 6 Muscular Dystrophy 1,096 $26,678
7 Amyotrophic Lateral Sclerosis and Other Motor Neuron Disease 992 $35,901
8 Pressure Ulcer of Skin with Necrosis Through to Muscle, Tendon, or 2,249 $68,847
9 Exudative Macular Degeneration 24,927 $18,921
10 Hemiplegia/Hemiparesis 23,328 $31,735
DxCG-based conditions
CMS most underpaid
11 Hemophilia 502 $63,841
12 Homelessness 918 $32,412
13 Kidney Transplant Status 1,853 $29,644
14 Kidney Transplant Complications 965 $44,498
15 Chemotherapy / Immunotherapy 13,484 $49,151
DxCG most underpaid
16 Bone Marrow Transplant Status 552 $44,087
17 Spinal Cord Disorders/Injuries Without Fracture 7,652 $25,154
Page20
18 Lipidoses, Including Gaucher's Disease 1,438 $18,889
19 Muscular Dystrophy 828 $26,229
† Hemophilia is also one of the five most underpaid conditions under the DxCG model.
‡ 2014 CMS Implemented model.
§ DxCG Dx only Medicare model. The risk score from this model is a function of patient age, sex, and
diagnoses from inpatient, outpatient and carrier-file claims.
Exhibit 6: Observed to expected (O/E) ratios of Medicare cost for CMS1 and DxCG2 models, by kinds of medical conditions presence (N=1,487,628)
Presence of any conditions in 2010
N PercentMean 2011cost
per member
O/E ratio
CMS Next 100 DxCGs3
Other DxCGs4 CMS DxCG
Yes - - 1,014,037 68 $15,440 1.00 1.01 No Yes - 187,281 13 $6,238 1.36 0.94 No No Yes 185,067 12 $3,755 0.87 0.97 No No No 101,243 7 $3,232 0.71 0.95
ALL 1,487,628 100 $11,943 SOURCE: Medicare Fee-For-Service (FFS) 5-percent sample, present in both 2010 and 2011, excluding those with 2010 ESRD. Both models use 2010 information to predict 2011 Medicare cost. Note: 1. 2014 CMS Implemented model. 2. DxCG Dx only model (Model 121): Medicare All Medical Predicting Prospective Medical Risk. This model was calibrated on 2005 – 2006 Medicare Fee-For-Service (FFS) 5-percent sample. 3. The conditions with the highest 100 coefficients from DxCG Dx only model after excluding conditions also classified in CMS-HCC. 4. The conditions with coefficients other than the top 100 ones from DxCG Dx only model after excluding conditions also classified in CMS-HCC.
Page21
References
CMS (Centers for Medicare & Medicaid Services). (2013) Advance Notice of Methodological Changes for Calendar Y ear (CY) 2014 for Medicare advantage (MA) Capitation Rates, Part C and Part D Payment Policies and 2014 Call Letter. Retrieved from http://www.cms.gov/Medicare/Health-Plans/MedicareAdvtgSpecRateStats/Downloads/Advance2014.pdf
CMS (Centers for Medicare & Medicaid Services). (2011) CMS Manual System. Pub 100-20 One-Time Notification, Transmittal 867, Change Request 7201. Retrieved from https://www.cms.gov/Regulations-and-Guidance/Guidance/Transmittals/downloads/R867OTN.pdf
Ellis, R.P., Mookim, P.G. (2013). Cross-validation Method for Risk Adjustment Models. Working paper.
Hughes, J.S., Averill, R.F., Eisenhandler, J., et al. (2004).Clinical Risk Groups (CRGs): A Classification System for Risk-Adjusted Capitation-Based Payment and Health Care Management. Medical Care, 42(1):81-90.
Kaiser Family Foundation (KFF). (2013). Medicare Advantage 2012 Data Spotlight: Enrollment Market Update. Retrieved from http://kaiserfamilyfoundation.files.wordpress.com/2013/01/8323.pdf
Kaiser Family Foundation (KFF). (2012a). Medicare Spending and Financing Fact Sheet. Retrieved from http://kff.org/medicare/fact-sheet/medicare-spending-and-financing-fact-sheet/
Kaiser Family Foundation (KFF). (2012b). State Health Facts. Retrieved from http://kff.org/medicare/state-indicator/total-medicare-beneficiaries/
Kapur, K., (2005). Risk Adjustment Methods and their Relevance to Pay-or-Play Supplement E to the Report: Challenges and Alternatives for Employer Pay-or-Play Program Design: An Implementation and Alternative Scenario Analysis of California’s Health Insurance Act of 2003 (SB 2) Report written for the California Health Care Foundation and the California Managed Risk Medical Insurance Board Project Team. Retrieved from www.ihps.org/pubs/2005_Apr_IHPS_SB2_ESup_Risk_Adj.pdf
Kapur, K., Tseng, C.W., Rastegar, A., et al. (2003). Medicare Calibration of the Clinically Detailed Risk Information System for Cost. Health Care Financing Review, 25(1):37-54.
Kronick, R., Gilmer, T., Dreyfus, T., et al. (2000). Improving Health-Based Payment for Medicaid Beneficiaries: Chronic Illness and Disability Payment System. Health Care Financing Review, 21(3):29-64.
Park, E. (2011). Allowing Insurers to Withhold Data on Enrollees’ Health Status Could Undermine Key Part of Health Reform: Data Collection Needed to Ensure Insurer Accountability and Reduce Risk of Error and Fraud. Retrieved from Center on Budget and Policy Priorities website http://www.cbpp.org/files/12-12-11health.pdf
Pope, G.C., Kautter J.(March 2011). Evaluation of the CMS-HCC Risk Adjustment Model Final Report. Retrieved from
Page22
https://www.cms.gov/MedicareAdvtgSpecRateStats/downloads/Evaluation_Risk_Adj_Model_2011.pdf
Pope, G.C., Kautter J., Ellis R.P., Ash, A.S., et al. (2004, Summer). Risk Adjustment of Medicare Capitation Payments Using the CMS-HCC Model. Health Care Financing Review, 25(4): 119-141.
Pope, G.C., Ellis, R.P., Ash, A.S., et al.(2000). Diagnostic Cost Group Hierarchical Condition Category Models for Medicare Risk Adjustment. Final Report to the Health Care Financing Administration under Contract Number 500-95-048. Health Economics Research, Inc.
Shafrin, J. (May 2011). The CMS HCC Model. Retrieved from Healthcare Economist website http://healthcare-economist.com/2011/05/17/cmss-hcc-model/
Stone, M. (1974). Cross-Validatory Choice and Assessment of Statistical Predictions. Journal of Royal Statistical Society. Series B (Methodological), 36(2):111-147.
Van de Ven, W.P. and Ellis, R. P. (2000). Risk Adjustment in Competitive Health Plan Markets. Chapter 14 in A.J. Culyer and J.P. Newhouse, (ed.) Handbook in Health Economics, North Holland:755-845.
Weiner, J.P., Dobson, A., Maxwell, S.L., et al.(1996). Risk-Adjusted Medicare Capitation Rates Using Ambulatory and Inpatient Diagnoses. Health Care Financing Review, 17(3):77-100.