Medicare Health & Drug Plan Quality and Performance Ratings
103
Medicare Health & Drug Plan Quality and Performance Ratings 2013 Part C & Part D Technical Notes First Plan Preview DRAFT Updated – 08/09/2012
Transcript of Medicare Health & Drug Plan Quality and Performance Ratings

Medicare Health & Drug Plan
Quality and Performance Ratings 2013 Part C & Part D
Technical Notes
First Plan Preview
DRAFT
Updated – 08/09/2012

DRAFT DRAFT
(Last Updated 08/09/2012) DRAFT Page i
Document Change Log
Previous Version Description of Change Revision Date
- Initial release of the Draft 2013 Part C & D Plan Ratings Technical Notes – First Plan Preview edition 08/09/2012

DRAFT DRAFT
(Last Updated 08/09/2012) DRAFT Page ii
Table of Contents
DOCUMENT CHANGE LOG .............................................................................................................................. I
INTRODUCTION ............................................................................................................................................... 1 Table 1: Contract Year 2013 Organization Types Reported in the 2013 Plan Ratings ...................................................... 1
DIFFERENCES BETWEEN THE 2012 PLAN RATINGS AND 2013 PLAN RATINGS ..................................... 1
CONTRACT ENROLLMENT DATA .................................................................................................................. 2
HANDLING OF BIASED, ERRONEOUS AND/OR NOT REPORTABLE (NR) DATA ....................................... 2
HOW THE DATA ARE REPORTED .................................................................................................................. 3
METHODOLOGY FOR ASSIGNING PART C AND D MEASURE STAR RATINGS ........................................ 3
PREDETERMINED THRESHOLDS .................................................................................................................. 4
METHODOLOGY FOR CALCULATING STARS FOR INDIVIDUAL MEASURES ............................................ 4
A. Relative Distribution and Clustering: ..................................................................................................................... 4
B. Relative Distribution and Significance Testing: ................................................................................................... 5
C. CMS Standard, Relative Distribution, and Clustering: ......................................................................................... 5
METHODOLOGY FOR CALCULATING STARS AT THE DOMAIN LEVEL ..................................................... 5 Table 2: Domain Rating Requirements ............................................................................................................................... 5
WEIGHTING OF MEASURES ........................................................................................................................... 6
METHODOLOGY FOR CALCULATING PART C AND PART D RATING ........................................................ 6 Table 3: Part C and Part D Rating Requirements ............................................................................................................... 6
METHODOLOGY FOR CALCULATING THE OVERALL MA-PD RATING ...................................................... 7 Table 4: Overall Rating Requirements ................................................................................................................................ 7
APPLYING THE IMPROVEMENT MEASURE(S) ............................................................................................. 7
APPLYING THE INTEGRATION FACTOR ....................................................................................................... 8 Table 5: Performance Summary Thresholds ...................................................................................................................... 9 Table 6: Variance Thresholds ............................................................................................................................................. 9
ROUNDING RULES FOR MEASURE SCORES: .............................................................................................. 9
ROUNDING RULES FOR SUMMARY AND OVERALL SCORES: ................................................................... 9 Table 7: Rounding Rules for Summary and Overall Scores ............................................................................................... 9
METHODOLOGY FOR CALCULATING THE HIGH PERFORMING ICON ..................................................... 10
METHODOLOGY FOR CALCULATING THE LOW PERFORMING ICON ..................................................... 10
ADJUSTMENTS FOR CONTRACTS UNDER SANCTIONS ........................................................................... 10
SPECIAL NEEDS PLAN (SNP) DATA ............................................................................................................ 11
CAHPS METHODOLOGY ............................................................................................................................... 11
CONTACT INFORMATION ............................................................................................................................. 11
PART C DOMAIN AND MEASURE DETAILS ................................................................................................ 12
Domain: 1 - Staying Healthy: Screenings, Tests and Vaccines ................................................................................... 12 Measure: C01 - Breast Cancer Screening ........................................................................................................................ 12 Measure: C02 - Colorectal Cancer Screening .................................................................................................................. 12 Measure: C03 - Cardiovascular Care – Cholesterol Screening ........................................................................................ 13

DRAFT DRAFT
(Last Updated 08/09/2012) DRAFT Page iii
Measure: C04 - Diabetes Care – Cholesterol Screening .................................................................................................. 14 Measure: C05 - Glaucoma Testing ................................................................................................................................... 15 Measure: C06 - Annual Flu Vaccine ................................................................................................................................. 15 Measure: C07 - Improving or Maintaining Physical Health ............................................................................................... 16 Measure: C08 - Improving or Maintaining Mental Health ................................................................................................. 17 Measure: C09 - Monitoring Physical Activity ..................................................................................................................... 17 Measure: C10 - Adult BMI Assessment ............................................................................................................................ 18
Domain: 2 - Managing Chronic (Long Term) Conditions ............................................................................................. 20 Measure: C11 - Care for Older Adults – Medication Review ............................................................................................ 20 Measure: C12 - Care for Older Adults – Functional Status Assessment .......................................................................... 20 Measure: C13 - Care for Older Adults – Pain Screening .................................................................................................. 21 Measure: C14 - Osteoporosis Management in Women who had a Fracture ................................................................... 22 Measure: C15 - Diabetes Care – Eye Exam ..................................................................................................................... 23 Measure: C16 - Diabetes Care – Kidney Disease Monitoring .......................................................................................... 23 Measure: C17 - Diabetes Care – Blood Sugar Controlled ................................................................................................ 24 Measure: C18 - Diabetes Care – Cholesterol Controlled ................................................................................................. 25 Measure: C19 - Controlling Blood Pressure ..................................................................................................................... 25 Measure: C20 - Rheumatoid Arthritis Management ......................................................................................................... 26 Measure: C21 - Improving Bladder Control ...................................................................................................................... 27 Measure: C22 - Reducing the Risk of Falling ................................................................................................................... 28 Measure: C23 - Plan All-Cause Readmissions ................................................................................................................. 29
Domain: 3 - Member Experience with Health Plan ........................................................................................................ 31 Measure: C24 - Getting Needed Care .............................................................................................................................. 31 Measure: C25 - Getting Appointments and Care Quickly ................................................................................................. 31 Measure: C26 - Customer Service .................................................................................................................................... 32 Measure: C27 - Overall Rating of Health Care Quality ..................................................................................................... 33 Measure: C28 - Overall Rating of Plan ............................................................................................................................. 34 Measure: C29 - Care Coordination ................................................................................................................................... 34
Domain: 4 - Member Complaints, Problems Getting Services, and Improvement in the Health Plan's Performance ...................................................................................................................................................................... 36 Measure: C30 - Complaints about the Health Plan........................................................................................................... 36 Measure: C31 - Beneficiary Access and Performance Problems ..................................................................................... 36 Measure: C32 - Members Choosing to Leave the Plan .................................................................................................... 38 Measure: C33 - Improvement ........................................................................................................................................... 39
Domain: 5 - Health Plan Customer Service .................................................................................................................... 41 Measure: C34 - Plan Makes Timely Decisions about Appeals ......................................................................................... 41 Measure: C35 - Reviewing Appeals Decisions ................................................................................................................. 42 Measure: C36 - Call Center – Foreign Language Interpreter and TTY/TDD Availability .................................................. 43 Measure: C37 - Enrollment Timeliness ............................................................................................................................. 43
PART D DOMAIN AND MEASURE DETAILS ................................................................................................ 45
Domain: 1 - Drug Plan Customer Service ...................................................................................................................... 45 Measure: D01 - Call Center – Pharmacy Hold Time......................................................................................................... 45 Measure: D02 - Call Center – Foreign Language Interpreter and TTY/TDD Availability .................................................. 45 Measure: D03 - Appeals Auto–Forward ............................................................................................................................ 46 Measure: D04 - Appeals Upheld ....................................................................................................................................... 47 Measure: D05 - Enrollment Timeliness ............................................................................................................................. 48
Domain: 2 - Member Complaints, Problems Getting Services, and Improvement in the Drug Plan’s Performance ............................................................................................................................................................................................ 49 Measure: D06 - Complaints about the Drug Plan ............................................................................................................. 49 Measure: D07 - Beneficiary Access and Performance Problems ..................................................................................... 49 Measure: D08 - Members Choosing to Leave the Plan .................................................................................................... 51 Measure: D09 - Improvement ........................................................................................................................................... 52
Domain: 3 - Member Experience with the Drug Plan .................................................................................................... 54 Measure: D10 - Getting Information From Drug Plan ....................................................................................................... 54 Measure: D11 - Rating of Drug Plan ................................................................................................................................. 55 Measure: D12 - Getting Needed Prescription Drugs ........................................................................................................ 55
Domain: 4 - Patient Safety and Accuracy of Drug Pricing ........................................................................................... 57

DRAFT DRAFT
(Last Updated 08/09/2012) DRAFT Page iv
Measure: D13 - MPF Price Accuracy ................................................................................................................................ 57 Measure: D14 - High Risk Medication .............................................................................................................................. 58 Measure: D15 - Diabetes Treatment ................................................................................................................................. 59 Measure: D16 - Part D Medication Adherence for Oral Diabetes Medications ................................................................ 60 Measure: D17 - Part D Medication Adherence for Hypertension (RAS antagonists) ....................................................... 61 Measure: D18 - Part D Medication Adherence for Cholesterol (Statins) .......................................................................... 63
ATTACHMENT A: CAHPS CASE-MIX ADJUSTMENT .................................................................................. 65
ATTACHMENT B: COMPLAINTS TRACKING MODULE EXCLUSION LIST................................................. 66 Table B-1: Exclusions effective September 25, 2010 .............................................................................................. 66 Table B-2: Exclusions prior to September 25, 2010 ................................................................................................ 66 Table B-3: Exclusions effective December 16, 2011 ............................................................................................... 67
ATTACHMENT C: NATIONAL AVERAGES FOR PART C AND D MEASURES ........................................... 68 Table C-1: National Averages for Part C Measures ................................................................................................ 68 Table C-2: National Averages for Part D Measures ................................................................................................ 69
ATTACHMENT D: PART C AND D DATA TIME FRAMES............................................................................. 70 Table D-1: Part C Measure Data Time Frames ....................................................................................................... 70 Table D-2: Part D Measure Data Time Frames ....................................................................................................... 71
ATTACHMENT E: NCQA MEASURE COMBINING METHODOLOGY .......................................................... 72 Definitions .......................................................................................................................................................................... 72 Setup Calculations ............................................................................................................................................................ 72 Pooled Analysis ................................................................................................................................................................. 72
ATTACHMENT F: CALCULATING MEASURE C23: PLAN ALL-CAUSE READMISSIONS ......................... 73
ATTACHMENT G: WEIGHTS ASSIGNED TO INDIVIDUAL PERFORMANCE MEASURES ......................... 74 Table G-1: Part C Measure Weights ........................................................................................................................ 74 Table G-2: Part D Measure Weights ........................................................................................................................ 75
ATTACHMENT H: CALCULATION OF WEIGHTED STAR RATING AND VARIANCE ESTIMATES ............ 76
ATTACHMENT I: CALCULATING THE IMPROVEMENT MEASURE AND THE MEASURES USED ............ 77 Calculating the Improvement Measure ............................................................................................................................. 77
Table I-1: Part C Measures used in the Improvement Measure .............................................................................. 78 Table I-2: Part D Measures used in the Improvement Measure .............................................................................. 79
ATTACHMENT J: PLAN RATINGS MEASURE HISTORY ............................................................................. 80 Table J-1: Part C Measure History ........................................................................................................................... 80 Table J-2: Part D Measure History ........................................................................................................................... 82
ATTACHMENT K: INDIVIDUAL MEASURE STAR ASSIGNMENT PROCESS .............................................. 84 1. Produce the Star Thresholds by the Adjusted Percentile Method ............................................................................ 84 2. Produce the Star Thresholds by the Two-stage Cluster Analysis ............................................................................. 84 3. Produce the Final Star Thresholds by the Hybrid Approach ..................................................................................... 84 4. Special Case: Produce Hybrid Thresholds When 3- or 4-star Thresholds are Predetermined ................................ 85
ATTACHMENT L: GLOSSARY OF TERMS ................................................................................................... 86
ATTACHMENT M: HEALTH PLAN MANAGEMENT SYSTEM MODULE REFERENCE ............................... 89
PART C REPORT CARD MASTER TABLE ................................................................................................... 89
A. Measure Data page ................................................................................................................................................ 89
B. Measure Detail page .............................................................................................................................................. 89 Table M-1: Measure Detail page fields .................................................................................................................... 89
C. Measure Detail – SNP page ................................................................................................................................... 90 Table M-2: Measure Detail – SNP page fields ......................................................................................................... 90 Table M-3: HEDIS 2012 Audit Designations and 2013 Plan Ratings ...................................................................... 90
D. Measure Detail – CTM page................................................................................................................................... 90

DRAFT DRAFT
(Last Updated 08/09/2012) DRAFT Page v
Table M-4: Measure Detail – CTM page fields ........................................................................................................ 90
E. Measure Detail – Improvement page .................................................................................................................... 91 Table M-5: Measure Improvement Results .............................................................................................................. 91
F. Measure Stars page ............................................................................................................................................... 91
G. Domain Stars page ................................................................................................................................................. 91
H. Summary Rating page ........................................................................................................................................... 91 Table M-6: Part C Summary Rating View ................................................................................................................ 92
I. Overall Rating page ............................................................................................................................................... 92 Table M-7: Overall Rating View ............................................................................................................................... 92
J. Technical Notes link .............................................................................................................................................. 93
PART D REPORT CARD MASTER TABLE ................................................................................................... 94
A. Measure Data page ................................................................................................................................................ 94
B. Measure Detail page .............................................................................................................................................. 94 Table M-8: Measure Detail page fields .................................................................................................................... 94
C. CTM IDs page ......................................................................................................................................................... 94 Table M-9: CTM IDs page fields .............................................................................................................................. 95
D. Auto-Forward Details page ................................................................................................................................... 95 Table M-10: Auto-Forward Details page fields......................................................................................................... 95
E. Upheld Details page ............................................................................................................................................... 95 Table M-11: Upheld Details page fields ................................................................................................................... 95
F. Plan Improvement page ......................................................................................................................................... 95 Table M-12: Measure Improvement Results ............................................................................................................ 96
G. Measure Star page ................................................................................................................................................. 96
H. Domain Star page ................................................................................................................................................... 96
I. Summary Rating page ........................................................................................................................................... 96 Table M-13: Part D Summary Rating View .............................................................................................................. 96
J. Technical Notes link .............................................................................................................................................. 97
K. Medication NDC List – Part D High Risk Medication Measure link ................................................................... 97
L. Medication NDC List – Part D Diabetes Treatment Measure link ...................................................................... 97
M. Medication NDC List – Part D Medication Adherence Measure link ................................................................. 97
DRAFT DRAFT
(Last Updated 08/09/2012) DRAFT Page 1
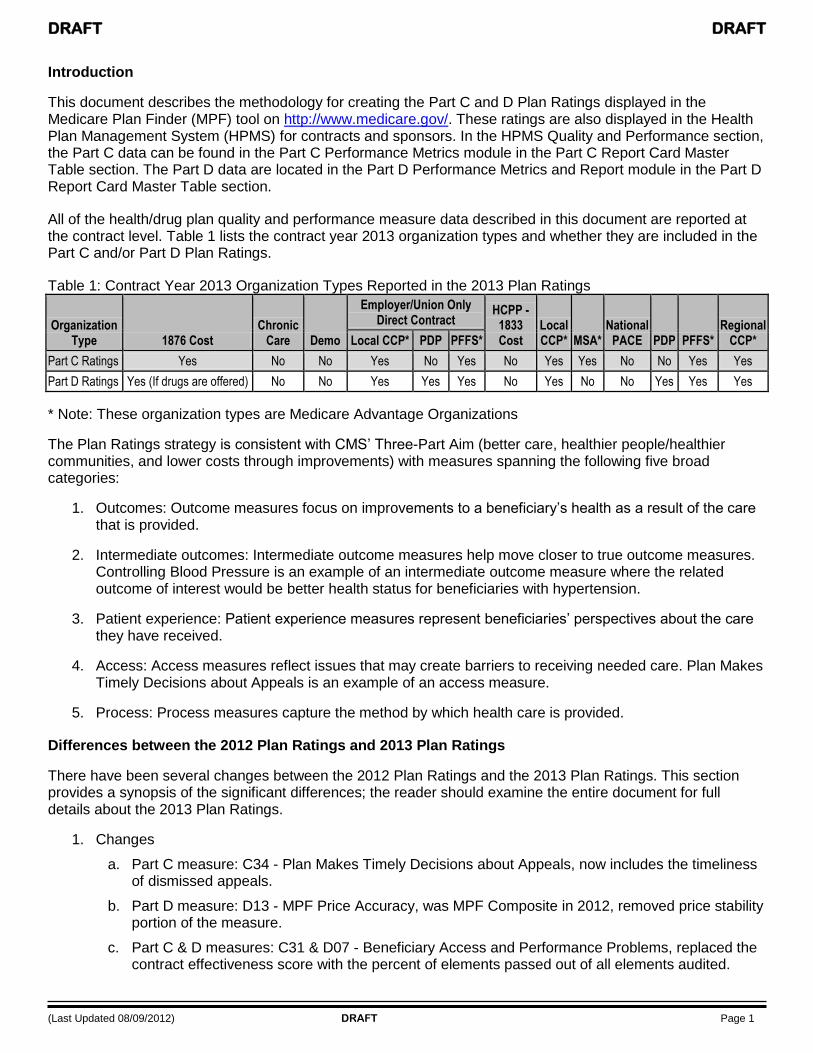
Introduction
This document describes the methodology for creating the Part C and D Plan Ratings displayed in the Medicare Plan Finder (MPF) tool on http://www.medicare.gov/. These ratings are also displayed in the Health Plan Management System (HPMS) for contracts and sponsors. In the HPMS Quality and Performance section, the Part C data can be found in the Part C Performance Metrics module in the Part C Report Card Master Table section. The Part D data are located in the Part D Performance Metrics and Report module in the Part D Report Card Master Table section.
All of the health/drug plan quality and performance measure data described in this document are reported at the contract level. Table 1 lists the contract year 2013 organization types and whether they are included in the Part C and/or Part D Plan Ratings.
Table 1: Contract Year 2013 Organization Types Reported in the 2013 Plan Ratings
Organization Type 1876 Cost
Chronic Care Demo
Employer/Union Only Direct Contract
HCPP - 1833 Cost
Local CCP* MSA*
National PACE PDP PFFS*
Regional CCP* Local CCP* PDP PFFS*
Part C Ratings Yes No No Yes No Yes No Yes Yes No No Yes Yes
Part D Ratings Yes (If drugs are offered) No No Yes Yes Yes No Yes No No Yes Yes Yes
* Note: These organization types are Medicare Advantage Organizations
The Plan Ratings strategy is consistent with CMS‘ Three-Part Aim (better care, healthier people/healthier communities, and lower costs through improvements) with measures spanning the following five broad categories:
1. Outcomes: Outcome measures focus on improvements to a beneficiary‘s health as a result of the care that is provided.
2. Intermediate outcomes: Intermediate outcome measures help move closer to true outcome measures. Controlling Blood Pressure is an example of an intermediate outcome measure where the related outcome of interest would be better health status for beneficiaries with hypertension.
3. Patient experience: Patient experience measures represent beneficiaries‘ perspectives about the care they have received.
4. Access: Access measures reflect issues that may create barriers to receiving needed care. Plan Makes Timely Decisions about Appeals is an example of an access measure.
5. Process: Process measures capture the method by which health care is provided.
Differences between the 2012 Plan Ratings and 2013 Plan Ratings
There have been several changes between the 2012 Plan Ratings and the 2013 Plan Ratings. This section provides a synopsis of the significant differences; the reader should examine the entire document for full details about the 2013 Plan Ratings.
1. Changes
a. Part C measure: C34 - Plan Makes Timely Decisions about Appeals, now includes the timeliness of dismissed appeals.
b. Part D measure: D13 - MPF Price Accuracy, was MPF Composite in 2012, removed price stability portion of the measure.
c. Part C & D measures: C31 & D07 - Beneficiary Access and Performance Problems, replaced the contract effectiveness score with the percent of elements passed out of all elements audited.

DRAFT DRAFT
(Last Updated 08/09/2012) DRAFT Page 2
d. Part C & D measures: C36 & D02 - Call Center – Foreign Language Interpreter and TTY/TDD Availability, includes data from Special Needs Plans and changes to collection methodology.
e. Part D measure: D14 - High Risk Medication - CMS will increase the number of HRM fills from one to two fills. Due to this specification change, the previously established 4-star threshold will not be applied for the 2013 Plan Ratings.
f. Part C Domain Ratings of Plan Responsiveness and Care renamed to Member Experience with Health Plan.
g. Part C Domain Member Complaints, Problems Getting Services, and Choosing to Leave the Plan renamed to Member Complaints, Problems Getting Services, and Improvement in the Health Plan's Performance.
h. Part D Domain Member Complaints, Problems Getting Services, and Choosing to Leave the Plan renamed to Member Complaints, Problems Getting Services, and Improvement in the Drug Plan's Performance.
2. Additions
a. Part C measure: C29 - Care Coordination
b. Part C measure: C33 - Health Plan Quality Improvement
c. Part C measure: C37 - Enrollment Timeliness
d. Part D measure: D09 - Drug Plan Quality Improvement
3. Transitioned (Moved to the display measures which can be found on the CMS website at this address: http://www.cms.gov/PrescriptionDrugCovGenIn/06_PerformanceData.asp)
a. Part C measure: Pneumonia Vaccine
b. Part C measure: Access to Primary Care Doctor Visits
c. Part D MPF Stability (removed from last year‘s MPF composite measure)
The complete history of measures used in the Plan Ratings can be found in Attachment J.
Contract Enrollment Data
The enrollment data used in the Part C and D "Complaints about the Health/Drug Plan" measures were pulled from the HPMS. These enrollment files represent the number of beneficiaries the contract was paid for in a specific month. For this measure, six months of enrollment files were pulled (January 2012 through June 2012) and the average enrollment from those months was used in the calculations.
The enrollment data used in the Part D "Appeals Auto–Forward" measure were pulled from the HPMS. These enrollment files represent the number of beneficiaries the contract was paid for in a specific month. For this measure, twelve months of enrollment files were pulled (January 2011 through December 2011) and the average enrollment from those months was used in the calculations.
Enrollment data are also used to combine plan level data into contract level data in the three Part C Care for Older Adults HEDIS measures. This only occurs when the eligible population was not included in the submitted SNP HEDIS data and the submitted rate was NR (see following section). For these measures, twelve months of plan level enrollment files were pulled (January 2011 through December 2011) and the average enrollment in the plan for those months was used in calculating the combined rate.
Handling of Biased, Erroneous and/or Not Reportable (NR) Data
CMS has identified issues with some contracts attempting to manipulate data or erroneously reporting data in an attempt to receive higher ratings. In these cases, the contract will receive a ―1‖ star rating for each of the measures and the numerical data value will be set to: ―CMS identified issues with this plan‘s data.‖
For the Healthcare Effectiveness Data and Information Set (HEDIS) data, NRs are assigned when the individual measure score is materially biased (e.g., the auditor informs the contract the data cannot be reported

DRAFT DRAFT
(Last Updated 08/09/2012) DRAFT Page 3
to the National Committee for Quality Assurance (NCQA) or CMS) or the contract decides not to report the data for a particular measure. When NRs have been assigned for a HEDIS measure rate, because the contract has had materially biased data or the contract has decided not to report the data, the contract receives a ―1‖ star for each of these measures and the numerical value will be set to: ―CMS identified issues with this plan‘s data‖. The measure score will also receive the footnote: ―Not reported. There were problems with the plan's data‖ for materially biased data or "Measure was not reported by plan" for unreported data.
If an approved CAHPS vendor does not submit a contract‘s CAHPS data by the data submission deadline, the contract will automatically receive a rating of 1 star for the CAHPS measures.
How the Data are Reported
For 2013, the Part C and D Plan Ratings are reported using five different levels of detail.
1. At the base level, with the most detail, are the individual measures. They are comprised of numeric data for all of the quality and performance measures except for the improvement measures which is explained in the section entitled Applying the Improvement Measure(s).
2. Each of the base level measure ratings are then scored on a 5-star scale.
3. Each measure is also grouped with similar measures into a second level called a domain. A domain is assigned a star rating.
4. All of the Part C measures are grouped together to form the Part C rating for a contract. There is also a Part D rating formed by grouping the Part D measures.
5. The highest level is the overall rating which applies only to MA-PDs. This overall rating summarizes all of the Part C and Part D measures for each contract. The highest level for PDPs is the Part D rating. The highest level for MA-only contracts is the Part C rating. For the highest rating, the improvement measure(s) may not be used under certain circumstances which is explained in the section entitled Applying the Improvement Measure(s).
There are a total of 9 domains (topic areas) comprised of up to 55 measures.
1. MA-only contracts are measured on 5 domains with up to 37 measures.
2. PDPs are measured on 4 domains with up to 18 measures.
3. MA-PD contracts are measured on all 9 domains with up to 51 unique measures.
Methodology for Assigning Part C and D Measure Star Ratings
CMS develops Part C and Part D Plan Ratings in advance of the annual enrollment period each fall. Ratings are calculated at the contract level.
The principle for assigning star ratings for a measure is based on evaluating the maximum score possible, and testing initial percentile star thresholds with actual scores. Scores are grouped using statistical techniques to minimize the distance between scores within a grouping (or ―cluster‖) and maximize the distance between scores in different groupings. Most datasets that are utilized for Plan Ratings, however, are not normally distributed. This necessitates further adjustments to the star thresholds to account for gaps in the data.
CMS does not force the Plan Ratings data into 5-star categories for every measure. For example, in the health plan measure of Osteoporosis management in women that had a fracture, the 4-star threshold is ≥ 60%. In the 2013 Plan Ratings, nine contracts surpassed this threshold while the majority of contracts‘ scores fell into the 1-star and 2-star ranges.
In the MPF Price Accuracy measure, we will continue to assign only 3, 4 or 5 stars, due to the distribution of the measure data.

DRAFT DRAFT
(Last Updated 08/09/2012) DRAFT Page 4
Predetermined Thresholds
CMS has set fixed 4-star thresholds for most measures and 3-star thresholds for measures when an absolute regulatory standard has been established (such as answering a pharmacy call within 2 minutes). Additionally, CMS set these thresholds in order to define expectations about what it takes to be a high quality contract and to drive quality improvement. These target 4-star thresholds are based on contract performance in prior years; therefore they have not been set for revised measures or for measures with less than 2 years of measurement experience.
The distribution of data is evaluated to assign the other star values. For example, in the call center hold time measure, a contract that has a hold time of 2 minutes or less will receive at least 3 stars. A contract that has a hold time of only 15 seconds will receive 5 stars as they met the CMS standard and were well above other contracts.
When CMS has not set a fixed 3 or 4-star threshold for a measure, the maximum score possible is considered as a first step in setting the initial thresholds. Again, these thresholds may require adjustments to accommodate the actual distribution of data.
Methodology for Calculating Stars for Individual Measures
CMS assigns stars for each measure by applying one of three different methods: relative distribution and clustering; relative distribution and significance testing; and CMS standard, relative distribution, and clustering. Each method is described in detail below. Attachment K explains this process in more detail.
A. Relative Distribution and Clustering:
This method is applied to the majority of CMS‘ Plan Ratings for star assignments, ranging from operational and process-based measures, to HEDIS and other clinical care measures. The following sequential statistical steps are taken to derive thresholds based on the relative distribution of the data. The first step is to assign initial thresholds using an adjusted percentile approach and a two-stage clustering analysis method. These methods jointly produce initial thresholds to account for gaps in the data and the relative number of contracts with an observed star value.
Detailed description:
1. By using the Euclidean metric (defined in Attachment L), scale the raw measures to comparable metrics, and group them into clusters. Clusters are defined as contracts with similar Euclidean distances between their data values and the center data value. Six different clustering scenarios are tested, where the smallest number of clusters is 10, and the largest number of clusters is 35. The results from each of these clustering scenarios are evaluated for potential star thresholds. The formula for scaling a contract‘s raw measure value (X) for a measure (M) is the following, where Scalemin = 0.025 and Scalemax 0.975
Scaled measure value Scalemax- Scalemin X - Mmin
Mmax - Mmin + Scalemin
2. Determine up to five star groupings and their corresponding thresholds from the means of each cluster derived in Step 1.
In applying these two steps, goodness of fit analysis using an empirical distribution function test in an iterative process is performed as needed to test the properties of the raw measure data distribution in contrast to various types of continuous distributions. Additional sub-tests are also applied and include: Kolmogorov- Smirnov statistic, Cramér-von-Mises statistic, and Anderson-Darling statistic. See Attachment L for definitions of these tests.
Following these steps, the estimates of thresholds for star assignments derived from the adjusted percentile and clustering analyses are combined to produce final individual measure star ratings.
DRAFT DRAFT
(Last Updated 08/09/2012) DRAFT Page 5
B. Relative Distribution and Significance Testing:
This method is applied to determine valid star thresholds for CAHPS measures. In order to account for the reliability of scores produced from the CAHPS survey, the method combines evaluating the relative percentile distribution with significance testing. For example, to obtain 5 stars a contract‘s CAHPS measure score needs to be ranked above the 80th percentile and be statistically significantly higher than the national average CAHPS measure score. A contract is assigned 4 stars if it does not meet the 5-star criteria, but the contract‘s average CAHPS measure score exceeds a cutoff defined by the 60th percentile of contract means in CAHPS reports for the same measure. To obtain 1 star, a contract‘s CAHPS measure score needs to be ranked below the 15th percentile and the contract‘s CAHPS measure score must be statistically significantly lower than the national average CAHPS measure score.
C. CMS Standard, Relative Distribution, and Clustering:
For measures with a CMS published standard, the CMS standard has been incorporated into star thresholds. Currently, the instance in which this method applies is the call center hold time measure. Contracts meeting or exceeding the CMS standard are assigned at least 3 stars. To determine the thresholds of the other star ratings (e.g., 1, 2, 4, and 5 stars), the steps outlined above for relative distribution and clustering are applied.
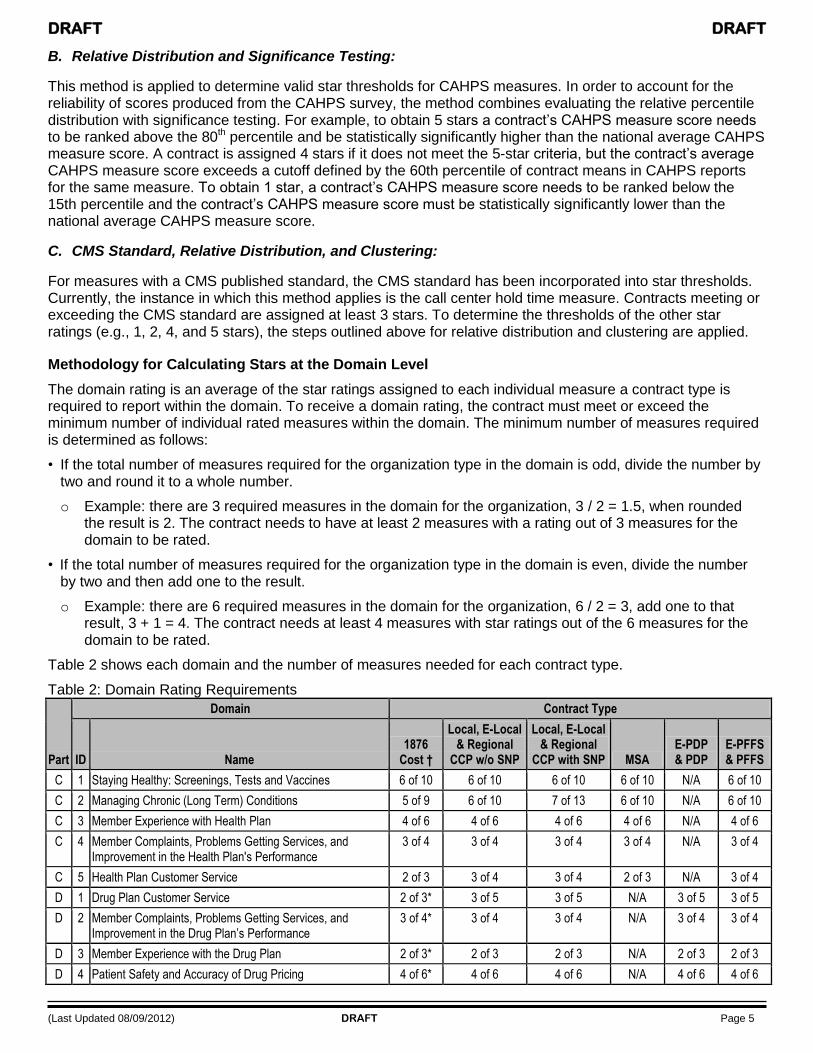
Methodology for Calculating Stars at the Domain Level
The domain rating is an average of the star ratings assigned to each individual measure a contract type is required to report within the domain. To receive a domain rating, the contract must meet or exceed the minimum number of individual rated measures within the domain. The minimum number of measures required is determined as follows:
• If the total number of measures required for the organization type in the domain is odd, divide the number by two and round it to a whole number.
o Example: there are 3 required measures in the domain for the organization, 3 / 2 = 1.5, when rounded the result is 2. The contract needs to have at least 2 measures with a rating out of 3 measures for the domain to be rated.
• If the total number of measures required for the organization type in the domain is even, divide the number by two and then add one to the result.
o Example: there are 6 required measures in the domain for the organization, 6 / 2 = 3, add one to that result, 3 + 1 = 4. The contract needs at least 4 measures with star ratings out of the 6 measures for the domain to be rated.
Table 2 shows each domain and the number of measures needed for each contract type.
Table 2: Domain Rating Requirements
Part
Domain Contract Type
ID Name 1876
Cost †
Local, E-Local & Regional
CCP w/o SNP
Local, E-Local & Regional
CCP with SNP MSA E-PDP & PDP
E-PFFS & PFFS
C 1 Staying Healthy: Screenings, Tests and Vaccines 6 of 10 6 of 10 6 of 10 6 of 10 N/A 6 of 10
C 2 Managing Chronic (Long Term) Conditions 5 of 9 6 of 10 7 of 13 6 of 10 N/A 6 of 10
C 3 Member Experience with Health Plan 4 of 6 4 of 6 4 of 6 4 of 6 N/A 4 of 6
C 4 Member Complaints, Problems Getting Services, and Improvement in the Health Plan's Performance
3 of 4 3 of 4 3 of 4 3 of 4 N/A 3 of 4
C 5 Health Plan Customer Service 2 of 3 3 of 4 3 of 4 2 of 3 N/A 3 of 4
D 1 Drug Plan Customer Service 2 of 3* 3 of 5 3 of 5 N/A 3 of 5 3 of 5
D 2 Member Complaints, Problems Getting Services, and Improvement in the Drug Plan’s Performance
3 of 4* 3 of 4 3 of 4 N/A 3 of 4 3 of 4
D 3 Member Experience with the Drug Plan 2 of 3* 2 of 3 2 of 3 N/A 2 of 3 2 of 3
D 4 Patient Safety and Accuracy of Drug Pricing 4 of 6* 4 of 6 4 of 6 N/A 4 of 6 4 of 6

DRAFT DRAFT
(Last Updated 08/09/2012) DRAFT Page 6
* Note: Does not apply to MA-only 1876 Cost contracts which do not offer drug benefits.
† Note: 1876 Cost contracts which do not submit data for the MPF measure must have a rating in 3 out of 5 Drug Pricing and Patient Safety measures to receive a rating in that domain.
Weighting of Measures
For the 2013 Plan Ratings, CMS assigned the highest weight to outcomes and intermediate outcomes, followed by patient experience/complaints, and access then process measures. Process measures were weighted the least. The Part C, Part D, and overall MA-PD ratings are thus calculated as weighted averages of the ratings of individual measures. Attachment G: Weights Assigned to Individual Performance Measures shows the weights assigned to each measure for summary and overall star ratings. A measure given a weight of 3 counts three times as much as a measure given a weight of 1. For both the summary and overall ratings, the rating for a single contract is calculated as a weighted average of the measures available for that contact. The first step in this calculation would be to multiply each individual measure‘s weight by the measure‘s star rating and then sum all results for all the measures available for a given contract. The second step would be to divide this result by the sum of the weights for the measures available for the contract.
Methodology for Calculating Part C and Part D Rating
The Part C and Part D ratings are calculated by taking a weighted average of the measure level ratings for Part C and D, respectively. To receive a Part C and/or D Rating, a contract must meet or exceed the minimum number of individual measures with a star rating. The Part C and D improvement measures are not included in the count for the minimum number of measures needed. The minimum number of measures required is determined as follows:
• If the total number of measures required for the organization type in the domain is odd, divide the number by two and round it to a whole number.
o Example: there are 17 required Part D measures for the organization, 17 / 2 = 8.5, when rounded the result is 9. The contract needs to have at least 9 measures with a rating out of the 17 total measures to receive a Part D rating.
• If the total number of measures required for the organization type in the domain is even, divide the number of measures by two.
o Example: there are 32 required Part C measures for the organization, 32 / 2 = 16. The contract needs at least 16 measures with ratings out of the 32 total measures to receive a Part C rating.
Table 3 shows the minimum number of measures having a rating needed by each contract type to receive a rating.
Table 3: Part C and Part D Rating Requirements
Rating 1876
Cost † Local, E-Local &
Regional CPP w/o SNP Local, E-Local &
Regional CPP with SNP MSA E-PDP &
PDP E-PFFS &
PFFS
Part C Rating 16 of 31 17 of 33 18 of 36 16 of 32 N/A 17 of 33
Part D Rating 8 of 15 9 of 17 9 of 17 N/A 9 of 17 9 of 17
† Note: 1876 Cost contracts which do not submit data for the MPF measure must have ratings in 7 out of 14 measures to receive a Part D rating.
For this rating, half stars are also assigned to allow for more variation across contracts.
Additionally, to incorporate performance stability into the rating process, CMS has used an approach that utilizes both the mean and the variance of individual performance ratings to differentiate contracts for the summary score. That is, a measure of individual performance score dispersion, specifically an integration factor (i-Factor), has been added to the mean score for rewarding contracts if they have both high and stable relative performance. Details about the i-Factor can be found in the section titled Applying the Integration Factor.

DRAFT DRAFT
(Last Updated 08/09/2012) DRAFT Page 7
Methodology for Calculating the Overall MA-PD Rating
For MA-PDs to receive an overall rating, the contract must have stars assigned to both the Part C rating and the Part D rating. If a contract has only one of the two required summary ratings, it will receive a note saying, ―Not enough data to calculate overall rating‖.
The overall Plan Rating for MA-PD contracts is calculated by taking a weighted average of the Part C and D measure level stars.
There are a total of 55 measures (37 in Part C, 18 in Part D). The following four measures are contained in both the Part C and D measure lists:
1. Complaints about the Health/Drug Plan (CTM)
2. Beneficiary Access and Performance Problems (BAPP)
3. Members Choosing to Leave the Plan (MCLP)
4. Enrollment Timeliness (ET)
These measures share the same data source, so CMS has only included the measure once in calculating the overall Plan Rating. The Part C and D improvement measures are also not included in the count for the minimum number of measures. This results in a total of 49 measures (the Part D CTM, BAPP, MCLP and ET measures are duplicates of the Part C measures).
The minimum number of measures required for an overall MA-PD is determined using the same methodology as for the Part C and D ratings. Table 4 shows the minimum number of measures having a rating needed by each contract type to receive an overall rating.
Table 4: Overall Rating Requirements
Rating 1876 Cost
† Local, E-Local &
Regional CPP w/o SNP Local, E-Local &
Regional CPP with SNP MSA E-PDP &
PDP E-PFFS &
PFFS
Overall Rating 21 of 42* 23 of 46 25 of 49 N/A N/A 23 of 46
* Note: Does not apply to MA-only 1876 Cost contracts which do not offer drug benefits.
† Note: 1876 Cost contracts which do not submit data for the MPF measure must have ratings in 21 out of 42 measures to receive an overall rating.
For the overall rating, half stars are also assigned to allow more variation across contracts.
Additionally, CMS is using the same i-Factor approach in calculating the summary level. Details about the i-Factor can be found in the section titled Applying the Integration Factor.
Applying the Improvement Measure(s)
The improvement measures (Part C measure C33 and Part D measure D09) compare the underlying numeric data from the 2012 Plan Ratings with the data from the 2013 Plan Ratings. The Part C measure uses only data from Part C and the Part D measure uses only data from Part D. To qualify for use in the improvement calculation, a measure must exist in both years and not have had a significant change in its specification.
The formulas used along with a list of the included measures can be found in Attachment I. The result of these calculations is a measure star rating; there is no numeric data for the measure for public reporting purposes. To receive a rating in the improvement measure, a contract must have data in at least half of the measures used.
The improvement measures are not included in the minimum number of measures needed for calculating the Part C, Part D or overall ratings.
Since high performing contracts have less room for improvement and consequently may have lower ratings on these measure(s), CMS has developed the following rules to not penalize contracts receiving 4 or more stars for their highest rating.

DRAFT DRAFT
(Last Updated 08/09/2012) DRAFT Page 8
MA-PD Contracts
1. There are separate Part C and Part D improvement measures (C33 & D09) for MA-PD contracts. C33 will always be used in calculating the Part C summary rating, and D09 will always be used in calculating the Part D summary rating for an MA-PD contract. Both measures will be used when calculating the overall rating in step 3.
2. Calculate the overall rating for MA-PD contracts without including the improvement measures.
3. Calculate the overall rating for MA-PD contracts using both improvement measures.
4. For MA-PD contracts in step 2 with 4 or more stars, compare the two overall ratings calculated in steps 2 & 3. If the rating in step 3 is less than the value in step 2, use the overall rating from step 2. For all other contracts, use the overall rating from step 3.
MA-Only Contracts
1. Only the Part C improvement measure (C33) will be used for MA-only contracts.
2. Calculate the Part C summary rating for MA-only contracts without including the improvement measure.
3. Calculate the Part C summary rating for MA-only contracts using the Part C improvement measure.
4. For MA-Only contracts in step 2 with 4 or more stars, compare the two Part C summary ratings. If the rating in step 3 is less than the value in step 2, use the Part C summary rating from step 2. For all other contracts, use the Part C summary rating from step 3.
PDP Contracts
1. Only the Part D improvement measure (D09) will be used for PDP contracts.
2. Calculate the Part D summary rating for PDP contracts without including the improvement measure.
3. Calculate the Part D summary rating for PDP contracts using the Part D improvement measure.
4. For PDP contracts in step 2 with 4 or more stars, compare the two Part D summary ratings. If the rating in step 3 is less than the value in step 2, use the Part D summary rating from step 2. For all other contracts, use the Part D summary rating from step 3.
Applying the Integration Factor
The following represents the steps taken to calculate and include the i-Factor in the Plan Ratings summary and overall ratings:
• Calculate the mean and the variance of all of the individual performance measure stars at the contract level.
o The mean is the summary or overall rating before the i-Factor is applied, which is calculated as described in the section titled Weighting of Measures.
o Using weights in the variance calculation accounts for the relative importance of measures in the i-Factor calculation. To incorporate the weights shown in Attachment G into the variance calculation of the available individual performance measures for a given contract, the steps are as follows:
Subtract the summary or overall star from each performance measure‘s star; square the results; and multiply each squared result by the corresponding individual performance measure weight.
Sum these results; call this ‗SUMWX.‘
Set n equal to the number of individual performance measures available for the given contract.
Set W equal to the sum of the weights assigned to the n individual performance measures available for the given contract.
DRAFT DRAFT
(Last Updated 08/09/2012) DRAFT Page 9
The weighted variance for the given contract is calculated as: n*SUMWX/(W*(n-1)) (for the complete formula, please see Attachment H: Calculation of Weighted Star Rating and Variance Estimates).
• Categorize the variance into three categories:
o low (0 to < 30th percentile),
o medium (≥ 30th to < 70th percentile) and
o high (≥ 70th percentile)
• Develop the i-Factor as follows:
o i-Factor = 0.4 (for contract w/ low variability & high mean (mean ≥ 85th percentile)
o i-Factor = 0.3 (for contract w/ medium variability & high mean (mean ≥ 85th percentile)
o i-Factor = 0.2 (for contract w/ low variability & relatively high mean (mean ≥ 65th & < 85th percentile)
o i-Factor = 0.1 (for contract w/ medium variability & relatively high mean (mean ≥ 65th & < 85th percentile)
o i-Factor = 0.0 (for other types of contracts)
• Develop final summary score or overall scores using 0.5 as the star scale (create 10 possible overall scores as: 0.5, 1.0, 1.5, 2.0, 2.5, 3.0, 3.5, 4.0, 4.5, and 5.0).
• Apply rounding to final summary or overall scores such that stars that are within the distance of 0.25 above or below any half star scale will be rounded to that half star scale.
• Tables 5 and 6 show the final threshold values used in i-Factor calculations for the 2013 Plan Ratings:
Table 5: Performance Summary Thresholds
Percentile Part C Rating Part D Rating Overall Rating
65th Available in plan preview 2 Available in plan preview 2 Available in plan preview 2
85th Available in plan preview 2 Available in plan preview 2 Available in plan preview 2
Table 6: Variance Thresholds
Percentile Part C Rating Part D Rating Overall Rating
30th Available in plan preview 2 Available in plan preview 2 Available in plan preview 2
70th Available in plan preview 2 Available in plan preview 2 Available in plan preview 2
Rounding Rules for Measure Scores:
Measure scores are rounded to the nearest whole number. Using standard rounding rules, raw measure scores that end in 0.49 or less are rounded down and raw measure scores that end in 0.50 or more are rounded up. So, for example, a measure score of 83.49 rounds down to 83 while a measure score of 83.50 rounds up to 84.
Rounding Rules for Summary and Overall Scores:
Summary and overall scores are rounded to the nearest half star (i.e., 0.5, 1.0, 1.5, 2.0, 2.5, 3.0, 3.5, 4.0, 4.5, 5.0). Table 7 shows how scores are rounded.
Table 7: Rounding Rules for Summary and Overall Scores
Raw Summary / Overall Score Final Summary / Overall Score
≥ 0 and < 0.25 0
≥ 0.25 and < 0.75 0.5
≥ 0.75 and < 1.25 1.0
≥ 1.25 and < 1.75 1.5
≥ 1.75 and < 2.25 2.0
≥ 2.25 and < 2.75 2.5
≥ 2.75 and < 3.25 3.0
DRAFT DRAFT
(Last Updated 08/09/2012) DRAFT Page 10
Raw Summary / Overall Score Final Summary / Overall Score
≥ 3.25 and < 3.75 3.5
≥ 3.75 and < 4.25 4.0
≥ 4.25 and < 4.75 4.5
≥ 4.75 5.0
For example, a summary or overall score of 3.74 rounds down to 3.5 and a measure score of 3.75 rounds up to 4.
Methodology for Calculating the High Performing Icon
A contract may receive a high performing icon as a result of its performance on the Part C and D measures. The high performing icon is assigned to an MA-only contract for achieving a 5-star Part C summary rating, a PDP contract for a 5-star Part D summary ratings and an MA-PD contract for a 5-star overall rating. Figure 1 shows the high performing icon to be used in the MPF:
Figure 1: The High Performing Icon
Methodology for Calculating the Low Performing Icon
A contract can receive a low performing icon as a result of its performance on the Part C or D measures. The low performing icon is calculated by evaluating the Part C rating for the current year and the past two years (i.e., the 2011, 2012 and 2013 Plan Ratings). If the contract had a Part C rating of 2.5 or lower for all three years of data, it is marked with a low performing icon. A contract must have a Part C rating for all three years to be considered for this icon.
A contract can also receive a separate low performing icon in the Part D Plan Ratings. Using the same data years as Part C, if a contract has had a Part D rating of 2.5 or lower for all three years of data, it is marked with a low performing icon. A contract must have a Part D rating for all three years to be considered for this icon. Figure 2 shows the low performing contract icon used in the MPF:
Figure 2: The Low Performing Icon
Adjustments for Contracts Under Sanctions
Contracts under an enrollment sanction are automatically assigned 2.5 stars. If a contract under sanction already has 2.5 stars or below, it will receive a 1-star reduction. Contracts under sanction will be evaluated and adjusted at two periods each year.
• August 31st: Contracts under sanction as of August 31st will have their Plan Ratings reduced in that fall's rating on Medicare Plan Finder (MPF).
• March 31st: Plan Ratings for contracts either coming off sanction or going under sanction will be updated for the MPF and Quality Bonus Payment purposes. A contract whose sanction has ended after August 31st will have its original Plan Rating restored. A contract that received a sanction after August 31st will have its Plan Rating reduced. Contracts will be informed of the changes in time to synchronize their submission of plan bids for the following year. Updates will also be displayed on MPF.

DRAFT DRAFT
(Last Updated 08/09/2012) DRAFT Page 11
Special Needs Plan (SNP) Data
CMS has included three SNP-specific measures in the 2013 Plan Ratings. All three measures are based on data from the HEDIS Care for Older Adults measure. Since these data are reported at the plan benefit package (PBP) level and the Plan Ratings are reported by contract, CMS has combined the reported rates for all PBPs within a contract using the NCQA-developed methodology described in Attachment E.
CAHPS Methodology
The CAHPS measures are case-mix adjusted to take into account differences in the characteristics of enrollees across contracts that may potentially impact survey responses. See Attachment A for the case-mix adjusters.
The CAHPS star calculations also take into account statistical significance and reliability of the measure. The base stars are the number of stars assigned prior to taking into account statistical significance and reliability.
These are the rules applied to the base star values to arrive at the final CAHPS measure star value:
5 base stars: If significance is NOT above average OR reliability is low, the Final Star value equals 4.
4 base stars: Always stays 4 Final Stars.
3 base stars: If significance is below average, the Final Star value equals 2.
2 base stars: If significance is NOT below average AND reliability is low, the Final Star value equals 3.
1 base star: If significance is NOT below average AND reliability is low, the Final Star value equals 3 or if significance is below average and reliability is low, the Final Star value equals 2 or if significance is not below average and reliability is not low, the Final Star value equals 2.
Contact Information
The two contacts below can assist you with various aspects of the Plan Ratings.
• Part C Plan Ratings: [email protected]
• Part D Plan Ratings: [email protected]
If you have questions or require information about the specific subject areas associated with the Plan Ratings please write to those contacts directly.
• CAHPS (MA & Part D): [email protected]
• Call Center Monitoring: [email protected]
• HEDIS: [email protected]
• HOS: [email protected]
• Marketing: [email protected]
• QBP Ratings and Appeals: [email protected]

DRAFT DRAFT
(Last Updated 08/09/2012) DRAFT Page 12
Part C Domain and Measure Details
See Attachment C for the national averages of individual Part C measures.
Domain: 1 - Staying Healthy: Screenings, Tests and Vaccines
Measure: C01 - Breast Cancer Screening
Label for Stars: Breast Cancer Screening
Label for Data: Breast Cancer Screening
HEDIS Label: Breast Cancer Screening (BCS)
Measure Reference: NCQA HEDIS 2012 Technical Specifications Volume 2, page 79
Description: Percent of female plan members aged 40-69 who had a mammogram during the past 2 years.
Metric: The percentage of female MA enrollees ages 40 to 69 (denominator) who had one or more mammograms during the measurement year or the year prior to the measurement year (numerator).
Exclusions: (optional) Women who had a bilateral mastectomy. Look for evidence of a bilateral mastectomy as far back as possible in the member‘s history through December 31 of the measurement year. Exclude members for whom there is evidence of two unilateral mastectomies. Refer to NCQA HEDIS 2012 Technical Specifications Volume 2, page 80, Table BCS-B for codes to identify exclusions.
Data Source: HEDIS
CMS Framework Area: Clinical care
NQF #: 0031
Data Time Frame: 01/01/2011 - 12/31/2011
General Trend: Higher is better
Statistical Method: Relative Distribution with Clustering
Improvement Measure: Included
Weighting Category: Process Measure
Weighting Value: 1
Data Display: Percentage with no decimal point
Reporting Requirements: 1876 Cost
Local, E-Local & Regional CCP w/o SNP
Local, E-Local & Regional CCP with SNP MSA
E-PDP & PDP
E-PFFS & PFFS
Yes Yes Yes Yes No Yes
4-Star Threshold: ≥ 74%
Cut Points: Available in plan preview 2
Measure: C02 - Colorectal Cancer Screening
Label for Stars: Colorectal Cancer Screening
Label for Data: Colorectal Cancer Screening
HEDIS Label: Colorectal Cancer Screening (COL)
Measure Reference: NCQA HEDIS 2012 Technical Specifications Volume 2, page 84
Description: Percent of plan members aged 50-75 who had appropriate screening for colon cancer
Metric: The percentage of MA enrollees aged 50 to 75 (denominator) who had one or more appropriate screenings for colorectal cancer (numerator).

DRAFT DRAFT
(Last Updated 08/09/2012) DRAFT Page 13
Exclusions: (optional) Members with a diagnosis of colorectal cancer or total colectomy. Look for evidence of colorectal cancer or total colectomy as far back as possible in the member‘s history. Refer to NCQA HEDIS 2012 Technical Specifications Volume 2, page 85, Table COL-B for codes to identify exclusions.
Data Source: HEDIS
CMS Framework Area: Clinical care
NQF #: 0034
Data Time Frame: 01/01/2011 - 12/31/2011
General Trend: Higher is better
Statistical Method: Relative Distribution with Clustering
Improvement Measure: Included
Weighting Category: Process Measure
Weighting Value: 1
Data Display: Percentage with no decimal point
Reporting Requirements: 1876 Cost
Local, E-Local & Regional CCP w/o SNP
Local, E-Local & Regional CCP with SNP MSA
E-PDP & PDP
E-PFFS & PFFS
Yes Yes Yes Yes No Yes
4-Star Threshold: ≥ 58%
Cut Points: Available in plan preview 2
Measure: C03 - Cardiovascular Care – Cholesterol Screening
Label for Stars: Cholesterol Screening for Patients with Heart Disease
Label for Data: Cholesterol Screening for Patients with Heart Disease
HEDIS Label: Cholesterol Management for Patients With Cardiovascular Conditions (CMC)
Measure Reference: NCQA HEDIS 2012 Technical Specifications Volume 2, page 132
Description: Percent of plan members with heart disease who have had a test for ―bad‖ (LDL) cholesterol within the past year.
Metric: The percentage of members 18–75 years of age who were discharged alive for Acute Myocardial Infarction (AMI), coronary artery bypass graft (CABG) or percutaneous coronary interventions (PCI) from January 1–November 1 of the year prior to the measurement year, or who had a diagnosis of ischemic vascular disease (IVD) during the measurement year and the year prior to the measurement year (denominator), who had an LDL-C screening test performed during the measurement year (numerator).
Exclusions: None listed.
Data Source: HEDIS
CMS Framework Area: Clinical care
NQF #: 0075
Data Time Frame: 01/01/2011 - 12/31/2011
General Trend: Higher is better
Statistical Method: Relative Distribution with Clustering
Improvement Measure: Included
Weighting Category: Process Measure
Weighting Value: 1

DRAFT DRAFT
(Last Updated 08/09/2012) DRAFT Page 14
Data Display: Percentage with no decimal point
Reporting Requirements: 1876 Cost
Local, E-Local & Regional CCP w/o SNP
Local, E-Local & Regional CCP with SNP MSA
E-PDP & PDP
E-PFFS & PFFS
Yes Yes Yes Yes No Yes
4-Star Threshold: ≥ 85%
Cut Points: Available in plan preview 2
Measure: C04 - Diabetes Care – Cholesterol Screening
Label for Stars: Cholesterol Screening for Patients with Diabetes
Label for Data: Cholesterol Screening for Patients with Diabetes
HEDIS Label: Comprehensive Diabetes Care (CDC) – LDL-C Screening
Measure Reference: NCQA HEDIS 2012 Technical Specifications Volume 2, page 146
Description: Percent of plan members with diabetes who have had a test for ―bad‖ (LDL) cholesterol within the past year.
Metric: The percentage of diabetic MA enrollees 18-75 with diabetes (type 1 and type 2) (denominator) who had an LDL-C screening test performed during the measurement year (numerator).
Exclusions: (optional) • Members with a diagnosis of polycystic ovaries (Refer to NCQA HEDIS 2012 Technical Specifications Volume 2, page 156, Table CDC-O) who did not have a face-to-face encounter, in any setting, with a diagnosis of diabetes (Refer to NCQA HEDIS 2012 Technical Specifications Volume 2, page 148, Table CDC-B) during the measurement year or the year before the measurement year. Diagnosis may occur at any time in the member‘s history, but must have occurred by December 31 of the measurement year. • Members with gestational or steroid-induced diabetes (CDC-O) who did not have a face-to-face encounter, in any setting, with a diagnosis of diabetes (CDC-B) during the measurement year or the year before the measurement year. Diagnosis may occur during the measurement year or the year before the measurement year, but must have occurred by December 31 of the measurement year.
Data Source: HEDIS
CMS Framework Area: Clinical care
NQF #: 1780
Data Time Frame: 01/01/2011 - 12/31/2011
General Trend: Higher is better
Statistical Method: Relative Distribution with Clustering
Improvement Measure: Included
Weighting Category: Process Measure
Weighting Value: 1
Data Display: Percentage with no decimal point
Reporting Requirements: 1876 Cost
Local, E-Local & Regional CCP w/o SNP
Local, E-Local & Regional CCP with SNP MSA
E-PDP & PDP
E-PFFS & PFFS
Yes Yes Yes Yes No Yes
4-Star Threshold: ≥ 85%
Cut Points: Available in plan preview 2

DRAFT DRAFT
(Last Updated 08/09/2012) DRAFT Page 15
Measure: C05 - Glaucoma Testing
Label for Stars: Glaucoma Testing
Label for Data: Glaucoma Testing
HEDIS Label: Glaucoma Screening in Older Adults (GSO)
Measure Reference: NCQA HEDIS 2012 Technical Specifications Volume 2, page 92
Description: Percent of senior plan members who got a glaucoma eye exam for early detection.
Metric: The percentage of Medicare members 65 years and older, without a prior diagnosis of glaucoma or glaucoma suspect (denominator), who received a glaucoma eye exam by an eye care professional for early identification of glaucomatous conditions (numerator).
Exclusions: (optional) Members who had a prior diagnosis of glaucoma or glaucoma suspect. Look for evidence of glaucoma as far back as possible in the member‘s history through December 31 of the measurement year. Refer to NCQA HEDIS 2012 Technical Specifications Volume 2, page 93, Table GSO-B for codes to identify exclusions.
Data Source: HEDIS
CMS Framework Area: Clinical care
NQF #: None
Data Time Frame: 01/01/2011 - 12/31/2011
General Trend: Higher is better
Statistical Method: Relative Distribution with Clustering
Improvement Measure: Included
Weighting Category: Process Measure
Weighting Value: 1
Data Display: Percentage with no decimal point
Reporting Requirements: 1876 Cost
Local, E-Local & Regional CCP w/o SNP
Local, E-Local & Regional CCP with SNP MSA
E-PDP & PDP
E-PFFS & PFFS
Yes Yes Yes Yes No Yes
4-Star Threshold: ≥ 70%
Cut Points: Available in plan preview 2
Measure: C06 - Annual Flu Vaccine
Label for Stars: Annual Flu Vaccine
Label for Data: Annual Flu Vaccine
Description: Percent of plan members who got a vaccine (flu shot) prior to flu season.
Metric: The percentage of sampled Medicare enrollees (denominator) who received an influenza vaccination during the measurement year (numerator).
General Notes: This measure is not case mix adjusted. CAHPS Survey results were sent to each contract's Medicare Compliance Officer in early August 2012. These reports provide further explanation of the CAHPS scoring methodology and provide detailed information on why a specific rating was assigned.
Data Source: CAHPS
Data Source Description: CAHPS Survey Question (question number varies depending on survey type): • Have you had a flu shot since September 1, 2011?

DRAFT DRAFT
(Last Updated 08/09/2012) DRAFT Page 16
CMS Framework Area: Clinical care
NQF #: 0040
Data Time Frame: 02/01/2012 - 06/30/2012
General Trend: Higher is better
Statistical Method: Relative Distribution and Significance Testing
Improvement Measure: Included
Weighting Category: Process Measure
Weighting Value: 1
Data Display: Percentage with no decimal point
Reporting Requirements: 1876 Cost
Local, E-Local & Regional CCP w/o SNP
Local, E-Local & Regional CCP with SNP MSA
E-PDP & PDP
E-PFFS & PFFS
Yes Yes Yes Yes No Yes
4-Star Threshold: ≥ 71%
Cut Points: Available in plan preview 2
Measure: C07 - Improving or Maintaining Physical Health
Label for Stars: Improving or Maintaining Physical Health
Label for Data: Improving or Maintaining Physical Health
Description: Percent of all plan members whose physical health was the same or better than expected after two years.
Metric: The percentage of sampled Medicare enrollees (denominator) whose physical health status was the same, or better than expected (numerator).
Exclusions: Contracts with less than 30 responses are suppressed.
Data Source: HOS
Data Source Description: 2009-2011 Cohort 12 Performance Measurement Results (2009 Baseline data collection, 2011 Follow-up data collection) 2-year PCS change – Questions: 1, 2a-b, 3a-b & 5
CMS Framework Area: Person- and caregiver- centered experience and outcomes
NQF #: None
Data Time Frame: Apr 2011 - Aug 2011
General Trend: Higher is better
Statistical Method: Relative Distribution with Clustering
Improvement Measure: Not Included
Weighting Category: Outcome Measure
Weighting Value: 3
Data Display: Percentage with no decimal point
Reporting Requirements: 1876 Cost
Local, E-Local & Regional CCP w/o SNP
Local, E-Local & Regional CCP with SNP MSA
E-PDP & PDP
E-PFFS & PFFS
Yes Yes Yes Yes No Yes
4-Star Threshold: ≥ 60%
Cut Points: Available in plan preview 2

DRAFT DRAFT
(Last Updated 08/09/2012) DRAFT Page 17
Measure: C08 - Improving or Maintaining Mental Health
Label for Stars: Improving or Maintaining Mental Health
Label for Data: Improving or Maintaining Mental Health
Description: Percent of all plan members whose mental health was the same or better than expected after two years.
Metric: The percentage of sampled Medicare enrollees (denominator) whose mental health status was the same or better than expected (numerator).
Exclusions: Contracts with less than 30 responses are suppressed.
Data Source: HOS
Data Source Description: 2009-2011 Cohort 11 Performance Measurement Results (2009 Baseline data collection, 2011 Follow-up data collection) 2-year MCS change – Questions: 4a-b, 6a-c & 7
CMS Framework Area: Person- and caregiver- centered experience and outcomes
NQF #: None
Data Time Frame: Apr 2011 - Aug 2011
General Trend: Higher is better
Statistical Method: Relative Distribution with Clustering
Improvement Measure: Not Included
Weighting Category: Outcome Measure
Weighting Value: 3
Data Display: Percentage with no decimal point
Reporting Requirements: 1876 Cost
Local, E-Local & Regional CCP w/o SNP
Local, E-Local & Regional CCP with SNP MSA
E-PDP & PDP
E-PFFS & PFFS
Yes Yes Yes Yes No Yes
4-Star Threshold: ≥ 85%
Cut Points: Available in plan preview 2
Measure: C09 - Monitoring Physical Activity
Label for Stars: Monitoring Physical Activity
Label for Data: Monitoring Physical Activity
HEDIS Label: Physical Activity in Older Adults (PAO)
Measure Reference: NCQA HEDIS 2012 Specifications for The Medicare Health Outcomes Survey Volume 6, page 33
Description: Percent of senior plan members who discussed exercise with their doctor and were advised to start, increase or maintain their physical activity during the year.
Metric: The percentage of sampled Medicare members 65 years of age or older (denominator) who had a doctor‘s visit in the past 12 months and who received advice to start, increase or maintain their level exercise or physical activity (numerator).
Exclusions: Members who responded "I had no visits in the past 12 months" to Question 46 are excluded from results calculations for Question 47.
Data Source: HEDIS / HOS
Data Source Description: Cohort 12 Follow-up Data collection (2011) and Cohort 14 Baseline data collection (2011).

DRAFT DRAFT
(Last Updated 08/09/2012) DRAFT Page 18
HOS Survey Question 46: In the past 12 months, did you talk with a doctor or other health provider about your level of exercise of physical activity? For example, a doctor or other health provider may ask if you exercise regularly or take part in physical exercise. HOS Survey Question 47: In the past 12 months, did a doctor or other health care provider advise you to start, increase or maintain your level of exercise or physical activity? For example, in order to improve your health, your doctor or other health provider may advise you to start taking the stairs, increase walking from 10 to 20 minutes every day or to maintain your current exercise program.
CMS Framework Area: Person- and caregiver- centered experience and outcomes
NQF #: 0029
Data Time Frame: Apr 2011 - Aug 2011
General Trend: Higher is better
Statistical Method: Relative Distribution with Clustering
Improvement Measure: Included
Weighting Category: Process Measure
Weighting Value: 1
Data Display: Percentage with no decimal point
Reporting Requirements: 1876 Cost
Local, E-Local & Regional CCP w/o SNP
Local, E-Local & Regional CCP with SNP MSA
E-PDP & PDP
E-PFFS & PFFS
Yes Yes Yes Yes No Yes
4-Star Threshold: ≥ 60%
Cut Points: Available in plan preview 2
Measure: C10 - Adult BMI Assessment
Label for Stars: Checking to See if Members are at a Healthy Weight
Label for Data: Checking to See if Members Are at a Healthy Weight
HEDIS Label: Adult BMI Assessment (ABA)
Measure Reference: NCQA HEDIS 2012 Technical Specifications Volume 2, page 56
Description: Percent of plan members with an outpatient visit who had their ―Body Mass Index‖ (BMI) calculated from their height and weight and recorded in their medical records.
Metric: The percentage of members 18-74 years of age (denominator) who had an outpatient visit and who had their body mass index (BMI) documented during the measurement year or the year prior the measurement year (numerator).
Exclusions: (optional) Members who have a diagnosis of pregnancy (Refer to NCQA HEDIS 2012 Technical Specifications Volume 2, page 57, Table ABA-C) during the measurement year or the year prior to the measurement year.
Data Source: HEDIS
CMS Framework Area: Clinical care
NQF #: 1690
Data Time Frame: 01/01/2011 - 12/31/2011
General Trend: Higher is better
Statistical Method: Relative Distribution with Clustering
Improvement Measure: Included

DRAFT DRAFT
(Last Updated 08/09/2012) DRAFT Page 19
Weighting Category: Process Measure
Weighting Value: 1
Data Display: Percentage with no decimal point
Reporting Requirements: 1876 Cost
Local, E-Local & Regional CCP w/o SNP
Local, E-Local & Regional CCP with SNP MSA
E-PDP & PDP
E-PFFS & PFFS
Yes Yes Yes Yes No Yes
4-Star Threshold: Not predetermined
Cut Points: Available in plan preview 2

DRAFT DRAFT
(Last Updated 08/09/2012) DRAFT Page 20
Domain: 2 - Managing Chronic (Long Term) Conditions
Measure: C11 - Care for Older Adults – Medication Review
Label for Stars: Yearly Review of All Medications and Supplements Being Taken (Special Needs Plans only)
Label for Data: Yearly Review of All Medications and Supplements Being Taken (Special Needs Plans only)
HEDIS Label: Care for Older Adults (COA) – Medication Review
Measure Reference: NCQA HEDIS 2012 Technical Specifications Volume 2, page 94
Description: Percent of plan members whose doctor or clinical pharmacist has reviewed a list of everything they take (prescription and non-prescription drugs, vitamins, herbal remedies, other supplements) at least once a year. (This information about a yearly review of medications is collected for Medicare Special Needs Plans only. These plans are a type of Medicare Advantage Plan designed for certain types of people with Medicare. Some Special Needs Plans are for people with certain chronic diseases and conditions, some are for people who have both Medicare and Medicaid, and some are for people who live in an institution such as a nursing home.)
Metric: The percentage of Medicare Advantage Special Needs Plan enrollees 66 years and older (denominator) who received at least one medication review (Table COA-B) conducted by a prescribing practitioner or clinical pharmacist during the measurement year and the presence of a medication list in the medical record (numerator).
Exclusions: None listed.
Data Source: HEDIS
CMS Framework Area: Clinical care
NQF #: 0553
Data Time Frame: 01/01/2011 - 12/31/2011
General Trend: Higher is better
Statistical Method: Relative Distribution with Clustering
Improvement Measure: Included
Weighting Category: Process Measure
Weighting Value: 1
Data Display: Percentage with no decimal point
Reporting Requirements: 1876 Cost
Local, E-Local & Regional CCP w/o SNP
Local, E-Local & Regional CCP with SNP MSA
E-PDP & PDP
E-PFFS & PFFS
No No Yes No No No
4-Star Threshold: Not predetermined
Cut Points: Available in plan preview 2
Measure: C12 - Care for Older Adults – Functional Status Assessment
Label for Stars: Yearly Assessment of How Well Plan Members Are Able to Do Activities of Daily Living (Special Needs Plans only)
Label for Data: Yearly Assessment of How Well Plan Members Are Able to Do Activities of Daily Living (Special Needs Plans only)
HEDIS Label: Care for Older Adults (COA) – Functional Status Assessment
Measure Reference: NCQA HEDIS 2012 Technical Specifications Volume 2, page 94

DRAFT DRAFT
(Last Updated 08/09/2012) DRAFT Page 21
Description: Percent of plan members whose doctor has done a ―functional status assessment‖ to see how well they are able to do ―activities of daily living‖ (such as dressing, eating, and bathing). (This information about the yearly assessment is collected for Medicare Special Needs Plans only. These plans are a type of Medicare Advantage Plan designed for certain types of people with Medicare. Some Special Needs Plans are for people with certain chronic diseases and conditions, some are for people who have both Medicare and Medicaid, and some are for people who live in an institution such as a nursing home.)
Metric: The percentage of Medicare Advantage Special Needs Plan enrollees 66 years and older (denominator) who received at least one functional status assessment during the measurement year (numerator).
Exclusions: None listed.
Data Source: HEDIS
CMS Framework Area: Clinical care
NQF #: None
Data Time Frame: 01/01/2011 - 12/31/2011
General Trend: Higher is better
Statistical Method: Relative Distribution with Clustering
Improvement Measure: Included
Weighting Category: Process Measure
Weighting Value: 1
Data Display: Percentage with no decimal point
Reporting Requirements: 1876 Cost
Local, E-Local & Regional CCP w/o SNP
Local, E-Local & Regional CCP with SNP MSA
E-PDP & PDP
E-PFFS & PFFS
No No Yes No No No
4-Star Threshold: Not predetermined
Cut Points: Available in plan preview 2
Measure: C13 - Care for Older Adults – Pain Screening
Label for Stars: Yearly Pain Screening or Pain Management Plan (Special Needs Plans only)
Label for Data: Yearly Pain Screening or Pain Management Plan (Special Needs Plans only)
HEDIS Label: Care for Older Adults (COA) – Pain Screening
Measure Reference: NCQA HEDIS 2012 Technical Specifications Volume 2, page 94
Description: Percent of plan members who had a pain screening or pain management plan at least once during the year. (This information about pain screening or pain management is collected for Medicare Special Needs Plans only. These plans are a type of Medicare Advantage Plan designed for certain types of people with Medicare. Some Special Needs Plans are for people with certain chronic diseases and conditions, some are for people who have both Medicare and Medicaid, and some are for people who live in an institution such as a nursing home.)
Metric: The percentage of Medicare Advantage Special Needs Plan enrollees 66 years and older (denominator) who received at least one pain screening or pain management plan during the measurement year (numerator).
Exclusions: None listed.
Data Source: HEDIS
CMS Framework Area: Clinical care

DRAFT DRAFT
(Last Updated 08/09/2012) DRAFT Page 22
NQF #: None
Data Time Frame: 01/01/2011 - 12/31/2011
General Trend: Higher is better
Statistical Method: Relative Distribution with Clustering
Improvement Measure: Included
Weighting Category: Process Measure
Weighting Value: 1
Data Display: Percentage with no decimal point
Reporting Requirements: 1876 Cost
Local, E-Local & Regional CCP w/o SNP
Local, E-Local & Regional CCP with SNP MSA
E-PDP & PDP
E-PFFS & PFFS
No No Yes No No No
4-Star Threshold: Not predetermined
Cut Points: Available in plan preview 2
Measure: C14 - Osteoporosis Management in Women who had a Fracture
Label for Stars: Osteoporosis Management
Label for Data: Osteoporosis Management
HEDIS Label: Osteoporosis Management in Women Who Had a Fracture (OMW)
Measure Reference: NCQA HEDIS 2012 Technical Specifications Volume 2, page 168
Description: Percent of female plan members who broke a bone and got screening or treatment for osteoporosis within 6 months.
Metric: The percentage of female MA enrollees 67 and older who suffered a fracture during the measurement year (denominator), and who subsequently had either a bone mineral density test or were prescribed a drug to treat or prevent osteoporosis in the six months after the fracture (numerator).
Exclusions: None listed.
Data Source: HEDIS
CMS Framework Area: Clinical care
NQF #: 0053
Data Time Frame: 01/01/2011 - 12/31/2011
General Trend: Higher is better
Statistical Method: Relative Distribution with Clustering
Improvement Measure: Included
Weighting Category: Process Measure
Weighting Value: 1
Data Display: Percentage with no decimal point
Reporting Requirements: 1876 Cost
Local, E-Local & Regional CCP w/o SNP
Local, E-Local & Regional CCP with SNP MSA
E-PDP & PDP
E-PFFS & PFFS
Yes Yes Yes Yes No Yes
4-Star Threshold: ≥ 60%
Cut Points: Available in plan preview 2

DRAFT DRAFT
(Last Updated 08/09/2012) DRAFT Page 23
Measure: C15 - Diabetes Care – Eye Exam
Label for Stars: Eye Exam to Check for Damage from Diabetes
Label for Data: Eye Exam to Check for Damage from Diabetes
HEDIS Label: Comprehensive Diabetes Care (CDC) – Eye Exam (Retinal) Performed
Measure Reference: NCQA HEDIS 2012 Technical Specifications Volume 2, page 146
Description: Percent of plan members with diabetes who had an eye exam to check for damage from diabetes during the year.
Metric: The percentage of diabetic MA enrollees 18-75 with diabetes (type 1 and type 2) (denominator) who had an eye exam (retinal) performed during the measurement year (numerator).
Exclusions: None listed.
Data Source: HEDIS
CMS Framework Area: Clinical care
NQF #: 0055
Data Time Frame: 01/01/2011 - 12/31/2011
General Trend: Higher is better
Statistical Method: Relative Distribution with Clustering
Improvement Measure: Included
Weighting Category: Process Measure
Weighting Value: 1
Data Display: Percentage with no decimal point
Reporting Requirements: 1876 Cost
Local, E-Local & Regional CCP w/o SNP
Local, E-Local & Regional CCP with SNP MSA
E-PDP & PDP
E-PFFS & PFFS
Yes Yes Yes Yes No Yes
4-Star Threshold: ≥ 64%
Cut Points: Available in plan preview 2
Measure: C16 - Diabetes Care – Kidney Disease Monitoring
Label for Stars: Kidney Function Testing for Members with Diabetes
Label for Data: Kidney Function Testing for Members with Diabetes
HEDIS Label: Comprehensive Diabetes Care (CDC) – Medical Attention for Nephropathy
Measure Reference: NCQA HEDIS 2012 Technical Specifications Volume 2, page 146
Description: Percent of plan members with diabetes who had a kidney function test during the year.
Metric: The percentage of diabetic MA enrollees 18-75 with diabetes (type 1 and type 2) (denominator) who had medical attention for nephropathy during the measurement year (numerator).
Exclusions: None listed.
Data Source: HEDIS
CMS Framework Area: Clinical care
NQF #: 0062
Data Time Frame: 01/01/2011 - 12/31/2011
General Trend: Higher is better

DRAFT DRAFT
(Last Updated 08/09/2012) DRAFT Page 24
Statistical Method: Relative Distribution with Clustering
Improvement Measure: Included
Weighting Category: Process Measure
Weighting Value: 1
Data Display: Percentage with no decimal point
Reporting Requirements: 1876 Cost
Local, E-Local & Regional CCP w/o SNP
Local, E-Local & Regional CCP with SNP MSA
E-PDP & PDP
E-PFFS & PFFS
Yes Yes Yes Yes No Yes
4-Star Threshold: ≥ 85%
Cut Points: Available in plan preview 2
Measure: C17 - Diabetes Care – Blood Sugar Controlled
Label for Stars: Plan Members with Diabetes whose Blood Sugar is Under Control
Label for Data: Plan Members with Diabetes whose Blood Sugar is Under Control
HEDIS Label: Comprehensive Diabetes Care (CDC) – HbA1c poor control (>9.0%)
Measure Reference: NCQA HEDIS 2012 Technical Specifications Volume 2, page 146
Description: Percent of plan members with diabetes who had an A-1-C lab test during the year that showed their average blood sugar is under control.
Metric: The percentage of diabetic MA enrollees 18-75 (denominator) whose most recent HbA1c level is greater than 9%, or who were not tested during the measurement year (numerator). (This measure for public reporting is reverse scored so higher scores are better.) To calculate this measure, subtract the submitted rate from 100.
Exclusions: None listed.
Data Source: HEDIS
CMS Framework Area: Clinical care
NQF #: 0059
Data Time Frame: 01/01/2011 - 12/31/2011
General Trend: Higher is better
Statistical Method: Relative Distribution with Clustering
Improvement Measure: Included
Weighting Category: Intermediate Outcome Measures
Weighting Value: 3
Data Display: Percentage with no decimal point
Reporting Requirements: 1876 Cost
Local, E-Local & Regional CCP w/o SNP
Local, E-Local & Regional CCP with SNP MSA
E-PDP & PDP
E-PFFS & PFFS
Yes Yes Yes Yes No Yes
4-Star Threshold: ≥ 80%
Cut Points: Available in plan preview 2

DRAFT DRAFT
(Last Updated 08/09/2012) DRAFT Page 25
Measure: C18 - Diabetes Care – Cholesterol Controlled
Label for Stars: Plan Members with Diabetes whose Cholesterol Is Under Control
Label for Data: Plan Members with Diabetes whose Cholesterol Is Under Control
HEDIS Label: Comprehensive Diabetes Care (CDC) – LDL-C control (<100 mg/dL)
Measure Reference: NCQA HEDIS 2012 Technical Specifications Volume 2, page 146
Description: Percent of plan members with diabetes who had a cholesterol test during the year that showed an acceptable level of ―bad‖ (LDL) cholesterol.
Metric: The percentage of diabetic MA enrollees 18-75 (denominator) whose most recent LDL-C level during the measurement year was 100 or less (numerator).
Exclusions: None listed.
Data Source: HEDIS
CMS Framework Area: Clinical care
NQF #: 0064
Data Time Frame: 01/01/2011 - 12/31/2011
General Trend: Higher is better
Statistical Method: Relative Distribution with Clustering
Improvement Measure: Included
Weighting Category: Intermediate Outcome Measures
Weighting Value: 3
Data Display: Percentage with no decimal point
Reporting Requirements: 1876 Cost
Local, E-Local & Regional CCP w/o SNP
Local, E-Local & Regional CCP with SNP MSA
E-PDP & PDP
E-PFFS & PFFS
Yes Yes Yes Yes No Yes
4-Star Threshold: ≥ 53%
Cut Points: Available in plan preview 2
Measure: C19 - Controlling Blood Pressure
Label for Stars: Controlling Blood Pressure
Label for Data: Controlling Blood Pressure
HEDIS Label: Controlling High Blood Pressure (CBP)
Measure Reference: NCQA HEDIS 2012 Technical Specifications Volume 2, page 136
Description: Percent of plan members with high blood pressure who got treatment and were able to maintain a healthy pressure.
Metric: The percentage of MA members 18–85 years of age who had a diagnosis of hypertension (HTN) (denominator) and whose BP was adequately controlled (<140/90) during the measurement year (numerator).
Exclusions: (optional) • Exclude from the eligible population all members with evidence of end-stage renal disease (ESRD) (refer to NCQA HEDIS 2012 Technical Specifications Volume 2, page 139, Table CBP-C) on or prior to December 31 of the measurement year. Documentation in the medical record must include a dated note indicating evidence of ESRD. Documentation of dialysis or renal transplant also meets the criteria for evidence of ESRD. • Exclude from the eligible population all members with a diagnosis of pregnancy (Table CBP-C) during the measurement year.

DRAFT DRAFT
(Last Updated 08/09/2012) DRAFT Page 26
• Exclude from the eligible population all members who had an admission to a nonacute inpatient setting during the measurement year. Refer to NCQA HEDIS 2012 Technical Specifications Volume 2, page 187 Table FUH-B for codes to identify nonacute care.
Data Source: HEDIS
CMS Framework Area: Clinical care
NQF #: 0018
Data Time Frame: 01/01/2011 - 12/31/2011
General Trend: Higher is better
Statistical Method: Relative Distribution with Clustering
Improvement Measure: Included
Weighting Category: Intermediate Outcome Measures
Weighting Value: 3
Data Display: Percentage with no decimal point
Reporting Requirements: 1876 Cost
Local, E-Local & Regional CCP w/o SNP
Local, E-Local & Regional CCP with SNP MSA
E-PDP & PDP
E-PFFS & PFFS
Yes Yes Yes Yes No Yes
4-Star Threshold: ≥ 63%
Cut Points: Available in plan preview 2
Measure: C20 - Rheumatoid Arthritis Management
Label for Stars: Rheumatoid Arthritis Management
Label for Data: Rheumatoid Arthritis Management
HEDIS Label: Disease-Modifying Anti-Rheumatic Drug Therapy for Rheumatoid Arthritis (ART)
Measure Reference: NCQA HEDIS 2012 Technical Specifications Volume 2, page 166
Description: Percent of plan members with Rheumatoid Arthritis who got one or more prescription(s) for an anti-rheumatic drug.
Metric: The percentage of MA members who were diagnosed with rheumatoid arthritis during the measurement year (denominator), and who were dispensed at least one ambulatory prescription for a disease modifying anti-rheumatic drug (DMARD) (numerator).
Exclusions: (optional) • Members diagnosed with HIV (refer to NCQA HEDIS 2012 Technical Specifications Volume 2, page 167, Table ART-D). Look for evidence of HIV diagnosis as far back as possible in the member‘s history through December 31 of the measurement year. • Members who have a diagnosis of pregnancy (Table ART-D) during the measurement year.
Data Source: HEDIS
CMS Framework Area: Clinical care
NQF #: 0054
Data Time Frame: 01/01/2011 - 12/31/2011
General Trend: Higher is better
Statistical Method: Relative Distribution with Clustering
Improvement Measure: Included

DRAFT DRAFT
(Last Updated 08/09/2012) DRAFT Page 27
Weighting Category: Process Measure
Weighting Value: 1
Data Display: Percentage with no decimal point
Reporting Requirements: 1876 Cost
Local, E-Local & Regional CCP w/o SNP
Local, E-Local & Regional CCP with SNP MSA
E-PDP & PDP
E-PFFS & PFFS
Yes Yes Yes Yes No Yes
4-Star Threshold: ≥ 78%
Cut Points: Available in plan preview 2
Measure: C21 - Improving Bladder Control
Label for Stars: Improving Bladder Control
Label for Data: Improving Bladder Control
HEDIS Label: Management of Urinary Incontinence in Older Adults (MUI)
Measure Reference: NCQA HEDIS 2012 Specifications for The Medicare Health Outcomes Survey Volume 6, page 31
Description: Percent of plan members with a urine leakage problem who discussed the problem with their doctor and got treatment for it within 6 months.
Metric: The percentage of Medicare members 65 years of age or older who reported having a urine leakage problem in the past six months (denominator) and who received treatment for their current urine leakage problem (numerator).
Exclusions: None listed.
Data Source: HEDIS / HOS
Data Source Description: Cohort 12 Follow-up Data collection (2011) and Cohort 14 Baseline data collection (2011). HOS Survey Question 42: Many people experience problems with urinary incontinence, the leakage of urine. In the past 6 months, have you accidentally leaked urine? HOS Survey Question 43: How much of a problem, if any, was the urine leakage for you? HOS Survey Question 45: There are many ways to treat urinary incontinence including bladder training, exercises, medication and surgery. Have you received these or any other treatments for your current urine leakage problem?
CMS Framework Area: Clinical care
NQF #: 0030
Data Time Frame: Apr 2011 - Aug 2011
General Trend: Higher is better
Statistical Method: Relative Distribution with Clustering
Improvement Measure: Included
Weighting Category: Process Measure
Weighting Value: 1
Data Display: Percentage with no decimal point
Reporting Requirements: 1876 Cost
Local, E-Local & Regional CCP w/o SNP
Local, E-Local & Regional CCP with SNP MSA
E-PDP & PDP
E-PFFS & PFFS
Yes Yes Yes Yes No Yes
4-Star Threshold: ≥ 60%

DRAFT DRAFT
(Last Updated 08/09/2012) DRAFT Page 28
Cut Points: Available in plan preview 2
Measure: C22 - Reducing the Risk of Falling
Label for Stars: Reducing the Risk of Falling
Label for Data: Reducing the Risk of Falling
HEDIS Label: Fall Risk Management (FRM)
Measure Reference: NCQA HEDIS 2012 Specifications for The Medicare Health Outcomes Survey Volume 6, page 35
Description: Percent of plan members with a problem falling, walking or balancing who discussed it with their doctor and got treatment for it during the year.
Metric: The percentage of Medicare members 65 years of age or older who had a fall or had problems with balance or walking in the past 12 months (denominator), who were seen by a practitioner in the past 12 months and who received fall risk intervention from their current practitioner (numerator).
Exclusions: None listed.
Data Source: HEDIS / HOS
Data Source Description: Cohort 12 Follow-up Data collection (2011) and Cohort 14 Baseline data collection (2011). HOS Survey Question 48: A fall is when your body goes to the ground without being pushed. In the past 12 months, did your doctor or other health provider talk with you about falling or problems with balance or walking? HOS Survey Question 49: Did you fall in the past 12 months? HOS Survey Question 51: Has your doctor or other health provider done anything to help prevent falls or treat problems with balance or walking? Some things they might do include: • Suggest that you use a cane or walker • Check your blood pressure lying or standing • Suggest that you do an exercise or physical therapy program • Suggest a vision or hearing testing
CMS Framework Area: Clinical care
NQF #: 0035
Data Time Frame: Apr 2011 - Aug 2011
General Trend: Higher is better
Statistical Method: Relative Distribution with Clustering
Improvement Measure: Included
Weighting Category: Process Measure
Weighting Value: 1
Data Display: Percentage with no decimal point
Reporting Requirements: 1876 Cost
Local, E-Local & Regional CCP w/o SNP
Local, E-Local & Regional CCP with SNP MSA
E-PDP & PDP
E-PFFS & PFFS
Yes Yes Yes Yes No Yes
4-Star Threshold: ≥ 59%
Cut Points: Available in plan preview 2

DRAFT DRAFT
(Last Updated 08/09/2012) DRAFT Page 29
Measure: C23 - Plan All-Cause Readmissions
Label for Stars: Readmission to a Hospital within 30 Days of Being Discharged (more stars are better because it means fewer members are being readmitted)
Label for Data: Readmission to a Hospital within 30 Days of Being Discharged (lower percentages are better because it means fewer members are being readmitted)
HEDIS Label: Plan All-Cause Readmissions (PCR)
Measure Reference: NCQA HEDIS 2012 Technical Specifications Volume 2, page 317
Description: Percent of senior plan members discharged from a hospital stay who were readmitted to a hospital within 30 days, either for the same condition as their recent hospital stay or for a different reason. (Patients may have been readmitted back to the same hospital or to a different one. Rates of readmission take into account how sick patients were when they went into the hospital the first time. This ―risk-adjustment‖ helps make the comparisons between plans fair and meaningful.)
Metric: The percentage of acute inpatient stays during the measurement year that were followed by an acute readmission for any diagnosis within 30 days, for members 65 years of age and older using the following formula to control for differences in the case mix of patients across different contracts. For contract A, their case-mix adjusted readmission rate relative to the national average is the observed readmission rate for contract A divided by the expected readmission rate for contract A. This ratio is then multiplied by the national average observed rate. To calculate the observed rate and expected rate for contract A for members 65 years and older, the following formulas were used: 1. The observed readmission rate for contract A equals the sum of the count of 30-day readmissions across the three age bands (65-74, 75-84 and 85+) divided by the sum of the count of index stays across the three age bands (65-74, 75-84 and 85+). 2. The expected readmission rate for contract A equals the sum of the average adjusted probabilities across the three age bands (65-74, 75-84 and 85+), weighted by the percentage of index stays in each age band. See Attachment F: Calculating Measure C23: Plan All-Cause Readmissions for the complete formula, example calculation and National Average Observation value used to complete this measure.
Exclusions: None listed in the HEDIS Technical Specifications. CMS has excluded contracts whose denominator was 10 or less.
General Notes: In HEDIS 2012, five 1876 Cost contracts voluntarily reported data in this measure even though they were not required to do so. CMS has rated these five contracts based on their submitted data. We did not use the cost contracts data when calculating the NatAvgObs or when determining the cut points for this measure. This measure is not used in the final Part C summary or overall ratings for 1876 Cost contracts.
Data Source: HEDIS
CMS Framework Area: Care coordination
NQF #: 1768
Data Time Frame: 01/01/2011 - 12/31/2011
General Trend: Lower is better
Statistical Method: Relative Distribution with Clustering
Improvement Measure: Included
Weighting Category: Outcome Measure
Weighting Value: 3
Data Display: Percentage with no decimal point

DRAFT DRAFT
(Last Updated 08/09/2012) DRAFT Page 30
Reporting Requirements: 1876 Cost
Local, E-Local & Regional CCP w/o SNP
Local, E-Local & Regional CCP with SNP MSA
E-PDP & PDP
E-PFFS & PFFS
No Yes Yes Yes No Yes
4-Star Threshold: Not predetermined
Cut Points: Available in plan preview 2
DRAFT DRAFT
(Last Updated 08/09/2012) DRAFT Page 31
Domain: 3 - Member Experience with Health Plan
Measure: C24 - Getting Needed Care
Label for Stars: Ease of Getting Needed Care and Seeing Specialists
Label for Data: Ease of Getting Needed Care and Seeing Specialists
Description: Percent of the best possible score the plan earned on how easy it is for members to get needed care, including care from specialists.
Metric: This case-mix adjusted composite measure is used to assess how easy it was for a member to get needed care and see specialists. The Consumer Assessment of Healthcare Providers and Systems (CAHPS) score uses the mean of the distribution of responses converted to a scale from 0 to 100. The score shown is the percentage of the best possible score each contract earned.
General Notes: CAHPS Survey results were sent to each contract's Medicare Compliance Officer in early August 2012. These reports provide further explanation of the CAHPS scoring methodology and provide detailed information on why a specific rating was assigned.
Data Source: CAHPS
Data Source Description: CAHPS Survey Questions (question numbers vary depending on survey type): • In the last 6 months, how often was it easy to get appointments with specialists? • In the last 6 months, how often was it easy to get the care, tests, or treatment you needed through your health plan?
CMS Framework Area: Person- and caregiver- centered experience and outcomes
NQF #: 0006
Data Time Frame: 02/01/2012 - 06/30/2012
General Trend: Higher is better
Statistical Method: Relative Distribution and Significance Testing
Improvement Measure: Included
Weighting Category: Patients‘ Experience and Complaints Measure
Weighting Value: 1.5
Data Display: Percentage with no decimal point
Reporting Requirements: 1876 Cost
Local, E-Local & Regional CCP w/o SNP
Local, E-Local & Regional CCP with SNP MSA
E-PDP & PDP
E-PFFS & PFFS
Yes Yes Yes Yes No Yes
4-Star Threshold: ≥ 85%
Cut Points: Available in plan preview 2
Measure: C25 - Getting Appointments and Care Quickly
Label for Stars: Getting Appointments and Care Quickly
Label for Data: Getting Appointments and Care Quickly
Description: Percent of the best possible score the plan earned on how quickly members get appointments and care.
Metric: This case-mix adjusted composite measure is used to assess how quickly the member was able to get appointments and care. The Consumer Assessment of Healthcare Providers and Systems (CAHPS) score uses the mean of the distribution of responses converted to a scale from 0 to 100. The score shown is the percentage of the best possible score each contract earned.
DRAFT DRAFT
(Last Updated 08/09/2012) DRAFT Page 32
General Notes: CAHPS Survey results were sent to each contract's Medicare Compliance Officer in early August 2012. These reports provide further explanation of the CAHPS scoring methodology and provide detailed information on why a specific rating was assigned.
Data Source: CAHPS
Data Source Description: CAHPS Survey Questions (question numbers vary depending on survey type): • In the last 6 months, when you needed care right away, how often did you get care as soon as you thought you needed? • In the last 6 months, not counting the times when you needed care right away, how often did you get an appointment for your health care at a doctor's office or clinic as soon as you thought you needed?
CMS Framework Area: Person- and caregiver- centered experience and outcomes
NQF #: 0006
Data Time Frame: 02/01/2012 - 06/30/2012
General Trend: Higher is better
Statistical Method: Relative Distribution and Significance Testing
Improvement Measure: Included
Weighting Category: Patients‘ Experience and Complaints Measure
Weighting Value: 1.5
Data Display: Percentage with no decimal point
Reporting Requirements: 1876 Cost
Local, E-Local & Regional CCP w/o SNP
Local, E-Local & Regional CCP with SNP MSA
E-PDP & PDP
E-PFFS & PFFS
Yes Yes Yes Yes No Yes
4-Star Threshold: ≥ 75%
Cut Points: Available in plan preview 2
Measure: C26 - Customer Service
Label for Stars: Health Plan Provides Information or Help When Members Need It
Label for Data: Health Plan Provides Information or Help When Members Need It
Description: Percent of the best possible score the plan earned on how easy it is for members to get information and help from the plan when needed.
Metric: This case-mix adjusted composite measure is used to assess how easy it was for the member to get information and help when needed. The Consumer Assessment of Healthcare Providers and Systems (CAHPS) score uses the mean of the distribution of responses converted to a scale from 0 to 100. The score shown is the percentage of the best possible score each contract earned.
General Notes: CAHPS Survey results were sent to each contract's Medicare Compliance Officer in early August 2012. These reports provide further explanation of the CAHPS scoring methodology and provide detailed information on why a specific rating was assigned.
Data Source: CAHPS
Data Source Description: CAHPS Survey Questions (question numbers vary depending on survey type): • In the last 6 months, how often did your health plan‘s customer service give you the information or help you needed? • In the last 6 months, how often did your health plan‘s customer service treat you with courtesy and respect? • In the last 6 months, how often were the forms for your health plan easy to fill out?
CMS Framework Area: Person- and caregiver- centered experience and outcomes
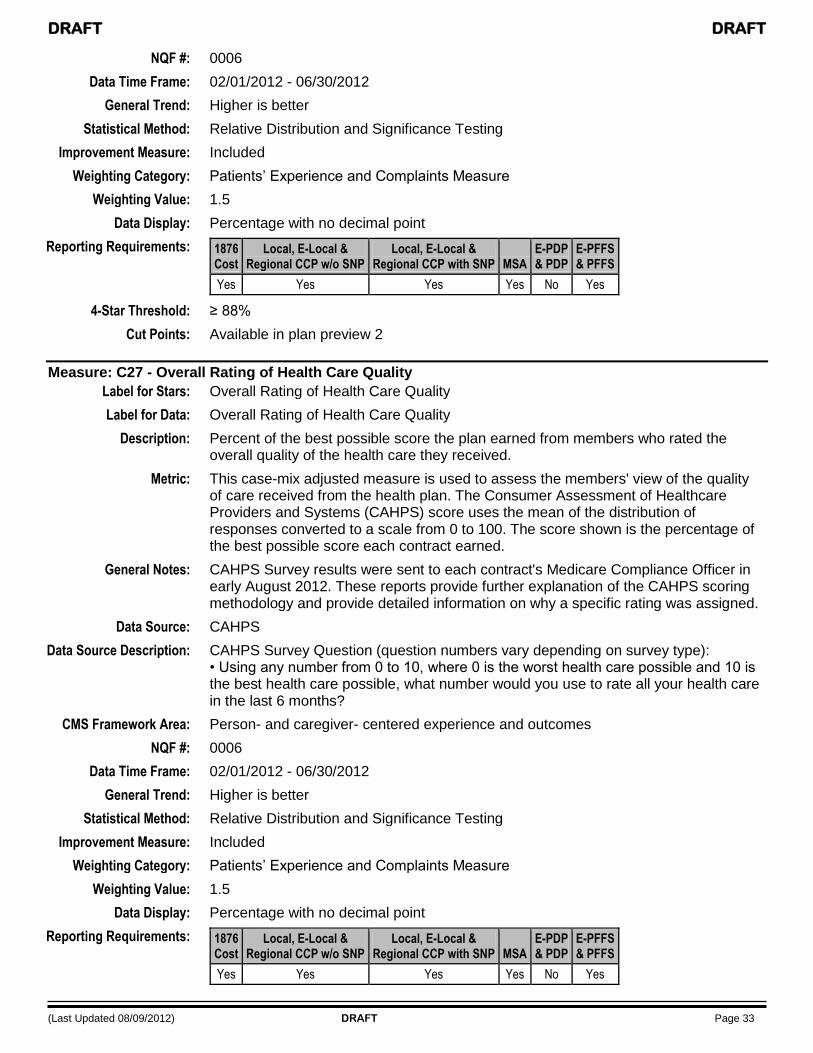
DRAFT DRAFT
(Last Updated 08/09/2012) DRAFT Page 33
NQF #: 0006
Data Time Frame: 02/01/2012 - 06/30/2012
General Trend: Higher is better
Statistical Method: Relative Distribution and Significance Testing
Improvement Measure: Included
Weighting Category: Patients‘ Experience and Complaints Measure
Weighting Value: 1.5
Data Display: Percentage with no decimal point
Reporting Requirements: 1876 Cost
Local, E-Local & Regional CCP w/o SNP
Local, E-Local & Regional CCP with SNP MSA
E-PDP & PDP
E-PFFS & PFFS
Yes Yes Yes Yes No Yes
4-Star Threshold: ≥ 88%
Cut Points: Available in plan preview 2
Measure: C27 - Overall Rating of Health Care Quality
Label for Stars: Overall Rating of Health Care Quality
Label for Data: Overall Rating of Health Care Quality
Description: Percent of the best possible score the plan earned from members who rated the overall quality of the health care they received.
Metric: This case-mix adjusted measure is used to assess the members' view of the quality of care received from the health plan. The Consumer Assessment of Healthcare Providers and Systems (CAHPS) score uses the mean of the distribution of responses converted to a scale from 0 to 100. The score shown is the percentage of the best possible score each contract earned.
General Notes: CAHPS Survey results were sent to each contract's Medicare Compliance Officer in early August 2012. These reports provide further explanation of the CAHPS scoring methodology and provide detailed information on why a specific rating was assigned.
Data Source: CAHPS
Data Source Description: CAHPS Survey Question (question numbers vary depending on survey type): • Using any number from 0 to 10, where 0 is the worst health care possible and 10 is the best health care possible, what number would you use to rate all your health care in the last 6 months?
CMS Framework Area: Person- and caregiver- centered experience and outcomes
NQF #: 0006
Data Time Frame: 02/01/2012 - 06/30/2012
General Trend: Higher is better
Statistical Method: Relative Distribution and Significance Testing
Improvement Measure: Included
Weighting Category: Patients‘ Experience and Complaints Measure
Weighting Value: 1.5
Data Display: Percentage with no decimal point
Reporting Requirements: 1876 Cost
Local, E-Local & Regional CCP w/o SNP
Local, E-Local & Regional CCP with SNP MSA
E-PDP & PDP
E-PFFS & PFFS
Yes Yes Yes Yes No Yes

DRAFT DRAFT
(Last Updated 08/09/2012) DRAFT Page 34
4-Star Threshold: ≥ 85%
Cut Points: Available in plan preview 2
Measure: C28 - Overall Rating of Plan
Label for Stars: Members‘ Overall Rating of Health Plan
Label for Data: Members‘ Overall Rating of Health Plan
Description: Percent of the best possible score the plan earned from members who rated the health plan overall.
Metric: This case-mix adjusted measure is used to assess the overall view the members have about their health plan. The Consumer Assessment of Healthcare Providers and Systems (CAHPS) score uses the mean of the distribution of responses converted to a scale from 0 to 100. The score shown is the percentage of the best possible score each contract earned.
General Notes: CAHPS Survey results were sent to each contract's Medicare Compliance Officer in early August 2012. These reports provide further explanation of the CAHPS scoring methodology and provide detailed information on why a specific rating was assigned.
Data Source: CAHPS
Data Source Description: CAHPS Survey Question (question numbers vary depending on survey type): • Using any number from 0 to 10, where 0 is the worst health plan possible and 10 is the best health plan possible, what number would you use to rate your health plan?
CMS Framework Area: Person- and caregiver- centered experience and outcomes
NQF #: 0006
Data Time Frame: 02/01/2012 - 06/30/2012
General Trend: Higher is better
Statistical Method: Relative Distribution and Significance Testing
Improvement Measure: Included
Weighting Category: Patients‘ Experience and Complaints Measure
Weighting Value: 1.5
Data Display: Percentage with no decimal point
Reporting Requirements: 1876 Cost
Local, E-Local & Regional CCP w/o SNP
Local, E-Local & Regional CCP with SNP MSA
E-PDP & PDP
E-PFFS & PFFS
Yes Yes Yes Yes No Yes
4-Star Threshold: ≥ 85%
Cut Points: Available in plan preview 2
Measure: C29 - Care Coordination
Label for Stars: Coordination of Members' Health Care Services
Label for Data: Coordination of Members' Health Care Services
Description: Percent of the best possible score the plan earned on how well the plan coordinates members‘ care. (This includes whether doctors had the records and information they need about members‘ care and how quickly members got their test results.)
Metric: Survey measures of care coordination from the Consumer Assessment of Healthcare Providers and Systems (CAHPS). Some of the questions for the Medicare Advantage CAHPS survey are new and all of the questions were drawn from existing CAHPS surveys. Once the data are available after survey administration a care coordination composite using factor analysis will be conducted to determine its reliability prior to

DRAFT DRAFT
(Last Updated 08/09/2012) DRAFT Page 35
making a final decision about inclusion.
General Notes: CAHPS Survey results were sent to each contract's Medicare Compliance Officer in early August 2012. These reports provide further explanation of the CAHPS scoring methodology and provide detailed information on why a specific rating was assigned.
Data Source: CAHPS
Data Source Description: CAHPS Survey Questions (question numbers vary depending on survey type): • Whether doctor had medical records and other information about the enrollee‘s care, • Whether there was follow up with the patient to provide test results, • How quickly the enrollee got the test results, • Whether the doctor spoke to the enrollee about prescription medicines, • Whether the enrollee received help managing care, and • Whether the personal doctor is informed and up-to-date about specialist care.
CMS Framework Area: Care coordination
NQF #: None
Data Time Frame: 02/01/2012 - 06/30/2012
General Trend: Higher is better
Statistical Method: Relative Distribution and Significance Testing
Improvement Measure: Not Included
Weighting Category: Patients‘ Experience and Complaints Measure
Weighting Value: 1
Data Display: Percentage with no decimal point
Reporting Requirements: 1876 Cost
Local, E-Local & Regional CCP w/o SNP
Local, E-Local & Regional CCP with SNP MSA
E-PDP & PDP
E-PFFS & PFFS
Yes Yes Yes Yes No Yes
4-Star Threshold: Not predetermined
Cut Points: Available in plan preview 2

DRAFT DRAFT
(Last Updated 08/09/2012) DRAFT Page 36
Domain: 4 - Member Complaints, Problems Getting Services, and Improvement in the Health Plan's Performance
Measure: C30 - Complaints about the Health Plan
Label for Stars: Complaints about the Health Plan (more stars are better because it means fewer complaints)
Label for Data: Complaints about the Health Plan (number of complaints for every 1,000 members) (lower numbers are better because it means fewer complaints)
Description: How many complaints Medicare received about the health plan.
Metric: Rate of complaints about the health plan per 1,000 members. For each contract, this rate is calculated as: ((Total number of all complaints logged into the CTM / (Average Contract enrollment) * 1,000 * 30) / (Number of Days in Period). • Enrollment numbers used to calculate the complaint rate were based on the average enrollment for the time period measured for each contract. • A contract‘s failure to follow CMS‘ CTM Standard Operating Procedures will not result in CMS‘ adjustment of the data used for these measures.
Exclusions: Some complaints that cannot be clearly attributed to the plan are excluded, please see Attachment B: Complaints Tracking Module Exclusion List. Complaint rates are not calculated for plans with enrollment less than 800 beneficiaries.
Data Source: CTM
CMS Framework Area: Person- and caregiver- centered experience and outcomes
NQF #: None
Data Time Frame: 01/01/2012 - 06/30/2012
General Trend: Lower is better
Statistical Method: Relative Distribution with Clustering
Improvement Measure: Included
Weighting Category: Patients‘ Experience and Complaints Measure
Weighting Value: 1.5
Data Display: Rate with 2 decimal points
Reporting Requirements: 1876 Cost
Local, E-Local & Regional CCP w/o SNP
Local, E-Local & Regional CCP with SNP MSA
E-PDP & PDP
E-PFFS & PFFS
Yes Yes Yes Yes No Yes
4-Star Threshold: Not predetermined
Cut Points: Available in plan preview 2
Measure: C31 - Beneficiary Access and Performance Problems
Label for Stars: Problems Medicare Found in Members‘ Access to Services and in the Plan‘s Performance (more stars are better because it means fewer serious problems)
Label for Data: Problems Medicare Found in Members‘ Access to Services and in the Plan‘s Performance (on a scale from 0 to 100, higher numbers are better because it means fewer serious problems)
Description: To check on whether members are having problems getting access to services and to be sure that plans are following all of Medicare‘s rules, Medicare conducts audits and other types of reviews. Medicare gives the plan a lower score (from 0 to 100) when it finds problems. The score combines how severe the problems were, how many

DRAFT DRAFT
(Last Updated 08/09/2012) DRAFT Page 37
there were, and how much they affect plan members directly. A higher score is better, as it means Medicare found fewer problems.
Metric: This measure is based on CMS‘ performance audits of health and drug plans (contracts), sanctions, civil monetary penalties (CMP) as well as Compliance Activity Module (CAM) data (this includes: notices of non compliance, warning letters {with or without business plan}, and ad-hoc corrective action plans (CAP) and the CAP severity). While CMS utilized a risk-based strategy to identify contracts for performance audits in 2011, compliance or other actions may be taken against contracts as a result of other issues or concerns being identified. ● Contracts‘ scores are based on a scale of 0-100 points. ● The starting score for each contract works as follows: ○ Contracts with an effective date of 1/1/2012 are marked as ―Plan too new to be measured‖. ○ All contracts with an effective date prior to 1/1/2012 begin with a score 100. ○ Contracts that received a full performance audit have their score reduced to the percentage of elements passed out of all elements audited. ● Contracts under sanction during the measurement period are reduced to a score of 0*. ● The following deductions are taken from contracts whose score is above 0: ○ Contracts that received a CMP with beneficiary impact related to access: 40 points. ○ Contracts that received a CMP with beneficiary impact not related to access: 20 points. ○ Contracts that have a CAM score (CAM score calculation is discussed below) are reduced as follows: ■ 0 – 2 CAM Score – 0 points ■ 3 – 9 CAM Score – 20 points ■ 10 – 19 CAM Score – 40 points ■ 20 – 29 CAM Score – 60 points ■ ≥ 30 CAM Score – 80 points Calculation of the CAM Score combines the notices of non compliance, warning letters (with or without business plan) and ad-hoc CAPs and their severity. The formula used is as follows: CAM Score = (NC * 1) + (woBP * 3) + (wBP * 4) + (NAHC * (6 * CAP Severity)) Where: NC = Number of Notices of Non Compliance woBP = Number of Warning Letters without Business Plan wBP = Number of Warning Letters with Business Plan NAHC = Number of Ad-Hoc CAPs CAP Severity = Sum of the severity of each CAP given to a contract during the measurement period. Each CAP is rated as one of the following: 3 – ad-hoc CAP with beneficiary access impact 2 – ad-hoc CAP with beneficiary non-access impact 1 – ad-hoc CAP no beneficiary impact
Data Source: CMS Administrative Data
Data Source Description: Findings of CMS audits, ad hoc and compliance actions that occurred during the 12 month past performance review period between January 1, 2011 and December 31, 2011. For compliance actions, the date the action was issued is used when pulling the data from HPMS.
CMS Framework Area: Population / community health
NQF #: None
Data Time Frame: 01/01/2011 - 12/31/2011
General Trend: Higher is better

DRAFT DRAFT
(Last Updated 08/09/2012) DRAFT Page 38
Statistical Method: Relative Distribution with Clustering
Improvement Measure: Not Included
Weighting Category: Measures Capturing Access
Weighting Value: 1.5
Data Display: Rate with no decimal point
Reporting Requirements: 1876 Cost
Local, E-Local & Regional CCP w/o SNP
Local, E-Local & Regional CCP with SNP MSA
E-PDP & PDP
E-PFFS & PFFS
Yes Yes Yes Yes No Yes
4-Star Threshold: Not predetermined
Cut Points: Available in plan preview 2
Measure: C32 - Members Choosing to Leave the Plan
Label for Stars: Members Choosing to Leave the Plan (more stars are better because it means fewer members are choosing to leave the plan)
Label for Data: Members Choosing to Leave the Plan (lower percentages are better because it means fewer members choose to leave the plan)
Description: The percent of plan members who chose to leave the plan in 2010. (This does not include members who did not choose to leave the plan, such as members who moved out of the service area.)
Metric: The percent of members who chose to leave the plan come from disenrollment reason codes in Medicare‘s enrollment system. The percent is calculated as the number of members who chose to leave the plan between January 1, 2011–December 31, 2011 divided by all members enrolled in the plan at any time during 2011.
Exclusions: Members who left their plan due to circumstances beyond their control (such as members who moved out of the service area, members affected by a service area reduction, PBP termination, LIS reassignments, employer group members and members who disenrolled due to the requirement that SNP disenroll disproportionate share member who do not meet the SNP criteria) are excluded from the numerator. Also members in PBPs that were granted special enrollment exceptions have been removed. The data for contracts with less than 1,000 enrollees are not reported in this measure.
General Notes: This measure includes members who disenrolled from the contract with the following disenrollment reason codes: 11 - Voluntary Disenrollment through plan, 13 - Disenrollment because of enrollment in another Plan, 14 - Retroactive or 99 - Other (not supplied by beneficiary).
Data Source: Medicare Beneficiary Database Suite of Systems
CMS Framework Area: Person- and caregiver- centered experience and outcomes
NQF #: None
Data Time Frame: 01/01/2011 - 12/31/2011
General Trend: Lower is better
Statistical Method: Relative Distribution with Clustering
Improvement Measure: Included
Weighting Category: Patients‘ Experience and Complaints Measure
Weighting Value: 1.5
Data Display: Percentage with no decimal point

DRAFT DRAFT
(Last Updated 08/09/2012) DRAFT Page 39
Reporting Requirements: 1876 Cost
Local, E-Local & Regional CCP w/o SNP
Local, E-Local & Regional CCP with SNP MSA
E-PDP & PDP
E-PFFS & PFFS
Yes Yes Yes Yes No Yes
4-Star Threshold: Not predetermined
Cut Points: Available in plan preview 2
Measure: C33 - Improvement
Label for Stars: Improvement (if any) in the Health Plan‘s Performance
Label for Data: Improvement (if any) in the Health Plan‘s Performance
Description: This shows how much the drug plan‘s performance has improved or declined from one year to the next year.
To calculate the plan‘s improvement rating, Medicare compares the plan‘s previous scores to its current scores for all of the topics shown on this Web site. Then Medicare averages the results to give the plan its improvement rating.
If a plan receives 1 or 2 stars, it means, on average, the plan‘s scores have declined (gotten worse).
If a plan receives 3 stars, it means, on average, the plan‘s scores have stayed about the same.
If a plan receives 4 or 5 stars, it means, on average, the plan‘s scores have improved.
Keep in mind that a plan that is already doing well in most areas may not show much improvement. It is also possible that a plan can start with low ratings, show a lot of improvement, and still not be performing very well.
Metric: The numerator is the net improvement which is a sum of the number of significantly improved measures minus the number of significantly declined measures. The denominator is the number of measures eligible for the improvement measure (i.e, the measures that were included in the 2012 and 2013 Plan Ratings for this contract and had no specification changes).
Exclusions: Contracts must have data in at least half of the measures used to calculate improvement to be rated in this measure.
General Notes: Attachment I contains the formulas used to calculate the improvement measure and lists indicating which measues were used.
Data Source: Plan Ratings
Data Source Description: 2012 and 2013 Plan Ratings
CMS Framework Area: Population / community health
NQF #: None
Data Time Frame: 01/01/2011 - 12/31/2011
General Trend: Higher is better
Statistical Method: Relative Distribution with Clustering
Improvement Measure: Not Included
Weighting Category: Outcome Measure
Weighting Value: 1
Data Display: Not Applicable

DRAFT DRAFT
(Last Updated 08/09/2012) DRAFT Page 40
Reporting Requirements: 1876 Cost
Local, E-Local & Regional CCP w/o SNP
Local, E-Local & Regional CCP with SNP MSA
E-PDP & PDP
E-PFFS & PFFS
Yes Yes Yes Yes No Yes
4-Star Threshold: Not predetermined
Cut Points: Available in plan preview 2
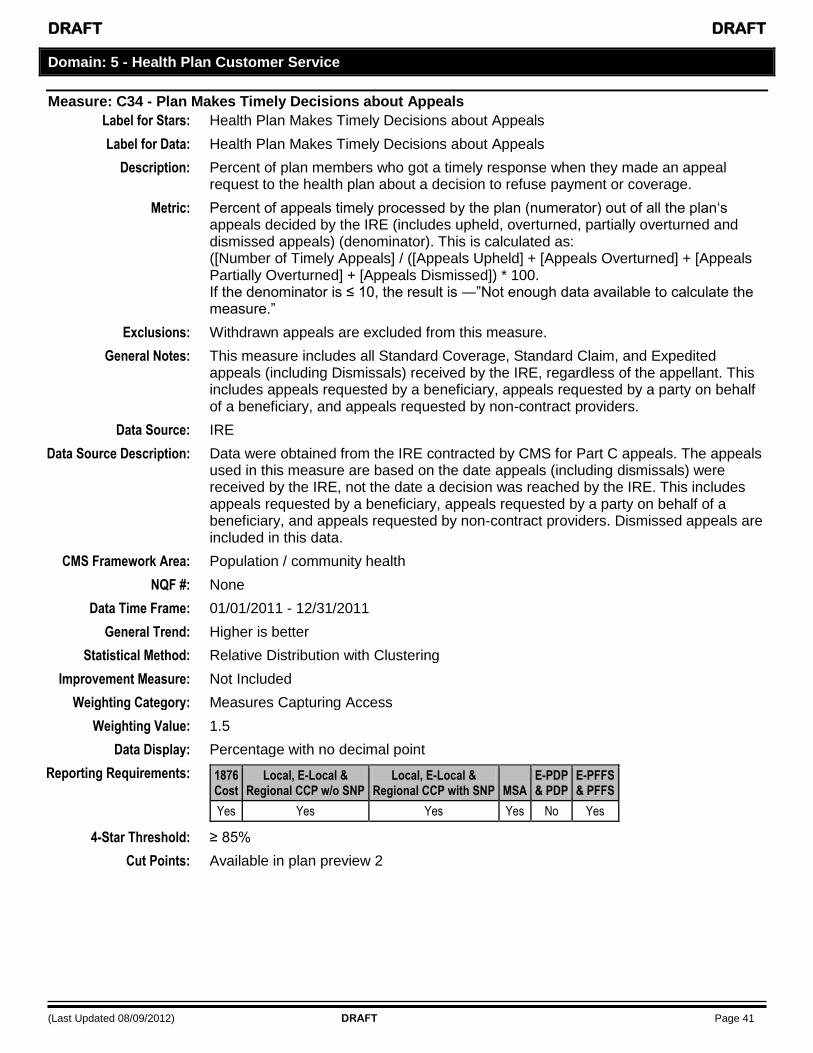
DRAFT DRAFT
(Last Updated 08/09/2012) DRAFT Page 41
Domain: 5 - Health Plan Customer Service
Measure: C34 - Plan Makes Timely Decisions about Appeals
Label for Stars: Health Plan Makes Timely Decisions about Appeals
Label for Data: Health Plan Makes Timely Decisions about Appeals
Description: Percent of plan members who got a timely response when they made an appeal request to the health plan about a decision to refuse payment or coverage.
Metric: Percent of appeals timely processed by the plan (numerator) out of all the plan‗s appeals decided by the IRE (includes upheld, overturned, partially overturned and dismissed appeals) (denominator). This is calculated as: ([Number of Timely Appeals] / ([Appeals Upheld] + [Appeals Overturned] + [Appeals Partially Overturned] + [Appeals Dismissed]) * 100. If the denominator is ≤ 10, the result is ―‖Not enough data available to calculate the measure.‖
Exclusions: Withdrawn appeals are excluded from this measure.
General Notes: This measure includes all Standard Coverage, Standard Claim, and Expedited appeals (including Dismissals) received by the IRE, regardless of the appellant. This includes appeals requested by a beneficiary, appeals requested by a party on behalf of a beneficiary, and appeals requested by non-contract providers.
Data Source: IRE
Data Source Description: Data were obtained from the IRE contracted by CMS for Part C appeals. The appeals used in this measure are based on the date appeals (including dismissals) were received by the IRE, not the date a decision was reached by the IRE. This includes appeals requested by a beneficiary, appeals requested by a party on behalf of a beneficiary, and appeals requested by non-contract providers. Dismissed appeals are included in this data.
CMS Framework Area: Population / community health
NQF #: None
Data Time Frame: 01/01/2011 - 12/31/2011
General Trend: Higher is better
Statistical Method: Relative Distribution with Clustering
Improvement Measure: Not Included
Weighting Category: Measures Capturing Access
Weighting Value: 1.5
Data Display: Percentage with no decimal point
Reporting Requirements: 1876 Cost
Local, E-Local & Regional CCP w/o SNP
Local, E-Local & Regional CCP with SNP MSA
E-PDP & PDP
E-PFFS & PFFS
Yes Yes Yes Yes No Yes
4-Star Threshold: ≥ 85%
Cut Points: Available in plan preview 2

DRAFT DRAFT
(Last Updated 08/09/2012) DRAFT Page 42
Measure: C35 - Reviewing Appeals Decisions
Label for Stars: Fairness of Health Plan‘s Denials to Member Appeals, Based on an Independent Reviewer
Label for Data: Fairness of Health Plan‘s Denials to Member Appeals, Based on an Independent Reviewer
Description: How often an independent reviewer agrees with the plan's decision to deny or say no to a member‘s appeal.
Metric: Percent of appeals where a plan‗s decision was ―upheld‖ by the IRE (numerator) out of all the plan‗s appeals (upheld, overturned, and partially overturned appeals only) that the IRE reviewed (denominator). This is calculated as: ([Appeals Upheld] / ([Appeals Upheld] + [Appeals Overturned] + [Appeals Partially Overturned]))* 100. If the minimum number of appeals (upheld + overturned + partially overturned) is ≤ 10, the result is ―Not enough data available to calculate the measure.‖
Exclusions: Dismissed and Withdrawn appeals are excluded from this measure.
General Notes: This measure includes all Standard Coverage, Standard Claim, and Expedited appeals received by the IRE, regardless of the appellant. This includes appeals requested by a beneficiary, appeals requested by a party on behalf of a beneficiary, and appeals requested by non-contract providers.
Data Source: IRE
Data Source Description: Data were obtained from the IRE contracted by CMS for Part C appeals. The appeals used in this measure are based on the date in the calendar year they were received by the IRE not the date a decision was reached. If a Reopening occurs and is decided prior to April 1, 2012, the Reopened decision is used in place of the Reconsideration decision. Reopenings decided on or after April 1, 2012 will not be reflected in this data. Appeals that occur beyond Level 2 (i.e., Administrative Law Judge or Medicare Appeals Council appeals) are not included in the data.
CMS Framework Area: Population / community health
NQF #: None
Data Time Frame: 01/01/2011 - 12/31/2011
General Trend: Higher is better
Statistical Method: Relative Distribution with Clustering
Improvement Measure: Included
Weighting Category: Measures Capturing Access
Weighting Value: 1.5
Data Display: Percentage with no decimal point
Reporting Requirements: 1876 Cost
Local, E-Local & Regional CCP w/o SNP
Local, E-Local & Regional CCP with SNP MSA
E-PDP & PDP
E-PFFS & PFFS
Yes Yes Yes Yes No Yes
4-Star Threshold: ≥ 87%
Cut Points: Available in plan preview 2

DRAFT DRAFT
(Last Updated 08/09/2012) DRAFT Page 43
Measure: C36 - Call Center – Foreign Language Interpreter and TTY/TDD Availability
Label for Stars: Availability of TTY/TDD Services and Foreign Language Interpretation When Members Call the Health Plan
Label for Data: Availability of TTY/TDD Services and Foreign Language Interpretation When Members Call the Health Plan
Description: Percent of the time that the TTY/TDD services and foreign language interpretation were available when needed by members who called the health plan‘s customer service phone number.
Metric: The calculation of this measure is the number of successful contacts with the interpreter or TTY/TDD divided by the number of attempted contacts. Successful contact with an interpreter is defined as establishing contact with a translator and either starting or completing survey questions. Interpreters must be able to communicate responses to the call surveyor in the call center‘s non-English language about the plan sponsor‘s Medicare benefits. Successful contact with a TTY/TDD service is defined as establishing contact with a TTY/TDD operator who can answer questions about the plan‘s Medicare Part C or D benefit.
Data Source: Call Center
Data Source Description: Call center monitoring data collected by CMS. The Customer Service Contact for Prospective Members phone number associated with each contract was monitored.
CMS Framework Area: Population / community health
NQF #: None
Data Time Frame: 01/30/2012 - 05/18/2012 (Monday - Friday)
General Trend: Higher is better
Statistical Method: Relative Distribution with Clustering
Improvement Measure: Not Included
Weighting Category: Measures Capturing Access
Weighting Value: 1.5
Data Display: Percentage with no decimal point
Reporting Requirements: 1876 Cost
Local, E-Local & Regional CCP w/o SNP
Local, E-Local & Regional CCP with SNP MSA
E-PDP & PDP
E-PFFS & PFFS
No Yes Yes Yes No Yes
4-Star Threshold: Not predetermined
Cut Points: Available in plan preview 2
Measure: C37 - Enrollment Timeliness
Label for Stars: Plan Handles New Enrollment Requests within 7 Days
Label for Data: Plan Handles New Enrollment Requests within 7 Days
Description: The percentage of plan generated enrollment requests submitted to the Medicare Program within 7 calendar days of the application date.
Metric: Numerator = The number of plan generated enrollment transactions submitted to CMS within 7 calendar days of the application date Denominator = The total number of plan generated enrollment transactions submitted to CMS Calculation = [(The number of plan generated enrollment transactions submitted to CMS within 7 calendar days of the application date) / (The total number of plan generated enrollment transactions submitted to CMS)] * 100
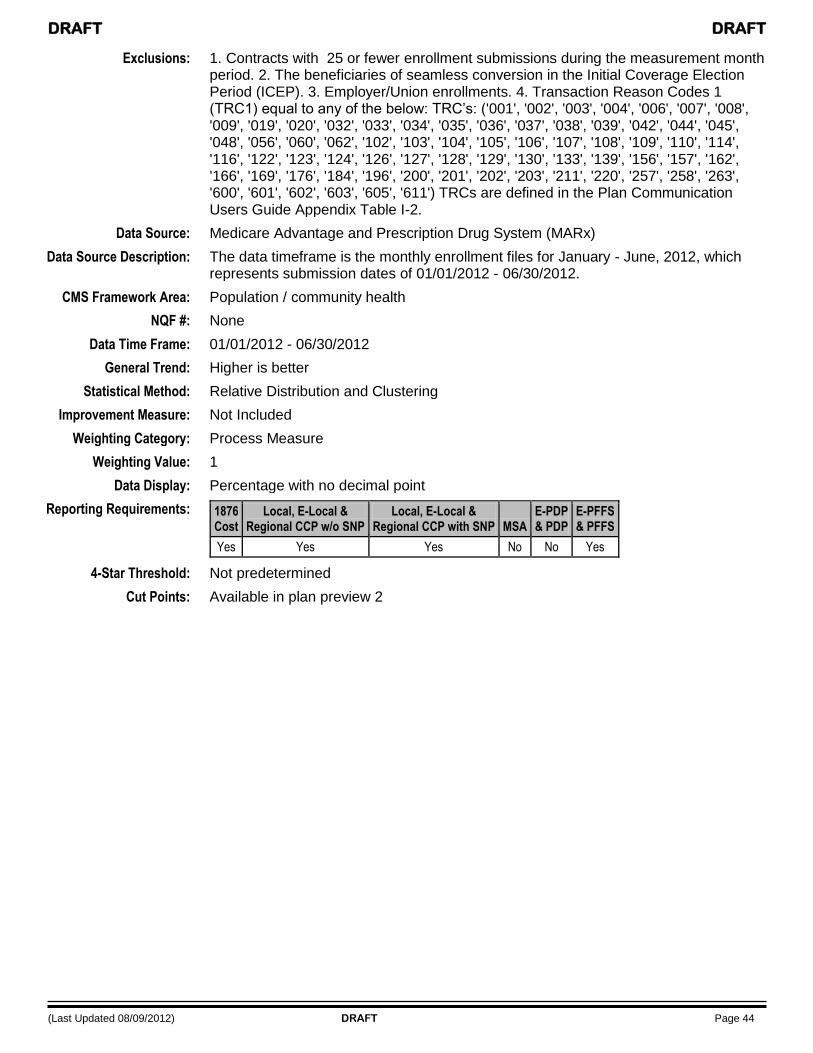
DRAFT DRAFT
(Last Updated 08/09/2012) DRAFT Page 44
Exclusions: 1. Contracts with 25 or fewer enrollment submissions during the measurement month period. 2. The beneficiaries of seamless conversion in the Initial Coverage Election Period (ICEP). 3. Employer/Union enrollments. 4. Transaction Reason Codes 1 (TRC1) equal to any of the below: TRC‘s: ('001', '002', '003', '004', '006', '007', '008', '009', '019', '020', '032', '033', '034', '035', '036', '037', '038', '039', '042', '044', '045', '048', '056', '060', '062', '102', '103', '104', '105', '106', '107', '108', '109', '110', '114', '116', '122', '123', '124', '126', '127', '128', '129', '130', '133', '139', '156', '157', '162', '166', '169', '176', '184', '196', '200', '201', '202', '203', '211', '220', '257', '258', '263', '600', '601', '602', '603', '605', '611') TRCs are defined in the Plan Communication Users Guide Appendix Table I-2.
Data Source: Medicare Advantage and Prescription Drug System (MARx)
Data Source Description: The data timeframe is the monthly enrollment files for January - June, 2012, which represents submission dates of 01/01/2012 - 06/30/2012.
CMS Framework Area: Population / community health
NQF #: None
Data Time Frame: 01/01/2012 - 06/30/2012
General Trend: Higher is better
Statistical Method: Relative Distribution and Clustering
Improvement Measure: Not Included
Weighting Category: Process Measure
Weighting Value: 1
Data Display: Percentage with no decimal point
Reporting Requirements: 1876 Cost
Local, E-Local & Regional CCP w/o SNP
Local, E-Local & Regional CCP with SNP MSA
E-PDP & PDP
E-PFFS & PFFS
Yes Yes Yes No No Yes
4-Star Threshold: Not predetermined
Cut Points: Available in plan preview 2

DRAFT DRAFT
(Last Updated 08/09/2012) DRAFT Page 45
Part D Domain and Measure Details
See Attachment C for the national averages of individual Part D measures.
Domain: 1 - Drug Plan Customer Service
Measure: D01 - Call Center – Pharmacy Hold Time
Label for Stars: Time on Hold When Pharmacist Calls Plan
Label for Data: Time on Hold When Pharmacist Calls Plan (minutes:seconds)
Description: How long pharmacists wait on hold when they call the plan‘s pharmacy help desk.
Metric: This measure is defined as the average time spent on hold by the call surveyor following navigation of the Interactive Voice Response (IVR) system, touch tone response system, or recorded greeting and before reaching a live person for the Pharmacy Technical Help Desk phone number.
Exclusions: Data were not collected from MA-PDs and PDPs under sanction or from organizations that did not have a phone number accessible to survey callers.
Standard: The CMS standard for this measure is an average hold time of 2 minutes or less.
Data Source: Call Center
Data Source Description: Call center data collected by CMS. The Pharmacy Technical Help Desk phone number associated with each contract was monitored.
CMS Framework Area: Population / community health
NQF #: None
Data Time Frame: 02/06/2012 - 05/18/2012 (Monday - Friday)
General Trend: Lower is better
Statistical Method: CMS Standard, Relative Distribution, and Clustering.
Improvement Measure: Included
Weighting Category: Measures Capturing Access
Weighting Value: 1.5
Data Display: Time
Reporting Requirements: 1876 Cost
Local, E-Local & Regional CCP w/o SNP
Local, E-Local & Regional CCP with SNP MSA
E-PDP & PDP
E-PFFS & PFFS
No Yes Yes No Yes Yes
3-Star Threshold: MA-PD: ≤ 2:15 (≤ 135 Seconds), PDP: ≤ 2:15 (≤ 135 Seconds)
Cut Points: Available in plan preview 2
Measure: D02 - Call Center – Foreign Language Interpreter and TTY/TDD Availability
Label for Stars: Availability of TTY/TDD Services and Foreign Language Interpretation When Members Call the Drug Plan
Label for Data: Availability of TTY/TDD Services and Foreign Language Interpretation When Members Call the Drug Plan
Description: Percent of the time that the TTY/TDD services and foreign language interpretation were available when needed by members who called the health plan‘s customer service phone number.
Metric: The calculation of this measure is the number of successful contacts with the interpreter or TTY/TDD divided by the number of attempted contacts. Successful contact with an interpreter is defined as establishing contact with a translator and

DRAFT DRAFT
(Last Updated 08/09/2012) DRAFT Page 46
either starting or completing survey questions. Interpreters must be able to communicate responses to the call surveyor in the call center‘s non-English language about the plan sponsor‘s Medicare benefits. Successful contact with a TTY/TDD service is defined as establishing contact with a TTY/TDD operator who can answer questions about the plan‘s Medicare Part C or D benefit.
Exclusions: Data were not collected from MA-PDs and PDPs under sanction or from organizations that did not have a phone number accessible to survey callers.
Data Source: Call Center
Data Source Description: Call center monitoring data collected by CMS. The Customer Service Contact for Prospective Members phone number associated with each contract was monitored.
CMS Framework Area: Population / community health
NQF #: None
Data Time Frame: 01/30/2012 - 05/18/2012 (Monday - Friday)
General Trend: Higher is better
Statistical Method: Relative Distribution and Clustering
Improvement Measure: Not Included
Weighting Category: Measures Capturing Access
Weighting Value: 1.5
Data Display: Percentage with no decimal point
Reporting Requirements: 1876 Cost
Local, E-Local & Regional CCP w/o SNP
Local, E-Local & Regional CCP with SNP MSA
E-PDP & PDP
E-PFFS & PFFS
No Yes Yes No Yes Yes
4-Star Threshold: MA-PD: Not predetermined, PDP: Not predetermined
Cut Points: Available in plan preview 2
Measure: D03 - Appeals Auto–Forward
Label for Stars: Drug Plan Makes Timely Decisions about Appeals
Label for Data: Drug Plan Makes Timely Decisions about Appeals (for every 10,000 members)
Description: How often the drug plan did not meet Medicare‘s deadlines for timely appeals decisions. Click here for more information on Medicare appeals: http://www.medicare.gov/basics/appeals.asp
Metric: This measure is defined as the rate of cases auto-forwarded to the Independent Review Entity (IRE) because decision timeframes for coverage determinations or redeterminations were exceeded by the plan. This is calculated as: [(Total number of cases auto-forwarded to the IRE) / (Average Medicare Part D enrollment)] * 10,000. There is no minimum number of cases required to receive a rating.
Exclusions: This rate is not calculated for contracts with less than 800 enrollees.
Data Source: IRE
Data Source Description: Data were obtained from the IRE contracted by CMS.
CMS Framework Area: Population / community health
NQF #: None
Data Time Frame: 01/01/2011 - 12/31/2011
General Trend: Lower is better
Statistical Method: Relative Distribution and Clustering

DRAFT DRAFT
(Last Updated 08/09/2012) DRAFT Page 47
Improvement Measure: Included
Weighting Category: Measures Capturing Access
Weighting Value: 1.5
Data Display: Rate with 1 decimal point
Reporting Requirements: 1876 Cost
Local, E-Local & Regional CCP w/o SNP
Local, E-Local & Regional CCP with SNP MSA
E-PDP & PDP
E-PFFS & PFFS
Yes Yes Yes No Yes Yes
4-Star Threshold: MA-PD: ≤ 1.3, PDP: ≤ 1.0
Cut Points: Available in plan preview 2
Measure: D04 - Appeals Upheld
Label for Stars: Fairness of Drug Plan‘s Denials to Member Appeals, Based on an Independent Reviewer
Label for Data: Fairness of Drug Plan‘s Denials to Member Appeals, Based on an Independent Reviewer
Description: How often an independent reviewer agrees with the drug plan's decision to deny or say no to a member‘s appeal.
Metric: This measure is defined as the percent of IRE confirmations of upholding the plans‘ decisions. This is calculated as: [(Number of cases upheld) / (Total number of cases reviewed)] * 100. Total number of cases reviewed is defined all cases received by the IRE during the timeframe and receiving a decision within 20 days after the last day of the timeframe. The denominator is equal to the number of cases upheld, fully reversed, and partially reversed. Dismissed, remanded and withdrawn cases are not included in the denominator. Auto-forward cases are included, as these are considered to be adverse decisions per Subpart M rules. Contracts with no IRE cases reviewed will not receive a score in this measure.
Exclusions: A percent is not calculated for contracts with fewer than 5 total cases reviewed by the IRE.
Data Source: IRE
Data Source Description: Data were obtained from the IRE contracted by CMS for Part D reconsiderations. The appeals used in this measure are based on the date they were received by the IRE.
CMS Framework Area: Population / community health
NQF #: None
Data Time Frame: 01/01/2012 - 6/30/2012
General Trend: Higher is better
Statistical Method: Relative Distribution and Clustering
Improvement Measure: Included
Weighting Category: Measures Capturing Access
Weighting Value: 1.5
Data Display: Percentage with no decimal point
Reporting Requirements: 1876 Cost
Local, E-Local & Regional CCP w/o SNP
Local, E-Local & Regional CCP with SNP MSA
E-PDP & PDP
E-PFFS & PFFS
Yes Yes Yes No Yes Yes
4-Star Threshold: MA-PD: ≥ 72%, PDP: ≥ 68.0%
Cut Points: Available in plan preview 2

DRAFT DRAFT
(Last Updated 08/09/2012) DRAFT Page 48
Measure: D05 - Enrollment Timeliness
Label for Stars: Plan Handles New Enrollment Requests within 7 Days
Label for Data: Plan Handles New Enrollment Requests within 7 Days
Description: The percentage of enrollment requests that the plan sent to the Medicare Program within 7 days
Metric: Numerator = The number of plan generated enrollment transactions submitted to CMS within 7 calendar days of the application date Denominator = The total number of plan generated enrollment transactions submitted to CMS Calculation = [(The number of plan generated enrollment transactions submitted to CMS within 7 calendar days of the application date) / (The total number of plan generated enrollment transactions submitted to CMS)] * 100
Exclusions: 1. Contracts with 25 or fewer enrollment submissions during the measurement month period. 2. The beneficiaries of seamless conversion in the Initial Coverage Election Period (ICEP). 3. Employer/Union enrollments. 4. Transaction Reason Codes 1 (TRC1) equal to any of the below: TRC‘s: ('001', '002', '003', '004', '006', '007', '008', '009', '019', '020', '032', '033', '034', '035', '036', '037', '038', '039', '042', '044', '045', '048', '056', '060', '062', '102', '103', '104', '105', '106', '107', '108', '109', '110', '114', '116', '122', '123', '124', '126', '127', '128', '129', '130', '133', '139', '156', '157', '162', '166', '169', '176', '184', '196', '200', '201', '202', '203', '211', '220', '257', '258', '263', '600', '601', '602', '603', '605', '611') TRCs are defined in the Plan Communication Users Guide Appendix Table I-2.
Data Source: Medicare Advantage and Prescription Drug System (MARx)
Data Source Description: The data timeframe is the monthly enrollment files for January - June, 2012, which represents submission dates of 01/01/2012 - 06/30/2012.
CMS Framework Area: Population / community health
NQF #: None
Data Time Frame: 01/01/2012 - 06/30/2012
General Trend: Higher is better
Statistical Method: Relative Distribution and Clustering
Improvement Measure: Not Included
Weighting Category: Process Measure
Weighting Value: 1
Data Display: Percentage with no decimal point
Reporting Requirements: 1876 Cost
Local, E-Local & Regional CCP w/o SNP
Local, E-Local & Regional CCP with SNP MSA
E-PDP & PDP
E-PFFS & PFFS
Yes Yes Yes No Yes Yes
4-Star Threshold: MA-PD: Not predetermined, PDP: Not predetermined
Cut Points: Available in plan preview 2

DRAFT DRAFT
(Last Updated 08/09/2012) DRAFT Page 49
Domain: 2 - Member Complaints, Problems Getting Services, and Improvement in the Drug Plan’s Performance
Measure: D06 - Complaints about the Drug Plan
Label for Stars: Complaints about the Drug Plan (more stars are better because it means fewer complaints)
Label for Data: Complaints about the Drug Plan (for every 1,000 members) (lower numbers are better because it means fewer complaints)
Description: How many complaints Medicare received about the drug plan.
Metric: Rate of complaints about the health plan per 1,000 members. For each contract, this rate is calculated as: ((Total number of all complaints logged into the CTM / (Average Contract enrollment) * 1,000 * 30) / (Number of Days in Period). • Enrollment numbers used to calculate the complaint rate were based on the average enrollment for the time period measured for each contract. • A contract‘s failure to follow CMS‘ CTM Standard Operating Procedures will not result in CMS‘ adjustment of the data used for these measures.
Exclusions: Some complaints that cannot be clearly attributed to the plan are excluded, please see Attachment B: Complaints Tracking Module Exclusion List. Complaint rates are not calculated for plans with enrollment less than 800 beneficiaries.
Data Source: CTM
Data Source Description: Data were obtained from the CTM based on the contract entry date (the date that complaints are assigned or re-assigned to contracts; also known as the contract assignment/reassignment date) for the reporting period specified. Complaint rates per 1,000 enrollees are adjusted to a 30-day basis.
CMS Framework Area: Person- and caregiver- centered experience and outcomes
NQF #: None
Data Time Frame: 01/01/2012 - 06/30/2012
General Trend: Lower is better
Statistical Method: Relative Distribution and Clustering
Improvement Measure: Included
Weighting Category: Patients‘ Experience and Complaints Measure
Weighting Value: 1.5
Data Display: Rate with 2 decimal points
Reporting Requirements: 1876 Cost
Local, E-Local & Regional CCP w/o SNP
Local, E-Local & Regional CCP with SNP MSA
E-PDP & PDP
E-PFFS & PFFS
Yes Yes Yes No Yes Yes
4-Star Threshold: MA-PD: Not predetermined, PDP: Not predetermined
Cut Points: Available in plan preview 2
Measure: D07 - Beneficiary Access and Performance Problems
Label for Stars: Problems Medicare Found in Members‘ Access to Services and in the Plan‘s Performance (more stars are better because it means fewer serious problems)
Label for Data: Problems Medicare Found in Members‘ Access to Services and in the Plan‘s Performance (on a scale from 0 to 100, higher numbers are better because it means fewer problems)
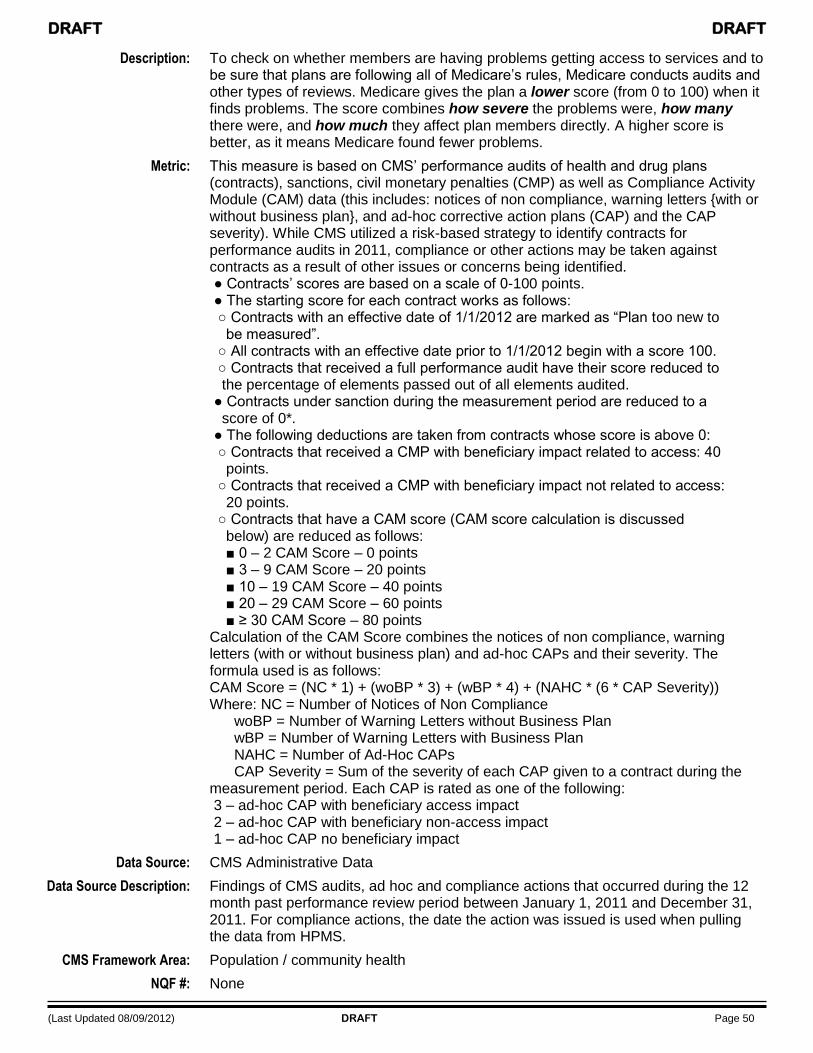
DRAFT DRAFT
(Last Updated 08/09/2012) DRAFT Page 50
Description: To check on whether members are having problems getting access to services and to be sure that plans are following all of Medicare‘s rules, Medicare conducts audits and other types of reviews. Medicare gives the plan a lower score (from 0 to 100) when it finds problems. The score combines how severe the problems were, how many there were, and how much they affect plan members directly. A higher score is better, as it means Medicare found fewer problems.
Metric: This measure is based on CMS‘ performance audits of health and drug plans (contracts), sanctions, civil monetary penalties (CMP) as well as Compliance Activity Module (CAM) data (this includes: notices of non compliance, warning letters {with or without business plan}, and ad-hoc corrective action plans (CAP) and the CAP severity). While CMS utilized a risk-based strategy to identify contracts for performance audits in 2011, compliance or other actions may be taken against contracts as a result of other issues or concerns being identified. ● Contracts‘ scores are based on a scale of 0-100 points. ● The starting score for each contract works as follows: ○ Contracts with an effective date of 1/1/2012 are marked as ―Plan too new to be measured‖. ○ All contracts with an effective date prior to 1/1/2012 begin with a score 100. ○ Contracts that received a full performance audit have their score reduced to the percentage of elements passed out of all elements audited. ● Contracts under sanction during the measurement period are reduced to a score of 0*. ● The following deductions are taken from contracts whose score is above 0: ○ Contracts that received a CMP with beneficiary impact related to access: 40 points. ○ Contracts that received a CMP with beneficiary impact not related to access: 20 points. ○ Contracts that have a CAM score (CAM score calculation is discussed below) are reduced as follows: ■ 0 – 2 CAM Score – 0 points ■ 3 – 9 CAM Score – 20 points ■ 10 – 19 CAM Score – 40 points ■ 20 – 29 CAM Score – 60 points ■ ≥ 30 CAM Score – 80 points Calculation of the CAM Score combines the notices of non compliance, warning letters (with or without business plan) and ad-hoc CAPs and their severity. The formula used is as follows: CAM Score = (NC * 1) + (woBP * 3) + (wBP * 4) + (NAHC * (6 * CAP Severity)) Where: NC = Number of Notices of Non Compliance woBP = Number of Warning Letters without Business Plan wBP = Number of Warning Letters with Business Plan NAHC = Number of Ad-Hoc CAPs CAP Severity = Sum of the severity of each CAP given to a contract during the measurement period. Each CAP is rated as one of the following: 3 – ad-hoc CAP with beneficiary access impact 2 – ad-hoc CAP with beneficiary non-access impact 1 – ad-hoc CAP no beneficiary impact
Data Source: CMS Administrative Data
Data Source Description: Findings of CMS audits, ad hoc and compliance actions that occurred during the 12 month past performance review period between January 1, 2011 and December 31, 2011. For compliance actions, the date the action was issued is used when pulling the data from HPMS.
CMS Framework Area: Population / community health
NQF #: None

DRAFT DRAFT
(Last Updated 08/09/2012) DRAFT Page 51
Data Time Frame: 01/01/2011 - 12/31/2011
General Trend: Higher is better
Statistical Method: Relative Distribution and Clustering
Improvement Measure: Not Included
Weighting Category: Measures Capturing Access
Weighting Value: 1.5
Data Display: Rate with no decimal point
Reporting Requirements: 1876 Cost
Local, E-Local & Regional CCP w/o SNP
Local, E-Local & Regional CCP with SNP MSA
E-PDP & PDP
E-PFFS & PFFS
Yes Yes Yes No Yes Yes
4-Star Threshold: MA-PD: Not predetermined, PDP: Not predetermined
Cut Points: Available in plan preview 2
Measure: D08 - Members Choosing to Leave the Plan
Label for Stars: Members Choosing to Leave the Plan (more stars are better because it means fewer members are choosing to leave the plan)
Label for Data: Members Choosing to Leave the Plan (lower percentages are better because it means fewer members choose to leave the plan)
Description: The percent of plan members who chose to leave the plan in 2011. (This does not include members who did not choose to leave the plan, such as members who moved out of the service area.)
Metric: The percent of members who chose to leave the plan come from disenrollment reason codes in Medicare‘s enrollment system. The percent is calculated as the number of members who chose to leave the plan between January 1, 2011–December 31, 2011 divided by all members enrolled in the plan at any time during 2011.
Exclusions: Members who left their plan due to circumstances beyond their control (such as members who moved out of the service area, members affected by a service area reduction, PBP termination, LIS reassignments, employer group members and members who disenrolled due to the requirement that SNP disenroll disproportionate share member who do not meet the SNP criteria) are excluded from the numerator. Also members in PBPs that were granted special enrollment exceptions have been removed. The data for contracts with less than 1,000 enrollees are not reported in this measure.
General Notes: This measure includes members who disenrolled from the contract with the following disenrollment reason codes: 11 - Voluntary Disenrollment through plan, 13 - Disenrollment because of enrollment in another Plan, 14 - Retroactive or 99 - Other (not supplied by beneficiary).
Data Source: Medicare Beneficiary Database Suite of Systems
CMS Framework Area: Person- and caregiver- centered experience and outcomes
NQF #: None
Data Time Frame: 01/01/2011 - 12/31/2011
General Trend: Lower is better
Statistical Method: Relative Distribution and Clustering
Improvement Measure: Included
Weighting Category: Patients‘ Experience and Complaints Measure

DRAFT DRAFT
(Last Updated 08/09/2012) DRAFT Page 52
Weighting Value: 1.5
Data Display: Percentage with no decimal point
Reporting Requirements: 1876 Cost
Local, E-Local & Regional CCP w/o SNP
Local, E-Local & Regional CCP with SNP MSA
E-PDP & PDP
E-PFFS & PFFS
Yes Yes Yes No Yes Yes
4-Star Threshold: MA-PD: Not predetermined, PDP: Not predetermined
Cut Points: Available in plan preview 2
Measure: D09 - Improvement
Label for Stars: Improvement (if any) in the Drug Plan‘s Performance
Label for Data: Improvement (If any) in the Drug Plan‘s Performance
Description: This shows how much the drug plan‘s performance has improved or declined from one year to the next year.
To calculate the plan‘s improvement rating, Medicare compares the plan‘s previous scores to its current scores for all of the topics shown on this Web site. Then Medicare averages the results to give the plan its improvement rating.
If a plan receives 1 or 2 stars, it means, on average, the plan‘s scores have declined (gotten worse).
If a plan receives 3 stars, it means, on average, the plan‘s scores have stayed about the same.
If a plan receives 4 or 5 stars, it means, on average, the plan‘s scores have improved.
Keep in mind that a plan that is already doing well in most areas may not show much improvement. It is also possible that a plan can start with low ratings, show a lot of improvement, and still not be performing very well.
Metric: The numerator is the net improvement which is a sum of the number of significantly improved measures minus the number of significantly declined measures. The denominator is the number of measures eligible for the improvement measure (i.e, the measures that were included in the 2012 and 2013 Plan Ratings for this contract and had no specification changes).
Exclusions: Contracts must have data in at least half of the measures used to calculate improvement to be rated in this measure.
General Notes: Attachment I contains the formulas used to calculate the improvement measure and lists indicating which measues were used.
Data Source: Plan Ratings
Data Source Description: 2012 and 2013 Plan Ratings
CMS Framework Area: Population / community health
NQF #: None
Data Time Frame: 01/01/2011 - 12/31/2011
General Trend: Higher is better
Statistical Method: Relative Distribution with Clustering
Improvement Measure: Not Included
Weighting Category: Outcome Measure

DRAFT DRAFT
(Last Updated 08/09/2012) DRAFT Page 53
Weighting Value: 1
Data Display: Not Applicable
Reporting Requirements: 1876 Cost
Local, E-Local & Regional CCP w/o SNP
Local, E-Local & Regional CCP with SNP MSA
E-PDP & PDP
E-PFFS & PFFS
Yes Yes Yes No Yes Yes
4-Star Threshold: MA-PD: Not predetermined, PDP: Not predetermined
Cut Points: Available in plan preview 2

DRAFT DRAFT
(Last Updated 08/09/2012) DRAFT Page 54
Domain: 3 - Member Experience with the Drug Plan
Measure: D10 - Getting Information From Drug Plan
Label for Stars: Drug Plan Provides Information or Help When Members Need It
Label for Data: Drug Plan Provides Information or Help When Members Need It
Description: The percent of the best possible score the plan earned on how easy it is for members to get information from the plan about prescription drug coverage and cost.
Metric: This case-mix adjusted measure is used to assess member satisfaction related to getting help from the drug plan. The Consumer Assessment of Healthcare Providers and Systems (CAHPS) score uses the mean of the distribution of responses. The mean is converted into the percentage of maximum points possible. The score shown is the percentage of the best possible score each contract earned.
General Notes: CAHPS Survey results were sent to each contract's Medicare Compliance Officer in early August 2012. These reports provide further explanation of the CAHPS scoring methodology and provide detailed information on why a specific rating was assigned.
Data Source: CAHPS
Data Source Description: CAHPS Survey Questions (question numbers vary depending on survey type): • In the last 6 months, how often did your health plan‘s customer service give you the information or help you needed about prescription drugs? • In the last 6 months, how often did your plan's customer service staff treat you with courtesy and respect when you tried to get information or help about prescription drugs? • In the last 6 months, how often did your health plan give you all the information you needed about which prescription medicines were covered? • In the last 6 months, how often did your health plan give you all the information you needed about how much you would have to pay for your prescription medicine?
CMS Framework Area: Person- and caregiver- centered experience and outcomes
NQF #: None
Data Time Frame: 02/15/2012 - 06/15/2012
General Trend: Higher is better
Statistical Method: Relative Distribution and Significance Testing
Improvement Measure: Included
Weighting Category: Patients‘ Experience and Complaints Measure
Weighting Value: 1.5
Data Display: Percentage with no decimal point
Reporting Requirements: 1876 Cost
Local, E-Local & Regional CCP w/o SNP
Local, E-Local & Regional CCP with SNP MSA
E-PDP & PDP
E-PFFS & PFFS
Yes Yes Yes No Yes Yes
4-Star Threshold: MA-PD: ≥ 82%, PDP: ≥ 80%
Cut Points: Available in plan preview 2
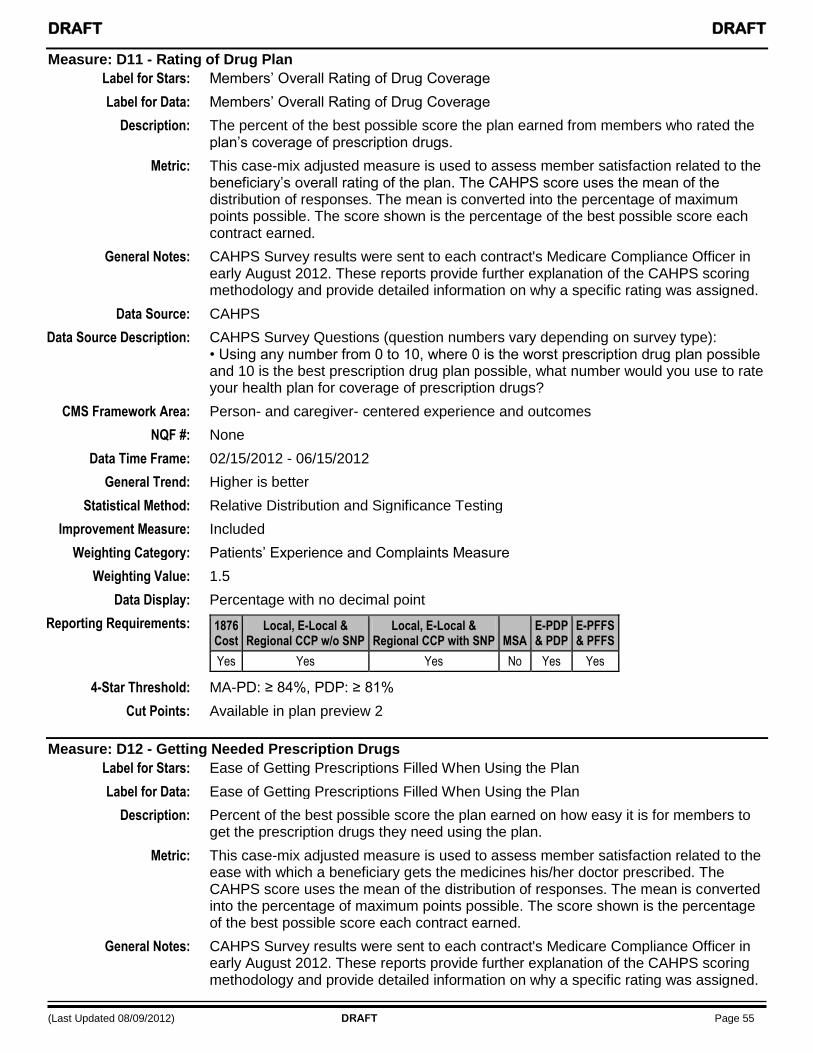
DRAFT DRAFT
(Last Updated 08/09/2012) DRAFT Page 55
Measure: D11 - Rating of Drug Plan
Label for Stars: Members‘ Overall Rating of Drug Coverage
Label for Data: Members‘ Overall Rating of Drug Coverage
Description: The percent of the best possible score the plan earned from members who rated the plan‘s coverage of prescription drugs.
Metric: This case-mix adjusted measure is used to assess member satisfaction related to the beneficiary‘s overall rating of the plan. The CAHPS score uses the mean of the distribution of responses. The mean is converted into the percentage of maximum points possible. The score shown is the percentage of the best possible score each contract earned.
General Notes: CAHPS Survey results were sent to each contract's Medicare Compliance Officer in early August 2012. These reports provide further explanation of the CAHPS scoring methodology and provide detailed information on why a specific rating was assigned.
Data Source: CAHPS
Data Source Description: CAHPS Survey Questions (question numbers vary depending on survey type): • Using any number from 0 to 10, where 0 is the worst prescription drug plan possible and 10 is the best prescription drug plan possible, what number would you use to rate your health plan for coverage of prescription drugs?
CMS Framework Area: Person- and caregiver- centered experience and outcomes
NQF #: None
Data Time Frame: 02/15/2012 - 06/15/2012
General Trend: Higher is better
Statistical Method: Relative Distribution and Significance Testing
Improvement Measure: Included
Weighting Category: Patients‘ Experience and Complaints Measure
Weighting Value: 1.5
Data Display: Percentage with no decimal point
Reporting Requirements: 1876 Cost
Local, E-Local & Regional CCP w/o SNP
Local, E-Local & Regional CCP with SNP MSA
E-PDP & PDP
E-PFFS & PFFS
Yes Yes Yes No Yes Yes
4-Star Threshold: MA-PD: ≥ 84%, PDP: ≥ 81%
Cut Points: Available in plan preview 2
Measure: D12 - Getting Needed Prescription Drugs
Label for Stars: Ease of Getting Prescriptions Filled When Using the Plan
Label for Data: Ease of Getting Prescriptions Filled When Using the Plan
Description: Percent of the best possible score the plan earned on how easy it is for members to get the prescription drugs they need using the plan.
Metric: This case-mix adjusted measure is used to assess member satisfaction related to the ease with which a beneficiary gets the medicines his/her doctor prescribed. The CAHPS score uses the mean of the distribution of responses. The mean is converted into the percentage of maximum points possible. The score shown is the percentage of the best possible score each contract earned.
General Notes: CAHPS Survey results were sent to each contract's Medicare Compliance Officer in early August 2012. These reports provide further explanation of the CAHPS scoring methodology and provide detailed information on why a specific rating was assigned.

DRAFT DRAFT
(Last Updated 08/09/2012) DRAFT Page 56
Data Source: CAHPS
Data Source Description: CAHPS Survey Questions (question numbers vary depending on survey type): • In the last 6 months, how often was it easy to use your health plan to get the medicines your doctor prescribed? • In the last 6 months, how often was it easy to use your health plan to fill a prescription at a local pharmacy? • In the last 6 months, how often was it easy to use your health plan to fill prescriptions by mail?
CMS Framework Area: Person- and caregiver- centered experience and outcomes
NQF #: None
Data Time Frame: 02/15/2012 - 06/15/2012
General Trend: Higher is better
Statistical Method: Relative Distribution and Significance Testing
Improvement Measure: Included
Weighting Category: Patients‘ Experience and Complaints Measure
Weighting Value: 1.5
Data Display: Percentage with no decimal point
Reporting Requirements: 1876 Cost
Local, E-Local & Regional CCP w/o SNP
Local, E-Local & Regional CCP with SNP MSA
E-PDP & PDP
E-PFFS & PFFS
Yes Yes Yes No Yes Yes
4-Star Threshold: MA-PD: ≥ 91%, PDP: ≥ 89%
Cut Points: Available in plan preview 2

DRAFT DRAFT
(Last Updated 08/09/2012) DRAFT Page 57
Domain: 4 - Patient Safety and Accuracy of Drug Pricing
Measure: D13 - MPF Price Accuracy
Label for Stars: Plan Provides Accurate Drug Pricing Information for This Website
Label for Data: Plan Provides Accurate Drug Pricing Information for This Website
Description: A score comparing the prices members actually pay for their drugs to the drug prices the plan provided for this Web site (Medicare‘s Plan Finder Website). (Higher scores are better because they mean the plan provided more accurate prices.)
Metric: This measure evaluates the accuracy of drug prices posted on the MPF tool. A contract‘s score is based on the accuracy index. The accuracy price index compares point-of-sale PDE prices to plan-reported MPF prices and determines the magnitude of differences found. Using each PDE‘s date of service, the price displayed on MPF is compared to the PDE price. The accuracy index considers both ingredient cost and dispensing fee and measures the amount that the PDE price is higher than the MPF price. Therefore, prices that are overstated on MPF—that is, the reported price is higher than the actual price—will not count against a plan‘s accuracy score. The index is computed as: (Total amount that PDE is higher than PF + Total PDE cost)/(Total PDE cost). The best possible accuracy index is 1. An index of 1 indicates that a plan did not have PDE prices greater than MPF prices. A contract‘s score is computed using its accuracy index as: 100 – ((accuracy index - 1) x 100).
Exclusions: A contract must have at least 30 claims over the year for the price accuracy index. PDEs must also meet the following criteria: • Pharmacy number on PDE must appear in MPF pharmacy cost file • Drug must appear in formulary file and in MPF pricing file • PDE must be for retail and/or specialty pharmacy • PDE must be a 30 day supply • Date of service must occur at a time that data are not suppressed for the plan on MPF • PDE must not be a compound claim • PDE must not be a non-covered drug
General Notes: Contracts receive only 3, 4 or 5 stars in this measure, due to the distribution of the data.
Data Source: PDE data, MPF Pricing Files, HPMS approved formulary extracts, and data from First DataBank and Medispan
Data Source Description: Data Source: Data were obtained from a number of sources: PDE data, MPF Pricing Files, HPMS approved formulary extracts. Post-reconciliation PDE adjustments are not reflected in this measure.
CMS Framework Area: Efficiency and cost reduction
NQF #: None
Data Time Frame: 01/01/2011 - 09/30/2011
General Trend: Higher is better
Statistical Method: Relative Distribution and Clustering
Improvement Measure: Not Included
Weighting Category: Process Measure
Weighting Value: 1
Data Display: Rate with no decimal point

DRAFT DRAFT
(Last Updated 08/09/2012) DRAFT Page 58
Reporting Requirements: 1876 Cost
Local, E-Local & Regional CCP w/o SNP
Local, E-Local & Regional CCP with SNP MSA
E-PDP & PDP
E-PFFS & PFFS
Yes Yes Yes No Yes Yes
4-Star Threshold: MA-PD: Not predetermined, PDP: Not predetermined
Cut Points: Available in plan preview 2
Measure: D14 - High Risk Medication
Label for Stars: Plan Members 65 and Older Who Received Prescriptions for Certain Drugs with a High Risk of Side Effects, When There May Be Safer Drug Choices
Label for Data: Plan Members 65 and Older Who Received Prescriptions for Certain Drugs with a High Risk of Side Effects, When There May Be Safer Drug Choices
Description: The percent of plan members who got prescriptions for certain drugs with a high risk of serious side effects, when there may be safer drug choices.
Metric: This measure calculates the percentage of Medicare Part D beneficiaries 65 years or older who received two or more prescription fills for a drug with a high risk of serious side effects in the elderly. This percentage is calculated as: [(Number of member-years of enrolled beneficiaries 65 years or older who received two or more prescription fills for an HRM during the period measured)/ (Number of member-years of enrolled beneficiaries 65 years and older during the period measured)]. This measure, also named the High Risk Medication measure (HRM), was first developed by the National Committee for Quality Assurance (NCQA), through its Healthcare Effectiveness Data and Information Set (HEDIS), and then adapted and endorsed by the Pharmacy Quality Alliance (PQA). This measure is also endorsed by the National Quality Forum (NQF). See the medication list for this measure. The HRM rate is calculated using the NDC lists maintained by the PQA. The complete National Drug Code (NDC) lists are posted along with these technical notes. The updated PQA HRM measure drug list based upon the new American Geriatrics Society (AGS) recommendations will not used to calculate the 2013 Plan Rating.
Exclusions: A percentage is not calculated for contracts with 30 or fewer enrolled beneficiary member years (in the denominator)
General Notes: Part D drugs do not include drugs or classes of drugs, or their medical uses, which may be excluded from coverage or otherwise restricted under section 1927(d)(2) of the Act, except for smoking cessation agents. As such, these drugs, which may be included in the medication or NDC lists, are excluded from CMS analyses. Also, member-years of enrollment is the adjustment made by CMS to account for enrollment for only part of the benefit year. For instance, if a beneficiary is enrolled for six out of twelve months of the year, s/he will count as only 0.5 member-years in the rate calculation.
Data Source: Prescription Drug Event (PDE) data
Data Source Description: The data for this measure come from PDE data files submitted by drug plans to Medicare for January 1, 2011-December 31, 2011 by June 30, 2012. Only final action PDE claims are used to calculate the patient safety measures. PDE claims are limited to members over 65 years of age, and for those Part D covered drugs identified to have high risk of serious side effects in patients 65 years of age or older. PDE adjustments made post-reconciliation were not reflected in this measure.
CMS Framework Area: Safety
NQF #: 0022
Data Time Frame: 01/01/2011 - 12/31/2011

DRAFT DRAFT
(Last Updated 08/09/2012) DRAFT Page 59
General Trend: Lower is better
Statistical Method: Relative Distribution and Clustering
Improvement Measure: Not Included
Weighting Category: Intermediate Outcome Measures
Weighting Value: 3
Data Display: Percentage with 1 decimal point
Reporting Requirements: 1876 Cost
Local, E-Local & Regional CCP w/o SNP
Local, E-Local & Regional CCP with SNP MSA
E-PDP & PDP
E-PFFS & PFFS
Yes Yes Yes No Yes Yes
4-Star Threshold: MA-PD: Not predetermined, PDP: Not predetermined
Cut Points: Available in plan preview 2
Measure: D15 - Diabetes Treatment
Label for Stars: Using the Kind of Blood Pressure Medication That Is Recommended for People with Diabetes
Label for Data: Using the Kind of Blood Pressure Medication That Is Recommended for People with Diabetes
Description: When people with diabetes also have high blood pressure, there are certain types of blood pressure medication recommended. This tells what percent got one of the recommended types of blood pressure medicine.
Metric: This is defined as the percentage of Medicare Part D beneficiaries who were dispensed a medication for diabetes and a medication for hypertension whose treatment included a renin angiotensin system (RAS) antagonist (an angiotensin converting enzyme inhibitor (ACEI), angiotensin receptor blocker (ARB), or direct renin inhibitor) medication which are recommended for people with diabetes. This percentage is calculated as: [(Number of member-years of enrolled beneficiaries from eligible population who received a RAS antagonist medication during period measured)/ (Number of member-years of enrolled beneficiaries in period measured who were dispensed at least one prescription for an oral hypoglycemic agent or insulin and at least one prescription for an antihypertensive agent during the measurement period)]. The Diabetes Treatment measure is adapted from the Diabetes: Appropriate Treatment for Hypertension measure endorsed by the Pharmacy Quality Alliance (PQA). Initially, this PQA measure was the Diabetes Suboptimal Treatment measure. The measure was submitted to the National Quality Forum for review by their Medication Management Steering Committee. The NQF Consensus Standards Committee endorsed this measure in July 2009. See the medication list for this measure. The Diabetes Treatment rate is calculated using the National Drug Code (NDC) lists maintained by the PQA. The complete NDC lists will be posted along with these technical notes.
Exclusions: A percentage is not calculated for contracts with 30 or fewer beneficiary member years (in the denominator).
General Notes: Part D drugs do not include drugs or classes of drugs, or their medical uses, which may be excluded from coverage or otherwise restricted under section 1927(d)(2) of the Act, except for smoking cessation agents. As such, these drugs, which may be included in the medication or NDC lists, are excluded from CMS analyses. Also, member-years of enrollment is the adjustment made by CMS to account for enrollment for only part of the benefit year. For instance, if a beneficiary is enrolled for six out of twelve months of the year, s/he will count as only 0.5 member-years in the rate calculation.

DRAFT DRAFT
(Last Updated 08/09/2012) DRAFT Page 60
Data Source: Prescription Drug Event (PDE) data
Data Source Description: The data for this measure come from PDE data files submitted by drug plans to Medicare for January 1, 2011-December 31, 2011 by June 30, 2012. Only final action PDE claims are used to calculate the patient safety measures. PDE claims were limited to members who received at least one prescription for an oral diabetes drug or insulin and at least one prescription for a high blood pressure drug. Members who received a RAS antagonist medication were identified. PDE adjustments made post-reconciliation were not reflected in this measure.
CMS Framework Area: Clinical care
NQF #: 0546
Data Time Frame: 01/01/2011 - 12/31/2011
General Trend: Higher is better
Statistical Method: Relative Distribution and Clustering
Improvement Measure: Included
Weighting Category: Intermediate Outcome Measures
Weighting Value: 3
Data Display: Percentage with 1 decimal point
Reporting Requirements: 1876 Cost
Local, E-Local & Regional CCP w/o SNP
Local, E-Local & Regional CCP with SNP MSA
E-PDP & PDP
E-PFFS & PFFS
Yes Yes Yes No Yes Yes
4-Star Threshold: MA-PD: ≥ 86%, PDP: ≥ 83%
Cut Points: Available in plan preview 2
Measure: D16 - Part D Medication Adherence for Oral Diabetes Medications
Label for Stars: Taking Oral Diabetes Medication as Directed
Label for Data: Taking Oral Diabetes Medication as Directed
Description: One of the most important ways you can manage your health is by taking your medication as directed. The plan, the doctor, and the member can work together to find ways to help the member take their medication as directed. Percent of plan members with a prescription for oral diabetes medication who fill their prescription often enough to cover 80% or more of the time they are supposed to be taking the medication. (―Oral diabetes medication‖ means a biguanide drug, a sulfonylurea drug, a thiazolidinedione drug, or a DPP-IV inhibitor. Plan members who take insulin are not included.)
Metric: This measure is defined as the percent of Medicare Part D beneficiaries 18 years or older who adhere to their prescribed drug therapy across four classes of oral diabetes medications: biguanides, sulfonylureas, thiazolidinediones, and DiPeptidyl Peptidase (DPP)-IV Inhibitors. This percentage is calculated as: [(Number of member-years of enrolled beneficiaries 18 years or older with a proportion of days covered (PDC) at 80 percent or over across the classes of oral diabetes medications during the measurement period.)/ (Number of member-years of enrolled beneficiaries 18 years or older with at least two fills of medication(s) across any of the drug classes during the measurement period.)] The PDC is the percent of days in the measurement period ―covered‖ by prescription claims for the same medication or medications in its therapeutic category. Beneficiaries with one of more fills for insulin in the measurement period are excluded. Patients are only included in the measure calculation if the first fill of their medication occurs at least 91 days before the end of the enrollment period.

DRAFT DRAFT
(Last Updated 08/09/2012) DRAFT Page 61
The Part D Medication Adherence measure is adapted from the Medication Adherence-Proportion of Days Covered measure which was developed and endorsed by the Pharmacy Quality Alliance (PQA). The measure was submitted to the National Quality Forum for review by their Medication Management Steering Committee. The NQF Consensus Standards Committee endorsed this measure in July 2009 as a ―time-limited endorsed measure‖. In September 2011, the NQF Consensus Standards Committee removed the ―time-limited endorsed‖ label and fully endorsed the PDC Adherence measures. See the medication list for this measure. The Part D Medication Adherence rate is calculated using the National Drug Code (NDC) lists maintained by the PQA. The complete NDC lists will be posted along with these technical notes.
Exclusions: A percentage is not calculated for contracts with 30 or fewer beneficiary member years (in the denominator).
General Notes: Part D drugs do not include drugs or classes of drugs, or their medical uses, which may be excluded from coverage or otherwise restricted under section 1927(d)(2) of the Act, except for smoking cessation agents. As such, these drugs, which may be included in the medication or NDC lists, are excluded from CMS analyses. Also, member-years of enrollment is the adjustment made by CMS to account for enrollment for only part of the benefit year. For instance, if a beneficiary is enrolled for six out of twelve months of the year, s/he will count as only 0.5 member-years in the rate calculation. The calculation accounts for Part D beneficiaries‘ stays in inpatient (IP) settings.
Data Source: Prescription Drug Event (PDE) data; Inpatient (IP) Data File
Data Source Description: The data for this measure come from PDE data files submitted by drug plans to Medicare for January 1, 2011-December 31, 2011 by June 30, 2012. Only final action PDE claims are used to calculate the patient safety measures. PDE claims are limited to members who received at least two prescriptions for oral diabetes medication(s). PDE adjustments made post-reconciliation were not reflected in this measure.
CMS Framework Area: Clinical care
NQF #: 0541
Data Time Frame: 01/01/2011 - 12/31/2011
General Trend: Higher is better
Statistical Method: Relative Distribution and Clustering
Improvement Measure: Included
Weighting Category: Intermediate Outcome Measures
Weighting Value: 3
Data Display: Percentage with 1 decimal point
Reporting Requirements: 1876 Cost
Local, E-Local & Regional CCP w/o SNP
Local, E-Local & Regional CCP with SNP MSA
E-PDP & PDP
E-PFFS & PFFS
Yes Yes Yes No Yes Yes
4-Star Threshold: MA-PD: Not predetermined, PDP: Not predetermined
Cut Points: Available in plan preview 2
Measure: D17 - Part D Medication Adherence for Hypertension (RAS antagonists)
Label for Stars: Taking Blood Pressure Medication as Directed
Label for Data: Taking Blood Pressure Medication as Directed
Description: One of the most important ways you can manage your health is by taking your medication as directed. The plan, the doctor, and the member can work together to

DRAFT DRAFT
(Last Updated 08/09/2012) DRAFT Page 62
find ways to help the member take their medication as directed. Percent of plan members with a prescription for a blood pressure medication who fill their prescription often enough to cover 80% or more of the time they are supposed to be taking the medication. (―Blood pressure medication‖ means an ACE (angiotensin converting enzyme) inhibitor, an ARB (angiotensin receptor blocker), or a direct renin inhibitor drug.)
Metric: This measure is defined as the percent of Medicare Part D beneficiaries 18 years or older who adhere to their prescribed drug therapy for renin angiotensin system (RAS) antagonists (angiotensin converting enzyme inhibitor (ACEI), angiotensin receptor blocker (ARB), or direct renin inhibitor medications). This percentage is calculated as: [(Number of member-years of enrolled beneficiaries 18 years and older with a proportion of days covered (PDC) at 80 percent or over for RAS antagonist medications during the measurement period) / (Number of member-years of enrolled beneficiaries 18 years or older with at least two fills of either the same medication or medications in the drug class during the measurement period.)] The PDC is the percent of days in the measurement period ―covered‖ by prescription claims for the same medication or another in its therapeutic category. Patients are only included in the measure calculation if the first fill of their medication occurs at least 91 days before the end of the enrollment period. The Part D Medication Adherence measure is adapted from the Medication Adherence-Proportion of Days Covered measure which was developed and endorsed by the Pharmacy Quality Alliance (PQA). The measure was submitted to the National Quality Forum for review by their Medication Management Steering Committee. The NQF Consensus Standards Committee endorsed this measure in July 2009 as a ―time-limited endorsed measure‖. In September 2011, the NQF Consensus Standards Committee removed the ―time-limited endorsed‖ label and fully endorsed the PDC Adherence measures. See the medication list for this measure. The Part D Medication Adherence rate is calculated using the National Drug Code (NDC) lists maintained by the PQA. The complete NDC lists will be posted along with these technical notes.
Exclusions: A percentage is not calculated for contracts with 30 or fewer beneficiary member years (in the denominator).
General Notes: Part D drugs do not include drugs or classes of drugs, or their medical uses, which may be excluded from coverage or otherwise restricted under section 1927(d)(2) of the Act, except for smoking cessation agents. As such, these drugs, which may be included in the medication or NDC lists, are excluded from CMS analyses. Also, member-years of enrollment is the adjustment made by CMS to account for enrollment for only part of the benefit year. For instance, if a beneficiary is enrolled for six out of twelve months of the year, s/he will count as only 0.5 member-years in the rate calculation. The calculation accounts for Part D beneficiaries‘ stays in inpatient (IP) settings.
Data Source: Prescription Drug Event (PDE) data; Inpatient (IP) Data File
Data Source Description: The data for this measure come from PDE data files submitted by drug plans to Medicare for January 1, 2011-December 31, 2011 by June 30, 2012. Only final action PDE claims are used to calculate the patient safety measures. PDE claims are limited to members who received at least two prescriptions for RAS antagonist medication(s). PDE adjustments made post-reconciliation were not reflected in this measure.
CMS Framework Area: Clinical care
NQF #: 0541
Data Time Frame: 01/01/2011 - 12/31/2011
General Trend: Higher is better
Statistical Method: Relative Distribution and Clustering

DRAFT DRAFT
(Last Updated 08/09/2012) DRAFT Page 63
Improvement Measure: Included
Weighting Category: Intermediate Outcome Measures
Weighting Value: 3
Data Display: Percentage with 1 decimal point
Reporting Requirements: 1876 Cost
Local, E-Local & Regional CCP w/o SNP
Local, E-Local & Regional CCP with SNP MSA
E-PDP & PDP
E-PFFS & PFFS
Yes Yes Yes No Yes Yes
4-Star Threshold: MA-PD: Not predetermined, PDP: Not predetermined
Cut Points: Available in plan preview 2
Measure: D18 - Part D Medication Adherence for Cholesterol (Statins)
Label for Stars: Taking Cholesterol Medication as Directed
Label for Data: Taking Cholesterol Medication as Directed
Description: One of the most important ways you can manage your health is by taking your medication as directed. The plan, the doctor, and the member can work together to find ways to help the member take their medication as directed. Percent of plan members with a prescription for a cholesterol medication (a statin drug) who fill their prescription often enough to cover 80% or more of the time they are supposed to be taking the medication.
Metric: This measure is defined as the percent of Medicare Part D beneficiaries 18 years or older who adhere to their prescribed drug therapy for statin cholesterol medications. This percentage is calculated as: [(Number of member-years of enrolled beneficiaries 18 years of older with a proportion of days covered (PDC) at 80 percent or over for statin cholesterol medication(s) during the measurement period.)/ (Number of member-years of enrolled beneficiaries 18 years or older with at least two fills of either the same medication or medication in the drug class during the measurement period.)] The PDC is the percent of days in the measurement period ―covered‖ by prescription claims for the same medication or another in the therapeutic category. Patients are only included in the measure calculation if the first fill of their medication occurs at least 91 days before the end of the enrollment period. Only final action PDE claims are used to calculate the patient safety measures. The Part D Medication Adherence measure is adapted from the Medication Adherence-Proportion of Days Covered measure which was developed and endorsed by the Pharmacy Quality Alliance (PQA). The measure was submitted to the National Quality Forum for review by their Medication Management Steering Committee. The NQF Consensus Standards Committee endorsed this measure in July 2009 as a ―time-limited endorsed measure‖. In September 2011, the NQF Consensus Standards Committee removed the ―time-limited endorsed‖ label and fully endorsed the PDC Adherence measures. See the medication list for this measure. The Part D Medication Adherence rate is calculated using the National Drug Code (NDC) lists maintained by the PQA. The complete NDC lists will be posted along with these technical notes.
Exclusions: A percentage is not calculated for contracts with 30 or fewer beneficiary member years (in the denominator).
General Notes: Part D drugs do not include drugs or classes of drugs, or their medical uses, which may be excluded from coverage or otherwise restricted under section 1927(d)(2) of the Act, except for smoking cessation agents. As such, these drugs, which may be included in the medication or NDC lists, are excluded from CMS analyses. Also, member-years of enrollment is the adjustment made by CMS to account for

DRAFT DRAFT
(Last Updated 08/09/2012) DRAFT Page 64
enrollment for only part of the benefit year. For instance, if a beneficiary is enrolled for six out of twelve months of the year, s/he will count as only 0.5 member-years in the rate calculation. The calculation accounts for Part D beneficiaries‘ stays in inpatient (IP) settings.
Data Source: Prescription Drug Event (PDE) data; Inpatient (IP) Data File
Data Source Description: The data for this measure come from PDE data files submitted by drug plans to Medicare for January 1, 2011-December 31, 2011 by June 30, 2012. PDE claims are limited to members who received at least two prescriptions for a statin drug(s). PDE adjustments made post-reconciliation were not reflected in this measure.
CMS Framework Area: Clinical care
NQF #: 0541
Data Time Frame: 01/01/2011 - 12/31/2011
General Trend: Higher is better
Statistical Method: Relative Distribution and Clustering
Improvement Measure: Included
Weighting Category: Intermediate Outcome Measures
Weighting Value: 3
Data Display: Percentage with 1 decimal point
Reporting Requirements: 1876 Cost
Local, E-Local & Regional CCP w/o SNP
Local, E-Local & Regional CCP with SNP MSA
E-PDP & PDP
E-PFFS & PFFS
Yes Yes Yes No Yes Yes
4-Star Threshold: MA-PD: Not predetermined, PDP: Not predetermined
Cut Points: Available in plan preview 2
DRAFT DRAFT
(Last Updated 08/09/2012) DRAFT Page 65
Attachment A: CAHPS Case-Mix Adjustment
This attachment will be available in the 2nd plan preview.

DRAFT DRAFT
(Last Updated 08/09/2012) DRAFT Page 66
Attachment B: Complaints Tracking Module Exclusion List
Table B-1 contains the current exclusions applied to the CTM based on the revised categories and subcategories that became effective September 25, 2010.
Table B-1: Exclusions effective September 25, 2010
Category ID Category Description
Subcategory ID Subcategory Description
11 Enrollment/Disenrollment 16 Facilitated/Auto Enrollment issues
18 Enrollment Exceptions (EE)
13 Pricing/Co-Insurance 06 Beneficiary has lost LIS Status/Eligibility or was denied LIS
16 Part D IRMAA
30 Beneficiary Needs Assistance with Acquiring Medicaid Eligibility Information
01 Beneficiary Needs Assistance with Acquiring Medicaid Eligibility Information
90 Other Beneficiary Needs Assistance with Acquiring Medicaid Eligibility Information Issue
38 Contractor/Partner Performance 90 Other Contractor/Partner Performance
Note: Program Integrity complaints, which are in the CTM but not viewable by plans, are excluded as well.
Table B-2 contains the categories and subcategories that are excluded if they were entered into the CTM prior to current exclusion criteria.
Table B-2: Exclusions prior to September 25, 2010 Category
ID Category Description Subcategory
ID Subcategory Description
03 Enrollment/Disenrollment 06 Enrollment Exceptions (EE)
07 Retroactive Disenrollment (RD)
09 Enrollment Reconciliation - Dissatisfied with Decision
10 Retroactive Enrollment (RE)
12 Missing Medicaid/ Medicare Eligibility in MBD
05 Program Integrity Issues/Potential Fraud, Waste and Abuse
01 Program Integrity Issues/Potential Fraud, Waste and Abuse
10 Customer Service 12 Plan Website
11 Enrollment/ Disenrollment 16 Facilitated/Auto Enrollment Issues
17 Missing Medicaid/ Medicare Eligibility in MBD
18 Enrollment Exceptions (EE)
13 Pricing/Co-Insurance 06 Beneficiary has lost LIS Status/Eligibility or was denied LIS
08 Overcharged Premium Fees
14 Program Integrity Issues/Potential Fraud, Waste and Abuse
01 Program Integrity Issues/Potential Fraud, Waste and Abuse
24 Program Integrity Issues/Potential Fraud, Waste and Abuse
01 Program Integrity Issues/Potential Fraud, Waste and Abuse
32 Program Integrity Issues/Potential Fraud, Waste and Abuse
01 Program Integrity Issues/Potential Fraud, Waste and Abuse
34 Plan Administration 02 Plan Terminating Contract
38 Contractor/ Partner Performance 01 Quality Improvement Organization (QIO)
02 State Health Insurance Plans (SHIPs)
03 Social Security Administration (SSA)
04 1-800-Medicare
90 Other Contractor/ Partner Performance
41 Pricing/Co-Insurance 01 Premium Reconciliation - Refund or Billing Issue
03 Beneficiary Double Billed (both premium withhold and direct pay)
04 Premium Withhold Amount not going to Plan
05 Part B Premium Reduction Issue
90 Other Premium Withhold Issue
Note: Program Integrity Complaints, which are in the CTM but not viewable by plans, are excluded as well.

DRAFT DRAFT
(Last Updated 08/09/2012) DRAFT Page 67
Table B-3 contains the current exclusions applied to the CTM based on the revised categories and subcategories that became effective December 16, 2011.
Table B-3: Exclusions effective December 16, 2011 Category
ID Category Description Subcategory
ID Subcategory Description
26 Contractor/Partner Performance 90 Other Contractor/Partner Performance 44 Equitable Relief/Good Cause Requests 01 Good Cause - Disenrollment for Failure to Pay Premiums
90 Other Equitable Relief/Good Cause Request
45 Equitable Relief/Good Cause Requests 01 Good Cause - Disenrollment for Failure to Pay Premiums 02 Refund/Non-Receipt Part D IRMAA 03 Good Cause Part D IRMAA 04 Equitable Relief Part D IRMAA 90 Other Equitable Relief/Good Cause Request
49 Contractor/Partner Performance 90 Other Contractor/Partner Performance 50 Contractor/Partner Performance 90 Other Contractor/Partner Performance

DRAFT DRAFT
(Last Updated 08/09/2012) DRAFT Page 68
Attachment C: National Averages for Part C and D Measures
The tables below contain the average of the numeric and star values for each measure reported in the 2013 Plan Ratings.
Table C-1: National Averages for Part C Measures
Measure ID Measure Name Numeric Average Star Average
C01 Breast Cancer Screening Available in plan preview 2 Available in plan preview 2
C02 Colorectal Cancer Screening Available in plan preview 2 Available in plan preview 2
C03 Cardiovascular Care – Cholesterol Screening Available in plan preview 2 Available in plan preview 2
C04 Diabetes Care – Cholesterol Screening Available in plan preview 2 Available in plan preview 2
C05 Glaucoma Testing Available in plan preview 2 Available in plan preview 2
C06 Annual Flu Vaccine Available in plan preview 2 Available in plan preview 2
C07 Improving or Maintaining Physical Health Available in plan preview 2 Available in plan preview 2
C08 Improving or Maintaining Mental Health Available in plan preview 2 Available in plan preview 2
C09 Monitoring Physical Activity Available in plan preview 2 Available in plan preview 2
C10 Adult BMI Assessment Available in plan preview 2 Available in plan preview 2
C11 Care for Older Adults – Medication Review Available in plan preview 2 Available in plan preview 2
C12 Care for Older Adults – Functional Status Assessment Available in plan preview 2 Available in plan preview 2
C13 Care for Older Adults – Pain Screening Available in plan preview 2 Available in plan preview 2
C14 Osteoporosis Management in Women who had a Fracture Available in plan preview 2 Available in plan preview 2
C15 Diabetes Care – Eye Exam Available in plan preview 2 Available in plan preview 2
C16 Diabetes Care – Kidney Disease Monitoring Available in plan preview 2 Available in plan preview 2
C17 Diabetes Care – Blood Sugar Controlled Available in plan preview 2 Available in plan preview 2
C18 Diabetes Care – Cholesterol Controlled Available in plan preview 2 Available in plan preview 2
C19 Controlling Blood Pressure Available in plan preview 2 Available in plan preview 2
C20 Rheumatoid Arthritis Management Available in plan preview 2 Available in plan preview 2
C21 Improving Bladder Control Available in plan preview 2 Available in plan preview 2
C22 Reducing the Risk of Falling Available in plan preview 2 Available in plan preview 2
C23 Plan All-Cause Readmissions Available in plan preview 2 Available in plan preview 2
C24 Getting Needed Care Available in plan preview 2 Available in plan preview 2
C25 Getting Appointments and Care Quickly Available in plan preview 2 Available in plan preview 2
C26 Customer Service Available in plan preview 2 Available in plan preview 2
C27 Overall Rating of Health Care Quality Available in plan preview 2 Available in plan preview 2
C28 Overall Rating of Plan Available in plan preview 2 Available in plan preview 2
C29 Care Coordination Available in plan preview 2 Available in plan preview 2
C30 Complaints about the Health Plan Available in plan preview 2 Available in plan preview 2
C31 Beneficiary Access and Performance Problems Available in plan preview 2 Available in plan preview 2
C32 Members Choosing to Leave the Plan Available in plan preview 2 Available in plan preview 2
C33 Improvement Available in plan preview 2 Available in plan preview 2
C34 Plan Makes Timely Decisions about Appeals Available in plan preview 2 Available in plan preview 2
C35 Reviewing Appeals Decisions Available in plan preview 2 Available in plan preview 2
C36 Call Center – Foreign Language Interpreter and TTY/TDD Availability Available in plan preview 2 Available in plan preview 2
C37 Enrollment Timeliness Available in plan preview 2 Available in plan preview 2

DRAFT DRAFT
(Last Updated 08/09/2012) DRAFT Page 69
Table C-2: National Averages for Part D Measures
Measure ID Measure Name
MA-PD Numeric Average
MA-PD Star Average
PDP Numeric Average
PDP Star Average
D01 Call Center – Pharmacy Hold Time Available in plan preview 2
Available in plan preview 2
Available in plan preview 2
Available in plan preview 2
D02 Call Center – Foreign Language Interpreter and TTY/TDD Availability
Available in plan preview 2
Available in plan preview 2
Available in plan preview 2
Available in plan preview 2
D03 Appeals Auto–Forward Available in plan preview 2
Available in plan preview 2
Available in plan preview 2
Available in plan preview 2
D04 Appeals Upheld Available in plan preview 2
Available in plan preview 2
Available in plan preview 2
Available in plan preview 2
D05 Enrollment Timeliness Available in plan preview 2
Available in plan preview 2
Available in plan preview 2
Available in plan preview 2
D06 Complaints about the Drug Plan Available in plan preview 2
Available in plan preview 2
Available in plan preview 2
Available in plan preview 2
D07 Beneficiary Access and Performance Problems Available in plan preview 2
Available in plan preview 2
Available in plan preview 2
Available in plan preview 2
D08 Members Choosing to Leave the Plan Available in plan preview 2
Available in plan preview 2
Available in plan preview 2
Available in plan preview 2
D09 Improvement Available in plan preview 2
Available in plan preview 2
Available in plan preview 2
Available in plan preview 2
D10 Getting Information From Drug Plan Available in plan preview 2
Available in plan preview 2
Available in plan preview 2
Available in plan preview 2
D11 Rating of Drug Plan Available in plan preview 2
Available in plan preview 2
Available in plan preview 2
Available in plan preview 2
D12 Getting Needed Prescription Drugs Available in plan preview 2
Available in plan preview 2
Available in plan preview 2
Available in plan preview 2
D13 MPF Price Accuracy Available in plan preview 2
Available in plan preview 2
Available in plan preview 2
Available in plan preview 2
D14 High Risk Medication Available in plan preview 2
Available in plan preview 2
Available in plan preview 2
Available in plan preview 2
D15 Diabetes Treatment Available in plan preview 2
Available in plan preview 2
Available in plan preview 2
Available in plan preview 2
D16 Part D Medication Adherence for Oral Diabetes Medications
Available in plan preview 2
Available in plan preview 2
Available in plan preview 2
Available in plan preview 2
D17 Part D Medication Adherence for Hypertension (RAS antagonists)
Available in plan preview 2
Available in plan preview 2
Available in plan preview 2
Available in plan preview 2
D18 Part D Medication Adherence for Cholesterol (Statins) Available in plan preview 2
Available in plan preview 2
Available in plan preview 2
Available in plan preview 2
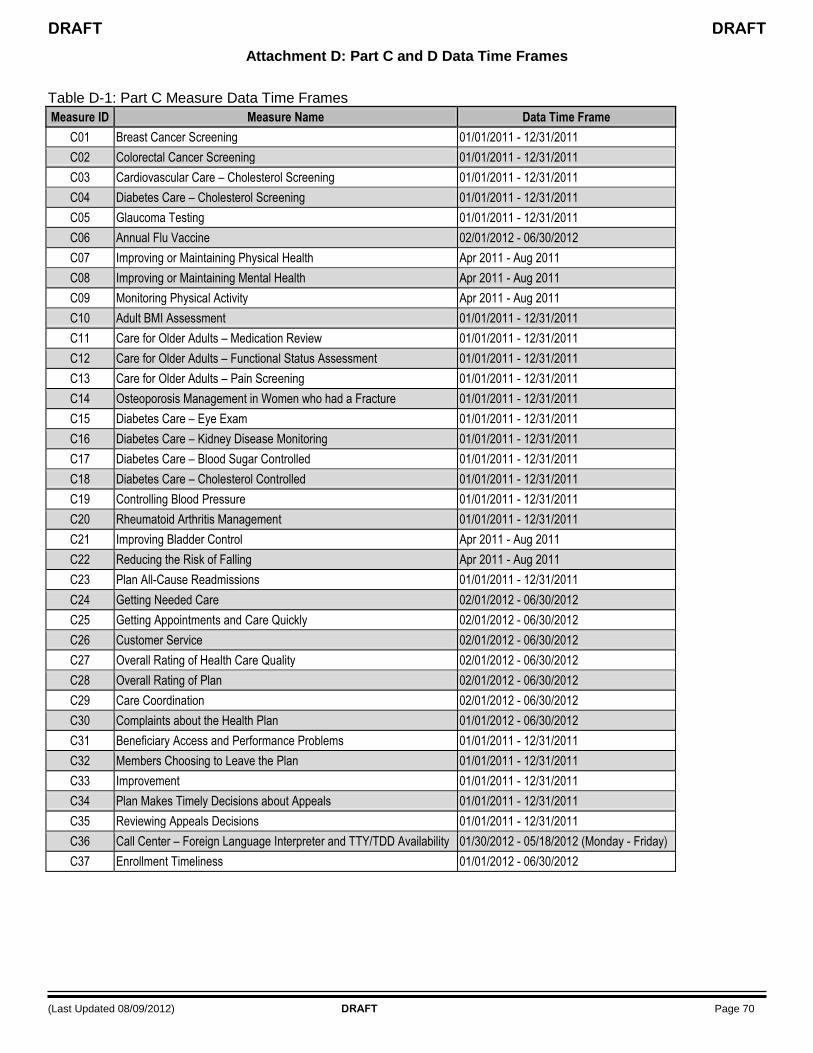
DRAFT DRAFT
(Last Updated 08/09/2012) DRAFT Page 70
Attachment D: Part C and D Data Time Frames
Table D-1: Part C Measure Data Time Frames
Measure ID Measure Name Data Time Frame
C01 Breast Cancer Screening 01/01/2011 - 12/31/2011
C02 Colorectal Cancer Screening 01/01/2011 - 12/31/2011
C03 Cardiovascular Care – Cholesterol Screening 01/01/2011 - 12/31/2011
C04 Diabetes Care – Cholesterol Screening 01/01/2011 - 12/31/2011
C05 Glaucoma Testing 01/01/2011 - 12/31/2011
C06 Annual Flu Vaccine 02/01/2012 - 06/30/2012
C07 Improving or Maintaining Physical Health Apr 2011 - Aug 2011
C08 Improving or Maintaining Mental Health Apr 2011 - Aug 2011
C09 Monitoring Physical Activity Apr 2011 - Aug 2011
C10 Adult BMI Assessment 01/01/2011 - 12/31/2011
C11 Care for Older Adults – Medication Review 01/01/2011 - 12/31/2011
C12 Care for Older Adults – Functional Status Assessment 01/01/2011 - 12/31/2011
C13 Care for Older Adults – Pain Screening 01/01/2011 - 12/31/2011
C14 Osteoporosis Management in Women who had a Fracture 01/01/2011 - 12/31/2011
C15 Diabetes Care – Eye Exam 01/01/2011 - 12/31/2011
C16 Diabetes Care – Kidney Disease Monitoring 01/01/2011 - 12/31/2011
C17 Diabetes Care – Blood Sugar Controlled 01/01/2011 - 12/31/2011
C18 Diabetes Care – Cholesterol Controlled 01/01/2011 - 12/31/2011
C19 Controlling Blood Pressure 01/01/2011 - 12/31/2011
C20 Rheumatoid Arthritis Management 01/01/2011 - 12/31/2011
C21 Improving Bladder Control Apr 2011 - Aug 2011
C22 Reducing the Risk of Falling Apr 2011 - Aug 2011
C23 Plan All-Cause Readmissions 01/01/2011 - 12/31/2011
C24 Getting Needed Care 02/01/2012 - 06/30/2012
C25 Getting Appointments and Care Quickly 02/01/2012 - 06/30/2012
C26 Customer Service 02/01/2012 - 06/30/2012
C27 Overall Rating of Health Care Quality 02/01/2012 - 06/30/2012
C28 Overall Rating of Plan 02/01/2012 - 06/30/2012
C29 Care Coordination 02/01/2012 - 06/30/2012
C30 Complaints about the Health Plan 01/01/2012 - 06/30/2012
C31 Beneficiary Access and Performance Problems 01/01/2011 - 12/31/2011
C32 Members Choosing to Leave the Plan 01/01/2011 - 12/31/2011
C33 Improvement 01/01/2011 - 12/31/2011
C34 Plan Makes Timely Decisions about Appeals 01/01/2011 - 12/31/2011
C35 Reviewing Appeals Decisions 01/01/2011 - 12/31/2011
C36 Call Center – Foreign Language Interpreter and TTY/TDD Availability 01/30/2012 - 05/18/2012 (Monday - Friday)
C37 Enrollment Timeliness 01/01/2012 - 06/30/2012

DRAFT DRAFT
(Last Updated 08/09/2012) DRAFT Page 71
Table D-2: Part D Measure Data Time Frames
Measure ID Measure Name Data Time Frame
D01 Call Center – Pharmacy Hold Time 02/06/2012 - 05/18/2012 (Monday - Friday)
D02 Call Center – Foreign Language Interpreter and TTY/TDD Availability 01/30/2012 - 05/18/2012 (Monday - Friday)
D03 Appeals Auto–Forward 01/01/2011 - 12/31/2011
D04 Appeals Upheld 01/01/2012 - 6/30/2012
D05 Enrollment Timeliness 01/01/2012 - 06/30/2012
D06 Complaints about the Drug Plan 01/01/2012 - 06/30/2012
D07 Beneficiary Access and Performance Problems 01/01/2011 - 12/31/2011
D08 Members Choosing to Leave the Plan 01/01/2011 - 12/31/2011
D09 Improvement 01/01/2011 - 12/31/2011
D10 Getting Information From Drug Plan 02/15/2012 - 06/15/2012
D11 Rating of Drug Plan 02/15/2012 - 06/15/2012
D12 Getting Needed Prescription Drugs 02/15/2012 - 06/15/2012
D13 MPF Price Accuracy 01/01/2011 - 09/30/2011
D14 High Risk Medication 01/01/2011 - 12/31/2011
D15 Diabetes Treatment 01/01/2011 - 12/31/2011
D16 Part D Medication Adherence for Oral Diabetes Medications 01/01/2011 - 12/31/2011
D17 Part D Medication Adherence for Hypertension (RAS antagonists) 01/01/2011 - 12/31/2011
D18 Part D Medication Adherence for Cholesterol (Statins) 01/01/2011 - 12/31/2011

DRAFT DRAFT
(Last Updated 08/09/2012) DRAFT Page 72
Attachment E: NCQA Measure Combining Methodology
The specifications below are written for two PBP submissions, which we distinguish as 1 and 2, but the methodology easily extends to any number of submissions
Definitions
Let N1 = The Total Number of Members Eligible for the HEDIS measure in the first PBP ("fixed" and auditable)
Let N2 = The Total Number of Members Eligible for the HEDIS measure in the second PBP ("fixed" and auditable)
Let P1 = The estimated rate (mean) for the HEDIS measure in the first PBP (auditable)
Let P2 = The estimated rate (mean) for the same HEDIS measure in the second PBP (auditable)
Setup Calculations
Based on the above definitions, there are two additional calculations:
Let W1 = The weight assigned to the first PBP results (estimated, auditable). This is estimated from the formula W1 = N1/( N1+N2)
Let W2 = The weight assigned to the second PBP results (estimated, auditable). This is estimated from the formula W2 = N2/( N1+N2)
Pooled Analysis
The pooled result from the two rates (means) is calculated as:
Ppooled = W1*P1 + W2*P2
NOTES: Weights are based on the eligible member population. While it may be more accurate to remove all excluded members before weighting, NCQA and CMS have chosen not do this (to simplify the method) for two reasons: 1) the number of exclusions relative to the size of the population should be small, and 2) exclusion rates (as a percentage of the eligible population) should be similar for each PBP and negligibly affect the weights.
If one or more of the submissions has an audit designation of NA, those submissions are dropped and not included in the weighted rate (mean) calculations. If one or more of the submissions has a designation of NR, which has been determined to be biased or is not reported by choice of the contract, the rate is set to zero as detailed in the section titled Handling of Biased, Erroneous and/or Not reportable (NR) Data.
Numeric Example Using an Effectiveness of Care Rate
# of Total Members Eligible for the HEDIS measure in PBP 1, N1 = 1500
# of Total Members Eligible for the HEDIS measure in PBP 2, N2 = 2500
HEDIS Result for PBP 1, Enter as a Proportion between 0 and 1, P1 = 0.75
HEDIS Result for PBP 2, Enter as a Proportion between 0 and 1, P2 = 0.5
Setup Calculations - Initialize Some Intermediate Results
The weight for PBP 1 product estimated by W1 = N1/( N1+N2) 0.375
The weight for PBP 2 product estimated by W2 = N2/( N1+N2) 0.625
Pooled Results
Ppooled = W1*P1 + W2*P2 0.59375

DRAFT DRAFT
(Last Updated 08/09/2012) DRAFT Page 73
Attachment F: Calculating Measure C23: Plan All-Cause Readmissions
All data come from the HEDIS 2012 M12_PCRB data file.
Formula Value PCR Field Field Description
A ist6574 Count of Index Stays (Denominator) Total 65-74 Num
D rt6574 Count of 30-Day readmissions (Numerator) Total 65-74 Num
G apt6574 Average Adjusted Probability Total 65-74 Num
B ist7584 Count of Index Stays (Denominator) Total 75-84 Num
E rt7584 Count of 30-Day readmissions (Numerator) Total 75-84 Num
H apt7584 Average Adjusted Probability Total 75-84 Num
C ist85 Count of Index Stays (Denominator) Total 85+ Num
F rt85 Count of 30-Day readmissions (Numerator) Total 85+ Num
I apt85 Average Adjusted Probability Total 85+ Num
NatAvgObs = Average D1+E1+F1A1+B1+C1
+ + Dn+En+Fn
An+Bn+Cn Where 1 through n are all contracts with numeric data.
Observed =D+E+F
A+B+C
Expected = A
A+B+C G +
B
A+B+C H +
C
A+B+C I
Final Rate = Observed
Expected NatAvgObs 100
Example: Calculating the final rate for Contract 1
Formula Value PCR Field Contract 1 Contract 2 Contract 3 Contract 4
A ist6574 2,217 1,196 4,157 221
D rt6574 287 135 496 30
G apt6574 0.126216947 0.141087156 0.122390927 0.129711036
B ist7584 1,229 2,483 3,201 180
E rt7584 151 333 434 27
H apt7584 0.143395345 0.141574415 0.168403941 0.165909069
C ist85 1,346 1,082 1,271 132
F rt85 203 220 196 22
I apt85 0.165292297 0.175702614 0.182608065 0.145632638
NatAvgObs = Average 287+151+203
2217+1229+1346 +
135+333+220
1196+2438+1082 +
496+434+196
4157+3201+1271 +
30+27+22
221+180+132
NatAvgObs = Average 0.13376 + 0.14451 + 0.13049 + 0.14822
NatAvgObs = 0.13924
Observed Contract 1 = 287+151+203
2217+1229+1346 = 0.13376
Expected Contract 1 =
Expected Contract 1 = (0.058 + 0.037 + 0.046) = 0.142
Final Rate Contract 1 = 0.13376
0.142 0.13924 100 13.1160158
Final Rate reported in the Plan Ratings for Contract 1 = 13%
The actual calculated NatAvgObs value used in the 2013 Plan Ratings was 0.139295325506652

DRAFT DRAFT
(Last Updated 08/09/2012) DRAFT Page 74
Attachment G: Weights Assigned to Individual Performance Measures
Table G-1: Part C Measure Weights
Measure ID Measure Name Weighting Category
Part C Summary
MA-PD Overall
C01 Breast Cancer Screening Process Measure 1 1
C02 Colorectal Cancer Screening Process Measure 1 1
C03 Cardiovascular Care – Cholesterol Screening Process Measure 1 1
C04 Diabetes Care – Cholesterol Screening Process Measure 1 1
C05 Glaucoma Testing Process Measure 1 1
C06 Annual Flu Vaccine Process Measure 1 1
C07 Improving or Maintaining Physical Health Outcome Measure 3 3
C08 Improving or Maintaining Mental Health Outcome Measure 3 3
C09 Monitoring Physical Activity Process Measure 1 1
C10 Adult BMI Assessment Process Measure 1 1
C11 Care for Older Adults – Medication Review Process Measure 1 1
C12 Care for Older Adults – Functional Status Assessment Process Measure 1 1
C13 Care for Older Adults – Pain Screening Process Measure 1 1
C14 Osteoporosis Management in Women who had a Fracture Process Measure 1 1
C15 Diabetes Care – Eye Exam Process Measure 1 1
C16 Diabetes Care – Kidney Disease Monitoring Process Measure 1 1
C17 Diabetes Care – Blood Sugar Controlled Intermediate Outcome Measures 3 3
C18 Diabetes Care – Cholesterol Controlled Intermediate Outcome Measures 3 3
C19 Controlling Blood Pressure Intermediate Outcome Measures 3 3
C20 Rheumatoid Arthritis Management Process Measure 1 1
C21 Improving Bladder Control Process Measure 1 1
C22 Reducing the Risk of Falling Process Measure 1 1
C23 Plan All-Cause Readmissions Outcome Measure 3 3
C24 Getting Needed Care Patients’ Experience and Complaints Measure 1.5 1.5
C25 Getting Appointments and Care Quickly Patients’ Experience and Complaints Measure 1.5 1.5
C26 Customer Service Patients’ Experience and Complaints Measure 1.5 1.5
C27 Overall Rating of Health Care Quality Patients’ Experience and Complaints Measure 1.5 1.5
C28 Overall Rating of Plan Patients’ Experience and Complaints Measure 1.5 1.5
C29 Care Coordination Patients’ Experience and Complaints Measure 1 1
C30 Complaints about the Health Plan Patients’ Experience and Complaints Measure 1.5 1.5
C31 Beneficiary Access and Performance Problems Measures Capturing Access 1.5 1.5
C32 Members Choosing to Leave the Plan Patients’ Experience and Complaints Measure 1.5 1.5
C33 Improvement Outcome Measure 1 1
C34 Plan Makes Timely Decisions about Appeals Measures Capturing Access 1.5 1.5
C35 Reviewing Appeals Decisions Measures Capturing Access 1.5 1.5
C36 Call Center – Foreign Language Interpreter and TTY/TDD Availability Measures Capturing Access 1.5 1.5
C37 Enrollment Timeliness Process Measure 1 1

DRAFT DRAFT
(Last Updated 08/09/2012) DRAFT Page 75
Table G-2: Part D Measure Weights
Measure ID Measure Name Weighting Category
Part D Summary
MA-PD Overall
D01 Call Center – Pharmacy Hold Time Measures Capturing Access 1.5 1.5
D02 Call Center – Foreign Language Interpreter and TTY/TDD Availability Measures Capturing Access 1.5 1.5
D03 Appeals Auto–Forward Measures Capturing Access 1.5 1.5
D04 Appeals Upheld Measures Capturing Access 1.5 1.5
D05 Enrollment Timeliness Process Measure 1 1
D06 Complaints about the Drug Plan Patients’ Experience and Complaints Measure 1.5 1.5
D07 Beneficiary Access and Performance Problems Measures Capturing Access 1.5 1.5
D08 Members Choosing to Leave the Plan Patients’ Experience and Complaints Measure 1.5 1.5
D09 Improvement Outcome Measure 1 1
D10 Getting Information From Drug Plan Patients’ Experience and Complaints Measure 1.5 1.5
D11 Rating of Drug Plan Patients’ Experience and Complaints Measure 1.5 1.5
D12 Getting Needed Prescription Drugs Patients’ Experience and Complaints Measure 1.5 1.5
D13 MPF Price Accuracy Process Measure 1 1
D14 High Risk Medication Intermediate Outcome Measures 3 3
D15 Diabetes Treatment Intermediate Outcome Measures 3 3
D16 Part D Medication Adherence for Oral Diabetes Medications Intermediate Outcome Measures 3 3
D17 Part D Medication Adherence for Hypertension (RAS antagonists) Intermediate Outcome Measures 3 3
D18 Part D Medication Adherence for Cholesterol (Statins) Intermediate Outcome Measures 3 3

DRAFT DRAFT
(Last Updated 08/09/2012) DRAFT Page 76
Attachment H: Calculation of Weighted Star Rating and Variance Estimates
The weighted summary (or overall) star rating for contract j is estimated as:
where nj is the number of performance measures for which contract j is eligible; wij is the weight assigned to performance measure i for contract j; and xij is the measure star for performance measure i for contract j. The
variance of the star ratings for each contract j, 2
js , must also be computed in order to estimate the integration
factor (i-Factor):
Thus, the ‘s are the new summary (or overall) star ratings for the contracts. The variance estimate, , simply
replaces the non-weighted variance estimate that was previously used for the i-Factor calculation. For all contracts j, wij = wi (i.e., the performance measure weights are the same for all contracts when estimating a given star rating (Part C or Part D summary or MA-PD overall ratings).

DRAFT DRAFT
(Last Updated 08/09/2012) DRAFT Page 77
Attachment I: Calculating the Improvement Measure and the Measures Used
Calculating the Improvement Measure
1. The improvement change score was determined for each measure for which a contract was eligible by calculating the difference in measure scores between plan rating years 2012 and 2013:
Improvement Change Score Score in 2013-Score in 2012.
An eligible measure was defined as a measure for which a contract was scored in both the 2012 plan ratings and 2012 plan ratings and there were no significant specification changes.
2. For each measure, significant improvement or decline between plan ratings years 2012 and 2013 was determined by a t-test at the 95% significance level:
IfImprovement Change Score
Standard Error of Improvement Change Score≥1.96, then YES significant improvement
If Improvement Change Score
Standard Error of Improvement Change Score≤-1.96, then YES significant decline
3. Net improvement was calculated for each weighting category (outcome or intermediate outcome, access or patient experience, and process) for Parts C and D separately by subtracting the total number of significantly declined measures from the total number of significantly improved measures.
Net Improvement of significantly improved measures- of significantly declined measures
4. The improvement measure score was calculated for Parts C and D separately by taking a weighted sum of net improvement divided by the weighted sum of the number of eligible measures.
Measures were weighted as follows: a. Outcome or intermediary outcome measure: Weight of 3
b. Access or patient experience measure: Weight of 1.5
c. Process measure: Weight of 1
Improvement Measure Score Net Imp Process+1.5*Net Imp PtExp+3*Net Imp Outcome
Elig Process+1.5*Elig PtExp+3*Elig Outcome
Net_Imp_Process = Net improvement for process measures
Net_Imp_PtExp = Net improvement for patient experience and access measures
Net_Imp_Outcome = Net improvement for outcome and intermediary outcome measures
Elig_Process = Number of eligible process measures
Elig_PtExp = Number of eligible patient experience and access measures
Elig_Outcome = Number of eligible outcome and intermediary outcome measures
5. Improvement measure score is converted into a star rating using the relative distribution method.
6. Hold Harmless Provision: Contracts with 4 or more stars for their highest rating that would have had their overall rating decreased with the addition of the improvement measures were held harmless. That is, the highest star rating could not be decreased from 4 or more stars when the improvement measures were added to the overall star rating calculation.

DRAFT DRAFT
(Last Updated 08/09/2012) DRAFT Page 78
Table I-1: Part C Measures used in the Improvement Measure
Measure ID Measure Name Measure Usage
C01 Breast Cancer Screening Included
C02 Colorectal Cancer Screening Included
C03 Cardiovascular Care – Cholesterol Screening Included
C04 Diabetes Care – Cholesterol Screening Included
C05 Glaucoma Testing Included
C06 Annual Flu Vaccine Included
C07 Improving or Maintaining Physical Health Not Included
C08 Improving or Maintaining Mental Health Not Included
C09 Monitoring Physical Activity Included
C10 Adult BMI Assessment Included
C11 Care for Older Adults – Medication Review Included
C12 Care for Older Adults – Functional Status Assessment Included
C13 Care for Older Adults – Pain Screening Included
C14 Osteoporosis Management in Women who had a Fracture Included
C15 Diabetes Care – Eye Exam Included
C16 Diabetes Care – Kidney Disease Monitoring Included
C17 Diabetes Care – Blood Sugar Controlled Included
C18 Diabetes Care – Cholesterol Controlled Included
C19 Controlling Blood Pressure Included
C20 Rheumatoid Arthritis Management Included
C21 Improving Bladder Control Included
C22 Reducing the Risk of Falling Included
C23 Plan All-Cause Readmissions Included
C24 Getting Needed Care Included
C25 Getting Appointments and Care Quickly Included
C26 Customer Service Included
C27 Overall Rating of Health Care Quality Included
C28 Overall Rating of Plan Included
C29 Care Coordination Not Included
C30 Complaints about the Health Plan Included
C31 Beneficiary Access and Performance Problems Not Included
C32 Members Choosing to Leave the Plan Included
C33 Improvement Not Included
C34 Plan Makes Timely Decisions about Appeals Not Included
C35 Reviewing Appeals Decisions Included
C36 Call Center – Foreign Language Interpreter and TTY/TDD Availability Not Included
C37 Enrollment Timeliness Not Included

DRAFT DRAFT
(Last Updated 08/09/2012) DRAFT Page 79
Table I-2: Part D Measures used in the Improvement Measure
Measure ID Measure Name Measure Usage
D01 Call Center – Pharmacy Hold Time Included
D02 Call Center – Foreign Language Interpreter and TTY/TDD Availability Not Included
D03 Appeals Auto–Forward Included
D04 Appeals Upheld Included
D05 Enrollment Timeliness Not Included
D06 Complaints about the Drug Plan Included
D07 Beneficiary Access and Performance Problems Not Included
D08 Members Choosing to Leave the Plan Included
D09 Improvement Not Included
D10 Getting Information From Drug Plan Included
D11 Rating of Drug Plan Included
D12 Getting Needed Prescription Drugs Included
D13 MPF Price Accuracy Not Included
D14 High Risk Medication Not Included
D15 Diabetes Treatment Included
D16 Part D Medication Adherence for Oral Diabetes Medications Included
D17 Part D Medication Adherence for Hypertension (RAS antagonists) Included
D18 Part D Medication Adherence for Cholesterol (Statins) Included

DRAFT DRAFT
(Last Updated 08/09/2012) DRAFT Page 80
Attachment J: Plan Ratings Measure History
The tables below cross reference the measures code in each of the Plan Ratings releases over the past six years. Measure codes that begin with DM are display measures which are posted on CMS.gov on this page: http://www.cms.gov/Medicare/Prescription-Drug-Coverage/PrescriptionDrugCovGenIn/PerformanceData.html.
Table J-1: Part C Measure History
Part Common Measure Name Data_Source 2013 2012 2011 2010 2009 2008 Notes
C Access to Primary Care Doctor Visits HEDIS DMC12 C11 C13 C12 C13 C09
C Adult BMI Assessment HEDIS C10 C12 DMC05
C Annual Flu Vaccine CAHPS C06 C06 C07 C06 C07 C07
C Antidepressant Medication Management (6 months) HEDIS DMC03 DMC03 DMC03 DMC04 C28 C23
C Appeals Decisions IRE / Maximus C35 C35 C32 C28 C36 C29
C Appeals Timeliness IRE / Maximus C34 C34 C31 C27 C35 C28
C Appropriate Monitoring of Patients Taking Long-term Medications HEDIS DMC05 DMC05 C06 C05 C06 C06
C Audit Administrative Data C31 C32 C33 C30
C Breast Cancer Screening HEDIS C01 C01 C01 C01 C01 C01
C Call Answer Timeliness HEDIS DMC02 DMC02 DMC02 DMC01 C20 C16
C Cardiovascular Care – Cholesterol Screening HEDIS C03 C03 C03 C03 C03 Part of composite measure Cholesterol Screening in 2010
C Care Coordination CAHPS C29
C Cholesterol Screening HEDIS C03 Composite Measure - combined Cardiovascular Care – Cholesterol Screening and Diabetes Care – Cholesterol Screening measures
C COA - Functional Status Assessment HEDIS C12 C14
C COA - Medication Review HEDIS C11 C13
C COA - Pain Screening HEDIS C13 C15
C Colorectal Cancer Screening HEDIS C02 C02 C02 C02 C02 C02
C Complaints CTM C30 C31 C30 C26
C Continuous Beta-Blocker Treatment HEDIS DMC04 DMC04 DMC04 DMC05 C32 C27
C Controlling Blood Pressure HEDIS C19 C21 C19 C15 C29 C24
C CSR Understandability Call Center DMC02
C Customer Service CAHPS C26 C28 C27 C23 C22
C Diabetes Care HEDIS C14 Composite Measure - combined Diabetes Care – Blood Sugar Controlled, Diabetes Care – Cholesterol Controlled, Diabetes Care – Eye Exam and Diabetes Care – Kidney Disease Monitoring measures
C Diabetes Care – Blood Sugar Controlled HEDIS C17 C19 C17 C26 C21 Part of composite measure Diabetes Care in 2010
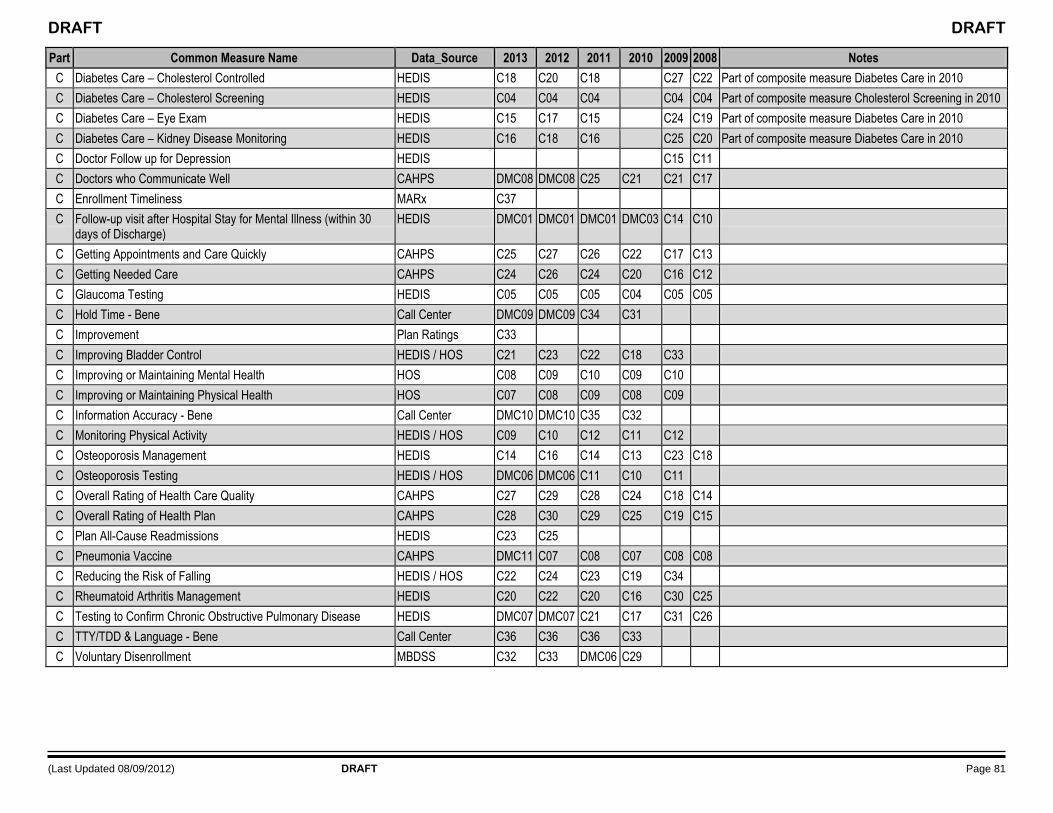
DRAFT DRAFT
(Last Updated 08/09/2012) DRAFT Page 81
Part Common Measure Name Data_Source 2013 2012 2011 2010 2009 2008 Notes
C Diabetes Care – Cholesterol Controlled HEDIS C18 C20 C18 C27 C22 Part of composite measure Diabetes Care in 2010
C Diabetes Care – Cholesterol Screening HEDIS C04 C04 C04 C04 C04 Part of composite measure Cholesterol Screening in 2010
C Diabetes Care – Eye Exam HEDIS C15 C17 C15 C24 C19 Part of composite measure Diabetes Care in 2010
C Diabetes Care – Kidney Disease Monitoring HEDIS C16 C18 C16 C25 C20 Part of composite measure Diabetes Care in 2010
C Doctor Follow up for Depression HEDIS C15 C11
C Doctors who Communicate Well CAHPS DMC08 DMC08 C25 C21 C21 C17
C Enrollment Timeliness MARx C37
C Follow-up visit after Hospital Stay for Mental Illness (within 30 days of Discharge)
HEDIS DMC01 DMC01 DMC01 DMC03 C14 C10
C Getting Appointments and Care Quickly CAHPS C25 C27 C26 C22 C17 C13
C Getting Needed Care CAHPS C24 C26 C24 C20 C16 C12
C Glaucoma Testing HEDIS C05 C05 C05 C04 C05 C05
C Hold Time - Bene Call Center DMC09 DMC09 C34 C31
C Improvement Plan Ratings C33
C Improving Bladder Control HEDIS / HOS C21 C23 C22 C18 C33
C Improving or Maintaining Mental Health HOS C08 C09 C10 C09 C10
C Improving or Maintaining Physical Health HOS C07 C08 C09 C08 C09
C Information Accuracy - Bene Call Center DMC10 DMC10 C35 C32
C Monitoring Physical Activity HEDIS / HOS C09 C10 C12 C11 C12
C Osteoporosis Management HEDIS C14 C16 C14 C13 C23 C18
C Osteoporosis Testing HEDIS / HOS DMC06 DMC06 C11 C10 C11
C Overall Rating of Health Care Quality CAHPS C27 C29 C28 C24 C18 C14
C Overall Rating of Health Plan CAHPS C28 C30 C29 C25 C19 C15
C Plan All-Cause Readmissions HEDIS C23 C25
C Pneumonia Vaccine CAHPS DMC11 C07 C08 C07 C08 C08
C Reducing the Risk of Falling HEDIS / HOS C22 C24 C23 C19 C34
C Rheumatoid Arthritis Management HEDIS C20 C22 C20 C16 C30 C25
C Testing to Confirm Chronic Obstructive Pulmonary Disease HEDIS DMC07 DMC07 C21 C17 C31 C26
C TTY/TDD & Language - Bene Call Center C36 C36 C36 C33
C Voluntary Disenrollment MBDSS C32 C33 DMC06 C29

DRAFT DRAFT
(Last Updated 08/09/2012) DRAFT Page 82
Table J-2: Part D Measure History
Part Msr_Name Data_Source 2013 2012 2011 2010 2009 2008 Notes
D 4Rx Timeliness Acumen/OIS (4Rx) DMD03 DMD03 D07 D07 D09
D Adherence - Cholesterol Prescription Drug Event (PDE) D18 D17
D Adherence - Diabetes Prescription Drug Event (PDE) D16 D15
D Adherence - Hypertension Prescription Drug Event (PDE) D17 D16
D Adherence - Proportion of Days Covered Prescription Drug Event (PDE) DMD07
D Appeals - Auto–Forwarded IRE / Maximus D03 D03 D05 D05 D05 D13
D Appeals - Timely Effectuation IRE / Maximus DMD02 DMD02 DMD02 DMD02
D Appeals - Timely Receipt IRE / Maximus DMD01 DMD01 DMD01 DMD01
D Appeals - Upheld IRE / Maximus D04 D04 D06 D06 D06 D14
D Audit Administrative Data D07 D07 D10 D11
D CAHPS - Drug Access CAHPS D12 D11 D13 D14 D14 D08
D CAHPS - Help CAHPS D10 D09 D11 D12 D12 D06
D CAHPS - Rating CAHPS D11 D10 D12 D13 D13 D07
D Calls Disconnected - Bene Call Center DMD04 DMD04 DMD04 DMD04 D02 D02
D Calls Disconnected - Pharmacist Call Center DMD05 D04 D04
D Complaint Resolution CTM DMD07
D Complaints - Benefits CTM D07 D11
D Complaints - Enrollment CTM D08 D08 D08 D12
D Complaints - Other CTM D09 D09 D10
D Complaints - Pricing CTM D09 D17
D Complaints - Total CTM D06 D06 D05
D CSR Understandability Call Center DMD06
D Diabetes Medication Dosing Prescription Drug Event (PDE) DMD08 DMD08 DMD06 DMD09
D Drug-Drug Interactions Prescription Drug Event (PDE) DMD07 DMD07 DMD05 DMD08
D Enrollment Timeliness MARx D05 D05 DMD03 DMD03
D Hold Time - Bene Call Center DMD05 DMD05 D01 D01 D01 D01
D Hold Time - Pharmacist Call Center D01 D01 D02 D02 D03 D03
D Improvement Plan Ratings D09
D Information Accuracy - Bene Call Center DMD06 DMD06 D03 D03
D LIS Match Rates Acumen/OIS (LIS Match Rates) DMD09 DMD09 D14 D15 D15 D10
D Member Retention MBDSS D11

DRAFT DRAFT
(Last Updated 08/09/2012) DRAFT Page 83
Part Msr_Name Data_Source 2013 2012 2011 2010 2009 2008 Notes
D MPF - Accuracy Plan Finder Data D13 D17 D18 Part of composite measure MPF - Composite in 2011 - 2012
D MPF - Composite Plan Finder Data D12 D15 Composite measure - combined MPF - Accuracy and MPF Stability
D MPF - Stability Plan Finder Data DMD11 D16 D17 D16 Part of composite measure MPF - Composite in 2011 - 2012
D MPF - Updates Plan Finder Data DMD10 DMD10 DMD08 DMD10 D16 D15
D Safety - DAE Prescription Drug Event (PDE) D14 D13 D16 D18 D19
D Saftety - DST Prescription Drug Event (PDE) D15 D14 D17 D19
D TTY/TDD & Language - Bene Call Center D02 D02 D04 D04
D Voluntary Disenrollment MBDSS D08 D08 DMD09 D10
DRAFT DRAFT
(Last Updated 08/09/2012) DRAFT Page 84
Attachment K: Individual Measure Star Assignment Process
This attachment illustrates detailed steps of the ―Relative Distribution and Clustering‖ method to develop individual measure stars. These steps include the implementation of the following set of methodologies:
1. Adjusted percentile approach (referred to as ―AP‖)
2. Two-stage cluster analysis (referred to as ―CA‖)
3. Hybrid approach to combine the results from the AP and CA methods, and produce the final thresholds (cut-off points) for individual measure stars.
1. Produce the Star Thresholds by the Adjusted Percentile Method
The AP method evaluates contracts relative to each other by assigning initial thresholds based on a particular percentile distribution. CMS has no pre-specified star distribution, so the initial thresholds are set under two parameterized choices of percentile values, i.e., at the 20th, 35th, 65th, and 80th percentiles, and at the 20th, 40th, 60th, and 80th percentiles, respectively. This produces two sets of initial thresholds (zero-gap adjusted). The use of two sets of percentile values will result in a rating process which is less sensitive to the initial distribution of contracts.
These initial percentile thresholds are then adjusted by evaluating the observed gaps between adjacent measure values around the initial thresholds in the data after the data are sorted. Two sets of gap adjustments to each initial threshold are performed, using a 3-gap and 7-gap adjustment which is described below. This adjustment intends to avoid a situation in which two contracts with very close measure values have different star ratings.
In the case of a 3-gap adjustment, a total of seven measure values with respect to an initial threshold (e.g., a 4-star threshold when the 20th, 35th, 65th, and 80th percentile is used) are identified. These seven values include the initial threshold values, the three most adjacent measure values above the initial threshold, and three most adjacent measure values below. From there, six gaps among these seven measure values (i.e., differences between two adjacent measure values) are calculated and compared. The adjusted threshold is set as the midpoint of the largest gap amongst the six. This exercise above is repeated for each of the four initial thresholds.
After the implementation of the AP method, a total of 24 candidate thresholds, or six sets for each star level, are produced. This includes two zero-gap adjusted, two 3-gap adjusted, and two 7-gap adjusted thresholds. These candidate thresholds will be processed under the hybrid approach to determine the final thresholds.
2. Produce the Star Thresholds by the Two-stage Cluster Analysis
A two-stage clustering analysis is implemented separately from the AP method. The clustering approach keeps contracts with similar measure values together, assuring that these contracts receive the same star rating. In the first stage, the number of clusters is parameterized as 10, 15, 20, 25, 30, and 35, respectively, to account for the variation of individual measure distributions. The second stage then clusters the centers of these first stage clusters into five (star) groups to assign thresholds and star ratings. This step results in a total of 24 candidate shields (i.e., a set of four thresholds for each the six choices of the number of first-stage clusters).
Jointly, the AP and CA analyses produce a total of 48 candidate thresholds to be used under the hybrid approach.
3. Produce the Final Star Thresholds by the Hybrid Approach
The hybrid approach serves as a post-processing step to use the candidate thresholds from both the AP and CA methods to obtain the final star thresholds. There are five steps to determine the final hybrid thresholds:
Step 1: Sort the raw measure values to produce the cumulative frequency of each distinctive measure value.

DRAFT DRAFT
(Last Updated 08/09/2012) DRAFT Page 85
Step 2: Compare each of the 48 candidate thresholds to all the distinct raw measure values to flag raw measures that are closest to the candidate threshold.
Step 3: For each distinct raw measure values, count the total number of flags (in Step 2) from 24 AP candidate thresholds and 24 CA candidate thresholds, respectively.
Step 4: Calculate the hybrid count as a weighted sum of total flags (hybrid counts) from the AP and CA methods. A higher weight is assigned to the AP match count than to the CA match count.
Step 5: Based on the hybrid count, determine the final cutoff points (hybrid thresholds) to be the distinctive measure values among those with the highest hybrid count, considering the number of stars and minimum number of contracts in each star level.
4. Special Case: Produce Hybrid Thresholds When 3- or 4-star Thresholds are Predetermined
CMS pre-determines thresholds at certain star values for some measures. In this case, the 48 candidate thresholds from the AP and CA methods are again produced first. Then step 1 through step 4 is implemented. However, prior to implementing step 5 under Section 3 above, the data are divided into two subsets by the predetermined threshold, and then step 5 is performed to identify the final thresholds. For example, in the event that a 4-star threshold is pre-determined, one threshold between 4 and 5 stars is to be identified in the upper section of the data. In the bottom section of the dataset, two cut-off points (between 1 and 2, and between 2 and 3 stars) are identified. The approach to treat the special case corresponds to the ―CMS standard, relative distribution, and clustering‖ method.

DRAFT DRAFT
(Last Updated 08/09/2012) DRAFT Page 86
Attachment L: Glossary of Terms
Anderson-Darling test This test compares the similarity of an observed cumulative distribution function to an expected cumulative distribution function.
AEP The annual period from November 15 until December 31 when a Medicare beneficiary can enroll into a Medicare Part D plan or re-enroll into their existing Medicare Part D Plan or change into another Medicare Part D plan is known as the Annual Election Period (AEP). Beneficiaries can also switch to a Medicare Advantage Plan that has a Prescription Drug Plan (MA-PD). The chosen Medicare Part D plan coverage begins on January 1st.
CAHPS The term CAHPS refers to a comprehensive and evolving family of surveys that ask consumers and patients to evaluate the interpersonal aspects of health care. CAHPS surveys probe those aspects of care for which consumers and patients are the best and/or only source of information, as well as those that consumers and patients have identified as being important. CAHPS initially stood for the Consumer Assessment of Health Plans Study, but as the products have evolved beyond health plans, the acronym now stands for Consumer Assessment of Healthcare Providers and Systems.
CCP A Coordinated Care Plan (CCP) is a health plan that includes a network of providers that are under contract or arrangement with the organization to deliver the benefit package approved by CMS. The CCP network is approved by CMS to ensure that all applicable requirements are met, including access and availability, service area, and quality requirements. CCPs may use mechanisms to control utilization, such as referrals from a gatekeeper for an enrollee to receive services within the plan, and financial arrangements that offer incentives to providers to furnish high quality and cost-effective care. CCPs include HMOs, PSOs, local and regional PPOs, and senior housing facility plans. SNPs can be offered under any type of CCP that meets CMS‘ requirements.
Cost Plan A plan operated by a Health Maintenance Organization (HMO) or Competitive Medical Plan (CMP) in accordance with a cost reimbursement contract under §1876(h) of the Act.
Cramér-von-Mises criterion This is used to judge the goodness of fit of a probability distribution, compared to a given empirical distribution function or to compare two empirical distributions.
Euclidean metric This test is the ordinary distance between two points that one would measure with a ruler.
HEDIS The Healthcare Effectiveness Data and Information Set (HEDIS) is a widely used set of performance measures in the managed care industry, developed and maintained by the National Committee for Quality Assurance (NCQA).
HOS The Medicare Health Outcomes Survey (HOS) is the first patient reported outcomes measure used in Medicare managed care. The goal of the Medicare HOS program is to gather valid, reliable, and clinically meaningful health status data in the Medicare Advantage (MA) program for use in quality improvement activities, pay for performance, program oversight, public reporting, and improving health. All managed care organizations with MA contracts must participate.
ICEP The 3 months immediately before beneficiaries are entitled to Medicare Part A and enrolled in Part B are known as the Initial Coverage Election Period (ICEP). Beneficiaries may choose a Medicare health plan during their ICEP and the plan

DRAFT DRAFT
(Last Updated 08/09/2012) DRAFT Page 87
must accept them unless it has reached its limit in the number of members. This limit is approved by CMS.
IRE The Independent Review Entity (IRE) is an independent entity contracted by CMS to review Medicare health plans‘ adverse reconsiderations of organization determinations.
IVR Interactive voice response (IVR) is a technology that allows a computer to interact with humans through the use of voice and dual-tone multi-frequency keypad inputs.
Kolmogorov-Smirnov test The Kolmogorov-Smirnov (K–S) test uses a non-parametric technique to determine if two datasets are significantly different. It compares a sample with a reference probability distribution (one-sample K–S test), or compares two samples (two-sample K–S test).
LIS The Low Income Subsidy (LIS) from Medicare provides financial assistance for beneficiaries who have limited income and resources. Those who are eligible for the LIS will get help paying for their monthly premium, yearly deductible, prescription coinsurance and copayments and they will have no gap in coverage.
MA A Medicare Advantage (MA) organization is a public or private entity organized and licensed by a State as a risk-bearing entity (with the exception of provider-sponsored organizations receiving waivers) that is certified by CMS as meeting the MA contract requirements.
MA-only An MA organization that does not offer Medicare prescription drug coverage.
MA-PD An MA organization that offers Medicare prescription drug coverage and Part A and Part B benefits in one plan.
MSA Medicare Medical Savings Account (MSA) plans combine a high deductible MA plan and a medical savings account (which is an account established for the purpose of paying the qualified medical expenses of the account holder).
Percentage A part of a whole expressed in hundredths. For example, a score of 45 out of 100 possible points is the same as 45%.
Percentile The value below which a certain percent of observations fall. For example, a score equal to or greater than 97 percent of other scores attained on the same measure is said to be in the 97th percentile.
PDP A Prescription Drug Plan (PDP) is a stand-alone drug plan, offered by insurers and other private companies to beneficiaries that receive their Medicare Part A and/or B benefits through the Original Medicare Plan; Medicare Private Fee-for-Service Plans that do not offer prescription drug coverage; and Medicare Cost Plans offering Medicare prescription drug coverage.
PFFS Private Fee-for-Service (PFFS) is defined as an MA plan that pays providers of services at a rate determined by the plan on a fee-for-service basis without placing the provider at financial risk; does not vary the rates for a provider based on the utilization of that provider's services; and does not restrict enrollees' choices among providers that are lawfully authorized to provide services and agree to accept the plan's terms and conditions of payment. The Medicare Improvements for Patients and Providers Act (MIPPA) added that although payment rates cannot vary based solely on utilization of services by a provider, a PFFS plan is permitted to vary the payment rates for a provider based on the specialty of the provider, the location of the provider, or other factors related to

DRAFT DRAFT
(Last Updated 08/09/2012) DRAFT Page 88
the provider that are not related to utilization. Furthermore, MIPPA also allows PFFS plans to increase payment rates to a provider based on increased utilization of specified preventive or screening services. See section 30.4 of the Medicare Managed Care Manual Chapter 1 for further details on PFFS plans.
Reliability A measure of the fraction of the variation among the observed measure values that is due to real differences in quality (―signal‖) rather than random variation (―noise‖). On a scale from 0 (all differences among plans are due to randomness of sampling) to 1 (every plan's quality is measured with perfect accuracy).
SNP A Special Needs Plan (SNP) is an MA coordinated care plan that limits enrollment to special needs individuals, i.e., those who are dual-eligible, institutionalized, or have one or more severe or disabling chronic conditions.
Sponsor An entity that sponsors a health or drug plan.
Statistical Significance Statistical significance assesses how unlikely differences as big as those observed are to appear due to chance when plans are actually the same. CMS uses statistical tests (e.g., t-test) to determine if a contract‘s measure value is statistically significantly greater or less than the national average for that measure, or whether conversely the observed differences from the national average could have arisen by chance.
TTY/TDD A Teletypewriter (TTY) or telecommunications device for the deaf (TDD) s an electronic device for text communication via a telephone line, used when one or more of the parties has hearing or speech difficulties.
Very Low Reliability For CAHPS, an indication that reliability is less than 0.6, indicating that 40% or more of observed variation is due to random noise.

DRAFT DRAFT
(Last Updated 08/09/2012) DRAFT Page 89
Attachment M: Health Plan Management System Module Reference
This attachment is designed to assist reviewers of the data displayed in HPMS to understand the various pages and fields shown in the Part C Report Card Master Table and the Part D Report Card Master Table modules. These modules employ standard HPMS user access rights so that users can only see contracts associated with their user id.
Part C Report Card Master Table
The Part C Report Card Master Table contains the Part C data and stars which will be displayed in MPF along with much of the detailed data that went into various calculations. To access the Part C Report Card Master Table, on the HPMS home page, select Quality and Performance. From the Quality and Performance Fly-out menu choose Part C Performance Metrics. The Part C Performance Metrics home page will be displayed.
On the Part C Performance Metrics home page, select Part C Report Card Master Table from the left hand menu. You will be presented with a screen that allows you to select a report period. The information below describes the year 2013.
A. Measure Data page
The Measure Data page displays the numeric data for each Part C measure. This page becomes available during the first plan preview.
The first three columns contain contract identifying information. The remaining columns contain the measure data which will display in MPF. There is one column for each of the Part C measures. The measure columns are identified by measure id and measure name. The row immediately above this measure information contains the domain name. The row immediately below the measure information contains the data time frame. All subsequent rows contain the data associated with an individual contract.
B. Measure Detail page
The Measure Detail page contains the underlying data used for the Part C Complaints (C30) and Appeals measures (C34 & C35). This page becomes available during the first plan preview. Table M-1 below explains each of the columns displayed on this page.
Table M-1: Measure Detail page fields
HPMS Field Label Field Description
Contract Number The contract number associated with the data
Organization Marketing Name The name the contract markets to members
Contract Name The name the contract is known by in HPMS
Total Number of Complaints The total number of non-excluded complaints for the contract
Complaint Average Enrollment The average enrollment used in the final calculation
Complaints Less than 800 Enrolled Yes / No, Yes = average enrollment < 800, No = average enrollment ≥ 800
Total Appeals Cases Total number of Part C appeals cases processed by the IRE (Maximus)
Number of Appeals Upheld The number of Part C appeals which were upheld
Number of Appeals Overturned The number of Part C appeals which were overturned
Number of Appeals Partly Overturned The number of Part C appeals which were partially overturned
Number of Appeals Dismissed The number of Part C appeals which were dismissed
Number of Appeals Withdrawn The number of Part C appeals which were withdrawn
Percent of Timely Appeals The percent of Part C appeals which were processed in a timely manner

DRAFT DRAFT
(Last Updated 08/09/2012) DRAFT Page 90
C. Measure Detail – SNP page
The Measure Detail – SNP page contains the underlying data used to calculate the three Part C SNP measures (C11, C12 & C13). The formulas used to calculate the SNP measures are detailed in Attachment E. This page becomes available during the first plan preview. Table M-2 below explains each of the columns displayed on this page.
Table M-2: Measure Detail – SNP page fields
HPMS Field Label Field Description
Contract Number The contract number associated with the data
Organization Marketing Name The name the contract markets to members
Contract Name The name the contract is known by in HPMS
PBP ID The Plan Benefit Package number associated with the data
Eligible Population The eligible population, as entered into the NCQA data submission tool (field eligpop)
Average Plan Enrollment The average enrollment in the PBP during 2011 (see section Contract Enrollment Data)
COA - MR Rate The contract entered COA Medication Review Rate as entered into the NCQA data submission tool (Field: ratemr) for the associated contract/PBP
COA – FSA Rate The contract entered COA Functional Status Assessment Rate as entered into the NCQA data submission tool (Field: ratefsa) for the associated contract/PBP
COA – PS Rate The contract entered COA Pain Screening Rate as entered into the NCQA data submission tool (Field: rateps) for the associated contract/PBP
COA - MR Audit Designation The audit designation for the COA Medication Review Rate for the associated contract/PBP (the codes are defined in Table M-3: HEDIS 2012 Audit Designations and 2013 Plan Ratings below)
COA – FSA Audit Designation The audit designation for the COA Functional Status Assessment Rate for the associated contract/ PBP the codes are defined in Table M-3: HEDIS 2012 Audit Designations and 2013 Plan Ratings below)
COA – PS Audit Designation The audit designation for the COA Pain Screening Rate for the associated contract/ PBP the codes are defined in Table M-3: HEDIS 2012 Audit Designations and 2013 Plan Ratings below)
Table M-3: HEDIS 2012 Audit Designations and 2013 Plan Ratings
Audit Designation Description Resultant Rating
R Reportable 1 to 5 stars depending on reported value
NB Required benefit not offered Benefit not offered by plan
NA Denominator fewer than 30 Not enough data available to calculate measure
BR Calculated rate was materially biased 1 star, numeric data set to “CMS identified issues with this plan’s data”
NR Plan chose not to report 1 star, numeric data set to “CMS identified issues with this plan’s data”
Error Plan not required to report Plan not required to report measure
Error Measure Unselected Plan not required to report measure
D. Measure Detail – CTM page
The Measure Detail – CTM page contains the case level data of the non-excluded cases used in producing the Part C Complaints measure (C30). This page becomes available during the first plan preview. Table M-4 below explains each of the columns displayed on this page.
Table M-4: Measure Detail – CTM page fields
HPMS Field Label Field Description
Contract Number The contract number associated with the data
Organization Marketing Name The name the contract markets to members
Contract Name The name the contract is known by in HPMS
Complaint ID The case number associated with the complaint in the HPMS CTM module
Complaint Category ID The complaint category identifier associated with this case
Category Description The complaint category description associated with this case

DRAFT DRAFT
(Last Updated 08/09/2012) DRAFT Page 91
HPMS Field Label Field Description
Complaint Subcategory ID The complaint subcategory identifier associated with this case
Subcategory Description The complaint subcategory description associated with this case
E. Measure Detail – Improvement page
The Measure Detail – Improvement page is constructed in the same manner as the Measure Data page. This page becomes available during the second plan preview.
The first three columns contain contract identifying information. The remaining columns contain the results of the improvement calculation for the specific Part C measure. There is one column for each of the Part C measures. The measure columns are identified by measure id and measure name. There is one additional column all the way to the right which contains the final improvement score. This is the numeric result from step 4 as described in Attachment I section Calculating the Improvement Measure.
The row immediately above this measure information contains the domain id and domain name. The row immediately below the measure information contains a flag (Included or Not Included) to show if the measure was used to calculate final improvement measure. All subsequent rows contain the data associated with an individual contract.
The possible results for measure calculations are shown in Table M-5 below.
Table M-5: Measure Improvement Results
Improvement Measure Result Description
No significant change There was no significant change in the values between the two years
Significant improvement There was a significant improvement from last year to this year
Significant decline There was a significant decline from last year to this year
Not included in calculation There was only one year of data available so the calculation could not be completed
Not Applicable The measure is not an improvement measure
Not Eligible The contract did not have data in more than half of the improvement measures or was too new
F. Measure Stars page
The Measure Stars page displays the star rating for each Part C measure. This page becomes available during the second plan preview.
The first three columns contain contract identifying information. The remaining columns contain the measure stars which will display in MPF. There is one column for each of the Part C measures. The measure columns are identified by measure id and measure name. The row immediately above this measure information contains the domain id and domain name. The row immediately below the measure information contains the data time frame. All subsequent rows contain the stars associated with an individual contract.
G. Domain Stars page
The Domain Stars page displays the star rating for each Part C domain. This page becomes available during the second plan preview.
The first three columns contain contract identifying information. The remaining columns contain the domain stars which will display in MPF. There is one column for each of the Part C domains. The domain columns are identified by the domain id and domain name. All subsequent rows contain the stars associated with an individual contract.
H. Summary Rating page
The Summary Rating page displays the Part C rating and data associated with calculating the final summary rating. This page becomes available during the second plan preview. Table M-6 below explains each of the columns contained on this page.
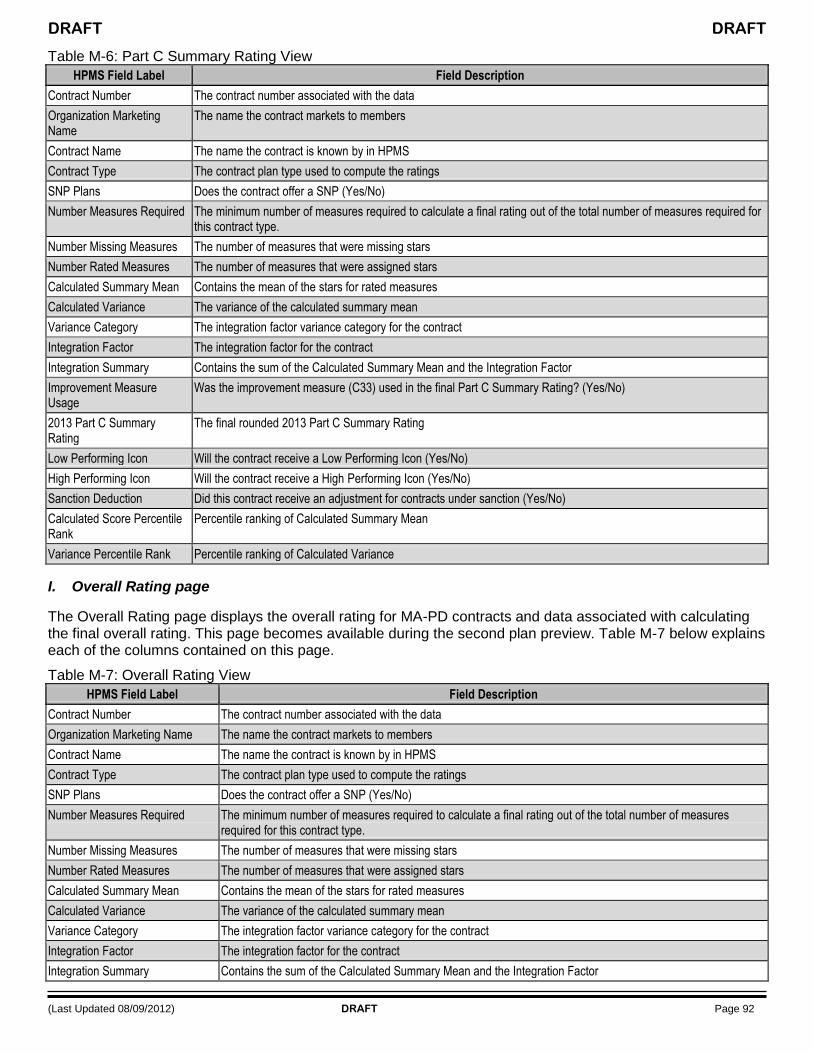
DRAFT DRAFT
(Last Updated 08/09/2012) DRAFT Page 92
Table M-6: Part C Summary Rating View
HPMS Field Label Field Description
Contract Number The contract number associated with the data
Organization Marketing Name
The name the contract markets to members
Contract Name The name the contract is known by in HPMS
Contract Type The contract plan type used to compute the ratings
SNP Plans Does the contract offer a SNP (Yes/No)
Number Measures Required The minimum number of measures required to calculate a final rating out of the total number of measures required for this contract type.
Number Missing Measures The number of measures that were missing stars
Number Rated Measures The number of measures that were assigned stars
Calculated Summary Mean Contains the mean of the stars for rated measures
Calculated Variance The variance of the calculated summary mean
Variance Category The integration factor variance category for the contract
Integration Factor The integration factor for the contract
Integration Summary Contains the sum of the Calculated Summary Mean and the Integration Factor
Improvement Measure Usage
Was the improvement measure (C33) used in the final Part C Summary Rating? (Yes/No)
2013 Part C Summary Rating
The final rounded 2013 Part C Summary Rating
Low Performing Icon Will the contract receive a Low Performing Icon (Yes/No)
High Performing Icon Will the contract receive a High Performing Icon (Yes/No)
Sanction Deduction Did this contract receive an adjustment for contracts under sanction (Yes/No)
Calculated Score Percentile Rank
Percentile ranking of Calculated Summary Mean
Variance Percentile Rank Percentile ranking of Calculated Variance
I. Overall Rating page
The Overall Rating page displays the overall rating for MA-PD contracts and data associated with calculating the final overall rating. This page becomes available during the second plan preview. Table M-7 below explains each of the columns contained on this page.
Table M-7: Overall Rating View
HPMS Field Label Field Description
Contract Number The contract number associated with the data
Organization Marketing Name The name the contract markets to members
Contract Name The name the contract is known by in HPMS
Contract Type The contract plan type used to compute the ratings
SNP Plans Does the contract offer a SNP (Yes/No)
Number Measures Required The minimum number of measures required to calculate a final rating out of the total number of measures required for this contract type.
Number Missing Measures The number of measures that were missing stars
Number Rated Measures The number of measures that were assigned stars
Calculated Summary Mean Contains the mean of the stars for rated measures
Calculated Variance The variance of the calculated summary mean
Variance Category The integration factor variance category for the contract
Integration Factor The integration factor for the contract
Integration Summary Contains the sum of the Calculated Summary Mean and the Integration Factor

DRAFT DRAFT
(Last Updated 08/09/2012) DRAFT Page 93
HPMS Field Label Field Description
2013 Part C Summary Rating The 2013 Part C Summary Rating
2013 Part D Summary Rating The 2013 Part D Summary Rating
Improvement Measure Usage Were the improvement measures (C33 & D09) used to produce the final Overall Rating? (Yes/No)
2013 Overall Rating The final 2013 Overall Rating
Low Performing Icon Will the contract receive a Low Performing Icon (Yes/No)
High Performing Icon Will the contract receive a High Performing Icon (Yes/No)
Sanction Deduction Did this contract receive an adjustment for contracts under sanction (Yes/No)
Calculated Score Percentile Rank Percentile ranking of Calculated Summary Mean
Variance Percentile Rank Percentile ranking of Calculated Variance
J. Technical Notes link
The Technical Notes link provides the user with a copy of the 2013 Plan Ratings Technical Notes. A draft version of these technical notes becomes available during the first plan preview. There are two scheduled times when this document is updated, the first is for the second plan preview. The other scheduled update is when the document has been finalized (no longer a draft) which occurs when the ratings data have been posted to MPF. There are also non-scheduled updates, which occur whenever there have been significant changes made to the document to correct errors found by any of the readers or by CMS.
Left clicking on the Technical Notes link will open a new browser window which will display a PDF (portable document format) copy of the 2013 Plan Ratings technical notes. Right clicking on the Technical Notes link will pop up a context menu which contains Save Target As , clicking on this will allow the user to download and save a copy of the PDF document.

DRAFT DRAFT
(Last Updated 08/09/2012) DRAFT Page 94
Part D Report Card Master Table
The Part D Report Card Master Table contains the Part D data and stars which will be displayed in MPF along with much of the detailed data that went into various calculations. To access the Part D Report Card Master Table, on the HPMS home page, select Quality and Performance. From the Quality and Performance Fly-out menu choose Part D Performance Metrics and Reports. The Part D Performance Metrics and Reports home page will be displayed.
On the Part D Performance Metrics and Reports home page, select Part D Report Card Master Table from the left hand menu. You will be presented with a screen that allows you to select a report period. The information below describes the year 2013.
A. Measure Data page
The Measure Data page displays the numeric data for each Part D measure. This page becomes available during the first plan preview.
The first five columns contain contract identifying information. The remaining columns contain the measure data which will display in MPF. There is one column for each of the Part D measures. The measure columns are identified by measure id and measure name. The two rows immediately above this measure information contain the domain id and domain name and the data time frame. All subsequent rows contain the data associated with an individual contract.
B. Measure Detail page
The Measure Detail page contains the underlying data used for the Part D Appeals (D03 & D04) and Complaints measures (D06). This page becomes available during the first plan preview. Table M-8 below explains each of the columns displayed on this page.
Table M-8: Measure Detail page fields
HPMS Field Label Field Description
Contract Number The contract number associated with the data
Organization Type The contract’s organization type
Contract Name The name the contract is known by in HPMS
Organization Marketing Name The name the contract markets to members
Parent Organization The parent organization of the contract
Appeals Total Auto-Forward Cases The total number of Part D appeals that were not processed in a timely manner, and subsequently auto-forwarded to the IRE (Maximus)
2011 part D enrollment The average 2011 monthly enrollment
Appeals Upheld Total Cases Total number of Part D appeals cases which were upheld
Upheld Cases The number of Part D appeals cases which were upheld
Upheld: Fully Reversed The number of Part D appeals cases which were reversed
Upheld: Partially Reversed The number of Part D appeals cases which were partially reversed
Total CTM Complaints The total number of non-excluded complaints for the contract
Complaint Average Enrollment The average enrollment used in the final calculation
C. CTM IDs page
The CTM IDs page contains the case-level data of the non-excluded cases used in producing the Part D Complaints measure (D06). This page becomes available during the first plan preview. Table M-9 below explains each of the columns displayed on this page.

DRAFT DRAFT
(Last Updated 08/09/2012) DRAFT Page 95
Table M-9: CTM IDs page fields
HPMS Field Label Field Description
Contract Number The contract number associated with the data
Organization Marketing Name The name the contract markets to members
Contract Name The name the contract is known by in HPMS
Complaint ID The case number associated with the complaint in the HPMS CTM module
Complaint Category ID The complaint category identifier associated with this case
Category Description The complaint category description associated with this case
Complaint Subcategory ID The complaint subcategory identifier associated with this case
Subcategory Description The complaint subcategory description associated with this case
D. Auto-Forward Details page
The Auto-Forward Details page contains the case-level data of the non-excluded cases used in producing the Part D Appeals Auto-Forward measure (D03). This page becomes available during the first plan preview. Table M-10 below explains each of the columns displayed on this page.
Table M-10: Auto-Forward Details page fields
HPMS Field Label Field Description
Contract Number The contract number associated with the data
Organization Marketing Name The name the contract markets to members
Contract Name The name the contract is known by in HPMS
Appeal Number The case ID assigned to the appeal request
Request Received Date The date the appeal was received by the IRE
Request Type The type of appeal (auto-forward)
Appeal Priority The priority of the appeal (standard or expedited)
Appeal Disposition The disposition of the IRE (Maximus)
Appeal End Date The end date of the appeal
E. Upheld Details page
The Upheld Details page contains the case-level data of the non-excluded cases used in producing the Part D Appeals Upheld measure (D04). This page becomes available during the first plan preview. Table M-11 below explains each of the columns displayed on this page.
Table M-11: Upheld Details page fields
HPMS Field Label Field Description
Contract Number The contract number associated with the data
Organization Marketing Name The name the contract markets to members
Contract Name The name the contract is known by in HPMS
Appeal Number The case ID assigned to the appeal request
Request Received Date The date the appeal was received by the IRE
Deadline The deadline for the decision
Appeal Priority The priority of the appeal (standard or expedited)
Appeal Disposition The disposition of the IRE (Maximus)
Appeal End Date The end date of the appeal
Status The status of the appeal
F. Plan Improvement page
The Plan Improvement page is constructed in the same manner as the Measure Data page. This page becomes available during the second plan preview.
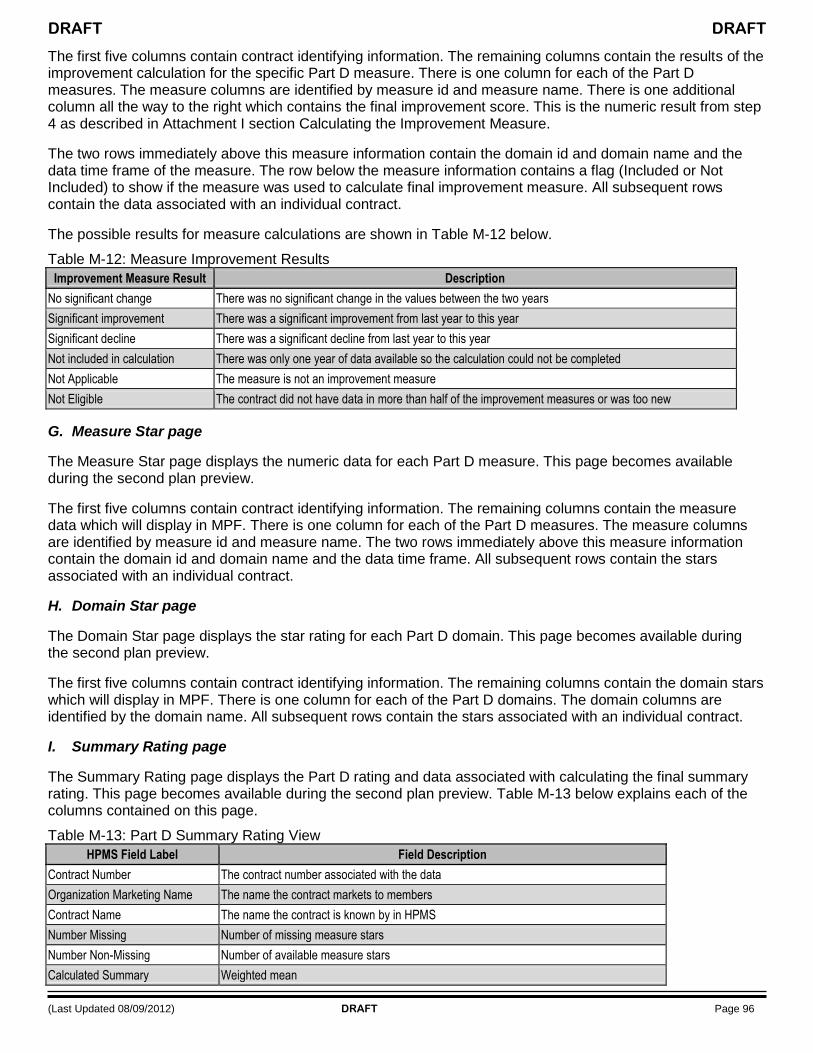
DRAFT DRAFT
(Last Updated 08/09/2012) DRAFT Page 96
The first five columns contain contract identifying information. The remaining columns contain the results of the improvement calculation for the specific Part D measure. There is one column for each of the Part D measures. The measure columns are identified by measure id and measure name. There is one additional column all the way to the right which contains the final improvement score. This is the numeric result from step 4 as described in Attachment I section Calculating the Improvement Measure.
The two rows immediately above this measure information contain the domain id and domain name and the data time frame of the measure. The row below the measure information contains a flag (Included or Not Included) to show if the measure was used to calculate final improvement measure. All subsequent rows contain the data associated with an individual contract.
The possible results for measure calculations are shown in Table M-12 below.
Table M-12: Measure Improvement Results
Improvement Measure Result Description
No significant change There was no significant change in the values between the two years
Significant improvement There was a significant improvement from last year to this year
Significant decline There was a significant decline from last year to this year
Not included in calculation There was only one year of data available so the calculation could not be completed
Not Applicable The measure is not an improvement measure
Not Eligible The contract did not have data in more than half of the improvement measures or was too new
G. Measure Star page
The Measure Star page displays the numeric data for each Part D measure. This page becomes available during the second plan preview.
The first five columns contain contract identifying information. The remaining columns contain the measure data which will display in MPF. There is one column for each of the Part D measures. The measure columns are identified by measure id and measure name. The two rows immediately above this measure information contain the domain id and domain name and the data time frame. All subsequent rows contain the stars associated with an individual contract.
H. Domain Star page
The Domain Star page displays the star rating for each Part D domain. This page becomes available during the second plan preview.
The first five columns contain contract identifying information. The remaining columns contain the domain stars which will display in MPF. There is one column for each of the Part D domains. The domain columns are identified by the domain name. All subsequent rows contain the stars associated with an individual contract.
I. Summary Rating page
The Summary Rating page displays the Part D rating and data associated with calculating the final summary rating. This page becomes available during the second plan preview. Table M-13 below explains each of the columns contained on this page.
Table M-13: Part D Summary Rating View
HPMS Field Label Field Description
Contract Number The contract number associated with the data
Organization Marketing Name The name the contract markets to members
Contract Name The name the contract is known by in HPMS
Number Missing Number of missing measure stars
Number Non-Missing Number of available measure stars
Calculated Summary Weighted mean

DRAFT DRAFT
(Last Updated 08/09/2012) DRAFT Page 97
HPMS Field Label Field Description
Calculated Variance Weighted variance
Variance Category Weighted variance category
iFactor Weighted i-Factor
Sumnsumifact Weighted mean plus weighted i-Factor
Summary Score Final summary score (i.e., rounded Sumnsumifact)
Calculated Score Percentile Rank Percentile ranking of Sumnsumifact
Variance Percentile Rank Percentile ranking of weighted variance
PartDO Part D offered flag
SNP Special Needs Plan flag
Contract Type The contract plan type used to compute the ratings
Low Performing Icon Will the contract receive a Low Performing Icon (Yes/No)
High Performing Icon Will the contract receive a High Performing Icon (Yes/No)
Improvement Measure Usage Was the improvement measure (D09) used in the final Part D Summary Rating? (Yes/No)
Sanction Deduction Did this contract receive an adjustment for contracts under sanction (Yes/No)
J. Technical Notes link
The Technical Notes link provides the user with a copy of the 2013 Plan Ratings Technical Notes. A draft version of these technical notes becomes available during the first plan preview. There are two scheduled times when this document is updated, the first is for the second plan preview. The other scheduled update is when the document has been finalized (no longer a draft) which occurs when the ratings data have been posted to MPF. There are also non-scheduled updates, which occur whenever there have been significant changes made to the document to correct errors found by any of the readers or by CMS.
Left clicking on the Technical Notes link will open a new browser window which will display a PDF of the 2013 Plan Ratings technical notes. Right clicking on the technical notes link will pop up a context menu which contains Save Target As , clicking on this will allow the user to download and save a copy of the PDF document.
K. Medication NDC List – Part D High Risk Medication Measure link
The Medication NDC List – Part D High Risk Medication Measure link provides the user a means to down-load a copy of the medication list used for the Part D High Risk Medication measure (D14). This downloadable file is in Excel format.
L. Medication NDC List – Part D Diabetes Treatment Measure link
The Medication NDC List – Part D Diabetes Treatment Measure link provides the user a means to down-load a copy of the medication list used for the Part D Diabetes Treatment measure (D15). This downloadable file is in Excel format.
M. Medication NDC List – Part D Medication Adherence Measure link
The Medication NDC List – Part D Medication Adherence Measure link provides the user a means to down-load a copy of the medication list used for the Part D Medication Adherence measures (D16, D17 & D18). This downloadable file is in Excel format.