Medicare Fee-For-Service (FFS) Hospital … Fee-For-Service (FFS) Hospital Readmissions: Q3...
17
Medicare Fee-For-Service (FFS) Hospital Readmissions: Q3 2013–Q2 2014 State of Florida Region 8 Please contact Edna Clifton via email at [email protected] or by phone at 813.865.3579 for additional information Data Dictionary Provided on Page A
Transcript of Medicare Fee-For-Service (FFS) Hospital … Fee-For-Service (FFS) Hospital Readmissions: Q3...

Medicare Fee-For-Service (FFS)
Hospital Readmissions:
Q3 2013–Q2 2014
State of Florida
Region 8
Please contact Edna Clifton via email at [email protected]
or by phone at 813.865.3579 for additional information
Data Dictionary Provided on Page A

Region 8 March 2015 Page | 1
Readmission Report (Q3 2013–Q2 2014)
Region 8 Overview
1 Data Source: ICPC Quarterly Scorecard (January 1, 2013 through December 31, 2013). 2 These data will differ from subsequent data included in Table 6, as some data are excluded from this calculation. Please refer to the appendix for additional information on the
methodology.
Table 1: 30-Day All-Cause Readmission Rates—Q3 2013–Q2 2014 Baseline
(CY 2013) Current Year 1
Goal RIR to Date Q3 13 Q4 13 Q1 14 Q2 14
Region 8 19.0% 19.9% 18.9% 18.7% 19.6%
27,789/146,134 6,674/33,499 6,692/35,348 7,259/38,821 7,093/36,146
Florida 19.1% 19.8% 19.3% 18.8% 19.5%
143,943/752,612 34,396/173,856 35,544/184,227 38,165/202,670 36,869/189,007
Nation1 18.0%
Table 2: Number of Emergency Department (ED) Visits—Q3 2013–Q2 20141
Q3 2013 Q4 2013 Q1 2014 Q2 2014
Region 8 31,523 34,403 36,883 34,296
Florida 180,722 195,679 210,015 195,953
Table 3: Number of Observation Stays—Q3 2013 – Q2 20142
Q3 2013 Q4 2013 Q1 2014 Q2 2014
Region 8 7,454 8,004 8,241 7,125
Florida 36,734 37,897 38,823 35,359
Table 5: All-Cause Average Readmissions Rates by Region Region Average Rate
Region 1 17.3%
Region 2 18.5%
Region 3 19.4%
Region 4 20.7%
Region 5 18.4%
Region 6 22.7%
Region 7 16.6%
Region 8 19.3%
Table 4: Physician Follow-up Visits from Patients Discharged from Hospital Directly to Home—Q3 2013–Q2 20142
Discharges to Home Total Follow-up in 30 Days % Follow-up Readmitted Count Follow-up Count % with Follow-up Days Count %
Region 8 46,104 32,223 69.9%
No 37,997 28,224 74.3% 01 to 14 22,567 80.0%
15 to 30 5,657 20.0%
Yes 8,107 3,999 49.3% 01 to 14 3,748 93.7%
15 to 30 251 6.3%

Region 8 March 2015 Page | 2
Readmission Report (Q3 2013–Q2 2014)
Figure 1: Florida and National Outpatient ED Visits, Observation Stays, and Inpatient Admissions3,4
3 ED visits and observations stays resulting in an inpatient stay are not included in this calculation. 4 National data are unavailable for Q1 2014.
0
50
100
150
200
250
Q2 2011 Q3 2011 Q4 2011 Q1 2012 Q2 2012 Q3 2012 Q4 2012 Q1 2013 Q2 2013 Q3 2013 Q4 2013 Q1 2014 Q2 2014
Enco
un
ters
by
Tho
usa
nd
s
Florida ED Visits Florida Observation Stays Florida Admissions
0
2
4
Q1 2011 Q2 2011 Q3 2011 Q4 2011 Q1 2012 Q2 2012 Q3 2012 Q4 2012 Q1 2013 Q2 2013 Q3 2013 Q4 2013
Enco
un
ters
by
Mill
ion
s
National ED Visits National Observation Stays National Admissions

Region 8 March 2015 Page | 3
Readmission Report (Q3 2013–Q2 2014)
Table 6: Discharge Distribution after Inpatient Hospitalization for All Causes—Q3 2013–Q2 2014
Group
Setting
Discharged To
30-Day
Readmit Rate
Discharges Readmits within 30
Days
30-Day Readmits to Same Hospital
30-Day Readmits to Different Hospital
Days to Readmission
N % N % 0–3 Days 4–7 Days 8–14 Days 15–21 Days 22–30 Days
N % N % N % N % N %
Region 8
Home 17.8% 63,397 11,313 8,186 72.4% 3,127 27.6% 1,957 17.3% 2,131 18.8% 2,807 24.8% 2,192 19.4% 2,226 19.7%
SNF 21.6% 34,708 7,497 5,678 75.7% 1,819 24.3% 1,097 14.6% 1,390 18.5% 1,901 25.4% 1,514 20.2% 1,595 21.3%
HHA 21.5% 28,164 6,052 4,809 79.5% 1,243 20.5% 986 16.3% 1,206 19.9% 1,605 26.5% 1,101 18.2% 1,154 19.1%
Hospice 2.7% 5,054 135 97 71.9% 38 28.1% 28 20.7% 27 20.0% 36 26.7% 23 17.0% 21 15.6%
Other 21.8% 12,491 2,721 1,639 60.2% 1,082 39.8% 605 22.2% 435 16.0% 609 22.4% 530 19.5% 542 19.9%
Total 19.3% 143,814 27,718 20,409 73.6% 7,309 26.4% 4,673 16.9% 5,189 18.7% 6,958 25.1% 5,360 19.3% 5,538 20.0%
Florida
Home 17.8% 345,669 61,699 45,067 73.0% 16,632 27.0% 10,668 17.3% 11,596 18.8% 15,338 24.9% 11,891 19.3% 12,206 19.8%
SNF 22.4% 160,040 35,811 27,310 76.3% 8,501 23.7% 5,469 15.3% 6,520 18.2% 9,237 25.8% 7,241 20.2% 7,344 20.5%
HHA 21.2% 150,438 31,861 25,452 79.9% 6,409 20.1% 5,414 17.0% 6,307 19.8% 8,141 25.6% 5,922 18.6% 6,077 19.1%
Hospice 2.6% 28,791 761 539 70.8% 222 29.2% 179 23.5% 146 19.2% 199 26.1% 113 14.8% 124 16.3%
Other 22.9% 64,822 14,842 9,136 61.6% 5,706 38.4% 3,471 23.4% 2,494 16.8% 3,287 22.1% 2,687 18.1% 2,903 19.6%
Total 19.3% 749,760 144,974 107,504 74.2% 37,470 25.8% 25,201 17.4% 27,063 18.7% 36,202 25.0% 27,854 19.2% 28,654 19.8%
Figure 2: 30-Day All-Cause Readmission Rates5
5 National data are obtained from the ICPC Quarterly Scorecard (January 1, 2013 through December 31, 2013).
0%
5%
10%
15%
20%
25%
Q2 2011 Q3 2011 Q4 2011 Q1 2012 Q2 2012 Q3 2012 Q4 2012 Q1 2013 Q2 2013 Q3 2013 Q4 2013 Q1 2014 Q2 2014
All-
Cau
se R
ead
mis
sio
n R
ate
Region State Nation
Region 8 March 2015 Page | 4
Readmission Report (Q3 2013–Q2 2014)
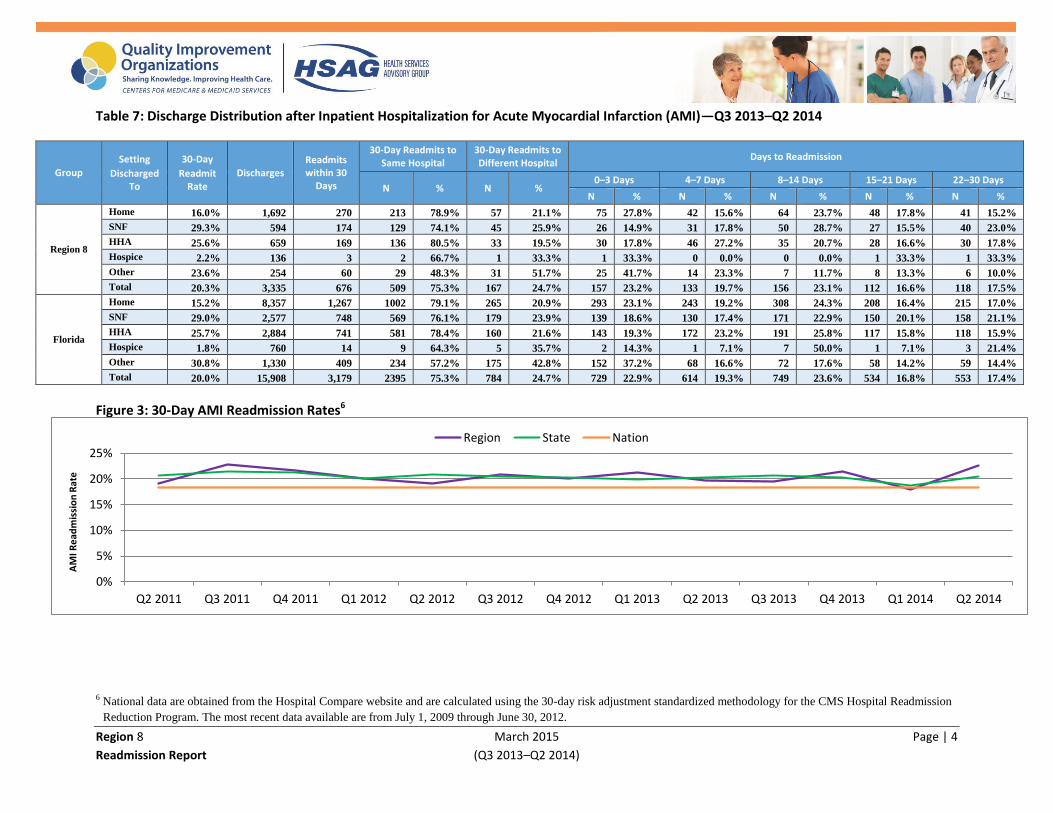
Table 7: Discharge Distribution after Inpatient Hospitalization for Acute Myocardial Infarction (AMI)—Q3 2013–Q2 2014
Group
Setting
Discharged To
30-Day
Readmit Rate
Discharges Readmits within 30
Days
30-Day Readmits to Same Hospital
30-Day Readmits to Different Hospital
Days to Readmission
N % N % 0–3 Days 4–7 Days 8–14 Days 15–21 Days 22–30 Days
N % N % N % N % N %
Region 8
Home 16.0% 1,692 270 213 78.9% 57 21.1% 75 27.8% 42 15.6% 64 23.7% 48 17.8% 41 15.2%
SNF 29.3% 594 174 129 74.1% 45 25.9% 26 14.9% 31 17.8% 50 28.7% 27 15.5% 40 23.0%
HHA 25.6% 659 169 136 80.5% 33 19.5% 30 17.8% 46 27.2% 35 20.7% 28 16.6% 30 17.8%
Hospice 2.2% 136 3 2 66.7% 1 33.3% 1 33.3% 0 0.0% 0 0.0% 1 33.3% 1 33.3%
Other 23.6% 254 60 29 48.3% 31 51.7% 25 41.7% 14 23.3% 7 11.7% 8 13.3% 6 10.0%
Total 20.3% 3,335 676 509 75.3% 167 24.7% 157 23.2% 133 19.7% 156 23.1% 112 16.6% 118 17.5%
Florida
Home 15.2% 8,357 1,267 1002 79.1% 265 20.9% 293 23.1% 243 19.2% 308 24.3% 208 16.4% 215 17.0%
SNF 29.0% 2,577 748 569 76.1% 179 23.9% 139 18.6% 130 17.4% 171 22.9% 150 20.1% 158 21.1%
HHA 25.7% 2,884 741 581 78.4% 160 21.6% 143 19.3% 172 23.2% 191 25.8% 117 15.8% 118 15.9%
Hospice 1.8% 760 14 9 64.3% 5 35.7% 2 14.3% 1 7.1% 7 50.0% 1 7.1% 3 21.4%
Other 30.8% 1,330 409 234 57.2% 175 42.8% 152 37.2% 68 16.6% 72 17.6% 58 14.2% 59 14.4%
Total 20.0% 15,908 3,179 2395 75.3% 784 24.7% 729 22.9% 614 19.3% 749 23.6% 534 16.8% 553 17.4%
Figure 3: 30-Day AMI Readmission Rates6
<<figure3>>
6 National data are obtained from the Hospital Compare website and are calculated using the 30-day risk adjustment standardized methodology for the CMS Hospital Readmission
Reduction Program. The most recent data available are from July 1, 2009 through June 30, 2012.
0%
5%
10%
15%
20%
25%
Q2 2011 Q3 2011 Q4 2011 Q1 2012 Q2 2012 Q3 2012 Q4 2012 Q1 2013 Q2 2013 Q3 2013 Q4 2013 Q1 2014 Q2 2014
AM
I Re
adm
issi
on
Rat
e
Region State Nation

Region 8 March 2015 Page | 5
Readmission Report (Q3 2013–Q2 2014)
Table 8: Discharge Distribution after Inpatient Hospitalization for Heart Failure (HF)—Q3 2013–Q2 2014
Group
Setting
Discharged To
30-Day
Readmit Rate
Discharges Readmits within 30
Days
30-Day Readmits to Same Hospital
30-Day Readmits to Different Hospital
Days to Readmission
N % N % 0–3 Days 4–7 Days 8–14 Days 15–21 Days 22–30 Days
N % N % N % N % N %
Region 8
Home 25.3% 2,680 678 535 78.9% 143 21.1% 95 14.0% 123 18.1% 178 26.3% 139 20.5% 143 21.1%
SNF 30.4% 1,593 485 393 81.0% 92 19.0% 60 12.4% 88 18.1% 125 25.8% 98 20.2% 114 23.5%
HHA 28.4% 1,931 549 442 80.5% 107 19.5% 76 13.8% 114 20.8% 150 27.3% 98 17.9% 111 20.2%
Hospice 2.0% 348 7 4 57.1% 3 42.9% 4 57.1% 0 0.0% 1 14.3% 1 14.3% 1 14.3%
Other 28.0% 492 138 91 65.9% 47 34.1% 34 24.6% 20 14.5% 26 18.8% 26 18.8% 32 23.2%
Total 26.4% 7,044 1,857 1,465 78.9% 392 21.1% 269 14.5% 345 18.6% 480 25.8% 362 19.5% 401 21.6%
Florida
Home 24.6% 15,734 3,873 3,045 78.6% 828 21.4% 563 14.5% 673 17.4% 995 25.7% 800 20.7% 842 21.7%
SNF 31.5% 7,598 2,393 1,885 78.8% 508 21.2% 312 13.0% 433 18.1% 632 26.4% 508 21.2% 508 21.2%
HHA 28.7% 10,111 2,903 2,370 81.6% 533 18.4% 439 15.1% 551 19.0% 810 27.9% 544 18.7% 559 19.3%
Hospice 2.8% 2,082 59 47 79.7% 12 20.3% 16 27.1% 11 18.6% 12 20.3% 6 10.2% 14 23.7%
Other 31.5% 2,562 808 526 65.1% 282 34.9% 193 23.9% 123 15.2% 174 21.5% 151 18.7% 167 20.7%
Total 26.4% 38,087 10,036 7,873 78.4% 2,163 21.6% 1,523 15.2% 1,791 17.8% 2,623 26.1% 2,009 20.0% 2,090 20.8%
Figure 4: 30-Day HF Readmission Rates7
<<figure4>>
7 National data are obtained from the Hospital Compare website and are calculated using the 30-day risk adjustment standardized methodology for the CMS Hospital Readmission
Reduction Program. The most recent data available are from July 1, 2009 through June 30, 2012.
0%
10%
20%
30%
Q2 2011 Q3 2011 Q4 2011 Q1 2012 Q2 2012 Q3 2012 Q4 2012 Q1 2013 Q2 2013 Q3 2013 Q4 2013 Q1 2014 Q2 2014
HF
Re
adm
issi
on
Rat
e
Region State Nation

Region 8 March 2015 Page | 6
Readmission Report (Q3 2013–Q2 2014)
Table 9: Discharge Distribution after Inpatient Hospitalization for Pneumonia (PNE)—Q3 2013–Q2 2014
Group
Setting
Discharged To
30-Day
Readmit Rate
Discharges Readmits within 30
Days
30-Day Readmits to Same Hospital
30-Day Readmits to Different Hospital
Days to Readmission
N % N % 0–3 Days 4–7 Days 8–14 Days 15–21 Days 22–30 Days
N % N % N % N % N %
Region 8
Home 15.4% 1,941 299 237 79.3% 62 20.7% 49 16.4% 51 17.1% 66 22.1% 65 21.7% 68 22.7%
SNF 24.3% 1,150 279 228 81.7% 51 18.3% 34 12.2% 57 20.4% 80 28.7% 54 19.4% 54 19.4%
HHA 21.3% 964 205 167 81.5% 38 18.5% 36 17.6% 39 19.0% 57 27.8% 35 17.1% 38 18.5%
Hospice 3.1% 227 7 6 85.7% 1 14.3% 3 42.9% 1 14.3% 1 14.3% 1 14.3% 1 14.3%
Other 22.4% 392 88 52 59.1% 36 40.9% 19 21.6% 16 18.2% 22 25.0% 17 19.3% 14 15.9%
Total 18.8% 4,674 878 690 78.6% 188 21.4% 141 16.1% 164 18.7% 226 25.7% 172 19.6% 175 19.9%
Florida
Home 15.6% 12,020 1,874 1,463 78.1% 411 21.9% 374 20.0% 325 17.3% 436 23.3% 343 18.3% 396 21.1%
SNF 24.7% 5,883 1,452 1,150 79.2% 302 20.8% 205 14.1% 265 18.3% 383 26.4% 300 20.7% 299 20.6%
HHA 22.6% 5,415 1,225 1,011 82.5% 214 17.5% 220 18.0% 226 18.4% 303 24.7% 235 19.2% 241 19.7%
Hospice 3.2% 1,377 44 29 65.9% 15 34.1% 11 25.0% 10 22.7% 9 20.5% 5 11.4% 9 20.5%
Other 22.2% 1,962 436 281 64.4% 155 35.6% 104 23.9% 81 18.6% 101 23.2% 66 15.1% 84 19.3%
Total 18.9% 26,657 5,031 3,934 78.2% 1,097 21.8% 914 18.2% 907 18.0% 1,232 24.5% 949 18.9% 1,029 20.5%
Figure 5: 30-Day PNE Readmission Rates8
8 National data are obtained from the Hospital Compare website and are calculated using the 30-day risk adjustment standardized methodology for the CMS Hospital Readmission
Reduction Program. The most recent data available are from July 1, 2009 through June 30, 2012.
0%
5%
10%
15%
20%
25%
Q2 2011 Q3 2011 Q4 2011 Q1 2012 Q2 2012 Q3 2012 Q4 2012 Q1 2013 Q2 2013 Q3 2013 Q4 2013 Q1 2014 Q2 2014
PN
E R
ead
mis
sio
n R
ate
Region State Nation

Region 8 March 2015 Page | 7
Readmission Report (Q3 2013–Q2 2014)
Table 10: Discharge Distribution after Inpatient Hospitalization for Chronic Obstructive Pulmonary Disease (COPD)—Q3 2013–Q2 2014
Group
Setting
Discharged To
30-Day
Readmit Rate
Discharges Readmits within 30
Days
30-Day Readmits to Same Hospital
30-Day Readmits to Different Hospital
Days to Readmission
N % N % 0–3 Days 4–7 Days 8–14 Days 15–21 Days 22–30 Days
N % N % N % N % N %
Region 8
Home 20.9% 3,641 760 623 82.0% 137 18.0% 121 15.9% 111 14.6% 212 27.9% 152 20.0% 164 21.6%
SNF 26.6% 1,123 299 235 78.6% 64 21.4% 40 13.4% 39 13.0% 79 26.4% 65 21.7% 76 25.4%
HHA 26.8% 1,654 444 379 85.4% 65 14.6% 68 15.3% 65 14.6% 124 27.9% 96 21.6% 91 20.5%
Hospice 5.7% 174 10 9 90.0% 1 10.0% 2 20.0% 1 10.0% 2 20.0% 4 40.0% 1 10.0%
Other 28.8% 493 142 84 59.2% 58 40.8% 32 22.5% 16 11.3% 36 25.4% 32 22.5% 26 18.3%
Total 23.4% 7,085 1,655 1,330 80.4% 325 19.6% 263 15.9% 232 14.0% 453 27.4% 349 21.1% 358 21.6%
Florida
Home 20.6% 18,023 3,704 3,004 81.1% 700 18.9% 582 15.7% 589 15.9% 947 25.6% 773 20.9% 813 21.9%
SNF 27.7% 4,663 1,292 1,002 77.6% 290 22.4% 184 14.2% 202 15.6% 329 25.5% 281 21.7% 296 22.9%
HHA 26.7% 7,007 1,873 1,597 85.3% 276 14.7% 285 15.2% 294 15.7% 496 26.5% 400 21.4% 398 21.2%
Hospice 3.6% 887 32 22 68.8% 10 31.3% 5 15.6% 6 18.8% 8 25.0% 8 25.0% 5 15.6%
Other 27.7% 2,180 603 380 63.0% 223 37.0% 134 22.2% 92 15.3% 126 20.9% 124 20.6% 127 21.1%
Total 22.9% 32,760 7,504 6,005 80.0% 1,499 20.0% 1,190 15.9% 1,183 15.8% 1,906 25.4% 1,586 21.1% 1,639 21.8%
Figure 6: 30-Day COPD Readmission Rates9
<<figure6>>
9 National COPD data are unavailable on the Hospital Compare website.
0%
10%
20%
30%
Q2 2011 Q3 2011 Q4 2011 Q1 2012 Q2 2012 Q3 2012 Q4 2012 Q1 2013 Q2 2013 Q3 2013 Q4 2013 Q1 2014 Q2 2014
CO
PD
Re
adm
issi
on
Rat
e
Region State

Region 8 March 2015 Page | 8
Readmission Report (Q3 2013–Q2 2014)
Table 11: Discharge Distribution after Inpatient Hospitalization for Total Hip/Knee Replacement (THA/TKA)—Q3 2013–Q2 2014
Group
Setting
Discharged To
30-Day
Readmit Rate
Discharges Readmits within 30
Days
30-Day Readmits to Same Hospital
30-Day Readmits to Different Hospital
Days to Readmission
N % N % 0–3 Days 4–7 Days 8–14 Days 15–21 Days 22–30 Days
N % N % N % N % N %
Region 8
Home 0.6% 171 1 1 100.0% 0 0.0% 0 0.0% 1 100.0% 0 0.0% 0 0.0% 0 0.0%
SNF 6.1% 1,904 116 88 75.9% 28 24.1% 14 12.1% 23 19.8% 26 22.4% 22 19.0% 31 26.7%
HHA 3.5% 2,202 77 50 64.9% 27 35.1% 13 16.9% 13 16.9% 26 33.8% 11 14.3% 14 18.2%
Hospice 0.0% 2 0 0 0.0% 0 0.0% 0 0.0% 0 0.0% 0 0.0% 0 0.0% 0 0.0%
Other 7.0% 313 22 17 77.3% 5 22.7% 3 13.6% 3 13.6% 6 27.3% 4 18.2% 6 27.3%
Total 4.7% 4,592 216 156 72.2% 60 27.8% 30 13.9% 40 18.5% 58 26.9% 37 17.1% 51 23.6%
Florida
Home 4.0% 1,494 60 50 83.3% 10 16.7% 13 21.7% 20 33.3% 9 15.0% 10 16.7% 8 13.3%
SNF 6.7% 10,574 704 518 73.6% 186 26.4% 121 17.2% 130 18.5% 181 25.7% 126 17.9% 146 20.7%
HHA 4.1% 13,557 556 422 75.9% 134 24.1% 95 17.1% 140 25.2% 137 24.6% 79 14.2% 105 18.9%
Hospice 0.0% 8 0 0 0.0% 0 0.0% 0 0.0% 0 0.0% 0 0.0% 0 0.0% 0 0.0%
Other 8.7% 1,917 166 124 74.7% 42 25.3% 27 16.3% 29 17.5% 44 26.5% 31 18.7% 35 21.1%
Total 5.4% 27,550 1,486 1,114 75.0% 372 25.0% 256 17.2% 319 21.5% 371 25.0% 246 16.6% 294 19.8%
Figure 7: 30-Day THA/TKA Readmission Rates10
10 National data are obtained from the Hospital Compare website and are calculated using the 30-day risk adjustment standardized methodology for the CMS Hospital Readmission
Reduction Program. The most recent data available are from July 1, 2009 through June 30, 2012.
0%
2%
4%
6%
8%
Q2 2011 Q3 2011 Q4 2011 Q1 2012 Q2 2012 Q3 2012 Q4 2012 Q1 2013 Q2 2013 Q3 2013 Q4 2013 Q1 2014 Q2 2014
TKA
/TH
A R
ead
mis
sio
n R
ate
Region State Nation

Region 8 March 2015 Page | 9
Readmission Report (Q3 2013–Q2 2014)
Table 12: Top 10 Index Admission Diagnosis Related Groups (DRGs) for Region 8—Q3 2013–Q2 201411
DRG Code
12
Description N %
470 MAJOR JOINT REPLACEMENT OR REATTACHMENT OF LOWER EXTREMITY W/O MCC 5,169 3.7%
871 SEPTICEMIA OR SEVERE SEPSIS W/O MV 96+ HOURS W MCC 4,034 2.9%
392 ESOPHAGITIS, GASTROENT & MISC DIGEST DISORDERS W/O MCC 3,659 2.6%
885 PSYCHOSES 3,528 2.5%
690 KIDNEY & URINARY TRACT INFECTIONS W/O MCC 3,335 2.4%
291 HEART FAILURE & SHOCK W MCC 2,636 1.9%
292 HEART FAILURE & SHOCK W CC 2,574 1.8%
190 CHRONIC OBSTRUCTIVE PULMONARY DISEASE W MCC 2,534 1.8%
191 CHRONIC OBSTRUCTIVE PULMONARY DISEASE W CC 2,311 1.6%
683 RENAL FAILURE W CC 2,231 1.6%
Table 13: Top 10 Readmission DRGs for Region 8—Q3 2013–Q2 201413
DRG Code Description N %
871 SEPTICEMIA OR SEVERE SEPSIS W/O MV 96+ HOURS W MCC 1,338 4.9%
885 PSYCHOSES 954 3.5%
291 HEART FAILURE & SHOCK W MCC 875 3.2%
292 HEART FAILURE & SHOCK W CC 677 2.5%
392 ESOPHAGITIS, GASTROENT & MISC DIGEST DISORDERS W/O MCC 602 2.2%
690 KIDNEY & URINARY TRACT INFECTIONS W/O MCC 536 2.0%
190 CHRONIC OBSTRUCTIVE PULMONARY DISEASE W MCC 528 2.0%
683 RENAL FAILURE W CC 521 1.9%
682 RENAL FAILURE W MCC 455 1.7%
378 G.I. HEMORRHAGE W CC 453 1.7%
11
Hospitalizations with a DRG code of ‘000’ are excluded from this calculation. 12
Hospitalizations with DRG code of ‘000’ are excluded. 13
Ibid.

Region 8 March 2015 Page | A
Readmission Report (Q3 2013–Q2 2014)
Methodology and Data Source Information
The dashboard provides information regarding your hospital’s all-cause, acute myocardial infarction (AMI), heart failure
(HF), pneumonia (PNE), chronic obstructive pulmonary disease (COPD), and total hip/knee replacement (THA/TKA) 30-
day readmissions. Rates are calculated using hospital inpatient claims for Medicare Fee-For-Service (FFS) beneficiaries.
Data in this report are limited to Medicare FFS Part-A data for discharges from April 1, 2013, through March 31, 2014.14
Readmission rates in this report are not calculated using the 30-day risk standardized methodology for the Centers for
Medicare & Medicaid Services (CMS) Hospital Readmission Reduction Program or found on hospitalcompare.hhs.gov.
Readmission rates are updated quarterly with the most current time period’s data. The time periods illustrated in this
document are examples only and may not reflect the most current data period.
Pages 1 and 2 contain the following information.
Summary table Regional map
Emergency department (ED) visits and
observation stays tables Outpatient ED visits, observation stays, and inpatient
admissions graphs
Physician follow-up visits table
Example Dashboard (Pages 1 and 2)
14
The CSAT data file was used for this analysis. The CSAT data file is provided to HSAG by CMS. The CSAT data file includes Part A and Part B
claims for FFS beneficiaries. Please note that the results obtained from CSAT may vary from your own hospital’s results.
1 4
2 5
3
1
2
3
4

Region 8 March 2015 Page | B
Readmission Report (Q3 2013–Q2 2014)
Example Outpatient ED Visits, Observation Stays, and Inpatient Admissions Dashboard
Summary Table
The summary table contains your hospital’s Baseline and Current 30-day readmission rates, including the numerator and
denominator for each quarter. All rates are calculated from Medicare inpatient claims for FFS beneficiaries. See page E
for measure definitions. The summary table also includes Baseline and Current rates for the region, state, and nation. Due
to availability of the data, the national rates may be calculated from a different time period.
ED Visits and Observation Stays Tables
The ED visits and observation stays tables provide the count of ED visits and observation stays, respectively, for each
quarter in the current report period. These tables also include data for the region and state. ED visits and observation stays
resulting in an inpatient stay are not included in the counts.
Physician Follow-Up Table
For all-cause readmissions, Medicare FFS Part-B data were used to identify whether a beneficiary had a claim for a
physician office visit in the 30 days post discharge or before readmission for beneficiaries discharged to home. Patients
1
2
3
5

Region 8 March 2015 Page | C
Readmission Report (Q3 2013–Q2 2014)
discharged to home with claim for a post-acute service (e.g., home health, skilled nursing) in the 30 days post discharge or
before readmission are excluded.
Regional Map
The state of Florida was divided into eight regions. The regions are based on the Area Agencies on Aging Office –
Planning and Service Areas (PSA), with some areas aggregated to make eight regions. Aggregate readmission rates are
calculated for each region using the hospitals located in the region. The table shows regional readmission rates for each
region.
Outpatient ED Visits, Observation Stays, and Inpatient Admissions
The three graphs depict the volume of outpatient ED visits, observation stays, and inpatient admissions for your hospital,
the state, and the nation. The purpose of each is to monitor acute care utilization at the hospital, state, and national levels.
The counts are calculated for quarterly periods from Medicare acute care claims for FFS beneficiaries. Claims are
classified based on hierarchy rules similar to Medicare bundled payment rules. Each encounter counts as only one of three
types: (1) Inpatient admission, (2) Observation stay, or (3) ED visit. Therefore, ED visits and observation stays that result
in an inpatient stay are counted as an inpatient stay. ED visits that result in an observation stay, but not an inpatient stay,
are counted as an observation stay.
Pages 3 through 8 provide the following data for all-cause and condition-specific 30-day readmissions:
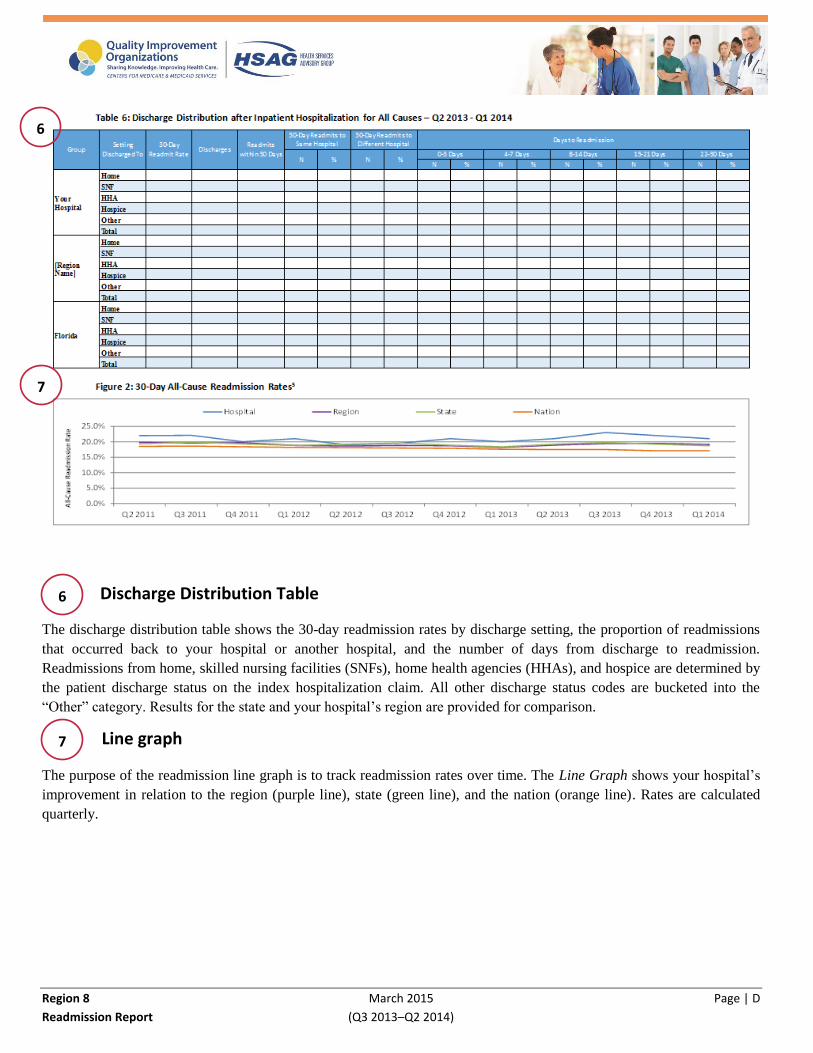
Discharge distribution table
Line graph
Example Dashboard (discharge distribution and line graph)
4
5
6
7
Region 8 March 2015 Page | D
Readmission Report (Q3 2013–Q2 2014)
Discharge Distribution Table
The discharge distribution table shows the 30-day readmission rates by discharge setting, the proportion of readmissions
that occurred back to your hospital or another hospital, and the number of days from discharge to readmission.
Readmissions from home, skilled nursing facilities (SNFs), home health agencies (HHAs), and hospice are determined by
the patient discharge status on the index hospitalization claim. All other discharge status codes are bucketed into the
“Other” category. Results for the state and your hospital’s region are provided for comparison.
Line graph
The purpose of the readmission line graph is to track readmission rates over time. The Line Graph shows your hospital’s
improvement in relation to the region (purple line), state (green line), and the nation (orange line). Rates are calculated
quarterly.
6
7
6
7

Region 8 March 2015 Page | E
Readmission Report (Q3 2013–Q2 2014)
Example Dashboard (Top 10 Diagnosis Related Groups)
Top 10 Diagnosis Related Groups (DRGs) at Admission and Readmission
Tables 12 and 13 on page 9 depict the 10 most common DRGs associated with all discharges and readmissions for the
time period. Hospitalizations with a DRG code of ‘000’ are excluded from this calculation.
Measure Definitions
All-Cause 30-Day Readmission Rates
All-cause readmission rates are calculated as the percentage of hospital admissions that occurred within 30 days of an
index admission for any condition. Each hospital admission within 30 days following an index admission is considered a
readmission (e.g., a beneficiary with four readmissions in the measurement period counts as four separate readmissions).
Any beneficiary who dies in the hospital or is transferred to another hospital on the same day is excluded from your
facility’s calculation. Readmissions from home, SNFs, HHAs, and hospice are determined by the patient discharge status
on the index hospitalization claim.
8
8

Region 8 March 2015 Page | F
Readmission Report (Q3 2013–Q2 2014)
Condition-Specific 30-Day Readmission Rates
When calculating condition-specific readmission rates, an admission is included if the principal diagnosis/procedure code
for the admission specifies that disease (i.e., AMI, HF, PNE, COPD, and THA/TKA). Condition-specific readmissions
include all-cause admissions that occur within 30 days of an index admission for the specific condition (e.g., a beneficiary
with an index admission of AMI who is readmitted for a urinary tract infection [UTI] is considered an AMI readmission).
Any beneficiary who dies in the hospital or is transferred to another hospital on the same day is excluded from your
facility’s calculation. The following table lists the codes used to identify the discharges for AMI, HF, PNE, COPD, and
THA/TKA.
Disease Diagnosis Codes
AMI15
410.00, 410.01, 410.10, 410.11, 410.20, 410.21, 410.30, 410.31, 410.40, 410.41, 410.50, 410.51, 410.60,
410.61, 410.70, 410.71, 410.80, 410.81, 410.90, 410.91
HF 402.01, 402.11, 402.91, 404.01, 404.03, 404.11, 404.13, 404.91, 404.93, 428
PNE
480.0, 480.1, 480.2, 480.3, 480.8, 480.9, 481.0, 482.0, 482.1, 482.2, 482.3, 482.31, 482.32, 482.39, 482.4,
482.41, 482.42, 482.49, 482.81, 482.82, 482.83, 482.84, 482.89, 482.9, 483.0, 483.1, 483.8, 485.0, 486.0,
487.0, 488.11
COPD 491.21, 491.22, 491.8, 491.9, 492.8, 493.20, 493.21, 493.22, 496, 518.81*, 518.82*, 518.84*, 799.1*
Procedure Procedural Codes
THA/TKA16
81.51, 81.54
* Principal diagnosis when combined with a secondary diagnosis of COPD (491.21, 491.22, 493.21, or 493.22)
ED Visits and Observation Stays
The following table lists the codes used to identify ED visits and observation stays.
Revenue Codes HCPCS
ED Visits 0450, 0451, 0452, 0456, 0459, 0981
Observation Stays 0762, 0760 AND G0378
15
If AMI is found to be the principal diagnosis for the first admission and the readmission has a primary diagnosis of 410.x2, the original discharge
is not included in the admission count. 16
This only includes elective primary THA/TKA procedures.

Region 8 March 2015 Page | G
Readmission Report (Q3 2013–Q2 2014)
Florida Counties by Region Region 1
Bay Gulf Liberty Taylor
Calhoun Holmes Madison Wakulla
Escambia Jackson Okaloosa Walton
Franklin Jefferson Santa Rosa Washington
Gadsden Leon
Region 2
Alachua Dixie Lafayette Putnam
Bradford Gilchrist Lake Sumter
Citrus Hamilton Levy Suwannee
Columbia Hernando Marion Union
Region 3
Baker Duval Nassau Volusia
Clay Flagler Saint Johns
Region 4
Brevard Osceola Seminole
Orange
Region 5
Indian River Okeechobee Saint Lucie
Martin Palm Beach
Region 6
Broward Miami-Dade Monroe
Region 7
Charlotte De Soto Hendry Sarasota
Collier Glades Lee
Region 8
Hardee Hillsborough Pasco Polk
Highlands Manatee Pinellas
This material was prepared by Health Services Advisory Group, the Medicare Quality Improvement Organization for Florida, under contract with the Centers for Medicare &
Medicaid Services (CMS), an agency of the U.S. Department of Health and Human Services. The contents presented do not necessarily reflect CMS policy.
Publication No. FL-11SOW-C.3-04062015-09