Medical Facilities Corporation TSX: DR...9 Unemployment Rate (%)1 U.S. Arkansas Indiana Oklahoma...
19
TSX: DR INVESTOR PRESENTATION JUNE 2017 Optimized. Enhanced.
Transcript of Medical Facilities Corporation TSX: DR...9 Unemployment Rate (%)1 U.S. Arkansas Indiana Oklahoma...
TSX: DR
INVESTOR PRESENTATION JUNE 2017
Optimized.Enhanced.
2
Forward-Looking Statements
This presentation may contain forward-looking statements within the meaning of certain securities laws, including the
“safe harbour” provisions of the Securities Act (Ontario) and other provincial securities law in Canada. These forward-
looking statements include, among others, statements with respect to our objectives, goals and strategies to achieve
those objectives and goals, as well as statements with respect to our beliefs, plans, objectives, expectations,
anticipations, estimates and intentions. The words “may”, “will”, “could”, “should”, “would”, “suspect”, “outlook”,
“believe”, “plan”, “anticipate”, “estimate”, “expect”, “intend”, “forecast”, “objective” and “continue” (or the negative
thereof), and words and expressions of similar import, are intended to identify forward-looking statements. Any such
statements are subject to risks and uncertainties that could cause actual results to differ materially from those
projected in these forward-looking statements. For more information on the risk factors related to these forward-
looking statements, please refer to the management’s discussion and analysis, annual information form and ongoing
quarterly filings of Medical Facilities Corporation available on SEDAR at www.sedar.com.

3
Transforming U.S. Healthcare Landscape
Acute Care Hospital
Specialty Surgical Hospital
Ambulatory Surgery Center
Urgent/Primary Care Center
MFC TODAY
Home Healthcare
Imaging Clinic
Other Specialty Clinic
(~5,500*)
(<300 physician-owned*)
(~5,500*)
* Estimated total U.S.

4
Multiple Payment Sources
Medicare20%
Medicaid18%
Other Government3%
Other Third Parties8%
Public Health and Investment
7%
Out of Pocket11%
Private Health Insurance33%
2015:
$3.2TRILLION
41% Public Health Insurance
Source: Kaiser Family Foundation

5
Growing Demand for Healthcare
DRIVERS:
Overall population growth
Aging population
Healthcare reform expanding coverage
Source: U.S. Census Bureau, 2010 based on National Population Projections 2008; 2015 & 2020 based on National Population Projections 2012Centers for Medicare & Medicaid Services, National Health Expenditure Projections 2011-2021
(millions) (US$ billion)
Po
pula
tio
n
Natio
nal Health Expenditure
0
1,000
2,000
3,000
4,000
5,000
0
100
200
300
400
2010 2015E 2020E
Under 45 years 45 to 64 years 65 years and over National Health Expenditure(US$ billion)

6
Changing Healthcare Industry Driving Acquisition Opportunities
Greater need for efficiency and scale among healthcare providers
Independent centers requiring scale to drive margin improvement
Portfolio rebalancing as a result of consolidation or service realignment makes attractive assets available
~940 healthcare transactions in 2016 ($72B)*
*Irving Levin Associates, cited by PRWeb, March 21, 2017
7
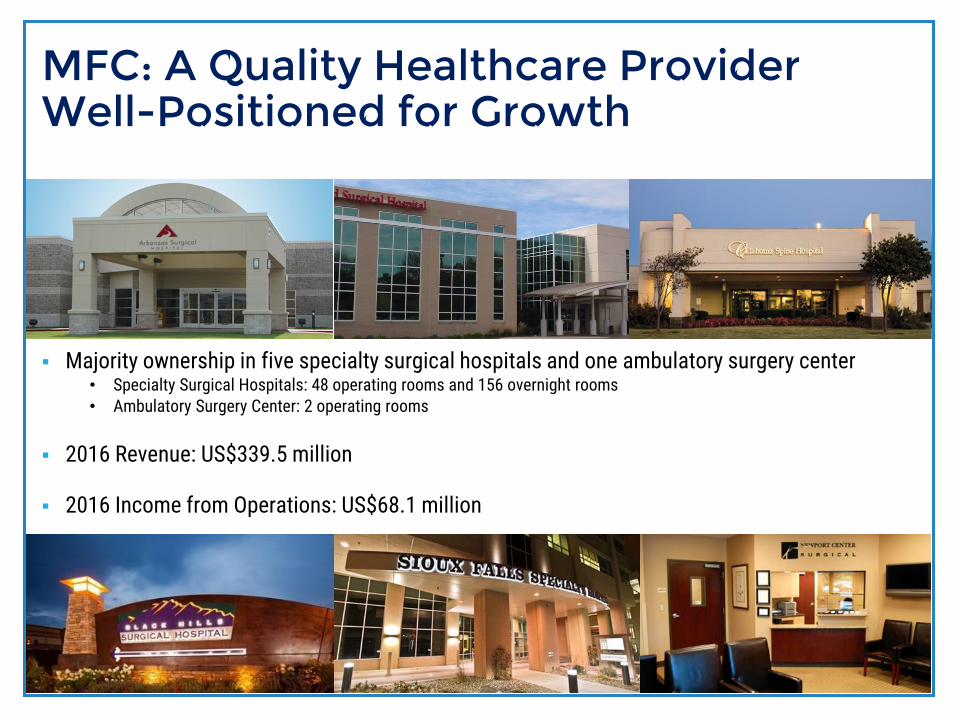
MFC: A Quality Healthcare Provider Well-Positioned for Growth
Majority ownership in five specialty surgical hospitals and one ambulatory surgery center • Specialty Surgical Hospitals: 48 operating rooms and 156 overnight rooms• Ambulatory Surgery Center: 2 operating rooms
2016 Revenue: US$339.5 million
2016 Income from Operations: US$68.1 million

8
MFC Specialty Surgical Hospitals
2
1 1
Specialty surgical hospitals have consistently demonstrated
HIGHER PATIENT SATISFACTIONratings resulting from
HIGHER QUALITY OF CARE RECEIVED
Our physician owned hospitals benefit from direct physician involvement in
facility management resulting inSUPERIOR PROCESSES AND EFFICIENCIES
1
FacilityOperating
SinceAcquired Operating Rooms Overnight Rooms Square Feet
Arkansas Surgical Hospital 2005 2012 11 41 126,000
Unity Medical and Surgical Hospital 2009 2016 6 29 50,000
Oklahoma Spine Hospital 1999 2005 7 25 61,000
Black Hills Surgical Hospital 1997 2004 11 26 75,000
Sioux Falls Specialty Hospital 1985 2004 13 35 76,000

9
Unemployment Rate (%)1 U.S. Arkansas Indiana Oklahoma South Dakota
2016 4.7 3.9 4.0 4.8 2.9
2015 5.0 4.3 4.6 4.6 2.8
65 and Over (% of population)2
2015 14.9 16.0 14.6 14.7 15.7
Situated in geographic regions that have proven to be resilient against challenging economic environments
MFC physicians and staff are integral part of our success, they provide patients with innovative treatments and optimal service
1 Source: The Bureau of Labor Statistics of the US Department of Labor.
2 Source: U.S. Census Bureau, U.S. Census Bureau, Population Division. Release Date: June 2016
Well-Situated in Current Markets
10
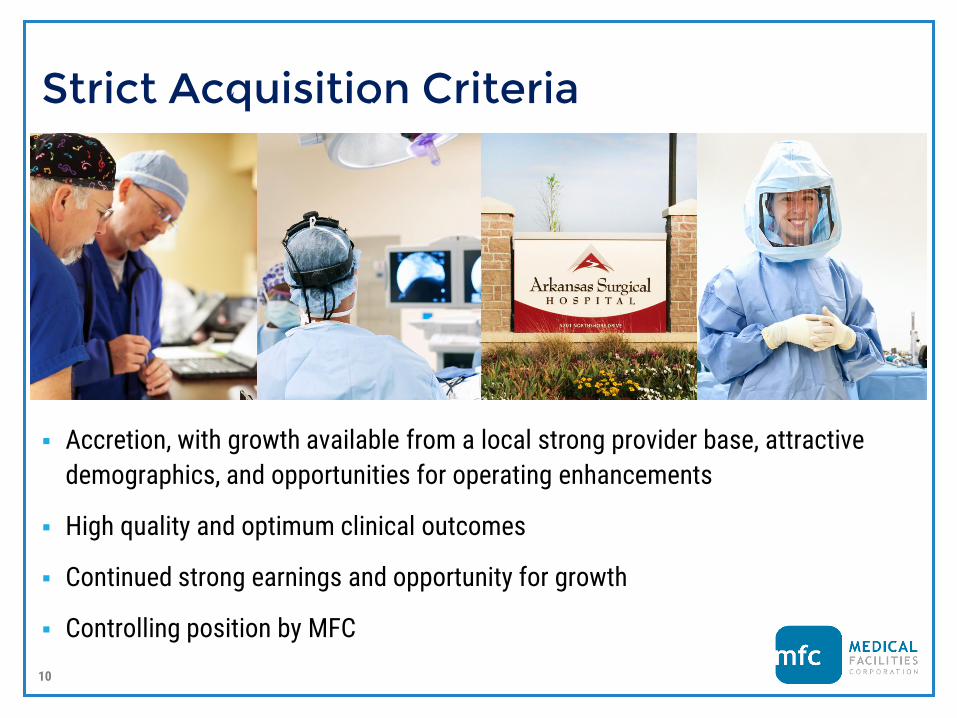
Strict Acquisition Criteria
Accretion, with growth available from a local strong provider base, attractive
demographics, and opportunities for operating enhancements
High quality and optimum clinical outcomes
Continued strong earnings and opportunity for growth
Controlling position by MFC
11
FinancialReview

12
Factors Driving Our Results
Revenues
Case Mix
Case Counts
Payor Mix
Ancillary Services
Levelof
Revenue
Operating Margins
Salaries & Benefits
Drugs & Supplies (incl. implants)
General & Administrative

13
Blue Cross/Blue Shield
Medicare/Medicaid
Workers’Compensation
Other Private Insurance
Other
MFC Payor Mix – 2016
34%
38%
7%
14%
7%
GROSS BILLINGS NET REVENUE
35%
29%
8%
20%
8%
14
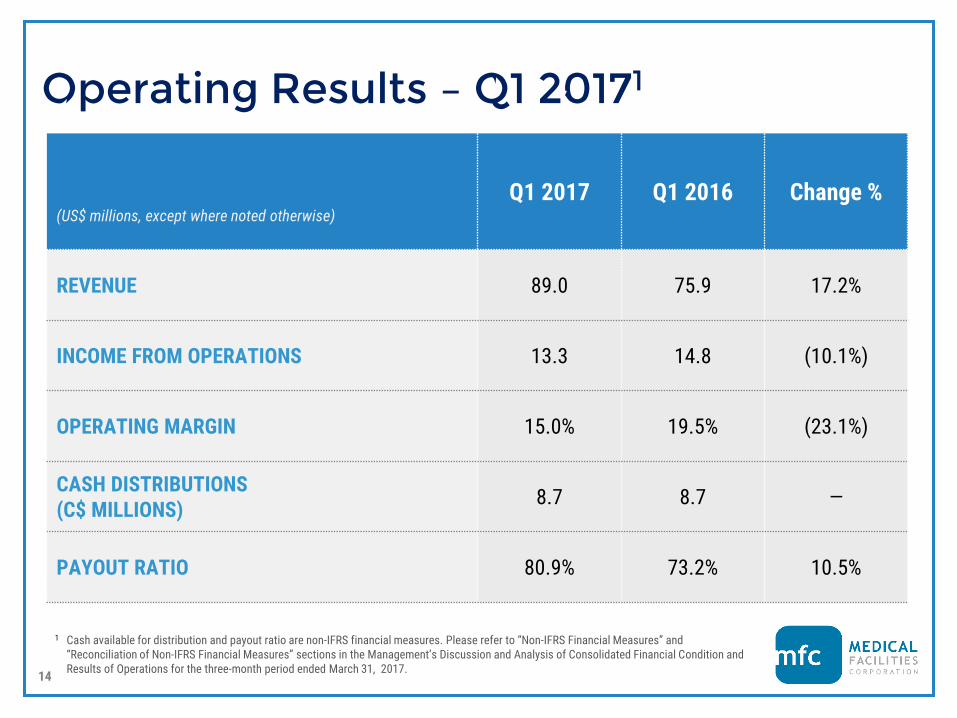
(US$ millions, except where noted otherwise)
Q1 2017 Q1 2016 Change %
REVENUE 89.0 75.9 17.2%
INCOME FROM OPERATIONS 13.3 14.8 (10.1%)
OPERATING MARGIN 15.0% 19.5% (23.1%)
CASH DISTRIBUTIONS (C$ MILLIONS)
8.7 8.7 —
PAYOUT RATIO 80.9% 73.2% 10.5%
Operating Results – Q1 20171
1 Cash available for distribution and payout ratio are non-IFRS financial measures. Please refer to “Non-IFRS Financial Measures” and “Reconciliation of Non-IFRS Financial Measures” sections in the Management’s Discussion and Analysis of Consolidated Financial Condition and Results of Operations for the three-month period ended March 31, 2017.
15
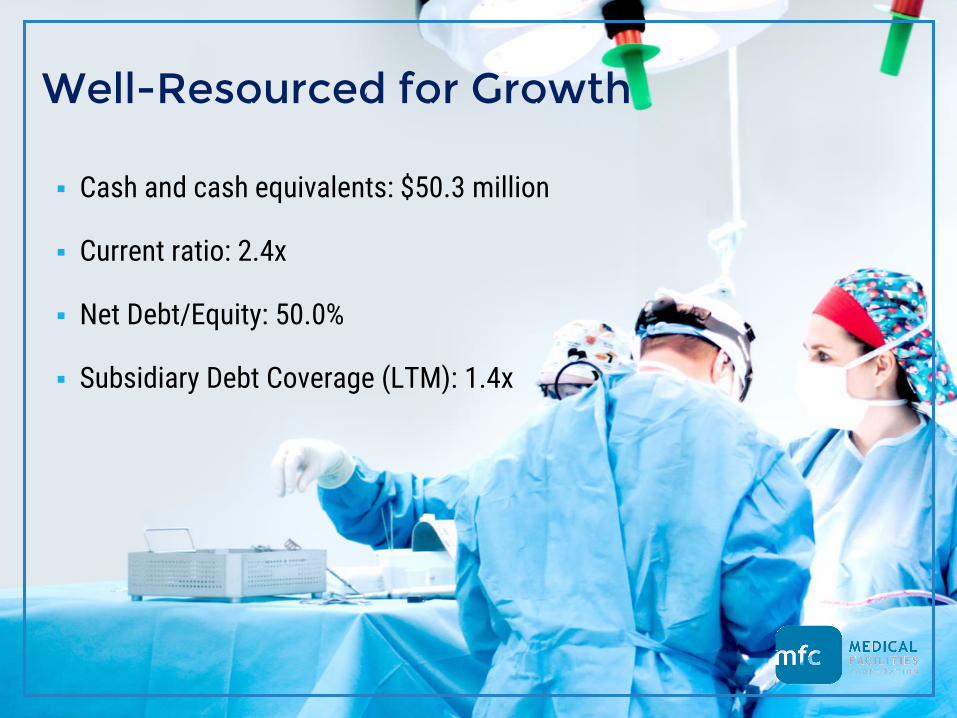
Well-Resourced for Growth
Cash and cash equivalents: $50.3 million
Current ratio: 2.4x
Net Debt/Equity: 50.0%
Subsidiary Debt Coverage (LTM): 1.4x

16
31.534.4 35.3 35.2 34.9
37.840.8 41.4
45.9
50.7
35.7
40.843.3
51.9 50.7
2012 2013 2014 2015 2016
69.02016
PAYOUT RATIO
%
83.3%
(C$ millions)
Distributions Cash Available for Distribution (including realized gains/losses on FX forward contracts)2
84.3%Payout Ratio2
1. Cash available for distribution and payout ratio are non-IFRS financial measures. Please refer to “Non-IFRS Financial Measures” and “Reconciliation of Non-IFRS Financial Measures” sections in the Management’s Discussion and Analysis of Consolidated Financial Condition and Results of Operations for the three-month period ended March 31, 2017.
2. Including realized gains/losses of FX forward contracts for years 2012-2015.
Strong Cash Flow1
Cash Available for Distribution (Excluding realized gains/losses on FX forward contracts)
85.2% 76.7% 69.0%
17
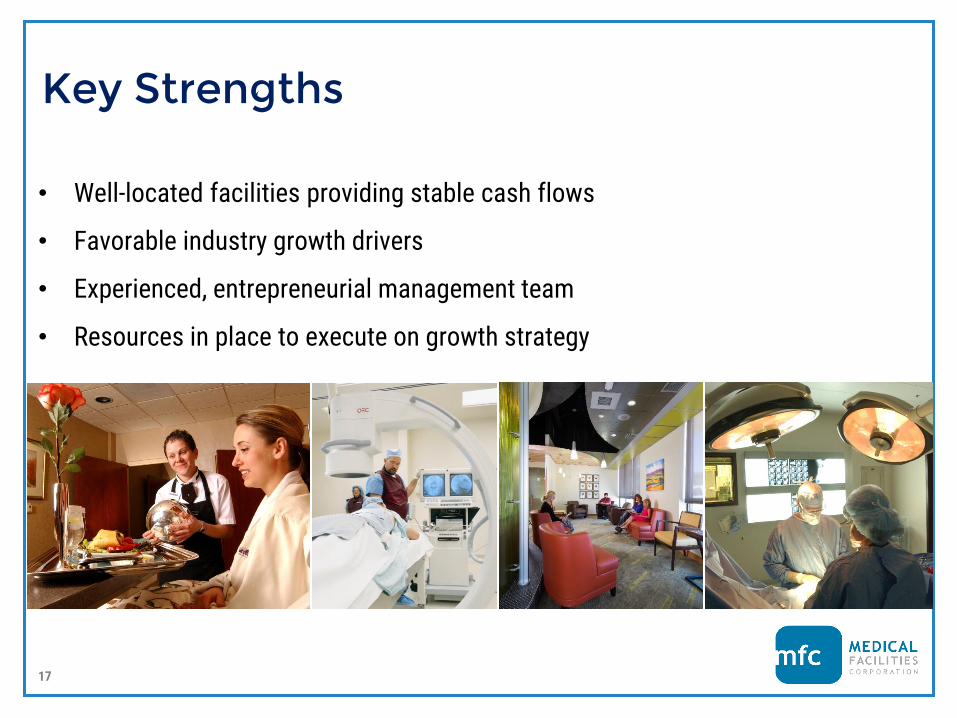
Key Strengths
• Well-located facilities providing stable cash flows
• Favorable industry growth drivers
• Experienced, entrepreneurial management team
• Resources in place to execute on growth strategy
18
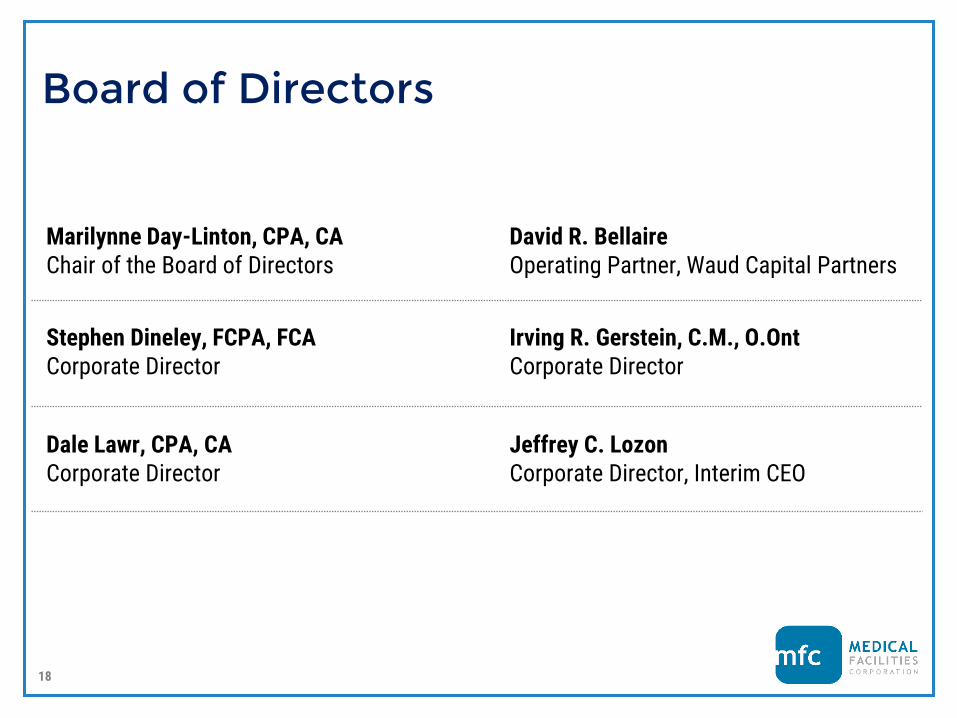
Board of Directors
Marilynne Day-Linton, CPA, CA Chair of the Board of Directors
Irving R. Gerstein, C.M., O.OntCorporate Director
David R. Bellaire Operating Partner, Waud Capital Partners
Dale Lawr, CPA, CACorporate Director
Stephen Dineley, FCPA, FCA Corporate Director
Jeffrey C. LozonCorporate Director, Interim CEO
19
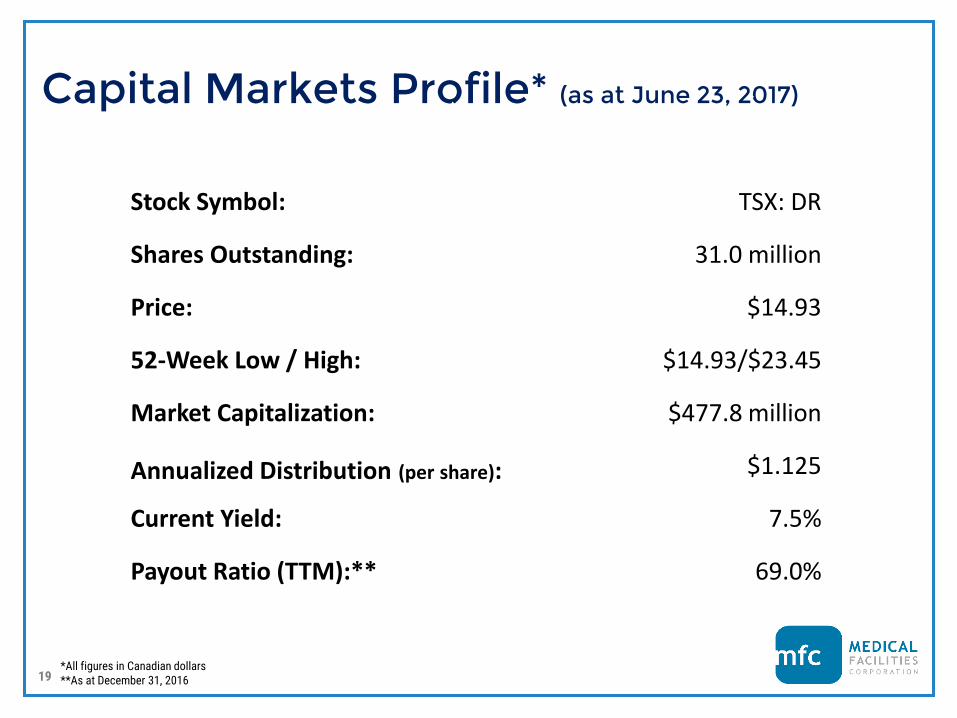
Capital Markets Profile* (as at June 23, 2017)
Stock Symbol: TSX: DR
Shares Outstanding: 31.0 million
Price: $14.93
52-Week Low / High: $14.93/$23.45
Market Capitalization: $477.8 million
Annualized Distribution (per share): $1.125
Current Yield: 7.5%
Payout Ratio (TTM):** 69.0%
*All figures in Canadian dollars**As at December 31, 2016