Medicaid Reimbursement and Nursing Home Quality of Care Revisited (Final product)
18
1 Medicaid Reimbursement and Nursing Home Quality of Care Revisited John R. Bowblis Muhammad Ismat Amin Robert Applebaum Background: Large increases in Medicaid expenditures, driven in part by high nursing home costs, have resulted in substantial pressure on states to improve the efficiency and effectiveness of nursing home reimbursement strategies. Objective: The aim of this study is to examine the relationship between Medicaid reimbursement rates and quality of care provided by Ohio nursing homes for the time period of 2006-2010. Research Design, Subjects, and Measures: We obtained facility-specific reimbursement rates for all nursing homes in 2006 and merged this with nursing home and resident-level information from multiple sources. We study differences in quality in the baseline year of 2006 and the change in quality by how much reimbursement rates were expected to change over the study period. Nursing home quality measures include deficiencies, nurse and support staffing levels, resident and family satisfaction, and resident quality indicator outcomes from the Minimum Data Set. Results: Baseline reimbursement rates show significant variation across the state. A review of baseline quality and changes in quality over the study period found that higher Medicaid reimbursement rates result in higher nurse and support staffing levels. However, there were no consistent impacts on quality outcomes. Results were not found to vary in geographic areas with excess demand. Conclusions: Consistent with the literature from the past 15 years, Medicaid reimbursement is found to increase staffing levels, but has limited effect on non-staffing outcomes, demonstrating that a better understanding of the relationship between reimbursement and quality is needed. Keywords: Medicaid reimbursement, nursing home quality, linkage of payment and quality
-
Upload
muhammad-amin -
Category
Documents
-
view
69 -
download
0
Transcript of Medicaid Reimbursement and Nursing Home Quality of Care Revisited (Final product)

1
Medicaid Reimbursement and Nursing Home Quality of Care Revisited
John R. Bowblis
Muhammad Ismat Amin
Robert Applebaum
Background: Large increases in Medicaid expenditures, driven in part by high nursing home
costs, have resulted in substantial pressure on states to improve the efficiency and effectiveness
of nursing home reimbursement strategies.
Objective: The aim of this study is to examine the relationship between Medicaid
reimbursement rates and quality of care provided by Ohio nursing homes for the time period of
2006-2010.
Research Design, Subjects, and Measures: We obtained facility-specific reimbursement rates
for all nursing homes in 2006 and merged this with nursing home and resident-level information
from multiple sources. We study differences in quality in the baseline year of 2006 and the
change in quality by how much reimbursement rates were expected to change over the study
period. Nursing home quality measures include deficiencies, nurse and support staffing levels,
resident and family satisfaction, and resident quality indicator outcomes from the Minimum Data
Set.
Results: Baseline reimbursement rates show significant variation across the state. A review of
baseline quality and changes in quality over the study period found that higher Medicaid
reimbursement rates result in higher nurse and support staffing levels. However, there were no
consistent impacts on quality outcomes. Results were not found to vary in geographic areas with
excess demand.
Conclusions: Consistent with the literature from the past 15 years, Medicaid reimbursement is
found to increase staffing levels, but has limited effect on non-staffing outcomes, demonstrating
that a better understanding of the relationship between reimbursement and quality is needed.
Keywords: Medicaid reimbursement, nursing home quality, linkage of payment and quality
2
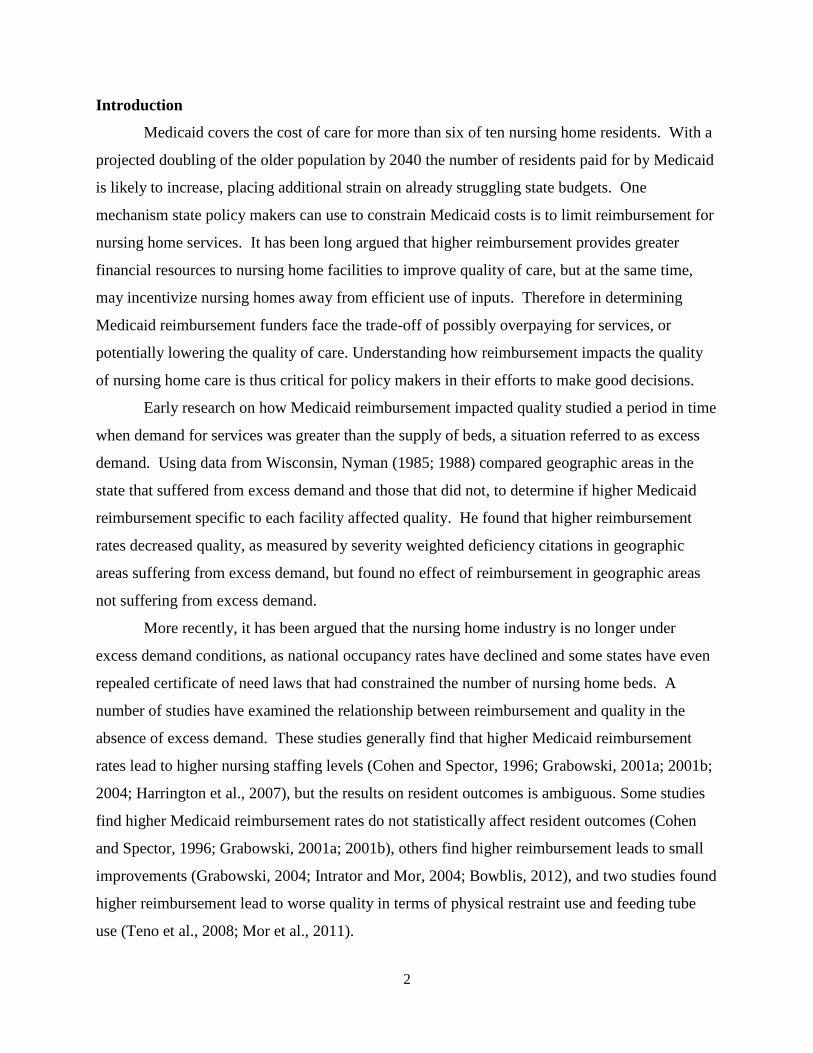
Introduction
Medicaid covers the cost of care for more than six of ten nursing home residents. With a
projected doubling of the older population by 2040 the number of residents paid for by Medicaid
is likely to increase, placing additional strain on already struggling state budgets. One
mechanism state policy makers can use to constrain Medicaid costs is to limit reimbursement for
nursing home services. It has been long argued that higher reimbursement provides greater
financial resources to nursing home facilities to improve quality of care, but at the same time,
may incentivize nursing homes away from efficient use of inputs. Therefore in determining
Medicaid reimbursement funders face the trade-off of possibly overpaying for services, or
potentially lowering the quality of care. Understanding how reimbursement impacts the quality
of nursing home care is thus critical for policy makers in their efforts to make good decisions.
Early research on how Medicaid reimbursement impacted quality studied a period in time
when demand for services was greater than the supply of beds, a situation referred to as excess
demand. Using data from Wisconsin, Nyman (1985; 1988) compared geographic areas in the
state that suffered from excess demand and those that did not, to determine if higher Medicaid
reimbursement specific to each facility affected quality. He found that higher reimbursement
rates decreased quality, as measured by severity weighted deficiency citations in geographic
areas suffering from excess demand, but found no effect of reimbursement in geographic areas
not suffering from excess demand.
More recently, it has been argued that the nursing home industry is no longer under
excess demand conditions, as national occupancy rates have declined and some states have even
repealed certificate of need laws that had constrained the number of nursing home beds. A
number of studies have examined the relationship between reimbursement and quality in the
absence of excess demand. These studies generally find that higher Medicaid reimbursement
rates lead to higher nursing staffing levels (Cohen and Spector, 1996; Grabowski, 2001a; 2001b;
2004; Harrington et al., 2007), but the results on resident outcomes is ambiguous. Some studies
find higher Medicaid reimbursement rates do not statistically affect resident outcomes (Cohen
and Spector, 1996; Grabowski, 2001a; 2001b), others find higher reimbursement leads to small
improvements (Grabowski, 2004; Intrator and Mor, 2004; Bowblis, 2012), and two studies found
higher reimbursement lead to worse quality in terms of physical restraint use and feeding tube
use (Teno et al., 2008; Mor et al., 2011).

3
While the work by Nyman (1985; 1988) used facility-specific rates, the empirical
strategies utilized by the more recent studies uses the average Medicaid reimbursement rates in
the state. State averages may capture the general level of reimbursement in the state, but rates
within a state can vary significantly across facilities. Furthermore, increases in state average
reimbursement could be due to a few facilities having higher reimbursement or a small increase
experienced by all facilities. The distribution of reimbursement within a state and how it
changes over time makes it difficult to understand the link between quality and reimbursement at
a facility-level. Additionally, many of these studies do not control for other policies that
changed in conjunction with Medicaid reimbursement rates. In many states, increases in
reimbursement rates occur at the same time as an increase in state minimum nurse staffing
requirements (Harrington et al., 2007; Hyer et al., 2009; Bowblis, 2011). Failure to control for
these policy changes could result in a finding that higher reimbursement rates lead to higher
staffing levels, even though the increased staffing could be the result of other state level policy
changes.
In this paper, we study how Medicaid reimbursement affects quality in a way that
addresses these issues. Initially, we combine data on facility specific reimbursement rates with a
series of quality indicators to examine the relationship between reimbursement and quality. To
study how reimbursement changes could affect quality we next examine the impact of Ohio
reimbursement reforms implemented over a four year time period. We then assess changes in
quality over time as reimbursement rates adjusted to the new levels. Our study coincides with a
period when Ohio did not make other significant changes to other nursing home policies, such as
minimum nurse staffing requirements.
Medicaid Reimbursement in Ohio
Prior to 2006, Ohio calculated nursing home per diem Medicaid reimbursement primarily
based on the cost of providing care for each specific facility. This system lead to significant
variation in reimbursement rates across the state. Facilities with high direct care and high capital
costs would receive higher reimbursement than those with low costs. Policy-makers were
concerned that this system rewarded facilities for inefficient staffing patterns and promoted
strategies that increased capital costs to enhance reimbursement rates. To reward providers that
had more efficient staffing patterns and to reduce payments for facilities that the state believed to
4
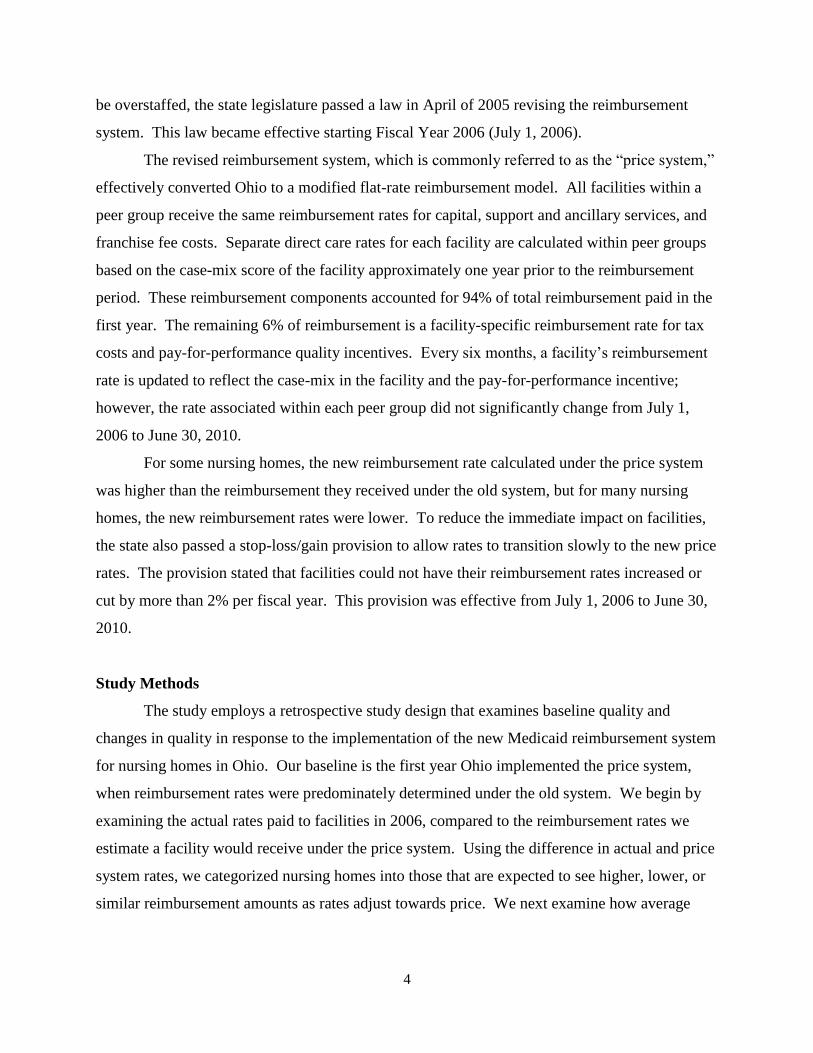
be overstaffed, the state legislature passed a law in April of 2005 revising the reimbursement
system. This law became effective starting Fiscal Year 2006 (July 1, 2006).
The revised reimbursement system, which is commonly referred to as the “price system,”
effectively converted Ohio to a modified flat-rate reimbursement model. All facilities within a
peer group receive the same reimbursement rates for capital, support and ancillary services, and
franchise fee costs. Separate direct care rates for each facility are calculated within peer groups
based on the case-mix score of the facility approximately one year prior to the reimbursement
period. These reimbursement components accounted for 94% of total reimbursement paid in the
first year. The remaining 6% of reimbursement is a facility-specific reimbursement rate for tax
costs and pay-for-performance quality incentives. Every six months, a facility’s reimbursement
rate is updated to reflect the case-mix in the facility and the pay-for-performance incentive;
however, the rate associated within each peer group did not significantly change from July 1,
2006 to June 30, 2010.
For some nursing homes, the new reimbursement rate calculated under the price system
was higher than the reimbursement they received under the old system, but for many nursing
homes, the new reimbursement rates were lower. To reduce the immediate impact on facilities,
the state also passed a stop-loss/gain provision to allow rates to transition slowly to the new price
rates. The provision stated that facilities could not have their reimbursement rates increased or
cut by more than 2% per fiscal year. This provision was effective from July 1, 2006 to June 30,
2010.
Study Methods
The study employs a retrospective study design that examines baseline quality and
changes in quality in response to the implementation of the new Medicaid reimbursement system
for nursing homes in Ohio. Our baseline is the first year Ohio implemented the price system,
when reimbursement rates were predominately determined under the old system. We begin by
examining the actual rates paid to facilities in 2006, compared to the reimbursement rates we
estimate a facility would receive under the price system. Using the difference in actual and price
system rates, we categorized nursing homes into those that are expected to see higher, lower, or
similar reimbursement amounts as rates adjust towards price. We next examine how average

5
quality varies in these categories at baseline. Finally, we review how the changes toward the
price reimbursement rate effects quality in these facilities.
Data and Study Population
Data on Medicaid-reimbursed nursing homes in the state of Ohio are obtained from
multiple sources. Facility-specific Medicaid reimbursement rates are provided by the Ohio
Department of Medicaid (ODOM). The reimbursement data include the rates that would have
been in place had the price system been fully enacted and the actual reimbursement rate.
Reimbursement data are merged with facility-level data from the Ohio Medicaid Cost Report,
Online Survey Certification and Reporting System (OSCAR), and the Ohio resident and family
satisfaction surveys. These sources of data provide information on facility characteristics,
number of deficiencies, staffing levels, quality indicators, and resident and family satisfaction.
Satisfaction scores are from surveys for the closest available year. To obtain resident level
quality information we use the Minimum Data Set (MDS). The analysis includes all Ohio
Medicaid certified facilities that could be merged for all dataset sources in both years. Eight
facilities were eliminated because they had different Medicaid reimbursement rates for multiple
units. This resulted in a sample of 887 facilities and over 51,000 resident observations.
Reimbursement Categories
Using data from the first half of fiscal year 2006, nursing homes are categorized into four
groups based on the percentage differences in their actual reimbursement and the rate they would
have received if the price system had been fully implemented. Group 1 includes facilities that
are “close” to price. These facilities are defined as having an actual reimbursement rate that is
within 5% of the price reimbursement rate. A second group of facilities includes those with
reimbursement rates below the price rate, who would see reimbursement rates increase under the
price system. These facilities are defined as having an actual reimbursement rate that is at least
5% below the price rate. Finally, two groups of facilities that have actual reimbursement rates
above price are identified and would expect to see reimbursement decline with implementation
of the price system. The first of these groups has an actual reimbursement rate 5 to 15% above
the price rate and the second of these groups has an actual reimbursement rate 15% or greater
over price.

6
Outcome Measures
Nursing home quality is measured using three sets of facility-level measures and two sets
of resident-level measures. The first set of facility-level quality measures is the number of
deficiencies. Deficiencies are given when a facility does not meet minimum regulatory standards
in quality of care, quality of life, and other areas. Our deficiency outcomes measure the number
of deficiencies the facility received in their most recent state survey inspection. The second and
third sets of facility-level measures are the amount of nurse and other staffing employed at the
facility. Nurse staffing is measured for registered nurses (RNs), licensed practiced nurses
(LPNs), certified nurse aides (CNAs), and total nurse staffing. Other staffing includes social
services, housekeeping, food service, dietitians, and activities staff. All staffing variables are
measured in terms of hours per resident day (HPRD) and for each staff variable, improbable
observations were eliminated from the analysis by identifying staffing levels that are three
standard deviations from the mean in the state. The first set of individual level data comes from
resident and family satisfaction scores. These scores are aggregated to represent the average
score of the facility, ranging from 0 to 100, with higher numbers implying higher satisfaction.
Finally, resident-level quality measures are constructed based on the Minimum Data Set for all
long-stay residents.
Statistical Analysis and Control Variables
The analysis includes a two-step process. Initially, quality in the baseline period is
compared across the four reimbursement groups. Linear regression is used to control for a host
of independent variables that may also affect the quality. For the facility-level dependent
variable the regressions control for profit status, number of beds, chain membership, hospital-
based facility, presence of Alzheimer’s and other special care units, payer mix, occupancy rates,
and case mix measures (Acuindex and percent of residents with dementia, psychiatric illness,
depression, MR/DD). In addition to the facility-level controls, resident outcome regressions
also control for variables specific to the resident. These include age, gender, race, education,
physical functioning (ADL index score), diabetes, cardiac dysrhythmia, heart failure, stroke, hip
fracture, dementia, schizophrenia, COPD, and cancer.
In our second statistical analysis, we study how quality changes between 2006 and 2010
for each reimbursement group. A linear regression that uses data for both years and captures the
7
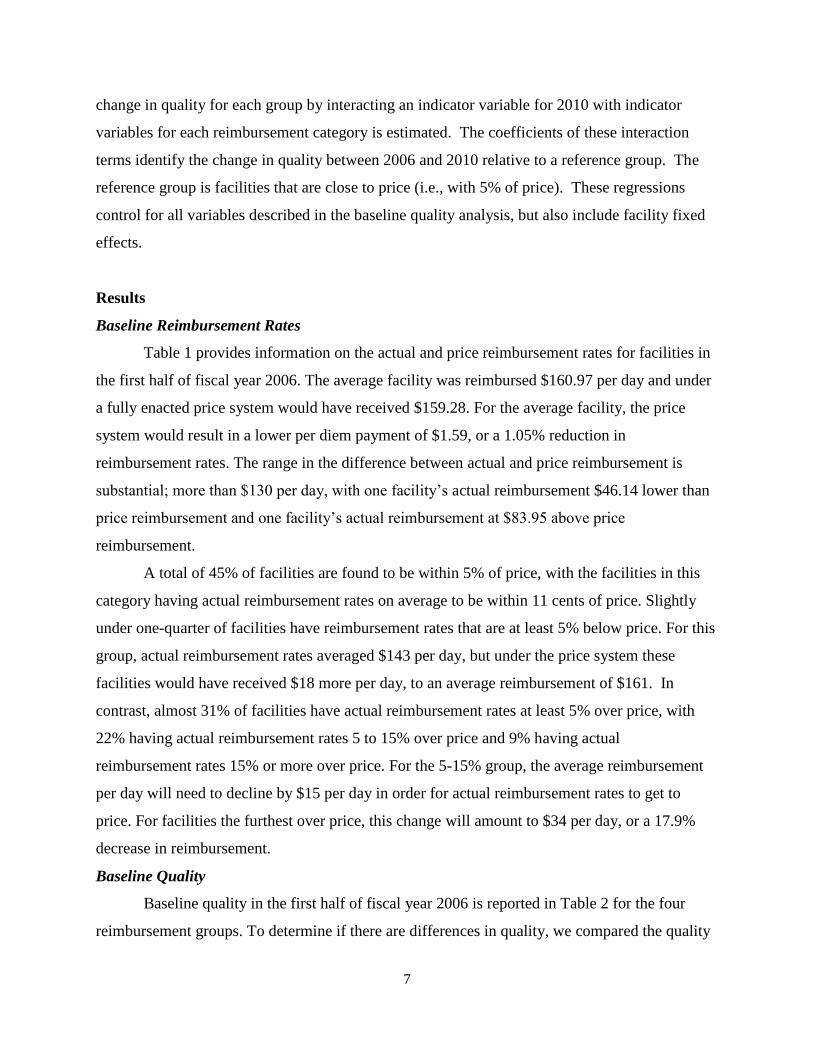
change in quality for each group by interacting an indicator variable for 2010 with indicator
variables for each reimbursement category is estimated. The coefficients of these interaction
terms identify the change in quality between 2006 and 2010 relative to a reference group. The
reference group is facilities that are close to price (i.e., with 5% of price). These regressions
control for all variables described in the baseline quality analysis, but also include facility fixed
effects.
Results
Baseline Reimbursement Rates
Table 1 provides information on the actual and price reimbursement rates for facilities in
the first half of fiscal year 2006. The average facility was reimbursed $160.97 per day and under
a fully enacted price system would have received $159.28. For the average facility, the price
system would result in a lower per diem payment of $1.59, or a 1.05% reduction in
reimbursement rates. The range in the difference between actual and price reimbursement is
substantial; more than $130 per day, with one facility’s actual reimbursement $46.14 lower than
price reimbursement and one facility’s actual reimbursement at $83.95 above price
reimbursement.
A total of 45% of facilities are found to be within 5% of price, with the facilities in this
category having actual reimbursement rates on average to be within 11 cents of price. Slightly
under one-quarter of facilities have reimbursement rates that are at least 5% below price. For this
group, actual reimbursement rates averaged $143 per day, but under the price system these
facilities would have received $18 more per day, to an average reimbursement of $161. In
contrast, almost 31% of facilities have actual reimbursement rates at least 5% over price, with
22% having actual reimbursement rates 5 to 15% over price and 9% having actual
reimbursement rates 15% or more over price. For the 5-15% group, the average reimbursement
per day will need to decline by $15 per day in order for actual reimbursement rates to get to
price. For facilities the furthest over price, this change will amount to $34 per day, or a 17.9%
decrease in reimbursement.
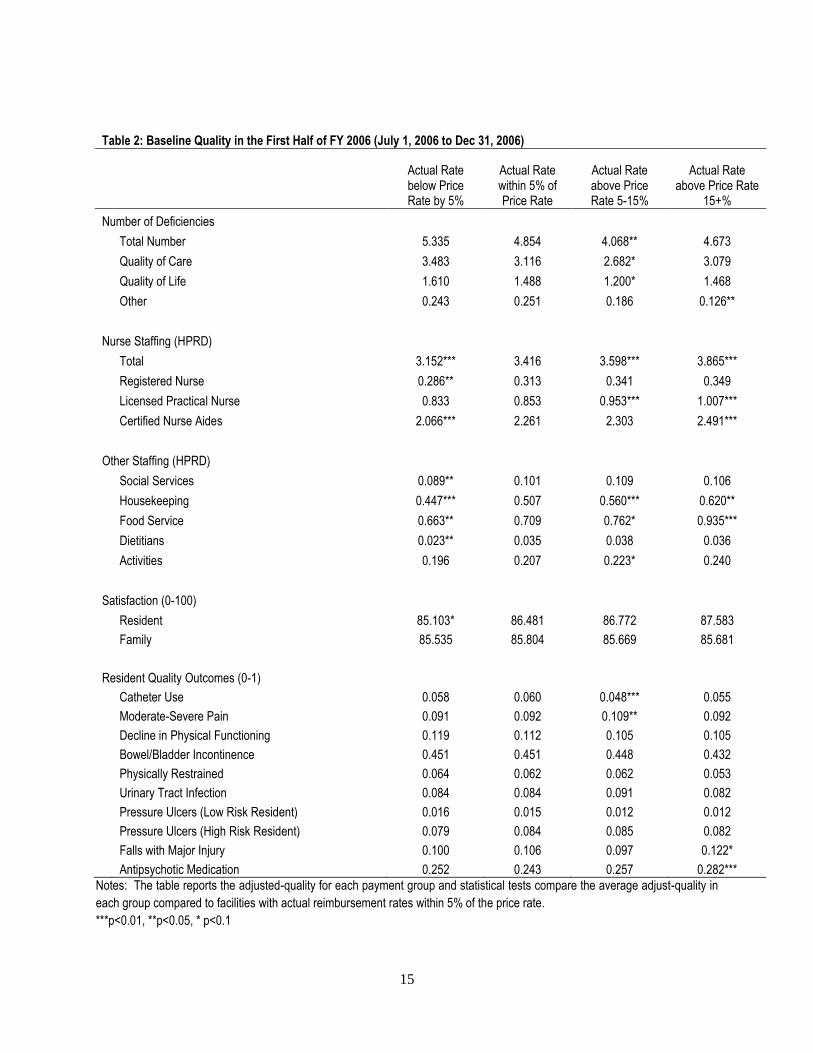
Baseline Quality
Baseline quality in the first half of fiscal year 2006 is reported in Table 2 for the four
reimbursement groups. To determine if there are differences in quality, we compared the quality

8
scores for facilities in each of the groups to the reference group of facilities, those that have
actual reimbursement rates within 5% of price. For baseline quality measured by number of
deficiencies, there is some evidence of higher quality among facilities with higher
reimbursement rates relative to price. Facilities with actual reimbursement rates of 5 to 15%
above price have fewer deficiencies than those within 5% of price. Facilities with actual
reimbursement rates below 5% of price have a greater number of deficiencies but the difference
is not statistically significant.
In terms of nurse staffing, facilities with actual reimbursement rates that were 5% below
price had 3.2 HPRD of total nurse staffing, compared to 3.9 HPRD for facilities 15% above
price. This general pattern of higher staffing levels the greater the actual reimbursement rate is
relative to price, is found for total, registered nurse, licensed practical nurse, and certified nurse
aide staffing levels. Additionally, this pattern is also found in other forms of staffing, such as
social service staff, housekeeping, food service, dietitians, and activities staff.
Baseline quality resident satisfaction is lower in facilities with actual reimbursement rates
5% below price, but there is not a statistical difference for facilities above price. There is no
statistical difference in family satisfaction found among the four groups. In terms of resident
quality outcomes, lower numbers imply higher quality. While a few groups have statistically
significant differences in quality compared to the reference group, there is no discernible pattern
in terms of resident outcomes across the four reimbursement groups.
Changes in Quality
To determine how reimbursement rates affects quality, Table 3 reports the change in
quality between 2006 and 2010 for nursing homes that experienced changes in reimbursement
compared to facilities that were within 5% of the price rate at baseline. When compared to those
facilities within 5% of price, there were no statistically significant differences in quality for the
three other reimbursement groups based on measures examining the average number of
deficiencies and resident and family satisfaction. In terms of staffing, facilities with actual rates
15% or above price did reduce the total nursing staff, mostly in the form of certified nurse aides
relative to the reference group. For other staff, there were no changes relative to the reference
group. Finally, the vast majority of resident quality indicators as measured by the Minimum
Data Set show no statistical difference relative to the reference group. There are four cases where

9
there is a statistically significant difference, but there is no discernible pattern to determine if
resident outcomes worsened or improved with adjustment towards price.
Following the empirical literature on nursing home reimbursement, it is expected that in
geographic areas with excess demand higher reimbursement should lower quality. The state of
Ohio provides a nice case study of the effect of excess demand because during the study period
Ohio had a Certificate of Need (CON) law in place. The CON law capped the number of beds
allowed in the state and each county within the state in 1993. Furthermore, beds were not
allowed to be moved across county lines creating situations where some counties had excess
beds and others experienced excess demand. Using the state’s definition of shortage of beds in a
county to define excess demand (Mehdizadeh and Applebaum, 2009), we compared baseline
quality for facilities in counties with excess demand to counties without excess demand. This is
done by including an indicator variable in the baseline quality regressions reported in Table 2.
We also examined the change in quality between 2006 and 2010 for each reimbursement group.
Within each reimbursement group, we determined if the change in quality in counties with
excess demand was different than those in counties without excess demand. These differences
are estimated using linear regressions controlling for the same variables used in Table 3, but the
interaction term is modified to allow the effect of reimbursement group to vary if the facilities is
in a county with excess demand.
The first column of Table 4 reports the difference in average quality for facilities in
counties with and without excess demand. Facilities in counties with excess demand are found
to have more deficiencies, with the result being statistically significant for total and quality of
life deficiencies. CNA staffing levels are higher in counties with excess demand, while resident
satisfaction is found to be lower. For all other quality measures, there is no statistical difference
between counties with and without excess demand.
The final four columns of Table 4, which report the difference in the change in quality for
facilities within each reimbursement group by presence of excess demand, generally support the
findings from the baseline results. The differences that are statistically significant show mixed
effects and the vast majority are not statistically significant. This does not support the hypothesis
that higher reimbursement under excess demand leads to lower quality.

10
Conclusion
While the recent literature has identified variation in Medicaid reimbursement using
state-level averages, this article presents results for how Medicaid reimbursement affects quality
using information on facility-specific rates. Consistent with the recent literature we find
evidence that higher reimbursement results in higher staffing levels. Specifically, nurse and
support staffing levels are found to be higher in nursing homes with higher reimbursement rates
in the baseline year and facilities that saw increases in reimbursement under the new system
increased staffing levels but those that saw decreases reduced staffing level. As Medicaid
reimbursement rates converged to a more uniform price across the state, staffing levels tended to
converge as well.
It has been hypothesized that higher nurse and aide staffing levels improve nursing home
quality and with our finding that higher reimbursement results in greater staffing (Schnelle et al,
2004; Park and Stearns, 2009; Bowblis, 2011), it is expected that other dimensions of quality
should also improve. Higher baseline reimbursement rates are associated with higher quality in
terms of meeting regulatory standards and higher resident satisfaction, but when studying
changes in reimbursement and quality, the few results that are statistically significant are not
consistent. Therefore, in this study, reductions in Medicaid reimbursement had little effect on
non-staffing quality. Early work by Nyman (1985; 1988) would suggest that the lack of findings
in regards to non-staffing dimensions of quality may be due to not controlling for excess
demand. We test this hypothesis and do not find any evidence that supports that excess demand
results in different effect of reimbursement on quality.
There are a few likely reasons that we find Medicaid reimbursement effects staffing but
not other dimensions of quality. Higher reimbursement provides financial resources that nursing
homes can invest into staffing and changing other factors that affect quality, such as management
and supervision practices, care processes, and nursing home culture. Staffing levels can be
changed instantaneously by hiring or laying off staff, but these other factors take time to gain
traction within a facility and even more time to translate into improved quality.
Another explanation for the findings is the changes in reimbursements were rather small.
Reimbursement rates were not allowed to change more than 2 percent per year during the study
period, resulting in a maximum cut in reimbursement of 8.24%. Some facilities may have
attempted to maintain quality by cutting administrative staff, sustaining losses, focusing on more
11
profitable Medicare and private pay residents, and using other financial resources, such as
endowments. Ohio eliminated the stop-loss/gain provision in the start of fiscal year 2011,
resulting in some facilities seeing double digit percentage declines in reimbursement in one year
and our subsequent analysis will examine whether quality is affected by these larger
reimbursement changes.
The finding that reimbursement changes lead to little effect on non-staffing quality
suggests that small increases in reimbursement are not an effective policy tool to improve
quality. One might conclude these results support small cuts to reimbursement to save money as
they would likely have little effect on nursing home outcomes. In this short run, this may be
true, but our study is limited in that we cannot address what occurs in the long-run or if cuts are
significantly large. Furthermore, cutting Medicaid or failing to keep reimbursement rates
competitive with private pay and Medicare post-acute care rates will reduce the incentive for
some nursing homes to accept new Medicaid patients, particularly harming individuals in areas
with little excess bed capacity.
Another limitation of this study is that our ability to identify and measure quality is still
evolving. When reviewing our quality indicators we find tremendous variation in quality
measures by facility. For example, a facility with very high resident or family satisfaction may
not score well on the state survey or on quality as measured by the Minimum Data Set. Our lack
of consensus on how to define and measure quality means that efforts to link quality impacts to
reimbursement levels are somewhat limited.
In any case, these finding contribute to the literature by confirming the results of earlier
studies that have used average state-level reimbursement rates. We were able to use a study
period that was not effected by other policy changes to isolate the impacts of changes in
reimbursement. Finally, this paper reiterates the importance of revisiting the issue of Medicaid
reimbursement by focusing on how reimbursement affects facilities at the micro-level through
the use of facility-specific reimbursement rates. As pressures on Medicaid continues, the
importance of getting reimbursement right, regardless of setting, will increase. This study
represents the continued effort to understand that critical linkage between quality and
reimbursement.
12
References:
Bowblis, J. R. 2011. Staffing Ratios and Quality: An Analysis of Minimum Direct Care Staffing
Requirements for Nursing Homes. Health Services Research 46(5): 1495-1516.
Bowblis, J. R., Crystal, S., Intrator, O., Lucas, J. A. 2012. Response to Regulatory Stringency:
The Case of Antipsychotic Medication Use in Nursing Homes. Health Economics 21(8):
977-93.
Cohen, J. W., and Spector, W. D. 1996. The Effect of Medicaid Reimbursement on Quality of
Care in Nursing Homes. Journal of Health Economics 15:23-48.
Grabowski, D. C. 2001a. Does an Increase in the Medicaid Reimbursement Rate Improve
Nursing Home Quality? Journal of Gerontology 56B(2): S84-S92.
Grabowski, D. C. 2001b. Medicaid Reimbursement and the Quality of Nursing Home Care.
Journal of Health Economics 20:549-569.
Grabowski, D. C. 2004. A Longitudinal Study of Medicaid Payment, Private-Pay Price and
Nursing Home Quality. International Journal of Health Care Finance and Economics 4:
5-26.
Harrington C., Swan J. H., and Carrillo H. 2007. Nurse Staffing Levels and Medicaid
Reimbursement Rates in Nursing Facilities. Health Services Research 42(3):1105-1129.
Hyer K., Temple A., and Johnson C. E. 2009. Florida’s Efforts to Improve Quality of Nursing
Home Care Through Nurse Staffing Standards, Regulation, and Medicaid
Reimbursement. Journal of Aging & Social Policy 21:318-337.
Intrator, O., and Mor, V. 2004. Effect of State Medicaid Reimbursement Rates on
Hospitalizations in Nursing Homes. Journal of the American Geriatrics Society 52(3):
393-398.
Mehdizadeh, S., and Applebaum, R. 2009. Certificate of Need Bed Formula Validity for Ohio’s
Nursing Homes. Available at: XXX.
Mor, V., Gruneir, A., Feng, Z., Grabowski, D. C., Intrator, O., and Zinn, J. 2011. The Effect of
State Policies on Nursing Home Resident Outcomes. Journal of the American Geriatrics
Society 59(1): 3-9.
Nyman, J. A. 1985. Prospective and ‘Cost-plus’ Medicaid Reimbursement, Excess Medicaid
Demand, and the Quality of Nursing Home Care. Journal of Health Economics 4:237-59.

13
Nyman, J. A. 1988. Excess Demand, the Percentage of Medicaid Patients, and the Quality of
Nursing Home Care. Journal of Human Resources 23(1): 76-92.
Park, J., and Stearns, S. C. 2009. Effects of state minimum staffing standards on nursing home
staffing and quality of care. Health Services Research 44(1): 56-78.
Schnelle, J. F., Simmons, S. F., Harrington, C., Cadogan, M., Garcia, E., and Bates-Jensen, B.
2004. Relationship of nursing home staffing to quality of care. Health Services Research
39(2): 225-250.
Teno J. M., Feng Z., Mitchell S. L., Kuo S, Intrator O., and Mor V. (2008). Do Financial
Incentives of Introducing Case Mix Reimbursement Increase Feeding Tube Use in
Nursing Home Residents? Journal of the American Geriatrics Society (56): 887-890.

14
Table 1: Reimbursement Rates for First Half of FY 2006 (July 1, 2006 to Dec 31, 2006)
% of Facilities
Actual Rate ($)
Price Rate ($)
Average Gap ($)
Under Gap amount ($)
Over Gap amount ($)
All Facilities 100.00% 160.97 159.28 1.69 -46.14 83.85
Actual Rate below Price Rate by 5% 24.13% 143.13 161.50 -18.36 -46.14 -7.30
Actual Rate within 5% of Price Rate 45.43% 158.48 158.60 -0.11 -8.97 9.02
Actual Rate above Price Rate 5-15% 21.87% 174.65 159.71 14.94 6.68 29.70
Actual Rate above Price Rate 15+% 8.57% 189.42 155.53 33.90 21.06 83.85
Notes: The sample size is 887 facilities. Actual rate refers to the per diem Medicaid reimbursement rate in the first half of fiscal year 2006 paid to facilities before resident contributions. The price rate refers to the per diem Medicaid reimbursement rate the facility would have received if the price system was fully implemented. Gap refers to the difference in actual and price reimbursement rates.
15
Table 2: Baseline Quality in the First Half of FY 2006 (July 1, 2006 to Dec 31, 2006)
Actual Rate below Price Rate by 5%
Actual Rate within 5% of Price Rate
Actual Rate above Price Rate 5-15%
Actual Rate above Price Rate
15+%
Number of Deficiencies
Total Number 5.335 4.854 4.068** 4.673
Quality of Care 3.483 3.116 2.682* 3.079
Quality of Life 1.610 1.488 1.200* 1.468
Other 0.243 0.251 0.186 0.126**
Nurse Staffing (HPRD)
Total 3.152*** 3.416 3.598*** 3.865***
Registered Nurse 0.286** 0.313 0.341 0.349
Licensed Practical Nurse 0.833 0.853 0.953*** 1.007***
Certified Nurse Aides 2.066*** 2.261 2.303 2.491***
Other Staffing (HPRD)
Social Services 0.089** 0.101 0.109 0.106
Housekeeping 0.447*** 0.507 0.560*** 0.620**
Food Service 0.663** 0.709 0.762* 0.935***
Dietitians 0.023** 0.035 0.038 0.036
Activities 0.196 0.207 0.223* 0.240
Satisfaction (0-100)
Resident 85.103* 86.481 86.772 87.583
Family 85.535 85.804 85.669 85.681
Resident Quality Outcomes (0-1)
Catheter Use 0.058 0.060 0.048*** 0.055
Moderate-Severe Pain 0.091 0.092 0.109** 0.092
Decline in Physical Functioning 0.119 0.112 0.105 0.105
Bowel/Bladder Incontinence 0.451 0.451 0.448 0.432
Physically Restrained 0.064 0.062 0.062 0.053
Urinary Tract Infection 0.084 0.084 0.091 0.082
Pressure Ulcers (Low Risk Resident) 0.016 0.015 0.012 0.012
Pressure Ulcers (High Risk Resident) 0.079 0.084 0.085 0.082
Falls with Major Injury 0.100 0.106 0.097 0.122*
Antipsychotic Medication 0.252 0.243 0.257 0.282***
Notes: The table reports the adjusted-quality for each payment group and statistical tests compare the average adjust-quality in
each group compared to facilities with actual reimbursement rates within 5% of the price rate.
***p<0.01, **p<0.05, * p<0.1

16
Table 3: Change in Quality from First Half of FY 2006 to Second Half FY 2010
Difference Relative to within 5% Price Rate
Below Rate by 5%
Above Rate by 5-15%
Above Rate 15+%
Number of Deficiencies
Total Number -0.542 0.111 -0.462
Quality of Care -0.260 0.053 -0.628
Quality of Life -0.269 0.030 0.057
Other -0.013 0.028 0.109
Nurse Staffing (HPRD)
Total 0.062 0.001 -0.217*
Registered Nurse 0.019 -0.000 0.032
Licensed Practical Nurse -0.007 -0.030 -0.041
Certified Nurse Aides 0.035 0.026 -0.229***
Other Staffing (HPRD)
Social Services -0.032 -0.040 -0.009
Housekeeping 0.049*** -0.013 -0.065
Food Service 0.001 -0.049* -0.139
Dietitians 0.010* 0.004 0.014*
Activities -0.003 -0.015 -0.020
Satisfaction
Resident 0.976 0.749 -0.256
Family 0.104 -0.418 -0.090
Resident Quality Outcomes
Catheter Use 0.004 0.014*** 0.008
Moderate-Severe Pain -0.005 -0.004 0.013
Decline in Physical Functioning -0.006 -0.006 0.010
Bowel/Bladder Incontinence -0.025* -0.012 0.009
Physically Restrained 0.001 -0.001 0.011
Urinary Tract Infection -0.001 -0.002 0.017*
Pressure Ulcers (Low Risk Resident) -0.004 0.002 0.005
Pressure Ulcers (High Risk Resident) 0.009 0.006 -0.002
Falls with Major Injury 0.005 0.011 -0.007
Antipsychotic Medication 0.000 -0.022** -0.023
Notes: The table reports the relative change in quality compared to the reference group of those facilities within 5% of the price rate. Statistical significance is related for this relative differences compared to the control group. ***p<0.01, **p<0.05, * p<0.1

17
Table 4: Baseline Quality and Change in Quality by Excess Demand
Baseline Quality Difference with
Excess Demand
Difference within Reimbursement Group with and without Excess Demand
Below Rate by 5%
Within 5% of Price Rate
Above Rate by 5-15%
Above Rate 15+%
Number of Deficiencies Total Number 0.616** -1.207 0.559 -1.178 -0.476
Quality of Care 0.264 -0.403 0.338 -0.633 -0.297
Quality of Life 0.386*** -0.764** 0.190 -0.515 -0.276
Other -0.034 -0.041 0.030 -0.030 0.097
Nurse Staffing (HPRD)
Total 0.003 0.104 0.106 -0.040 0.174
Registered Nurse -0.015 0.026 0.029 0.033 0.038
Licensed Practical Nurse 0.052** -0.015 0.013 -0.030 0.069
Certified Nurse Aides -0.029 0.120 0.066 -0.061 -0.012
Other Staffing (HPRD)
Social Services 0.003 0.003 -0.061 0.022** 0.004
Housekeeping 0.020 -0.020 0.008 -0.014 -0.197
Food Service 0.023 -0.017 -0.025 -0.014 -0.176
Dietitians 0.002 0.005 0.005 0.004 0.012
Activities 0.003 0.018 0.006 0.014 -0.025
Satisfaction
Resident -0.829** -1.995 -1.016 3.011* 2.854
Family 0.469 0.569 0.537 -1.196 -1.301
Resident Quality Outcomes
Catheter Use -0.001 -0.005 0.002 -0.005 0.016
Moderate-Severe Pain 0.004 -0.021 -0.009 0.025 0.007
Decline in Physical Functioning 0.002 0.016 0.008 0.000 -0.019
Bowel/Bladder Incontinence 0.005 0.004 0.007 0.011 0.041
Physically Restrained -0.007 -0.014 0.016** -0.003 0.000
Urinary Tract Infection 0.002 -0.007 0.008 0.013 -0.008
Pressure Ulcers (Low Risk Resident) 0.003 0.002 0.001 -0.002 0.003
Pressure Ulcers (High Risk Resident) 0.006 -0.020 0.000 -0.005 -0.027
Falls with Major Injury 0.001 -0.002 0.007 0.010 0.001
Antipsychotic Medication -0.006 -0.016 0.007 0.024 -0.049
Notes: The first column of the table reports the difference in average baseline quality in counties with excess demand compared to no excess demand. The remaining columns of the table report the difference in the change in quality within reimbursement group between 2006 to 2010 for facilities in counties with excess demand compared to facilities in counties with no excess demand. ***p<0.01, **p<0.05, * p<0.1

18