Medicaid Long Term Services and Supports - … · Medicaid Long Term Services and Supports: ......
25
Medicaid Long Term Services and Supports: A Review of Available Evidence
Transcript of Medicaid Long Term Services and Supports - … · Medicaid Long Term Services and Supports: ......
Medicaid Long Term Services and Supports: A Review of Available Evidence
1
Table of Contents
Introduction 2
Key Findings 2 Section 1: Overview of MLTSS 3
Section 2: Implementation Experiences 7 Section 3: Ability to Improve Outcomes 14 Section 4: Cost Effectiveness 17 Conclusion 20 Notes 21
2
Introduction
Medicaid fills a prominent role in financing Long-Term Services and Supports (LTSS) to older adults and individuals with disabilities. It is the single largest payer for such services. Medicaid beneficiaries who require LTSS typically have complex health care needs as well, such as multiple chronic illnesses. As a result, this population is especially vulnerable to poorly coordinated care.
Many states currently use managed care to provide acute care services to children and non-disabled adults. There is a widely held view that managed care could also work in LTSS – in particular, that it could reduce costs and improve coordination of LTSS services for older adults and persons with disabilities. Currently, only a minority of states use managed care to coordinate LTSS. Some programs operate statewide, or nearly so, while others are limited to certain geographic regions. A number of states are interested in implementing managed LTSS programs or expanding existing ones. This paper provides a brief overview of existing Managed Long-term Service and Supports (MLTSS) programs, discusses implications for the Centers for Medicare and Medicaid Services (CMS) Financial Alignment Initiative (also known as the Dual Eligible Integration Demonstration), and explores in detail state experience with MLTSS and managed acute care (MAC) regarding capitation rates, network adequacy, and plan departures from state programs. This discussion also addresses the implications of these experiences for an expansion of Medicaid managed LTSS. Finally, the paper summarizes research on Managed Long-term Service and Supports (MLTSS) programmatic impacts on beneficiary health outcomes and costs.
For more information, contact Mike Cheek, Vice President for Medicaid & Long Term Policy, at [email protected].
Key Findings
1. Experts recommend updates to capitation rates based on each MCO’s experience. ► States should ensure rates reflect the needs of the beneficiaries. If
capitated rates are inadequate plans may exit the program or shut down.
2. MCOs are expected to provide many services for which they are at risk. ► Full or partial capitation can give MCOs time to build enrollment and gain
experience managing particular populations. 3. The adequacy of MLTSS capitated rates needs additional research.
► States may find that their capitated rates are too low and some will eventually apply minimum loss ration requirements to MLTSS plans.
3
4. States use various methods to ensure adequacy of MCO provider networks.
► Since LTSS offers a broad range of services, determining network adequacy is essential and six approaches are discussed.
5. Methodology for monitoring LTSS quality is underdeveloped. ► Due to the lack of national quality standards and inadequate measurement
systems, states have tailored measures to their plans and must build on this capacity to comply with CMS rules.
6. Medicaid managed care plans may fail or withdraw, disrupting care. ► Factors that contribute to the retention or exit of MLTSS plans from a
market are highlighted and a case study examined.
7. MLTSS programs have shown mixed results regarding health outcomes. ► There is no clear choice for one model that improves health outcomes
better than others, yet several programs show potential. A robust MLTSS program requires strong participation by medical specialists.
8. Care coordination is promising, but more research on best practices is needed.
► There are great differences in care coordination methods between the states but several share themes that may serve as incubators for future comparative research on best practices, especially into participant-directed options.
9. Studies on the impact of MLTSS on costs are mixed. ►Several examples show why MLTSS is unlikely to produce short-term
gains for state budgets but may achieve longer term savings by improving care management and beneficiary health outcomes.
Section 1: Overview of Managed Long-Term Services and Supports in the States
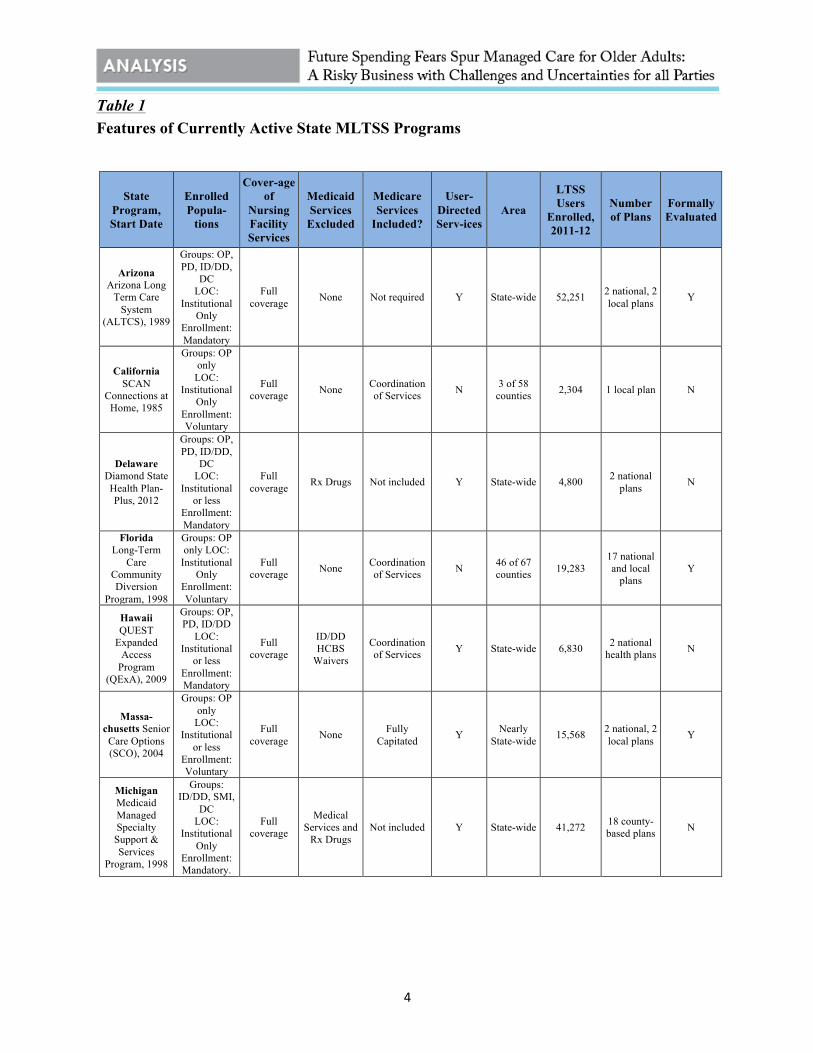
State use of managed long-term services and supports (MLTSS) is not widespread; MLTSS accounted for only 5 percent of Medicaid’s total LTSS expenditures in Federal Fiscal Year 2009. Sixteen states currently offer MLTSS programs: Arizona, California, Delaware, Florida, Hawaii, Massachusetts, Michigan, Minnesota, New Mexico, New York, North Carolina, Pennsylvania, Tennessee, Texas, Washington and Wisconsin.
At least 9 of these states have several years of experience operating MLTSS programs and will be discussed further as case studies. Among states with MLTSS programs, 7 of 16 have programs that operate statewide, but some of these statewide programs only serve specific populations. For example, Michigan, North Carolina and Pennsylvania only use MLTSS to serve beneficiaries with developmental disabilities or severe mental illnesses.
4
Table 1 Features of Currently Active State MLTSS Programs
State Program, Start Date
Enrolled Popula-
tions
Cover-age of
Nursing Facility Services
Medicaid Services
Excluded
Medicare Services
Included?
User-Directed Serv-ices
Area
LTSS Users
Enrolled, 2011-12
Number of Plans
Formally Evaluated
Arizona Arizona Long
Term Care System
(ALTCS), 1989
Groups: OP, PD, ID/DD,
DC LOC:
Institutional Only
Enrollment: Mandatory
Full coverage None Not required Y State-wide 52,251 2 national, 2
local plans Y
California SCAN
Connections at Home, 1985
Groups: OP only
LOC: Institutional
Only Enrollment: Voluntary
Full coverage None Coordination
of Services N 3 of 58 counties 2,304 1 local plan N
Delaware Diamond State Health Plan-Plus, 2012
Groups: OP, PD, ID/DD,
DC LOC:
Institutional or less
Enrollment: Mandatory
Full coverage Rx Drugs Not included Y State-wide 4,800 2 national
plans N
Florida Long-Term
Care Community Diversion
Program, 1998
Groups: OP only LOC:
Institutional Only
Enrollment: Voluntary
Full coverage None Coordination
of Services N 46 of 67 counties 19,283
17 national and local
plans Y
Hawaii QUEST
Expanded Access
Program (QExA), 2009
Groups: OP, PD, ID/DD
LOC: Institutional
or less Enrollment: Mandatory
Full coverage
ID/DD HCBS
Waivers
Coordination of Services Y State-wide 6,830 2 national
health plans N
Massa-chusetts Senior
Care Options (SCO), 2004
Groups: OP only
LOC: Institutional
or less Enrollment: Voluntary
Full coverage None Fully
Capitated Y Nearly State-wide 15,568 2 national, 2
local plans Y
Michigan Medicaid Managed Specialty Support & Services
Program, 1998
Groups: ID/DD, SMI,
DC LOC:
Institutional Only
Enrollment: Mandatory.
Full coverage
Medical Services and
Rx Drugs Not included Y State-wide 41,272 18 county-
based plans N

5
State Program, Start Date
Enrolled Popula-
tions
Cover-age of
Nursing Facility Services
Medicaid Services
Excluded
Medicare Services
Included?
User-Directed Serv-ices
Area
LTSS Users
Enrolled, 2011-12
Number of Plans
Formally Evaluated
Minnesota
MN Senior Health Options (MSHO), 1997
MN Senior Care Plus
(MSC+), 2005
Groups: OP only
LOC: Institutional
or less Enrollment: Voluntary
First 180 days only None Fully
Capitated Y State-wide 25,819
8 private contractor
and county-based plans
Y
Groups: OP only
LOC: Institutional
or less Enrollment: Voluntary
First 180 days only None Coordination
of Services Y State-wide 6,874 8 private
and county-based plans
Y
New Mexico CoLTS, 2008
Groups: OP, PD, DC LOC:
Institutional or less
Enrollment: Mandatory
Full coverage
Behavioral health Not included Y State-wide 22,446 2 national
plans Y
New York
Managed Long-term
Care Program, 1998
Groups: OP and PD LOC:
Institutional Enrollment: Voluntary
Full coverage
Medical Services and
Rx Drugs
Coordination of Services N
9 counties (mostly NYC Metro area)
45,417
14 plans, mostly
provider-based
Y
Medicaid Advantage Plus, 2006
Groups: OP and PD LOC:
Institutional Enrollment: Voluntary
Full coverage None Coordination
of Services N
19 counties (includes
NYC)
1,875
8 national, regional, and local
plans
N
North Carolina
MH/DD/SAS Health Plan
Waiver, 2005
Groups: ID/DD, SMI,
DC LOC:
Institutional Enrollment: Mandatory
Not covered Medical
Services and Rx Drugs
Not included Y 41 out of
100 counties
4,699 3 local plans N
Penn-sylvania Adult
Community Autism
Program, 2009
Group: Adults 21+ with Autism
LOC: Institutional Enrollment: Voluntary
Not covered
Medical Services, Rx Drugs and
Home Health
Not included N 4 of 67 counties 90 1 local plan N
Tennessee TennCare
CHOICES, 2010
Groups: OP, PD, DC LOC:
Institutional Enrollment: Mandatory
Full coverage Rx Drugs Coordination
of Services Y State-wide 31,200 2 national, 1 local plan N
Texas STAR+PLUS,
1998
Groups: OP, PD, DC LOC:
Institutional or less
Enrollment: Mandatory
Not covered Behavioral Health in
Dallas Area
Coordination of Services Y 42 of 254
counties 71,239 5 national plans Y

6
State Program, Start Date
Enrolled Popula-
tions
Cover-age of
Nursing Facility Services
Medicaid Services
Excluded
Medicare Services
Included?
User-Directed Serv-ices
Area
LTSS Users
Enrolled, 2011-12
Number of Plans
Formally Evaluated
Washington Medicaid
Integration Partnership,
2005
Groups: OP, PD, ID/DD,
SMI LOC:
Institutional or less
Enrollment: Voluntary
First 180 days only
ID/DD HCBS Waiver
Coordination of Services Y 1 of 39
counties 413 1 national plan Y
Wisconsin Family Care,
1999
Groups: OP, PD, ID/DD Enrollment: Voluntary
Full coverage
Medical and Rx Drugs
Coordination of Services Y 57 of 72
counties 33,141 9 local plans Y
Family Care Partnership,
1996
Groups: OP, PD, ID/DD Enrollment: Voluntary
Full coverage None Fully
Capitated Y 19 of 72 counties 3,871 4 local
plans Y
Notes: Group Identifiers: OP = Older Persons 65+, PD = Physically Disabled Adults, ID/DD = Adults with Intellectual/Developmental Disabilities, SMI = Adults with Severe Mental Illness, DC = Disabled Children, generally includes most children with SSI-related Medicaid eligibility. LOC: Level of care. Source: Saucier, Paul, Jessica Karsten, Brian Burwell and Lisa Gold. “The Growth of Managed Long-Term Services and Supports (MLTSS) Programs: A 2012 Update.” Centers for Medicare and Medicaid Services, July 2012.
Initiatives authorized by the Affordable Care Act (ACA) will drive further penetration of managed care in the LTSS area. CMS recently launched the Medicare-Medicaid Financial Alignment Initiative, often referred to as the “duals integration demonstration.” The Initiative enables states to use a capitated managed care model or an enhanced fee-for-service model, or both, to make significant changes to the way that acute care and LTSS services for Medicare-Medicaid dual eligibles are funded. Under a capitated model (payment is a fixed per person, per month payment), states will contract with managed care organizations (MCOs) that will be authorized to manage both the acute care benefits covered under Medicare and Medicaid-financed LTSS. Both Medicare and Medicaid capitated payments will be made to the MCOs. Plans are expected to deliver all contracted services to enrolled beneficiaries in exchange for the capitated payment. Among the goals of this risk-based managed care model is promoting the cost-effective provision of services. In the enhanced fee-for-service model, called managed fee-for-service (MFFS), Medicare and Medicaid will continue to pay for services on a fee-for-service basis, and the state will make additional payments to providers to cover care coordination services.
Twenty states have developed draft proposals for participation in the Financial Alignment Initiative under the capitated model, and ten have officially submitted capitated model proposals to CMS. Another 6 states have drafted managed FFS proposals, and one state has submitted an official MFFS proposal. However a number of states have withdrawn their proposals including AZ, HI, OR, MN, NM, and TN. With the exception of OR, all of these states have extensive experience with MLTSS and/or integrated care.
Many of these states have aggressive timelines for enrolling a large portion or, in some cases, all of the state’s dual eligible beneficiaries. Due to the magnitude of these shifts

7
and the relative lack of state experience with MLTSS models, many stakeholders have expressed concerns about the proposals. Though MLTSS is not currently widespread, insights can be gained from the states that do operate MLTSS programs. This literature review will summarize state experiences with managed care, particularly MLTSS, in an effort to glean such insights.
Section 2: State Implementation of Managed LTSS Programs -- Experiences with Rate Setting, Ensuring Network Adequacy, Quality Oversight, and Plan Exits
As discussed above, in risk-based managed care arrangements, payers make capitated payments to managed care organizations (MCOs). The MCOs are required to deliver all contracted services to enrolled beneficiaries in exchange for these capitated payments. MCOs may also be eligible for bonuses or subject to penalties based on their quality score measures.
Capitated payments to each MCO may be adjusted to reflect the health status of the MCO’s members. Such adjustments are made so that plans with a higher number of members with significant disabilities receive a higher rate to compensate for those members’ greater expected costs; this process is known as risk adjustment.
In return, MCOs agree to assume financial risk for their members’ care. If its members use more and/or higher-cost care than expected, an MCO may have lower profits. This financing model gives MCOs incentives to coordinate care across settings and to shift care to lower-cost settings, where possible. However, managed care financing models also can inadvertently encourage MCOs to provide inadequate or less care in order to maximize profits, which could negatively affect members’ health outcomes.
This section summarizes how states with MLTSS programs: 1) attempted to ensure their capitation rates were adequate; 2) assessed whether MLTSS plans had a sufficient number and scope of LTSS providers; and 3) handled plans exiting the program .
Finding 1: Experts Recommend that States Update Capitation Rates Based on Each MCO’s Experience
States should ensure that the rates they pay MLTSS programs reflect the needs of the beneficiaries, which may vary by age, gender, location, health status and other factors. The Center for Health Care Strategies (CHCS) found that for most MLTSS programs, states determine the initial rates for Medicaid beneficiaries with disabilities and other older adults living in the community using the fee-for-service costs of beneficiaries enrolled in Medicaid Home- and Community-Based Services (HCBS) waiver programs. A number of the remaining MLTSS states have competing contractors in each region where MLTSS is offered, and may factor bids submitted by these contractors into the rate setting process.
The initial rate is updated periodically to account for inflation and changes in utilization. Most MLTSS programs either apply a trend factor to the initial rate or base the update on an analysis of recent HCBS experience (i.e., cost and utilization data). Currently, Arizona, Wisconsin, and New York update their rates based on contractor experience —

8
the costs that each contracted MLTSS plan has incurred to service beneficiaries with severe disabilities — instead of using either of the other approaches.
CHCS recommends using contractor/plan experience, as these three states do, to update rates. The MLTSS population could be sicker (or healthier) or vary in other ways from the HCBS waiver population, so updating rates based on waiver spending may not be the optimal approach.
States using the "contractor experience" approach can update rates in two ways:
1. Separately for each MCO, using each MCO's own experience. This results in a more accurate payment and reduces the likelihood of excess profits or losses for each MCO. However, this can reduce incentives to provide care in the most efficient manner possible; MCOs that spend more on similar enrollees (i.e., MCOs that are less efficient) receive larger updates.
2. Based on the average MCO's experience, with the same update applied to all MCOs. This approach would need to be combined with a system of adjusting payments to account for variations in enrollees' health status and service needs, which is known as risk adjustment. Without risk adjustment, plans with higher-need beneficiaries would have greater costs but not higher payments.
► Implications for the Financial Alignment Initiative: States that are new to MLTSS will likely base their initial MLTSS plan rates on their present Medicaid HCBS waiver costs and rates. Risk adjustment for MLTSS based on historical fee-for-service spending is unrefined.
Finding 2: States Vary Regarding the Services MCOs Are Expected to Provide, and for Which They Are at Risk
A Center for Health Care Strategies (CHCS) survey found that full capitation, where plans are at risk for both community and nursing facility services, provides the maximum financial incentive to improve care and achieve cost containment. A number of states, such as Arizona and New Mexico, use full capitation. Other states "carve out" some services from the MCOs' capitation rates, an approach known as “partial capitation.”
For example, MCOs may be unwilling to assume full risk for institutional care, if they believe the capitated payments do not fully reflect the high cost of such institutional care. It is possible to carve out institutional care from the capitation rates, meaning that MCOs are not responsible for providing such care, while still providing a financial incentive for them to direct beneficiaries into the community – e.g., states can give MCOs quality bonuses based on nursing facility admission rates (lower rates qualify for bonuses). The rationale for carving out other services, such as behavioral health, can give MCOs time to build enrollment and gain experience managing particular populations, after which they may be willing to accept risk for these services. As shown in table 1 (above), most MLTSS plans cover behavioral health as well as all other long-term care services and supports.

9
States have reported that risk-sharing arrangements are critical, especially in the early years of an MLTSS program. Under these arrangements, the state may share some of the financial risk with MCOs. For example, a state could cap each MCO's maximum losses at a certain amount; it might also require MCOs to pay into a reinsurance fund that would cover losses above this amount. These arrangements may make plans more willing to take on risks that they might otherwise view as too unpredictable.
Finding 3: Additional Research Is Needed on the Adequacy of MLTSS Capitated Rates
There have not been any nationwide or even multi-state analyses to determine if MLTSS capitation rates have been adequate and/or appropriately set, but individual states have conducted analyses.
Wisconsin, for example, commissioned its Legislative Audit Bureau (LAB) to conduct a study in 2010 to determine the adequacy of its MLTSS rates. The LAB analyzed MCOs' financial statements and spending on services and administration, and determined that rates based on the experiences of pilot counties were insufficient for many of the newer MCOs because the participants served by the newer MCOs were generally more costly. Eight of the nine MCOs had operating deficits in 2009, and three of nine had operating deficits in 2010. The report advised Wisconsin to provide newer MCOs with up to five years of additional payments for risk-sharing, as well as making other adjustments to capitated payments to ensure MCOs' financial stability.
In response to these recommendations, Wisconsin significantly changed its approach to: 1) calculate a baseline rate for each of the three types of participants — developmentally disabled, physically disabled, and non-disabled older adults; 2) use data from functional screen assessments to adjust the baseline rate to reflect costs associated with certain functional limitations such as dementia; and 3) create a weighted average rate for each MCO. Despite these adjustments, Wisconsin expects continued disputes with the MCOs.
Some states require Medicaid managed care plans to meet a minimum medical loss ratio (MLR), which means they must spend a minimum percentage of total capitated payments on medical services. For example, if a state applies an 85 percent medical loss ratio, plans must devote at least 85 percent of the capitated payments they receive to delivery of services, leaving 15 percent for administrative costs – e.g., claims processing, marketing, MCO staff (not provider) salaries -- and profit. The MLR is intended to ensure that the dollars states spend on capitated payments are largely being used to finance actual care; if plans consistently have low MLRs, it can be a sign that rates are too high.
Medical loss ratio requirements are somewhat common in Medicaid managed acute care. A survey of 33 states in 2010 by the Kaiser Family Foundation found that 11 states had a minimum MLR requirement in Medicaid managed care, with 3 additional states planning to implement an MLR. Minimum MLRs ranged from 80 percent in three states to 93 percent for one plan in Hawaii that provided medical services exclusively (?) to beneficiaries who were elderly and/or had disabilities. However, there is no information available on how common this requirement is in MLTSS. In its Financial Alignment Initiative demonstration, Massachusetts will require plans to report their MLRs, but the state will not establish a minimum, at least not initially.
10
►Implications for the Financial Alignment Initiative: There is not much research to guide state policies for ensuring the adequacy of MLTSS capitated rates. Some states may find, as Wisconsin did, that their initial rates are too low. It seems likely that some states will eventually apply MLR requirements to MLTSS plans, but few if any will do so immediately, given limited state experience with MLTSS. In January 2014, CMS will implement an ACA-required MLR of 85 percent for Medicare Advantage Prescription Drug Plans (MA-PD). It is unclear how this Medicare MLR will affect the MLTSS plans participating in the Financial Alignment Initiative; these plans will cover pharmacy/prescription drug services.
Finding 4: States Use Various Methods to Ensure Adequacy of MCOs’ Provider Networks
States seek to ensure that an MCO's beneficiaries are able to access qualified providers in a timely manner, which encompasses availability of appointments, geographical proximity and cultural competence/language access. Literature on methods that states use to ensure network adequacy is limited. States with established MLTSS programs appear to follow a similar set of practices, but there is little evidence regarding the success of these efforts.
In 2012, AARP conducted a survey of eight states with established MLTSS programs to identify methods of ensuring network adequacy. Most states used some combination of the following approaches:
• Monitored summary utilization data, such as number of personal care visits delivered on time (all states).
• Reviewed plans’ published lists of network providers for shortcomings (7 of 8 states).
• Created geography-specific measures of access that MCOs had to meet, such as a minimum number of in-network providers within a certain distance from a specified location (7 of 8 states).
• Reviewed provider reimbursement rates to determine if a large number of providers were declining to participate (4 of 8 states).
• Referred MCOs with network adequacy problems in certain areas to providers with whom the state contracted for FFS Medicaid-covered services (5 of 8 states).
• Contracted with External Quality Review Organizations (EQROs) to supplement their review activities, or to take over responsibility for review activities entirely (4 of 8 states).
Some states go beyond these practices. Texas and Tennessee, for example, use "mystery shoppers" to contact providers' offices to ensure that they are accepting new patients.
The LTSS population uses a much broader range of services, clinical and non-clinical, than non-disabled adults and children. Care coordination for LTSS users encompasses
11
management of behavioral health conditions and delivery of social services. MLTSS plans operating in Pennsylvania and New Jersey had to request additional time to reach out to non-medical providers, often working with state agencies on aging or developmental disability to do so. States new to MLTSS may find that the network adequacy standards they have developed for traditional Medicaid managed care are insufficient.
Network adequacy in rural areas is a particular concern. A 1983 evaluation of Arizona's MLTSS program found that rural plans had more limited HCBS provider networks than urban plans. Long travel distances, limited public transportation systems, and small client pools were identified as barriers to network adequacy in rural areas.
Capitated rates can have a major impact on the adequacy of provider networks. If the capitated rates paid to the MCO are insufficient to cover the enrollees' true cost of care, the MCO will likely have to reduce its provider payment rates, making recruitment of providers more difficult. For example, MLTSS plans in Wisconsin contended that their capitation rates were inadequate (an independent reviewer concurred; see discussion above). A number of plans operated at deficits and/or had negative net assets at some point in the year. As would be expected, some providers reported that their payment rates were reduced, often with little advance notice. In addition, a number of providers complained about delays in receiving authorization for services. Some providers have stated that, due to these problems, they do not intend to continue participating in the Wisconsin Family Care Program. ►Implications for the Financial Alignment Initiative: States are likely to use and build on existing methods to ensure network adequacy. However, states with only acute Medicaid managed care experience may find ensuring network adequacy for MLTSS plans more challenging, due to the extensive service needs of the LTSS population.
Finding 5: Methodology for Monitoring LTSS Quality Is Underdeveloped
Most states with MLTSS programs include LTSS-specific quality measurements; however, the lack of national standards has led to widely differing approaches across states. Current national managed care quality measurement systems such as HEDIS and CAHPS are not sensitive enough to the needs of the chronically ill. Consequently, states have often developed, either independently or in collaboration with external quality review organizations (EQROs), more tailored clinical measures. Many states have used reporting requirements in their existing HCBS waiver programs, such as percent of participants who received all the services in their care plans, as a basis for their MLTSS measures. Other elements addressed by MLTSS performance measures include member satisfaction and timeliness of care. The literature contained little information on how the quality of long-stay nursing home care is measured in MLTSS programs.
Most state LTSS performance-monitoring activities include face-to-face interviews with beneficiaries, auditing care plans, and reviewing critical incidents. State Medicaid agencies commonly form partnerships with external stakeholders (including: external

12
quality review organizations; state staff in health, aging, or disability departments; and consumer advocacy groups) in order to increase oversight capacity.
A 2012 AARP review of best practices in MLTSS identified a number of innovative activities states are performing in contract monitoring, quality assurance and performance improvement, including using IT audits to review MCO data submission, real-time service-monitoring tools, and ombudsman programs. The report emphasized the need for a skilled, diverse staff with information system expertise in order to effectively carry out monitoring activities.
►Implications for the Financial Alignment Initiative: States will have to build their MLTSS performance measurement and monitoring capacity in order to successfully implement their dual-eligible integration proposals, including complying with CMS quality measurement requirements for the demonstrations.
Finding 6: Medicaid Managed Care Plans May Fail or Withdraw, Disrupting Care for Beneficiaries
If capitated rates are inadequate and/or plans operate at deficits for an extended period, they may exit the managed care program or shut down. There have been several instances of such “plan failure” in the Medicaid managed acute care market. However, there is limited research concerning failure of MLTSS plans.
Historically, large numbers of plans have both entered and exited the Medicaid managed acute care market. For example, in 2001, 68 plans entered the market (began contracting with one or more states) and 57 exited (ceased all participation in Medicaid managed care).
The Urban Institute found that for Medicaid managed acute care plans in 2000 and 2001, higher capitation rates and higher growth rates in those capitation rates were positively associated with plans staying in the market. Uncertainty over future rates also appeared to be a factor in plan exits. The authors of the study also found that non-profit and provider-sponsored plans were less likely to exit. The same study concluded that carving out pharmacy services increased the risk that plans would exit. The authors noted that although carving out pharmacy services reduced the financial risk to MCOs, it may have impeded their ability to manage care. In fact, a February 2012 Kaiser Family Foundation report found that states are moving toward including pharmacy services in Medicaid managed care arrangements in order to achieve more integrated care, in addition to the financial considerations. Finally, the study found that if states required disabled Medicaid beneficiaries to enroll in managed care, MCOs were more likely to exit, probably because the MCOs found, or feared, that the capitated rates did not reflect the much higher cost of this population. CASE STUDY: TENNCARE TennCare was an ambitious expansion of Tennessee’s Medicaid program in 1994 that covered most of the uninsured in the state and placed plans at risk for most acute care services (except for specialty mental health). The state approved 12 MCO bids.
13
However, many of the MCOs had no prior experience with Medicaid managed care and the costs of the enrolled population were higher than expected. These higher costs put significant financial pressure on the MCOs. Blue Cross Blue Shield (the state’s largest insurer), which covered half of TennCare’s enrollees, withdrew from the program in 2000. According to Blue Cross Blue Shield, it had become increasingly difficult to break even, as the state (due to financial pressures) did not update its capitation rates in accordance with enrollee costs. The insurer reported that its TennCare provider network was eroding, as it was unable to pay providers adequately. One MCO was put into receivership and a number of other MCOs exited the market. Tennessee negotiated new contracts with MCOs and temporarily moved away from a capitated/risk-sharing arrangement. Instead, the MCOs were paid on a fee-for-service basis for services provided to enrollees, and also continued to fulfill administrative functions, such as creating provider networks and paying provider claims.
Today there are only three MCOs participating in TennCare, but they operate at full risk. The state’s assessment is that beneficiary satisfaction is high, quality of care has improved and the MCOs are financially stable.
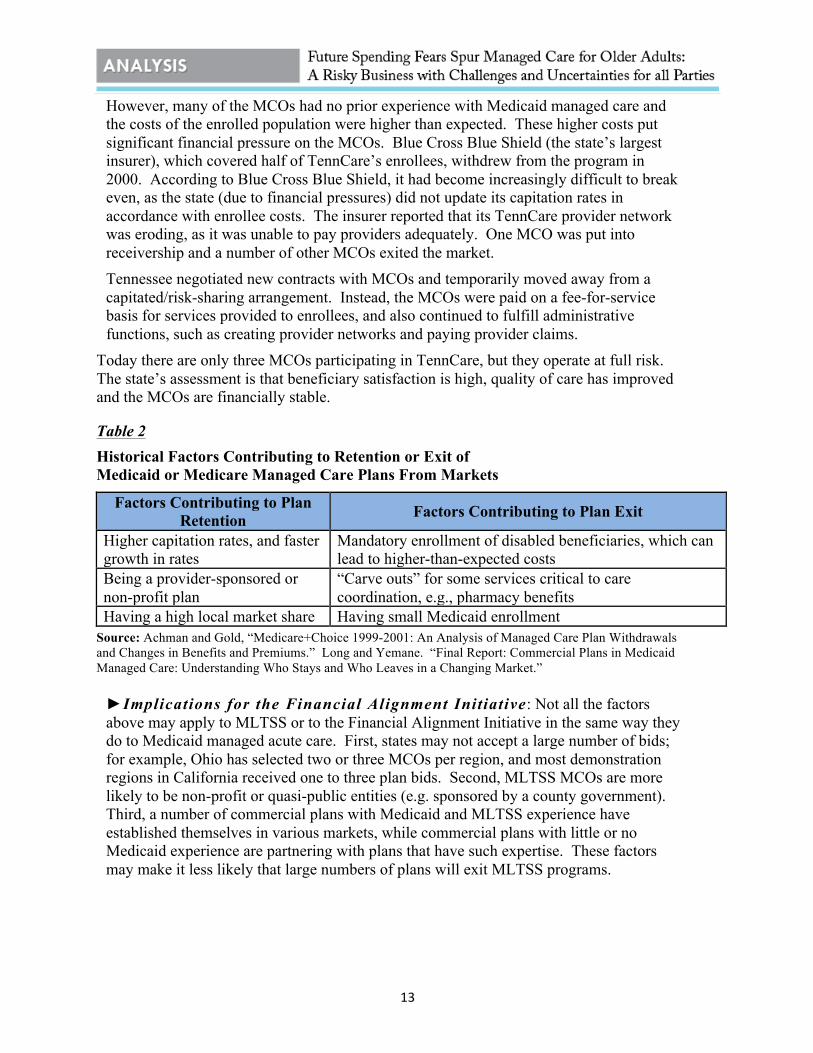
Table 2 Historical Factors Contributing to Retention or Exit of Medicaid or Medicare Managed Care Plans From Markets
Factors Contributing to Plan Retention Factors Contributing to Plan Exit
Higher capitation rates, and faster growth in rates
Mandatory enrollment of disabled beneficiaries, which can lead to higher-than-expected costs
Being a provider-sponsored or non-profit plan
“Carve outs” for some services critical to care coordination, e.g., pharmacy benefits
Having a high local market share Having small Medicaid enrollment Source: Achman and Gold, “Medicare+Choice 1999-2001: An Analysis of Managed Care Plan Withdrawals and Changes in Benefits and Premiums.” Long and Yemane. “Final Report: Commercial Plans in Medicaid Managed Care: Understanding Who Stays and Who Leaves in a Changing Market.”
►Implications for the Financial Alignment Initiative: Not all the factors above may apply to MLTSS or to the Financial Alignment Initiative in the same way they do to Medicaid managed acute care. First, states may not accept a large number of bids; for example, Ohio has selected two or three MCOs per region, and most demonstration regions in California received one to three plan bids. Second, MLTSS MCOs are more likely to be non-profit or quasi-public entities (e.g. sponsored by a county government). Third, a number of commercial plans with Medicaid and MLTSS experience have established themselves in various markets, while commercial plans with little or no Medicaid experience are partnering with plans that have such expertise. These factors may make it less likely that large numbers of plans will exit MLTSS programs.
14
Section 3: The Ability of Managed LTSS Programs to Improve Outcomes – Access, Care Coordination, and Person-Centeredness
Finding 7: Evaluations of MLTSS Programs Have Shown Mixed Results Regarding Health Outcomes for Beneficiaries
MEDICAID-ONLY MLTSS PROGRAMS:
• Arizona: A 1996 evaluation compared participant outcomes in the Arizona Long Term Care System (ALTCS) to outcomes in neighboring New Mexico’s traditional Medicaid program found that ALTCS nursing home residents were more likely to experience poor outcomes such as decubitus ulcers, fever, and improper catheter insertion.
• Texas: Early evaluations showed that STAR+PLUS decreased the numbers of inpatient discharges (i.e., admissions) and emergency room visits, and also reduced the average hospital length of stay compared to the FFS baseline. A more focused evaluation of only Supplemental Security Income (SSI) beneficiaries in STAR+PLUS found members had shorter hospital lengths of stay and fewer emergency room visits than a comparison group not enrolled in managed care.
• Wisconsin: Initial evaluations of Wisconsin Family Care generated conflicting results. In 2003, the Lewin Group compared Family Care members to the remainder of the state along four clinical outcomes and found no significant difference in hospital or emergency room admissions, development of decubitus ulcers, or death.36 However, a similarly timed evaluation by APS Healthcare instead compared member outcomes before and after enrollment in the program and found that hospital length of stay decreased significantly following enrollment in Family Care.
MEDICARE-MEDICAID INTEGRATED MLTSS PROGRAMS:
• Massachusetts: Early program evaluations showed Senior Care Options provided high-quality, community-based care that was more capable of maintaining frailer individuals in the community than traditional Medicaid.
• Minnesota: A 2003 evaluation found that Minnesota Senior Health Options (MSHO) members in nursing homes had fewer hospital admissions and days, fewer preventable hospital admissions, and fewer emergency room visits and preventable emergency room visits than control group members. Differences were similarly positive but not as large for community MSHO members. A follow-up evaluation in 2005 found that MSHO community and nursing home residents had fewer preventable hospital and ER visits than a comparison group; there were no major differences in other nursing home quality indicators. Overall, the authors concluded that the improvements in outcomes were too small to justify the cost of changing models of care.
15
• PACE: A 1998 study found that PACE enrollees had higher self-reported health status, lived longer, and spent more days in the community than a comparison group; however, the positive effects of PACE generally diminished after six months in the program. PACE was found to have the greatest effect on health outcomes for enrollees with a high number of limitations in Activities of Daily Living (ADLs). A second evaluation conducted a decade later focused on the longer-term effects of PACE and found weak evidence that PACE improved health status. Comparisons of Medicaid-only MLTSS to PACE have found no significant differences in health outcomes between the two models of care.
Overall, evaluations of Medicaid-only and integrated MLTSS programs find some improvements in health for beneficiaries. There is less evidence concerning the impact of MLTSS programs on participants’ functional status, as measured by their ability to perform ADLs. The first PACE evaluation found that PACE participants had significantly fewer limitations in ADLs than similar individuals who had declined to participate, though the difference was smaller after six months in the program. Later evaluations of MLTSS programs have found no significant effect on functional status. Implications for Financial Alignment Initiative: No one model for MLTSS stands out as the clear choice for states looking to improve health outcomes for their elderly and disabled populations. A number of models show potential to improve health outcomes, including both Medicaid-only and Medicaid-Medicare integrated approaches. Greater research on existing programs, especially follow-ups to initial evaluations, is needed to determine which models have the greatest potential for replication in other states.
Beneficiary Access to Providers and Services
The experience of states with long-running managed care for acute services shows that beneficiary access to needed providers and services is commonly problematic. In a recent survey by the Kaiser Family Foundation, over two-thirds of states with Medicaid managed care programs reported that beneficiaries enrolled in MCOs sometimes experience access problems; difficulties seeing specialists and behavioral health providers are among the problems frequently cited. Given that individuals receiving long-term care are heavy users of these services, MLTSS programs will need to be especially vigilant in facilitating beneficiary access. Many states do report that their MLTSS programs have increased access to care, especially for home- and community-based services (HCBS), which are largely non-medical services such as home care and homemaker services.
MEDICAID-ONLY MLTSS PROGRAMS:
• Arizona: The Arizona Long Term Care System (ALTCS) has progressively increased the use of HCBS over time. For example, from 1998 to 2002, the percentage of ALTCS members being served in their own homes or in alternative residential settings increased from 41 percent to 63 percent.
16
• New Mexico: A 2011 independent assessment of CoLTS found access to general providers was at 91 percent or better in urban areas and 85 percent or better in rural areas. The study showed that, similar to Medicaid managed acute care programs, Medicaid MLTSS programs can have difficulty providing beneficiaries’ sufficient access to specialists. For example, only 53 percent of CoLTS members in rural areas had timely access to an orthopedic surgeon.
• Wisconsin: A 2003 independent assessment of Wisconsin Family Care found that the program improved access to LTSS: waiting lists for long-term care services in Family Care counties were eliminated, while waiting lists in comparison counties continued to increase.
MEDICARE-MEDICAID INTEGRATED MLTSS PROGRAMS:
• Minnesota: A 2003 evaluation found that community members in Minnesota Senior Health Options (MSHO) had greater access to homemaker services, home-delivered meals, and outpatient rehabilitation services relative to a control group.
►Implications for Financial Alignment Initiative: States need to closely monitor beneficiary access and ensure that their programs promote participation by specialists. Guaranteeing beneficiary access in rural areas is especially challenging. States may need to consider other models of care for rural areas, such as fee-for-service primary care case management (PCCM).
Finding 8: Care Coordination is Promising, but More Research on Best Practices Is Needed, Particularly on Best Practices for Coordination of Medicare and Medicaid Services
A number of Medicaid MLTSS programs include care coordination programs that have the goal of improving beneficiary outcomes and lowering costs, but few evaluations of any care coordination models have been conducted, much less of models targeted to dual eligibles. Even though states differ greatly in their approaches to coordinating care for the elderly and disabled, many programs share themes that can serve as the focus of future comparative research. Common characteristics include: (1) flexible capitated payments to allow patients to receive a mix of needed medical and social services; (2) key care coordination activities such as medication reconciliation, patient education, and patient assessment for risk of hospitalization; (3) information systems that facilitate coordination of care; and (4) a team approach to care management.
While state-level programs have not been assessed, a recent evaluation of a small care coordination demonstration project within Medicare suggests that coordination of care for high-need individuals can improve outcomes and reduce spending. A 2012 evaluation of the Physician Group Practice Demonstration, a precursor to accountable care organizations that allowed participating physician groups to share savings, showed a statistically significant 1 percent reduction in the 30-day readmission rate and average annual savings of $532 among dual eligible beneficiaries, with most of the savings due to reductions in hospitalization. Savings varied widely across physician groups, however,
17
underscoring the need to identify the most effective elements of care coordination programs.
Altogether, states appear to have much to gain through greater coordination of care for their elderly and disabled populations. A 2012 report by the U.S. Government Accountability Office (GAO) found that only one-fifth of state Medicaid contracts with Medicare Dual-Eligible Special Needs Plans (D-SNPs) contain provisions for active care coordination between Medicaid agencies and D-SNPs. The Financial Alignment Initiative gives states the opportunity and the incentive to greatly enhance coordination of Medicare and Medicaid services.
MCO Utilization of LTSS Participant-Directed Services
The Department of Health and Human Services defines participant-direction as a way to allow beneficiaries and their families to control what services are received, who provides them, and how and when those services are delivered. Participant direction has been shown to improve beneficiary outcomes and increase access to care.
A recent inventory of MLTSS found that 12 of 16 states offer participant-directed options in their programs. Eight of these offer only employer authority, allowing beneficiaries to hire, supervise, and fire care workers, and the remaining four states also offer budgetary authority, giving beneficiaries a flexible budget for the purchase of goods and services related to LTSS needs. In order to ensure beneficiary access to participant-directed services, these states generally require MCOs to discuss the availability of such services with all members during the initial needs assessment and at regular reassessment intervals.
Beyond contractually requiring MCOs to offer participant-directed services, states can use monitoring tools to ensure proper administration. For example, Wisconsin Family Care uses a member outcome tool to measure beneficiary perception of the availability and choice of services, including participant-directed options.
►Implications for the Financial Alignment Initiative: Successful implementation of participant-directed services in a state’s MLTSS program requires establishment of clear, contractual MCO obligations and a robust monitoring program.
Section 4: Cost-Effectiveness of Managed LTSS Programs
Finding 9: Studies on the Impact of MLTSS on Costs Are Inconclusive Research has generally shown that MLTSS programs reduce the use of institutional services and increase access to less costly home and community-based services (HCBS); however, questions remain as to whether adopting this financing model leads to reduced overall Medicaid spending on this population.
Studies of the shift in Medicaid from fee-for-service to managed acute care have found mixed results. While a 2004 synthesis of 14 studies found that Medicaid managed care typically produces cost savings , a recent nationwide survey raised questions about the potential for overall savings—the survey found that states with low FFS payment rates generally have to increase spending in order to implement managed care.
18
MEDICAID-ONLY MLTSS PROGRAMS:
• Arizona: The final evaluation of the Arizona Long-Term Care System (ALTCS) in 1996 concluded that ALTCS had saved Arizona 16 percent ($290 million) over five years in comparison to traditional Medicaid and that these savings increased substantially from 0.2 percent in 1989 to 21 percent in 1993. Furthermore, according to the evaluation ALTCS slowed the rate of growth of health care costs from an estimated 9.6 percent per year under traditional Medicaid to 4 percent per year. Another independent assessment supported and further refined these findings, showing that the expansion of HCBS under ALTCS had saved the state 35 percent in nursing home costs ($4.6 million), even after factoring in the cost of HCBS. The study highlighted three major reasons for the cost-effectiveness of the program: large investment in administrative infrastructure; requiring participants to be in need of at least three months of nursing home care to be eligible; and payments that encouraged MCOs to shift patients to HCBS.
• New Mexico: A state evaluation of New Mexico’s CoLTS program found that the program was administratively complex and exceeded the state’s cost estimates by over 10 percent. The cost increases were driven by growth in the use of personal care options, higher than expected enrollment (including of expensive populations), and new costs associated with managed care. The report recommended streamlining state oversight, specifically the multiple waivers and programs that inhibited cost-effective managed care.
• Texas: At the beneficiary level, STAR+PLUS has reduced costs for at least some subsets of the population. A 2003 study of program implementation in one county showed that costs for Medicaid-only beneficiaries receiving adult day care or personal assistance were significantly lower when compared to beneficiaries not in MLTSS ($3,226 vs. $13,160). Based on the experience of operating MLTSS in that pilot county, a 2004 analysis predicted that expansion of STAR+PLUS to 51 metropolitan counties would reduce state Medicaid spending by 3.3 percent; however, the report cautioned that MLTSS would not be cost-effective in rural counties. Since these reports were issued, Texas has added 29 counties to STAR+PLUS in 2007 and 13 more counties in 2011. No definitive analysis of the cost-effectiveness of this expansion has been conducted. The Texas Health and
• Human Services Commission (HHSC) estimates that the state can save approximately $300 million in 2012-13 by expanding STAR+PLUS to 10 more counties.
• Wisconsin: Analyses of the cost-effectiveness of the Family Care Program offer conflicting results. The first evaluation of the pilot program (The Lewin Group, 2003) found that average monthly Medicaid expenditures increased much more quickly in Family Care counties than in the remainder of the state (25.2 percent vs. 10.9 percent). However, a 2005 analysis by APS Healthcare concluded that Family Care produced substantial savings both directly through controlling service costs and indirectly by improving participants’ health and decreasing the need for services. According to this second study, average per member per month costs
19
were $454 lower in four Family Care counties and $55 lower in the fifth county when compared to FFS counties.
MEDICARE-MEDICAID INTEGRATED MLTSS PROGRAMS:
• Minnesota: A 2003 evaluation found that the Minnesota Senior Health Options (MSHO) program actually cost more than FFS; the MSHO capitated payments for both Medicaid and Medicare were significantly higher than FFS payments, for both the community and nursing home populations. For example, in 2000, the average Medicaid payment was $202 higher and the average Medicare payment was $252 higher for an MSHO participant in the community population than for a control group member in the same population. For nursing home-eligible beneficiaries, the average Medicaid payment was $230 higher and the average Medicare payment was $202 higher in the MSHO group than in the control group. The authors attributed the higher Medicare capitated payments, in part, to payment changes enacted under the Balanced Budget Act of 1997 that de-linked capitated payments from local FFS costs.
• PACE: Like MSHO, PACE is a comprehensive care model that places MCOs at full risk for all Medicare and Medicaid services. An evaluation of the PACE demonstration in the late 1990s that followed participants during the first year of enrollment found that while overall costs were similar to FFS, the Medicaid capitated payments were higher than payments in a FFS-comparison group and the Medicare capitated payments were lower. A second evaluation covering a longer period of time produced somewhat similar findings -- little effect on Medicare spending and an increase in Medicaid spending of several hundred dollars per month.
• Medicare Advantage Special Needs Plans (SNPs): Medicare Advantage SNPs were created in 2003 to improve care for populations with special needs, including dual eligibles. SNPs receive a capitated payment from Medicare and have the option to enter into contracts with state Medicaid agencies to administer Medicaid benefits, thus increasing the coordination of care. A 2010 Avalere Health analysis of a large SNP (SCAN Legacy Plan) in California providing coordinated Medicare and Medicaid services to roughly 90,000 beneficiaries showed strong evidence of cost savings. When compared to Medicare FFS for a similar population, the plan reduced Medicare spending by $250 million over two years. The study did not analyze changes in Medicaid spending.
Our review of state and federal MLTSS programs suggests that models emphasizing movement of patients from institutional care to HCBS, such as Arizona’s, can yield long-term, increasing savings. The ALTCS experience further demonstrates that early and significant state investment in administrative infrastructure is one of the keys to a cost-effective program, most likely due to the need for strong oversight of MCOs, especially quality initiatives. States that opt for models integrating Medicare and Medicaid services may have difficulty achieving Medicaid savings. Evaluations of MSHO and PACE suggest

20
Medicare spending may decline, but Medicaid spending usually increases. Coordination of care between Medicare and Medicaid is likely to be better for beneficiaries, but it may not meet states’ needs if they are implementing MLTSS with the goal of reducing state Medicaid spending.
►Implications for the Financial Alignment Initiative: States need time to build their integrated Medicare-Medicaid programs before they can determine whether reductions in Medicaid spending are possible. While MLTSS is unlikely to provide short-term fixes for state budgets, states may be able to achieve Medicaid savings over the longer term through reducing utilization of institutional care, and by improving care management and beneficiary health outcomes.
Conclusion
States have limited experience thus far with managed long-term services and supports. Research to date suggests that implementing managed LTSS programs poses different challenges than overseeing existing managed acute care programs. Among these challenges are accurately setting capitation rates and ensuring adequate provider networks for a population that is much sicker. This population uses a greater volume of services and sees a wide range of providers than the typical Medicaid managed acute care enrollee. There are, however, lessons learned from the managed acute care context that can be applied to limit the risk and minimize attrition of MLTSS plans.
While there is a strong expectation that managed long-term care will promote care coordination, additional research is needed regarding which care coordination models are most effective and which will in turn require states to expand implementation of the various models.
Evidence suggests that integrating Medicare and Medicaid benefits may not reduce costs; Medicaid spending may actually increase. Improvements in quality are similarly not guaranteed – the impact of managed long-term services and supports on health outcomes has been mixed, although there is some evidence that managed LTSS can enhance access to some services. In order to realize the promise of MLTSS regarding cost containment and improvements in health outcomes, it will be necessary for states to augment their monitoring capacity, and apply this enhanced monitoring capacity to MCO quality initiatives as well as spending.
21
Notes 1 Arizona, California, Hawaii, Idaho, Illinois, Massachusetts, Michigan, Minnesota, New Mexico, New York, Ohio, Oregon, Rhode Island, South Carolina, Tennessee, Texas, Vermont, Virginia, Washington and Wisconsin. 2 Illinois, Massachusetts, Minnesota, Michigan, Ohio, Oregon, Tennessee, Vermont, Washington and Wisconsin. 3 Kronick, Richard and Karen Llanos. “Rate Setting for Medicaid Managed Long-Term Supports and Services: Best Practices and Recommendations for States.” Center for Health Care Strategies, March, 2008. http://www.chcs.org/usr_doc/Rate_Setting_for_Medicaid_MLTS.pdf 4 Kronick, Richard and Karen Llanos. “Rate Setting for Medicaid Managed Long-Term Supports and Services: Best Practices and Recommendations for States.” Center for Health Care Strategies, March, 2008. http://www.chcs.org/usr_doc/Rate_Setting_for_Medicaid_MLTS.pdf 5 Kronick, Richard and Karen Llanos. “Rate Setting for Medicaid Managed Long-Term Supports and Services: Best Practices and Recommendations for States.” Center for Health Care Strategies, March, 2008. http://www.chcs.org/usr_doc/Rate_Setting_for_Medicaid_MLTS.pdf 6 Kronick, Richard and Karen Llanos. “Rate Setting for Medicaid Managed Long-Term Supports and Services: Best Practices and Recommendations for States.” Center for Health Care Strategies, March, 2008. http://www.chcs.org/usr_doc/Rate_Setting_for_Medicaid_MLTS.pdf 7 Gore, Suzanne and Julie Klebonis. “Medicaid Rate-Setting Strategies to Promote Home- and Community-Based Services.” Center for Health Care Strategies, May, 2012. http://www.chcs.org/usr_doc/Incentivizing_HCBS_in_MLTS_Programs_05_01_12.pdf 8 Gore, Suzanne and Julie Klebonis. “Medicaid Rate-Setting Strategies to Promote Home- and Community-Based Services.” Center for Health Care Strategies, May, 2012. http://www.chcs.org/usr_doc/Incentivizing_HCBS_in_MLTS_Programs_05_01_12.pdf 9 Saucier, Paul and Julie Fralich. "Financing and Payment Issues in Rural Long-Term Care Integration." Journal of Applied Gerontology, 20 (2001): 409-425. 10 Highsmith, Nikki and Stephen Sommers. "Adults with Disabilities in Medi-Cal Managed Care: Lessons from Other States." Medi-Cal Policy Institute, September, 2003. http://www.chcs.org/usr_doc/MediCalDisabilitiesLessons.pdf 11 Stuiber, Paul, Scott Sager, Elizabeth Drilias, Joe Fontaine, Justin Martin, Andrew McGuire, Molly Regan and Jacob Schindler. "An Evaluation: Family Care." Wisconsin Legislative Audit Bureau. April, 2011. http://legis.wisconsin.gov/lab/reports/11-5full.pdf 12 Gifford, Kathleen, Vernon Smith, Dyke Snipes and Julia Paradise. "A Profile of Medicaid Managed Care Programs in 2010: Findings from a 50-State Survey." Kaiser Family Foundation, September, 2011. http://www.kff.org/medicaid/upload/8220.pdf 13 Gifford, Kathleen, Vernon Smith, Dyke Snipes and Julia Paradise. "A Profile of Medicaid Managed Care Programs in 2010: Findings from a 50-State Survey." Kaiser Family Foundation, September, 2011. http://www.kff.org/medicaid/upload/8220.pdf 14 Commonwealth of Massachusetts, Executive Office of Health and Human Services and U.S. Department of Health and Human Services. "Request for Responses from Integrated Care Organizations." June, 2012. http://www.mass.gov/eohhs/docs/eohhs/healthcare-reform/120730-duals-demo-rfr.pdf 15 Lipson, Debra, Jenna Libersky, Rachel Machta, Lynda Flowers and Wendy Fox-Grage. "Keeping Watch: Building State Capacity to Oversee Medicaid Managed Long-Term Services and Supports." AARP, July 2012. http://www.aarp.org/content/dam/aarp/research/public_policy_institute/health/keeping-watch-building-state-capacity-to-oversee-medicaid-managed-ltss-AARP-ppi-health.pdf 16 Lipson, Debra, Jenna Libersky, Rachel Machta, Lynda Flowers and Wendy Fox-Grage. "Keeping Watch: Building State Capacity to Oversee Medicaid Managed Long-Term Services and Supports." AARP, July 2012. http://www.aarp.org/content/dam/aarp/research/public_policy_institute/health/keeping-watch-building-state-capacity-to-oversee-medicaid-managed-ltss-AARP-ppi-health.pdf 17 Highsmith, Nikki and Stephen Sommers. "Adults with Disabilities in Medi-Cal Managed Care: Lessons from Other States." Medi-Cal Policy Institute, September, 2003. http://www.chcs.org/usr_doc/MediCalDisabilitiesLessons.pdf 18 McCall, Nelda, Jodi Korb, Michael Crane, William Weissert and C. William Wrightson. "Evaluation of Arizona's Health Care Cost Containment System Demonstration: Third Implementation and Operation Report." Health Care Financing Administration, October, 1993. http://aspe.hhs.gov/pic/reports/cms/2509_2.pdf
22
19 Stuiber, Paul, Scott Sager, Elizabeth Drilias, Joe Fontaine, Justin Martin, Andrew McGuire, Molly Regan and Jacob Schindler. "An Evaluation: Family Care." Wisconsin Legislative Audit Bureau. April, 2011. http://legis.wisconsin.gov/lab/reports/11-5full.pdf 20 The Healthcare Effectiveness Data and Information Set (HEDIS) is a widely used set of performance measures in the managed care industry, developed and maintained by the National Committee for Quality Assurance (NCQA). 21 The Consumer Assessment of Healthcare Providers and Systems (CAHPS) program is a multi-year initiative of the Agency for Healthcare Research and Quality (AHRQ) to support and promote the assessment of consumers' experiences with health care. These surveys cover topics that are important to consumers and focus on aspects of quality that consumers are best qualified to assess, such as the communication skills of providers and ease of access to health care services. 22 Highsmith, Nikki, and Stephen Somers. “Adults with Disabilities in Medi-Cal Managed Care: Lessons from Other States.” Oakland, CA: Medi-Cal Policy Institute, 2003. 23 Saucier, Paul, Jessica Kasten, Brian Burwell, and Lisa Gold. 2012. “The Growth of Managed Long-Term Services and Supports (MLTSS) Programs: A 2012 Update.” Truven Health Analytics. Prepared under CMS Contract No. HHSM-500-2005-00025I. 24 Saucier, Paul, Jessica Kasten, Brian Burwell, and Lisa Gold. 2012. “The Growth of Managed Long-Term Services and Supports (MLTSS) Programs: A 2012 Update.” Truven Health Analytics. Prepared under CMS Contract No. HHSM-500-2005-00025I. 25 Lipson, Debra, Jenna Libersky, Rachel Machta, Lynda Flowers and Wendy Fox-Grage. "Keeping Watch: Building State Capacity to Oversee Medicaid Managed Long-Term Services and Supports." AARP, July 2012. http://www.aarp.org/content/dam/aarp/research/public_policy_institute/health/keeping-watch-building-state-capacity-to-oversee-medicaid-managed-ltss-AARP-ppi-health.pdf 26 Lipson, Debra, Jenna Libersky, Rachel Machta, Lynda Flowers and Wendy Fox-Grage. "Keeping Watch: Building State Capacity to Oversee Medicaid Managed Long-Term Services and Supports." AARP, July 2012. http://www.aarp.org/content/dam/aarp/research/public_policy_institute/health/keeping-watch-building-state-capacity-to-oversee-medicaid-managed-ltss-AARP-ppi-health.pdf 27 Long, Sharon and Alshadye Yemane. “Final Report: Commercial Plans in Medicaid Managed Care: Understanding Who Stays and Who Leaves in a Changing Market.” Centers for Medicare and Medicaid Services, September, 2004. http://www.cms.gov/Research-Statistics-Data-and-Systems/Statistics-Trends-and-Reports/Reports/Downloads/Long2.pdf 28 Long, Sharon and Alshadye Yemane. “Final Report: Commercial Plans in Medicaid Managed Care: Understanding Who Stays and Who Leaves in a Changing Market.” Centers for Medicare and Medicaid Services, September, 2004. http://www.cms.gov/Research-Statistics-Data-and-Systems/Statistics-Trends-and-Reports/Reports/Downloads/Long2.pdf 29Kaiser Family Foundation (KFF). “Medicaid Managed Care: Key Data, Trends, and Issues.” February 2012. 30 Page, Leigh. "Blues Plan Throws in the Towel, Leaves Troubled TennCare." American Medical News, January 3, 2000. http://www.ama-assn.org/amednews/2000/01/03/mkl10103.htm 31 Mirvis, David, James Bailey and Cyril Chang. “TennCare – Medicaid Managed Care in Tennessee in Jeopardy.” American Journal of Managed Care, 8 (2002): 57-68. 32 Gordon, Darrin. “Tennessee’s Experience Serving the Medicaid Population in Managed Care: Lessons Learned from the TennCare Experience." National Committee for Quality Assurance, 2011. http://www.ksinsurance.org/hbexplan/files/20111228_gpid10_NCQA2011_Tennessee_2011Dec13.pdf 33 McCall, Nelda et al. Evaluation of Arizona’s Health Care Cost Containment System — Final Report. San Francisco, CA: Laguna Research, 1996. 34 Texas A&M Public Policy Research Institute. “STAR+PLUS Medicaid Managed Care Waiver Study: An Independent Assessment of Access, Quality, and Cost-Effectiveness,” 1999, and Texas A&M Public Policy Research Institute. “Medicaid Managed Care Waiver Study: An Independent Assessment of Access, Quality, and Cost-Effectiveness of the STAR+PLUS Program,” 2002. 35 Aydede, Sema K. “The Impact of Care Coordination on the Provision of Health Care Services to Disabled and Chronically Ill Medicaid Enrollees (Texas Star+Plus Focus Study).” Gainesville: University of Florida, Institute for Child Health Policy, 2003. 351 Lewin Group. “Wisconsin Family Care Final Evaluation Report.” Washington, DC: The 36.Lewin Group, 2003. 37 APS Healthcare, Inc. “Family Care Independent Assessment: An Evaluation of Access, Quality and Cost-Effectiveness for Calendar Year 2002.” Washington, DC: APS Healthcare, Inc, 2003.
23
38 JEN Associates, Inc. “MassHealth SCO Program Evaluation Pre-SCO Enrollment Period CY2004 and Post-SCO Enrollment Period CY2005 Nursing Home Entry Rate and Frailty Level Comparisons.” Cambridge, MA: JEN Associates, Inc, 2008. 39 Kane, Robert L., and Patricia Homyak. “Minnesota Senior Health Options Evaluation Focusing on Utilization, Cost and Quality of Care.” Minneapolis: University of Minnesota School of Public Health, Division of Health Services Research and Policy, 2003. 40 Kane, Robert L., Patricia Homyak, Boris Bershadsky, Terry Lum, Shannon Flood and Hui Zhang. “The Quality of Care under a Managed-Care Program for Dual Eligibles.” Gerontologist 45 (2005): 496-504. 41 Chatterji, Pinka, Nancy R. Burstein, David Kidder, and Alan J. White. 1998. “The Impact of PACE on Participant Outcomes.” Cambridge, MA: Abt Associates. Prepared under HCFA Contract No. 500-96-0003/T04 42 Beauchamp, Jody, Valerie Cheh, Robert Shmitz, Peter Kemper, and John Hall. 2008. “The Effect of the Program of All-Inclusive Care for the Elderly (PACE) on Quality.” Princeton, NJ: Mathematica Policy Research, Inc. Submitted to the Centers for Medicare and Medicaid under Contract No. 500-00-0033. 43 Nadash, Pamela. 2008. “Two Varieties of Managed Long-Term Care: Comparing PACE and Medicaid-Only Models.” PhD dissertation, Columbia University. Ann Arbor, MI: ProQuest/UMI (Publication No. 3333414). 44 Chatterji, Pinka, Nancy R. Burstein, David Kidder, and Alan J. White. 1998. “The Impact of PACE on Participant Outcomes.” Cambridge, MA: Abt Associates. Prepared under HCFA Contract No. 500-96-0003/T04 45 Kane, Robert L., and Patricia Homyak. “Minnesota Senior Health Options Evaluation Focusing on Utilization, Cost and Quality of Care.” Minneapolis: University of Minnesota School of Public Health, Division of Health Services Research and Policy, 2003, and Beauchamp, Jody, Valerie Cheh, Robert Shmitz, Peter Kemper, and John Hall. 2008. “The Effect of the Program of All-Inclusive Care for the Elderly (PACE) on Quality.” Princeton, NJ: Mathematica Policy Research, Inc. Submitted to the Centers for Medicare and Medicaid under Contract No. 500-00-0033. 46 Kaiser Family Foundation. “A Profile of Medicaid Managed Care Programs in 2010: Findings from a 50-State Survey.” Washington, DC: Kaiser Family Foundation, 2011. 47 Arizona Health Care Cost Containment System, Arizona Department of Economic Security, and Arizona Department of Health Services. “Arizona’s Community-Based Services and Settings Report, 3rd Biennial.” Phoenix: State of Arizona, 2002. 48 New Mexico Medical Review Association. “Independent Assessment of New Mexico’s Medicaid Managed Care Program — Coordination of Long-Term Services, Final Report.” June 24, 2011. 49 APS Healthcare, Inc. “Family Care Independent Assessment: An Evaluation of Access, Quality and Cost-Effectiveness for Calendar Year 2002.” Washington, DC: APS Healthcare, Inc, 2003. 50 Kane, Robert L., Patricia Homyak, Boris Bershadsky, Yat-Sang Lum and Mir Said Siadaty. “Outcomes of Managed Care of Dually Eligible Older Persons.” Gerontologist 43(2003): 165–74. 51 Sparer, Michael S. “Managed Long-Term Care: Limits and Lessons.” Journal of Aging and Health 15(2003): 269-291. 52 Medicare Payment Advisory Commission (MedPAC). “Chapter 5: Coordinating Care for Dual-Eligible Beneficiaries.” Report to the Congress: Medicare Payment Policy, March 2011. Washington, DC: MedPAC, 2011 and Verdier, James M., Melanie Au, and Jessica Gillooly. “Managing the Care of Dual Eligible Beneficiaries: a Review of Selected State Programs and Special Needs Plans.” Washington, DC: Mathematica Policy Research, 2010. 53 Medicare Payment Advisory Commission (MedPAC). “Chapter 5: Coordinating Care for Dual-Eligible Beneficiaries.” Report to the Congress: Medicare Payment Policy, March 2011. Washington, DC: MedPAC, 2011, and Verdier, James M., Melanie Au, and Jessica Gillooly. “Managing the Care of Dual Eligible Beneficiaries: a Review of Selected State Programs and Special Needs Plans.” Washington, DC: Mathematica Policy Research, 2010. 54 Colla, Carrie, David Wennberg, Ellen Meara, Jonathan Skinner, Daniel Gottleib, Valerie Lewis, Christopher Snyder and Elliot Fisher. “Spending Differences Associated with the Medicare Physician Group Practice Demonstration.” Journal of the American Medical Association, 308(10): 1015-1023, 2012. 55 United States Government Accountability Office (GAO). “Medicare Special Needs Plans: CMS Should Improve Information Available About Dual-Eligible Plans’ Performance.” Washington, DC: GAO, 2012. 56 Department of Health and Human Services. “Participant-Directed Services.” Retrieved on September 28, 2012 from http://www.longtermcare.gov/LTC/Main_Site/Understanding/Service_Delivery/Participant_Directed.aspx 57 O’Keeffe, Janet, Paul Saucier, Beth Jackson, Robin Cooper, Ernest McKenney, Suzanne Crisp and Charles Moseley. “Understanding Medicaid Home and Community Services: A Primer, 2010 Edition.” Research Triangle Park, North Carolina: RTI International, 2010.
24
58 Saucier, Paul, Jessica Kasten, Brian Burwell, and Lisa Gold. 2012. “The Growth of Managed Long-Term Services and Supports (MLTSS) Programs: A 2012 Update.” Truven Health Analytics. Prepared under CMS Contract No. HHSM-500-2005-00025I. 59.The Lewin Group. “Wisconsin Family Care Final Evaluation Report.” Washington, DC: The Lewin Group, 2003. 60 The Lewin Group. “Medicaid Managed Care Cost Savings — A Synthesis of Fourteen Studies.” Washington, DC: The Lewin Group, 2004. 61 Duggan, Mark, and Tamara Hayford. “Has the Shift to Managed Care Reduced Medicaid Expenditures? Evidence from State and Local-Level Mandates.” Cambridge, MA: National Bureau of Economic Research, 2011. 62 McCall, Nelda et al. “Evaluation of Arizona’s Health Care Cost Containment System — Final Report.” San Francisco, CA: Laguna Research, 1996. 63 Weissert, William G., Timothy Lesnick, Melissa Musliner, and Kathleen Foley. “Cost Savings from Home and Community-Based Services: Arizona’s Capitated Medicaid Long-Term Care Program.” Journal of Health Politics, Policy and Law, 22 (1997): 1329-1357. 64 New Mexico Human Services Department. “Program Evaluation: Medicaid Coordination of Long-Term Services Program.” February 14, 2011. 65 Aydede Sema. “The Impact of Care Coordination on the Provision of Health Care Services to Disabled and Chronically Ill Medicaid Enrollees,” University of Florida: Institute for Child Health Policy, 2003. 66 Lewin Group. “Actuarial Assessment of Medicaid Managed Care Expansion Options.” Prepared for the Texas Health and Human Services Commission. Amended version, January 21, 2004. 67 Texas Health and Human Services Commission. “Presentation to Senate Finance Committee on Medicaid Cost Saving Proposals for Managed Care, February 22, 2011.” Retrieved on 9/19/12 from http://www.hhsc.state.tx.us/news/presentations/2011/Senate-Appropriations-0211.pdf 68 Lewin Group. “Wisconsin Family Care Final Evaluation Report.” Washington, DC: The Lewin Group, 2003. 69 APS Healthcare, Inc. “Family Care Independent Assessment: An Evaluation of Access, Quality and Cost-Effectiveness for Calendar Year 2003-2004.” Washington, DC: APS Healthcare, Inc., 2005. 70.Kane, Robert L., and Patricia Homyak. “Minnesota Senior Health Options Evaluation Focusing on Utilization, Cost and Quality of Care.” Minneapolis: University of Minnesota School of Public Health, Division of Health Services Research and Policy, 2003. 71.White, Alan J., Yvonne Abel, and David Kidder. “A Comparison of the PACE Capitation Rates to Projected Costs in the First Year of Enrollment.” Cambridge, MA: Abt Associates, 2000. 72 Foster, Leslie, Robert Schmitz, and Peter Kemper. “The Effects of PACE on Medicare and Medicaid Expenditures.” Princeton, NJ: Mathematica, 2007. 73 Avalere Health, LLC. “Comparing CMS Spending for a Special Needs Plan’s Enrollees with Medicare Fee-for-Service.” Washington, DC: Avalere Health, LLC. 2010.