MEDICAID EVIDENCE-BASED DECISIONS … EVIDENCE-BASED DECISIONS PROJECT (MED) ... and Alison Little...
65
MEDICAID EVIDENCE-BASED DECISIONS PROJECT (MED) Rapid Review Elective Induction of Labor October 2010 This report was written the Center for Evidence-based Policy at Oregon Health & Science University (the Center). The Center is a policy resource and is not providing any legal or business advice. The Governance group has voted to make this report available for public distribution and for the benefit of the Medicaid Evidence-based Decisions Project participant organizations and their constituent decision-making bodies. This report is not a Policy Statement of the Center for Evidence- based Policy. Center for Evidence-based Policy Oregon Health & Science University 3455 SW US Veterans Hospital Road, Mailstop SN-4N, Portland, OR 97239-2941 503.494.2182 Fax 503.494.3807 http://www.ohsu.edu/xd/research/centers-institutes/evidence-based-policy-center/
Transcript of MEDICAID EVIDENCE-BASED DECISIONS … EVIDENCE-BASED DECISIONS PROJECT (MED) ... and Alison Little...

MEDICAID EVIDENCE-BASED DECISIONS PROJECT (MED)
Rapid Review
Elective Induction of Labor
October 2010
This report was written the Center for Evidence-based Policy at Oregon Health & Science University (the Center). The Center is a policy resource and is not providing any legal or business advice. The Governance group has voted to make this report available for public distribution and for the benefit of the Medicaid Evidence-based Decisions Project participant organizations and their constituent decision-making bodies. This report is not a Policy Statement of the Center for Evidence-
based Policy.
Center for Evidence-based Policy Oregon Health & Science University
3455 SW US Veterans Hospital Road, Mailstop SN-4N, Portland, OR 97239-2941 503.494.2182 Fax 503.494.3807
http://www.ohsu.edu/xd/research/centers-institutes/evidence-based-policy-center/

The Center for Evidence-based Policy (http://www.ohsu.edu/policycenter) is a collaboration of academic and governmental entities with the mission of addressing policy challenges with evidence and collaboration. Established in 2003 by Oregon Governor John Kitzhaber, M.D. and colleagues, the Center builds on lessons learned from improving public policy in the field of health care through innovation, collaboration, and use of best evidence. The Medicaid Evidence-based Decisions (MED) Project is housed at the Center, and is a collaboration of state Medicaid programs and their state partners whose purpose is to make high quality evidence available to states to support benefit design and coverage decisions. The MED Project products include identification and synthesis of high quality systematic reviews and other studies, technology assessments of existing and emerging health technologies, and rapid evaluations of healthcare interventions. Additional information about the project can be found at the following link: http://www.ohsu.edu/xd/research/centers-institutes/evidence-based-policy-center/med/index.cfm. Suggested citation: King, V., Pilliod, R., & Little, A. (2010). Rapid review: Elective induction of labor. Portland: Center for Evidence-based Policy. Available at: http://www.ohsu.edu /xd/research/centers-institutes/evidence-based-policy-center/med/index.cfm
Acknowledgement This report was prepared by: Valerie J. King MD, MPH; Rachel Pilliod BS; and Alison Little MD, MPH The Medicaid Evidence-based Decisions Project Center for Evidence-based Policy Oregon Health & Science University This report was reviewed by experts in the field. Names of reviewers and disposition of review comments are available upon request.
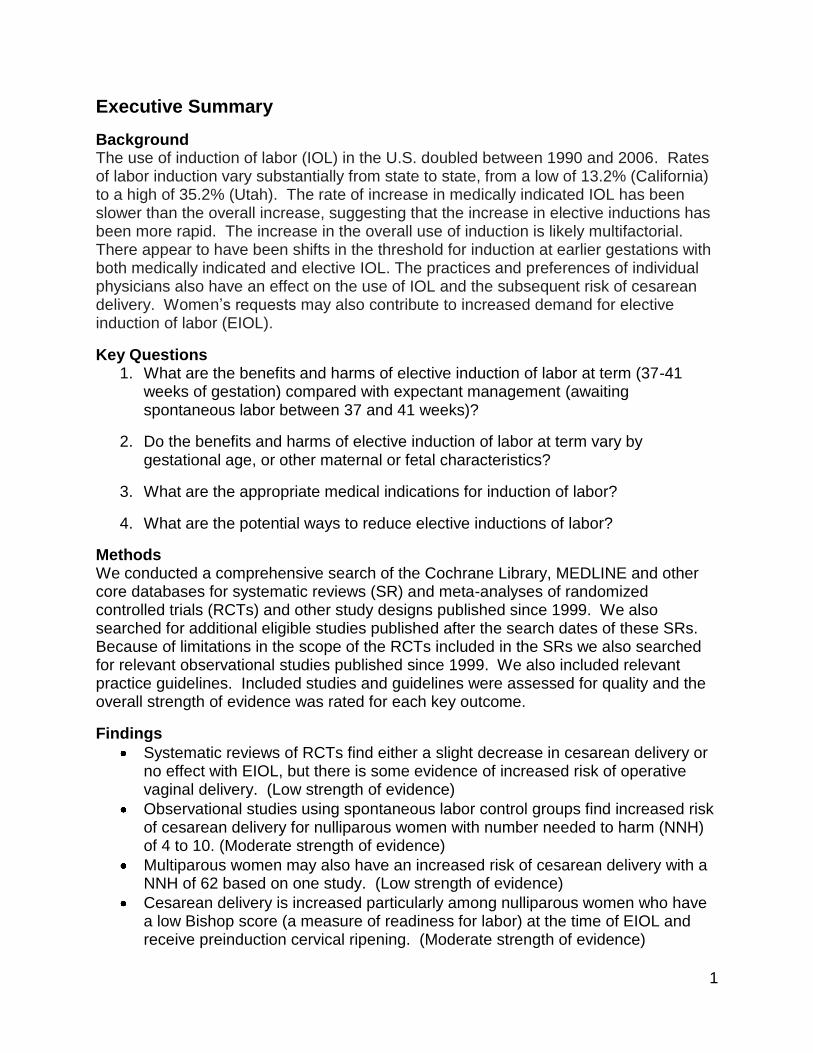
Table of Contents Executive Summary ...................................................................................................... 1
Background ................................................................................................................... 3
Key Questions .............................................................................................................. 5
Methods ......................................................................................................................... 5
Findings ......................................................................................................................... 7
Key Question #1: What are the benefits and harms of elective induction of labor at term (37-41 weeks of gestation) compared with expectant management (awaiting spontaneous labor between 37 and 41 weeks)?..........................................................8
Table 1. Cesarean delivery after EIOL compared with SL ....................................... 11
Key Question #2: Do the benefits and harms of elective induction of labor at term
vary by gestational age, or other maternal or fetal characteristics? ......................17
Table 2. Bishop Score ................................................................................................ 9
Key Question #3: What are the appropriate medical indications for induction of
labor?..................................................................................................... ......................19
Table 3. Strength of evidence and grade of recommendation supporting commonly
cited indication for inductions of labor ..................................................................... 21
Key Question #4: What are the potential ways to reduce the elective inductions of
labor? ........................................................................................................................... 25
Guidelines .................................................................................................................... 27
Table 4. Induction of labor guidelines summary ...................................................... 28
Joint Commission and National Quality Forum ........................................................ 32
Summary ...................................................................................................................... 32
Conclusions ................................................................................................................. 34
Appendix A. Updated Search Strategy ...................................................................... 35
Appendix B. Summary of Systematic Reviews: Elective Induction of Labor ....... 37
Appendix C. Summary of Observational Studies: Elective Induction of Labor.. . 40
Appendix D. Summary of Quality Improvement/Guideline Implementation Studies:
Elective Induction of Labor ........................................................................................ 51
Appendix E. Relevant Codes ..................................................................................... 56
References ................................................................................................................... 58
1
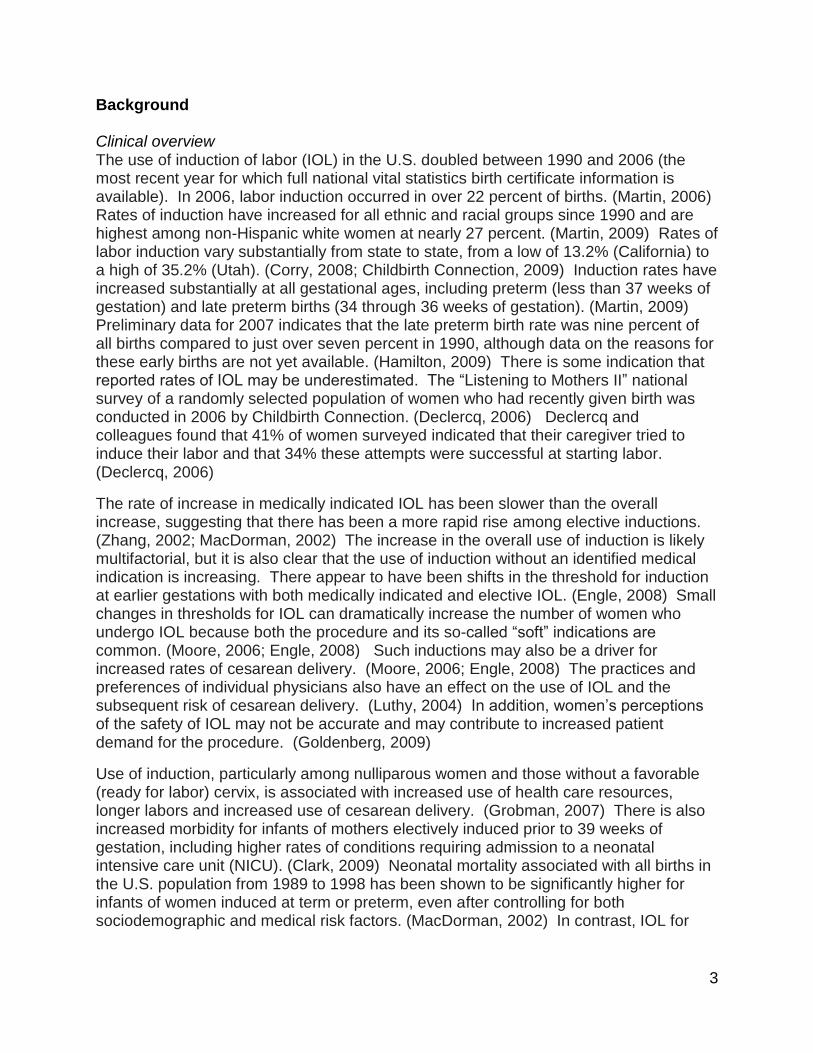
Executive Summary
Background The use of induction of labor (IOL) in the U.S. doubled between 1990 and 2006. Rates of labor induction vary substantially from state to state, from a low of 13.2% (California) to a high of 35.2% (Utah). The rate of increase in medically indicated IOL has been slower than the overall increase, suggesting that the increase in elective inductions has been more rapid. The increase in the overall use of induction is likely multifactorial. There appear to have been shifts in the threshold for induction at earlier gestations with both medically indicated and elective IOL. The practices and preferences of individual physicians also have an effect on the use of IOL and the subsequent risk of cesarean delivery. Women’s requests may also contribute to increased demand for elective induction of labor (EIOL).
Key Questions 1. What are the benefits and harms of elective induction of labor at term (37-41
weeks of gestation) compared with expectant management (awaiting spontaneous labor between 37 and 41 weeks)?
2. Do the benefits and harms of elective induction of labor at term vary by gestational age, or other maternal or fetal characteristics?
3. What are the appropriate medical indications for induction of labor?
4. What are the potential ways to reduce elective inductions of labor?
Methods We conducted a comprehensive search of the Cochrane Library, MEDLINE and other core databases for systematic reviews (SR) and meta-analyses of randomized controlled trials (RCTs) and other study designs published since 1999. We also searched for additional eligible studies published after the search dates of these SRs. Because of limitations in the scope of the RCTs included in the SRs we also searched for relevant observational studies published since 1999. We also included relevant practice guidelines. Included studies and guidelines were assessed for quality and the overall strength of evidence was rated for each key outcome.
Findings
Systematic reviews of RCTs find either a slight decrease in cesarean delivery or no effect with EIOL, but there is some evidence of increased risk of operative vaginal delivery. (Low strength of evidence)
Observational studies using spontaneous labor control groups find increased risk of cesarean delivery for nulliparous women with number needed to harm (NNH) of 4 to 10. (Moderate strength of evidence)
Multiparous women may also have an increased risk of cesarean delivery with a NNH of 62 based on one study. (Low strength of evidence)
Cesarean delivery is increased particularly among nulliparous women who have a low Bishop score (a measure of readiness for labor) at the time of EIOL and receive preinduction cervical ripening. (Moderate strength of evidence)

2
Infants face an increased risk of admission to a neonatal intensive care unit (NICU) if their mothers undergo EIOL prior to 39 weeks of gestation. (Moderate strength of evidence)
The length of active labor may be shorter with EIOL, although the total time spent on a labor and delivery unit or in the hospital may be greater. (Very low strength of evidence)
Most commonly cited indications for IOL are not well supported by evidence. Only the indications of a gestational age beyond 41 weeks and prelabor rupture of membranes at term are supported by strong evidence of net benefit. (High strength of evidence)
Quality improvement programs targeted at eliminating inappropriate EIOL can be effective at reducing cesarean delivery outcomes, particularly for nulliparous women with a low Bishop score. (Moderate strength of evidence)
Limitations None of the findings of this review are based on high quality strength of evidence. There are limited numbers of studies which focus on EIOL of low risk women in the time period between 37 and 41 weeks of gestation. All of the available RCTs are older, and none of the SRs of them control for the effects of parity (whether it is the first birth or a subsequent one for that woman) or cervical status (―readiness‖ for labor, usually expressed as the Bishop score). Although the RCTs use an expectant management control group they are of poor overall quality. Newer observational studies use control groups of women in spontaneous labor which may exaggerate the effects of EIOL. Only three of the observational studies we were able to include accounted for cervical status and parity in their analyses. While recent reports of quality improvement efforts demonstrate success at reducing inappropriate EIOL and cesarean delivery, the applicability of these programs may be limited to settings with resources and leadership to support sustained improvement programs.
3
Background Clinical overview The use of induction of labor (IOL) in the U.S. doubled between 1990 and 2006 (the most recent year for which full national vital statistics birth certificate information is available). In 2006, labor induction occurred in over 22 percent of births. (Martin, 2006) Rates of induction have increased for all ethnic and racial groups since 1990 and are highest among non-Hispanic white women at nearly 27 percent. (Martin, 2009) Rates of labor induction vary substantially from state to state, from a low of 13.2% (California) to a high of 35.2% (Utah). (Corry, 2008; Childbirth Connection, 2009) Induction rates have increased substantially at all gestational ages, including preterm (less than 37 weeks of gestation) and late preterm births (34 through 36 weeks of gestation). (Martin, 2009) Preliminary data for 2007 indicates that the late preterm birth rate was nine percent of all births compared to just over seven percent in 1990, although data on the reasons for these early births are not yet available. (Hamilton, 2009) There is some indication that reported rates of IOL may be underestimated. The ―Listening to Mothers II‖ national survey of a randomly selected population of women who had recently given birth was conducted in 2006 by Childbirth Connection. (Declercq, 2006) Declercq and colleagues found that 41% of women surveyed indicated that their caregiver tried to induce their labor and that 34% these attempts were successful at starting labor. (Declercq, 2006)
The rate of increase in medically indicated IOL has been slower than the overall increase, suggesting that there has been a more rapid rise among elective inductions. (Zhang, 2002; MacDorman, 2002) The increase in the overall use of induction is likely multifactorial, but it is also clear that the use of induction without an identified medical indication is increasing. There appear to have been shifts in the threshold for induction at earlier gestations with both medically indicated and elective IOL. (Engle, 2008) Small changes in thresholds for IOL can dramatically increase the number of women who undergo IOL because both the procedure and its so-called ―soft‖ indications are common. (Moore, 2006; Engle, 2008) Such inductions may also be a driver for increased rates of cesarean delivery. (Moore, 2006; Engle, 2008) The practices and preferences of individual physicians also have an effect on the use of IOL and the subsequent risk of cesarean delivery. (Luthy, 2004) In addition, women’s perceptions of the safety of IOL may not be accurate and may contribute to increased patient demand for the procedure. (Goldenberg, 2009)
Use of induction, particularly among nulliparous women and those without a favorable (ready for labor) cervix, is associated with increased use of health care resources, longer labors and increased use of cesarean delivery. (Grobman, 2007) There is also increased morbidity for infants of mothers electively induced prior to 39 weeks of gestation, including higher rates of conditions requiring admission to a neonatal intensive care unit (NICU). (Clark, 2009) Neonatal mortality associated with all births in the U.S. population from 1989 to 1998 has been shown to be significantly higher for infants of women induced at term or preterm, even after controlling for both sociodemographic and medical risk factors. (MacDorman, 2002) In contrast, IOL for

4
post-term births in this same analysis demonstrated a statistically significant decrease in perinatal mortality. (MacDorman, 2002)
Many U.S. providers plan for induction of labor at between 41 and 42 weeks of gestation because of the increased risk of intrauterine fetal death in pregnancies at and beyond 42 weeks of gestation. The perinatal mortality rate at 42 weeks of gestation (approximately 5/1000) is about double that seen at 40 weeks (approximately 2.5/1000). (ACOG, 2004) Perinatal mortality begins to rise dramatically after 37 weeks of gestation and reaches a peak at over six per 1000 births by 43 weeks. The American College of Obstetricians and Gynecologists (ACOG) recommends that women at 42 weeks of gestation or later who have unfavorable cervical status either undergo labor induction or expectant management with fetal surveillance. They also recommend prompt delivery in women with a favorable cervix by 42 weeks of gestation.
In addition, ACOG states that indications for IOL are not absolute, but should take into account the relative maternal and fetal/neonatal benefits and harms of IOL. (ACOG, 2009) They list the following conditions that may indicate the need for IOL: placental abruption, chorioamnionitis, fetal demise, gestational hypertension, preeclampsia, eclampsia, prelabor rupture of membranes (PROM), postterm pregnancy, certain maternal medical conditions (e.g. diabetes, renal disease, chronic hypertension, etc.) and evidence of fetal compromise (e.g. severe fetal growth restriction, oligohydramnios, etc.). In addition, ACOG’s most recent guideline on induction of labor states that labor may be induced for a variety of logistical situations (e.g. distance from hospital, risk of rapid labor) or psychosocial considerations. However, ACOG does not recommend induction of labor before 39 weeks of gestation in the absence of a definitive obstetric or medical indication. (ACOG, 2009)
This review will examine the evidence on potential benefits and harms of elective induction of labor (EIOL) at term prior to 41 weeks of gestation. We made the assumption that most U.S. clinicians will advise IOL between 41 and 42 weeks of gestation due to concerns about the increased risk of stillbirth. Similarly, most cases of IOL at less than 37 weeks of gestation require a defined medical or obstetric reason to risk the potential harms of prematurity. Induction of labor before 37 weeks may occasionally be elective, but we wanted to focus this review on term pregnancy. Therefore, we focused on EIOL during the narrow one month window of time between 37 and 41weeks of gestation.

5
Key Questions:
1. What are the benefits and harms of elective induction of labor at term (37-41 weeks of gestation) compared with expectant management (awaiting spontaneous labor between 37 and 41 weeks)?
2. Do the benefits and harms of elective induction of labor at term vary by gestational age, or other maternal or fetal characteristics?
3. What are the appropriate medical indications for induction of labor?
4. What are the potential ways to reduce elective inductions of labor?
Methods
Overview A full search of the MED clinical evidence core sources was done to identify systematic reviews (SR), technology assessments (TA), and clinical practice guidelines (CPG) using the terms ―induction of labor/labour,‖ as well as a hand search of some core sources which do not have robust search engines. Searches of core sources were limited to citations which were published since 1999. The core sources searched included: ECRI Institute Information Service, Hayes, Inc., Cochrane Library (Wiley Interscience), UK National Institute for Health and Clinical Excellence (NICE), Blue Cross/Blue Shield Health Technology Assessment (HTA) program, Veterans Administration TA program, BMJ Clinical Evidence Group, the Canadian Agency for Drugs and Technologies in Health (CADTH), Washington State HTA, U.S. Services Preventive Task Force, and the Agency for Health Research and Quality (AHRQ).
A MEDLINE (Ovid) search was conducted to identify SRs and meta-analyses (MA) as well as additional randomized controlled trials (RCTs) and relevant observational studies published after the search dates of included SR/TAs. We also used the MEDLINE search to identify studies relevant to a key question if there was no SR/MA/TA available to address that question. The MEDLINE search used the search terms and combinations of terms listed below in the section on search strategy. The search was limited to publications in English which were not commentaries or editorials and which were published over the past decade. We also reviewed the bibliographies of included studies and retrieved any relevant articles that our core source or MEDLINE searches had not identified.
A search for relevant clinical practice guidelines (CPG) was also conducted, using the following sources: the National Guidelines Clearinghouse, the Institute for Clinical Systems Improvement (ICSI), the Scottish Intercollegiate Guidelines Network (SIGN), the National Institute for Health and Clinical Excellence (NICE), the Veterans Administration/Department of Defense (VA/DOD) guidelines, ACOG, the American Academy of Pediatrics (AAP), the Society of Obstetricians and Gynaecologists of Canada (SOGC), the Royal College of Obstetricians and Gynaecologists (RCOG), the Royal Australian and New Zealand College of Obstetricians and Gynaecologists

6
(RANZOG), the American College of Nurse-Midwives (ACNM), and the Royal College of Midwives (RCM).
Inclusion criteria The PICO for key questions 1 and 2 are as follows:
Patient/population group: Pregnant women at term (37-41 weeks of gestation) with normal, singleton pregnancies
Intervention: Scheduled elective induction of labor prior to spontaneous onset of labor at term (estimated gestational age [EGA] of 37-41 weeks)
Comparators: Expectant management until spontaneous onset of labor unless a medical indication for induction of labor occurs (Assumes that women who are managed expectantly will be induced between 41 and 42 weeks of gestation for the indication of being “post-dates” if not delivered by that point in time.) In the absence of an expectant management comparator, spontaneous labor control groups were eligible for inclusion.
Outcomes: Any measure of maternal/fetal/neonatal mortality and morbidity, including, but not limited to: mode of delivery, maternal use of anesthesia/analgesia, admission to NICU, maternal and neonatal length of stay, costs of alternative care strategies or other clinically important outcomes
Other inclusion criteria for key questions 3 and 4 We included systematic reviews which assessed the quality and strength of evidence in support of various commonly used indications for induction of labor. As per our general protocol, we searched for additional studies on these indications published after the search dates of any included systematic reviews.
We allowed inclusion of reports of quality improvement or guideline implementation from various institutions which had reduced elective induction of labor without a medical indication for key question 4.
Exclusion criteria key questions 1 and 2 Studies were excluded if they:
were not published in English,
were conducted in locations where clinical practice would not be comparable to that found in the U.S.,
included pregnant women with a medical or obstetric indication for induction of labor,
included women with a prior history of cesarean delivery,
did not report on one or more of our outcomes of interest,
and/or we were unable to abstract data relevant to the PICO and key questions.
Studies were also excluded if we were unable to separate out data on the cohort of women between 37 and 41 weeks of gestation without a medical indication for induction

7
of labor from the total group described in the study. We excluded studies which compared methods of induction and did not include a control group of women who were managed expectantly or had spontaneous onset of labor (except for studies which compared elective induction of labor for subpopulations which varied by gestational age or other maternal/fetal characteristics in order to contribute data to key question 2). Commentaries and editorials were also excluded.
Search strategy Core sources were primarily searched using the terms, ―induction of labor‖ and ―induction of labour.‖ Specific terms were used as appropriate to the country of origin and the database being searched. Databases with few items or inadequate search engines were searched by hand.
MEDLINE was searched using a strategy that combined terms for induction of labor, specific methods of induction of labor, outcomes of interest and study designs of interest. The search was limited to studies published in English between 1999 and March 2010. The full MEDLINE search strategy is detailed in Appendix A.
Quality assessment Studies were assessed for their risk of bias using instruments developed by the MED project by modifying instruments in use by the Scottish Intercollegiate Guidelines Network (SIGN) and the National Institute for Health and Clinical Excellence (NICE). Guidelines were appraised for quality using an instrument adapted from one developed by the AGREE (Appraisal of Guidelines Research and Evaluation) Collaboration. All studies and guidelines were assessed by two independent and experienced raters. In cases where there was not agreement about the quality of the study or guideline the disagreement was resolved by conference or the use of a third rater.
Findings
Search results Our MED Project core source search located two systematic reviews and four clinical practice guidelines relevant to this topic. The MEDLINE search retrieved 917 full citations with abstracts in English. After full review of citations and abstracts, we included two systematic reviews, eight observational studies, and four clinical practice guidelines for key questions 1 and 2. We included one SR for key question 3 and an additional SR and one RCT which were found as an update for it. We included four observational studies of quality improvement and guidelines implementation projects to address key question 4. Detailed evidence tables by study design are presented in Appendices B (SRs), C (observational studies), and D (process improvement/guideline implementation studies).

8
Key Question #1: What are the benefits and harms of elective induction of labor at term (37-41 weeks of gestation) compared with expectant management (awaiting spontaneous labor between 37 and 41 weeks)?
Our findings for key question 1 are presented below by study design included in the review.
Systematic reviews and meta-analyses Gülmezoglu, 2006 The Cochrane Review by Gülmezoglu and colleagues examined induction of labor at term compared with an expectant management group awaiting spontaneous labor. The SR included 19 RCTs with 7984 women. Only three of the included RCTs, published between 1975 and 1989, examined populations of women at 37 to 41 weeks of gestation. (Breart, 1982; Cole, 1975; Egarter, 1989) There was not an overall difference in rates of cesarean delivery for women induced at 41 (completed) weeks (RR 0.92; 95% CI 0.76-1.12) or 42 (completed) weeks (RR 0.97; 95% CI 0.72-1.31) of gestation. Women induced at 37 to 40 (completed) weeks of gestation were slightly less likely to have a cesarean birth than those allocated to expectant management (RR 0.58; 95% CI 0.34-0.99). However, women in the induction group at these gestational ages had a significantly higher risk of operative vaginal delivery (OVD) with forceps or vacuum extractor devices (RR 1.71; 95% CI 1.23-2.39). No significant differences were found for perinatal death, stillbirth or neonatal death within a week of birth. None of the RCTs conducted with women at less than 40 completed weeks of gestation reported information on cervical status at the time of IOL with the exception of the Egarter study which required a Bishop score of greater than four for trial entry. The SR did not separate meta-analysis results for these populations and outcomes by parity. However, all three studies included both nulliparous and multiparous women.
Caughey, 2009a Caughey and colleagues conducted a SR of EIOL for the Agency for Healthcare Research and Quality (AHRQ). Although the review was extensive, like Gülmezoglu, it presented few data on outcomes limited to a gestational age group between 37 and 41 weeks. Caughey included three RCTs, two of which (Cole, 1975 and Egarter, 1989) were also included in the Gülmezoglu SR. The third included RCT (Tylleskar, 1979) was not included by Gülmezoglu because over 20% of women had been excluded from both the intervention and control groups prior to analysis. The RCT by Breart included in the Gülmezoglu review was not included by Caughey. Although this study is not mentioned by Caughey as being either specifically included or excluded, we suspect it was not retrieved in their search because it is a non-English publication. Again, only the Egarter study enrolled women with attention to cervical status. All three of these RCTs included mixed parity groups of women and the meta-analysis did not report outcomes by parity.
Caughey and colleagues presented outcomes for cesarean delivery or operative vaginal delivery for EIOL between 37 and 41 weeks based on a meta-analysis of the Cole, Egarter, and Tylleskar studies. They found a nonsignificantly decreased risk of cesarean delivery with EIOL [OR 0.58 (95% CI 0.22-1.50)], based on the Cole and Egarter RCTs. The risk of operative vaginal delivery was nonsignificantly increased

9
with EIOL [OR 1.41 (95% CI 0.83-2.44)], based on all three RCTs. No other outcomes of interest were presented for the 37 to 41 week gestation group by Caughey. There were no results of the meta-analysis presented by parity.
Caughey concluded that while EIOL at 41 weeks of gestation and beyond reduced the risk of cesarean delivery there was insufficient evidence to draw any conclusions about IOL prior to 41 weeks of gestation. (Caughey, 2009a; Caughey, 2009b)
RCTs We found no additional RCTs which met our inclusion criteria for this review.
Observational studies Because of the limited nature of available evidence in the existing SRs we also conducted a systematic search for observational studies published over the past decade that gave information on our outcomes of interest. We included eight observational studies: one non-randomized controlled trial (Amano, 1999), four retrospective cohort studies (Dunne, 2009; Glantz, 2005; Hoffman, 2006; Vahratian, 2005), one retrospective matched cohort study (Cammu, 2002), one prospective cohort study (Seyb, 1999) and one prospective case series (Clark, 2009). The Clark case series study was used exclusively to help answer key question 2. The Caughey SR included five of these studies in their review (Amano, 1999; Cammu, 2002; Glantz, 2005; Hoffman, 2006 Seyb, 1999) and rated all of them as of poor quality because of the lack of an expectant management control group. Caughey excluded the Vahratian study because it did not use prostaglandin for cervical ripening. However, they included the Hoffman study which was conducted in the same institution during the same time period and also used the Foley bulb exclusively for ripening. The Caughey review did not include the Dunne study as it was published after the end of their search dates. For detailed information about these studies please see the evidence table in Appendix C.
Five of the eight observational studies we included were conducted in the U.S. and the others were done in Japan, Canada and Belgium. Most of the studies were conducted between the mid-1990s and the early 2000s. One study did not report dates of conduct. (Amano, 1999) Sample sizes in the EIOL groups ranged from 63 to 7683 with a total of 10,542 women included in the induction groups. Nearly 73% of the electively induced women came from the matched retrospective cohort study conducted in Belgium. (Cammu, 2002) All studies used a spontaneous labor control group. The rated quality of these studies ranged from poor to fair with the exception of the Clark study which was rated as good and which we used exclusively for key question 2. We rated as fair the three studies which controlled for the key confounders of parity and cervical status at admission. (Hoffman, 2006; Seyb, 1999; Vahratian, 2005) Although these three observational studies used a spontaneous labor control group rather than an expectant management control group we thought that their inclusion of very low-risk populations, limitation of gestational age to less than 41 weeks and control for key confounders warranted a rating of fair.
Four of the seven studies did not include information about cervical status at admission or the start of induction. Six studies reported that cervical ripening was used for at least some women, but only three studies conducted analyses of key outcomes by whether

10
cervical ripening had occurred. Studies reported using a variety of methods of cervical ripening, including laminaria, extraamniotic saline infusion, and Foley bulb. Two of the six studies mentioning the use of preinduction cervical ripening did not specify the type and one study did not report whether it was used or not. Only one study specifically mentioned the use of misoprostol or prostaglandins as ripening or induction agents. (Dunne, 2009) Two studies did not report what methods of induction were used. A variety of methods were reported among the other studies, including oxytocin with or without artificial rupture of membranes (AROM), and prostaglandins.
Cesarean delivery was the only outcome reported by all studies. In general, the rates of cesarean birth were much lower than current baseline rates observed in the U.S. Other outcomes reported by a majority of studies included operative vaginal delivery and use of epidural anesthesia. Two studies reported on postpartum hemorrhage. Three studies reported infant birth weight and two reported proportion of infants born macrosomic (birth weight >4 kg). Three studies reported on neonatal admission to a NICU. Two studies reported Apgar scores at five minutes of life. Two studies reported rates of meconium stained amniotic fluid. However, no studies reported any cases of meconium aspiration syndrome. One study reported one neonatal death in the spontaneous labor control group. (Dunne, 2009) No maternal deaths were reported. Length of labor was reported by four studies. Two studies reported additional measures of health services utilization such as lengths of stay and costs.
Maternal, neonatal and health services outcomes are reported in the sections below. A detailed table of these observational studies and their reported outcomes is presented in Appendix C.
Maternal outcomes
Mode of delivery Cesarean delivery is widely considered a primary outcome of interest in examining EIOL. We have presented this outcome in Table 1 below.
Five of the six studies of nulliparous women found a statistically significant increased risk of cesarean delivery among women undergoing EIOL. The Amano study did not find a significant difference in the cesarean rates between groups. (Amano, 1999) The Vahratian study divided women based on whether they had undergone preinduction cervical ripening and found that an increased risk was only present for the group which had cervical ripening. (Vahratian, 2005) None of the other studies of nulliparous women made this distinction regarding preinduction cervical ripening. We calculated the number needed to harm (NNH) when possible and presented it below if a statistically significant difference in the risk of cesarean delivery was present. The NNH represents the number of women who would need to undergo EIOL for there to be an additional cesarean delivery among that group compared to women in spontaneous labor. The NNH ranged from 10 to 29.
Two studies reported the risk of cesarean birth among multiparous women only. Multiparous women who have not had a prior cesarean delivery have very high rates of vaginal delivery in subsequent pregnancies. Hoffman and colleagues found an almost

11
doubled risk of cesarean delivery among induced women who had not had preinduction cervical ripening. (Hoffman, 2006) Glantz did not find a statistically increased risk of cesarean delivery among multiparas who had EIOL. (Glantz, 2005)
Information on the use of operative vaginal delivery is presented, when available, in the comments column of Table 1 below. Since cesarean and OVD are considered to be possible alternative methods to effect delivery when there is dystocia in the second stage of labor (the pushing phase of labor, after full cervical dilation) it is important to confirm that lower cesarean rates in an EIOL or SL group are not simply accounted for with higher rates of OVD. Higher rates of OVD with EIOL were seen in four studies. The difference was statistically significant in two studies (Amano, 1990; Hoffman, 2006), not different in one study (Cammu, 2002) and in one study an increased rate among the EIOL groups was not presented with a statistical test of difference (Vahratian, 2005).
Epidural anesthesia Use of epidural anesthesia increased with EIOL compared to SL in all six of the observational studies which reported the outcome. (Amano, 1999; Cammu, 2002; Glantz, 2005; Hoffman, 2006; Seyb, 1999; Vahratian, 2005) Some studies did not test the statistical difference in epidural use for the EIOL groups versus the SL groups. Cammu reported a 38% increased risk of epidural use among nulliparas with EIOL. (Cammu, 2002) Glantz found a 66% increased odds of epidural use with EIOL in a mixed parity group of women undergoing EIOL. (Glantz, 2005) Amano and Hoffman each reported proportions of women using epidural anesthesia in both groups and we used these numbers to calculate a NNH. (Amano, 1999; Hoffman, 2006) The NNH ranged from 3 to 7, depending on the EIOL and comparison groups used. It was not possible to calculate confidence limits for these NNH estimates.
Postpartum hemorrhage Only two studies reported postpartum hemorrhage (PPH) outcomes. The amount of postpartum blood loss (Amano, 1999) and the rate of PPH (blood loss in excess of 500 mL) and severe PPH (blood loss in excess of 1000 mL) (Dunne, 2009) were both slightly elevated in the EIOL group compared to the SL group. However, neither study reported tests of statistical significance of the difference. The differences represented by mean volumes of blood lost are not likely to be clinically significant. No study reported more patient-centered outcomes such as postpartum anemia requiring transfusion.
Other maternal outcomes Dunne reported a variety of other maternal outcomes, including maternal fever and perineal tears. (Dunne, 2009) The incidence of maternal fever was similar between the groups (4.9% versus 3.6%) with no test of statistical difference reported. There was a statistically significant lower risk of perineal tearing in the EIOL group compared with the SL group (37.8% versus 45.7%) and a correspondingly higher incidence of intact perineum (29.6% versus 23.4%) in the EIOL group. Dunne also reported the incidence of a composite measure of postpartum complications (any of the following: hematoma, wound dehiscence, anemia, endometritis, urinary tract infection, wound infection, septicemia or other complications) and found a significantly higher overall risk of complications among the EIOL group (27% versus 18.2%).

12
Table 1. Cesarean Delivery after EIOL Compared with SL
Citation EIOL
Group
SL Control Group
p-value
OR or RR (95% CI) and NNH (if applicable)
Comments
Nulliparous women only
Amano, 1999 6.4% 5.6% p=ns -- Vacuum assisted deliveries significantly higher among the EIOL group (53.4% vs. 33.3%.
Cammu, 2002 9.9% 6.5% -- RR 1.52 (1.37-1.70) NNH=29
CS in first stage and for fetal distress both significantly increased, but not for second stage CS. No significant difference in OVD.
Dunne, 2009 13.3% 6.6% p<0.001 OR 2.72 (1.74-4.28) NNH=15
Glantz, 2005 (data on nulliparas only)
NR NR -- adjOR 1.90 (1.39-2.59) NNH not calculable
No data on OVD by parity presented. No overall difference in OVD for nulliparas and multiparas combined.
Seyb, 1999 17.5% 7.8% -- adjOR 1.89 (1.12-3.18) NNH=10
No data on OVD presented.
Vahratian, 2005 EIOL-N 16.8%
EIOL-R 41.3%
13.9% -- EIOL-N adjRR 1.04 (0.79-1.37) EIOL-R adjRR 2.41 (1.95-2.98) NNH=4
EIOL-N and –R are groups without and with cervical ripening performed prior to induction. No data on OVD presented.
13
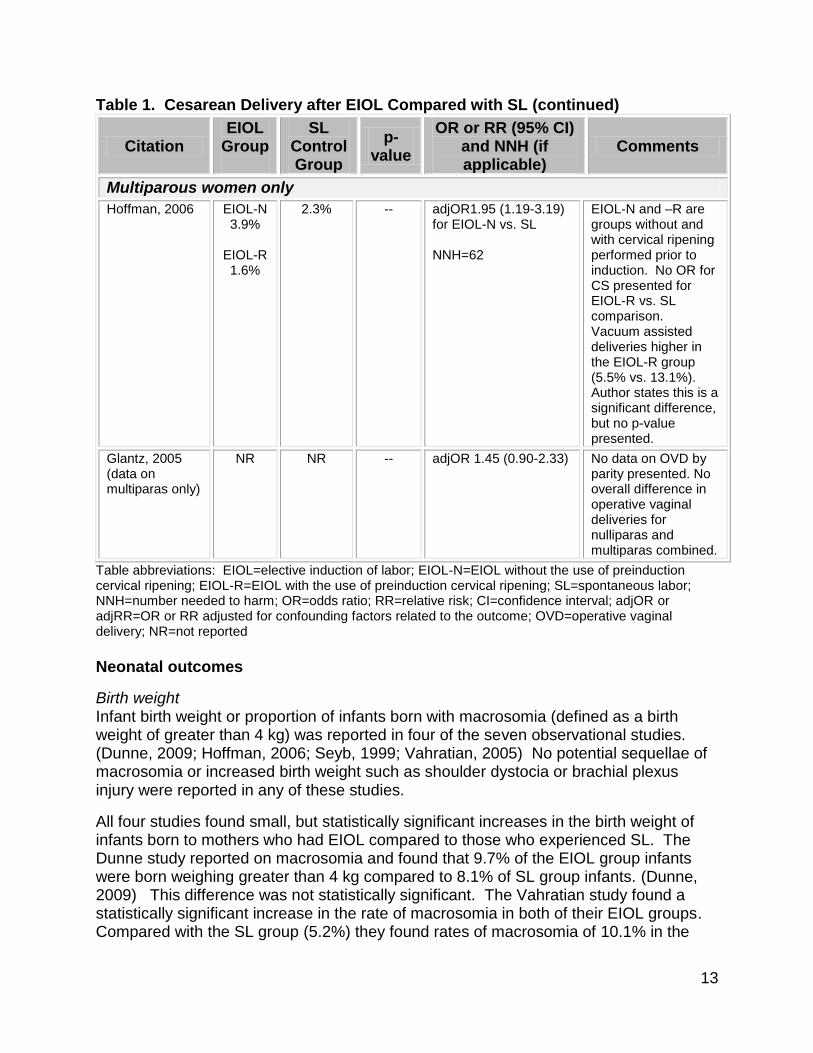
Table 1. Cesarean Delivery after EIOL Compared with SL (continued)
Citation EIOL
Group
SL Control Group
p-value
OR or RR (95% CI) and NNH (if applicable)
Comments
Multiparous women only
Hoffman, 2006 EIOL-N 3.9%
EIOL-R 1.6%
2.3% -- adjOR1.95 (1.19-3.19) for EIOL-N vs. SL NNH=62
EIOL-N and –R are groups without and with cervical ripening performed prior to induction. No OR for CS presented for EIOL-R vs. SL comparison. Vacuum assisted deliveries higher in the EIOL-R group (5.5% vs. 13.1%). Author states this is a significant difference, but no p-value presented.
Glantz, 2005 (data on multiparas only)
NR NR -- adjOR 1.45 (0.90-2.33) No data on OVD by parity presented. No overall difference in operative vaginal deliveries for nulliparas and multiparas combined.
Table abbreviations: EIOL=elective induction of labor; EIOL-N=EIOL without the use of preinduction cervical ripening; EIOL-R=EIOL with the use of preinduction cervical ripening; SL=spontaneous labor; NNH=number needed to harm; OR=odds ratio; RR=relative risk; CI=confidence interval; adjOR or adjRR=OR or RR adjusted for confounding factors related to the outcome; OVD=operative vaginal delivery; NR=not reported
Neonatal outcomes
Birth weight Infant birth weight or proportion of infants born with macrosomia (defined as a birth weight of greater than 4 kg) was reported in four of the seven observational studies. (Dunne, 2009; Hoffman, 2006; Seyb, 1999; Vahratian, 2005) No potential sequellae of macrosomia or increased birth weight such as shoulder dystocia or brachial plexus injury were reported in any of these studies.
All four studies found small, but statistically significant increases in the birth weight of infants born to mothers who had EIOL compared to those who experienced SL. The Dunne study reported on macrosomia and found that 9.7% of the EIOL group infants were born weighing greater than 4 kg compared to 8.1% of SL group infants. (Dunne, 2009) This difference was not statistically significant. The Vahratian study found a statistically significant increase in the rate of macrosomia in both of their EIOL groups. Compared with the SL group (5.2%) they found rates of macrosomia of 10.1% in the

14
EIOL group without cervical ripening and 14.0% in the EIOL with cervical ripening. These findings are somewhat counterintuitive given that EIOL occurred at slightly later gestational ages in all of these studies. Longer gestation generally correlates with higher birth weight. This raises the question about whether the EIOL groups in these studies included some women induced for ―big baby‖ and that this soft indication was not identifiable among these retrospective analyses.
Admission to Neonatal Intensive Care Unit (NICU) Admission to a NICU is perhaps the most consistently reported patient centered outcome for neonates among these studies. It is an indicator of an infant whose condition at birth is not optimal. However, NICU care also separates infants from their mothers and can impede breastfeeding initiation and early bonding. Infants who are admitted to a NICU often have longer total hospital lengths of stay and incur higher costs compared to infants who are able to stay with their mothers. Four of our included observational studies reported on NICU admission. Three of these found higher rates of NICU use with EIOL (Cammu, 2002; Dunne, 2009; Glantz, 2005) and one found a higher rate among the SL group (Amano, 1999). Cammu reported that 10.7% of the EIOL group was admitted to the NICU compared with 9.4% of the SL group. (Cammu, 2002) The difference was statistically significant with an estimated NNH of 77. Glantz reported a 27% increased odds of NICU admission among the EIOL group, but this difference was not statistically significant. (Glantz, 2005) Dunne reported that 5.8% of the NICU group and 4.7% of the SL group were admitted to the NICU, although the difference was not statistically significant. (Dunne, 2009) The Amano study found no infants admitted to the NICU in the EIOL group compared with 2.8% of the SL group.
Meconium stained amniotic fluid Fetal meconium passage in utero becomes more common with increasing gestational age. Meconium passage can also be a sign of fetal acidemia and has therefore traditionally been a sign of concern for clinicians. Fetal acidemia can induce gasping both in utero and immediately after birth, resulting in aspiration of meconium into the lungs. In and of itself meconium stained amniotic fluid (MSAF) is not problematic. However, term neonates who both pass meconium in utero and who are acidemic can develop meconium aspiration syndrome (MAS), a type of pneumonitis which can require prolonged NICU care. None of the studies reported MAS as an outcome. Amano and Glantz reported that the rate of MSAF was significantly lower in the EIOL group (Amano, 1999; Glantz, 2005) Dunne also found a higher proportion of neonates with MSAF in the SL group, but the difference was not statistically significant. (Dunne, 2009)
Other neonatal outcomes An Apgar score of less than seven at five minutes after birth is abnormal and a higher proportion of infants with low five minute Apgar scores require more extensive resuscitation efforts and subsequent NICU care. This outcome was reported in the Glantz and Dunne studies. (Dunne, 2009; Glantz, 2005) Both found decreased incidence of low five minute Apgar scores in the EIOL group, but in neither case was the difference statistically significant. Amano found a slightly lower incidence of decreased umbilical cord blood pH in the EIOL group, although the difference was also not statistically significant. (Amano, 1999)

15
Dunne reported on a variety of other neonatal outcomes, including breastfeeding initiation, use of positive pressure ventilation (PPV), and neonatal death. (Dunne, 2009) Similarly high proportions of infants initiated breastfeeding (92.5% vs. 92.2%) in this study. Only 0.04% of infants required PPV in the EIOL group compared to 2.5% among the SL group. There was one neonatal death in the SL group. None of these differences were statistically significant.
Health services outcomes
Length of labor Three studies reported the length of both the first and second stages of labor. (Amano, 1999; Hoffman, 2006; Vahratian, 2005) One study reported the total length of labor. (Dunne, 2009) One other study reported the total time a woman spent on the labor and delivery unit. (Seyb, 1999) The length of the first stage of labor was found to be statistically significantly lower among the EIOL group compared with the SL group. The difference ranged from 62 to 225 minutes less, with the lowest difference found among multiparous women in the Hoffman study. There were small and not statistically different lengths of second stage labor reported by these three studies. Dunne reported that the total length of labor was 7.8 hours in the EIOL group compared to 9.8 hours the SL group and that this was statistically different. (Dunne, 2009) However, Seyb found that the total time on the labor and delivery unit was increased among the EIOL group (11.6 hours versus 8.7 hours), although no test of statistical difference was done. (Seyb, 1999) It is possible that while the active phase of induced first stage labor is shorter, it may take more total time in a labor and delivery unit to achieve active labor. The other studies do not provide enough information to test this assumption.
Other health services outcomes The Seyb study also found a 17.4% increased costs associated with the EIOL, although no absolute figures were presented in their paper. (Seyb, 1999) Glantz reported that there was an increase of total length of stay of 0.34 days in the EIOL group, although again no absolute differences were reported. (Glantz, 2005) It is reasonable to assume that the length of stay for women who have had a cesarean delivery is higher than for an uncomplicated vaginal delivery. To the extent that EIOL is associated with a higher risk of cesarean delivery compared to SL it will also be linked to longer total average lengths of stay for both women and their newborns in the absence of other complicating factors.
Overall summary of evidence Good quality SRs of a small number of RCTs suggest a decrease in the risk of cesarean delivery with EIOL between 37 and 41 weeks of gestation, but a corresponding increase in OVD risk. There is consistent evidence from poor to fair quality observational studies that cesarean delivery is increased among nulliparous women who have EIOL compared to those who are admitted with SL. There is evidence of some increased risk of OVD with EIOL among these observational studies, but most studies did not show an effect or did not report the outcome. Use of epidural anesthesia is consistently increased among observational studies of EIOL. Based on few studies, postpartum hemorrhage, and fever in labor do not appear to be increased with EIOL. In addition, EIOL may result in fewer perineal lacerations and more women

16
who have an intact perineum after birth. However, one study suggests a higher risk of all postpartum complications added together with EIOL. Overall there are few data to examine outcomes other than mode of delivery and use of epidural anesthesia.
None of the relevant SRs reported neonatal or health services outcomes of interest. The bulk of evidence indicates increased risk of neonatal admission to the NICU after EIOL. However, the outcome is relatively uncommon among term infants. Obstetric providers and the women they care for may not fully appreciate the risks of NICU admission for infants. (Goldenberg, 2009) The observational studies which reported the outcome consistently found small increases in birth weight among infants of women who experienced EIOL. This counterintuitive finding may represent unmeasured confounding among these studies. However, there is no data on the potential sequellae of higher birth weight or macrosomia. While MSAF is less common among infants of mothers who undergo EIOL, there is no data about the actual outcome of concern, MAS.
There is some suggestion that total patient time on labor and delivery may be longer for women who have EIOL, but that their time spent in active labor may be shorter. While most studies did not report on health services utilization outcomes, those that did found increased costs and total hospital length of stay with EIOL.
Strength and limitations of the evidence The primary limitation of the body of evidence from observational studies is the lack of a control group with expectant management rather than spontaneous labor. Women considering EIOL do not have the choice between EIOL and SL. They only have the choice of inducing labor now versus waiting to see if labor ensues on its own. If the woman opts to await labor she will have one of three possible outcomes. She will go into spontaneous labor, she will develop an obstetric or medical indication for induction, or she may decide while awaiting labor that she wants to have an EIOL. The evidence presented for this key question can really only give answers about the first situation where a woman does go into spontaneous labor rather than having an EIOL. However, given that the risks of abnormal labor, including cesarean delivery, may increase if a woman develops an indication for induction while awaiting SL these observational studies likely overestimate the risk of cesarean delivery with EIOL. No studies using a SL control group were rated as good because of this bias and their limited applicability to the actual decision faced by women and their caregivers.
Only two studies accounted for the use of preinduction cervical ripening in their analyses. Given that a low Bishop score is a strong predictor of cesarean delivery, accounting for this factor is essential. The specific methods used for both preinduction cervical ripening and induction were often not specified in these studies. It may be that the use of oxytocin for IOL is so common, nearly universal, that some authors did not feel the need to specify its use. However, in one non-U.S. study prostaglandin F2-alpha is specifically mentioned as an induction agent, raising the question of whether drugs other than oxytocin were in use in other settings as well. Many of the preinduction cervical ripening methods mentioned are not currently in common use in the U.S. which may also limit applicability. Similarly, misoprostol as a preinduction cervical ripening agent was mentioned specifically in only one study. It has become perhaps the most

17
commonly used medication for this indication in the U.S., also raising questions about the applicability of this group of studies to current U.S. practice.
Key Question #2: Do the benefits and harms of elective induction of labor at term vary by gestational age, or other maternal or fetal characteristics?
Our findings for key question 2 are presented below by study design included in this review.
Systematic reviews and meta-analyses None of the SRs provided information on subgroups of women between 37 and 41 weeks of gestation, broken down by gestational age or other key maternal or fetal characteristics. The Caughey AHRQ review reported that nulliparity, low Bishop score, higher maternal body mass index (BMI), and increasing gestational age were associated with a higher risk of cesarean delivery. (Caughey, 2009a, 2009b) These findings were based on studies which included women outside of our 37 to 41 week gestational age window. However, as general principles these factors are likely to influence the risk of cesarean delivery. In their analysis, nulliparous women had a 3.7 times increased risk of cesarean delivery. (Caughey, 2009a, 2009b) Caughey also found that while 12 different observational studies dichotomized or categorized the Bishop score differently and included different patient populations they all reported an inverse relationship between Bishop score and the risk of cesarean delivery. (Caughey, 2009a, 2009b)
RCTs
We found no additional RCTs which met our inclusion criteria for this review.
Observational studies Parity Five of the cohort studies described for KQ1 above were conducted exclusively among nulliparous or multiparous women. Only the Glantz study included a mixed parity group (42.5% nulliparas) and the Hoffman study included multiparous women only. Amano, Cammu, Dunne, Glantz, Seyb, and Vahratian found that the risk of cesarean delivery was significantly elevated among nulliparous women. Glantz did not find a significant increase among multiparous women, but the Hoffman study did find a nearly doubled risk of cesarean delivery among multiparas after controlling for age, race and birth weight.
Cervical status As labor approaches, the cervix begins to soften, shorten and dilate. One common measure of cervical readiness for labor is the Bishop score. The more ―ready‖ the cervix is for labor the higher the Bishop score. The Bishop score can range from zero to 13 points. Clinicians commonly use cervical ripening techniques to soften and open the cervix prior to induction of labor with oxytocin if there is a low Bishop score.
The clinical cutoff point for a ―low‖ Bishop score can vary among clinicians and institutions. Guidelines for EIOL (see Appendix D for studies of guideline and quality improvement program implementation) commonly do not allow for cervical ripening if

18
EIOL is contemplated. They require that a woman have a ―ripe‖ cervix prior to IOL. Although the exact Bishop score varies, all three of the U.S. institutions detailed in Appendix D require a Bishop score of at least six. (Fisch, 2009; Oshiro, 2009; IHC, 2007a; IHC, 2007b; Reisner, 2009) Two of them set a different threshold for nulliparous and multiparous women, ranging from six to eight for mulliparas and eight to ten for nulliparas. (Fisch, 2009; Oshiro, 2009; IHC, 2007a; IHC, 2007b)
Table 2 below provides details about the calculation of a Bishop score. A cervical exam and assessment of fetal station (relationship of the leading point of the fetus to a point in the maternal pelvis at the level of the ischial tuberosities) is done. The number of points for each criterion examined are added together for the total score. For example, a woman with cervical exam findings of one centimeter of dilation, 50% effacement, a medium consistency, posterior position and a fetus at three centimeters above the ischial tuberosities would have a Bishop score of three. Another woman with her fetus at the level of the ischial tuberosities, and having a cervix dilated three centimeters, 75% effaced, anterior position and of soft consistency would have a Bishop score of 10.
Table 2. Bishop Score Score (points)
Criterion 0 1 2 3
Dilation (cm) 0 1-2 3-4 5-6
Effacement (%) 0-39 40-59 60-79 >80
Fetal Descent -3 -2 -1, 0 +1, +2
Cervix Consistency
Firm Medium Soft Not applicable
Cervix Position Posterior Middle Anterior Not applicable
Adapted from Obstetrics & Gynecology, 24, 266-8. (1964).
In our review only the Hoffman and Vahratian studies reported the risk of cesarean delivery by whether or not cervical ripening (exclusively with a Foley bulb in these studies) was used. (Hoffman, 2006; Vahratian, 2007) These studies were conducted in the same institution, over the same period of time. Hoffman reported outcomes for multiparous women and Vahratian reported outcomes for nulliparous women. Neither study reports the exact threshold when cervical ripening was employed, but state that it was generally used if the Bishop score was less than six. The number of multiparous women who had cervical ripening was small and so only the comparison of EIOL without ripening was calculated. The absolute proportion of multiparous women who delivered by cesarean section in this study was lowest among multiparas who had cervical ripening (1.6%) and highest among those who did not have cervical ripening (3.9%). It was intermediate for multiparas in spontaneous labor (2.3%). Hoffman reported that the risk of cesarean delivery was nearly doubled for multiparous women who did not have cervical ripening compared to women in spontaneous labor. However, among nulliparous women Vahratian found an increased risk of cesarean delivery only among those who had cervical ripening [OR 2.41 (95% CI 1.95-2.98]. The Seyb study examined the question of whether cervical dilation or effacement at the time of induction increases the risk of cesarean delivery among nulliparous women. (Seyb, 1999) They found a statistically significant decrease in cesarean delivery with increasing cervical effacement, but not with increasing cervical dilation. (Seyb, 1999)

19
Gestational age We also found one large, good quality prospective case series which compared the outcomes of EIOL at 37, 38 and 39 to 41 weeks of gestation. (Clark, 2009) Although this study did not include either an expectant management or spontaneous labor control group, it does provide useful information about the relative proportion of infants who experience adverse outcomes based on gestational age at induction. This study was conducted in 27 hospitals owned by the Hospital Corporation of America in 14 states and included a total of 2811 multiparous and nulliparous women (112 at 37 weeks, 678 at 38 weeks and 2004 at 39 to 41 weeks) who had elective induction. The primary outcome was admission to a NICU. At 37, 38, and 39 to 41 weeks of gestation the proportion of infants admitted to the NICU were, respectively, 15.2%, 7.0%, and 6.0%. Both the 37 and 38 week groups were statistically different compared to the 39 to 41 week group.
Overall summary of evidence The risk of cesarean delivery after EIOL is likely to be highest when nulliparous women with a low Bishop score are induced. Elective induction at less than 39 weeks of gestation increases the risk of admission to the NICU for infants.
Strength and limitations of the evidence Data regarding the effects of cervical status at the time of induction are limited among these studies, but available evidence comports with the findings of SRs with larger populations undergoing IOL of all types. Similarly, women who have had a prior vaginal birth are less likely to require cesarean delivery under any circumstance. However, we are unable to determine whether they are at any overall increased risk with EIOL compared to multiparous women who are managed expectantly. There is increasing recognition of the risk of early term delivery for infants and the findings of this review provide good evidence to affirm the increased risk of NICU admission for these infants compared to those whose mothers are at least 39 weeks at the time of EIOL.
Key Question #3: What are the appropriate medical indications for induction of labor?
Our findings for key question 3 are presented below by type of study.
Systematic review We located one systematic ―best-evidence‖ review by Mozurkewich and colleagues assessing the quality and strength of evidence for commonly cited medical indications for IOL. (Mozurkewich, 2009) This review included a comprehensive search using MEDLINE, the Cochrane Library and several other databases covering articles published between 1980 and April 2008. The authors used the ―best evidence‖ review methodology used by BMJ Clinical Evidence and rated the quality of studies using tools developed by the Scottish National Guidelines Network (SIGN). They also graded the strength of recommendations resulting from each evidence base using GRADE methodology. The results of this review for each commonly cited indication for induction of labor are summarized in Table 3 below.

20
Mozurkewich and colleagues found high quality evidence supporting strong recommendations for only two indications, post-term pregnancy and pre-labor rupture of membranes (PROM) at term.
Additional studies We supplemented this SR with a MEDLINE search going forward from the search dates of the Mozurkewich study to March 2010 and found two additional studies. The first was another SR on IOL for post-dates pregnancy. (Wennerholm, 2009) This SR was restricted to RCTs of IOL vs. EM at 41 weeks of gestation or later and included 13 studies. They also included only RCTs performed after 1980 when ultrasound dating of pregnancy was introduced. Wennerholm found that IOL at 41 weeks of gestation was associated with a lower, but statistically not significant, risk for perinatal death (RR 0.33, 95% CI 0.10-1.09). However, none of the studies were adequately powered to detect a rare outcome such as perinatal death. There were a total of nine deaths among 6, 617 newborns and four cases of intrauterine fetal demise among 6, 218 pregnancies at 41 and 42 weeks of gestation.
Like the Cochrane Review by Gülmezoglu and colleagues, this review found a lower risk of cesarean delivery in the IOL group (RR 0.87, 95% CI 0.80-0.96). However, in sensitivity analysis they found that this result was influenced by the largest trial in the SR in which the IOL and EM groups were managed differently. No prostaglandin was used in the EM group. When this one RCT was excluded for the sensitivity analysis there was no longer a statistically significant difference in risk of cesarean delivery (RR 0.88, 95% CI 0.77-1.01). The Wennerholm SR also found a lower risk of meconium aspiration syndrome with IOL at term (RR 0.43, 95% CI 0.23-0.79) as did the Gülmezoglu SR.
The second additional article we identified was a large non-blinded RCT of IOL versus EM for gestational hypertension or mild preeclampsia. (Koopmans, 2009) Given that the Mozurkewich SR did not locate any RCTs for this condition this study adds considerably to the evidence base for this indication. This RCT enrolled 756 women at 36 to 41 weeks of gestation with either gestational hypertension or mild preeclampsia to IOL or EM. Gestational hypertension was defined as a diastolic blood pressure of 95 mm Hg on two occasions at least six hours apart and mild preeclampsia was defined as a diastolic blood pressure of at least 90 mm Hg on two occasions at least six hours apart accompanied by significant proteinuria. Women with severe hypertension or severe preeclampsia were excluded from the trial.
The primary outcome was a composite measure of poor maternal outcome which included mortality, morbidity (such as eclampsia, pulmonary edema or placental abruption), progression to more severe disease and postpartum hemorrhage. The IOL group had a lower risk of this composite outcome (RR 0.71, 95% CI 0.59-0.86).

21
Table 3. Strength of Evidence and Grade of Recommendation Supporting Commonly Cited Indications for Induction of Labor
Indication
Overall Strength
of Evidence
Benefits/Harms Grade of
Recommendation
Evidence Summary and Comments
Post-term pregnancy High Net benefits Strong There are 2 large SRs of 12-16 RCTs each. Together they find that IOL beyond 41 wks. May reduce perinatal mortality and meconium aspiration syndrome. IOL not found to increase cesarean delivery. (See also additional SR [Wennerholm, 2009] located in updating search and described in text below.)
PROM (term) High Net benefits Strong There are 3 SRs containing 6-23 RCTs each. Expedited IOL (2 to 12 hours after rupture of membranes) reduces maternal infections and neonatal admission to NICU.
PPROM (preterm) Moderate Uncertain tradeoffs
Weak A single SR with 4 small RCTs found that expedited IOL reduces chorioamnionitis. RCTs are older and did not involve interventions that are now standard (steroids for lung maturity and antibiotics for latency).
Suspected macrosomia
Moderate Net harm Weak (against
IOL)
There were 2 SRs including the same 2 RCTs each. IOL does not improve outcomes for neonates and may increase cesarean deliveries.
Twin gestation Low Uncertain tradeoffs
Weak A single RCT of IOL at 37 wks for twins and it is underpowered to detect benefits and harms.

22
Table 3. Strength of Evidence and Grade of Recommendation Supporting Commonly Cited Indications for Induction of Labor (continued)
Indication
Overall Strength
of Evidence
Benefits/Harms Grade of
Recommendation
Evidence Summary and Comments
Oligohydramnios Low Uncertain tradeoffs
Weak A single small RCT on IOL for low amniotic fluid levels at 41 wks. vs. EM until 42 wks.
Gestational diabetes (treated with insulin)
Moderate Uncertain tradeoffs
Weak A single RCT found that IOL at 38 wks reduces neonatal macrosomia (NNT=8), but there were no statistically significant differences in patient-oriented outcomes such as shoulder dystocia or brachial plexus injury.
Intrahepatic cholestasis of pregnancy
Very low Uncertain tradeoffs
Weak One case-control study at 38 wks found that IOL may reduce intrauterine fetal death (NNT=63), but an RCT is needed to confirm these findings.
Cardiac disease Very low Uncertain tradeoffs
Weak There are 2 case series and 1 poorly done case-control study. None provide sufficient evidence for benefit or harm of IOL.
Mild preeclampsia No evidence
--- No recommend
ation
No studies of IOL for women with gestational hypertension or mild preeclampsia were found. (See additional RCT [Koopmans, 2009] located in updating search and described below in text.)
Severe preeclampsia (preterm, IOL vs. EM)
Moderate Uncertain tradeoffs
Weak (against
IOL)
EM for preterm (28-34 wks. in one RCT and 28-32 wks. in the other) severe preeclampsia improves neonatal outcomes, based on 2 small RCTs.

23
Table 3. Strength of Evidence and Grade of Recommendation Supporting Commonly Cited Indications for Induction of Labor (continued)
(Results from Induction of Labor Indications Best-Evidence Review (Mozurkewich, 2009)) Progression of disease based on development of higher blood pressure was the most common reason that a woman was classified as having met criteria for the primary outcome. Women in the IOL group were also less likely to received antihypertensive or anticonvulsant drugs. There was not a significant difference in the risk of cesarean delivery (RR 0.75, 95% CI 0.55-1.04). Infants were not found to have a higher risk of low Apgar scores, low umbilical cord pH or admission to the NICU.
Several subgroup analyses were conducted. The risk of developing the poor maternal outcome composite measure was found to be independently statistically significant only among women at 40 to 41 weeks of gestation, nulliparas, those with a diagnosis of
Indication
Overall Strength
of Evidence
Benefits/Harms Grade of
Recommendation
Evidence Summary and Comments
Severe preeclampsia (preterm, IOL vs. Cesarean)
Very low Uncertain tradeoffs
Weak 7 case series found that IOL at 30-34 wks was commonly associated with a cesarean delivery, but that the IOL may help to improve fetal lung maturity compared to cesarean without labor.
Eclampsia (IOL vs. Cesarean)
Low Uncertain tradeoffs
Weak 1 small RCT found that IOL reduced maternal LOS, but was underpowered to detect neonatal outcomes and was conducted in a developing country setting.
Suspected IUGR/SGA (preterm)
High Tradeoffs Weak One large RCT found that IOL does not reduce perinatal mortality or longer term disability. Cesarean delivery is reduced with EM.
Suspected IUGR/SGA (term)
Low Uncertain tradeoffs
Weak The 1 RCT was underpowered to detect harms or benefits.
Gastroschisis Low Uncertain tradeoffs
Weak The 1 RCT was underpowered to detect most outcomes of interest.

24
preeclampsia, and women with a lower Bishop score (or other measures of cervical status indicating less readiness for labor).
Overall summary of evidence Many commonly cited medical indications for IOL are not well supported by evidence. The only two indications with strong evidence and net benefit for IOL are gestational age beyond 41 weeks and prelabor rupture of membranes at term. There is moderate quality evidence against inducing labor for suspected macrosomia because it does not improve fetal outcomes and increases the risk of cesarean delivery for the mother. There is also moderate quality evidence on IOL for gestational diabetes if insulin treatment has been required. While IOL reduces macrosomia, there is not currently evidence to support that it improves more patient-centered outcomes. It is not certain how the single RCT in this area might relate to the growing practice of treating uncontrolled gestational diabetes with oral medications rather than insulin. Suspected intrauterine growth restriction or small for gestational age status (<=5th percentile) for preterm women does not appear to improve perinatal outcomes while increasing cesarean delivery rates.
Expectant management may improve neonatal outcomes for severe preeclampsia before 34 weeks of gestation, based on a moderate strength of evidence. The Mozurkewich SR found no evidence about IOL for mild preeclampsia, a commonly used indication for induction of labor at term in the U.S. The RCT by Koopmans of IOL versus EM for women with gestational hypertension or mild preeclampsia at 36 weeks of gestation or greater has been criticized for use of surrogate and composite outcome measures. The most common reason for a woman to be classified as having the outcome of interest was development of a higher blood pressure. Critics have argued that women with gestational hypertension or mild preeclampsia, especially those who are not yet at term, can simply be induced if disease progresses. In post hoc sensitivity analyses done by this group of authors it appears that IOL may only be useful for women over 40 weeks of gestation, those with a firm diagnosis of preeclampsia, and women who are less likely to go into spontaneous labor (nulliparas and women with a low Bishop score).
Strength and limitations of the evidence Only the quality of evidence to support IOL for postterm pregnancy and prelabor rupture of membranes, and preterm suspected IUGT is high. Moderate evidence is available to guide treatment when there is preterm prelabor rupture of membranes, suspected macrosomia, gestational diabetes requiring insulin, and severe preeclampsia. The quality of evidence to support IOL for multiple gestation, oligohydramnios, cholestasis of pregnancy, maternal cardiac disease, eclampsia, suspected IUGR at term and fetal anomalies like gastroschisis is low or very low. Some of these conditions are sufficiently uncommon that mounting an RCT of women with the condition is very difficult. It is also difficult to attain adequate sample sizes in any perinatal RCT to study rare outcomes such as perinatal death. Nearly all of these types of RCTs study immediate outcome measures and have not followed women and their infants for long-term effects of interventions. Many of these indications are supported by various guidelines. Until better quality evidence is available to support or refute the usefulness

25
of IOL for improving outcomes among women with these indications it is likely that expert opinion will dictate practice. It may also be anticipated that there will be high practice variation for these various indications.
Key Question #4: What are the potential ways to reduce elective inductions of labor?
We found no SRs or RCTs which studied methods of reducing EIOL. However, our search did locate several recent articles which describe programs to decrease inappropriate inductions or institute guidelines for elective induction. We included detailed evidence tables of each of these four programs in Appendix D.
While there is not an adequate evidence base from either RCTs or observational studies to definitively determine whether EIOL leads to cesarean delivery, it is important to note that each of these quality improvement studies demonstrate an overall decrease in cesarean delivery when EIOL is limited and clinical guidelines for EIOL are followed. (Fisch, 2009; Oshiro, 2009; IHC, 2007a; IHC, 2007b; LeRay, 2007; Reisner, 2009) Another publication discussed how a hospital protocol was developed and implemented, but did not present outcomes data and so is not presented in Appendix D. (Durham, 2008)
Fisch compared outcomes of EIOL before and after the implementation of a quality improvement program in 2006 at Magee Women’s Hospital in Pittsburg. (Fisch, 2009) The new guidelines included EIOL only after 39 weeks of gestation. No preinduction cervical ripening was allowed and EIOL required a Bishop score of eight or over for nulliparas and of 6 or over for multiparas. The hospital collected information on gestational age, stated reason for the induction, the name of the clinician, gravidity, parity and the delivery outcome. Criteria for EIOL were strictly enforced during the implementation period and peer review letters were sent to physicians who did not adhere to guidelines. The hospital also limited the number of EIOL ―slots‖ or appointments which were available each day and EIOL could not be scheduled more than a week in advance. Population characteristics before and after the program was instituted were similar, although the proportion of publically insured and non-Caucasian patients declined somewhat. The starting EIOL rate was over nine percent and fell to 6.4%. The proportion of nulliparas being induced electively declined to 4.3% from a starting point of 11.8%. Fisch and colleagues reported that the risk of cesarean delivery for nulliparas undergoing EIOL decreased by two-thirds compared to the pre-implementation period (OR 0.3 [95% CI 0.1-0.9]).
Reisner and colleagues conducted a similar quality improvement program beginning in 2004 at Swedish Medical Center in Seattle. (Reisner, 2009) The hospital developed indications for high priority, medium priority and purely elective inductions. Reasons for purely elective inductions could include a history of rapid labor, remote residence, social reasons and macrosomia. Patient consent forms detailing the risks of EIOL were developed. A gestational age of at least 39 weeks and a Bishop score of six or greater was required to schedule an EIOL. The implementation committee tracked and reported consent compliance, induction rates and other clinical outcomes on a quarterly basis. They reported over three years of data from their post-implementation period and

26
found that consent compliance increase dramatically to 90% and that the EIOL rate for both nulliparas and multiparas decreased significantly (4.3% to 0.8% for nulliparas and 12.5% to 9.3% for multiparas). Unplanned cesarean delivery for nulliparous women decreased by a third compared to the pre-implementation period (RR 0.66 [95% CI 0.4-1.1]), although the difference was not statistically significant. Unplanned cesarean delivery for multiparous women decreased by over half and the difference was statistically significant (RR 0.47 [95% CI 0.25-0.87]).
Intermountain Healthcare (IHC) is an integrated healthcare system with 21 hospitals in Utah and Idaho. A quality improvement program for EIOL began in 2001 and Oshiro and colleagues reported outcomes from July 2001 through June 2006 compared to a pre-implementation period from 1999 through 2000. (Oshiro, 2009; IHC, 2007a; IHC, 2007b) Their guidelines included no EIOL prior to 39 weeks of gestation and a Bishop score of 10 or greater in nulliparas and 8 or greater for multiparous women. Induction for elective indications at less than 39 weeks of gestation declined from 28% in 1999 to 3.4% in 2007. They found that the rate of cesarean delivery for nulliparas with a Bishop score of 10 was 8.1% compared with rates of 26.3% with a Bishop score of four and 17.6% with a Bishop score of five. Cesarean delivery for ―fetal distress‖ declined significantly (OR 0.57 (95% 0.35-0.92). The risk of stillbirth, meconium aspiration and of a neonate having a one minute Apgar scores less than five also declined significantly after implementation of the EIOL guidelines.
National guidelines for EIOL were instituted in France in 1995. (LeRay, 2007) The French guidelines required an EGA of over 39 weeks, a Bishop score of over five and no use of preinduction cervical ripening for EIOL. LeRay found that when the French national guidelines were not followed in a group of 138 French maternity units that the overall risk of cesarean delivery increased three-fold.
All of these programs limited EIOL to women at or over 39 weeks of gestation. The guidelines from Intermountain Healthcare (Oshiro, 2009; IHC, 2007a; IHC, 2007b) and Magee Women’s Hospital in Pittsburg (Fisch, 2009) impose more stringent Bishop score requirements for nulliparous women than did the French guidelines. The program from Swedish Medical Center in Tacoma used essentially the same set of requirements as did the French guidelines. (Reisner, 2009) Each of these study authors speak to the difficulty of changing clinician behavior and the substantial institutional effort required to sustain practice change over time.
Overall summary of evidence These studies demonstrate that the risk of cesarean delivery can be decreased by adherence to simple rules for safe induction of labor at term. These policies have been effective at decreasing the use of EIOL in each of the settings. The process improvement literature is consistent with evidence from the observational studies we examined to answer the first two key questions in this report. The before-after design of these quality improvement studies supports other observational literature findings that induction of nulliparous women with a low Bishop score increases the risk of cesarean delivery. A sample of a patient education brochure from IHC is available online at: https://kr.ihc.com/ext/Dcmnt?ncid=51061832. A set of sample clinical forms from

27
Swedish Hospital in Seattle are presented in the appendices to the Reisner article. (Reisner, 2009)
Strength and limitations of the evidence These studies are before and after case series that use a ―historical‖ time period control group. While all of the time periods are immediately before the intervention periods, their noncontemporaneous nature may obscure temporal trends and concurrent interventions aimed at decreasing cesarean delivery. However, the effects observed with substantially equivalent policies are remarkably similar across institutions. The applicability of these process improvement programs may be limited to settings with resources and leadership to support sustained improvement efforts.
Guidelines
Summary of Guidelines The clinical practice guideline recommendations for IOL by ACOG, NICE, SOGC and the VA/DOD are detailed below in Table 4. None of these guidelines are specifically about EIOL, but are more generally geared to the indications, contraindications and methods for induction of labor. Relatively little is said about EIOL, per se. The ACOG guideline is permissive about EIOL for ―logistic‖ and ―psychosocial‖ reasons, but advises avoidance of elective induction at less than 39 weeks of gestation. There is no guidance on cervical status for EIOL. The SOGC guideline discourages EIOL and supports a full discussion of risks and harms with the woman prior to undertaking IOL. It also advises use of cervical ripening agents if the cervical status is unfavorable, although this advice is not specific to EIOL. Like ACOG, the NICE guideline notes that exceptional personal circumstances can justify EIOL on rare occasions, but only if the woman has reached 40 weeks of gestation. The NICE and VA/DOD guidelines both advise offering membrane sweeping beginning at 38 weeks of gestation to lessen the chance of needing formal induction at 41 or more weeks of gestation. The VA/DOD guideline allows EIOL after 39 weeks of gestation in women with a Bishop score of greater than six.
The guidelines produced by the two North American professional organizations were rated by our guidelines assessment tool as being of poor quality. In neither case could we identify the methods used to search for and select evidence for recommendations in the guideline itself. We were also unable to find a methods manual or other general guidelines process document for either ACOG or SOGC and thus had to rate the overall quality of these guidelines as poor. This does not mean that these organizations did not employ good practice, but only that their publically available documentation does not speak to these features. The SOGC did give search dates and included quality of evidence ratings in its guidelines, but there was no other information about search or selection of evidence. It also appears that the funding for both of these guidelines was internal to the organization, which led to ratings of ―poor‖ for editorial independence of guideline development. No conflict of interest policies could be identified for either ACOG or SOGC. Although we could not identify an ending search date for the VA/DOD guideline, it is an update of a pre-existing guideline with better documentation of the search strategy and methodology used and there is fair evidence that the other primary criteria of rigor of development and editorial independence are adequate. The only

28
good quality guideline is from NICE in the U.K. It was supported by a full SR and used a highly rigorous methodology. The NICE guideline involved a broad array of stakeholders, including representation from patients, all relevant clinician groups and health service administrators. It includes tools for implementation and audit as well.
Comparison of guidelines and evidence summary The ACOG, NICE and VA/DOD guidelines all support avoiding EIOL prior to 39 weeks of gestation. Only the VA/DOD guideline sets a particular Bishop score threshold for EIOL. The indications cited as medical and obstetric reasons for IOL are largely not supported by our review of the evidence on indications for induction of labor. All four guidelines recommend offering IOL for women who are at least a week past their due date and this indication is supported by strong evidence. All of the guidelines with the exception of the VA/DOD guideline recommend IOL for prelabor rupture of membranes. The ACOG guidelines carry the longest list of conditions which ―may‖ be indications for IOL, but does not discuss evidence of the relative benefits and harms for most of these indications.
Table 4. Induction of Labor Guidelines Summary
Guideline, Date
Quality Rating
Elective Induction Recommendations Indications and Contraindications for
Induction of Labor
ACOG, 2009 Quality: Poor
―Labor may also be induced for logistic reasons, for example, risk of rapid labor, distance from hospital, or psychosocial indications. In such circumstances, at least one of the gestational age criteria in the box [see below] should be met, or fetal lung maturity should be established. A mature fetal lung test result before 39 weeks of gestation, in the absence of appropriate clinical circumstances, is not an indication for delivery.‖ [strength of recommendation not graded] Confirmation of Term Gestation:
Ultrasound measurement at <20 weeks supporting gestation age of >=39 weeks.
Fetal heart tones by Doppler present for >=30 weeks.
36 weeks since positive serum/urine pregnancy test.
Indications: ―Indications for induction of labor are not absolute but should take into account maternal and fetal conditions that may be indications for induction of labor:
Abruptio placentae
Chorioamnionitis
Fetal demise
Gestational hypertension
Preeclampsia, eclampsia
Premature rupture of membranes
Postterm pregnancy
Maternal medical conditions (e.g. diabetes mellitus, renal disease, chronic pulmonary disease, chronic hypertension, antiphospholipid syndrome)
Fetal compromise (e.g. severe fetal growth
restriction, isoimmunization, oligohydramnios)‖

29
Table 4. Induction of Labor Guidelines Summary (continued)
Guideline, Date
Quality Rating
Elective Induction Recommendations Indications and Contraindications for
Induction of Labor
Contraindications: ―Generally the contraindications to labor induction are the same as those for spontaneous labor and vaginal delivery. They include, but are not limited to the following situations:
Vasa previa or complete placenta previa
Transverse fetal lie
Umbilical cord prolapsed
Previous classical cesarean delivery
Active genital herpes infection
Previous myomectomy entering the endometrial cavity‖
None of these indications or contraindications has a grade of recommendation associated with them.
NICE, 2008 Quality: Good
―Induction of labour should not be offered on maternal request alone. However, under exceptional circumstances (for example, if the woman’s partner is soon to be posted abroad with the armed forces), induction may be considered at or after 40 weeks.‖
At 38 weeks, women should be given information on the risks associated with pregnancies that extend more than 42 weeks. Information should cover information on options including membrane sweeping (effective for reducing the need for formal induction), induction of labor between 41 and 42 weeks, expectant management. Indications:
Prevention of prolonged pregnancy (offer induction between 41 and 42 weeks)
Prelabour rupture of membranes at term
Intrauterine fetal demise (IUFD) with ruptured membranes, infection or bleeding (offer IOL or EM for IUFD without any of these complications)
IOL Usually Contraindicated:
Prelabour rupture of membranes prior to 34 weeks (unless complication such as infection or evidence of fetal compromise)
Breech presentation
Fetal growth restriction
History of precipitate labour
Suspected fetal macrosomia

30
Table 4. Induction of Labor Guidelines Summary (continued)
Guideline, Date
Quality Rating
Elective Induction Recommendations Indications and Contraindications for
Induction of Labor
SOGC, 2001 SOGC, 2008 Quality: Poor
―As elective induction is associated with potential complications it should be discouraged, and only undertaken after fully informing the woman of these risks and establishing accurate gestational age. (II-2 B)‖
Indication Recommendations (grade of evidence, grade of recommendation): ―If induction of labour is being considered the following should be addressed: indication for induction, any contraindications, gestational age, cervical favourability, fetal presentation, potential for cephalopelvic disproportion, fetal wellbeing/fetal heart rate, and membrane status. (III B)‖ ―If the cervix is unfavourable, ripening of the cervix should be considered prior to induction of labour. (II-2 A)‖ ―Induction should be considered when it is felt that the benefits of vaginal delivery outweigh the potential maternal and fetal risks of induction. These issues should be discussed with the woman prior to initiation of induction.‖ Indications:
Gestational age of at least 41 completed weeks
Premature rupture of membranes
Potential fetal compromise (significant fetal growth restriction, non-reassuring fetal surveillance)
Maternal medical conditions (type I diabetes, renal disease, significant pulmonary disease, hypertension (gestational or chronic), antiphospholipid syndrome, suspected or proven chorioamnionitis, abruption, and fetal death)

31
Table 4. Induction of Labor Guidelines Summary (continued)
Guideline, Date
Quality Rating
Elective Induction Recommendations Indications and Contraindications for
Induction of Labor
Contraindications:
Contraindications to labour or vaginal delivery (e.g. previous myomectomy entering the uterine cavity, previous uterine rupture, fetal transverse lie, placenta previa, vasa previa, invasive cervical cancer, active genital herpes, and previous classical or inverted T uterine incision)
SOGC’s Guideline for the Management of Pregnancy at 41+0 to 42+0 Weeks (SOGC, 2008) makes the following additional recommendations relevant to this review: ―Women should be offered the option of membrane sweeping commencing at 38 to 41 weeks, following a discussion of risks and benefits. (1-A)‖ ―Women should be offered induction at 41+0 to 42+0 weeks, as the present evidence reveals a decrease in perinatal mortality without increased risk of Cesarean section. (1-A)‖
VA/DOD, 2009 Quality: Fair
In those patients with a favorable cervix (Bishop score > 6), induction after 39 weeks may be considered. [B]
Recommendations [grade of recommendation]:
Consider offering routine membrane sweeping to all pregnant women every visit beginning at 38 weeks. [C]
In the absence of contraindications, labor induction should be offered to women who reach 41 and 0/7 weeks undelivered. [A]
When labor induction is offered or planned women should be educated on the risks of induction, including length of induction, discomfort involved, and the process in determining appropriate timing of induction. [B]
Antepartum fetal testing should begin as soon as possible after 41 and 0/7 weeks if not scheduled for induction at his time. [C]
Testing should consist of weekly amniotic fluid assessment and twice weekly non-stress testing. [D]
Inadequate amniotic fluid index should prompt further evaluation to determine the need for delivery. [B]

32
Joint Commission and National Quality Forum The Joint Commission put into effect five new perinatal care measures on April 1, 2010. (Joint Commission, 2009; Main, 2009) The first of these measures is ―Elective Delivery‖ and measures the proportion of patients delivering newborns with 37-39 weeks completed who have elective deliveries (medical induction of labor or cesarean section). The measure excluded women at these gestational ages who are in active labor, have had spontaneous rupture of membranes or who have a condition justifying elective delivery. Hospitals are directed to track ―improvement‖ based on a decrease in the rate, although no specific goal rate is suggested. This measure is also a National Quality Forum (NQF) endorsed voluntary consensus standard for hospital care and is maintained by the Hospital Corporation of America. (Main, 2009; NQF, 2008) The measure was adopted by NQF in 2008 and is defined as the proportion of babies electively delivered prior to 39 completed weeks of gestation.
Summary
Potential Benefits and Harms of Elective Induction of Labor The SRs of RCTs using an expectant management control group show either a slight decrease in cesarean delivery or no effect with EIOL, but there is some evidence of increased risk of operative vaginal delivery. These meta-analyses do not distinguish between nulliparous women who are at higher risk of cesarean delivery and multiparous women. The underlying studies do not give enough information about cervical status at EIOL to control for this key factor. The overall number of studies and subjects, trial quality and changes in routine maternity care since their conduct leads to concern about their usefulness to determine the benefits and harms of EIOL. The overall strength of evidence from these SRs is low.
All of the observational studies we located to supplement these SRs used a SL control group. Women do not have a choice of EIOL or SL. Rather, they have a choice of EIOL or expectant management which may result in SL, but may also result in a planned cesarean or IOL for complications arising during the remainder of pregnancy. However, we found three observational studies of women at very low risk of complications which controlled for both parity and cervical status or use of cervical ripening. All three were conducted in the U.S. and published within the past decade. They are more likely than the RCTs included in the SRs to represent contemporaneous practice, but none of them employed the most commonly used methods of cervical ripening currently in use (misoprostol and dinoprostone). These studies may bias estimates of either benefit or harm away from the null, exaggerating the effects of the intervention compared to a hypothetical study which used an expectant management control group. However, they are consistent in finding a similarly increased risk of cesarean delivery with EIOL. Increased use of epidural anesthesia is also associated with EIOL among these studies. The overall strength of evidence for these outcomes after EIOl is low. None of the fair quality observational studies gave information on the risk of OVD after EIOL.
For nulliparous women the NNH ranges from four among women who had preinduction cervical ripening in the Vahratian study to 10 among women in the Seyb study. Multiparous women may also have an increased risk of cesarean delivery with a NNH of

33
62 based on the Hoffman study. There is moderate strength of evidence that nulliparity and having a low Bishop score or requiring preinduction cervical ripening increase the risk of cesarean delivery with EIOL.
The most relevant data about the likely effects of EIOL on the risk of cesarean delivery in the U.S. may come from a series of studies on process improvement or guideline implementation. These studies all demonstrate a substantially decreased risk of cesarean delivery when EIOL is confined to women over 39 weeks of gestation who have a relatively high Bishop score and do not require preinduction cervical ripening.
The bulk of evidence from observational studies indicates increased risk of neonatal admission to the NICU after EIOL. Neonatal outcomes were not reported by the SRs. Meconium stained amniotic fluid is more common among women who enter SL at term compared with those who undergo EIOL, but there is insufficient evidence of direct harm (e.g. MAS with increased use of ventilation or other interventions) related to this observation. The counterintuitive finding of higher rates of macrosomia and slightly increased birth weight among the EIOL groups in these studies raise the question of potential unmeasured confounding. The overall strength of evidence for these three neonatal outcomes is low. There is insufficient evidence to determine other less common and less commonly reported neonatal outcomes. There is a moderate strength of evidence that gestational age substantially modifies neonatal risk with EIOL. Elective induction at less than 39 weeks of gestation increases the risk of NICU admission for newborns.
The length of active labor is likely shorter with EIOL compared to SL, although total time spent on a labor and delivery unit and in the hospital from admission to discharge may be greater. The strength of evidence for health service utilization outcomes after EIOL is very low.
Appropriateness of Indications for Induction of Labor Many commonly cited medical indications for IOL are not well supported by evidence. The only two indications with strong evidence and net benefit for IOL are gestational age beyond 41 weeks and prelabor rupture of membranes at term. There is moderate quality evidence against inducing labor for suspected macrosomia. Induction of labor at term for women with gestational diabetes who are treated with insulin may decrease neonatal macrosomia. Although there is moderate strength of evidence for this finding, there is insufficient evidence about the risk of other more important outcomes. There is a low overall strength of evidence that induction of labor for suspected intrauterine growth restriction at term does not appear to improve perinatal outcomes and presents an increased risk of cesarean delivery to the mother. Expectant management may improve neonatal outcomes for severe preeclampsia before 34 weeks of gestation, based on a moderate strength of evidence. Induction of labor may be beneficial for certain subgroups of women with mild preeclampsia, including those at 40 weeks of gestation, nulliparas and those with a low Bishop score. This is based on a moderate overall strength of evidence. There is insufficient evidence to guide practice regarding induction of labor for other commonly cited indications, including multiple gestation and oligohydramnios.

34
Reducing Inappropriate Induction of Labor Sustained process improvement efforts targeted at eliminating inappropriate EIOL can be effective at reducing cesarean delivery outcomes, particularly for nulliparous women with a low Bishop score. Data from process improvement and guideline implementation studies indicate that the risk of cesarean delivery can be decreased by as much as 70% if guidelines are followed for these women. Implementation of practice change requires strong leadership and sustained effort on the part of all stakeholders for these efforts to succeed.
Conclusions Evidence about both the potential benefits and harms of EIOL would ideally arise from multiple, well-conducted RCTs that compared the intervention to expectant management until 41 weeks of gestation. This evidence base does not exist. Similarly, strong evidence on each of the many potential medical and obstetric indications for IOL would require a robust base of evidence that largely does not exist. However, there is low to moderate quality evidence, based on poor to fair RCTs and fair observational studies that EIOL may be associated with increased risk of cesarean delivery for some women. There is also moderate quality evidence to support a few common indications for induction of labor.
The most relevant evidence about the association between EIOL and mode of delivery comes from recent process improvement efforts in U.S. hospitals. These efforts can also provide a framework for other institutions who are seeking to implement EIOL guidelines. Health systems, hospitals, clinicians and payers must commonly decide their actions and policies based on imperfect science. The results of this review can help to support these stakeholders as they implement policies and practices. They can all assist in requesting, sponsoring and developing stronger evidence about the questions related to EIOL by tracking their interventions and outcomes and sharing them with their constituents, colleagues, and patients.

35
Appendix A. Updated Search Strategy Core sources were searched primarily using the terms, ―induction of labor‖ and ―induction of labour,‖ as appropriate to the country of origin or the database. Databases with few items or inadequate search engines were searched by hand. MEDLINE was searched using the following strategy: 1 exp Labor, Induced/ (1967) 2 exp Cervical Ripening/ (586) 3 exp Cervix Uteri/ (6430) 4 (ripe$ or induc$).mp. (1029538) 5 3 and 4 (1072) 6 ((cervi$ or labor$) adj5 (induc$ or initiat$ or began or begin$ or ripe$)).mp. (6143) 7 exp Oxytocics/ (20069) 8 exp Balloon Dilation/ (33866) 9 exp Laminaria/ (188) 10 exp castor oil/ (364) 11 exp Enema/ (1970) 12 exp Physical stimulation/ (77357) 13 exp Extraembryonic Membranes/ (6438) 14 exp Acupuncture therapy/ (6119) 15 exp homeopathy/ (1874) 16 7 or 8 or 9 or 10 or 11 or 12 or 13 or 14 or 15 (147196) 17 (5 or 6) and 16 (1611) 18 1 or 2 or 5 or 17 (3310) 19 exp "Outcome Assessment (Health Care)"/ (421167) 20 exp Pregnancy Outcome/ (23263) 21 19 or 20 (442511) 22 18 and 21 (843) 23 exp Delivery, Obstetric/ (20569) 24 22 and 23 (747) 25 exp Obstetric Labor Complications/ (17481) 26 exp Gestational Age/ (25481) 27 exp Obstetrical Forceps/ (371) 28 exp Analgesia, Epidural/ (3953) 29 exp Birth Weight/ (11475) 30 exp Heart Rate, Fetal/ (1889) 31 exp Fetal Distress/ (845) 32 exp Dystocia/ (927) 33 exp Fetal Macrosomia/ (905) 34 exp Apgar Score/ (2083) 35 exp Infant, Newborn, Diseases/ (42777) 36 exp "costs and cost analysis"/ (87490) 37 25 or 26 or 27 or 28 or 29 or 30 or 31 or 32 or 33 or 34 or 35 or 36 (178136) 38 18 and 37 (1197) 39 24 or 38 (1541)

36
40 Meta Analysis.pt. or (meta analy$ or metaanaly$).tw. or systematic review$.tw. or (published studies or medline or embase or data synthesis or data extraction).ab. or cochrane.jw. (70088)
41 Randomized Controlled Trial.pt. or random$.tw. (384632) 42 (Clinical Trial or Clinical Trial, Phase I or Clinical Trial, Phase II or Clinical Trial,
Phase III or Clinical Trial, Phase IV or Controlled Clinical Trial or Multicenter Study).pt. or ((double adj2 blind$) or trial$ or multicenter or multicentre or multi center or multi centre).tw. or placebo.tw, hw. or exp Clinical Trials/ (572726)
43 (Guideline or Practice Guideline or Consensus Development Conference or Consensus Development Conference, NIH).pt. or (guideline$ or consensus).tw,hw. or recommend$.ti. (204314)
44 39 and 40 (54) 45 39 and 41 (437) 46 39 and 42 (501) 47 39 and 43 (46) 48 exp Cohort Studies/ (486861) 49 exp case-control studies/ (350983) 50 39 and 48 (293) 51 39 and 49 (271) 52 44 or 45 or 46 or 47 or 50 or 51 (917) 53 limit 52 to yr="1999 -Current" (752) 54 limit 53 to english language (692) 55 limit 54 to abstracts (655) 56 from 54 keep 1-692 (692)

37
Appendix B. Summary of Systematic Reviews: Elective Induction of Labor
Reference Study Design and Number
of Studies & Subjects Interventions and
Comparators
Outcomes Evaluated and
Main Findings
Quality Assessment and
Comments
Gülmezoglu, 2006
Cochrane Review, SR +MA 19 RCTs N=7984 women from 37 to 43 wks EGA Only the following 3 component RCTs contributed data for women 37-41 wks EGA: Breart, 1982, France (N=716); Cole, 1975, Scotland (N=237); Egarter, 1989, Austria (N=345). Total N=1151
Elective induction of labor (EIOL) vs. Expectant management (EM)
Cesarean Section Delivery (3 RCTs, Cole, Egarter, Breart) 26/780 vs 28/520 RR 0.58 (95% CI 0.34-0.99) Assisted Vaginal Delivery (2 RCTs, Breart & Egarter) 129/661 vs 38/400 RR 1.71 (95% CI 1.23-2.39) Perinatal Death (2 RCTs, Cole & Egarter) 0/299 vs 2/285 RR 0.32 (95% CI 0.03- 3.09) Stillbirth (2 RCTs, Cole & Egarter) 0/299 vs 1/285 RR 0.30 (95% CI 0.01-7.27) Neonatal Death within 7 days (2 RCTs, Cole & Egarter) 0/299 vs 1/284 RR 0.35 (95% CI 0.01-8.53) Outcomes not reported in these 3 RCTs included: Birth asphyxia, Meconium aspiration syndrome, NICU admission, 5 min. Apgar score <7, Birthweight > 4kg, Mean Birthweight, PPH,
Quality: Good None of these studies reported whether women had a favorable cervix prior to EIOL. Some studies conducted prior to 1980 when ultrasound started to commonly be used for gestational age assessment. No data on cervical status at the start of EIOL or SL were presented. Labor management practices, including the types and use of cervical ripening agents, have likely changed substantially since these studies were done.

38
Reference Study Design and Number
of Studies & Subjects Interventions and
Comparators
Outcomes Evaluated and
Main Findings
Quality Assessment and
Comments
Caughey, 2009a, 2009b
AHRQ SR 34 studies (11 RCTs and 23 observational studies). 9 RCTs (N=6138) compared EIOL vs EM and an additional 2 RCTs compared vs SL control groups. Only the following 3 component RCTs contributed data for women 37-41 wks EGA: Cole, 1975, (N=228); Egarter, 1989, (N=345); Tylleskar, 1979, (N=84). This SR did not report outcomes for this EGA subgroup except for cesarean and operative vaginal delivery.
EIOL vs. EM or Spontaneous Labor (SL) Controls
Outcomes from RCTs: Cesarean Delivery (2 RCTs: Cole, Egarter) 7/291 vs 12/282 OR 0.58 (95% CI 0.22-1.50) Operative Vaginal Delivery (3 RCTs: Cole, Egarter, Tylleskar) 39/334 vs 51/323 OR 1.41 (95%CI 0.83-2.44) No other outcomes for EGA less than 41 weeks were presented in this SR. Outcomes from Observational Studies: Neither maternal nor fetal/neonatal outcomes were reported for studies including only women at less than 41 weeks of gestation. Among all women included in these studies (up to 42 weeks of gestation) the meta-analysis found a higher risk of cesarean delivery with EIOL compared to SL (OR 1.60; 95% CI 1.26-2.02). For nulliparous women only the risk was higher (OR 2.10; 95% CI 1.80-2.46), while for multiparous women the risk remained elevated, but was lower than for nulliparous women (OR 1.28; 95% CI 1.04-1.58). There was no overall difference in the risk of operative vaginal delivery among women who were included in these studies (SL control group, up to 42 weeks of gestation). However, for nulliparous women the risk was elevated
Quality: Good

39
Reference Study Design and Number
of Studies & Subjects Interventions and
Comparators
Outcomes Evaluated and
Main Findings
Quality Assessment and
Comments
(OR 1.12; 95% CI 1.05-1.20). There were no other significant differences found in maternal outcomes for women up to 42 weeks of gestation comparing EIOL to SL.
Mozurkewich, 2009
BJOG Best-Evidence Review (SR of SRs plus additional newer studies) 34 studies (10 SR/MAs; 12 RCTs; 12 Observational studies, including 1 Cohort; 1 Case-control; and 10 Case series) Multiple studies, total N not reported.
Planned IOL vs. EM or immediate delivery for various common indications
See summary of results displayed in Table 3, main body of this review
Quality: Fair ―Best Evidence‖ review using methodology of BMJ Clinical Evidence. Study quality was rated using SIGN methodology and Overall strength of recommendation was rated using GRADE methodology.

40
Appendix C. Summary of Observational Studies: Elective Induction of Labor
Reference
Location and/or
Setting, Year(s) of
Study, Study
Design
Study Inclusion and Exclusion Criteria
Interventions and Baseline Characteristics of Study Population
Outcomes Assessed and Results
Study Quality and Comments
Amano, 1999
Japan, University hospital Year(s) of study not reported; Prospective cohort (see comments)
Inclusion criteria: Nulliparous, ―uncomplicated‖ pregnancy, vertex presentation. Intervention group had Induction at 39 wks Control group were observed for spontaneous onset of labor until 42 wks.
EIOL vs. SL control group Characteristics: Age, years (SD) EIOL—28.5 (3.8) SL—28.9 (3.9) Maternal weight, kg (SD) EIOL—61.0 (8.0) SL—60.8 (7.2) Bishop score < 7, % EIOL—79.6% SL—74.0% Intervention group: Allocated=98 Analyzed=63 Excluded=35.7% Intervention group admitted the night before induction at 38 6/7 weeks. Overnight, cervical ripening as needed with laminaria tents and/or oral prostaglandin E2 1mg q. hr up to 4 doses. If cervical dilation > 3cm and 0 station AROM followed by IV oxytocin or prostaglandin F2 alpha. 35 intervention subjects had spontaneous labor prior to 39 wks.and were excluded from analysis Control group: Allocated=96 Analyzed=72 Excluded=25.0%
Cesarean delivery 4/63 (6.4%) vs. 4/72 (5.6%) P=ns Forceps delivery 1/63 (1.6%) vs. 1/72 (1.4%) P=ns Vacuum extractor delivery 33/63 (53.4%) vs. 24/72 (33.3%) P=0.03 Epidural analgesia 56/63 (88.9%) vs. 39/72 (54.2%) P<0.001 NNH=3 Abnormal fetal monitoring requiring intervention (oxygen, tocolysis or amnio-infusion) 3/63 (4.8%) vs. 12/72 (16.7%) P=0.03 Postpartum blood loss, mL (SD.) 268 (179) vs. 237 (185) P=ns Mean duration first stage labor, min (SD) 460 (201) vs. 685 (410) P<0.001 Mean duration second stage labor, min (SD) 111 (81) vs. 96 (75) P=ns Umbilical artery pH < 7.2 6/63 (9.5%) vs. 9/72 (12.5%) P=ns
Quality: Poor Nulliparas only Subject allocation by last digit of chart number No intention to treat analysis performed These design and analysis decisions effectively converted study design to a prospective cohort study Amano study was excluded from Cochrane Review by Gülmezoglu (2006) because of alternate allocation by last digit of medical record number and classed as observational study with a SL control group by Caughey. Note that more than 30% of subjects were excluded in analysis.

41
Reference
Location and/or
Setting, Year(s) of
Study, Study
Design
Study Inclusion and Exclusion Criteria
Interventions and Baseline Characteristics of Study Population
Outcomes Assessed and Results
Study Quality and Comments
Control group was ―expectantly managed‖ until 42 wks. 10 control subjects excluded (3 induced at 42 wks, 3 induced for fetal indications, 4 with elective induction at 40 wks), effectively converting control group to a spontaneous labor only group rather than an expectant management group. Although flow diagram indicates 86 had spontaneous onset of labor before 42 weeks, the paper only presents outcomes for 72 women in the control group. Neither the proportion of each group which had cervical ripening nor receiving each possible induction method was specified.
Meconium stained amniotic fluid 2/63 (3.2%) vs. 14/72 (19.4%) P=0.004 NICU admission 0/63 (0%) vs. 2/72 (2.8%) p=ns
Cammu, 2002 Belgium, Flanders region, multiple hospitals 1996-1997 Retrospective Matched Cohort
Inclusion criteria: Nulliparous; low risk pregnancy; singleton; cephalic presentation; live-born infant; 38 0/7 to 41 0/7 weeks EGA Groups matched for maternal age, birth weight, gestational age, sex of infant, and obstetric unit. Exclusion criteria: Fetal death, non-hospital delivery, deliveries not performed or supervised by a gynecologist.
EIOL vs. SL control group EIOL: N=7683 SL: N=7683 Cervical status, methods used for induction not reported other than a general comment that cervical ripening preceded about two-thirds of inductions in the region. Characteristics: Maternal age, birth weight, gestational age and proportion of male infants were essentially the same given matching on these factors. No information on Bishop score on admission reported.
Cesarean delivery 762/7683 (9.9%) vs. 500/7683 (6.5%) RR 1.52 (95% CI 1.37-1.70) NNH 29 (95% CI23/4-39.4) Cesarean section, by indication: Dystocia, 1
st stage:
RR 1.82 (95% CI 1.56-2.11) Dystocia, 2
nd stage
RR 0.99 (95% CI 0.75-1.31) Fetal distress RR 1.42 (95% CI 1.14-1.76) Operative vaginal delivery 2429/7683 vs. 2236/7683 RR 1.09 (95% CI 1.04-1.14) Use of epidural anesthesia 6128/7683 vs. 4428/7683 RR 1.38 (95% CI 1.35-1.42) Infant admitted to NICU 824/7683 (10.7%) vs. 725/7683 (9.4%) RR 1.14 (95% CI 1.03-1.25) NNH=77
Quality: Poor Nulliparas only Spontaneous labor control group. No analysis controlling for cervical status at admission/induction No information about specific methods of induction employed. Matched design prohibits analysis based on matching factors

42
Reference
Location and/or
Setting, Year(s) of
Study, Study
Design
Study Inclusion and Exclusion Criteria
Interventions and Baseline Characteristics of Study Population
Outcomes Assessed and Results
Study Quality and Comments
Clark, 2009 USA, 27 hospitals in 14 states which are part of the Hospital Corp. of American system May through July 2007; Prospective case series
Multiparous and nulliparous with planned elective delivery at term. Subpopulations with elective induction at 37, 38 and 39-41 weeks analyzed. Inclusion criteria: Elective delivery without an indication as defined below. Exclusion criteria: Indication for delivery as determined by the admitting physician or the nurse who collected data. Indications included greater than 41 weeks, hypertension, large for gestational age/macrosomia, diabetes, oligohydramnios, IUGR, abnormal antepartum testing, or other conditions. Deliveries during study period: Total = 17,794 Deliveries at term = 14,955 Planned term deliveries = 6562 Elective planned term deliveries = 4645 Elective inductions (EIOL) = 2794
EIOL at 37 wks = 112 EIOL at 38 wks = 678 EIOL at 39-41 wks = 2004 Primary method of induction for total induction of labor population (EIOL and indicated induction): Oxytocin—72% Prostaglandin E2—15% Misoprostol—8% Amniotomy—4%
NICU admissions among infants of women with EIOL, number (%): 37 wks: 17/112 (15.2%) P=0.003 compared to 38 wk group 38 wks: 44/678 (7.0%) P<0.001 compared to 39-41 wk group 39-41 wks: 61/2004 (6.0%) Length of labor (start of induction to delivery), hours (SD) Nulliparous—13.6 (7.9) Multiparous—8.2 (5.0)
Quality: Good Mixed parity groups Prospective case series of EIOL without a control group. Included for KQ2 only. Cesarean rates reported by cervical dilation for induction of labor group, but not separately for EIOL subgroup.
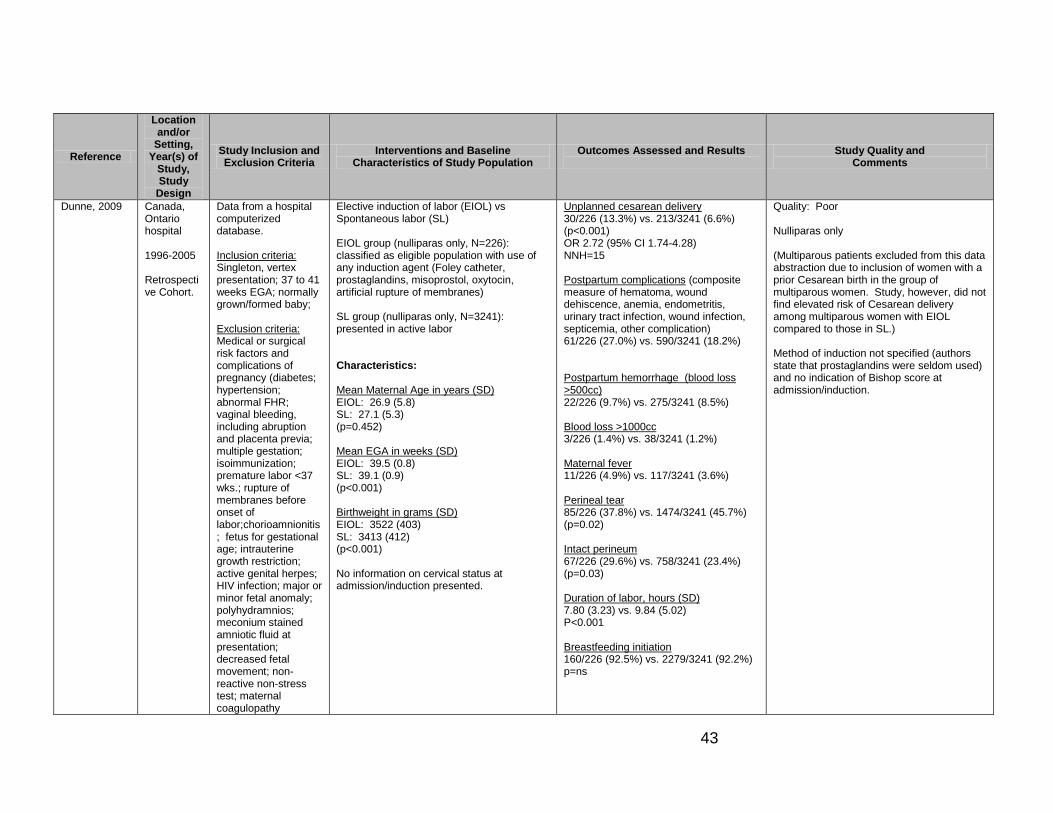
43
Reference
Location and/or
Setting, Year(s) of
Study, Study
Design
Study Inclusion and Exclusion Criteria
Interventions and Baseline Characteristics of Study Population
Outcomes Assessed and Results
Study Quality and Comments
Dunne, 2009 Canada, Ontario hospital 1996-2005 Retrospective Cohort.
Data from a hospital computerized database. Inclusion criteria: Singleton, vertex presentation; 37 to 41 weeks EGA; normally grown/formed baby; Exclusion criteria: Medical or surgical risk factors and complications of pregnancy (diabetes; hypertension; abnormal FHR; vaginal bleeding, including abruption and placenta previa; multiple gestation; isoimmunization; premature labor <37 wks.; rupture of membranes before onset of labor;chorioamnionitis; fetus for gestational age; intrauterine growth restriction; active genital herpes; HIV infection; major or minor fetal anomaly; polyhydramnios; meconium stained amniotic fluid at presentation; decreased fetal movement; non-reactive non-stress test; maternal coagulopathy
Elective induction of labor (EIOL) vs Spontaneous labor (SL) EIOL group (nulliparas only, N=226): classified as eligible population with use of any induction agent (Foley catheter, prostaglandins, misoprostol, oxytocin, artificial rupture of membranes) SL group (nulliparas only, N=3241): presented in active labor Characteristics: Mean Maternal Age in years (SD) EIOL: 26.9 (5.8) SL: 27.1 (5.3) (p=0.452) Mean EGA in weeks (SD) EIOL: 39.5 (0.8) SL: 39.1 (0.9) (p<0.001) Birthweight in grams (SD) EIOL: 3522 (403) SL: 3413 (412) (p<0.001) No information on cervical status at admission/induction presented.
Unplanned cesarean delivery 30/226 (13.3%) vs. 213/3241 (6.6%) (p<0.001) OR 2.72 (95% CI 1.74-4.28) NNH=15 Postpartum complications (composite measure of hematoma, wound dehiscence, anemia, endometritis, urinary tract infection, wound infection, septicemia, other complication) 61/226 (27.0%) vs. 590/3241 (18.2%) Postpartum hemorrhage (blood loss >500cc) 22/226 (9.7%) vs. 275/3241 (8.5%) Blood loss >1000cc 3/226 (1.4%) vs. 38/3241 (1.2%) Maternal fever 11/226 (4.9%) vs. 117/3241 (3.6%) Perineal tear 85/226 (37.8%) vs. 1474/3241 (45.7%) (p=0.02) Intact perineum 67/226 (29.6%) vs. 758/3241 (23.4%) (p=0.03) Duration of labor, hours (SD) 7.80 (3.23) vs. 9.84 (5.02) P<0.001 Breastfeeding initiation 160/226 (92.5%) vs. 2279/3241 (92.2%) p=ns
Quality: Poor Nulliparas only (Multiparous patients excluded from this data abstraction due to inclusion of women with a prior Cesarean birth in the group of multiparous women. Study, however, did not find elevated risk of Cesarean delivery among multiparous women with EIOL compared to those in SL.) Method of induction not specified (authors state that prostaglandins were seldom used) and no indication of Bishop score at admission/induction.

44
Reference
Location and/or
Setting, Year(s) of
Study, Study
Design
Study Inclusion and Exclusion
Criteria
Interventions and Baseline Characteristics of Study Population
Outcomes Assessed and Results
Study Quality and Comments
; maternal infection; maternal fever at presentation; cancer affecting pregnancy; intrauterine death at presentation; grand multiparity). Note: prior cesarean delivery was NOT an exclusion factor and data for this population is not presented separately. Therefore, we have abstracted data only for nulliparous women who could not have had a prior CS.
Newborn admitted to NICU 13/226 (5.8%) vs. 153/3241 (4.7%) p=ns Newborn received positive pressure ventilation after birth 1/226 (0.04%) vs. 80/3241 (2.5%) p=ns 5 minute Apgar score less than 7 2/226 (0.9%) vs. 33/3241 (1.0%) p=ns Neonatal death 0/226 vs. 1/3241 p=ns Meconium passage 32/226 (14.2%) vs. 633/3241 (19.5%) p=ns Macrosomia (birth weight > 4kg) 22/226 (9.7%) vs. 261/3241 (8.1%) p=ns [if no p-value presented for comparison the comparison p-value was not given in the article which primarily tested the difference across 3 groups: EIOL, SL and Elective CS]
Glantz, 2005 USA, Finger Lakes region of New York state 1998-1999 Retrospective cohort.
Study used state birth certificate database and limited subjects to low risk pregnancies in the Finger Lakes region. Low risk population defined as: singleton, vertex, 37-40.9 weeks, no prior
EIOL vs. SL EIOL group: 1,241 women SL group: 10,608 women Method(s) of induction not specified.
Cesarean delivery All women (unadjusted): OR 1.52 (95% CI 1.26-1.84) Adjusted OR, stratified by parity (adjOR computed by ―. . . adjusting for multiple possible confounding factors . . .‖ Possible confounders are not listed. Text states that OR was adjusted for 15 factors.)
Quality: Poor Mixed parity groups. Neither method of induction not Bishop score were available in the database. Birth certificate database without independent validation of accuracy of fields for this population.

45
Reference
Location and/or
Setting, Year(s) of
Study, Study
Design
Study Inclusion and Exclusion Criteria
Interventions and Baseline Characteristics of Study Population
Outcomes Assessed and Results
Study Quality and Comments
cesarean delivery; no presenting medical or obstetric diagnoses that would be considered criteria for induction per ACOG guidelines. (These diagnoses included gestational age >=41 wks., oliogohdramnios, prelabor rupture of membranes, fetal macrosomia, growth restriction, prior stillbirth, hypertension/preeclampsia, diabetes and pulmonary disease.)
Characteristics: (not reported individually by EIOL and SL groups): Nulliparous 42.5% Caucasian 84.0% Employed 67.0% Cervical status at admission/induction not reported.
All subjects: adjOR 1.75 (95% CI 1.35-2.27) Nulliparas only: adjOR 1.90 (95% CI 1.39-2.59) Multiparas only: adjOR 1.45 (95% CI 0.90-2.33) Instrumental delivery adjOR 0.80 (95% CI 0.65-1.0) Epidural use adjOR 1.66 (95% CI 1.45-1.89) Meconium stained amniotic fluid adjOR 0.37 (95% CI 0.26-0.52) 5 minute Apgar score < 7 adjOR 0.85 (95% CI 0.38-1.86) Admission to NICU adjOR 1.27 (95% CI 0.65-1.35) Maternal length of stay Increased by 0.34 days with labor induction, but raw figures not given.
Hoffman, 2006
USA, Delaware, single institution January 2002 to March 2004. Retrospective cohort
Inclucsion criteria: Multiparas, singleton pregnancy, 37 0/7 to 40 6/7 weeks Exclusion criteria: Diabetes, hypertension, maternal medical history of cardiovascular, infectious, pulmonary, renal, mental or thyroid disorders, multiple gestation, intrauterine growth
EIOL vs. SL control groups Total N=2681 EIOL-N=735 EIOL-R=61 SL=1885 EIOL population (N=796) was subdivided into those who had preinduction cervical ripening with a Foley bulb (N= 61) without prostaglandins or additional measures and a group who did not have preinduction cervical ripening (N=735). Cervical status at admission not reported. Authors state that cervical ripening generally used if Bishop score <6.
Cesarean delivery EIOL-N 3.9% EIOL-R 1.6% SL 2.3% Comparison of cesarean delivery for EIOL-N vs. SL groups only OR 1.76( 95% CI 1.09-2.84) adjOR 1.95 (95% CI 1.19-3.19), after controlling for maternal race, gestational age, and birth weight Forceps delivery EIOL-N 0.1% EIOL-R 1.7% SL 0.5%
Quality: Fair Retrospective cohort study Multiparous women only Very low cesarean delivery rates in this selected low-risk multiparous population Subgroup analyses based on use of cervical ripening presented Vahratian, 2006 presents information for same hospital and time period, but for nulliparas only.

46
Reference
Location and/or
Setting, Year(s) of
Study, Study
Design
Study Inclusion and Exclusion
Criteria
Interventions and Baseline Characteristics of Study
Population
Outcomes Assessed and Results
Study Quality and Comments
restriction, uterine bleeding, oligohydramnios, breech presentation, elective cesarean delivery without labor, prior cesarean delivery, clinically indicated induction. Elective induction was classed as induction without a medical or obstetric indication or for ―postdates‖ prior to 41 weeks of gestation.
Oxytocin used for induction of labor after cervical ripening. Characteristics: Caucasian race EIOL-N 77%. EIOL-R 78%. SL 58% EIOL-N vs. SL, p<0.001 EIOL-R vs. SL, p=0.001 Maternal age, years (SD) EIOL-N 29.8 (5.4) EIOL-R 29.6 (5.6) SL 28.8 (5.6) EIOL-N vs. SL, p<0.001 EIOL-R vs. SL, p=0.24 Gestational age at delivery, weeks (SD) EIOL-N 38.9 (0.9) EIOL-R 39.4 (0.8) SL 38.8 (1.0) EIOL-N vs. SL, p<0.001 EIOL-R vs. SL, p<0.001 Cervical dilation at start of induction with oxytocin, cm (10
th, 90
th %-ile)
EIOL-N 3.0 (2.0, 5.0) EIOL-R 3.0 (1.0, 4.5) SL 4.5 (2.5, 7.5) EIOL-N vs. SL, p<0.001 EIOL-R vs. SL, p<0.001 Birthweight, grams (SD) EIOL-N 3438 (401) EIOL-R 3334 (360) SL 3373 (434) EIOL-N vs. SL, p<0.001 EIOL-R vs. SL, p=0.48
Vacuum delivery EIOL-N 5.6% EIOL-R 13.1% SL 5.5% (Authors state that ―. . . instrumental vaginal delivery was significantly more common in the [EIOL-R] group . . . ― although specific p-value for forceps and vacuum comparisons were not presented.) Epidural anesthesia EIOL-N 88.0% EIOL-R 91.8% SL 72.9% EIOL-N vs.SL, p<0.001; NNH=7 EIOL-R vs. SL, p<0.001; NNH=5 Medial duration first stage labor (time from cervical dilation of 5cm to 10cm), minutes EIOL-N 99 min., p<0.001 vs. SL EIOL-R 109 min., p=0.01 vs. SL SL 161 min. Mean duration second stage labor, minutes EIOL-N 14 min., p<0.01 vs. SL EIOL-R 15 min., p=0.49 vs. SL SL 16 min.

47
Reference
Location and/or
Setting, Year(s) of
Study, Study
Design
Study Inclusion and Exclusion Criteria
Interventions and Baseline Characteristics of Study Population
Outcomes Assessed and Results
Study Quality and Comments
Seyb, 1999 USA, Chicago, University hospital November 1996 through June 1997 Prospective cohort
Inclusion criteria: Nulliparous, vertex presentation, 37-41 weeks gestation Exclusion criteria: >=41 weeks gestation, prelabor rupture of membranes, fetal growth restriction, preeclampsia, chronic hypertension, nonreassuring fetal surveillance, macrosomia, diabetes, other maternal medical condition influencing pregnancy
EIOL: N = 143 SL: N = 1124 Cervical ripening (laminaria or extraamniotic saline) used ―if indicated.‖ Ripening used in 14.7% of the EIOL group. Induction using oxytocin with or without amniotomy Characteristics: Mean maternal age, years (range) EIOL: 31.1 (17-45) SL: 28.6 (12-44) P<0.05 Caucasian, % EIOL: 86.7% SL: 61.7% (no statistical testing of difference) Mean BMI (range) EIOL: 23 (16.8-35.2) SL: 22.9 (15,7-47.2) (no statistical testing of difference) Mean gestational age, weeks (range) EIOL: 39.4 (38-40) SL: 39.2 (37-42) (no statistical testing of difference) Cervical dilation (cm) at admission EIOL group (n=142): <1—14.8% 1-2—62.7% 3-4—21.1% >=5—1.4% SL group (n=1070): <1—3.8%
Cesarean delivery 25/143 (17.5%) vs. 88/1124 (7.8%) OR 2.49 (95% CI 1.54-4.04) adjOR 1.89 (95% CI 1.12-3.18) (adjusted for other risk factors for cesarean delivery in this analysis, including maternal obesity, gestational age, birthweight > 4kg, prelabor rupture of membranes, epidural use, chorioamnionitis, and use of magnesium sulfate) Authors state that, ―Among the elective induction group, there was a significant trend toward decreasing cesarean delivery rates with advanced cervical effacement (P<.001), but not with advancing cervical dilation (P=0.98).‖ Epidural use, % EIOL: 94.4% SL: 79.4% (no statistical testing of difference) Chorioamnionitis, % EIOL: 7.0% SL: 6.3% (no statistical testing of difference) Mean birthweight, grams (range) EIOL: 3548 (2675-4700) SL: 3400 (1820-5000) P<0.05 Mean time on L&D unit in hours EIOL: 11.6 SL: 8.7 (no statistical testing of difference)
Quality: Fair Prospective cohort Spontaneous labor control group Nulliparas only Analysis considered cervical status Note that SL control group up to 42 wks of gestation Laminaria and extraamniotic saline not currently in common use for cervical ripening. Cervical status at admission/induction presented.

48
Reference
Location and/or
Setting, Year(s) of
Study, Study
Design
Study Inclusion and Exclusion Criteria
Interventions and Baseline Characteristics of Study Population
Outcomes Assessed and Results
Study Quality and Comments
1-2—32.0% 3-4—41.4% >=5—22.8% Cervical effacement at admission EIOL group (n=142): Long—18.3% 50-90%--59.9% >90%--21.8% SL group (n=1053): Long—4.7% 50-90%--22.1% >90%--73.2%
Total costs associated with hospitalization Increased by 17.4% in EIOL group compared with SL group (no absolute cost data presented)
Vahratian, 2005
USA, Delaware, single institution January 2002 to March 2004 Retrospective cohort
Inclusion: Elective induction of labor at term, nulliparous, singleton, vertex Exclusion criteria: Diabetes, hypertension, maternal medical history of cardiovascular, infectious, pulmonary, renal, mental or thyroid disorders, multiple gestation, intrauterine growth restriction, uterine bleeding, oligohydramnios, breech presentation, elective cesarean delivery, or clinically indicated induction.
EIOL vs. SL control group EIOL subdivided into 2 groups based on use of preinduction cervical ripening (EIOL-N=without cervical ripening and with ripening=EIOL-R). All preinduction cervical ripening was by Foley bulb. Authors state that preinduction cervical ripening generally used if Bishop score <6. Total population of nulliparous women included in study: N=2200 EIOL-N: n=286 EIOL-R: n=143 SL: n=1771 Characteristics: [p- values are for each EIOL group in comparison to the SL group] Maternal age, years (SD) EIOL-N: 26.3 (5.6), p<0.01 EIOL-R: 26.7 (6.4), p+0.01 SL: 25.3 (5.9)
Cesarean delivery, % EIOL-N: 16.8% EIOL-R: 41.3% SL: 13.9% Overall risk of cesarean delivery RR (EIOL-N vs. SL) 1.2 (95% CI 0.91-1.6) RR (EIOL-R vs. SL) 2.97 (95% CI 2.37-3.73) NNH=3.6 Overall adjusted risk of cesarean delivery [adjusted for maternal age, gestational age at delivery, and infant birth weight for this analysis and all subsequent adjusted RRs] RR (EIOL-N vs. SL) 1.04 (95% CI 0.79-1.37) RR (EIOL-R vs. SL) 2.41 (95% CI 1.95-2.98) Cesarean in first stage of labor, % EIOL-N: 11.2% EIOL-R: 37.1% SL: 8.6% NNH=3.5
Quality: Fair Spontaneous labor control group Retrospective cohort Nulliparous women only Cervical status at admission/induction and subgroups by use of ripening are presented Hoffman, 2006 presents information for same hospital and time period, but for multiparas only.
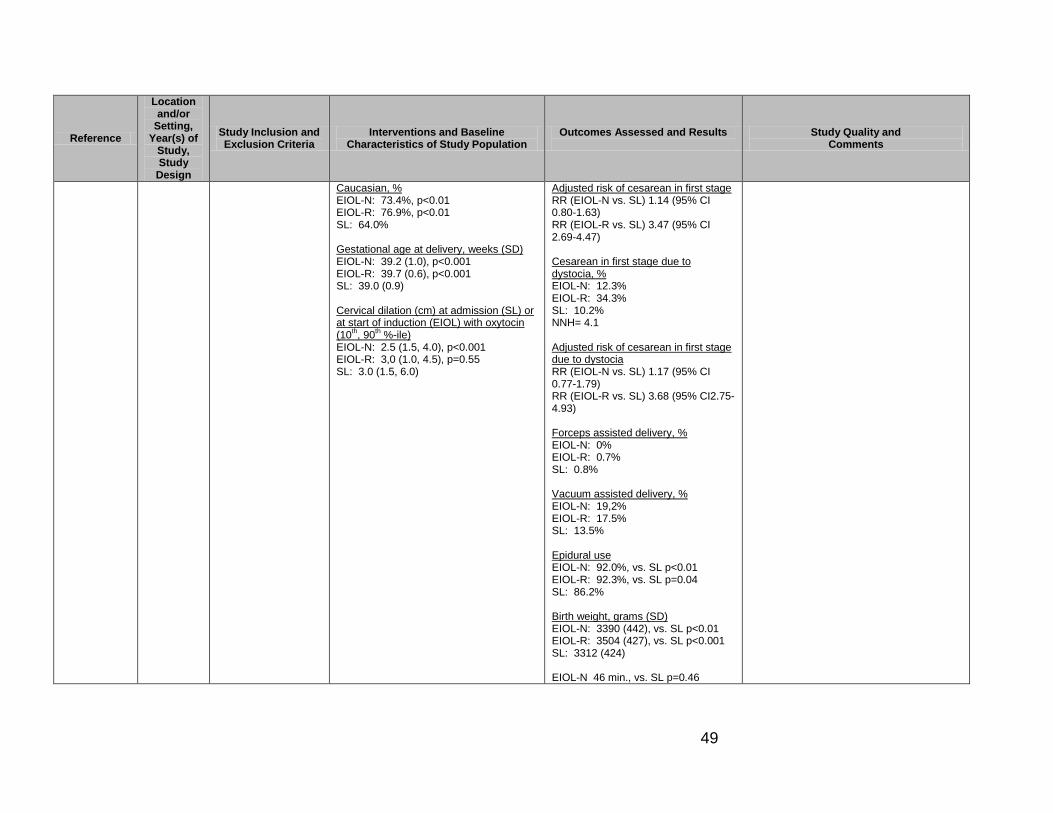
49
Reference
Location and/or
Setting, Year(s) of
Study, Study
Design
Study Inclusion and Exclusion Criteria
Interventions and Baseline Characteristics of Study Population
Outcomes Assessed and Results
Study Quality and Comments
Caucasian, % EIOL-N: 73.4%, p<0.01 EIOL-R: 76.9%, p<0.01 SL: 64.0% Gestational age at delivery, weeks (SD) EIOL-N: 39.2 (1.0), p<0.001 EIOL-R: 39.7 (0.6), p<0.001 SL: 39.0 (0.9) Cervical dilation (cm) at admission (SL) or at start of induction (EIOL) with oxytocin (10
th, 90
th %-ile)
EIOL-N: 2.5 (1.5, 4.0), p<0.001 EIOL-R: 3,0 (1.0, 4.5), p=0.55 SL: 3.0 (1.5, 6.0)
Adjusted risk of cesarean in first stage RR (EIOL-N vs. SL) 1.14 (95% CI 0.80-1.63) RR (EIOL-R vs. SL) 3.47 (95% CI 2.69-4.47) Cesarean in first stage due to dystocia, % EIOL-N: 12.3% EIOL-R: 34.3% SL: 10.2% NNH= 4.1 Adjusted risk of cesarean in first stage due to dystocia RR (EIOL-N vs. SL) 1.17 (95% CI 0.77-1.79) RR (EIOL-R vs. SL) 3.68 (95% CI2.75-4.93) Forceps assisted delivery, % EIOL-N: 0% EIOL-R: 0.7% SL: 0.8% Vacuum assisted delivery, % EIOL-N: 19,2% EIOL-R: 17.5% SL: 13.5% Epidural use EIOL-N: 92.0%, vs. SL p<0.01 EIOL-R: 92.3%, vs. SL p=0.04 SL: 86.2% Birth weight, grams (SD) EIOL-N: 3390 (442), vs. SL p<0.01 EIOL-R: 3504 (427), vs. SL p<0.001 SL: 3312 (424) EIOL-N 46 min., vs. SL p=0.46

50
Reference
Location and/or
Setting, Year(s) of
Study, Study
Design
Study Inclusion and Exclusion Criteria
Interventions and Baseline Characteristics of Study Population
Outcomes Assessed and Results
Study Quality and Comments
Median duration first stage labor (cervical dilation from 4cm to 10cm), minutes EIOL-N 266 min., vs. SL p<0.01 EIOL-R 439 min., vs. SL p=0.02 SL 358 min. Median duration second stage labor, minutes EIOL-R 45 min., vs. SL p=0.46 SL 49 min. Birth weight over 4kg, % EIOL-N: 10.1%, vs. SL p=0.001 EIOL-R: 14.0%, vs. SL p<0.001 SL: 5.2%
Table Abbreviations: AFI--amniotic fluid index; AROM--artificial rupture of membranes; CS--cesarean section; cm—centimeter; EIOL--elective induction of labor; EIOL--N-elective induction of labor without cervical ripening; EIOL-R—elective induction of labor with cervical ripening prior to induction; kg—kilogram; SL--spontaneous labor; SVD--spontaneous vaginal delivery; OVD--operative vaginal delivery (vacuum extraction or forceps); EFM--electronic fetal heart rate monitoring; SD--standard deviation; NA--not applicable; NICU--neonatal intensive care unit; NR--not reported; ns--not statistically significant; NST--non-stress test

51
Appendix D. Summary of Quality Improvement/Guideline Implementation Studies: Elective Induction of Labor
Reference
Location, Setting, Years of Study,
Study Design
Characteristics of Study Population
Quality Improvement Intervention or Guideline
Outcomes Assessed and Results
Comments
Fisch, 2009 Magee Women’s Hospital, Pittsburg, PA T1: June-Aug 2004 T2: June-Aug 2005 T3: Nov 2006-Dec 2007 Retrospective before-after case series
Total deliveries T1: 2139 T2: 2260 T3: 10,895 Total inductions T1: 533 T2: 454 T3: 1806 Total elective inductions T1: 195 T2: 211 T3: 700 Characteristics of all births at hospital (characteristics of induction populations only not reported) Mean maternal age, years T1: 30 T2: 30 T3: 29 Caucasian race, % T1: 76.2% T2: 76.5% T3: 72.8% Nulliparity, % T1: 44.3% T2: 43.2% T3: 45.0% Public payor status, % T1: 22.5% T2: 20.6% T3: 13.7%
3 month time periods from June-August 2004 (T1) and June-August 2005 (T2) were used as baseline time periods. The induction guidelines were put into place in the autumn of 2006 and the 13 month period from November 2006 to December 2007 (T3) served as the comparison time period. Data collected: EGA, stated reason for induction, inducing physician, gravidity, parity, Bishop score, and delivery outcome. Elective inductions defined as inductions without a medical or obstetric indication (e.g. history of rapid labor, advanced cervical dilation, ―post-term‖ induction at less than 41 0/7 weeks). Cervical ripening, when needed for indicated inductions, used prostaglandin E2 gel, Foley bulb or misoprostol 25 ug vaginally, Cervical ripening not allowed for EIOL. Inductions used standard institutional oxytocin protocol. EIOL guidelines:
Only after 39 wks. EGA, with accurate dating;
Bishop score >=8 for nulliparas;
Bishop score >=6 for multiparas;
No use of cervical ripening agents for EIOL
Induction guidelines implemented immediately before T1. Results of audit at T1 and T2 shared via physician champion. Induction scheduling process changed at start of T3. Criteria for EIOL remained the same, but were strictly enforced.
EIOL rate, % (EIOL/total deliveries) T1: 9.1% T2: 9.3% T3: 6.4% T1 vs. T2 , p=0.42; T1 vs. T3, p<0.001 T1 vs. T3: OR 0.68 (95% CI 0.58-0.81) EIOL at <39 wks EGA, % (EIOL<39wks/total deliveries) T1: 11.8% T2: 10.0% T3: 4.3% T1 vs. T2, p=0.56; T1 vs. T3, p=<0.001 T1 vs. T3: OR 0.33 (95% CI 0.18-0.62) Cesarean delivery rate for nulliparas undergoing EIOL, % T1: 34.5% T2: 15.2% T3: 13.8% T1 vs. T3: OR 0.3 (95% CI 0.1-0.9), NNT=4.8

52
Reference
Location, Setting, Years of Study,
Study Design
Characteristics of Study Population
Quality Improvement Intervention or Guideline
Outcomes Assessed and Results
Comments
Smoking during pregnancy, % T1: 17.0% T2: 10.3% T3: 16.3% Preeclampsia T1: 6.1% T2: 6.5% T3: 6.0% Maternal diabetes T1: 4.3% T2: 4.0% T3: 4.9%
Number of EIOL ―slots‖ on schedule reduced from 13 to 8. EIOL could not be scheduled more than 1 wk. in advance. Process improvement team reviewed EIOL cases which did not meet criteria. Responsible physicians were contacted and guidelines/policy reviewed. Peer review performed and letters sent to physicians who did not follow guidelines, becoming part of permanent recredentialing file. If criteria for IOL < 39 wks. EGA not met, but physician feels there is risk of continuing pregnancy outweighing risk there is an appeal process.
LeRay, 2007 France, 138 hospital maternity units June 2001 – May 2002
Population of 5046 women, 319 with EIOL and 4727 with SL. Comparison of EIOL which followed or did not follow national guideline. This population was originally the control group for a prospective observational study of breech delivery. Original inclusion criteria included: cephalic presentation, singleton. Further inclusion criteria for this post hoc analysis related to guidelines included: >=37 wks and <41 wks EGA, no prior uterine scars, birth weight >+2500g and <4500g, no medical reason for induction
French national consensus conference guideline (1995) for EIOL include:
>=39 wks. EGA with certain dating
Bishop score >=5
Use of oxytocin and/or AROM only for induction without any use of cervical ripening agents
Risk of cesarean delivery after EIOL if guidelines not followed, compared to SL adjOR 3.2 (95% CI 1.0-10.2) Risk of cesarean delivery after EIOL if guidelines followed, compared to SL adjOR 0.8 (95% CI 0.2-2.6) Risk of cesarean after induction when guidelines not followed for whole population, nulliparas and multiparas, compared to SL OR 1.3 (95% CI 0.5-3.7) Risk of cesarean after induction when guidelines followed for whole population, nulliparas and multiparas,compared to SL OR 0.9 (95% CI 0.5-1.8) Risk of cesarean after induction when guidelines not followed for nulliparas, compared to SL OR 3.2 (95% CI 1.0-9.7) Risk of cesarean after induction when guidelines followed for nulliparas, compared to SL OR 0.8 (95% CI 0.2-2.5)
Guideline consensus conference publication: Conference de consensus sur le déclenchement de l’accouchement. Organisé par le college des Gynaécologues Obstétriciens Français J Gynécol Obstet Biol Reprod 1995; 24(Supplément 1).

53
Reference
Location, Setting, Years of Study,
Study Design
Characteristics of Study Population
Quality Improvement Intervention or Guideline
Outcomes Assessed and Results
Comments
Risk of cesarean after induction when Bishop score <5 compared to SL OR 2.9 (95% CI 1.0-8.4) Risk of cesarean after induction at 37 weeks compared to SL OR 1.8 (95% CI 0.2-13.9) Risk of cesarean after induction at 38-39 weeks compared to SL OR 1.0 (95% CI 0.5-1.7)
Oshiro, 2009 Intermountain Healthcare, Utah and Idaho 9 urban hospitals within the 21 hospital IHC system. Specific hospitals not given. Retrospective before-after case series comparing T1: 1999-2000 and T2: July 2001 – June 2006
General demographics of IHC patient population (not specific to EIOL population): Average annual deliveries T1: 11,813 T2: 16,337 p<0.001 Average maternal age, years T1: 26.4 T2: 26.9 p<0.001 Caucasian, % T1: 83.3% T2: 85.4% P=0.001 Nulliparous, % T1: 38.2% T2: 37.6% p=0.34
Quality improvement program started January 2001. Project implementation had two phases. First phase (starting July 2001) required physicians to obtain permission of unit director or consulting perinatologist prior to induction for a woman at less than 39 weeks EGA. Second phase (starting January 2004), required physicians to additionally provide a clinical reason for EIOL for women with Bishop score of <10. Data collected for performance monitoring and peer review. IHC EIOL Guidelines [from Clinican Update, 2007]:
No contraindication to labor
>=39 wks. EGA
Bishop score >=10 for nulliparas and >=8 for multiparas
No preinduction cervical ripening with prostaglandins or other agents
No use of amniocentesis to assess fetal lung maturity for purely elective induction
Annual % EIOL at <39 wks EGA [data from Oshiro 2009 paper] 2002: 25.7% 2007: 20.5% EIOL at <39 wks. EGA, % [data from Commonwealth Case Report] January 2001: 27% July 2002: 6% Report states that decrease was sustained during 2003 and the goal of 5% was reached by first half of 2004. Annual EIOL rate, all women, at <39 wks. EGA, % {data from IHC Clinican Update 2007] 1999: 28% 2007: 3.4% EIOL, nulliparas, with Bishop score<10, % [data from Commonwealth Case Report] January 2001: 15% June 2004: 6% Cesarean delivery after EIOL, nulliparas, 2001-2006, by Bishop score, % [data from IHC Clinician Guideline Update, 2007] Bishop=1: 51.4% Bishop=4: 26.3%
Most of data presented in paper mixed elective cesarean and elective induction. Additional data retrieved from Commonwealth Fund report on IHC EIOL quality improvement project and IHC clinician and patient education brochures. URLs for each document below: Commonwealth Fund Case Report http://www.commonwealthfund.org/Content/Innovations/Case-Studies/2004/Nov/Reducing-Inappropriate-Induction-of-Labor--Case-Study-of-Intermountain-Health-Care.aspx IHC Clinician Guideline Update 2007 Document https://kr.ihc.com/ext/Dcmnt?ncid=51061830 IHC Patient Education Brochure https://kr.ihc.com/ext/Dcmnt?ncid=51061832 IHC patient education brochure reprinted in Appendix E of this report.
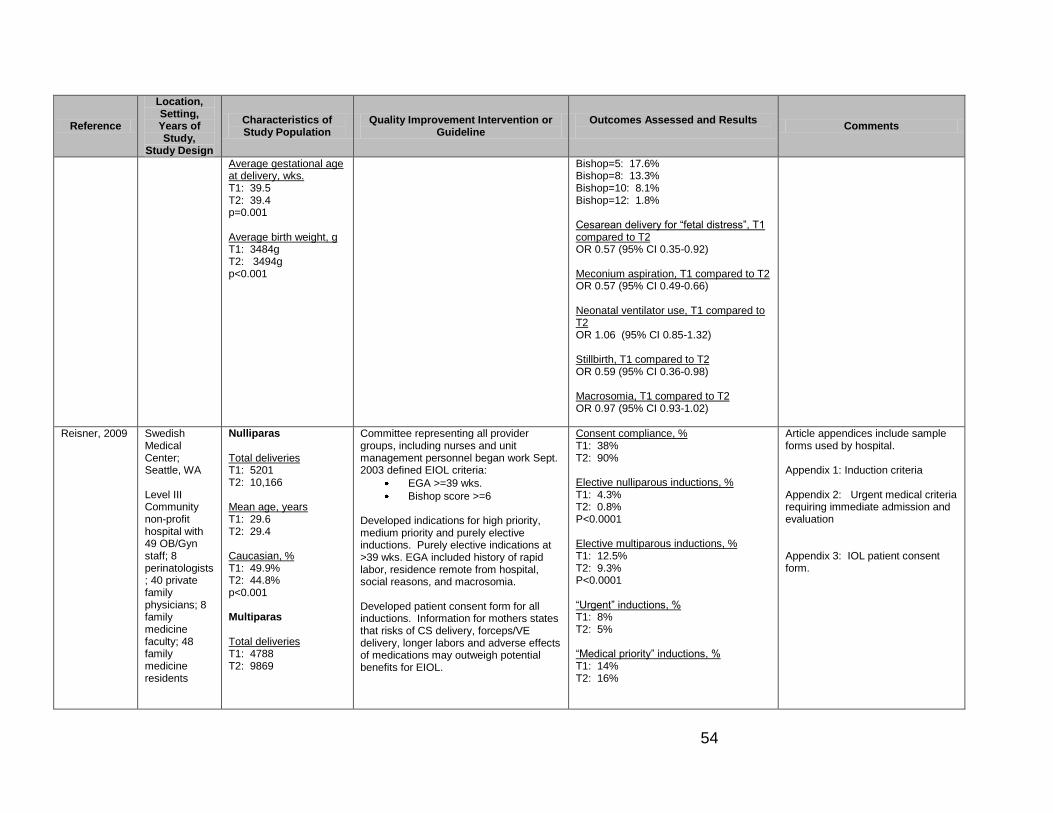
54
Reference
Location, Setting, Years of Study,
Study Design
Characteristics of Study Population
Quality Improvement Intervention or Guideline
Outcomes Assessed and Results
Comments
Average gestational age at delivery, wks. T1: 39.5 T2: 39.4 p=0.001 Average birth weight, g T1: 3484g T2: 3494g p<0.001
Bishop=5: 17.6% Bishop=8: 13.3% Bishop=10: 8.1% Bishop=12: 1.8% Cesarean delivery for ―fetal distress‖, T1 compared to T2 OR 0.57 (95% CI 0.35-0.92) Meconium aspiration, T1 compared to T2 OR 0.57 (95% CI 0.49-0.66) Neonatal ventilator use, T1 compared to T2 OR 1.06 (95% CI 0.85-1.32) Stillbirth, T1 compared to T2 OR 0.59 (95% CI 0.36-0.98) Macrosomia, T1 compared to T2 OR 0.97 (95% CI 0.93-1.02)
Reisner, 2009 Swedish Medical Center; Seattle, WA Level III Community non-profit hospital with 49 OB/Gyn staff; 8 perinatologists; 40 private family physicians; 8 family medicine faculty; 48 family medicine residents
Nulliparas Total deliveries T1: 5201 T2: 10,166 Mean age, years T1: 29.6 T2: 29.4 Caucasian, % T1: 49.9% T2: 44.8% p<0.001 Multiparas Total deliveries T1: 4788 T2: 9869
Committee representing all provider groups, including nurses and unit management personnel began work Sept. 2003 defined EIOL criteria:
EGA >=39 wks.
Bishop score >=6 Developed indications for high priority, medium priority and purely elective inductions. Purely elective indications at >39 wks. EGA included history of rapid labor, residence remote from hospital, social reasons, and macrosomia. Developed patient consent form for all inductions. Information for mothers states that risks of CS delivery, forceps/VE delivery, longer labors and adverse effects of medications may outweigh potential benefits for EIOL.
Consent compliance, % T1: 38% T2: 90% Elective nulliparous inductions, % T1: 4.3% T2: 0.8% P<0.0001 Elective multiparous inductions, % T1: 12.5% T2: 9.3% P<0.0001 ―Urgent‖ inductions, % T1: 8% T2: 5% ―Medical priority‖ inductions, % T1: 14% T2: 16%
Article appendices include sample forms used by hospital. Appendix 1: Induction criteria Appendix 2: Urgent medical criteria requiring immediate admission and evaluation Appendix 3: IOL patient consent form.

55
Reference
Location, Setting, Years of Study,
Study Design
Characteristics of Study Population
Quality Improvement Intervention or Guideline
Outcomes Assessed and Results
Comments
T1: Mar 2002-Feb 2004 (24 mo) T2: Mar 2004-Dec 2007 (45 mo.) Retrospective before-after case series
Mean age, years T1: 31.7 T2: 31.7 Caucasian, % T1: 48.4% T2: 42.8% p<0.001
QI committee tracked consent compliance, induction rates, length of stay, and mode of delivery on quarterly basis. Goal was to reduce elective nulliparous inductions from about 5% to less than 2% and multiparous elective inductions from about 13% to less than 10%.
Unplanned primary cesarean birth for nulliparas, all inductions vs. spontaneously laboring during T2 30.4% vs. 17.2% RR 1.77 (95% CI 1.64-1.91) NNH=7.5 [during T1 proportions of unplanned cesarean births for induced vs. spontaneously laboring groups of nulliparas were similar: 31.2% vs. 17.2%] Unplanned primary cesarean birth for nulliparas with EIOL, T1 vs. T2 26.9% vs. 17.9% RR 0.66 (95% CI 0.4-1.1) Unplanned primary cesarean birth for multiparas, all inductions vs. spontaneously laboring during T2 T1: 4.5% T2: 3.0% RR 1.52 (95% CI 1.21-1.91) Unplanned primary cesarean birth for multiparas with EIOL, T1 vs. T2 4.0% vs. 1.9% RR 0.47 (95% CI 0.25-0.87) Hours on L&D, during T2, induced vs. spontaneously laboring Nulliparas: 9.6 vs. 14.8 Multiparas: 9.0 vs. 5.0

56
Appendix E. Relevant Codes
CODES DESCRIPTION
ICD-9 Diagnosis Codes
650 Normal delivery
659.0 Failed mechanical induction
659.1 Failed medical or unspecified induction
V22.0 Supervision of normal first pregnancy
V22.1 Supervision of other normal pregnancy
V22.2 Pregnant state, incidental
V30 Single liveborn
V39 Liveborn unspecified whether single twin or multiple
ICD-10
O80 Single spontaneous delivery
Z34.0 Supervision of normal first pregnancy
Z34.8 Supervision of other normal pregnancy
Z34.9 Supervision of normal pregnancy, unspecified
ICD-9 Volume 3 (procedure codes)
Other procedures inducing or assisting delivery
73.0 Artificial rupture of membranes
73.1 Other surgical induction of labor: Induction by cervical dilation
73.4 Medical induction of labor
Forceps, vacuum, and breech delivery
72.0 – 72.9
Forceps, vacuum, and breach delivery
Cesarean section and removal of fetus
74.0 – 74.4, 74.9
Cesarean section and removal of fetus
CPT
Dilation
57800 Dilation of cervical canal, instrumental (separate procedure)
59200 Insertion of cervical dilator (e.g., laminaria, prostaglandin) (separate procedure)
Infusions
96365 Intravenous infusion for therapy, prophylaxis, or diagnosis; initial, up to 1 hour
96366 Intravenous infusion for therapy, prophylaxis, or diagnosis; each additional hour
96367 Each additional sequential infusion up to 1 hour
96368 Concurrent infusion
Care associated with vaginal delivery
59400 Routine obstetric care including antepartum care, vaginal delivery (with or without episiotomy, and/or forceps) and postpartum care
59409 Vaginal delivery only, with or without postpartum care
59610 Routine obstetric care including antepartum care, vaginal delivery (with or without episiotomy, and/or forceps) and postpartum care, after previous cesarean delivery

57
59612, 59614
Vaginal delivery only, after previous cesarean delivery
Care associated with Cesarean
59510 Routine Obstetric care including antepartum care, Cesarean delivery, and postpartum care
59514 Cesarean Delivery only
59515
Cesarean Delivery only, including postpartum care59618: Routine Obstetric care including antepartum care, Cesarean delivery, and postpartum care, following attempted vaginal delivery after previous cesarean delivery
59620 Cesarean Delivery only, following attempted vaginal delivery after previous Cesarean delivery.
59622 Cesarean Delivery only, following attempted vaginal delivery after previous Cesarean delivery. Including postpartum care
HCPCS Level II Codes
J2590 Pitocin 10 units. [NOTE: Appears in a listing of ―Drugs Administered Other Than Oral Method J0000-J9999.‖]
S0191 Misoprostol, oral, 200 mcg [NOTE: Appears in a listing of Temporary National Codes (Non-Medicare), S0012-S9999)

58
References Amano, K., Saito, K., Shoda, T., Tani, A., & Yoshihara, H. (1999). Elective induction of
labor at 39 weeks of gestation: a prospective randomized trial. Journal of Obstetrics and Gynaecological Research, 25(1), 33-37.
American College of Obstetrics and Gynecology (ACOG). (2004). Management of postterm pregnancy. ACOG Practice Bulletin No. 55. American College of Obstetricians and Gynecologists. Obstetrics & Gynecology, 104, 639-46. (reaffirmed 2009)
American College of Obstetrics and Gynecology (ACOG). (2009). Induction of labor. ACOG Practice Bulletin No. 107, American College of Obstetricians and Gynecologists. Obstetrics & Gynecology, 114, 386-97.
Breart, G., Goujard, J., Maillard, F., Chavigny, C., Rumeau-Rouquette, C., & Sureau, C. (1982). Comparison of two obstetrical policies with regard to artificial induction of labour at term. A randomized trial. Journal de Gynecologie, Obstetrique et Biologie de la Reproduction, 11, 107-112.
Cammu, H., Martens, G., Ruyssinck, G., & Amy, J-J. (2002). Outcome after elective labor induction in nulliparous women: a matched cohort study. American Journal of Obstetrics and Gynecology, 186, 240-244.
Caughey, A.B., Sundaram, V., Kaimal, A.J., Cheng, Y.W., Gienger, A., Little, S.E., et al. (2009a). Maternal and Neonatal Outcomes of Elective Induction of Labor. Evidence Report/Technology Assessment No. 176. (Prepared by the Stanford University-UCSF Evidenced-based Practice Center under contract No. 290-02-0017.) AHRQ Publication No. 09-E005. Rockville, MD: Agency for Healthcare Research and Quality.
Caughey, A.B., Sundaram, V., Kaimal, A.J., Gienger, A., Cheng, Y.W., McDonald, K.M., et al. (2009b). Systematic Review: Elective Induction of Labor Versus Expectant Management of Pregnancy. Annals of Internal Medicine, 151(4), 252-263.
Childbirth Connection. (2009). Updated Table 2 (2009): Performance on Selected Indicators of Maternal and Newborn Health, by State, 2003 and 2006. Update to Corry, 2008 reference. Retrieved April 30, 2010, from http://www.childbirthconnection.org/pdfs/State-Level-Maternity-Care-Statistics.pdf
Clark, S.L., Miller, D.D., Belfort, M.A., Dildy, G.A., Frye, D.K., & Meyers, J.A. (2009). Neonatal and maternal outcomes associated with elective term delivery. American Journal of Obstetrics and Gynecology, 200, 156e1-156e4.
Cole, R.A., Howie, P.W., & MacNaughton, M.C. (1975). Elective induction of labour. A randomized prospective trial. Lancet, 1, 767-770.

59
The Commonwealth Fund. (2004, November 19).Reducing Inappropriate Induction of Labor: Case Study of Intermountain Health Care. Retrieved March 20, 2010, from http://www.commonwealthfund.org/Conten t/Innovations/Case-Studies/2004/Nov/Reducing-Inappropriate-Induction-of-Labor--Case-Study-of-Intermountain-Health-Care.aspx
Corry, M.P., & Sakala, C. (2008). Evidence-based Maternity Care: What It Is and What It Can Achieve. New York: The Milbank Memorial Fund. Produced in collaboration with Childbirth Connection and The Reforming States Group. 115 pages. ISBN 978-1-887748-70-4. Retrieved April 20, 2010, from http://www.milbank.org/reports/0809MaternityCare/0809 MaternityCare.pdf
Crane, J. (2001). Induction of labour at term. SOGC Clinical Practice Guideline No. 107. Journal of Obstetrics and Gynaecology Canada, August, 1-12.
Declercq, E.R., Sakala, C., Corry, M.P., & Applebaum, S. (2006). Listening to Mothers II: Report of the Second National U.S. Survey of Women’s Childbearing Experiences. New York: Childbirth Connection. Retrieved April 20, 2010, from http://www.childbirthconnection.com/pdfs/LTMII_report.pdf
Delaney, M., & Roggensack, A. (2008). Guidelines for the Management of Pregnancy at 41+0 to 42+0 Weeks. SOGC Clinical Practice Guideline No. 214, September 2008. Journal of Obstetrics and Gynaecology Canada, 30(9), 800-810.
The Department of Veterans Affairs and Department of Defense (VA/DoD). (2009). Management of Pregnancy. Washington, DC: Department of Veterans Affairs and Department of Defense.
Dunne, C., Da Silva, O., Schmidt, G., & Natale, R. (2009). Outcomes of elective labour induction and elective caesarean section in low-risk pregnancies between 37 and 41 weeks’ gestation. Journal of Obstetrics and Gynaecology Canada, December, 1124-1130.
Durham, L., Veltman, L., Davis, P., Ferguson, L., Hacker, M., Hooker, D., et al. (2008). Standardizing criteria for scheduling elective labor inductions. Maternal and Child Nursing, 33(3), 159-165.
Egarter, C.H., Kofler, E., Fitz, R., & Husslein, P. (1989). Is induction of labour indicated in prolonged pregnancy? Results of a prospective randomized trial. Gynecologic and Obstetric Investigation, 27, 6-9.
Engle, W.A., & Kominiarek, M.A. (2008). Late preterm infants, early term infants, and timing of elective deliveries. Clinics in Perinatology, 35, 325-341.
Fisch, J.M., English, D., Pedaline, S., Brooks, K., & Simhan, H.N. (2009). Labor induction process improvement: a patient quality-of-care initiative. Obstetrics & Gynecology, 113(4), 797-803.

60
Glantz, J.C. (2005). Elective induction vs. spontaneous labor: associations and outcomes. Journal of Reproductive Medicine, 50, 235-240.
Goldenberg ,R.L., McClure, E.M., Bhattacharya, A., Groat, R.D., & Stahl, P.J. (2009). Women’s perceptions regarding the safety of births at various gestational ages. Obstetrics & Gynecology, 114(6), 1254-1258.
Grobman, W.A. (2007). Elective Induction: When? Ever? Clinical Obstetrics and Gynecology, 50(2), 537–46.
Gülmezoglu, A.M., Crowther, C.A., & Middleton, P. ( 2006). Induction of labour for improving birth outcomes for women at or beyond term. Cochrane Database of Systematic Reviews, Issue 4. Art. No.: CD004945. DOI: 10.1002/14651858.CD004945.pub2.
Hamilton, B.E., Martin, J.A., & Ventura, S.J. (2009, March 18). Births: Preliminary data for 2007. National vital statistics reports, Web release; vol 57 no 12. Hyattsville, MD: National Center for Health Statistics.
Hoffman, M.K., Vahratian, A., Sciscione, A.C., Troendle, J.F., & Zhang, J. (2006). Comparison of labor progression between induced and noninduced multiparous women. Obstetrics & Gynecology, 10, 1029-1034.
Intermountain Health Care (IHC). (2007a). Elective Labor Induction: When is it okay? (Patient Education Brochure), Updated 2007. Salt Lake City: Intermountain Healthcare. Publication No. IHCEDCPM002 - 8/07 . Retrieved March 20, 2010 from https://kr.ihc.com/ext/Dcmnt ?ncid=51061832
Intermountain Health Care (IHC). (2007b). Management of Elective Labor Induction, 2007 Update. Care Process Model (Clinician Guideline Update). Salt Lake City: Intermountain Healthcare. Publication No. IHCEDWN002 7/07. Retrieved March 20, 2010, from https://kr.ihc.com /ext/Dcmnt?ncid=51061830
The Joint Commission. (2009). The Specifications Manual for Joint Commission National Quality Core Measures. Version 2010A, October, 2009. Perinatal Care Measure specifications. Retrieved April 5, 2010, from http://manual.jointcommission.org/releases/TJC2010A/rsrc/Manual/TableOfContentsTJC/Perinatal_Care_v2010A2.pdf
Koopmans, C.M., Bijlenga, D., Groen, H., Aarnoudse, J.G., Bekedam, D.J., van den Berg, P.P., et al. (2009). Induction of labour versus expectant monitoring for gestational hypertension or mild pre-eclampsia after 36 weeks’ gestation (HYPITAT): a multicentre, open-label randomized controlled trial. Lancet, 374, 979-987.
LeRay, C., Carayol, M., Bréart,, & Gorrinet, F. (2007). Elective induction of labor: failure to follow guidelines and risk of cesarean delivery. Acta Obstetricia et Gynecologica Scandinavica, 86, 657-665.

61
Luthy, D.A., Malmgren, J.A., & Zingheim, R.W. (2004). Cesarean delivery after elective induction in nulliparous women: The physician effect. American Journal of Obstetrics and Gynecology, 191, 1511-1515.
Lydon-Rochelle, M.T., Holt, V.L., Nelson, J.C., Cardnas, V., Gardella, C., et al. (2005). Accuracy of reporting maternal in-hospital diagnoses and intrapartum procedures in Washing state linked birth records. Paediatric and Perinatal Epidemiology, 19(6), 460-71.
MacDorman, M.F., Mathews, T.J., Martin, J.A., & Malloy, M.H. (2002). Trends and characteristics of induced labour in the United States, 1989-1998. Paediatric and Perinatal Epidemiology, 16, 263-273.
Main, E.K. (2009). New perinatal quality measures from the National Quality Forum, the Joint Commission and the Leapfrog Group. Current Opinion in Obstetrics and Gynecology, 21, 532-540.
Martin, J.A., Hamilton, B.E., Sutton, P.D., Ventura, S.J., et al. (2009). Births: Final data for 2006. National vital statistics reports; vol 57 no 7. Hyattsville, MD: National Center for Health Statistics.
Martin, J.A., Hamilton, B.E., Sutton, P.D., Ventura, S.J., Menacker, F., & Kirmeyer, S. (2006). Births: final data for 2004. National Vital Statistics Reports, 55(1), 1-101.
Moore, L.E., & Rayburn ,W.F. (2006). Elective induction of labor. Clinical Obstetrics and Gynecology, 49(3), 698-704.
Mozurkewich, E., Chilimigras, J., Koepke, E., Keeton, K., & King, V.J. (2009). Indications for induction of labour: a best-evidence review. British Journal of Obstetrics and Gynecology, 116, 626-636.
National Collaborating Center for Women’s and Children’s Health. (2008, July). Induction of labour. Commissioned by the National Institute for Health and Clinical Excellence (NICE). London: RCOG Press.
National Institute for Health and Clinical Excellence. (2009). The guidelines manual. London: National Institute for Health and Clinical Excellence. Retrieved October 4, 2010, from http://www.nice.org.uk/media/5F2/44/The_guidelines_manual_2009_-_All_chapters.pdf
National Quality Forum. (2008). NQF-endorsed measure #0469: Elective delivery prior to 39 completed weeks gestation. Retrieved April 5, 2010, from http://www.qualityforum.org/Measures_List.aspx#p=1&k=elective %2520delivery&e=1&st=&sd=&s=
Oshiro, B.T., Henry, E., Wilson, J., Branch, D.W., & Varner, M.W. (2009). Decreasing elective deliveries before 39 weeks of gestation in an integrated health care system. Obstetrics & Gynecology, 113, 804-811.
62
Ramsey, P.S., Ramin, K.D., & Ramin, S.M. (2000). Labor induction. Obstetrics & Gynecology, 12, 463-473.
Reisner, D.P., Wallin, T.K., Zinghelm, R.W., & Luthy, D.A. (2009). Reduction of elective inductions in a large community hospital. American Journal of Obstetrics and Gynecology, 200, e1-e7.
Scottish Intercollegiate Guidelines Network (SIGN). (2008). SIGN 50: A guideline developer’s handbook. Edinburgh: Scottish Intercollegiate Guidelines Network. Retrieved October 4, 2010, from http://www.sign.ac.uk/pdf/sign50.pdf
Seyb, S.T., Berka, R.J., Socol, M.L.,& Dooley, S.L. (1999). Risk of cesarean delivery with elective induction of labor at term in nulliparous women. Obstetrics & Gynecology, 94(4), 600-607.
Simpson, K.R. & Atterbury, J. (2003). Trends and issues in labor induction in the United States: Implications for clinical practice. Journal of Obstetrics, Gynecology & Neonatal Nursing, 32, 767-779.
The AGREE Collaborative. (2003). Development and validation of an international appraisal instrument for assessing the quality of clinical practice guidelines: The AGREE project. Quality and Safety in Health Care, 12, 18-23. Retrieved October 4, 2010, from http://www.agreetrust.org/home/
Tylleskar, J., Finnstrom, O., Heijon, I., Hedenskog, S., & Ryden, G. (1979). Spontaneous labor and elective induction – a prospective randomized study. Effects on mother and fetus. Acta Obstetricia et Gynecologica Scandinavica, 58, 513-518.
Vahratian, A., Zhang, J., Troendle, J.F., Sciscione, A.C., & Hoffman, M.K. (2005). Labor progression and risk of cesarean delivery in electively induced nulliparas. Obstetrics & Gynecology, 105(4), 698-704.
Wennerholm, U., Hagberg, H., Brorsson, B., & Bergh, C. (2009). Induction of labor versus expectant management for post-date pregnancy: Is there sufficient evidence for a change in clinical practice? Acta Obstetricia et Gynecologica Scandinavica, 88, 6-17.
Yasmeen, S., Romano, P.S., Schembri, M.E., Keyzer, J.M., & Gilbert, W.M. Accuracy of obstetric diagnoses and procedures in hospital surcharge data. American Journal of Obstetrics and Gynecology, 194(4), 992-1001.
Zhang, J., Yancey, M.K., & Henderson, C.E. (2002). U.S. National trends in labor induction, 1989-1998. Journal of Reproductive Medicine, 47, 120-124.
Zollinger, T.W., Przybyiski, M.J., & Gamache, R.E. (2006). Reliability of Indiana birth certificate data compared to medical records. Annals of Epidemiology, 16(1), 1-10.