mediated by PD-1/PD-L1 blockade Contribution of NK cells ...Contribution of NK cells to...
16
Contribution of NK cells to immunotherapy mediated by PD-1/PD-L1 blockade Joy Hsu, … , David H. Raulet, Michele Ardolino J Clin Invest. 2018; 128(10):4654-4668. https://doi.org/10.1172/JCI99317. Graphical abstract Research Article Immunology Find the latest version: http://jci.me/99317/pdf
Transcript of mediated by PD-1/PD-L1 blockade Contribution of NK cells ...Contribution of NK cells to...

Contribution of NK cells to immunotherapymediated by PD-1/PD-L1 blockade
Joy Hsu, … , David H. Raulet, Michele Ardolino
J Clin Invest. 2018;128(10):4654-4668. https://doi.org/10.1172/JCI99317.
Graphical abstract
Research Article Immunology
Find the latest version:
http://jci.me/99317/pdf
The Journal of Clinical Investigation R E S E A R C H A R T I C L E
4 6 5 4 jci.org Volume 128 Number 10 October 2018
IntroductionImmunotherapy targeting the PD-1/PD-L1 inhibitory axis has produced spectacular results in the treatment of a wide variety of tumors (1–9). The current paradigm dictates that CD8+ T cells are inhibited by PD-1, and it is widely accepted that checkpoint blockade unleashes T cells to attack tumor cells. However, many cancer types exhibit a high incidence of MHC loss and/or low neo-antigen burden (10, 11), which should render tumor cells refrac-tory to recognition by CD8+ T cells. High levels of PD-L1 expres-sion have been observed in tumors with low MHC I expression (12–18). Interestingly, some of these cancer types are responsive to PD-1/PD-L1 blockade. An example is Hodgkin’s lymphoma (12, 13), in which genes encoding PD-L1 are amplified. Interestingly, in Hodgkin’s lymphoma, PD-L1 upregulation was predictive of a poor outcome even when the tumor cells were defective in MHC I
expression (19). These findings suggest the existence of immune responses that are independent of cytotoxic T cells, inhibited by PD-1, and rescued by PD-1 blockade.
NK cells are innate lymphocytes with cytotoxic activity against cancer cells that also orchestrate the immune response by releas-ing cytokines and chemokines (20). NK cells participate in the immune response against solid and hematopoietic cancers owing to their capacity to recognize molecular patterns characteristic of stressed cells (so-called missing self and induced self recogni-tion; ref. 21). NK cells mediate strong antileukemia activity when included in some allogeneic stem cell transplants (22–31), and their presence in solid tumors is a good prognostic factor (31–37). Unlike recognition by T cells, recognition by NK cells does not require that cancer cells express neoantigens or overexpress self-antigens, and loss of MHC expression on tumor cells increases rather than decreases their susceptibility to NK cell killing (38, 39). Evidence that PD-1 can be expressed on human NK cells has recently emerged in several cancer indications, including Hodg-kin’s lymphoma (40–44), but mechanistic in vivo studies examin-ing whether and how PD-1 inhibits NK cell responses to tumors and whether PD-1/PD-L1 blockade mobilizes NK cell responses are still lacking.
Here, we investigated whether the therapeutic effect of PD-1 and PD-L1 blockade relies on the antitumor activity of NK cells. Using several cancer mouse models, we found that activated NK cells express PD-1 and that PD-1 engagement by PD-L1+ tumor cells potently suppresses NK cell–mediated immunity to tumors. Releasing PD-1–imposed inhibition through blockade of PD-1 or
Checkpoint blockade immunotherapy targeting the PD-1/PD-L1 inhibitory axis has produced remarkable results in the treatment of several types of cancer. Whereas cytotoxic T cells are known to provide important antitumor effects during checkpoint blockade, certain cancers with low MHC expression are responsive to therapy, suggesting that other immune cell types may also play a role. Here, we employed several mouse models of cancer to investigate the effect of PD-1/PD-L1 blockade on NK cells, a population of cytotoxic innate lymphocytes that also mediate antitumor immunity. We discovered that PD-1 and PD-L1 blockade elicited a strong NK cell response that was indispensable for the full therapeutic effect of immunotherapy. PD-1 was expressed on NK cells within transplantable, spontaneous, and genetically induced mouse tumor models, and PD-L1 expression in cancer cells resulted in reduced NK cell responses and generation of more aggressive tumors in vivo. PD-1 expression was more abundant on NK cells with an activated and more responsive phenotype and did not mark NK cells with an exhausted phenotype. These results demonstrate the importance of the PD-1/PD-L1 axis in inhibiting NK cell responses in vivo and reveal that NK cells, in addition to T cells, mediate the effect of PD-1/PD-L1 blockade immunotherapy.
Contribution of NK cells to immunotherapy mediated by PD-1/PD-L1 blockadeJoy Hsu,1 Jonathan J. Hodgins,2,3 Malvika Marathe,1 Chris J. Nicolai,1 Marie-Claude Bourgeois-Daigneault,2,3 Troy N. Trevino,1 Camillia S. Azimi,1 Amit K. Scheer,2,3 Haley E. Randolph,1 Thornton W. Thompson,1 Lily Zhang,1 Alexandre Iannello,1 Nikhita Mathur,2,3 Karen E. Jardine,2,3 Georgia A. Kirn,1 John C. Bell,2,3 Michael W. McBurney,2,3 David H. Raulet,1 and Michele Ardolino1,2,3
1Department of Molecular and Cell Biology, Immunotherapy and Vaccine Research Initiative, Cancer Research Laboratory, Division of Immunology and Pathogenesis, University of California, Berkeley,
Berkeley, California, USA. 2Department of Biochemistry, Microbiology and Immunology, University of Ottawa, Ottawa, Ontario, Canada. 3Centre for Cancer Therapeutics, Ottawa Hospital Research Institute,
Ottawa, Ontario, Canada.
Related Commentary: p. 4251
Authorship note: JH and JJH, as well as DHR and MA, contributed equally to this work.Conflict of interest: DHR is a cofounder of Dragonfly Therapeutics and served on the Sci-entific Advisory Boards of Innate Pharma, Aduro Biotech, and IGNITE Immmunotherapy; he has a financial interest in all 4 companies and received research support from Innate Pharma. JCB is a cofounder and has equity in Turnstone Biologics, from which he receives consulting fees and research support for his lab. MCBD and JCB both have patented intel-lectual properties, not related to the present article (see Supplemental Data for complete information).Submitted: December 18, 2017; Accepted: July 24, 2018.Reference information: J Clin Invest. 2018;128(10):4654–4668. https://doi.org/10.1172/JCI99317.

The Journal of Clinical Investigation R E S E A R C H A R T I C L E
4 6 5 5jci.org Volume 128 Number 10 October 2018
scenario in which tumor cells are MHC deficient, we determined whether PD-1 was expressed by and inhibited NK cells. We inject-ed RMA-S cells in syngeneic mice and analyzed PD-1 expression by flow cytometry. PD-1 was strongly upregulated on 30%–40% of NK cells infiltrating RMA-S tumors, but not in splenic NK cells (Figure 2, A and B). PD-1 expression on intratumoral NK cells was evident at the earliest time point that allowed dissection and analysis of the cells (day 7, when tumors were small, <25 mm3). NK cells in the local lymph nodes (LNs) draining the tumor, and in some cases, distant LNs, showed slight PD-1 expression at early time points and higher expression later (Figure 2A and not shown). Similar results were obtained when we analyzed NK cells infiltrat-ing tumors derived from the RMA tumor line, which is an MHC I+ version of RMA-S cells (Figure 2C). Hence, PD-1 expression by NK cells within tumors is not limited to MHC-deficient tumors.
Next, we employed another well-established tumor model based on s.c. injection of the colon carcinoma cell line CT26 in syngeneic BALB/cJ mice. Up to 60% of NK cells infiltrating CT26 tumors expressed PD-1, whereas only modest PD-1 expression was observed on NK cells from the draining LNs and no PD-1 expression was detected on splenic NK cells (Figure 2, A–C). PD-1 upregulation on NK cells was observed in numerous other tumor models, including several ectopic s.c. models and 3 spontane-ous models (Figure 2C). Interestingly, we found that PD-1 was expressed with a high degree of heterogeneity among tumor-bear-ing mice in both NK and CD8+ T cells (Figure 2C).
To study the functional effects of PD-1 engagement on NK cells, we initially used an in vitro approach. Compared with untransduced tumor cells, tumor cells transduced with PD-L1 were less effective in inducing degranulation and IFN-γ produc-tion by PD-1+ NK cells in vitro, consistent with inhibition of NK activation by PD-L1 (Figure 2, D and E). The prototypical NK-sen-sitive human target cell line K562 lacks PD-L1 and PD-L2, and the human NK cell line NK92 lacks PD-1. Cytolysis of K562 cells by NK92 cells and K562-induced degranulation of NK92 cells were significantly reduced when K562 and NK92 were transduced with PD-L1 and PD-1, respectively (Figure 2, F and G). Responses were minimally or not affected with empty vector–transduced NK92 cells or when NK92-Pdcd1 (Pdcd1 encodes PD-1) cells were stimu-lated with untransduced K562 cells, demonstrating that inhibition required both receptor expression by NK cells and ligand expres-sion by target cells. In conclusion, PD-1 is specifically upregulated by a population of NK cells in the tumor microenvironment, and it suppresses NK cell degranulation and cytotoxic functions in vitro.
PD-1 inhibits both NK- and T cell–mediated antitumor immunity. We investigated whether PD-1 suppresses NK antitumor activity in vivo. In mice implanted with 106 tumor cells, RMA-S–Pdl1 cells were much more aggressive than RMA-S cells (untransduced or transduced with an empty vector) (Figure 3A). RMA-S–Pdl1 caused fatality in approximately 90% of recipients, whereas only approxi-mately 45% of mice injected with RMA-S cells developed fatal tumors (Figure 3B). NK depletion before tumor cell implantation (Figure 3, B and C) or genetic depletion of NK cells in Rag2–/–Il2rg–/– immunodeficient mice (Figure 3D) resulted in similar growth of RMA-S and RMA-S–Pdl1 tumors and similar rapid mortality, whereas depletion of CD4+ and CD8+ T cells had no effect (Fig-ure 1, A and D). These data verify the expectation that NK cells,
PD-L1 activated an NK response that was indispensable for the full effect of PD-1/PD-L1 blockade.
ResultsNK cells participate in the therapeutic effect of PD-1/PD-L1 blockade. To study the effect of PD-1 blockade in a model in which T cells do not participate in the immune response against cancer, we took advantage of a lymphoma model based on injection of RMA-S cells, which exhibit low expression of MHC I. Tumor surveillance of RMA-S cells is strongly dependent on NK cells, but not T cells (45), as confirmed by experiments in which depletion of NK cells, but not T cells, resulted in accelerated tumor growth (Figure 1A). RMA-S cells express low levels of the PD-1 ligands PD-L1 and PD-L2, even after IFN-γ treatment in vitro (Figure 1B). Even when RMA-S cells become established tumors in syngenic mice and these tumors are evaluated as ex vivo tumor dissociates, expres-sion of PD-L1 by RMA-S cells was much lower than observed on myeloid cells in the spleen or on other tumor cells, such as the prostate adenocarcinoma line TRAMP-C2 (Figure 1C). We trans-duced RMA-S cells with Pdl1 and selected by flow cytometry cells with surface PD-L1 at levels comparable to those observed on myeloid cells in the spleen or infiltrating the tumor or to those naturally expressed by a PD-L1+ tumor cell line in vivo (TRAMP-C2 cells, Figure 1, B and C). Immunosurveillance of RMA-S–Pdl1 tumors was not mediated by T cells, but NK depletion accelerated the growth of tumor cells in vivo, showing that NK cells, but not T cells, mediate an immune response to this cell line even when PD-L1 is expressed (Figure 1D). Therefore, this represents a valu-able model for studying the effect of PD-1 blockade in a system in which a CD8+ T cell response to cancer cells is incapacitated by low MHC expression, but an NK cell response is still evident.
To investigate whether PD-1/PD-L1 blockade elicits an effec-tive response for tumors that are insensitive to CD8+ T cells, we injected RMA-S–Pdl1 cells into C57BL/6J mice and, after 2 days, treated the mice with a PD-1–blocking antibody (clone RMP1-14) (46). Mice treated just once exhibited a markedly diminished rate of tumor progression (Figure 1E). However, when mice were depleted of NK cells before tumor injection, the antibody treat-ment was completely ineffective (Figure 1E), showing that PD-1 blockade mobilized an NK cell response. Next, we allowed the RMA-S–Pdl1 tumors to progress to a volume of approximately 25 mm3 before initiating treatment. Even in this scenario, anti–PD-1 therapy significantly delayed tumor development (Figure 1F).
Compared with systemic injections, local injections of anti–PD-1 allow the use of a lower antibody dose while potentially reducing systemic side effects. To address the efficacy of intratu-moral injection of therapeutic antibodies, RMA-S–Pdl1 cells were mixed in Matrigel with control Ig, PD-1 antibody (a dose more than 10-fold lower than in the systemic injection), or PD-L1 anti-bodies and injected subcutaneously in C57BL/6J mice. Mice that received PD-1 or PD-L1 antibody in the tumor inoculum devel-oped significantly smaller tumors (Figure 1, G and H), consistent with the results obtained by injecting the antibody i.p. Collective-ly, these data show that the efficacy of PD-1 and PD-L1 blockade in MHC-deficient tumors depends on NK cell activity.
PD-1 is expressed by and inhibits NK cells. Having shown that the efficacy of PD-1 and PD-L1 blockade depends on NK cells in a

The Journal of Clinical Investigation R E S E A R C H A R T I C L E
4 6 5 6 jci.org Volume 128 Number 10 October 2018
Figure 1. Therapeutic antitumor effect of PD-1 or PD-L1 antibodies dependent on NK cells. (A) NK, CD4+, and/or CD8+ T cells were depleted before s.c. injection of 106 RMA-S cells. Tumor volumes (mean ± SEM) are shown. Experiments depicted are representative of 2 performed. n = 4–5/group. Two-way ANOVA. ***P < 0.001. (B) PD-L1 expression was analyzed on cells stimulated or not with 20 ng/ml IFN-γ for 48 hours. Experiments depicted are representative of 3 performed. (C) 2 × 10⁶ RMA-S or RMA-S–Pdl1 cells (naturally expressing CD45.2) or TRAMP-C2 cells (transduced with Thy1.1) were injected s.c. into C57BL/6J-CD45.1+ mice, and PD-L1 expression was analyzed on splenic or intratumoral cells, gating on dendritic cells (viable CD45.1+CD3–
CD19–Ter119–NK1.1–CD11b+Ly6G–CD11chi), monocytes (viable CD45.1+CD3–CD19–Ter119–NK1.1–CD11b+Ly6G–CD11c–Ly6C+), and tumor cells (viable CD45.1–CD45.2+ cells for RMA-S and RMA-S–Pdl1; or viable CD45.2–Thy1.1+ cells for TRAMP-C2). The MFI of isotype control–stained cells was subtracted from the MFI of PD-L1–stained cells. Two experiments were pooled (n = 5–7/group). (D) 106 RMA-S–Pdl1 cells were injected in mice depleted of NK or CD8+ or CD4+ T cells. Tumor volumes (mean ± SEM) are shown. Experiments depicted are representative of 2 performed. n = 4–5/group. Two-way ANOVA. **P < 0.01. (E) 106 RMA-S–Pdl1 cells were injected in C57BL/6J mice, and after 2 days, 250 μg PD-1 or control antibody was administered. Some mice were depleted of NK cells 2 days before tumor cell injection. Pooled data from 2 of the 3 experiments performed are shown. n = 6–11/group. Two-way ANOVA. Both NK-depleted groups were significantly different than the corresponding undepleted groups. (F) 106 RMA-S–Pdl1 cells were injected, and tumors were allowed to grow to an average of 25 mm3, at which time (and 2 days later), mice were treated with 250 μg PD-1 antibody or control antibody. Experiments shown are representative of 2 performed. n = 5/group. Two-way ANOVA. (G–H) 0.5 × 10⁶ RMA-S–Pdl1 tumor cells were mixed with Matrigel and either 20 μg anti–PD-1 or control Ig (E, G) or anti–PD-L1 or control Ig (F, H) and injected s.c. in C57BL/6 mice. Experiments were repeated at least 2 times, with n = 4–5/group. Two-way ANOVA.

The Journal of Clinical Investigation R E S E A R C H A R T I C L E
4 6 5 7jci.org Volume 128 Number 10 October 2018
but not T cells, mediate spontane-ous rejection of RMA-S cells and indicate that, in this model, NK cells are inhibited by PD-1/PD-L1 interactions and rescued by PD-1/PD-L1 blockade. The finding that NK depletion accelerated tumor growth somewhat more potently than PD-L1 transduction of the RMA-S cells (Figure 3, B and C) suggests that, while PD-L1 expres-sion by RMA-S cells strongly inhib-ited NK cells, some residual NK-mediated rejection still occurred.
RMA cells, unlike RMA-S cells, are resistant to NK cells and also fail to provoke T cell–medi-ated responses when inoculated in naive mice (45, 47). Not surpris-ingly, RMA tumors grew rapidly in C57BL/6J mice whether or not the tumor cells expressed PD-L1 (Figure 3E), demonstrating that PD-L1 protein expression by the tumor cells does not promote in vivo growth of tumors that are refractory to NK-mediated (and T cell–mediated) control.
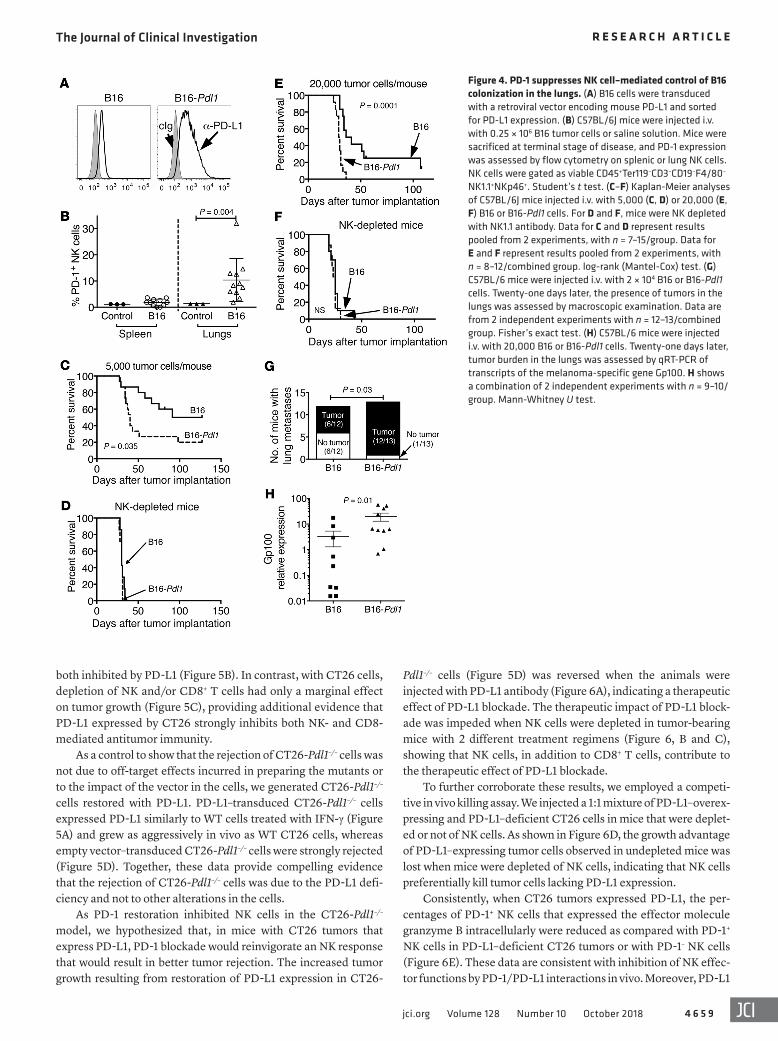
Like RMA-S, the melanoma cell line B16-BL6 (hereafter abbre-viated B16) is poorly immunogenic for T cells, but is sensitive to NK cells (48). We generated PD-L1 transductants of B16 (hereafter abbreviated B16-Pdl1). NK cells infiltrating subcutaneous B16 tumors expressed PD-1 in only half of tumor-bearing animals and at a low frequency (Figure 2C), so it was not surprising that B16-Pdl1 cells grew at a rate in vivo similar to that of the parental cells when transferred s.c. In contrast, NK cells infiltrating lung tissue where B16 cells had colonized after i.v. injection had appreciable, albeit variable, PD-1 expression (Figure 4B). Compared with the parental cell line, B16-Pdl1 cells (Figure 4A) injected i.v. caused a more rapid disease, indicating that PD-L1 expression inhibited tumor rejec-tion (Figure 4, C and E). Similar results were obtained with inocula of 5,000 or 20,000 tumor cells. With both doses, NK cell depletion accelerated the onset of lethal dis-
Figure 2. PD-1 is expressed on tumor-infiltrating NK cells and suppresses NK cell cytotoxicity in vitro. (A–B) C57BL/6J mice were injected s.c. with 2 × 10⁶ RMA-S cells or PBS; BALB/cJ mice were injected with 0.5 × 10⁶ CT26 cells. PD-1 expression was assessed after 13 days on NK cells from spleens, axillary LNs, inguinal LNs, and tumors. Staining for PD-1 (dark gray histograms) or control IgG (cIg) (light gray histograms) is shown. NK cells were gated as viable Ter119–CD3–CD19–F4/80–NKp46+ cells in BALB/cJ or Ter119–CD3–CD19–F4/80–NKp46+NK1.1+ cells in C57BL/6J mice. Experiments shown are representative of 6 performed. n = 3–5. (C) Summary of PD-1 expression on intratumoral NK and CD8+ T cells in mice injected with RMA, RMA-S, B16, C1498, CT26, 4T1, or A20 cells or on intratumoral NK cells in the prostates or thymi from spontaneous cancer models (TRAMP and Eu-Myc models, respectively) or in KP sarcomas. PD-1 expression on NK cells in each model was assessed in at least 3 independent experiments with at least n = 3. (D–E) IL-2–activated NK cells previously transduced with a Pdcd1 expression vector were stimulated with RMA-S or RMA-S–Pdl1 cells at different T/E ratios before determining degranulation (D) and IFN-γ production (E) of PD-1+ NK cells. Experiments depicted are representative of 3 performed. Every T/E ratio is shown as average ± SD of 3 technical replicates. Two-way ANOVA. (F–G) NK92 cells transduced with Pdcd1 (Pdcd1 encodes PD-1) or an empty vector were stimulated with K562 or K562-Pdl1 cells, and lysis of target cells (F) or degranulation of effector cells (G) was assessed by flow cytometry. Data shown in F and G are representative of 4 and 2 experiments performed, respectively. Every T/E ratio shows the average of 3 technical replicates. Note that in instances in which responses increase with more target cells, we plotted T/E ratios, wherease in cases in which the response increases with more effector cells, we plotted E/T ratios. Two-way ANOVA with repeated measures.

The Journal of Clinical Investigation R E S E A R C H A R T I C L E
4 6 5 8 jci.org Volume 128 Number 10 October 2018
in antitumor immunity. Initially, we employed a tumor model based on s.c. injection of CT26 cells in BALB/cJ mice. CT26 cells expressed high levels of ligands for NK cell–activating receptors (Supplemental Figure 2) and were efficiently killed by IL-2–acti-vated NK cells in vitro (not shown). CT26 cells naturally express low amounts of PD-L1 in vitro, which was strongly upregulated by IFN-γ (Figure 5A). To address the role of PD-1 inhibition in this tumor model, we generated a PD-L1–deficient variant of CT26 by targeting the Pdl1 gene with CRISPR/Cas9. The muta-tion abolished PD-L1 expression whether or not the cells were treated with IFN-γ (Figure 5A). When injected in BALB/cJ mice, CT26 cells generated solid tumors in all recipients 5 to 7 days after injection, whereas growth of PD-L1–KO CT26 cells was dramati-cally delayed, indicating that naturally expressed PD-L1 strongly inhibited the antitumor response (Figure 5B). In this cancer mod-el, PD-1 was upregulated on a large fraction of both NK and T cells infiltrating the tumors (Figure 2C). To determine which immune cells were susceptible to PD-1–mediated inhibition, groups of mice were depleted of NK cells, CD8+ T cells, or both before being challenged with tumor cells. Notably, NK or CD8 depletion resulted in substantial and similar increases in the growth rates of CT26-Pdl1–/– tumors, showing that PD-1 comparably inhibited NK and CD8+ T cells (Figure 5B). Furthermore, depletion of both NK and CD8+ T cells resulted in even faster tumor growth, com-parable to the growth of WT CT26 cells, showing that NK cells and CD8+ T cells were the major tumor-rejecting populations, that they acted at least partly independently, and that they were
ease with untransduced tumor cells to match the pace of disease with PD-L1–transduced tumor cells (Figure 4, C–F). In contrast, CD8 depletion did not accelerate mortality in mice injected with B16 or B16-Pdl1 tumor cells (Supplemental Figure 1; supplemental material available online with this article; https://doi.org/10.1172/JCI99317DS1). These data confirmed that B16 cells are controlled by NK cells and not CD8+ T cells (i.e., in the absence of immuno-therapy) and indicated that higher PD-L1 expressed by these tumor cells inhibits the NK cell response. Post mortem analysis confirmed the higher degree of tumor burden conferred by PD-L1 expression. Twenty-one days after injecting the lower dose of tumor cells, only half of the mice that received B16 cells had macroscopically vis-ible tumor colonies in the lungs, whereas 12 out of 13 mice injected with B16-Pdl1 cells had easily observable lung tumors (Figure 4G). Quantitative RT-PCR (qRT-PCR) analysis of lung-tissue RNA for transcripts encoding a melanocyte-specific protein (Gp100; ref. 49) confirmed the increased burden of B16-Pdl1 tumors as com-pared with B16 cells (Figure 4H). We also attempted to address whether PD-1 blockade provided a therapeutic effect in the B16 experimental metastasis model, but were stymied in the effort by the failure of the PD-1–blocking antibody to efficiently penetrate the lung tumor microenvironment, as indicated by the absence of antibody bound to PD-1+ cells in dissociated tumors after treat-ment. Collectively, these findings indicated that PD-L1 expression inhibits NK-mediated control of B16 lung colonization.
We investigated whether PD-1–mediated inhibition of NK cell responses was physiologically relevant when T cells participated
Figure 3. Expression of PD-L1 by NK cell–sensitive, T cell–resistant tumor cells promotes more aggressive tumor growth in vivo. (A) RMA-S cells were transduced with PD-L1 expression vector or an empty control vector. G418-resistant transductants were selected. Transduced cells, as well as untransduced RMA-S cells, were injected into C57BL/6J mice (106 cells/mouse s.c.), and tumor growth was monitored. Tumor volumes (mean ± SEM) are shown for each time point. The experiment shown is representative of 3 performed. n = 5–6. *P < 0.05, 2-way ANOVA. Survival (B) and in vivo tumor growth (mean ± SEM) (C) were assessed after s.c. injection of 1 × 10⁶ RMA-S or RMA-S–Pdl1 tumor cells in C57BL/6J mice. Where indicated, NK cells were depleted by injecting NK1.1 antibody. The results depicted are representative of 8 independent experi-ments, 2 of which included NK cell–depleted mice for comparison. In the experiment shown, n = 6–7 per group. **P < 0.01, log-rank (Mantel-Cox) test (B); 2-way ANOVA test (C). (D) 106 RMA-S or RMA-S–Pdl1 cells were injected s.c. into Rag2–/–Il2rg–/– mice, and tumor growth was assessed. Tumor volumes (mean ± SEM) are shown. Experiment shown is representative of 3 independent experiments, n = 4/group. (E) 106 RMA or RMA-Pdl1 tumor cells were injected s.c. into C57BL/6J mice, and tumor growth was monitored. Tumor vol-umes (mean ± SEM) are shown. Experiment shown is representative of 2 performed. n = 5 for RMA group and n = 6 for RMA-Pdl1 group.
The Journal of Clinical Investigation R E S E A R C H A R T I C L E
4 6 5 9jci.org Volume 128 Number 10 October 2018
both inhibited by PD-L1 (Figure 5B). In contrast, with CT26 cells, depletion of NK and/or CD8+ T cells had only a marginal effect on tumor growth (Figure 5C), providing additional evidence that PD-L1 expressed by CT26 strongly inhibits both NK- and CD8-mediated antitumor immunity.
As a control to show that the rejection of CT26-Pdl1–/– cells was not due to off-target effects incurred in preparing the mutants or to the impact of the vector in the cells, we generated CT26-Pdl1–/– cells restored with PD-L1. PD-L1–transduced CT26-Pdl1–/– cells expressed PD-L1 similarly to WT cells treated with IFN-γ (Figure 5A) and grew as aggressively in vivo as WT CT26 cells, whereas empty vector–transduced CT26-Pdl1–/– cells were strongly rejected (Figure 5D). Together, these data provide compelling evidence that the rejection of CT26-Pdl1–/– cells was due to the PD-L1 defi-ciency and not to other alterations in the cells.
As PD-1 restoration inhibited NK cells in the CT26-Pdl1–/– model, we hypothesized that, in mice with CT26 tumors that express PD-L1, PD-1 blockade would reinvigorate an NK response that would result in better tumor rejection. The increased tumor growth resulting from restoration of PD-L1 expression in CT26-
Pdl1–/– cells (Figure 5D) was reversed when the animals were injected with PD-L1 antibody (Figure 6A), indicating a therapeutic effect of PD-L1 blockade. The therapeutic impact of PD-L1 block-ade was impeded when NK cells were depleted in tumor-bearing mice with 2 different treatment regimens (Figure 6, B and C), showing that NK cells, in addition to CD8+ T cells, contribute to the therapeutic effect of PD-L1 blockade.
To further corroborate these results, we employed a competi-tive in vivo killing assay. We injected a 1:1 mixture of PD-L1–overex-pressing and PD-L1–deficient CT26 cells in mice that were deplet-ed or not of NK cells. As shown in Figure 6D, the growth advantage of PD-L1–expressing tumor cells observed in undepleted mice was lost when mice were depleted of NK cells, indicating that NK cells preferentially kill tumor cells lacking PD-L1 expression.
Consistently, when CT26 tumors expressed PD-L1, the per-centages of PD-1+ NK cells that expressed the effector molecule granzyme B intracellularly were reduced as compared with PD-1+ NK cells in PD-L1–deficient CT26 tumors or with PD-1– NK cells (Figure 6E). These data are consistent with inhibition of NK effec-tor functions by PD-1/PD-L1 interactions in vivo. Moreover, PD-L1
Figure 4. PD-1 suppresses NK cell–mediated control of B16 colonization in the lungs. (A) B16 cells were transduced with a retroviral vector encoding mouse PD-L1 and sorted for PD-L1 expression. (B) C57BL/6J mice were injected i.v. with 0.25 × 10⁶ B16 tumor cells or saline solution. Mice were sacrificed at terminal stage of disease, and PD-1 expression was assessed by flow cytometry on splenic or lung NK cells. NK cells were gated as viable CD45+Ter119–CD3–CD19–F4/80–
NK1.1+NKp46+. Student’s t test. (C–F) Kaplan-Meier analyses of C57BL/6J mice injected i.v. with 5,000 (C, D) or 20,000 (E, F) B16 or B16-Pdl1 cells. For D and F, mice were NK depleted with NK1.1 antibody. Data for C and D represent results pooled from 2 experiments, with n = 7–15/group. Data for E and F represent results pooled from 2 experiments, with n = 8–12/combined group. log-rank (Mantel-Cox) test. (G) C57BL/6 mice were injected i.v. with 2 × 10⁴ B16 or B16-Pdl1 cells. Twenty-one days later, the presence of tumors in the lungs was assessed by macroscopic examination. Data are from 2 independent experiments with n = 12–13/combined group. Fisher’s exact test. (H) C57BL/6 mice were injected i.v. with 20,000 B16 or B16-Pdl1 cells. Twenty-one days later, tumor burden in the lungs was assessed by qRT-PCR of transcripts of the melanoma-specific gene Gp100. H shows a combination of 2 independent experiments with n = 9–10/group. Mann-Whitney U test.

The Journal of Clinical Investigation R E S E A R C H A R T I C L E
4 6 6 0 jci.org Volume 128 Number 10 October 2018
antibody treatment of mice bearing CT26 tumor cells resulted in a significant increase in the percentage of granzyme B+ NK cells among PD-1+ NK cells, consistent with the impact of PD-L1 block-ade on tumor rejection in vivo (Figure 6E). Several other param-eters of NK cell activation were unchanged, consistent with our observation that most NK activation markers are not strongly induced by exposure to NK-sensitive (as opposed to NK-resistant) tumors in vivo (M. Ardolino and D.H. Raulet, unpublished obser-vations). As CT26 cells are known to express high levels of MHC I molecules and to express mutated neoantigens (50), it was not surprising to observe such a strong T cell response with the PD-L1–deficient variants. It is, however, remarkable that, in such a sce-nario, NK cells play a comparable role to T cells and that with WT
CT26 cells, PD-1 can potently sup-press both responses.
As a fourth model, we employed orthotopic injections of 4T1 cells in the mammary fat pad of BALB/cJ mice. Similarly to CT26 cells, 4T1 cells express NK cell–activat-ing ligands and are efficiently killed by IL-2–activated NK cells in vitro (Supplemental Figure 2 and data not shown). We generated a PD-L1–defi-cient version of 4T1 cells (4T1-Pdl1–/–) with CRISPR/Cas9 (Figure 7A). When injected into BALB/cJ mice, 4T1 cells grew more rapidly than their PD-L1–deficient counterparts, indi-cating that, even in this model, PD-L1 expression on tumor cells suppressed the immune response (Figure 7, B and D). As we observed with CT26-derived tumors, depletion of NK or CD8+ T cells separately did not com-pletely rescue the growth of PD-L1–deficient tumor cells, but concurrent depletion of NK and CD8+ T cells accelerated the growth of 4T1-Pdl1–/– cells to the level observed with 4T1 cells, indicating that PD-L1 inhibition was exerted on both NK and CD8+ T cells (Figure 7, B–E). Therefore, in 2 cancer models in which CD8+ T cells played a substantial role, NK respons-es were still important for control-ling cancer development and PD-1 was able to suppress the antitumor activity of NK cells. These results in 4 different tumor models show that NK-mediated antitumor responses are inhibited by PD-1, indicating that PD-1 represents an important check-point for NK cells.
PD-1 is more abundantly expressed in activated NK cells with higher func-tional activity. NK cells are both phe-
notypically and functionally heterogeneous (20). In the analyzed tumor models, PD-1 was expressed by a discrete fraction of cells rather than by the entire population. We addressed whether the NK cells that upregulated PD-1 correspond to a phenotypically defined subset. For the 4 maturation stages defined by CD27 and CD11b expression (51), PD-1 was expressed on NK cells within all 4 stages, with somewhat higher expression on R2 cells (CD11b+CD27+ NK cells), one of the stages of maturation in which NK cells are more responsive (Figure 8A).
Another element of heterogeneity among NK cells is provided by stochastic expression of MHC-specific inhibitory receptors (20). In B6 mice, Ly49C, Ly49I, and NKG2A recognize self–MHC I, whereas Ly49A and Ly49G2 do not (38). NK cells that expressed
Figure 5. PD-L1 expression by CT26 tumor cells prevents tumor rejection mediated by NK cells and CD8+ T cells. (A) PD-L1 expression by CT26 cell variants. Cells were untreated or treated with 20 ng/ml IFN-γ for 48 hours, and PD-L1 expression was analyzed by flow cytometry. Top panel: comparison of CT26 and CT26-Pdl1–/– cells. Lower panel: comparison of CT26-Pdl1–/– cells transduced with a PD-L1 expression vector or with an empty vector. WT CT26 cells transduced with empty vector served as a control. (B, C) In vivo growth of CT26 or CT26-Pdl1–/– tumors was assessed after s.c. injection of 0.5 × 10⁶ cells in BALB/cJ mice. Some mice were depleted of NK cells (with asialo GM-1 antibody), CD8+ T cells (with CD8α-specific 2.43 antibody), or both before tumor cell injection. Tumor volumes (mean ± SEM) are shown. For B, 2-way ANOVA tests were used to compare CT26-Pdl1–/–/undepleted mice with either CT26/undepleted mice (P < 0.01), CT26-Pdl1–/–/NK-depleted mice (P < 0.0001), or CT26-Pdl1–/–/CD8-depleted mice (P < 0.01). Two-way ANOVA tests were also used to com-pare CT26-Pdl1–/–/NK&CD8-depleted mice to either CT26-Pdl1–/–/CD8-depleted mice (P < 0.05) or CT26-Pdl1–/–/NK-depleted mice (P = 0.0599). For C, none of the differences were significant. Data from B and C are from the same experiment, which is representative of 2 performed. n = 8 for the experiment shown. (D) 0.2 × 10⁶ CT26-Pdl1–/– cells transduced with an empty vector or a PD-L1 expression vector or CT26 WT cells transduced with an empty vector were injected s.c. in BALB/cJ mice, and tumor progression was assessed. Experiment depicted is representative of 3 performed. n = 3–4 mice/group. *P < 0.05; ***P < 0.001, 2-way ANOVA.

The Journal of Clinical Investigation R E S E A R C H A R T I C L E
4 6 6 1jci.org Volume 128 Number 10 October 2018
respectively) induced only marginal increases in the percentages of PD-1–expressing NK cells (Supplemental Figure 3). The lack of a strong association between tumor cell stimulation of NK cells and PD-1 expression suggests that PD-1 upregulation may be induced more potently by other types of signals, such as local exposure to generic activating or coactivating ligands or cytokines.
The clear correlation between cellular activation markers and PD-1 expression prompted us to investigate whether PD-1+ NK cells corresponded to the more functionally active NK cells. To answer this question, we took advantage of an ex vivo approach, often used to assay NK cell responsiveness (47, 52–54). We inject-ed RMA-S or RMA-S–Pdl1 tumor cells in syngeneic C57BL/6J mice and, after tumor formation, restimulated tumor-infiltrating NK cells ex vivo with plate-bound antibodies that crosslink NK cell–activating receptors NKp46 or NKR-P1C or isotype control anti-bodies. Degranulation (CD107a on the cell surface) and intracel-lular accumulation of IFN-γ were assessed. Interestingly, PD-1+ NK cells had substantially higher functional activity than PD-1–negative NK cells (Figure 9). A similar result was obtained employ-ing NK cells infiltrating PD-L1+ or PD-L1– CT26 tumors (Figure 10). These results showed that PD-1 is selectively upregulated on the most activated and functionally responsive intratumoral NK
inhibitory receptors specific for the host’s MHC I molecules were marginally but significantly more likely to express PD-1. This was evident when examining NK cells that simultaneously expressed all 3 of the known self-MHC–specific receptors (Ly49C+, Ly49I+, and NKG2A+) in B6 mice or the larger population that expressed at least 1 of the 3 (Figure 8B). Interestingly, NK cells expressing self-MHC–specific receptors exhibit greater functional responsiveness than other NK cells (38).
The more robust expression of PD-1 in NK cells with a pheno-type associated with higher responsiveness led us to hypothesize that cellular activation could be related to PD-1 expression. Con-sistent with our hypothesis, NK cells that express activation mark-ers such as Sca-1 and CD69 consistently contained more PD-1+ NK cells than NK cells lacking these markers (Figure 8, C–E). Induc-tion of PD-1 on NK cells did not, however, necessarily correlate with how well the tumor cells stimulate NK cells. Indeed, PD-1 expression was similar on NK cells infiltrating RMA-S tumors (a good NK cell target) and RMA tumors (an NK-resistant, MHC I–high sister cell line) (Figure 2C). Moreover, compared with NK-insensitive RMA tumor cells, RMA cells that were rendered NK sensitive by transduction of the NK-activating ligands m157 or RAE-1ε (which bind the Ly49H- and NKG2D-activating receptors,
Figure 6. NK cells are necessary to mediate full therapeutic efficacy of PD-L1 blockade in the NK- and T cell–sensitive CT26 tumor model. (A) Mice were injected with 0.2 × 10⁶ CT26-Pdl1–/– cells transduced with an empty vector or a PD-L1 expression vector and treated with 250 μg anti–PD-L1 or control Ig daily for 10 days by i.p. injection. *P < 0.05; **P < 0.01, 2-way ANOVA. n = 4–5 mice/group. Experiment is representative of 3 performed. (B) 0.2 × 10⁶ CT26-Pdl1–/– cells transduced with a PD-L1 expression vector were injected into BALB/cJ mice. Where indicated, NK or CD8+ T cells were depleted by i.p. injection of anti–asialo GM1 or 2.43 antibodies 2 and 1 day before tumor injection. Mice were treated with 250 μg anti–PD-L1 or control Ig daily for 10 days by i.p. injection. n = 4–5 mice/group. Experiment is representative of 3 performed. Mann-Whitney U tests comparing the anti–PD-L1 group with the other experi-mental groups at days 15, 17, and 19. *P < 0.05 for all such comparisons. (C) BALB/cJ mice were injected with 0.25 × 10⁶ CT26-Pdl1–/– plus Pdl1 cells. PD-L1 or cIg antibodies were injected 3, 4, 5, 7, and 12 days after tumor injection. Some mice were NK depleted 2, 9, and 16 days after tumor injection. n = 6–9 mice/group. Data are from the combination of 2 independent experiments. **P < 0.01, 2-way ANOVA with repeated measurements. (D) 500,000 Cells compris-ing a 1:1 mixture of CT26-Pdl1–/– plus Pdl1-IRES-Thy1.1 and CT26-Pdl1–/– plus empty-IRES-Thy1.1 cells were injected in BALB/cJ mice depleted or not of NK cells. Tumors were analyzed by flow cytometry as soon as they became palpable. Tumor cells were identified as CD45–Thy1.1+. Experiments are representa-tive of 3 performed. n = 3/group. Two-tailed paired Student’s t test. (E) 0.2 × 10⁶ CT26 or CT26-Pdl1–/– cells were injected s.c. in BALB/cJ mice. Once tumors were established, mice were treated with 250 μg/d of PD-L1 or control antibody for 2 days and intracellular granzyme B expression was assessed in PD-1+ or PD-1– tumor-infiltrating NK cells. Experiment is representative of 2 performed. n = 3–5 mice/group. *P < 0.05, 2-tailed unpaired Student’s t tests.

The Journal of Clinical Investigation R E S E A R C H A R T I C L E
4 6 6 2 jci.org Volume 128 Number 10 October 2018
ade is challenged by at least 2 observations: (a) human tumors often lose expression of HLA-I molecules (10, 60), and in some of these tumors, PD-1 blockade is still effective; and (b) a strong clinical response to PD-1 blockade is observed in tumor types, such as Hodgkin’s lymphomas that display extremely low muta-tional loads (12, 13). Unlike T cells, NK cells can respond to MHC-deficient tumors (45), and they are activated by ligands that are usually upregulated upon oncogenic stress (39, 61). Based on these premises, we hypothesized that PD-1 blockade may activate an NK cell response.
Tumors that are good T cell targets, such as melanoma and lung cancer cells, also express high levels of ligands for NK-acti-vating receptors (62–65). Furthermore, NK cells often infiltrate melanoma and lung tumors. Hence, NK cells may also participate in immune-mediated rejection of these tumors, even if T cells may play a major role under these conditions.
Here, we present what we believe is the first mechanistic evi-dence that PD-1 blockade elicits an antitumor NK cell response
cells. These findings explain why the NK response is potently sup-pressed by PD-1 interactions when PD-1 is only expressed by a fraction of NK cells: the PD-1+ NK cells are the ones with the great-est potential activity and are responsible for most of the response when PD-1 interactions are blocked.
In conclusion, our studies show that PD-1/PD-L1 blockade relies on NK cells in both MHC+ and MHC– tumors. PD-1 inhib-its NK-dependent immune surveillance and favors the escape of tumor cells from NK cell responses.
DiscussionThe efficacy of PD-1 blockade has been correlated with reinvigo-ration of a preexisting T cell response (55). Indeed, tumors with abundant neoantigens due to an elevated mutational load, such as melanomas and lung cancers, tend to be more responsive to PD-1 blockade than tumors with a low somatic mutation load (56–59). However, the prevalent view that T cells are the only important mediators of the antitumor response unleashed by PD-1 block-
Figure 7. PD-1 engagement suppresses NK cell responses to 4T1 orthotopic tumors. (A) 4T1 or 4T1-Pdl1–/– cells were stimulated or not with IFN-γ, and PD-L1 expression was analyzed by flow cytometry. (B–E) 100,000 Tumor cells were injected in the mammary fat pad of BALB/cJ mice. Where indicated, mice were immune depleted 2 and 1 days before tumor injection and then 7 and 14 days after tumor injection. Results from B and C come from the same experiment. Results from D and E come from the same experiment. n = 7–8 mice/group. The 2 experiments are represen-tative of 3 performed. *P < 0.05; **P < 0.01; ****P < 0.00001, 2-way ANOVA with repeated measurements comparing every group with 4T1-Pdl1–/– undepleted (B and D) or 4T1 unde-pleted (C and E).

The Journal of Clinical Investigation R E S E A R C H A R T I C L E
4 6 6 3jci.org Volume 128 Number 10 October 2018
by NK cells and T cells in the tumor bed. Our studies in mice, for example, show that PD-1 blockade elicits antitumor responses by both T cells and NK cells in the case of CT26 tumors, whereas it elicits an NK cell response in the case of RMA-S–Pdl1 tumors, which are defective for MHC I expression. Interestingly, approxi-mately 79% of classical Hodgkin’s lymphomas show decreased or absent expression of MHC I (19), yet a large majority of patients respond to PD-1 blockade immunotherapy (12). These observa-tions suggest the possibility that NK cells participate in tumor elimination stimulated by PD-1 immunotherapy in this indication
and that PD-1 is an important checkpoint for NK activation. We propose that, along with T cells, NK cells also participate in the clinical benefit of PD-1/PD-L1 antibody therapy. NK cells may participate by helping to recruit a T cell response and/or by killing tumor cells directly. The participation of T cells versus NK cells in direct tumor killing will likely depend on the relative sensitivity of the specific tumor to NK versus T cells, which, in turn, varies depending on numerous factors, including expression of MHC I and activating ligands for NK cells, the antigenic load of the tumor cells, PD-L1 expression by the tumor cells, and PD-1 expression
Figure 8. PD-1 is upregulated on the most activated tumor-infiltrating NK cells. (A) PD-1 expression on different NK cell maturation subsets in RMA-S tumors. R0–R3 stages are as follows: R0, CD27–CD11b–; R1, CD27+CD11b–; R2, CD27+CD11b+; R3, CD27–CD11b+. Three independent experiments were pooled (n = 7–18/combined group). One-way ANOVA with repeated measures. *P < 0.05; ***P < 0.001. (B) NK cells from RMA-S tumors were stained with anti-bodies for Ly49I (I), Ly49C (C), and NKG2A (N), and PD-1 expression was assessed on the 3 populations by flow cytometry. C+I+N+ cells expressed all the receptors; C+±I+±N+ cells expressed at least 1 of the receptors; C–I–N– NK cells lacked expression of all 3 receptors. Data from 2 independent experiments are included. One-way ANOVA with repeated measures. NK cells from RMA-S (C), CT26 (D), or KP sarcoma (E) tumors were costained with PD-1 antibody and antibody against Sca-1 or CD69. PD-1 expression was assessed by flow cytometry on gated NK cells that did or did not express such markers. Representa-tive contour plots and summary of the data are depicted. For C and E, 3 independent experiments were pooled; for D, 2 independent experiments were pooled. n = 6–15. Two-tailed paired Student’s t test.

The Journal of Clinical Investigation R E S E A R C H A R T I C L E
4 6 6 4 jci.org Volume 128 Number 10 October 2018
even within tumors that are poor targets for NK cells in vitro, such as from the RMA tumor line. PD-1 expression trended higher, but not appreciably so, within tumors formed from RMA transfectants that expressed NK-activating ligands. The data suggest that PD-1 expression is induced by other activating signals or a combination of activating signals supplied within tumors. Cytokine cocktails we have tested were not sufficient to induce PD-1 on NK cells (data not shown). It will be important in future studies to identify the mechanisms that lead to PD-1 expression by NK cells in tumors and the source of variation in PD-1 expression in different tumors.
Our results and those of others (69, 70) suggest there are opportunities for combining PD-1 or PD-L1 antibody therapy with agents that enhance the antitumor effects of NK cells by other means, including KIR blockade (71), cytokine therapy (47), antibody-dependent cell-mediated cytotoxicity (ADCC) (72), and other mechanisms (73) for marshaling NK cell responses against cancer. Finally, given reports that NK cells express other checkpoint receptors, such as CTLA-4, LAG-3, CD96, and TIGIT (74–76), therapies targeting those molecules may also mobilize NK responses and will be the subject of future studies.
MethodsMice and in vivo procedures. Mice were maintained at the University of California, Berkeley, or at the University of Ottawa. C57BL/6J, BALB/cJ, and Rag2–/–Il2rg–/– mice were bred from mice purchased from The Jack-son Laboratory, and B6-Klrk1–/– mice have been described (77). p53fl/fl mice and Kras+/LSL–G12D mice, both purchased from The Jackson Labora-tory, were bred to generate KP (Kras+/LSL–G12Dp53fl/fl) mice (78). Ncr1+/gfp mice were a gift of O. Mandelboim (Hebrew University, Jerusalem, Israel). For all experiments, sex-matched (both males and females) and age-matched (6 to 12 weeks old) mice were employed. Antibodies for in vivo depletions or in vivo treatments were obtained from Leinco, except for anti–asialo GM-1, which was obtained from BioLegend.
For s.c. and orthotopic injections, tumor cells resuspended in 100 μl RPMI without FCS were injected in the left flank or in the mammary
and probably others. Other immune cell types, such as tumor-associated macrophages, may also express PD-1 and may also play a role in therapeutic responses (66). Interestingly, PD-1 expression has been detected on human NK cells in several cancer indica-tions (40–43). Though NK cells exhibit cytotoxicity against many tumors, they fail to eliminate many tumors in vivo and are fre-quently found in tumor beds in an inactive state. Based on the col-lective data, we believe that PD-1 engagement is at least partially responsible for the impact of PD-L1 expression by tumor cells on NK-dependent tumor rejection. However, PD-1 expressed by cells other than NK cells and CD8+ T cells may also play a role, depend-ing on the tumor type and the nature of the immune response. The same reasoning likely applies to other checkpoint receptors, including LAG-3, TIM-3, and TIGIT, that probably play a wider role in the tumor microenvironment than inhibiting T cells.
Functional and phenotypic tests showed that the PD-1+ NK cells had the highest functional activity when stimulated ex vivo and were largely included in the subsets of NK cells that expressed activation markers (CD69 and Sca-1). These data suggest that PD-1+ NK cells are not necessarily anergic in PD-L1+ tumors, but may instead be inhibited in killing tumor cells. Studies suggest that anergy and PD-1 expression are independent processes in T cells as well (67), and it was recently reported that activation, rather than exhaustion, drives expression of PD-1 and other checkpoint recep-tors on human T cells (68). PD-1–negative NK cells may fail to kill tumor cells because they failed to become activated or have been rendered anergic. Whatever the explanation, the finding that PD-1+ NK cells are the most active provides a plausible explanation for why PD-L1 expression by tumor cells suppressed the response even though only a fraction of NK cells expressed PD-1. Furthermore, it is consistent with the impact of PD-1 and PD-L1 blockade because these more active NK cells would be expected to vigorously attack tumor cells once the inhibitory interaction is disrupted.
PD-1 expression by CD8+ T cells is also correlated with acti-vation (68). Unexpectedly, PD-1 expression by NK cells occurred
Figure 9. In RMA-S tumors, PD-1+ NK cells are more functionally responsive than PD-1–negative NK cells. NK cells from RMA-S–Pdl1–derived (A) or RMA-S–derived (B) tumors were stimulated with plate-bound isotype control, anti-NKp46, or anti-NKR-P1C, and degranulation and IFN-γ accumulation of PD-1+ vs. PD-1– NK cells was assessed. Experiments are representative of 2 performed. n = 4–5. Two-tailed paired Student’s t test.

The Journal of Clinical Investigation R E S E A R C H A R T I C L E
4 6 6 5jci.org Volume 128 Number 10 October 2018
by injecting 250 μg PD-L1 (10F.9G2) antibodies or control IgG i.p. daily from day 1 to day 10 after injecting tumor cells. In these mice, immune depletion was performed at days –2, –1, 7, and 14. In a second protocol, PD-L1 antibody was injected at days 3, 4, 5, 7, and 10. In these animals, NK depletion was performed on days 2, 9, and 16.
Cell lines and cell culture. All cell lines were cultured at 37°C in a humidified atmosphere containing 5% CO2 with media containing 100 U/ml penicillin, 100 μg/ml streptomycin, 0.2 mg/ml glutamine, 10 g/ml gentamycin sulfate, 20 mM HEPES, and 5% FCS (10% FCS in the case of CT26 cells). RMA, RMA-Pdl1, RMA-S, RMA-S–Pdl1, RMA-m157, RMA-RAE-1ε, C1498, CT26, CT26-Pdl1–/–, K562, K562-Pdl1, A20, YAC-1, YAC-1-Pdl1, 4T1, and 4T1-Pdl1–/– were cultured in RPMI, whereas B16, B16-Pdl1, and TRAMP-C2 were cultured in DMEM. NK92 and NK92-Pdcd1 were cultured in MEM-α with 10% FCS, 10% horse serum, 100 U/ml recombinant human IL-2, 100 U/ml penicillin, 100 μg/ml streptomycin, 0.2 mg/ml glutamine, 10 μg/ml gentamycin sulfate, and 20 mM HEPES. Cell line identity was confirmed by flow cytometry or PCR, and cells tested negative for mycoplasma.
Flow cytometry. In mice injected with tumor cells s.c. or in the sar-coma model, draining LNs (inguinal), nondraining LNs (brachial LN), and spleens were gently dissociated through a 40 μm filter, and the resulting single-cell suspensions were employed for experiments. The tumors were excised after separating the skin, cut in pieces, and dis-sociated using a gentleMACS Dissociator (Miltenyi Biotec). In mice injected with tumor cells i.v., lungs were perfused and then dissociated using a gentleMACS Dissociator. Cell preparations from tumors and lungs were loaded on a mouse-lympholyte gradient (Cedarlane) and then stained. TRAMP- and Eu-Myc–derived tumors were dissociated with collagenase, and cells were stored frozen at –80° C. Before stain-ing, cells were thawed and loaded on a mouse-lympholyte gradient.
Dead cells were excluded by staining with the Live-Dead Fixable Stain Kit (Molecular Probes) for 30 minutes. Cells were then incubat-ed for 20 minutes with 2.4G2 hybridoma supernatant to block FcγRII/III receptors and for a further 20 minutes with primary specific anti-bodies before washing. When necessary, an additional incubation with fluorochrome-conjugated streptavidin (BioLegend) was per-
fat pad. Tumor growth was monitored by caliper measurements. For the experimental metastasis model, tumor cells resuspended in 200 μl RPMI without FCS were injected in the tail vein. KP sarcomas were induced by intramuscular hind leg injection of 25,000 PFU of a lenti-virus expressing Cre recombinase in a volume of 50 μl. Cre-expressing lentivirus was produced in 293T cells by simultaneous transfection of a transfer vector encoding Cre (a gift from Tyler Jacks, Massachusetts Institute of Technology, Boston, Massachusetts, USA) along with the plasmids psPAX2 and pCMV-VSV-G. Cell-culture supernatant con-taining Lenti-Cre was passed through a 0.45 μM filter, centrifuged at 30,000 g per 90 minutes, and resuspended in a 1:1 mixture of HBSS and OptiMem. Viral preparations were titered using the GreenGO reporter cell line (a gift from Tyler Jacks).
To deplete CD8+ T cells, mice were injected i.p. with 250 μg mono-clonal antibodies H35-17.2 (specific for CD8β) or 2.43 (specific for CD8α) on days –2 and –1 relative to tumor injection. CD4+ T cells were depleted by i.p. injection of 500 μg GK1.5 monoclonal antibodies (spe-cific for CD4) on days –3 and –1. To deplete NK cells in C57BL/6 mice, 250 μg PK136 (specific for NKR-P1C) was injected i.p. on days –1 and –2. In BALB/cJ mice, 10 μl anti–asialo GM1 was injected i.p. on days –2 and –1. Cell depletion was confirmed by staining peripheral blood cells with antibodies different from the ones used for in vivo deple-tion. Specifically, NK depletion was confirmed by the absence of CD3–
NKp46+ cells, CD8+ T cell depletion was confirmed by the absence of CD3+CD4– cells, and CD4+ T cell depletion was confirmed by the absence of CD3+CD8– cells.
For experiments using RMA-S or RMA-S–Pdl1 cells, checkpoint blockade was performed by injecting 250 μg PD-1 (RMP1-14) or PD-L1 (10F.9G2) antibodies or control IgG i.p. In one protocol, the antibody was delivered 2 days after tumor cell injection. In a second protocol, the antibody was injected when the tumor volume reached 25 mm3 and repeated 2 days after. In a third protocol, tumor cells were inject-ed s.c. after resuspending the cells in 100 μl Growth Factor Reduced Matrigel (BD) mixed with 20 μg control or PD-1 or PD-L1 antibodies.
For experiments using CT26-Pdl1–/– cells transduced with empty vector or Pdl1 expression vector, checkpoint blockade was performed
Figure 10. In CT26 tumors, PD-1+ NK cells are more responsive than PD-1–negative NK cells. NK cells from tumors deriving from CT26-Pdl1–/– cells reconstituted with PD-L1 (A) or an empty vector (B) were stimulated with plate-bound isotype control or anti-NKp46 or PMA/I. Degranula-tion and IFN-γ accumulation of PD-1+ vs. PD-1– NK cells were assessed. Experiments are representative of 2 performed. n = 4. Two-tailed paired Student’s t test.
The Journal of Clinical Investigation R E S E A R C H A R T I C L E
4 6 6 6 jci.org Volume 128 Number 10 October 2018
Flow cytometry–based killing assay. 15,000 CFSE-labeled target cells were incubated for 5 hours with effector cells at different effec-tor/target (E/T) ratios in 96-well U-bottom plates in technical tripli-cates. Cells were then stained with Live/Dead Fixable Viability Dye (Molecular Probes) and resuspended in 150 μl flow buffer. 8,000 APC-labeled microbeads (Bangs Laboratories) resuspended in 50 μl were added to each well. Maximum killing was obtained by incubat-ing target cells alone with 100 μl of bleach for 10 minutes at room temperature. Cells were washed with flow buffer, and then beads were added (target+bleach condition). Cells plus beads (180 μl) were acquired at the flow cytometer using the HTS plate reader. The ratio among viable target cells (defined as CFSE+viability dye– cells) and flu-orescent microbeads (defined as APC+ events) was calculated in each well (T/B). Percentage of specific lysis was calculated for each well as follows: %specific lysis = (T/Bexperimental condition – T/Btarget alone)/(T/Btarget+bleach – T/Btarget alone) × 100.
Degranulation assay. Splenocytes from resting Ncr1+/gfp mice (all NK cells express GFP) were spin infected twice (at day 0 and day 1) with Pdcd1-encoding lentivirus in the presence of 1000 U/ml recom-binant human IL-2. On day 2, activated splenocytes were harvested, stained with CellTrace Violet (BioLegend), and used as effectors in a degranulation assay. 30,000 Effector cells were cultured with RMA-S or RMA-S–Pdl1 cells at different T/E ratios for 5 hours with 1 μg GolgiPlug (BD), 1 μg GolgiStop (BD), and anti-CD107a. PD-1 staining was performed after the stimulation. NK cells were gated as viable CellTrace Violet+GFP+.
NK92-Pdcd1 and NK92 cells transduced with empty vector were CFSE labeled and used as effectors in a degranulation assay. 20,000 Effector cells were stimulated with K562 or K562/Pdl1 cells at differ-ent T/E ratios for 5 hours with 1 μg GolgiStop and anti-CD107a.
In other experiments, wells of flat-bottomed high-protein–binding plates were coated with 0.5 μg control isotype or NKp46 antibody or 5 μg NKR-P1C antibody. Approximately 106 tumor-infiltrating cells were stimulated in the presence of 100 U of recombinant human IL-2, anti-CD107a, 1 μg GolgiPlug, and 1 μg GolgiStop. After 5 hours, cells were harvested and stained with anti–PD-1; degranulation and IFN-γ accu-mulation on PD-1+ vs. PD-1– NK cells was assessed by flow cytometry.
RNA isolation, reverse transcription, and qPCR. Lungs from con-trol mice or from mice injected with B16 tumor variants were dissoci-ated using a gentleMACS Dissociator, and RNA was extracted using the RNeasy Mini Kit (QIAGEN). RNA preparations were treated with DNase I (DNA-Free Kit, Invitrogen) for 25 minutes at 37°C before retrotranscribing 1 μg RNA using the iScript Reverse Transcriptase System (Bio-Rad). Quantitative real-time PCR was performed on a CFX96 thermocycler (Bio-Rad) using SSO-Fast EvaGreen Supermix (Bio-Rad). B-actin mRNA and Rlt19 rRNA were used as references.
Primer sequences were as follows: Gp100, forward, AGCAC-CTGGAACCACATCTA, reverse, CCAGAGGGCGTTTGTGTAGT; B-actin, forward, AGAGGGAAATCGTGCGTGAC, reverse, CAA-TAGTGACCTGGCCGT; and Rtl19, forward, GGCAGTACC CTTC-CTCTTCC, reverse, AGCCTGTGACTGTCCATTCC.
Statistics. Statistical analysis was performed with 2-tailed unpaired (or paired when indicated) Student’s t test, Mann-Whitney U test, or 1- or 2-way ANOVA. Survival experiments were analyzed with log-rank test. P values of less than 0.05 were considered statistically significant. Different experimental groups were equally allocated among the same cage (5–6 mice/small cage, up to 12 mice in large cage). No experimen-
formed and the samples were subjected to flow cytometric analysis. For intracellular staining of IFN-γ and granzyme B, we used the Cyto-fix/Cytoperm Kit (BD), following the manufacturer’s instructions. Multicolor flow cytometry was performed with an LSRFortessa (BD) or with an X20-Fortessa (BD), and data were analyzed with FlowJo software (Tree Star Inc.).
Antibodies. For flow cytometry, we used the following antibod-ies: anti-CD3ε (clone 145-2C11), anti-CD4 (clone GK1.5), anti-CD11b (clone M1/70), CD11c (clone N418), anti-CD19 (clone 6D5), anti-CD69 (clone H1.2F3), anti-CD137 (clone 4-1BB, clone 17B5), anti-DNAM (clone 10E5), anti-F4/80 (clone BM8), anti-Ly6C (clone HK1.4), anti-Ly6G (clone 1A8), anti-Ly49A (clone YE1/48.10.6), anti-NKp46 (clone 29A1.4), anti–NKR-P1C (clone PK136), anti–PD-1 (clone 29F.1A12), anti–PD-L1 (clone 10F.9G2), anti-PVR (clone TX56), anti–Sca-1 (clone D7), anti-Ter119 (clone TER-119), and rat-IgG2a isotype control (Bio-Legend); anti-CD25 (clone PC61.5), anti-CD27 (clone 37.51), anti-CD45.1 (clone A20), anti-CD45.2 (clone 104), anti-Ki67 (clone SolA15), anti-mouse CD107a (clone eBio1D4B), anti-human CD107a (clone eBioH4A3), anti-KLRG1 (clone 2F1), anti-Ly49G2 (clone LGL-1), anti–MHC class I H-2Db (clone 28.14.8), anti–MHC class I H-2Kd (clone SF1-1.1.1), anti-NKG2A/C/E (clone 20d5), and anti-NKG2D (clone MI-6) (eBioscience); anti-CD25 (clone PC61), anti-Ly49I (clone YLI-90), and anti–granzyme B (GB11) (BD Biosciences — Pharmingen); anti-H60 (clone 205326), anti-MULT1 (clone 237104), anti-Nectin2 (clone 829038), and anti-pan-RAE-1 (186107) (R&D Systems). Anti-Ly49C (4LO3311) was a gift from S. Lemieux (l’Institut National de la Recher-che Scientifique–Institut Armand-Frappier, Laval, Quebec, Canada). Anti-m157 (6H121) was a gift from W. Yokoyama (Washington Univer-sity School of Medicine, St. Louis, Missouri, USA).
Viral transduction. A cDNA clone encoding WT mouse Pdl1 (gene ID 60533) was subcloned into the pQCXIN (provided by L. Coscoy, University of California, Berkeley) or MSCV-IRES-Thy1.1-DEST (Add-gene, 17442) retroviral expression vectors. A cDNA clone encoding WT mouse Pdcd1 (gene ID 18566) was subcloned into the 236pHAGE.EF1A expression vector (provided by R. Tjian, University of California, Berkeley). Cells expressing the vector were selected based on mCher-ry expression. m157-encoding plasmid was a gift of J. Sun (Memorial Sloan Kettering Cancer Center, New York, New York, USA). Expres-sion plasmids were amplified in DH5α bacterial cells and purified by Midi-Prep (QIAGEN).
Retro- and lentiviral expression vectors were generated by trans-fecting 293T cells with 2 μg vector with 2 μg packaging plus poly-merase-encoding plasmids using Lipofectamine 2000. Virus-contain-ing supernatants were used to transduce target cells by spin infection (800 g for 2 hours at 37°C) with 8 μg/ml polybrene. Transduced cells were sorted using an Influx Cell Sorter (BD) or selected by culturing in medium containing 1 mg/ml G418 for 48 hours, as indicated.
Generation of PD-L1–deficient mutants of the CT26 and 4T1 cell lines. Single-guide RNA (sgRNA) targeting the third exon of the Pdl1 gene (sequence: GTATGGCAGCAACGTCACGA) was cloned into the LentiCRISPR lentiviral backbone vector (Addgene), also containing the Cas9 gene. CT26 or 4T1 cells were transfected with 2 μg plasmid and, after 2 days, were treated with 20 ng/ml recombinant mouse IFN-γ (Peprotech). After 48 hours, cells that failed to upregulate PD-L1 were sorted. IFN-γ treatment and cell sorting were repeated for 3 cycles, after growing the cells for 5 days after each treatment. Cells were cultured extensively in the absence of IFN-γ before use.

The Journal of Clinical Investigation R E S E A R C H A R T I C L E
4 6 6 7jci.org Volume 128 Number 10 October 2018
qPCR analyses; and members of the Raulet Lab and Ardolino Lab for discussions. Giuseppe Sciumè critically read the manuscript. MA was supported by an Istituto Pasteur-Fondazione Cenci Bolog-netti postdoctoral fellowship and by a CRI Irvington fellowship. JH and CSA were supported by summer undergraduate research fel-lowships from Rose Hill. TWT was supported by a Student Train-ing in Tumor Immunology fellowship from the Cancer Research Institute. This work was supported by NIH grants R01-CA093678 and R01-AI113041 (to DHR), by a TELUS Ride for Dad grant from the Prostate Cancer Fight Foundation and a Canadian Institutes of Health Research project grant (to MA), and by grants from the Canadian Cancer Society and the Terry Fox Foundation (to JCB).
Address correspondence to: David H. Raulet, 485 LSA, Berke-ley, California 94720-3200, USA. Phone: 510.642.9521; Email: [email protected]. Or to: Michele Ardolino, 501 Smyth Road, Cancer Center, 3-328, Ottawa, Ontario, K1H8M2. Phone: 613.737.8899, ext. 77257; Email: [email protected].
tal blinding was necessary. In all experiments, when statistical analy-ses were performed, the compared groups had similar variance.
Study approval. All experiments were reviewed and approved by the Animal Care and Use Committee at the University of California, Berkeley, in accordance with the guidelines of the NIH and by Animal Care Veterinary Services at the University of Ottawa in accordance with the guidelines of Canadian Institutes of Health Research.
Author contributionsMA, JH, JJH, MM, MCBD, and CJN performed and analyzed experi-ments. TNT, CSA, AKS, HER, TWT, LZ, AI, KEJ, NM, GAK, MWM, and JCB assisted with experiments. MA and DHR conceived of the study, designed and interpreted experiments, and prepared the manuscript. All authors critically read the manuscript.
AcknowledgmentsWe thank Hector Nolla, Alma Valeros, and Vera Tang for help with cell sorting; Francesco Spallotta and C. Cencioni for help with
1. Topalian SL, et al. Safety, activity, and immune correlates of anti-PD-1 antibody in cancer. N Engl J Med. 2012;366(26):2443–2454.
2. Brahmer JR, et al. Safety and activity of anti-PD-L1 antibody in patients with advanced cancer. N Engl J Med. 2012;366(26):2455–2465.
3. Hamid O, et al. Safety and tumor responses with lambrolizumab (anti-PD-1) in melanoma. N Engl J Med. 2013;369(2):134–144.
4. Callahan MK, Postow MA, Wolchok JD. CTLA-4 and PD-1 pathway blockade: combinations in the clinic. Front Oncol. 2014;4:385.
5. Robert C, et al. Anti-programmed-death-receptor-1 treatment with pembrolizumab in ipilimumab-refractory advanced melanoma: a randomised dose-comparison cohort of a phase 1 trial. Lancet. 2014;384(9948):1109–1117.
6. Tumeh PC, et al. PD-1 blockade induces respons-es by inhibiting adaptive immune resistance. Nature. 2014;515(7528):568–571.
7. Herbst RS, et al. Predictive correlates of response to the anti-PD-L1 antibody MPDL3280A in can-cer patients. Nature. 2014;515(7528):563–567.
8. Powles T, et al. MPDL3280A (anti-PD-L1) treat-ment leads to clinical activity in metastatic blad-der cancer. Nature. 2014;515(7528):558–562.
9. Robert C, et al. Nivolumab in previously untreat-ed melanoma without BRAF mutation. N Engl J Med. 2015;372(4):320–330.
10. Garrido F, Algarra I. MHC antigens and tumor escape from immune surveillance. Adv Cancer Res. 2001;83:117–158.
11. Aptsiauri N, Cabrera T, Garcia-Lora A, Lopez-Nevot MA, Ruiz-Cabello F, Garrido F. MHC class I antigens and immune surveillance in trans-formed cells. Int Rev Cytol. 2007;256:139–189.
12. Ansell SM, et al. PD-1 blockade with nivolumab in relapsed or refractory Hodgkin’s lymphoma. N Engl J Med. 2015;372(4):311–319.
13. Ansell SM. Hodgkin lymphoma: MOPP che-motherapy to PD-1 blockade and beyond. Am J Hematol. 2016;91(1):109–112.
14. Zaretsky JM, et al. Mutations associated with acquired resistance to PD-1 blockade in mela-
noma. N Engl J Med. 2016;375(9):819–829. 15. Šmahel M. PD-1/PD-L1 blockade therapy for
tumors with downregulated MHC class I expres-sion. Int J Mol Sci. 2017;18(6):E1331.
16. Aust S, et al. Absence of PD-L1 on tumor cells is associated with reduced MHC I expression and PD-L1 expression increases in recurrent serous ovarian cancer. Sci Rep. 2017;7:42929.
17. McGranahan N, et al. Allele-specific HLA loss and immune escape in lung cancer evolution. Cell. 2017;171(6):1259–1271.e11.
18. Marty R, et al. MHC-I genotype restricts the oncogenic mutational landscape. Cell. 2017;171(6):1272–1283.e15.
19. Roemer MG, et al. Classical Hodgkin lymphoma with reduced β2M/MHC class I expression is associated with inferior outcome indepen-dent of 9p24.1 status. Cancer Immunol Res. 2016;4(11):910–916.
20. Vivier E, et al. Innate or adaptive immunity? The example of natural killer cells. Science. 2011;331(6013):44–49.
21. Marcus A, et al. Recognition of tumors by the innate immune system and natural killer cells. Adv Immunol. 2014;122:91–128.
22. Ruggeri L, et al. Role of natural killer cell allore-activity in HLA-mismatched hematopoietic stem cell transplantation. Blood. 1999;94(1):333–339.
23. Giebel S, et al. Survival advantage with KIR ligand incompatibility in hematopoietic stem cell transplantation from unrelated donors. Blood. 2003;102(3):814–819.
24. Beelen DW, et al. Genotypic inhibitory killer immunoglobulin-like receptor ligand incompat-ibility enhances the long-term antileukemic effect of unmodified allogeneic hematopoietic stem cell transplantation in patients with myeloid leukemias. Blood. 2005;105(6):2594–2600.
25. Verheyden S, Schots R, Duquet W, Demanet C. A defined donor activating natural killer cell receptor genotype protects against leukemic relapse after related HLA-identical hemato-poietic stem cell transplantation. Leukemia. 2005;19(8):1446–1451.
26. Miller JS, et al. Missing KIR ligands are associated with less relapse and increased graft-versus-host disease (GVHD) following unrelated donor allo-geneic HCT. Blood. 2007;109(11):5058–5061.
27. Kim HJ, et al. The activating killer cell immu-noglobulin-like receptors as important deter-minants of acute graft-versus host disease in hematopoietic stem cell transplantation for acute myelogenous leukemia. Transplantation. 2007;84(9):1082–1091.
28. Willemze R, et al. KIR-ligand incompatibility in the graft-versus-host direction improves outcomes after umbilical cord blood transplantation for acute leukemia. Leukemia. 2009;23(3):492–500.
29. Giebel S, et al. Activating killer immunoglobulin-like receptor incompatibilities enhance graft-versus-host disease and affect survival after allo-geneic hematopoietic stem cell transplantation. Eur J Haematol. 2009;83(4):343–356.
30. Cooley S, et al. Donor selection for natural killer cell receptor genes leads to superior survival after unrelated transplantation for acute myelogenous leukemia. Blood. 2010;116(14):2411–2419.
31. Malmberg KJ, Carlsten M, Björklund A, Sohlberg E, Bryceson YT, Ljunggren HG. Natural killer cell-mediated immunosurveillance of human cancer. Semin Immunol. 2017;31:20–29.
32. Coca S, et al. The prognostic significance of intratu-moral natural killer cells in patients with colorectal carcinoma. Cancer. 1997;79(12):2320–2328.
33. Ishigami S, et al. Prognostic value of intratumoral natural killer cells in gastric carcinoma. Cancer. 2000;88(3):577–583.
34. Villegas FR, et al. Prognostic significance of tumor infiltrating natural killer cells subset CD57 in patients with squamous cell lung cancer. Lung Cancer. 2002;35(1):23–28.
35. Schleypen JS, et al. Cytotoxic markers and fre-quency predict functional capacity of natural killer cells infiltrating renal cell carcinoma. Clin Cancer Res. 2006;12(3 Pt 1):718–725.
36. McKay K, Moore PC, Smoller BR, Hiatt KM. Association between natural killer cells and regression in melanocytic lesions. Hum Pathol.

The Journal of Clinical Investigation R E S E A R C H A R T I C L E
4 6 6 8 jci.org Volume 128 Number 10 October 2018
2011;42(12):1960–1964. 37. Pasero C, et al. Highly effective NK cells are
associated with good prognosis in patients with metastatic prostate cancer. Oncotarget. 2015;6(16):14360–14373.
38. Shifrin N, Raulet DH, Ardolino M. NK cell self tolerance, responsiveness and missing self recog-nition. Semin Immunol. 2014;26(2):138–144.
39. Iannello A, Thompson TW, Ardolino M, Marcus A, Raulet DH. Immunosurveillance and immu-notherapy of tumors by innate immune cells. Curr Opin Immunol. 2016;38:52–58.
40. Benson DM, et al. The PD-1/PD-L1 axis modulates the natural killer cell versus multiple myeloma effect: a therapeutic target for CT-011, a novel monoclonal anti-PD-1 antibody. Blood. 2010;116(13):2286–2294.
41. Beldi-Ferchiou A, et al. PD-1 mediates func-tional exhaustion of activated NK cells in patients with Kaposi sarcoma. Oncotarget. 2016;7(45):72961–72977.
42. Pesce S, et al. Identification of a subset of human natural killer cells expressing high levels of programmed death 1: A phenotypic and func-tional characterization. J Allergy Clin Immunol. 2017;139(1):335–346.e3.
43. Liu Y, et al. Increased expression of programmed cell death protein 1 on NK cells inhibits NK-cell-mediated anti-tumor function and indicates poor prognosis in digestive cancers. Oncogene. 2017;36(44):6143–6153.
44. Vari F, et al. Immune evasion via PD-1/PD-L1 on NK cells and monocyte/macrophages is more prominent in Hodgkin lymphoma than DLBCL. Blood. 2018;131(16):1809–1819.
45. Kärre K, Ljunggren HG, Piontek G, Kiessling R. Selective rejection of H-2-deficient lymphoma variants suggests alternative immune defence strategy. Nature. 1986;319(6055):675–678.
46. Matsumoto K, et al. Exosomes secreted from monocyte-derived dendritic cells support in vitro naive CD4+ T cell survival through NF-(kappa)B activation. Cell Immunol. 2004;231(1–2):20–29.
47. Ardolino M, et al. Cytokine therapy reverses NK cell anergy in MHC-deficient tumors. J Clin Invest. 2014;124(11):4781–4794.
48. Seaman WE, Sleisenger M, Eriksson E, Koo GC. Depletion of natural killer cells in mice by monoclonal antibody to NK-1.1. Reduction in host defense against malignancy without loss of cellular or humoral immunity. J Immunol. 1987;138(12):4539–4544.
49. Sorensen MR, Pedersen SR, Lindkvist A, Christensen JP, Thomsen AR. Quantification of B16 melanoma cells in lungs using triplex Q-PCR--a new approach to evaluate melanoma
cell metastasis and tumor control. PLoS ONE. 2014;9(1):e87831.
50. Castle JC, et al. Immunomic, genomic and tran-scriptomic characterization of CT26 colorectal carcinoma. BMC Genomics. 2014;15:190.
51. Chiossone L, Chaix J, Fuseri N, Roth C, Vivier E, Walzer T. Maturation of mouse NK cells is a 4-stage developmental program. Blood. 2009;113(22):5488–5496.
52. Joncker NT, Fernandez NC, Treiner E, Vivier E, Raulet DH. NK cell responsiveness is tuned com-mensurate with the number of inhibitory recep-tors for self-MHC class I: the rheostat model. J Immunol. 2009;182(8):4572–4580.
53. Joncker NT, Shifrin N, Delebecque F, Raulet DH. Mature natural killer cells reset their responsive-ness when exposed to an altered MHC environ-ment. J Exp Med. 2010;207(10):2065–2072.
54. Elliott JM, Wahle JA, Yokoyama WM. MHC class I-deficient natural killer cells acquire a licensed phenotype after transfer into an MHC class I-sufficient environment. J Exp Med. 2010;207(10):2073–2079.
55. Huang AC, et al. T-cell invigoration to tumour burden ratio associated with anti-PD-1 response. Nature. 2017;545(7652):60–65.
56. Martincorena I, Campbell PJ. Somatic muta-tion in cancer and normal cells. Science. 2015;349(6255):1483–1489.
57. Van Allen EM, et al. Genomic correlates of response to CTLA-4 blockade in metastatic melanoma. Science. 2015;350(6257):207–211.
58. Deeken JF, et al. A phase I study of liposomal-encapsulated docetaxel (LE-DT) in patients with advanced solid tumor malignancies. Cancer Che-mother Pharmacol. 2013;71(3):627–633.
59. McGranahan N, et al. Clonal neoantigens elicit T cell immunoreactivity and sensitiv-ity to immune checkpoint blockade. Science. 2016;351(6280):1463–1469.
60. Garrido F, Cabrera T, Lopez-Nevot MA, Ruiz-Cabello F. HLA class I antigens in human tumors. Adv Cancer Res. 1995;67:155–195.
61. Raulet DH, Guerra N. Oncogenic stress sensed by the immune system: role of natural killer cell receptors. Nat Rev Immunol. 2009;9(8):568–580.
62. Paschen A, Baingo J, Schadendorf D. Expression of stress ligands of the immunoreceptor NKG2D in melanoma: regulation and clinical signifi-cance. Eur J Cell Biol. 2014;93(1-2):49–54.
63. Zhang J, Basher F, Wu JD. NKG2D ligands in tumor immunity: two sides of a coin. Front Immunol. 2015;6:97.
64. Fionda C, Soriani A, Zingoni A, Santoni A, Cipp-itelli M. NKG2D and DNAM-1 ligands: molecular targets for NK cell-mediated immunotherapeutic
intervention in multiple myeloma. Biomed Res Int. 2015;2015:178698.
65. Zingoni A, Fionda C, Borrelli C, Cippitelli M, Santoni A, Soriani A. Natural killer cell response to chemotherapy-stressed cancer cells: role in tumor immunosurveillance. Front Immunol. 2017;8:1194.
66. Gordon SR, et al. PD-1 expression by tumour-associated macrophages inhibits phagocytosis and tumour immunity. Nature. 2017;545(7655):495–499.
67. Schietinger A, et al. Tumor-specific T cell dys-function is a dynamic antigen-driven differentia-tion program initiated early during tumorigen-esis. Immunity. 2016;45(2):389–401.
68. Legat A, Speiser DE, Pircher H, Zehn D, Fuertes Marraco SA. Inhibitory receptor expression depends more dominantly on differentiation and activation than “exhaustion” of human CD8 T cells. Front Immunol. 2013;4:455.
69. Terme M, et al. IL-18 induces PD-1-dependent immunosuppression in cancer. Cancer Res. 2011;71(16):5393–5399.
70. Mittal D, et al. Antimetastatic effects of blocking PD-1 and the adenosine A2A receptor. Cancer Res. 2014;74(14):3652–3658.
71. Romagné F, et al. Preclinical characterization of 1-7F9, a novel human anti-KIR receptor therapeutic antibody that augments natural killer-mediated killing of tumor cells. Blood. 2009;114(13):2667–2677.
72. Kohrt HE, et al. Stimulation of natural killer cells with a CD137-specific antibody enhances trastu-zumab efficacy in xenotransplant models of breast cancer. J Clin Invest. 2012;122(3):1066–1075.
73. Deng W, et al. Antitumor immunity. A shed NKG2D ligand that promotes natural killer cell activation and tumor rejection. Science. 2015;348(6230):136–139.
74. Triebel F, et al. LAG-3, a novel lymphocyte acti-vation gene closely related to CD4. J Exp Med. 1990;171(5):1393–1405.
75. Stojanovic A, Fiegler N, Brunner-Weinzierl M, Cerwenka A. CTLA-4 is expressed by activated mouse NK cells and inhibits NK Cell IFN-γ pro-duction in response to mature dendritic cells. J Immunol. 2014;192(9):4184–4191.
76. Chan CJ, et al. The receptors CD96 and CD226 oppose each other in the regulation of natural killer cell functions. Nat Immunol. 2014;15(5):431–438.
77. Guerra N, et al. NKG2D-deficient mice are defec-tive in tumor surveillance in models of spontane-ous malignancy. Immunity. 2008;28(4):571–580.
78. Kirsch DG, et al. A spatially and temporally restricted mouse model of soft tissue sarcoma. Nat Med. 2007;13(8):992–997.