Median Growth Percentile (MGP)
46
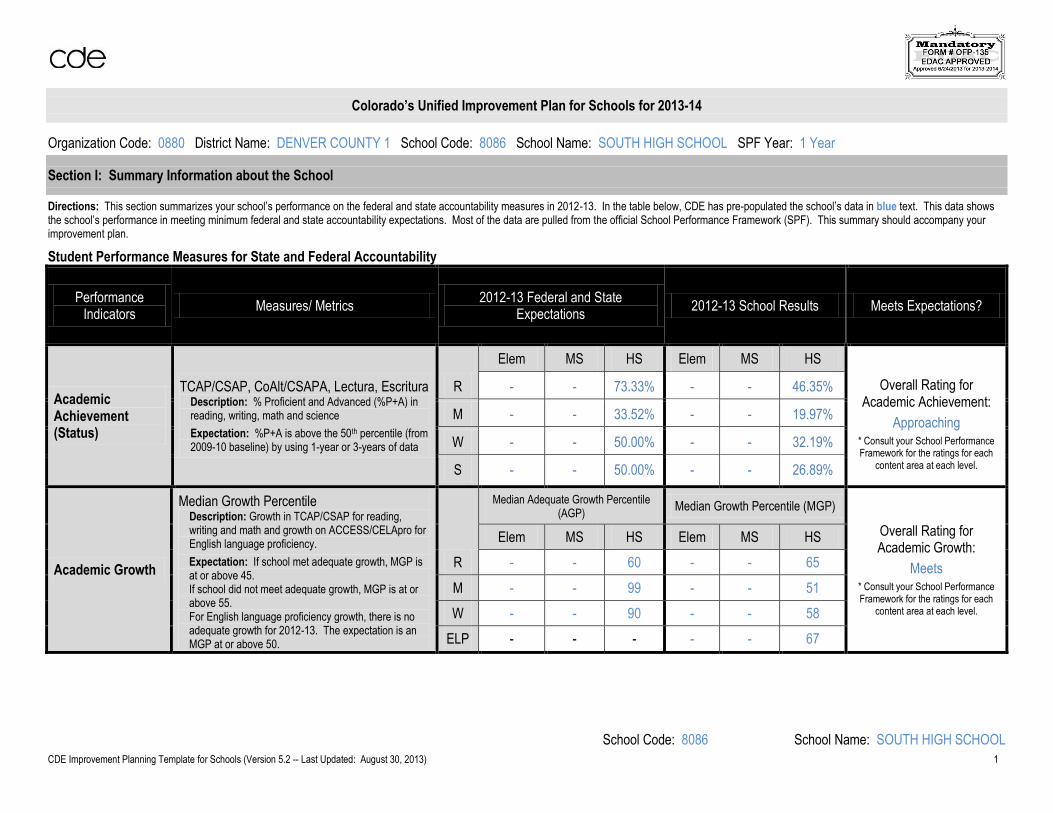
School Code: 8086 School Name: SOUTH HIGH SCHOOL CDE Improvement Planning Template for Schools (Version 5.2 -- Last Updated: August 30, 2013) 1 Colorado’s Unified Improvement Plan for Schools for 2013-14 Organization Code: 0880 District Name: DENVER COUNTY 1 School Code: 8086 School Name: SOUTH HIGH SCHOOL SPF Year: 1 Year Section I: Summary Information about the School Directions: This section summarizes your school’s performance on the federal and state accountability measures in 2012-13. In the table below, CDE has pre-populated the school’s data in blue text. This data shows the school’s performance in meeting minimum federal and state accountability expectations. Most of the data are pulled from the official School Performance Framework (SPF). This summary should accompany your improvement plan. Student Performance Measures for State and Federal Accountability Performance Indicators Measures/ Metrics 2012-13 Federal and State Expectations 2012-13 School Results Meets Expectations? Academic Achievement (Status) TCAP/CSAP, CoAlt/CSAPA, Lectura, Escritura Description: % Proficient and Advanced (%P+A) in reading, writing, math and science Expectation: %P+A is above the 50 th percentile (from 2009-10 baseline) by using 1-year or 3-years of data R Elem MS HS Elem MS HS Overall Rating for Academic Achievement: Approaching * Consult your School Performance Framework for the ratings for each content area at each level. - - 73.33% - - 46.35% M - - 33.52% - - 19.97% W - - 50.00% - - 32.19% S - - 50.00% - - 26.89% Academic Growth Median Growth Percentile Description: Growth in TCAP/CSAP for reading, writing and math and growth on ACCESS/CELApro for English language proficiency. Expectation: If school met adequate growth, MGP is at or above 45. If school did not meet adequate growth, MGP is at or above 55. For English language proficiency growth, there is no adequate growth for 2012-13. The expectation is an MGP at or above 50. R Median Adequate Growth Percentile (AGP) Median Growth Percentile (MGP) Overall Rating for Academic Growth: Meets * Consult your School Performance Framework for the ratings for each content area at each level. Elem MS HS Elem MS HS - - 60 - - 65 M - - 99 - - 51 W - - 90 - - 58 ELP - - - - - 67
Transcript of Median Growth Percentile (MGP)
School Code: 8086 School Name: SOUTH HIGH SCHOOL
CDE Improvement Planning Template for Schools (Version 5.2 -- Last Updated: August 30, 2013) 1
Colorado’s Unified Improvement Plan for Schools for 2013-14
Organization Code: 0880 District Name: DENVER COUNTY 1 School Code: 8086 School Name: SOUTH HIGH SCHOOL SPF Year: 1 Year
Section I: Summary Information about the School
Directions: This section summarizes your school’s performance on the federal and state accountability measures in 2012-13. In the table below, CDE has pre-populated the school’s data in blue text. This data shows the school’s performance in meeting minimum federal and state accountability expectations. Most of the data are pulled from the official School Performance Framework (SPF). This summary should accompany your improvement plan.
Student Performance Measures for State and Federal Accountability
Performance Indicators
Measures/ Metrics 2012-13 Federal and State
Expectations 2012-13 School Results Meets Expectations?
Academic Achievement (Status)
TCAP/CSAP, CoAlt/CSAPA, Lectura, Escritura
Description: % Proficient and Advanced (%P+A) in reading, writing, math and science
Expectation: %P+A is above the 50th percentile (from 2009-10 baseline) by using 1-year or 3-years of data
R
Elem MS HS Elem MS HS
Overall Rating for Academic Achievement:
Approaching
* Consult your School Performance Framework for the ratings for each
content area at each level.
- - 73.33% - - 46.35%
M - - 33.52% - - 19.97%
W - - 50.00% - - 32.19%
S - - 50.00% - - 26.89%
Academic Growth
Median Growth Percentile Description: Growth in TCAP/CSAP for reading, writing and math and growth on ACCESS/CELApro for English language proficiency.
Expectation: If school met adequate growth, MGP is at or above 45. If school did not meet adequate growth, MGP is at or above 55. For English language proficiency growth, there is no adequate growth for 2012-13. The expectation is an MGP at or above 50.
R
Median Adequate Growth Percentile (AGP)
Median Growth Percentile (MGP)
Overall Rating for Academic Growth:
Meets * Consult your School Performance Framework for the ratings for each
content area at each level.
Elem MS HS Elem MS HS
- - 60 - - 65
M - - 99 - - 51
W - - 90 - - 58
ELP - - - - - 67

School Code: 8086 School Name: SOUTH HIGH SCHOOL
CDE Improvement Planning Template for Schools (Version 5.2 -- Last Updated: August 30, 2013) 2
Student Performance Measures for State and Federal Accountability (cont.)
Performance Indicators
Measures/ Metrics 2012-13 Federal and State
Expectations 2012-13 School Results Meets Expectations?
Academic Growth Gaps
Median Growth Percentile Description: Growth for reading, writing and math by disaggregated groups.
Expectation: If disaggregated groups met adequate growth, MGP is at or above 45. If disaggregated groups did not meet adequate growth, MGP is at or above 55.
See your School Performance Framework for listing of median adequate growth expectations for your school’s disaggregated groups, including free/reduced lunch eligible, minority students, students with disabilities, English Language Learners (ELLs) and students below proficient.
See your School Performance Framework for listing of median growth by each disaggregated group.
Overall Rating for Growth Gaps:
Meets
* Consult your School Performance Framework for the ratings for each student disaggregated group at each content area at each level.
Postsecondary & Workforce Readiness
Graduation Rate Expectation: At 80% or above on the best of 4-year, 5-year, 6-year or 7-year graduation rate.
At 80% or above Best of 4-year through 7- year Grad Rate
Approaching
Overall Rating for
Postsecondary & Workforce Readiness:
Approaching
74.9% using a 6 year grad rate
Disaggregated Graduation Rate Expectation: At 80% or above on the disaggregated group’s best of 4-year, 5-year, 6-year or 7-year graduation rate.
At 80% or above for each disaggregated group
See your School Performance Framework for listing of 4-year, 5-year, 6-year and 7-year graduation rates for disaggregated groups, including free/reduced lunch eligible, minority students, students with disabilities, and ELLs.
Approaching
Dropout Rate
Expectation: At or below state average overall. 3.6% 3.5% Meets
Mean Colorado ACT Composite Score
Expectation: At or above state average. 20.0 16.4
Does Not Meet

School Code: 8086 School Name: SOUTH HIGH SCHOOL
CDE Improvement Planning Template for Schools (Version 5.2 -- Last Updated: August 30, 2013) 3
Accountability Status and Requirements for Improvement Plan
Denver Public Schools
Summary of School
Plan Timeline
October 16, 2013 All schools must upload their UIP to the ARE website via the DPS Unified Improvement Plan Upload Tool
December 13, 2014 All schools must upload their updated UIP to the ARE website via the DPS Unified Improvement Plan Upload Tool
January 6, 2014 UIPs of turnaround and priority improvement schools (per CDE SPF) are sent by ARE to CDE for review.
April 9, 2014 All schools must submit their updated UIP to the ARE website via the DPS Unified Improvement Plan Upload Tool for
public viewing at www.schoolview.org
Program Identification Process Identification for School Directions for Completing Improvement Plan
State Accountability
Plan Type Assignment
ESEA and Grant Accountability
Title I Focus School
Title I school with a (1) low graduation rate (regardless of plan type), and/or (2) Turnaround or Priority Improvement plan type with either (or both) a) low-achieving disaggregated student groups (i.e., minority, ELL, IEP and FRL) or b) low disaggregated graduation rate. This is a three-year designation.
Not identified as a Title I Focus School
This school is not identified as a Focus School and does not need to meet those additional requirements.
Tiered Intervention Grant (TIG)
Competitive grant (1003g) for schools identified as 5% of lowest performing Title I or Title I eligible schools, eligible to implement one of four reform models as defined by the USDE.
Not awarded a TIG grant This school does not receive a TIG grant and does not need to meet those additional requirements.
Colorado Graduation Pathways Program (CGP)
The program supports the development of sustainable, replicable models for dropout prevention and recovery that improve interim indicators (attendance, behavior and course completion), reduce the dropout rate and increase the graduation rate for all students participating in the program.
Not a CGP Funded School This school does not receive funding from the CGP Program and does not need to meet these additional program requirements.

School Code: 8086 School Name: SOUTH HIGH SCHOOL
CDE Improvement Planning Template for Schools (Version 5.2 -- Last Updated: August 30, 2013) 4
Section II: Improvement Plan Information
Additional Information about the School
Comprehensive Review and Selected Grant History
Related Grant Awards Has the school received a grant that supports the school’s improvement efforts? When was the grant awarded?
Colorado Legacy Foundation Grant- Focus providing AP classes to diverse populations, supporting AP students and teachers toward earning credit and passing AP exams with a score of 3,4, or 5.
School Support Team or Expedited Review
Has (or will) the school participated in an SST or Expedited Review? If so, when?
External Evaluator Has the school partnered with an external evaluator to provide comprehensive evaluation? Indicate the year and the name of the provider/tool used.
Improvement Plan Information
The school is submitting this improvement plan to satisfy requirements for (check all that apply):
State Accreditation Title I Focus School Tiered Intervention Grant (TIG) Colorado Graduation Pathways Program (CGP)
Other: ______________________________________________________________________________
School Contact Information (Additional contacts may be added, if needed)
1 Name and Title Kristin E. Waters
Email [email protected]
Phone 720-423-6041
Mailing Address 1700 E Louisiana St. Denver, CO 80210
2 Name and Title Kelly Carr
Email [email protected]
Phone 720-423-6084
Mailing Address 1700 E Louisiana St. Denver, CO 80210

School Code: 8086 School Name: SOUTH HIGH SCHOOL
CDE Improvement Planning Template for Schools (Version 5.2 -- Last Updated: August 30, 2013) 5
Section III: Narrative on Data Analysis and Root Cause Identification
This section corresponds with the “Evaluate” portion of the continuous improvement cycle. The main outcome is to construct a narrative that describes the process and results of the analysis of the data for your school. The analysis should justify the performance targets and actions proposed in Section IV. Two worksheets have been provided to help organize your data analysis for your narrative. This analysis section includes: identifying where the school did not at least meet minimum state and federal accountability expectations; describing progress toward targets for the prior school year; describing what performance data were used in the analysis of trends; identifying trends and priority performance challenges (negative trends); describing how performance challenges were prioritized; identifying the root causes of performance challenges; describing how the root causes were identified and verified and what data were used; and describing stakeholder involvement in the analysis. Additional guidance on how to engage in the data analysis process is provided in the Unified Improvement Planning Handbook. Data Narrative for School Directions: In the narrative, describe the process and results of the data analysis for the school, including (1) a description of the school and the process for data analysis, (2) a review of current performance, (3) trend analysis, (4) priority performance challenges and (5) root cause analysis. A description of the expected narrative sections are included below. The narrative should not take more than five pages. Two worksheets (#1 Progress Monitoring of Prior Year’s Performance Targets and #2 Data Analysis) have been provided to organize the data referenced in the narrative.
Data Narrative for School
Description of School Setting and Process for Data Analysis: Provide a very brief description of the school to set the context for readers (e.g., demographics). Include the general process for developing the UIP and participants (e.g., SAC).
Review Current Performance: Review the SPF and local data. Document any areas where the school did not at least meet state/federal expectations. Consider the previous year’s progress toward the school’s targets. Identify the overall magnitude of the school’s performance challenges.
Trend Analysis: Provide a description of the trend analysis that includes at least three years of data (state and local data). Trend statements should be provided in the four performance indicator areas and by disaggregated groups. Trend statements should include the direction of the trend and a comparison (e.g., state expectations, state average) to indicate why the trend is notable.
Priority Performance Challenges: Identify notable trends (or a combination of trends) that are the highest priority to address (priority performance challenges). No more than 3-5 are recommended. Provide a rationale for why these challenges have been selected and address the magnitude of the school’s overall performance challenges.
Root Cause Analysis: Identify at least one root cause for every priority performance challenge. Root causes should address adult actions, be under the control of the school, and address the priority performance challenge(s). Provide evidence that the root cause was verified through the use of additional data. A description of the selection process for the corresponding major improvement strategies is encouraged.
Narrative:
Data Narrative
Denver South High School offers a cross-cultural academic experience that challenges all students to attain the highest levels of academic success. Hailing from through-out Denver and across the globe, South’s student body meets in the beautiful Washington Park neighborhood to collaborate and mast the skills needed to excel in college and today’s world economy. Academic programs such as Advanced Placement and Honors, AVID, and ELA challenge students in grades 9-12 to reach new levels of individual achievement. From the classroom to athletics and enrichments, the world gathers at Denver South High School to prepare for the future.
Listen to our students talk about Denver South HS!
http://www.youtube.com/watch?v=PpVFa5-qsYw&feature=youtu.be&safety_mode=true&persist_safety_mode=1&safe=active
School Code: 8086 School Name: SOUTH HIGH SCHOOL
CDE Improvement Planning Template for Schools (Version 5.2 -- Last Updated: August 30, 2013) 6
UIP Planning Process:
During the 2013-2014 school year, the data and strategies were presented to and reviewed by the CSC, the Instructional Council, the teaching staff, and the PTSA. Feedback is on-going.
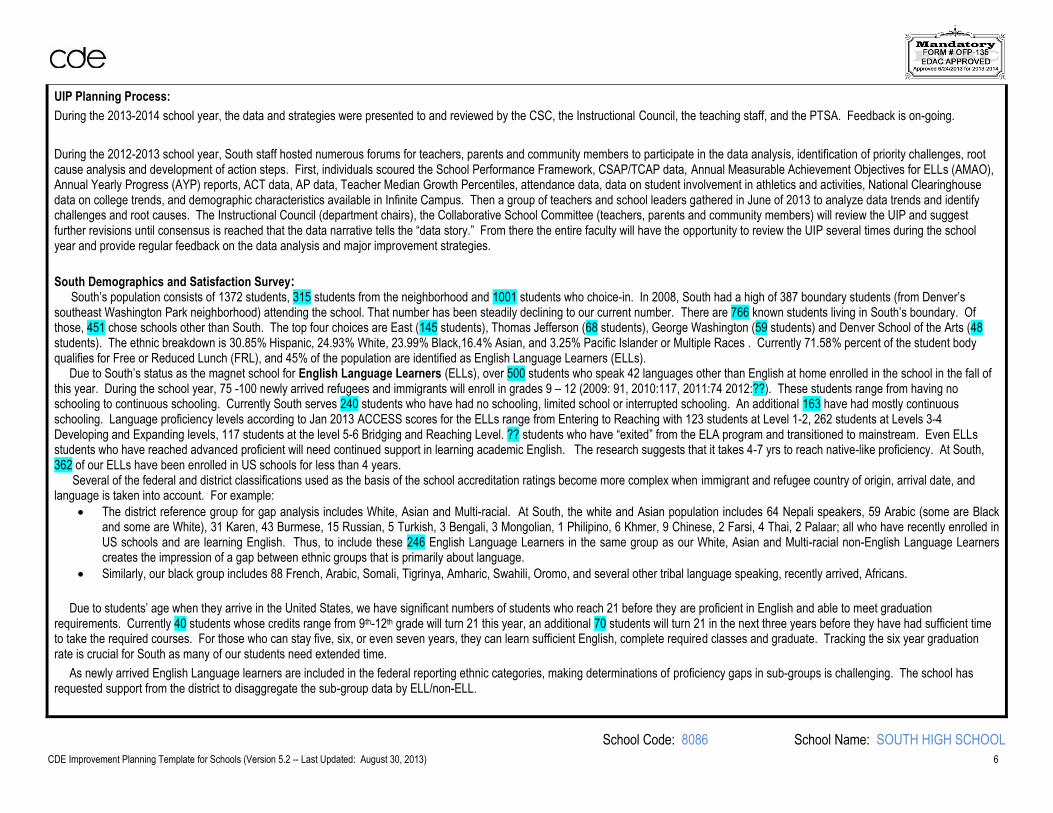
During the 2012-2013 school year, South staff hosted numerous forums for teachers, parents and community members to participate in the data analysis, identification of priority challenges, root cause analysis and development of action steps. First, individuals scoured the School Performance Framework, CSAP/TCAP data, Annual Measurable Achievement Objectives for ELLs (AMAO), Annual Yearly Progress (AYP) reports, ACT data, AP data, Teacher Median Growth Percentiles, attendance data, data on student involvement in athletics and activities, National Clearinghouse data on college trends, and demographic characteristics available in Infinite Campus. Then a group of teachers and school leaders gathered in June of 2013 to analyze data trends and identify challenges and root causes. The Instructional Council (department chairs), the Collaborative School Committee (teachers, parents and community members) will review the UIP and suggest further revisions until consensus is reached that the data narrative tells the “data story.” From there the entire faculty will have the opportunity to review the UIP several times during the school year and provide regular feedback on the data analysis and major improvement strategies.
South Demographics and Satisfaction Survey: South’s population consists of 1372 students, 315 students from the neighborhood and 1001 students who choice-in. In 2008, South had a high of 387 boundary students (from Denver’s southeast Washington Park neighborhood) attending the school. That number has been steadily declining to our current number. There are 766 known students living in South’s boundary. Of those, 451 chose schools other than South. The top four choices are East (145 students), Thomas Jefferson (68 students), George Washington (59 students) and Denver School of the Arts (48 students). The ethnic breakdown is 30.85% Hispanic, 24.93% White, 23.99% Black,16.4% Asian, and 3.25% Pacific Islander or Multiple Races . Currently 71.58% percent of the student body qualifies for Free or Reduced Lunch (FRL), and 45% of the population are identified as English Language Learners (ELLs). Due to South’s status as the magnet school for English Language Learners (ELLs), over 500 students who speak 42 languages other than English at home enrolled in the school in the fall of this year. During the school year, 75 -100 newly arrived refugees and immigrants will enroll in grades 9 – 12 (2009: 91, 2010:117, 2011:74 2012:??). These students range from having no schooling to continuous schooling. Currently South serves 240 students who have had no schooling, limited school or interrupted schooling. An additional 163 have had mostly continuous schooling. Language proficiency levels according to Jan 2013 ACCESS scores for the ELLs range from Entering to Reaching with 123 students at Level 1-2, 262 students at Levels 3-4 Developing and Expanding levels, 117 students at the level 5-6 Bridging and Reaching Level. ?? students who have “exited” from the ELA program and transitioned to mainstream. Even ELLs students who have reached advanced proficient will need continued support in learning academic English. The research suggests that it takes 4-7 yrs to reach native-like proficiency. At South, 362 of our ELLs have been enrolled in US schools for less than 4 years. Several of the federal and district classifications used as the basis of the school accreditation ratings become more complex when immigrant and refugee country of origin, arrival date, and language is taken into account. For example:
The district reference group for gap analysis includes White, Asian and Multi-racial. At South, the white and Asian population includes 64 Nepali speakers, 59 Arabic (some are Black and some are White), 31 Karen, 43 Burmese, 15 Russian, 5 Turkish, 3 Bengali, 3 Mongolian, 1 Philipino, 6 Khmer, 9 Chinese, 2 Farsi, 4 Thai, 2 Palaar; all who have recently enrolled in US schools and are learning English. Thus, to include these 246 English Language Learners in the same group as our White, Asian and Multi-racial non-English Language Learners creates the impression of a gap between ethnic groups that is primarily about language.
Similarly, our black group includes 88 French, Arabic, Somali, Tigrinya, Amharic, Swahili, Oromo, and several other tribal language speaking, recently arrived, Africans.
Due to students’ age when they arrive in the United States, we have significant numbers of students who reach 21 before they are proficient in English and able to meet graduation requirements. Currently 40 students whose credits range from 9th-12th grade will turn 21 this year, an additional 70 students will turn 21 in the next three years before they have had sufficient time to take the required courses. For those who can stay five, six, or even seven years, they can learn sufficient English, complete required classes and graduate. Tracking the six year graduation rate is crucial for South as many of our students need extended time.
As newly arrived English Language learners are included in the federal reporting ethnic categories, making determinations of proficiency gaps in sub-groups is challenging. The school has requested support from the district to disaggregate the sub-group data by ELL/non-ELL.

School Code: 8086 School Name: SOUTH HIGH SCHOOL
CDE Improvement Planning Template for Schools (Version 5.2 -- Last Updated: August 30, 2013) 7
Languages spoken at South HS:
English 633 Oromo, West-Central
7 Uzbek 2
Spanish 229 Khmer 6 Pulaar 2
Nepali 64 Turkish 5 Sidama 2
Arabic 59 Twi 5 Luganda 1
Burmese 43 Kirundi 5 Grebo 1
Veitnamese 34 Japanese 4 Philipino 1
Solami 33 Thai 4 Indonesian 1
Karen 31 Bengali 3 Lithuanian 1
Tigrinya 26 Mongolian 3 Chinese 1
French 22 Creole 3 Rundi 1
Swahili 18 Korean 3 Fulani 1
Russian 15 Farsi, Eastern 2 Nuer 1
Chinese, Mandarin 9 Igbo 2 German 1
Amharic 8 Rwanda 2 Lao 1
Bosnian 2
On the satisfaction survey, 92% of the students surveyed responded that they felt like they were getting a good education at the school which was a 1% decrease over 2012. Ninety-three percent of students felt that they knew what they needed to do to learn and make progress in their classes and 91% felt that the time in classes was spent on learning. Sixty-nine percent felt like discipline for students who break rules was consistent and fair while 81% expressed that they felt safe at school. 88% of students felt that teachers treated them with respect and 89% felt that most teachers encourage them to do their best. Almost all students (97%) felt that their families believed education would make them more successful in the future and 89% responded that the school provided them with education about college.
Parents (213 respondents) overall felt satisfied with the school (81.62%). They concurred that their children felt safe (89%). Over 82% felt that parents were treated with respect and encouraged to be involved in the school.
SPF 2011 2012 2013
Enrollment 1359 1313 1372
FRL 72% 74% 72%
ELLs 45% 45% 42%
SPED 9% 9% 9%

School Code: 8086 School Name: SOUTH HIGH SCHOOL
CDE Improvement Planning Template for Schools (Version 5.2 -- Last Updated: August 30, 2013) 8
Minority Combined 57% 57% 54%
Trend Analysis, Priority Challenges, Root Causes and Verification
Achievement Data: CSAP/TCAP achievement data has remained relatively stable or has grown in all content areas and across all sub groups over the last four years. We chose not to analyze data by ethnicity because our ethnicity does not follow traditional ethnic groupings. Additionally, our team based our breakdown on ELL vs ethnicity or FRL because of our students less than 2% of students are advanced on CSAP/TCAP. While students who are proficient and advanced generally stay at those levels, only 49% of math students stay on grade level. On ACCESS 23% of ELL students reach proficiency, while the DPS School Performance Framework (SPF) expectation is 50%. Our priority challenge is to continue to break this trend and increase proficiency in all content areas, including language development. One primary root cause for our recent success has been the consistency in administrative leadership over the past three years. Previously South HS has had three principals over six years, with numerous changes in assistant principals during that same time period. We believe a second root cause lies in a specified approach to professional development and multiple, changing, improvement initiatives that have begun to sufficiently differentiate for students at different points in their development. PD structural changes were made during the 12-13 school year, and many staff reported that the training sometimes felt more consistent and connected because of common areas of focus and but allowing for the large group to be split into smaller groups appropriate for specific content areas or need. This was supported by the school wide teacher choice to pursue differentiation as the topic of professional development. Additionally, 16% of parents felt that coursework was not sufficiently rigorous. A third root cause toward our continued need to grow may be that not all teachers have identified essential learning goals for each course and tracked student progress toward these goals as needed. During the 12-13 school year, Essential Learning Goals were identified, but limited student progress monitoring was done to meet those goals. A fourth root cause may be that we have not provided or communicated to students and parents with sufficient purpose the understanding of the different assessments nor the meaning of their test scores. We feel that if students and parents were more data literate about their standardized assessments, their grade point average (GPA), and their credits and how they relate to college entrance requirements, they may be able to set achievement goals for themselves and take more responsibility for the outcome of the assessments.
Reading 2010 2011 2012 2013 Writing 2010 2011 2012 2013 Math 2010 2011 2012 2013 Science 2010 2011 2012 2013
% P/A 35% 32% 37% 46.27% 20% 20% 25% 32% 14% 12% 14% 19% 19% 19% 24% 26 %
ELL 3% 4% 5% 8.84% 1% 1% 3% 3% 2% 3% 3% 6% 1% 2% 5% 2 %
Exited ELL 65% 58% 70% 77 % 23% 30% 39% 47% 17% 18% 23% 24% 23% 31% 33% 39 %
Non-ELL 62% 60% 62% 68 % 42% 42% 43% 52% 25% 23% 24% 29% 36% 36% 41% 46 %
Special Ed 17% 27% 24% 19 % 9% 16% 6% 8% 9% 6% 2% 6% 19% 20% 13 % 5 %
South % Unsat 35% 36% 30% 24% 29% 26% 22% 17% 62% 61% 60% 53% 59% 62% 58% 53 %
9th gr % P/A 32% 30% 39% 47% 20% 19% 24% 34% 15% 12% 16% 21%
10th gr %P/A 39% 33.5% 35% 43% 21% 21% 25% 28% 14% 12.5% 12% 17%
Continuously Enrolled
33% 34% 40% 43% 20% 22% 28% 28% 16% 12% 17% 16%
Academic Growth: Student median growth percentiles have stayed above average for three years. They are currently meeting state expectations for above average growth. Nevertheless, even with elevated growth percentiles, catching students up to grade level is challenging. The state has indicated that the adequate growth percentile in all content areas is above 60 for reading and above 90 in Math and Writing. According to the School Performance Framework, in Math 10.34% of students catch up; in writing 24.93%, and in reading 41.16%. CELA/ACCESS is the marker of growth for language proficiency. While the expectation is that the Median Growth Percentile is 50 to meet expectations, our students scored 66.5% in Jan 2013. The average number of years students stay at each level is higher than district averages. While we meet state expectations for growth, we have identified a priority challenge: to increase the percentage of ELLs moving up a level on CELA/ACCESS. We believe the root cause is that while we have specified the criteria for each level, we are in the early stages of tracking student progress in a timely fashion. Additionally, many students are unaware of how CELA/ACCESS monitors their language development and may not take the test seriously. While DPS does not have an English competency test

School Code: 8086 School Name: SOUTH HIGH SCHOOL
CDE Improvement Planning Template for Schools (Version 5.2 -- Last Updated: August 30, 2013) 9
for graduation, most colleges have an entrance proficiency test. We believe that if students were more clear about what they need to demonstrate for each level, they would be participate more fully in reaching the learning goals. This root cause is verified anecdotally by students who have told counselors that they did not understand their CELA data and how it was used to place them in language development classes. Parents and students need to understand what the CELA data means and how it is used for placement. It is also verified by the ELA faculty who dedicated time last year to develop transition criteria for each level.
Median Growth Percentile CSAP/TCAP 9th and 10th.
2008 2009 2010 2011 2012 2013
Reading 55 57 58 58 53 65
9th gr
59 50 62 55 67
10th gr
51 53 56 50 59
Writing 51 51 56 57 61 57.5
9th gr
50 52 55 57 58
10th gr
49 58.5 61 66 57
Math 53 55 54 57 56 51
9th gr
50 61 57 55 49
10th gr
58 48 58 58 54
Academic Growth Gaps data: Currently the MGP for all subgroups is above the DPS target for high growth with the exception of students with IEPs in reading and writing. The general trend has been to increase and then to decrease. The exceptions are with students with IEPs in writing where the MGP increased from 49.5 to 51 and from 55 to 62 in reading. In the last three years there has been an emphasis on non-fiction reading which may have supported boys with reading. All teachers focused on short constructed response writing which is evident in the increased growth in writing.
Median Growth Percentile 2011 R/W/M 2012 R/W/M 2013 R/W/M
Free & Reduced Lunch 58/56/60 55/63/56 65/51/59
Students with an Individualized Education Plan (IEP) 52/47/58 55/49.5/50 62/51/43
English Language Learners 58/58/58 62/67/59 67/64/62
Girls (medians based on SchoolNet) 57/56/57 60.5/66/59 67/60/51
Boys (medians based on SchoolNet) 60/58/58 49.5/57/53 60/55/49
Post-Secondary Readiness: South’s 6 yr graduation rate increased from 62.9% to 70% during the 2011-2012 school year. During the 2012-2013 school year our 6 yr. graduation rate was the

School Code: 8086 School Name: SOUTH HIGH SCHOOL
CDE Improvement Planning Template for Schools (Version 5.2 -- Last Updated: August 30, 2013) 10
focus for SPF at 74.92% Focusing on the 6 yr graduation rate is important at South as almost half of the population needs additional time to learn academic English. Last year in the Spring of 2013, ACT average scores increased slightly over 2012 in the areas of Math, Reading and Science. The percentage of students meeting College Readiness benchmarks increased only in Reading and Science. ACT disaggregates data by federal ethnic groups while at South we always need to look at our data through the language lens. The district has helped create reports in the past to support this.
Students have the opportunity to choose between 25 different Advanced Placement courses during the 2013-14 school year. In 2012-13, 294 students took 408 AP classes with an overall passing rate of 29%. The Design Portfolio class had a passing rates (a score of 3 or higher) over 89%. The other classes have passing rates ranging from 10% to 33%. This year South has increased the number of Human Geography (open to freshmen as well as upper classmen) courses to five and added three World History, one Comparative Government, one US Government and two US History courses. Counselors encourage all juniors and seniors to take at least one college level course before they graduate. For the 2013-14 school year, our target is to have 334 students taking AP classes and 126 participating in Concurrent Enrollment courses.
The first priority challenge for Post Secondary Readiness is to increase the on-track to graduate rate. It is challenging to monitor actual progress of students who appear off-track due either to taking advanced coursework or to taking English Language development classes. Counselors must calculate credits by hand for each student. The root cause is that we have not had systems to monitor on-track to graduate nor have we had sufficient interventions for students prior to failing. Currently the primary means of credit recovery is a) APEX which requires strong reading skills which many of our students do not have, or summer school. Also the tutoring teachers offer is voluntary for students and lacks intentionality. Meetings between parents, counselors, teachers and students are not systematic with regards to courses and credits.
The second priority challenge is to increase the passing rate of AP tests. The root cause appears to be that teachers have not consistently focused on essential learning goals and monitored student progress toward specific goals, differentiating for students who may need additional support. This is verified by the College Board Advanced Placement (AP) Instructional Planning reports and anecdotally by teachers who express the difficulty they experience trying to meet the needs of all their students.
ACT Average Scores 2011 2012 2013
English (18) 14.8 15.3 15
Math (22) 16.8 16.9 17.2
Reading (21) 16.7 15.3 16.5
Science (24) 16.9 16.4 16.5
Composite 16.4 16 16
ACT % of students meeting College Readiness benchmark
2011 2012 2013
English (18) 28% 34% 31%
Math (22) 16% 13% 13%
Reading (21) 23% 19% 21%
Science (24) 10% 8% 10%
All four 7% 23% 23%

School Code: 8086 School Name: SOUTH HIGH SCHOOL
CDE Improvement Planning Template for Schools (Version 5.2 -- Last Updated: August 30, 2013) 11
Worksheet #1: Progress Monitoring of Prior Year’s Performance Targets Directions: This chart supports analysis of progress made towards performance targets set for the 2012-13 school year (last year’s plan). While this worksheet should be included in your UIP, the main intent is to record your school’s reflections to help build your data narrative.
Performance Indicators Targets for 2012-13 school year
(Targets set in last year’s plan)
Performance in 2012-13? Was the target met? How close was the school to meeting
the target?
Brief reflection on why previous targets were met or not met.
Academic Achievement (Status)
TCAP/CSAP :
Reading:
Students will meet the DPS expectation of 46% P/A.
CSAP Advanced = 5%
Students were within one percentage point of the expectation scoring 45% P/A.
English and Math teachers developed essential learning goals during the 11-12 school year. From these teachers were able to begin creating progress monitoring tools for Intro to Lit, American Lit, Algebra, Geometry, juniors for ACT, and AP classes. Specific data mining and focus on ELGs data were areas that made a difference in our scores. All teachers focused on authentic writing in their content area and monitor students’ progress; writing was be linked to reading. Attention to developing plans for differentiated learning and rigor began to show in our student’s scores as well.
English and Math teachers developed essential learning goals during the 11-12 school year. From these teachers were able to begin creating progress monitoring tools for Intro to Lit, American Lit, Algebra, Geometry, juniors for ACT, and AP classes. Specific data mining and focus on ELGs data were areas
Math:
Students will meet the DPS expectation of 17% P/A.
CSAP Advanced = 5%
Students met the expectation scoring 19% P/A in Math.
Writing:
Students will meet the DPS expectation of 27% P/A.
CSAP Advanced = 5%
Students met the expectation scoring 32% P/A in Writing.
Science:
Students will meet the DPS expectation of 26% P/A.
CSAP Advanced = 5%
Students met the expectation scoring 26% P/A in Science
Academic Growth
R: 65th Percentile
M: 65th Percentile
W: 65th Percentile
R: Yes
M: No
W: No

School Code: 8086 School Name: SOUTH HIGH SCHOOL
CDE Improvement Planning Template for Schools (Version 5.2 -- Last Updated: August 30, 2013) 12
Performance Indicators Targets for 2012-13 school year
(Targets set in last year’s plan)
Performance in 2012-13? Was the target met? How close was the school to meeting
the target?
Brief reflection on why previous targets were met or not met.
that made a difference in our scores. All teachers focused on authentic writing in their content area and monitor students’ progress; writing was be linked to reading. Attention to developing plans for differentiated learning and rigor began to show in our student’s scores as well.
ELA teachers developed essential learning goals and exit criteria for ELA Newcomers, and Courses Level 1 and Level 2. The focus for 12-13 was to develop and use progress monitoring tools to evaluate student progress on meeting the goals and exit criteria. With common planning sessions, group progress monitoring and use of the exit criteria these were expectations were met and exceeded.
CELA ACCESS median growth 65 percentile
Goals were met and exceeded scoring 77%
Academic Growth Gaps
ELL Reading- 72nd percentile
ELL Math -68th Percentile
ELL Writing-77th Percentile
ELL Reading- 68th percentile
ELL Math-64th percentile
ELL writing 63rd percentile
Postsecondary & Workforce Readiness
Increase On-Track to graduate by 2.5% Due to the complications with Principal Portal and the On-Track to Graduation data, we are unable to provide information for this at this time.
School Code: 8086 School Name: SOUTH HIGH SCHOOL
CDE Improvement Planning Template for Schools (Version 5.2 -- Last Updated: August 30, 2013) 13
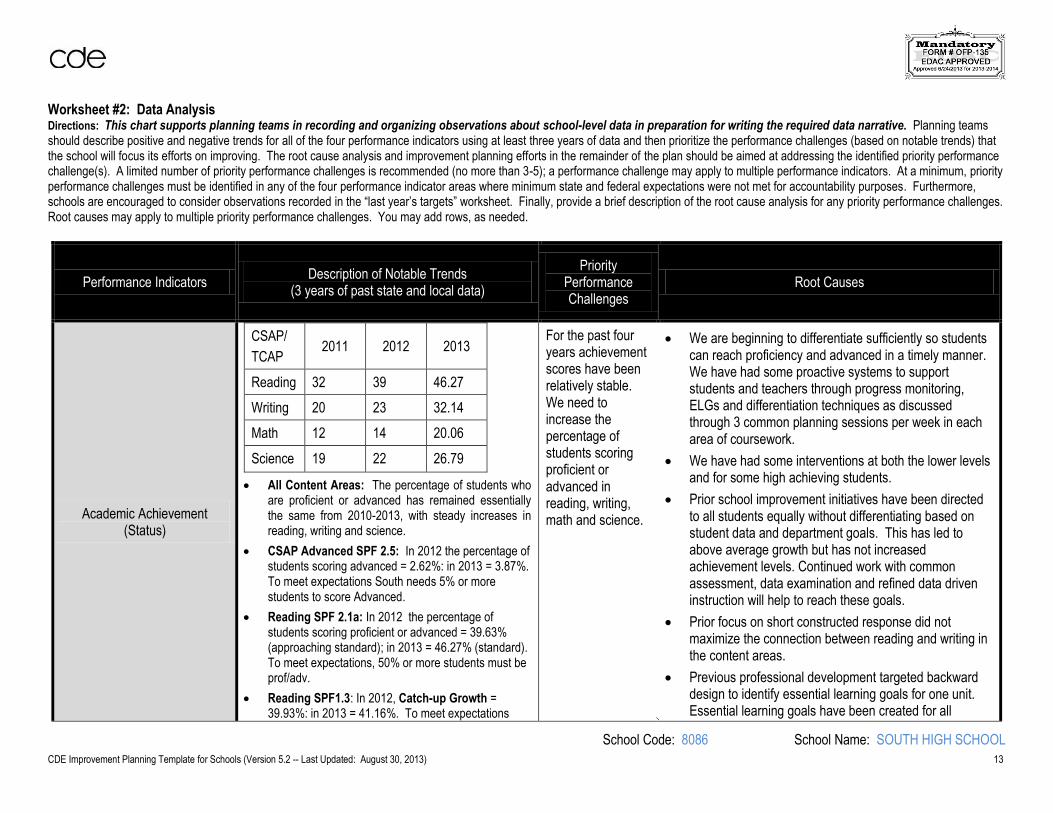
Worksheet #2: Data Analysis Directions: This chart supports planning teams in recording and organizing observations about school-level data in preparation for writing the required data narrative. Planning teams should describe positive and negative trends for all of the four performance indicators using at least three years of data and then prioritize the performance challenges (based on notable trends) that the school will focus its efforts on improving. The root cause analysis and improvement planning efforts in the remainder of the plan should be aimed at addressing the identified priority performance challenge(s). A limited number of priority performance challenges is recommended (no more than 3-5); a performance challenge may apply to multiple performance indicators. At a minimum, priority performance challenges must be identified in any of the four performance indicator areas where minimum state and federal expectations were not met for accountability purposes. Furthermore, schools are encouraged to consider observations recorded in the “last year’s targets” worksheet. Finally, provide a brief description of the root cause analysis for any priority performance challenges. Root causes may apply to multiple priority performance challenges. You may add rows, as needed.
Performance Indicators Description of Notable Trends
(3 years of past state and local data)
Priority Performance Challenges
Root Causes
Academic Achievement (Status)
CSAP/
TCAP 2011 2012 2013
Reading 32 39 46.27
Writing 20 23 32.14
Math 12 14 20.06
Science 19 22 26.79
All Content Areas: The percentage of students who are proficient or advanced has remained essentially the same from 2010-2013, with steady increases in reading, writing and science.
CSAP Advanced SPF 2.5: In 2012 the percentage of students scoring advanced = 2.62%: in 2013 = 3.87%. To meet expectations South needs 5% or more students to score Advanced.
Reading SPF 2.1a: In 2012 the percentage of students scoring proficient or advanced = 39.63% (approaching standard); in 2013 = 46.27% (standard). To meet expectations, 50% or more students must be prof/adv.
Reading SPF1.3: In 2012, Catch-up Growth = 39.93%: in 2013 = 41.16%. To meet expectations
For the past four years achievement scores have been relatively stable. We need to increase the percentage of students scoring proficient or advanced in reading, writing, math and science.
We are beginning to differentiate sufficiently so students can reach proficiency and advanced in a timely manner. We have had some proactive systems to support students and teachers through progress monitoring, ELGs and differentiation techniques as discussed through 3 common planning sessions per week in each area of coursework.
We have had some interventions at both the lower levels and for some high achieving students.
Prior school improvement initiatives have been directed to all students equally without differentiating based on student data and department goals. This has led to above average growth but has not increased achievement levels. Continued work with common assessment, data examination and refined data driven instruction will help to reach these goals.
Prior focus on short constructed response did not maximize the connection between reading and writing in the content areas.
Previous professional development targeted backward design to identify essential learning goals for one unit. Essential learning goals have been created for all

School Code: 8086 School Name: SOUTH HIGH SCHOOL
CDE Improvement Planning Template for Schools (Version 5.2 -- Last Updated: August 30, 2013) 14
Performance Indicators Description of Notable Trends
(3 years of past state and local data)
Priority Performance Challenges
Root Causes
South needs to move 3.8% or more students from UPP or PPP.
Reading SPF 1.4c: In 2012, Keep Up Growth = 80.34%: in 2013 = 88.56%. To meet expectations South needs to keep 4.4% or more students at Proficient or Advanced.
Math SPF 2.1a: In 2012 the percentage of students scoring proficient or advanced = 15.75% (approaching standard); in 2013 = 20.06% (approaching standard). To meet expectations,5 % or more students must be prof/adv.
Math SPF 1.3b: In 2012, Catch-up Growth = 10.6%: in 2013= 10.34%. To meet expectations South needs to move 9.7% or more students from UPP or PPP.
Math SPF 1.4b: In 2012, Keep Up Growth = 57.29%: in 2013 = 43.67%. To meet expectations South needs to keep 6.3% or more students at Proficient or Advanced.
Writing SPF 2.1c: The percentage of prof/adv in 2012 = 27.34%; in the 2013= 32.14%. To meet expectations, 8% of students must score prof/adv.
Writing SPF1.3c: In 2012, Catch-up Growth = 27.81%: in 2013 = 24.93%. To meet expectations South needs to move 5.1% or more students from UPP or PPP.
Writing SPF 1.4c: In 2012, Keep Up Growth = 76.11%: in 2013 = 76.56%. To meet expectations South needs to keep 3.4% or more students at Proficient or Advanced.
Science SPF 2.1d: The percentage of students scoring prof/adv in 2012 = 27.34%; in 2013 = 26.79%. To meet expectations, 3% or more of students must
Language Arts and Math core classes. Teachers may not be systematically monitoring student progress toward essential goals.
In prior years’ advisement, some students learned test results and set goals. All students have not had the opportunity to analyze their test results and set goals.
All students need more academic vocabulary and systematic instruction in syntax. Although all content teachers are ELA-E certified, they have not had sufficient time to process and apply learning.
Teachers have adhered to the Pacing and Planning Guides and have not focused solely on the Essential Learning Goals.
o Teachers may not be sufficiently sheltering instruction or consistently using strategies so ELL students can access grade level standards in content areas.
o Students may not be asked to do sufficiently rigorous tasks in the English Language Acquisition classes to reach the next CELA level.
o The addition of ELA HS Reading classes will help with the transition from ELA to mainstream English classes and continue to move our growth forward.
Continued use of Imagine Learning, with a minimum of 100 minutes per week will be needed to meet these expectations.

School Code: 8086 School Name: SOUTH HIGH SCHOOL
CDE Improvement Planning Template for Schools (Version 5.2 -- Last Updated: August 30, 2013) 15
Performance Indicators Description of Notable Trends
(3 years of past state and local data)
Priority Performance Challenges
Root Causes
score prof/adv.
ELLs: The percentage of English language learners who are proficient or advanced on CSAP/TCAP is less than 10% in all content areas (Reading 8.84%, Writing 3.21%, Math 6.05%, Science 1.71%)
CELA Overall: In 2011, 32% of students moved up a band and ??% in 2012. The SPF target is 35%.
Of the students who did not move up a band, 25% stayed beginning (n= 77, ave yrs at level = 2.8), 21% stayed early intermediate (n= 64, ave yrs at level = 2.1), 34% stayed at intermediate (n= 104, ave yrs at level = 2.3), 17% stayed at proficient (n= 54, ave years at level =2.4)
ELL CSAP Math: In 2011 3% of students scored P/A. In 2012, 2.51%, and in 2013, 6.05%.
CELA SPF 2.6: Percent at level 5 (including exited students), 2012 = 6.11%; 2013 with the adjustment to ACCESS, 21.46% score at a level 5, 28.54% growth will help us to make the maximum growth possible.
For the last two years less than 35% of ELLs move up at least one band on CELA. Students stay at each band on average longer than district averages (District: Beginning=2.2 yr, Early Int=2.0 yr, Intermediate=2.2 yr, Proficient =2.5 yr)
Academic Growth
TCAP Median Growth Percentile
MGP 2011 2012 2013
Reading 58 53 65
Writing 57 56 58
Math 57 61 51
Growth has stayed steady above 50. The school meets expectations for academic growth
CELA Median Growth Percentile
CELA median growth percentile is above 50 (above both State

School Code: 8086 School Name: SOUTH HIGH SCHOOL
CDE Improvement Planning Template for Schools (Version 5.2 -- Last Updated: August 30, 2013) 16
Performance Indicators Description of Notable Trends
(3 years of past state and local data)
Priority Performance Challenges
Root Causes
CELA 2011 CELA 2012 ACCESS 2013
47.0 46.0 65
.
and District targets)
Academic Growth Gaps
MGPs for our ELLs are above 50, but not high enough to catch students up to be college-ready when they leave South HS

School Code: 8086 School Name: SOUTH HIGH SCHOOL
CDE Improvement Planning Template for Schools (Version 5.2 -- Last Updated: August 30, 2013) 17
Performance Indicators Description of Notable Trends
(3 years of past state and local data)
Priority Performance Challenges
Root Causes
Writing:

School Code: 8086 School Name: SOUTH HIGH SCHOOL
CDE Improvement Planning Template for Schools (Version 5.2 -- Last Updated: August 30, 2013) 18
Performance Indicators Description of Notable Trends
(3 years of past state and local data)
Priority Performance Challenges
Root Causes
Math:

School Code: 8086 School Name: SOUTH HIGH SCHOOL
CDE Improvement Planning Template for Schools (Version 5.2 -- Last Updated: August 30, 2013) 19
Performance Indicators Description of Notable Trends
(3 years of past state and local data)
Priority Performance Challenges
Root Causes
ELL trends – The MGP in reading, writing, and math
have stayed above the state target for five years, yet is not high enough to ensure that students are college ready when they leave South HS.
Sped – The MGP have decreased over the last five years, but are higher than state averages.
Graduation Rate SPF 4.3: (6 yr) 2012: 72.3%, 2013: 74.92%. To meet SPF expectations, South needs to increase the graduation rate to 80%.
On track to Graduate SPF3.2 & 4.5: In 2012 70.63% of students were on track; in 2013, 76.31% were. To meet expectations 80% need to be on track. If we increase the percentage of students on track by at least 3.7%, we will meet expectations for the on-track change indicator.

School Code: 8086 School Name: SOUTH HIGH SCHOOL
CDE Improvement Planning Template for Schools (Version 5.2 -- Last Updated: August 30, 2013) 20
Performance Indicators Description of Notable Trends
(3 years of past state and local data)
Priority Performance Challenges
Root Causes
Attendance SPF 5.1: In 2012 attendance was 88.59%, in 2013 = 90.32%. To meet expectations attendance must be at least 93%.
Postsecondary & Workforce Readiness
ACT Average 2009 2010 2011 2012 2013
English (18) 15.9 14.1 14.8 15.3 15.0
Math (22) 17.0 16.5 16.8 16.9 17.2
Reading (21) 17.6 16.4 16.7 15.3 16.5
Science (24) 17.7 16.9 16.9 16.4 16.5
Composite 17.2 16.1 16.4 16 16.4
ACT Composite Scores:
Composite English Reading Math Science
Overall 16.4 15.0 16.5 17.2 16.5
White 20 19 20 19 19
Black 14 13 14 15 15
Hispanic 17 15 16 17 17
Asian 14 12 14 17 14
ELL 15 13 15 16 15
ACT English SPF 4.1c:35.16% of juniors reached the 18 benchmark (2.5% decrease over 2012=37.66%). SPF Meets Expectations = 40%
Increase on-track to graduate by 2.5%

School Code: 8086 School Name: SOUTH HIGH SCHOOL
CDE Improvement Planning Template for Schools (Version 5.2 -- Last Updated: August 30, 2013) 21
Performance Indicators Description of Notable Trends
(3 years of past state and local data)
Priority Performance Challenges
Root Causes
ACT Reading SPF 4.1a: 23.74% of juniors reached the 21 benchmark. SPF Meets Expectations = 35%
ACT Math SPF 4.1b: 14.16% of juniors reached the 22 benchmark. SPF Meets Expectations = 20%
ACT Science SPF 4.1d: 10.96% of juniors reached the 24 benchmark. SPF Meets Approaching = 20%
AP Test Passing Rate SPF 4.8: In 2012 the passing rate was 24%; in 2013 = 28.95%. To meet expectations 50% of exams must be passed.
Three of 13 AP classes are reaching the 50% passing rate goal.

School Code: 8086 School Name: SOUTH HIGH SCHOOL
CDE Improvement Planning Template for Schools (Version 5.2 -- Last Updated: August 30, 2013) 22
Section IV: Action Plan(s)
This section addresses the “Plan” portion of the continuous improvement cycle. First, identify annual performance targets and the interim measures. This will be documented in the required School Target Setting Form on the next page. Then move into action planning, which should be captured in the Action Planning Form. School Target Setting Form Directions: Complete the worksheet below. While schools may set targets for all performance indicators, at a minimum, they must set targets for those priority performance challenges identified in Section III (e.g., by disaggregated student groups, grade levels, subject areas). Schools are expected to set their own annual targets for academic achievement, academic growth, academic growth gaps, and postsecondary and workforce readiness. At a minimum, schools should set targets for each of the performance indicators where state expectations are not met; targets should also be connected to prioritized performance challenges. Consider last year’s targets (see Worksheet #1) and whether adjustments need to be made. For each annual performance target, identify interim measures that will be used to monitor progress toward the annual targets at least quarterly during the school year.

School Code: 8086 School Name: SOUTH HIGH SCHOOL
CDE Improvement Planning Template for Schools (Version 5.2 -- Last Updated: August 30, 2013) 23
School Target Setting Form
Performance Indicators Measures/ Metrics
Priority Performance Challenges
Annual Performance Targets Interim Measures for
2013-14 Major Improvement
Strategy 2013-14 2014-15
Academic Achievement
(Status)
TCAP/CSAP, CoAlt/CSAPA, Lectura, Escritura
R
Our 2013 TCAP scores reflected a significant Prof/Adv.growth; 2011:30%, 2012:39%, 2013:47% totaling 17% over two years . We need to increase the percentage of students scoring Prof/Adv in reading to continue the upward trend.
Students will meet the DPS expectation of 47%
Students will meet the DPS expectation of 54%
District Interim Course Assessments
Scholastic Reading Intervention
Teacher Made Assessments
EDGE Curricular Assessments
Imagine Learning Assessments
English and Math teachers developed essential learning goals during the 11-12 and 12-13 school years. The focus for 13-14 will be on creating weekly progress monitoring tools for Intro to Lit, American Lit, Algebra, Geometry, juniors for ACT, and AP classes, tracking student performance, and adjusting instruction based on the data. All teachers will focus on authentic writing in their content area and monitor students’ progress; writing will be linked to reading.
M
Students will meet the DPS expectation of 22% P/A in math.
Students will meet the DPS expectation of 28% P/A in math.
District Unit and Interim Course Assessments
Teacher Made Assessments
W
Students will meet the DPS expectation of 33% P/A in writing.
Students will meet the DPS expectation of 39% P/A in writing.
District Interim Course Assessments
Teacher Made Writing Prompts
EDGE Curricular Assessments
S
TCAP will not be tested for the 2013-2014 school year.
District Interim Course Assessments
Teacher Made Assessments
These measures will be used for student progress monitoring in lieu of TCAP Scores

School Code: 8086 School Name: SOUTH HIGH SCHOOL
CDE Improvement Planning Template for Schools (Version 5.2 -- Last Updated: August 30, 2013) 24
For the last two years less than 35% of ELLs move up at least one band on CELA. Students stay at each band on average longer than district averages (District: Beginning=2.2 yr, Early Int=2.0 yr, Intermediate=2.2 yr, Proficient =2.5 yr)
Academic Growth
Median Growth Percentile (TCAP/CSAP & ACCESS)
R 65th percentile 75th percentile District Interim Course Assessments
Scholastic Reading Intervention
Teacher Made Assessments
EDGE Curricular Assessments
English and Math teachers developed essential learning goals during the 11-12 and 12-13 school years. The focus for 13-14 will be on creating progress monitoring tools for Intro to Lit, American Lit, Algebra, Geometry, juniors for ACT, and AP classes, tracking student performance, and adjusting instruction based on the data.
M 65th percentile 75th percentile
W 65th percentile 75th percentile
ELP
CELA median growth percentile is below 50 (below both State and District targets)
65th percentile 75th percentile
Academic Growth Gaps
Median Growth Percentile
R MGPs for our ELLs are above 50, but not high enough to catch students up to be college-ready when they leave South HS
ELL Reading - 72th percentile
ELL Reading - 77th percentile
District Interim Course Assessments
Scholastic Reading Intervention
Teacher Made Assessments
ELA teachers developed essential learning goals and exit criteria for ELA Newcomers, and Courses Level 1 and Level 2. The continued focus for 13-14
M ELL Math – 68th percentile
ELL Math – 73rd
percentile
W ELL Writing – 77th ELL Writing – 83rd

School Code: 8086 School Name: SOUTH HIGH SCHOOL
CDE Improvement Planning Template for Schools (Version 5.2 -- Last Updated: August 30, 2013) 25
percentile percentile EDGE Curricular Assessments
will be to revise and use progress monitoring tools to evaluate student progress on meeting the goals and exit criteria.
Postsecondary & Workforce Readiness
Graduation Rate
Increase our 5 yr. Graduation Rate to meet district expectation of 63%
Increase our 5 yr. graduation rate to 70%
Increase our 5 yr. graduation rate to 79%
English and Math teachers developed essential learning goals during the 11-12 and 12-13 school years. The focus for 13-14 will be on creating progress monitoring tools for Intro to Lit, American Lit, Algebra, Geometry, juniors for ACT, and AP classes to monitor student progress and adjust instruction based on data. Provide structures and supports to maximize college readiness for all students.
Disaggregated Grad Rate
Dropout Rate
Mean CO ACT

School Code: 8086 School Name: SOUTH HIGH SCHOOL
CDE Improvement Planning Template for Schools (Version 5.2 -- Last Updated: August 30, 2013) 26
Action Planning Form for 2013-14 and 2014-15 Directions: Identify the major improvement strategy(s) for 2013-14 and 2014-15 that will address the root causes determined in Section III. For each major improvement strategy, identify the root cause(s) that the action steps will help to dissolve. Then, indicate which accountability provision or grant opportunity it will address. In the chart below, provide details about key action steps necessary to implement the major improvement strategy. Details should include the action steps that will be taken to implement the major improvement strategy, a general timeline, resources that will be used to implement the actions, and implementation benchmarks. Additional rows for action steps may be added. While the template provides space for three major improvement strategies, additional major improvement strategies may also be added. To keep the work manageable, however, it is recommended that schools focus on no more than 3 to 5 major improvement strategies.
Major Improvement Strategy #1: English, and Math teachers developed essential learning goals (11-12) and focused on creating progress monitoring tools (12-13) for Intro to Lit, American Lit, Algebra, Geometry, juniors for ACT, and AP classes. Work during the 2013-14 school year will focus on using these tools along with the Language Arts Assessment Blueprints, Math Unit Tests and the DPS Scope and Sequence. The Data Inquiry Cycle will occur during Common Planning. Root Cause(s) Addressed:
Continuing differentiation sufficiently so students can reach proficiency and advanced in a timely manner.
We have been intervening at the lower levels and are just beginning supports for high achieving students.
Prior school improvement initiatives have been directed to all students equally without differentiating based on student data and department goals. This has led to above average growth but has not increased achievement levels.
Prior focus on short constructed response did not maximize the connection between reading and writing in the content areas.
Previous professional development targeted creating essential learning goals, but they may not be clearly articulated for all units. Teachers may not be systematically monitoring student progress toward essential or communicating these goals with parents and students.
All students have not had the opportunity to analyze their test results and set goals.
Teachers have created Essential Learning Goals, but are just beginning to monitor students’ progress in meeting the goals and adjusting instruction accordingly.
Teachers may not be sufficiently sheltering instruction or consistently using strategies so ELL students can access grade level standards in content areas.

School Code: 8086 School Name: SOUTH HIGH SCHOOL
CDE Improvement Planning Template for Schools (Version 5.2 -- Last Updated: August 30, 2013) 27
Accountability Provisions or Grant Opportunities Addressed by this Major Improvement Strategy (check all that apply):
State Accreditation x Title I Focus School Tiered Intervention Grant (TIG) Colorado Graduation Pathways Program (CGP)
Other: ______________________________________________________________________________
Description of Action Steps to Implement the Major Improvement Strategy
Timeline Key
Personnel*
Resources (Amount and Source: federal, state,
and/or local) Implementation Benchmarks
Status of Action Step* (e.g.,
completed, in progress, not begun) 2013-14
2014-15
Algebra and Geometry teachers will develop tools to progress monitor ELGs.
- ELG’s with rubrics in Geometry, Advanced Algebra
- Intervention classes for high achieving students
- ELL Algebra who are higher achieving, double students up, start a math club for 9th graders, recommend geometry honors and/or double up for Algebra and Geometry
Use of Common Planning to support the Data Inquiry Cycle.
October 2013-
Ongoing
June 2014 Algebra, Geometry, and Algebra 2 teachers will revise ELGs, create assessments, unit progress monitoring tools and mini lessons. Collaborative Plan 3 times per week with focus on grading, data cycle and planning
Algebra and Geometry teachers
General Fund Use of new school wide Grade book structure
Progress monitoring Tools.
Use of minimum competencies
Continued use of Content Language Objective to support rigor.
Target specific ACT skills
In progress
Intro to Lit and American Lit teachers will develop tools to progress monitor
October 2013-
Am. Lit. and Intro. Lit.
General Fund Use of ELGs in SGOs
Developed in 2012-13
In progress

School Code: 8086 School Name: SOUTH HIGH SCHOOL
CDE Improvement Planning Template for Schools (Version 5.2 -- Last Updated: August 30, 2013) 28
ELGs.
- Each English course developed three ELG’s for Spring Semester focus and assessments for author’s purpose (American Literature) literary and poetic devices (Intro).
- Academic Language focus was based on analysis, synthesis, evaluate, ethos, logos, pathos, claim, reason and evidence.
Use of Assessment Blueprints and Scope and Sequence to align instruction with assessments and student progress
Ongoing
Fall 2013
Collaborative planning, three days/week to plan and review with focus on grading, data cycle and planning
teachers Grade book structure
Progress monitoring Tools
Use of the new Grade book structure
Continued use of Content Language Objective to support rigor.
Target specific ACT skills
Teachers of juniors will develop and use ACT ELGs and progress monitoring tools. Teachers will use TCAP results to target instructional groupings.
- Giving ACTpractice questions - Algebra 2 with trig book with
standardized - Kaplan test (on-line)
October 2013-
Ongoing
Social Studies, Science, English, Math teachers, AVID teachers
General Fund Daily lesson warm-ups spring semester; Grade book structure; Use of ELGs in SGOs, Fall 2013
In progress
Teachers will apply professional development work on rigor, content-language objectives and differentiation to support students at different levels.
- Math: continue work on differentiation
- Aleks for Algebra provides differentiation
- Differentiated Tests/Assignments/Presentations
AVID Strategies: - Socratic Seminar - Philosophical Chairs
August 2013-
Ongoing
August 2013, teacher leaders to guide implementation
All teachers; AVID teachers to share instructional strategies
General Fund Varied activities, varied assignments,
Use of new Grade book structure to support students understanding of weekly data
Focus on Information Text in both reading and writing to support Language Arts teachers as well as enhancing differentiation and rigor in
In progress

School Code: 8086 School Name: SOUTH HIGH SCHOOL
CDE Improvement Planning Template for Schools (Version 5.2 -- Last Updated: August 30, 2013) 29
- Cornell Notes - Critical Writing/Reading - Jigsaw - Think Pair Share - Gallery Walk - Tutorology - Quick-writes/summaries/reflections
Costa’s Levels of Questions
content area lessons Continued
Use of Content Language Objective to support rigor.
Target specific ACT skills
* Note: These two columns are not required to meet state or federal accountability requirements, though completion is encouraged. “Status of Action Step” may be required for certain grants.

School Code: 8086 School Name: SOUTH HIGH SCHOOL
CDE Improvement Planning Template for Schools (Version 5.2 -- Last Updated: August 30, 2013) 30
Major Improvement Strategy #2: All teachers will focus on authentic writing in their content area and monitor students’ progress; writing will be linked to reading. Root Cause(s) Addressed:
Prior school improvement initiatives have been directed to all students equally without differentiating based on student data and department goals. This has led to above average growth but has not increased achievement levels.
Prior focus on short constructed response did not maximize the connection between reading and writing in the content areas.
All students need more academic vocabulary and systematic instruction in syntax. Although all content teachers are ELA-E certified, they have not had sufficient time to process and apply learning.
All students need more academic vocabulary and systematic instruction in syntax. Although all content teachers are ELA-E certified, they have not had sufficient time to process and apply learning.
Teachers may not be sufficiently sheltering instruction or consistently using strategies so ELL students can access grade level standards in content areas.
Focus needs to be on language of instruction in each content area, where writing is a part of every content areas ELG and PD work.
Accountability Provisions or Grant Opportunities Addressed by this Major Improvement Strategy (check all that apply):
State Accreditation Title I Focus School Tiered Intervention Grant (TIG) Colorado Graduation Pathways Program (CGP)
Other: ______________________________________________________________________________
Description of Action Steps to Implement the Major Improvement Strategy
Timeline Key
Personnel*
Resources (Amount and Source: federal, state,
and/or local) Implementation Benchmarks
Status of Action Step* (e.g.,
completed, in progress, not begun) 2013-14 2014-15
All teachers (except math) will develop a Student Growth Objective (SGO) related to content specific informational writing that is connected to reading (core content classes). World Language will focus on simple and complex writing in the target language and translation to English.
All teachers (except math) have an SGO focused on writing.
October 2013-
Ongoing
All content teachers, admin team
General Fund SGO review March 2014; finalized May 2014
In progress; SGOs will be completed by June 1, 2014
Review necessity of strategy summer 2013
Using a baseline of three different levels of student writing (high, mid and low) teachers will develop differentiated
October 2013-
Ongoing
Tech, PE, Special Educators,
General Fund SGO review March 2014; finalized May 2014
In progress Review necessity of strategy

School Code: 8086 School Name: SOUTH HIGH SCHOOL
CDE Improvement Planning Template for Schools (Version 5.2 -- Last Updated: August 30, 2013) 31
strategies to support students at each level, provide feedback to students and monitor progress toward proficiency. Additionally, teachers will provide specific feedback to learners on their progress. Common Planning will allow teachers to focus on collaborative support as well as student progress.
- Social Studies uses RAP (Restate Answer Proof).
- Social Studies and Science have each created a writing rubric for their departments.
- In electives, teachers are focusing their highest levels on artistry, their mid-levels on organization, and their low levels on increased oral support. They are using transition words, sentence stems, and Step Up to Writing Tools.
Social Studies
Use of techniques for identifying varied levels of informational reading texts in all content area courses.
summer 2014
All teachers will create daily content language objectives supporting both differentiation and rigor that provide students frequent opportunities to use academic language in speaking and writing.
October 2013 – on-going
All teachers General Fund LEAP Framework average scores
In progress Review necessity of strategy summer 2014
Content Specific Vocabulary
- Teachers in some content areas will teach on average 8-10 academic vocabulary words each week that students will use in their writing.
- Students answer essential questions using unit vocabulary.
Elective classes teach 8-10 vocab
October 2013-
Ongoing
JROTC, Tech, World Language
General Fund SGO review March 2013; finalized May 2014
In progress

School Code: 8086 School Name: SOUTH HIGH SCHOOL
CDE Improvement Planning Template for Schools (Version 5.2 -- Last Updated: August 30, 2013) 32
words and use comprehensible input to support retention of words.
Teachers in all content areas will use reading strategies to increase students’ volume of reading. Students will respond to informational text in both reading in writing.
- Two outside the text readings are assigned in Social Studies, specifically in AP classes. Students respond in writing to both outside readings.
October 2013-
Ongoing
JROTC, PE, Social Studies (RAP); AVID teachers
General Fund Use of techniques to assist students in writing informational pieces and selecting appropriately leveled informational text in all content area courses.
In progress Review necessity of strategy summer 2014
* Note: These two columns are not required to meet state or federal accountability requirements, though completion is encouraged. “Status of Action Step” may be required for certain grants.

School Code: 8086 School Name: SOUTH HIGH SCHOOL
CDE Improvement Planning Template for Schools (Version 5.2 -- Last Updated: August 30, 2013) 33
Major Improvement Strategy #3: ELA teachers developed essential learning goals and exit criteria for ELA Newcomers, and Courses Level 1 and Level 2. The continued focus for the 13-14 school year will be to revise and use progress monitoring tools to evaluate student progress on meeting the goals and exit criteria. Root Cause(s) Addressed:
Prior school improvement initiatives have been directed to all students equally without differentiating based on student data and department goals. This has led to above average growth but has not increased achievement levels.
All students need more academic vocabulary and systematic instruction in syntax. Although all content teachers are ELA-E certified, they have not had sufficient time to process and apply learning.
Teachers may not be sufficiently sheltering instruction or consistently using strategies so ELL students can access grade level standards in content areas.
Students may not be asked to do sufficiently rigorous tasks in the English Language Acquisition classes to reach the next ACCESS level.
Professional development and school wide initiatives have been generalized for all students leading to overall elevated growth but not a specific focus on individual ELL levels.
Accountability Provisions or Grant Opportunities Addressed by this Major Improvement Strategy (check all that apply):
State Accreditation x Title I Focus School Tiered Intervention Grant (TIG) Colorado Graduation Pathways Program (CGP)
Other: ______________________________________________________________________________
Description of Action Steps to Implement the Major Improvement
Strategy
Timeline Key
Personnel*
Resources (Amount and Source: federal, state,
and/or local) Implementation Benchmarks
Status of Action Step* (e.g.,
completed, in progress, not begun) 2013-14 2014-15
Newcomer and ELA Level 1 and 2 teachers will continue to refine progress monitoring tools to support both form and function of ELA across content areas with focus on language of instruction.
- Teachers have written ELGs for each level and identified 3-4 “must be able to dos” Next step: develop a formal transition process using the criteria.
October-December 2013
All ELA teachers,
Chris Colias
General Fund Exit criteria
Placement expectations
Content Area ELGs as appropriate.
Completed Fall 2013
ELA teachers and students will monitor students’ progress toward meeting level exit criteria.
October 2013 – on-going
All ELA teachers,
Chris Colias
General Fund Student exit data
Progress monitoring tools.
In progress
Review progress in June, 2014; revise as necessary

School Code: 8086 School Name: SOUTH HIGH SCHOOL
CDE Improvement Planning Template for Schools (Version 5.2 -- Last Updated: August 30, 2013) 34
Use of Data Inquiry Process
ELA teachers will use SRI/Edge reading gains/Imagine learning reports to progress monitor reading comprehension.
- Teachers gave SRI twice during first semester and used the results to adjust student placement.
- Second semester Intro/American/World will continue to use SRI while level 1 & 2 will administer the Edge reading gains
August 2013-
Ongoing
All ELA teachers,
Deb McGinty
General Fund Review ACCESS scores; course passing rate
In progress; teachers will recommend 14-15 student placement in April 2014
Review progress in June, 2014; revise as necessary
Teachers will use the transition criteria and a body of evidence (assessment data, and classwork) to transition students.
- Transition criteria is being developed but has not yet been used in a formal transition process.
- Developed the graduation planning tool to include ELA classes. Counselors meet with students to make sure students understand graduation requirements;
Spring 2013-ongoing
All ELA teachers,
Chris Colias
General Fund Transition meetings on the calendar; Semester 2 Intro classes.
In progress; teachers will recommend 14-15 student placement in April 2014
Review progress in June, 2014; revise as necessary
Summer school will be offered to extend the school year for ELA students at Newcomer, level 1 and level 2.
Summer school will be offered to extend the school year for ELA students at Newcomer, level 1 and level 2.
June, 2014
ELA teachers, TBD
General Fund, grant funding, Title III funds TBD
Imagine Learning GLE or Edge Reading gains at the end of summer school.
In progress
Review progress in June, 2013; revise as necessary
* Note: These two columns are not required to meet state or federal accountability requirements, though completion is encouraged. “Status of Action Step” may be required for certain grants.

School Code: 8086 School Name: SOUTH HIGH SCHOOL
CDE Improvement Planning Template for Schools (Version 5.2 -- Last Updated: August 30, 2013) 35
Major Improvement Strategy #4 College and Career Readiness – increase enrollment and performance in all areas on the School Performance Framework.
Root Cause(s) Addressed:
There has not been a structure for specific progress monitoring toward essential learning goals identified for ACT/AP/CE/CTE.
Teachers are challenged to differentiate or re-teach when students struggle.
Lack of systematic proactive supports (study groups, tutoring, etc). for struggling AP/CE/CTE students.
Accountability Provisions or Grant Opportunities Addressed by this Major Improvement Strategy (check all that apply):
School Plan under State Accountability Title I Schoolwide or Targeted Assistance plan requirements Title I Focus School Plan requirements
Application for a Tiered Intervention Grant (TIG) Improvement Support Partnership (ISP) or School Improvement Grant
Description of Action Steps to Implement the Major Improvement Strategy
Timeline
2013-2014 Key Personnel*
Resources (Amount and Source: federal,
state, and/or local)
Implementation Benchmarks
Status of Action Step*
(e.g., completed, in progress, not
begun)
Academic Systems
1.1 The school provides and implements rigorous curriculum that is focused, coherent, appropriately challenging and that prepares students for college-level work. How are curricula vertically articulated and aligned to ensure that students are college and career ready before graduation?
1.2 The school assessment measures are used to intentionally inform students and parents about their level of college preparedness. How are you using this information to inform students and their parents of the student’s progress towards becoming college and/or career ready?
1.3 The school teaches self-management skills and academic behaviors and expects students to use them. How are you teaching these skills to all students?
Academic Systems
AP/CE/CTE Offerings
o Increase number of students taking AP/CE/ CTE courses. (School requires all students to take at least one AP, CE, or CTE course prior to graduation.)
o AP/CE vertical teaming for backwards design to support our goal of increasing students enrolled and 3+ scores
August 2014,
On-going
All Staff
General Funds
Legacy Grant
Baseline:
2010-11: 174
2011-12: 264 AP, 72 CE
2012-13:318 AP, 120 CE
Target 2013-14: 334 AP, 126 CE (+5%)
Target 2014-2015
AP: 425
CE: 291
In Progress
Met Feb
2013, 405
CE: 277

School Code: 8086 School Name: SOUTH HIGH SCHOOL
CDE Improvement Planning Template for Schools (Version 5.2 -- Last Updated: August 30, 2013) 36
AP/CE tutoring and exam support
o Develop and implement an effective tutoring program for AP/CE students that need extra support in both on and off campus courses.
o AP teachers administer shortened practice tests during class and a minimum of five full-length practice tests on Saturdays, primarily in March and April before the AP exams in May (Financial incentives provided through the CO Legacy grant for scores of 3-5 in STEM AP courses)
o Progress monitoring feedback cycles for each practice test.
o SGO for all AP teachers based on pre/post tests
o 12-13: 214 Tutoring sessions; 752 student participants
August 2014,
On-going
All content teachers, admin team
Legacy Grant
General Funds
Baseline: AP 3,4,5 scores
2010-11: 30
2011-12:25
2012-13: 110
Target 2013-14:+5%
AP/CE: Teacher populated spreadsheets
Students: 790
Sessions: 226
In Progress
AP/Pre-AP alignment to increase both number of students taking AP courses and number of students passing AP courses.
o AP vertical teaming for backwards design to support our goal of increasing 3+ scores.
o Counselors will ensure that students fully understand their responsibility as college students through Junior and Senior PEP sessions.
o Ongoing support for AP teachers through CO Legacy Grant –
Pipeline training sessions four times/year
Summer Institute
Bimonthly Coaching with AP subject specialist
o Systematic identification using all available data to increase student number in Pre-AP courses
August 2014,
On-going
All content teachers, content MS feeder school teachers, Admin team
Legacy Grant,
General Funds
Baseline student enrollment in Pre-AP courses:
2010-11:819
2011-12:821
2012-13:1022
Target 2013-14:+5%
1073
AP: Meeting notes
Target 2014-15:
In Progress Met February 2014:
ACT Prep and alignment
o 8 11th grade ACT Prep sessions (semester courses)
o School provides ACT tutoring based on TCAP/PLAN/ACCUPLACER scores to target Juniors
o Warm-ups ACT practice questions in every Jr. core class
Targeted supports in needed areas to increase ACT scores.
o Program for Seniors DU tutors during 7th period 4-6 week sessions to increase content scores
August 2014,
On-going
All content teachers, admin team
General Funds Baseline ACT composite
2011: 16.4
2012: 16.2
2013: 16.0
Target 2014: 16.5
ACT: Dept common planning notes, attendance rosters,
In Progress: 1st semester, 10-15 students participated in each after-school session with DU tutors; program to continue in spring; Timed reading

School Code: 8086 School Name: SOUTH HIGH SCHOOL
CDE Improvement Planning Template for Schools (Version 5.2 -- Last Updated: August 30, 2013) 37
o Coordination with AD to provide specific program for students eligible for athletic scholarships
o Year-long program for Juniors to build test stamina, test-taking skills
and populated spreadsheets
practice; DSF counselor met with athletes after school in fall and will continue in spring during periods 2, 3
Increase number of students on-track to graduate with an associates degree.
August 2014,
On-going
Counselors, teachers, admin team.
General Funds # of Juniors who have completed 15 credits
AVID
o AVID Conference plus Professional development for all teachers in AVID strategies
o AVID strategies incorporated in every classroom.
o School offers at least one section of AVID at each grade level
o AVID small group tutoring sessions
August 2014,
On-going
AVID team $19,519
College Readiness Grant,
General Funds
Baseline:
2011-12: 189
2012-13: 184
Target 2013-14: 194
AVID
Whole staff PD
Master schedule
In Progress
Increase graduation rates and decrease dropout rates.
o Incoming freshmen summer transition meetings
o Identify three times/year OTG status for each student, weekly monitoring of D/F report
o Grade level teams meet with students to monitor progress.
o Assign students to tutoring for extra help.
o Use of Accuplacer scores, reading/writing and math benchmark assessment collaboratively scored and analyzed and reflected upon for instructional modifications during common planning
o Department progress monitoring for all students
o Referral to RtI for tier II services
o Transition students to Multiple Pathways based on best fit, parent check-in with intentional communication.
August 2014,
On-going
Teachers, Counselors, Deans, and admin team
General Funds, Gear-up Graduation Rate:
2010-11: 70.4% (6-year)
2011-12: 72.3% (7-year)
2012-13: 78.8%
Target 2013-14: 82.5%
Dropout rate:
2010-11: 2.6%
2011-12: 3.8%
2012-13: 2.8%
Goal: 2013-14: 2.5%
Decrease - 1%
IC, D/F report, OTG spreadsheets, Conf. Tab communication notes.
In Progress

School Code: 8086 School Name: SOUTH HIGH SCHOOL
CDE Improvement Planning Template for Schools (Version 5.2 -- Last Updated: August 30, 2013) 38
Developmental courses offered for English and Math (030, 060, 090, 099)
o System developed for interpretation of test scores to identify students in need of Developmental courses.
Data:
Accuplacer
ACT/PLAN Scores Status/Growth
GPAs – Status/Growth
Interim Assessments
TCAP/CSAP – Status/Growth
Advance students from one course to the next based on course completion/test results
World Lit ELGs aligned to 060 developmental Ed. course.
August 2014,
On-going
Teachers, Counselors, admin team.
$480 SEI Grant
plus
General Funds
Developmental Crs:
Baseline CE Developmental courses
2010-11:0
2011-12: 0
2012-13:119
Target 2013-14:125 (increase 5%)
IC schedules, meeting notes, test score data
In Progress
Increase the number of students who graduate college ready August 2014, ongoing
Teachers, counselors, admin team
SEI Grant, general fund

School Code: 8086 School Name: SOUTH HIGH SCHOOL
CDE Improvement Planning Template for Schools (Version 5.2 -- Last Updated: August 30, 2013) 39
Description of Action Steps to Implement the Major Improvement Strategy
Timeline
2013-2014 Key Personnel*
Resources (Amount and Source: federal,
state, and/or local)
Implementation Benchmarks
Status of Action Step* (e.g.,
completed, in progress, not
begun)
Social Capital with College & Career Planning
2.1 The school communicates progress toward college and career readiness goals. How do you ensure your families receive this information? How do you recognize progress towards post-secondary preparedness? 2.2 The school develops and coordinates intentional partnerships for college and career readiness. Do you intentionally collaborate with district entities to meet College and Career Readiness goals? 2.3 The school shows a commitment to providing professional development around PEPs emphasizing College and Career Readiness. What is the nature of your PD? How are you informing your staff of College and Career Readiness (Faculty meetings, emails, etc.)
Social Capital with College & Career Planning
• Application support
• FAFSA/Scholarship support
• FASFA night x/2 plus FASFA Fridays
• Scholarship workshops increase to 2x/year
• Formal and informal meeting sessions
• Naviance/CIC 100% of students to complete
August 2014,
On-going; Meetings scheduled 2/4, 2/18; FAFSA Fridays will begin 2/21 until end of year; FAFSA follow-up is 4/28
DSF, counselors,
admin team
DSF, General Funds Baseline FASFA
2011-12: 156
2012-13: 206/250 (elig)=82%
Target 2013-14: 90%
Baseline accepted to college
2011-12:235
2012-13:214/231 (applied)= 93%
Target 2013-14: 98%
Naviance report
In Progress;
• Monthly progress updates to Senior parents, students, and staff with readiness goals (acquire accurate email addresses in IC)
August 2014,
On-going; Spring grade level meetings, e-mails to students/parents in spring
DSF, counselors, teachers,
admin team; parent/community liaison
General Funds Counselor report In Progress
Increase participation in postsecondary sessions. Notification of upcoming support nights(FASFA, Scholarship night, Junior night, Sophomore night): one-on-one conversations with students, School newspaper – Gargoyle, School news show - Rebel Report, weekly email message from Family Liaison ,
August 2014,
On-going
DSF, counselors, teachers, staff,
admin team
DSF, General Funds Products, meeting notes, sign-in sheets
In Progress

School Code: 8086 School Name: SOUTH HIGH SCHOOL
CDE Improvement Planning Template for Schools (Version 5.2 -- Last Updated: August 30, 2013) 40
PTSA monthly meetings and school website ELA PAC, Back to school nights, PTC
• Pre-collegiate partners work collaboratively to ensure student achievement and success.
• Establish clear goals for each program.
• Identify appropriate students for each partner.
• Monthly meetings with our Future Center Coordinator, Postsecondary Readiness Coordinator and all counselors helps maintain our focus toward college readiness.
August 2014,
On-going
DSF, Gear-up, TRIO, Goodwill, counselors, admin. team
DSF, Gear-up, TRIO, Goodwill, General Funds
Meeting notes In Progress; monthly meetings during period 5
Collaboration and coordination around AVID between AVID teachers, Counselors and tutors.
August 2014,
On-going
Teachers, counselors, Admin team
SEI Grant, General Funds Meeting notes Complete and ongoing
Club preview day for student sign-up August 2014,
On-going
Teachers, staff, admin team
SEI Grant, General Funds Number of clubs offered including the number of students participating in each. Participation documentation included.
Complete and ongoing
Goodwill, Future Center and internships August 2014,
On-going
Teachers, staff, admin team
Goodwill, DSF, General Funds
Meeting notes, log Complete and ongoing
Attend all CE/AP PD sessions and work collaboratively to increase Post-Secondary Readiness
August 2014,
On-going
Admin General Funds Meeting notes In Progress

School Code: 8086 School Name: SOUTH HIGH SCHOOL
CDE Improvement Planning Template for Schools (Version 5.2 -- Last Updated: August 30, 2013) 41
Description of Action Steps to Implement the Major Improvement Strategy
Timeline
(2012-13 and 2013-2014)
Key Personnel* Resources
(Amount and Source: federal, state, and/or local)
Implementation Benchmarks
Status of Action Step* (e.g.,
completed, in progress, not
begun)
College and Career Going Culture
3.1 The school provides students with opportunities to complete PEPs. When and how do you provide opportunities for students to engage in PEP activities?
3.2 The school shows a commitment to developing a comprehensive school-counseling program. How are your building administrators actively supporting the counselors in developing a comprehensive school-counseling program? 3.3 The school engages students, families, and the community in the college and career readiness process. How does your school engage students & their families with intentionality? 3.4 The school offers one or more CTE programs as an elective option. How does your school use workforce trend data and student career interest data to determine CTE offerings? 3.5 The school shows a commitment to all teachers including workforce readiness skills in their curriculum. How do core academic teachers use project –based assignments to teach problem solving, creative/critical thinking, cultural awareness, collaboration, civic responsibility and work ethics? 3.6 The school develops a comprehensive approach to partnering with pre-collegiate programs. How does your school engage pre-collegiate programs with intentionality? 3.7 The school systematically collects and analyzes college and career related data. How are you reviewing and using data to improve your College and Career Readiness programs?
College and Career Going Culture
Dedicated times throughout the year for all students to work on PEPs
o Counselors will work with all students to complete Personal Education Plans (meet with students 5x/year)
o Integration of PEP into classes throughout the year (ie: College essay in English class)
o Scheduled Career Development
August 2014,
On-going
Teachers, counselors, staff and admin team
General Funds Baseline PEP
2011-12:
2012-13: 90%
Target 2013-14: 95%
Naviance report
In progress
Monthly meetings with administrator and counseling department to address issues and concerns.
Increased communication between counseling dept, Future Center and college partners.
August 2014,
On-going
DSF, Gear-up, TRIO, Goodwill, counselors, admin. team
General Funds Baseline college enrollment
2011-12: 55%
2012-13:54%
Target 2013-14: 59% (+5%)
Meeting notes
In progress
• Annual grade level meetings with students and parents. Junior and Sophomore nights, Freshman academy
August 2014,
On-going
counselors, staff, admin team
General Funds Sign-in sheets In progress

School Code: 8086 School Name: SOUTH HIGH SCHOOL
CDE Improvement Planning Template for Schools (Version 5.2 -- Last Updated: August 30, 2013) 42
Mentoring partnerships through CTE connections (includes Academy of Finance, Art, ceramics, photography, computer game programming)
August 2014,
On-going
Teachers, staff, counselors, admin team
General Funds Logs In progress
Community partnerships integrated into the classrooms o Career/classroom match day to plan presentations,
fieldtrips to match day o Two times/year all teachers plan career readiness
info/opportunities into their curriculum.
August 2014,
On-going;
Career panels in March with Rebel DADS
Parent/ community liaison
General Funds # events scheduled Not begun
Increase career/tech Ed course offerings August 2014,
On-going
Teachers, staff, counselors, admin team
General Funds Baseline CTE courses
2010-11:
2011-12:
2012-13:
Target 2013-14:
Master schedule
In progress
Major Improvement Strategy #5: Ensure that all teachers are “highly qualified”, per No Child Left Behind guidelines, upon hire. Ensure that all teachers receive regular, on-going, professional development to meet the needs of our diverse student population. Root Cause(s) Addressed:
District initiated initiative
Accountability Provisions or Grant Opportunities Addressed by this Major Improvement Strategy (check all that apply):
School Plan under State Accountability Title IA School Improvement/Corrective Action Plan Application for a Tiered Intervention Grant
Title I schoolwide or targeted assistance plan requirements School Improvement Grant
Description of Action Steps to Implement the Major Improvement Strategy
Timeline Key Personnel* Resources
(Amount and Source: federal, state, and/or local)
Implementation Benchmarks
Status of Action Step* (e.g., completed,
in progress, not begun)
Establish hiring priorities based on initial enrollment January 2014 Principal, CSC, General Fund Final 14-15 budget In progress

School Code: 8086 School Name: SOUTH HIGH SCHOOL
CDE Improvement Planning Template for Schools (Version 5.2 -- Last Updated: August 30, 2013) 43
and budgetary projections. Personnel Committee
Recruit and hire “highly qualified” teachers. January 2014, ongoing
Principal, Personnel Committee
General Fund, Title 1 Funds Final 14-15 staffing plan In progress
Provide regular, ongoing, differentiated professional development so teachers can meet the diverse needs of South HS students.
August 2014-
Ongoing
Leadership team General Fund, Title II Funds Review of agendas In progress
Major Improvement Strategy #6: Increase authentic parent involvement. Research has shown that regardless of family income or background, students with involved parents are more likely to show: 1) higher grades and test scores; 2) increased enrollment in higher level classes; 3) pass more classes and earn credits; 4) show an increase in school attendance; 5) show an increase in social skills; 6) improve behavior; 7) adapt better to school environment; 8) show an increase in graduation rates; 9) show an increase in college enrollment. Root Cause(s) Addressed:
While parent participation has increased over the last two years, regular on-going participation falls on the shoulders of 100-150 parents.
Accountability Provisions or Grant Opportunities Addressed by this Major Improvement Strategy (check all that apply):
School Plan under State Accountability Title I School wide or Targeted Assistance Plan requirements Title I Focus School Plan requirements
Application for a Tiered Intervention Grant (TIG) Improvement Support Partnership (ISP) or School Improvement Grant
Description of Action Steps to Implement the Major Improvement Strategy
Timeline
2013-2014 Key Personnel*
Resources (Amount and Source: federal, state,
and/or local)
Implementation Benchmarks
Status of Action Step* (e.g., completed,
in progress, not begun)
PTSA to create more collaboration and build relationships with the PAC/ELA sub-group of parents.
May 2013 Karen Duell, Community/Family Liaison
Current PAC Parents
PTSA Members
NA Approved among PTSA Board Members and PAC Representatives
Collaborative efforts of all parents to support South’s parent involvement.
Completed
Through personal phone calls and home visits, increase the number of PAC Parent Representatives from South High School to District and South PAC meetings. We will seek out PAC topics from PAC parents to empower parents to be advocates for their student’s educational
Sept. 2013 Current PAC Representatives; Karen Duell; ELA Lead Teacher
Title 1 funds: 4 PAC Meetings/year 2 buses x 4 x $105.00 each $840.00.
Double our PAC representatives from 2013
In Progress

School Code: 8086 School Name: SOUTH HIGH SCHOOL
CDE Improvement Planning Template for Schools (Version 5.2 -- Last Updated: August 30, 2013) 44
needs/goals.
Provide events to bring ALL families together at South. Use all “tools” to communicate to families about the events. Resettling agencies such as Lutheran Family Services, Colorado African Organization, etc. will be sent information on all events to assist in communicating to families. Paraprofessionals will also communicate events in their native languages to our ELA students and parents. Flyers will be created in native languages. Other communication tools include emails, automated calls, website and school announcements.
Sept. 2013 through May 2014
PTSA Members; PAC Members; Karen Duell;
Paraprofessionals
Events will be sponsored by PTSA and Title 1 funds. Title 1 – 3 events/year x 2 buses each event x $105.00 each event. $630.00 Other Expenses: Food; Prizes, etc.: PTSA Funds; General Funds; community partnership donations Approximately $200.00
An increase in parent attendance at school functions as a result of an increase in communication.
An increase in parent volunteers at school events to assist in creating a warm welcome!
In Progress
Host “Parent Forum” or a Q and A time for parents with our principal and administrative staff to discuss and survey their needs and answer questions to create an intentional outreach for parent input and involvement. Have translators available.
Fall 2013
PAC & PTSA
Karen Duell
Dr. Waters
Admin. Personnel
Title 1 Funds: 2 DPS buses for this event. $210.00
Increase in the number of parent volunteers as a result of Greater awareness of the
Section V: Appendices
Some schools will need to provide additional forms to document accountability or grant requirements:
Additional Requirements for Turnaround Status Under State Accountability (Required)
Tiered Intervention Grantee (TIG) (Required)

School Code: 8086 School Name: SOUTH HIGH SCHOOL
CDE Improvement Planning Template for Schools (Version 5.2 -- Last Updated: August 30, 2013) 45
SCHOOL – PARENT- STUDENT COMPACT The Denver South High School, and the parents of the students participating in activities, services, and programs funded by Title I, Part A of the Elementary and Secondary Education Act (ESEA) (participating children), agree that this compact outlines how the parents, the entire school staff, and the students will share the responsibility for improved student academic achievement and the means by which the school and parents will build and develop a partnership that will help children achieve the State’s high standards. This school-parent compact is in effect during school year 2013-2014
School Responsibilities Denver South High School will:
1. Provide high-quality curriculum and instruction in a supportive and effective learning environment that enables the participating children to meet the State’s student academic achievement standards as follows: All students will receive a rigorous and supportive education. All teachers will meet weekly during common planning to effectively plan their instruction based on formative assessments. The goal is to prepare all students to succeed in a four year college or university. Teachers/staff will inform parents of any academic or disciplinary concerns.
2. Hold parent-teacher conferences during which this compact will be discussed as it relates to the individual child’s achievement. Specifically, those conferences will be held: Parent-teacher conferences will be held in October during semester 1 and in February during semester 2.
3. Provide parents with frequent reports on their children’s progress. Specifically, the school will provide reports as follows: Teachers will update grades in Infinite Campus every week; in addition, every four weeks a report card is mailed home to each family.
4. Provide parents reasonable access to staff. Specifically, staff will be available for consultation with parents as follows: Teachers will be available to meet with students and parents during their planning time or after school. Parents should schedule this with the teacher directly or with their child’s guidance counselor.
5. Provide parents opportunities to volunteer and participate in their child’s class, and to observe classroom activities, as follows: All parents can contact Parent and Community Liaison Karen Duell to volunteer at South High School.
Parent Responsibilities We, as parents, will support our children’s learning in the following ways:
1. Monitor attendance and/or tardiness of my student. Notify the school when my student has an excused absence. 2. Encourage homework assignments to be completed and on time as directed by each teacher. 3. Volunteer for the school a minimum of one time each semester as opportunities are presented by the school. 4. Participating, as appropriate, in decisions relating to my children’s education. Inform my student’s teachers and counselors about any supports that are needed for my student to be successful. 5. Promoting positive use of my child’s extracurricular time. 6. Staying informed about my child’s education and communicating with the school by promptly reading all notices from the school or the school district either by mail, electronically and/or in parent portal and
responding, as appropriate. 7. Serving, to the extent possible, on policy advisory groups, such as being the Title I, Part A parent representative on the school’s School Improvement Team, the Title I Policy Advisory Committee, the District wide
Policy Advisory Council, the State’s Committee of Practitioners, the School Support Team, or other committees that are presented by the school. Student Responsibilities We, as students, will share the responsibility to improve our academic achievement and achieve the State’s high standards. Specifically, we will:
1. Complete all assignments as directed by teachers and seek tutoring from teaches/staff, as needed, with assignments. 2. Increase my academic skills by reading outside of school time and seek other academic tools that will increase my knowledge in all content areas. 3. Relay to my parents or the adult who is responsible for my welfare all notices and information received by me from my school.
Signatures: __________________________________________ ______________________________________ _____________________________________ ___________
School Representative Parent Student Date

School Code: 8086 School Name: SOUTH HIGH SCHOOL
CDE Improvement Planning Template for Schools (Version 5.2 -- Last Updated: August 30, 2013) 46