· Corporate Center Board department Chief Executive Offi cer Finance, Global Business Services...
264
ANNUAL REPORT 2011
Transcript of · Corporate Center Board department Chief Executive Offi cer Finance, Global Business Services...

ANNUAL REPORT 2011

Corporate Center
Board department Chief Executive Offi cerFinance, Global Business Services Personnel
Board member Dr Frank Appel Lawrence Rosen Walter Scheurle
Functions Corporate Offi ce
Corporate Legal
Corporate Executives
Corporate Communications
Corporate Development
Corporate Regulation Management
Corporate First Choice
Corporate Public Policy & Responsibility
hr dhl International
Chief Commercial Offi cer (cco)
Corporate Controlling
Corporate Accounting & Reporting
Investor Relations
Corporate Finance
Corporate Internal Audit & Security
Taxes
Global Business Services (Group-wide services: Procurement, Real Estate, Finance Operations etc.)
hr Standards & Guidelines Germany
hr mail
02 GROUP STRUCTURE
Divisions
Board department mail express
global forwarding, freight supply chain
Board member Jürgen Gerdes Ken Allen Roger Crook Bruce Edwards
Brand Deutsche Post dhl dhl dhl dhl
Business units / regions
Mail Commu-nication
Dialogue Marketing
Press Services
Value-Added Services
Retail Outlets
Pension Service
Global Mail
Parcel Germany
Europe
Americas
Asia Pacifi c
eemea (Eastern Europe, the Middle East and Africa)
Global Forwarding
Freight
Supply Chain
Williams Lea
II

Group Structure / Target-Perform
ance Comparison
03 TARGET-PERFORMANCE COMPARISON
GOALS 2011 RESULTS 2011 GOALS 2012
ebit 1 ebit ebit
Group: more than €2.4 billion.
mail division: around €1.1 billion.
dhl divisions: more than €1.7 billion.
Corporate Center / Other: around €–0.4 billion.
Group: €2.44 billion.
mail division: €1.11 billion.
dhl divisions: €1.72 billion.
Corporate Center / Other: € – 0.39 billion.
Group: €2.5 billion to €2.6 billion.
mail division: €1.0 billion to €1.1 billion.
dhl divisions: around €1.9 billion.
Corporate Center / Other: around €–0.4 billion.
Consolidated net profi t 2 Consolidated net profit 2 Consolidated net profi t 2
Continue to improve consolidated net profi t before effects from the measure-ment of the Postbank instruments in line with operating business (previous year: € 972 million).
Consolidated net profi t before effects from the measurement of the Postbank instruments: €1.46 billion.
Continue to improve consolidated net profi t before effects from the Postbank transaction in line with operating business.
Capital expenditure (capex) Capital expenditure (capex) Capital expenditure (capex)
Increase investments from €1.26 billion (2010) to no more than €1.6 billion.
Invested: €1.72 billion. Increase investments to €1.8 billion.
Revenue Revenue Dividend distribution
Increase revenue, especially in the dhl divisions, more or less in line with forecast medium-term growth rates of 7 % to 9 %.
Organic revenue growth in the dhl divisions: 7.2%.
Pay out 40 % to 60 % of net profi t as dividend.
1 Forecast increased over the course of the year.2 After deduction of non-controlling interests.
III

Group Structure / Target-Perform
ance Comparison
Deutsche Post DHL is the world’s leading mail and logistics services group. The Deutsche Post and dhl corporate brands represent a one-of-a-kind portfolio of logistics (dhl) and communi -cations (Deutsche Post) services. The Group provides its customers with both easy-to-use standardised products as well as innovative and tailored solutions ranging from dialogue marketing to industrial supply chains. About 470,000 employees in more than 220 countries and territories form a global network focused on service, quality and sustainability. With programmes in the areas of climate protection, disaster relief and education, the Group is committed to social responsibility.
The postal service for Germany. The logistics company for the world.
dp-dhl.com
01.1 Selected key fi gures
2010 2011 + / – % Q 4 2010 Q4 2011 + / – %
Revenue € m 51,388 1 52,829 2.8 13,835 1 14,126 2.1
Profi t from operating activities (ebit) € m 1,835 2,436 32.8 525 599 14.1
Return on sales 2 % 3.6 4.6 – 3.8 4.2 –
Consolidated net profi t for the period 3 € m 2,541 1,163 – 54.2 487 175 – 64.1
Operating cash fl ow € m 1,927 2,371 23.0 1,025 1,262 23.1
Net liquidity (–) / net debt (+) 4 € m –1,382 – 938 – 32.1 – – –
Return on equity before taxes % 29.8 15.2 – – – –
Earnings per share 5 € 2.10 0.96 – 54.3 0.40 0.14 – 65.0
Dividend per share € 0.65 0.70 6 7.7 – – –
Number of employees 7 421,274 423,348 0.5 – – –1 Prior-period amount adjusted, see Note 5. 2 ebit / revenue.3 After deduction of non-controlling interests, including Postbank.4 For the calculation please refer to page 59 of the Group Management Report.5 Including Postbank.6 Proposal.7 Average ftes.
01 THE GROUP
I

ANNUAL REPORT 2011 CONTENTS
The Group I
Group Structure II
Target-Performance Comparison III
SIMPLY GROWInterview with the ceo
12
GROUP MANAGEMENT REPORT 27 – 122
Business and Environment 29
Deutsche Post Shares 42
Economic Position 46
Divisions 60
Non-Financial Performance Indicators 81
Further Developments 97
Outlook 98
CORPORATE GOVERNANCE 123 – 148
Report of the Supervisory Board 125
Supervisory Board 129
Board of Management 130
Mandates 132
Corporate Governance Report 133
CONSOLIDATED FINANCIAL STATEMENTS 149 – 246
Income Statement 151
Statement of Comprehensive Income 152
Balance Sheet 153
Cash Flow Statement 154
Statement of Changes in Equity 155
Notes to the Consolidated Financial Statements 156
Responsibility Statement 245
Independent Auditor’s Report 246
FURTHER INFORMATION 247 – 256
Index 249
Glossary 250
Graphs and Tables 251
Locations 252
Multi-Year Review 254
Contacts 256
Events IV

Group Structure / Target-Perform
ance Comparison
Deutsche Post DHL is the world’s leading mail and logistics services group. The Deutsche Post and dhl corporate brands represent a one-of-a-kind portfolio of logistics (dhl) and communi -cations (Deutsche Post) services. The Group provides its customers with both easy-to-use standardised products as well as innovative and tailored solutions ranging from dialogue marketing to industrial supply chains. About 470,000 employees in more than 220 countries and territories form a global network focused on service, quality and sustainability. With programmes in the areas of climate protection, disaster relief and education, the Group is committed to social responsibility.
The postal service for Germany. The logistics company for the world.
dp-dhl.com
01.1 Selected key fi gures
2010 2011 + / – % Q 4 2010 Q4 2011 + / – %
Revenue € m 51,388 1 52,829 2.8 13,835 1 14,126 2.1
Profi t from operating activities (ebit) € m 1,835 2,436 32.8 525 599 14.1
Return on sales 2 % 3.6 4.6 – 3.8 4.2 –
Consolidated net profi t for the period 3 € m 2,541 1,163 – 54.2 487 175 – 64.1
Operating cash fl ow € m 1,927 2,371 23.0 1,025 1,262 23.1
Net liquidity (–) / net debt (+) 4 € m –1,382 – 938 – 32.1 – – –
Return on equity before taxes % 29.8 15.2 – – – –
Earnings per share 5 € 2.10 0.96 – 54.3 0.40 0.14 – 65.0
Dividend per share € 0.65 0.70 6 7.7 – – –
Number of employees 7 421,274 423,348 0.5 – – –1 Prior-period amount adjusted, see Note 5. 2 ebit / revenue.3 After deduction of non-controlling interests, including Postbank.4 For the calculation please refer to page 59 of the Group Management Report.5 Including Postbank.6 Proposal.7 Average ftes.
01 THE GROUP
I

ANNUAL REPORT 2011
You send. You order. We deliver. Safely and on time. Our customers have every right to expect this, and meeting their expectations is our greatest challenge. We handle each and every shipment meticulously, all within our complex yet seamless network. In Germany alone, our network moves some 65 million letters and around three million parcels and small packages from a to b every working day.
The key word is simplifi cation. The simpler we make solving our customers’ complex logistics problems, the more satisfi ed they will be.
We provide communications and logistics ser-vices in more than 220 countries and territories and we understand the needs of our customers, both large and small, doing business all over the world in a broad range of industries. Ours is a globally integrated business. Through simplifi cation we are unlocking our potential for future growth.
1

ACT STRATEGICALLY
€2.44 billionCONSOLIDATED EBITin fi nancial year 2011.
€52.8 billionCONSOLIDATED REVENUEin fi nancial year 2011.
2

The Post Tower in Bonn. 7
SIMPLY GROWDeutsche Post DHL’s ceo is convinced that the company’s consistent focus on its Strategy 2015 is bearing fruit and that the Group is off to a good start on the road to achieving its quite ambitious goals.
1 Dr Frank Appel, ceo
1
3

ACT STRATEGICALLY
€2.44 billionCONSOLIDATED EBITin fi nancial year 2011.
€52.8 billionCONSOLIDATED REVENUEin fi nancial year 2011.
2
“Why is the iPhone such a success? Because it integrates applica tions and interfaces and makes everything as simple as possible for its users. We can learn from that and transfer this idea over to our industry. Deutsche Post DHL should be-come the iPhone of the logistics industry.”
2 Frank Appel sees enormous potential for growth in the fl ourishing e-commerce sector.
3 Dr Appel also thinks the company will experience growth in 2012.
2
3
4

The Post Tower in Bonn. 7
Dr Appel, how would you rate fi nancial year 2011?We not only exceeded our own expectations
but also those of external observers, who were posi-tively surprised with our results. This shows that focusing consistently on our Strategy 2015 is bearing fruit. Revenue increased to €52.8 billion despite be-ing reduced by currency effects and changes in our port folio; and even though we raised our earnings guidance twice during the year, in the end we still exceeded our expectations slightly with a fi gure of €2.44 billion, quite a noteworthy achievement in an uncertain economic environment.
What do you think were the deciding factors?We consistently utilised our strengths as the
market leader in the German mail business and nearly all of our logistics activities. The encouraging growth we’ve seen in the German parcel business and the fast-growing Asian region substantiates this.
Your goal is to be the provider, employer and investment of choice in the industry. How successful have you been?We are off to a good start on the road to achiev-
ing our quite ambitious goals. We’ve seen a measur-able increase in customer satisfaction, both in our mail division and in our dhl divisions. We have also made strides as an employer: for the third year in a row, we improved our ratings in our annual employ-ee opinion survey substantially. I’m convinced that satisfi ed employees and customers have a direct, positive effect on our fi nancial performance.
And what does that mean for investors?First of all, it’s confi rmation that they have in-
vested in a solid company with bright prospects. In 2011, our share price performed better than the dax. We certainly understand how important a stable dividend policy is. Therefore, we intend to consist-ently distribute 40 % to 60 % of our net profi ts as dividends. We will propose raising the dividend from €0.65 last year to €0.70 per share for fi nancial year 2011 to our shareholders at the Annual General Meeting in May.
In 2010, dhl made the largest contribution to consolidated net profi t for the fi rst time. Did this trend continue?Yes. In 2011, all of our divisions contributed to
our very good results. Our express and logistics busi-nesses, in particular, have gained momentum. In some areas, revenues increased quite considerably. This also goes for earnings that were still impacted by restructuring measures in the previous year. These measures substantially improved our profi tability, and our margins increased noticeably.
How do you see the trend in the German mail and parcel market?Without a doubt, the internet is having the
greatest impact on this business. It’s presenting chal-lenges but also opening enormous growth opportun-ities. Traditional mail is giving way to electronic forms of communication. Now we did see volumes stabilise in 2011 but demand will continue to decline due to the overall structural trend. In our parcel busi-ness on the other hand, the trend is very encourag-ing. We are reaping the rewards of the fl ourishing e-commerce sector. We grew by almost double-digit fi gures and expect volumes to increase signifi cantly in the future as well. What’s more, we agreed upon a Generations Pact with the trade unions, a trend-setting model that is the fi rst of its kind.
You’ve set yourself the goal of offering your customers services that are easy to use. What exactly does that mean?We believe that customers will only purchase
services that make their lives easier. That’s why we try, wherever we can, to make things easier and to reduce complexity and to do so along the entire value chain. Why is the iPhone such a success? Be-cause it integrates applications and interfaces and makes everything as simple as possible for its users. We can learn from that and transfer this idea over to our industry. Deutsche Post DHL should become the iPhone of the logistics industry. We just established the position of cco at dhl, which was a logical step in the development of our customer promise.
5
ACT STRATEGICALLY
€2.44 billionCONSOLIDATED EBITin fi nancial year 2011.
€52.8 billionCONSOLIDATED REVENUEin fi nancial year 2011.
2
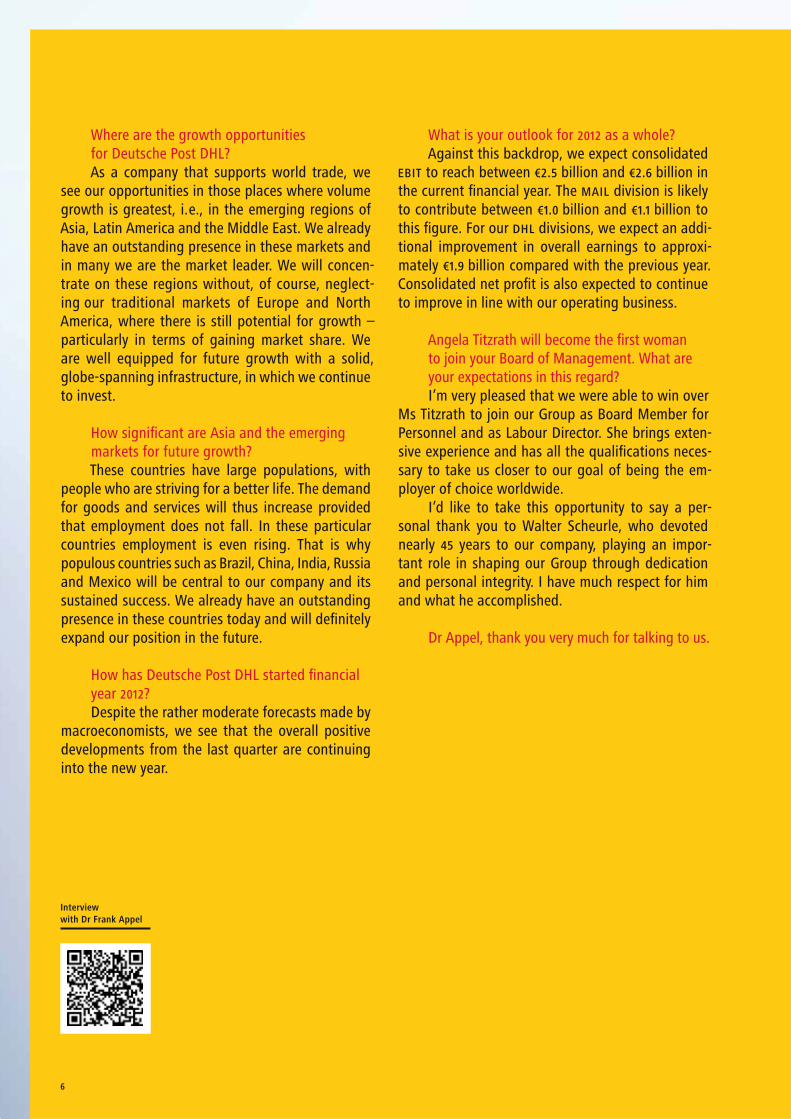
Where are the growth opportunities for Deutsche Post DHL?As a company that supports world trade, we
see our opportunities in those places where volume growth is greatest, i. e., in the emerging regions of Asia, Latin America and the Middle East. We already have an outstanding presence in these markets and in many we are the market leader. We will concen-trate on these regions without, of course, neglect-ing our traditional markets of Europe and North America, where there is still potential for growth – particularly in terms of gaining market share. We are well equipped for future growth with a solid, globe-spanning infrastructure, in which we continue to invest.
How signifi cant are Asia and the emerging markets for future growth?These countries have large populations, with
people who are striving for a better life. The demand for goods and services will thus increase provided that employment does not fall. In these particular countries employment is even rising. That is why populous countries such as Brazil, China, India, Russia and Mexico will be central to our company and its sustained success. We already have an outstanding presence in these countries today and will defi nitely expand our position in the future.
How has Deutsche Post DHL started fi nancial year 2012? Despite the rather moderate forecasts made by
macroeconomists, we see that the overall positive developments from the last quarter are continuing into the new year.
What is your outlook for 2012 as a whole?Against this backdrop, we expect consolidated
ebit to reach between €2.5 billion and €2.6 billion in the current fi nancial year. The mail division is likely to contribute between €1.0 billion and €1.1 billion to this fi gure. For our dhl divisions, we expect an addi-tional improvement in overall earnings to approxi-mately €1.9 billion compared with the previous year. Consolidated net profi t is also expected to continue to improve in line with our operating business.
Angela Titzrath will become the fi rst woman to join your Board of Management. What are your expectations in this regard?I’m very pleased that we were able to win over
Ms Titzrath to join our Group as Board Member for Personnel and as Labour Director. She brings exten-sive experience and has all the qualifi cations neces-sary to take us closer to our goal of being the em-ployer of choice worldwide.
I’d like to take this opportunity to say a per-sonal thank you to Walter Scheurle, who devoted nearly 45 years to our company, playing an impor-tant role in shaping our Group through dedication and personal integrity. I have much respect for him and what he accomplished.
Dr Appel, thank you very much for talking to us.
Interview with Dr Frank Appel
6

The Post Tower in Bonn. 7

OPENING MARKETS
36 %MARKET SHAREfor dhl in the inter-national express busi-ness in Asia (2010).
US $ 175 millionINVESTMENTin our dhl hub in Shanghai over the lifetime of the facility.11%
ANNUAL GROWTHexpected for the intra-Asian market until 2025.
8

The Shanghai skyline. 13
ENSURING GROWTHAsian markets are growing rapidly, and trade both within the region and with other parts of the world is constantly increasing. In the summer of 2012, dhl Express will open its newest hub at Shanghai Pudong International Airport, putting the company in a strong position to extend its role as market leader in Asia.
1 Technicians still dominate the scene at the new dhl hub in Shanghai, which will go into operation in the summer of 2012.
1
9

OPENING MARKETS
36 %MARKET SHAREfor dhl in the inter-national express busi-ness in Asia (2010).
US $ 175 millionINVESTMENTin our dhl hub in Shanghai over the lifetime of the facility.11%
ANNUAL GROWTHexpected for the intra-Asian market until 2025.
8
“The hub gives us suffi cient capacity to accommodate growth, especially in north Asia. There will be more regional and international fl ight connections to and from Shanghai. dhl will therefore be able to provide greater fl exibility and reliability to customers with guaranteed time-definite delivery to major cities in north Asia. The Shanghai hub complements the hub in Hong Kong, shortening flight routes and times, and thus enabling later collections and earlier deliveries.”Jerry Hsu, ceo dhl Express Asia Pacifi c
2 The sorting centre at the new hub in Shanghai spans an enormous 55,000 m2.
3 More than six kilometres of conveyor belts twist and turn through the centre.
4 Jerry Hsu, ceo dhl Express Asia Pacific, stresses the importance of the new hub for further growth in the Asian markets.
5 dhl has harnessed years of experi-ence from its existing hubs to design and construct the new North Asia Hub.
2
3
4
5
10

The Shanghai skyline. 13
Asian markets growing rapidlyThe new facility stands impressively in front
of a grey January sky as the sound of jet engines from the nearby runway can be heard. Inside, a team of technicians are busy commissioning a sophisti-cated automated sorting system, evidence that here, in the freight zone on the west side of Shanghai Pudong Airport, a fi rst-class hub is in the works: dhl’s new North Asia Hub. “No other express market is as dynamic as the Asian market,” explains Jerry Hsu, ceo dhl Express Asia Pacifi c. “In order to be the provider of choice for our Asian customers, we have to improve our standard of service continuously, be-coming faster and more effi cient. The new hub is an important part of that.”
The numbers speak for themselves. Asian coun-tries such as China, India and South Korea are the new growth drivers of the world economy and that is good news for the logistics sector. Experts predict that the air freight market in Asia will see the highest growth rates in the world until 2025, with the intra-Asian market expected to grow by 11 % annually.
Expanding market leaderdhl already is the market leader in the express
business in Asia today. The company strategy is to operate its own hubs, and it maintains hubs in Hong Kong, Singapore and Bangkok. These, in turn, are connected with 50 gateways located strategi-cally throughout the Asia Pacifi c region. The North Asia Hub will replace the existing gateway at Shanghai Pudong Airport and represents an invest-ment of around us $ 175 million over the lifetime of the facility.
dhl has harnessed years of experience from its existing hubs to design and construct the facility, and new solutions have been developed that make operations easier, safer and more effi cient. For ex-ample, the loading area has been made especially large and given a wide vehicle lane. In addition, skids and carts are being employed to lessen the need for forklifts. This reduces congestion and the risk of accidents, and increases effi ciency. The high number of loading docks speeds up loading and un-loading of lorries, which will be quickly shuttling in and out of the dock area to keep up with the cen-tre’s lightning-fast incoming and outgoing process-ing times. With four separate automatic sorters, it
will be a state-of-the-art operation, and its 55,000 m2 of operational fl oor space make it the largest dhl Express hub in Asia and one of the largest anywhere in the world.
The new hub goes into operation in summer 2012The North Asia Hub consists of two main build-
ings, a sorting centre and a 6,500 m2 administrative building. In the sorting centre, six kilometres of con-veyor belts and sorters have already been installed and it will not be long before the fully automated parcel and document sorters are processing up to 20,000 parcels and just as many documents per hour. In the meantime, fi nal fi t- out work such as the in-stallation of an advanced security system with 300 cameras has begun.
Once the hub goes into operation, which will be a step-by-step process to be completed in the summer of 2012, the round-the-clock quality control centre will monitor all shipments in the air and on the ground, and a team of 600 people will be in place to ensure all parcels and documents are processed quickly and effi ciently.
“The hub in Shanghai reinforces dhl’s multi-hub strategy in Asia Pacific. Together with our hub in Hong Kong as well as those in Bangkok and Singapore, the four hubs will be linked to over 50 dhl Express gateways located strategically throughout Asia Pacific, providing our customers with the most extensive network infra-structure in the region.”Chris Bresnahan,evp Network Operations & Aviation, dhl Express Asia Pacifi c
11

OPENING MARKETS
36 %MARKET SHAREfor dhl in the inter-national express busi-ness in Asia (2010).
US $ 175 millionINVESTMENTin our dhl hub in Shanghai over the lifetime of the facility.11%
ANNUAL GROWTHexpected for the intra-Asian market until 2025.
8
An investment in the future“The new hub is an investment in our future and
a commitment to providing ‘great service quality’ on north Asian trade lanes,” says Mr Hsu. “It puts us a step ahead of the competition.” The new hub will increase capacity and create the opportunity for later collections and earlier deliveries, shortening transit times. “The facility is an example of how dhl is tap-ping into the enormous growth potential in Asia,” says Mr Hsu. “The North Asia Hub is an important milestone that strengthens our leading position in the region substantially.”
6 Up to 40,000 shipments are set to be processed each hour in Shanghai.
7 A team of up to 600 people will be in place to ensure all parcels and documents are processed quickly and efficiently.
8 Ready for take-off: the new hub in Shanghai will give dhl the capacity it needs to handle rapid growth in the Asian markets.
6
7
8
12

The Shanghai skyline. 13
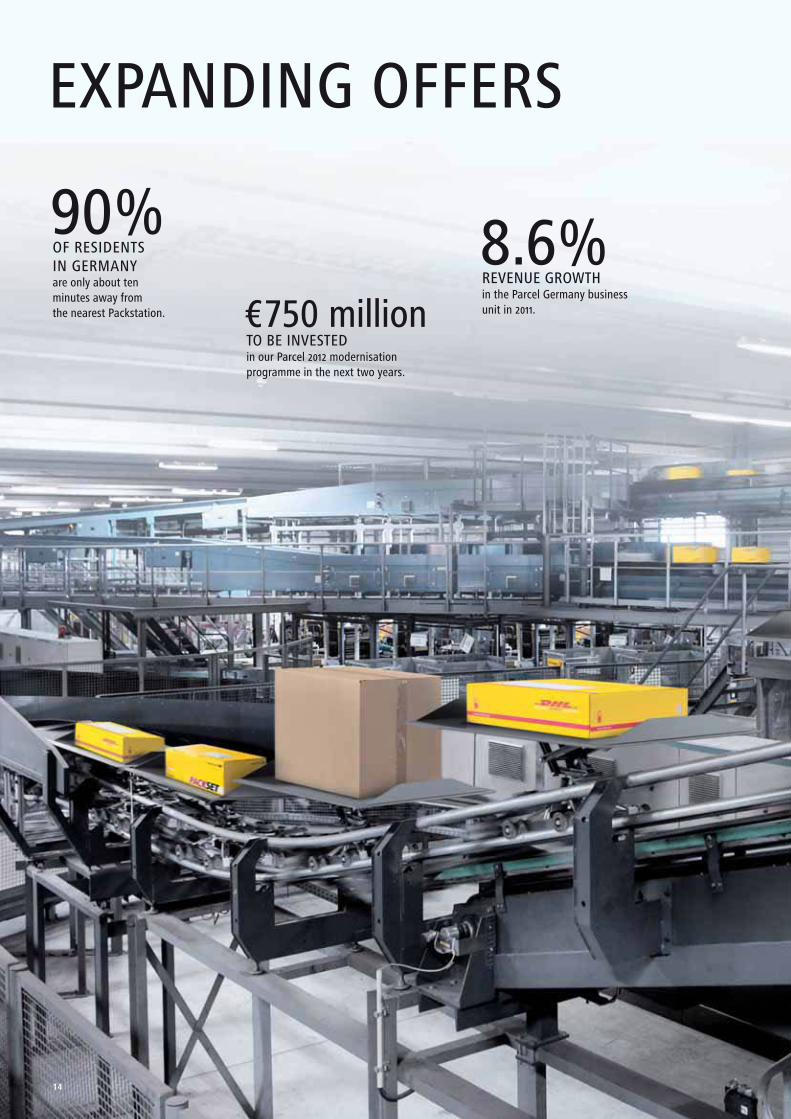
EXPANDING OFFERS
8.6%REVENUE GROWTHin the Parcel Germany business unit in 2011.€ 750 million
TO BE INVESTEDin our Parcel 2012 modernisation programme in the next two years.
90%OF RESIDENTS IN GERMANYare only about ten minutes away from the nearest Packstation.
14

One of 33 parcel centres in Germany. 19
IMPROVING SERVICEWith its easy-to-use services, the parcel business has become the innovative engine of the mail division. Deutsche Post DHL is investing €750 million in its German parcel network over the next two years. The goal is to continue growing in a booming market. In the future, parcels are to reach customers even more quickly and delivery is to be more precise and transparent.
1 Deutsche Post DHL is investing in the booming parcel business.
1
1515

EXPANDING OFFERS
8.6%REVENUE GROWTHin the Parcel Germany business unit in 2011.€ 750 million
TO BE INVESTEDin our Parcel 2012 modernisation programme in the next two years.
90%OF RESIDENTS IN GERMANYare only about ten minutes away from the nearest Packstation.
14
Investing in an important goalWho wouldn’t like a remote control to guide
their parcels to precisely where they want them to go? Soon, Deutsche Post DHL will be offering just that. The service will be made up of an entire bundle of products that allow customers to precisely “control” the delivery of their parcels, whether they are day-defi nite, time-defi nite or destination-defi nite. This is but a tiny example of the innovative strength of the leading provider on the German parcel market. The largest example is called Parcel 2012 and it “weighs” €750 million. The concept is the company’s response to new business models in the rapidly growing e-commerce sector and to changing consumer be-haviour. “Parcels will become as fast as letters,” says Jürgen Gerdes, Cor porate Board Member for mail.
“We are laying the groundwork by expanding our network and creating innovative shipping solutions.”
Intelligent solutions that make customers’ lives easierToday, the parcel business makes up around
one-fi fth of revenue in the mail division. In 2011, dhl Parcel alone transported some three million parcels per day in Germany. There is a demand for innova-tive solutions that make customers’ lives easier and that goes for the entire value chain, from collecting parcels from customers to high-tech sorting and delivering. Examples of such successful solutions: Packstations, which were introduced in 2001. In Ger-many, there are already around 2,500 stations and more than 2.5 million registered users. Since 2005, deliverers have collected parcels from private house-holds and since 2007 there have been “postboxes” for parcels, the so-called Paketboxes.
2 There are currently around 2,500 Pack-stations in Germany.
3 In the future, a parcel will be just as fast as a letter.
4 Making things as easy as possible for our customer is the goal pursued by each and every one of our employees.
42
3
16

One of 33 parcel centres in Germany. 19
Online shopping is a growth driverE-commerce, an economic sector that has seen
impressive growth for years, offers an enormous op-por tunity for growth in the logistics sector. According to Bundesverband des Deutschen Versand handels (the German e-commerce and distance selling trade association), the 2011 Christmas season generated €4.4 billion in revenue for businesses involved in e-commerce, 22 % more than in 2010. dhl transported up to six million parcels a day during this time. That fi gure is normally around three million. According to the Deutsche Post DHL study Shopping 4.0, published in February 2012, one in three Germans shopped on-line at least three times in the past six months. The e-commerce sector is likely to be boosted further by the rising number of smart devices and online net-working through social media.
Guaranteed quality, even for sensitive itemsBooks, cd s, clothing and consumer electronics
are currently the main items being purchased online. The future is likely to see even more areas open up to retailers and logistics providers, not least as a re-sult of changing demographics. For instance, a growing number of retail customers will purchase medicine and groceries online one day. By expand-ing the parcel network, adding new vehicles and permanently optimising delivery rounds, dhl is well prepared to offer the right solutions for these re-quirements as well, and one of these solutions is faster parcel transit times, something that is very important for sensitive parcels in particular. In future 95 % of all parcels in Germany should arrive at their destinations on the next day, just as fast as a letter. Improved effi ciency will make this possible. Parcel centres will one day be able to handle 28,000 to
5 e-commerce is booming and offers a good opportunity for growth in the logistics industry.
6 In future, 95% of all parcels should reach their destinations the next day.
7 Since 2007, we have also provided “postboxes” for parcels.
6
7
5
17

EXPANDING OFFERS
8.6%REVENUE GROWTHin the Parcel Germany business unit in 2011.€ 750 million
TO BE INVESTEDin our Parcel 2012 modernisation programme in the next two years.
90%OF RESIDENTS IN GERMANYare only about ten minutes away from the nearest Packstation.
14
50,000 parcels an hour depending on location and demand, a 150 % increase from the 20,000 parcels we process each hour today.
Transparency makes it simpleSimply grow also means making things both
easier and more understandable for customers. That is why Deutsche Post DHL is taking aim at transpar-ency. In the future, a state-of-the-art it infrastruc-ture will allow customers to see the current status of their parcels practically in real time. As a result, indi-viduals will also be able to decide at short notice whether their parcel should be delivered at home, at the offi ce or at a Pack station. Sending items will also become easier for business customers. When the new concept is in place, they will be able to post a parcel later in the evening with the peace of mind that their customers will still receive the product on time. “Our customers will experience a marked im-provement in our already market-leading quality and reliability,” says Jürgen Gerdes about the planned innovations.
Deutsche Post DHL’s internet services
www.dhl.com
www.deutschepost.com
18

One of 33 parcel centres in Germany. 19

PLANNING INTELLIGENTLY
1,000PARCELStransported by the SmartTruck each day in the Bonn test region.
15%FEWER KILOMETRESdriven by the SmartTrucks in tests conducted in Germany and routes completed on average 8 % faster.
30%IMPROVEMENT IN CARBON EFFICIENCYby 2020.
20

The Indian megacity of Bangalore. 25
INCREASING EFFICIENCYDynamic route planning is what the SmartTruck is about. This state-of-the-art delivery vehicle saves time, money and emissions by intelligently navigating the best route in real time.
1 Couriers can now find the fastest route through traffi c using gps-based route planning.
1
21

PLANNING INTELLIGENTLY
1,000PARCELStransported by the SmartTruck each day in the Bonn test region.
15%FEWER KILOMETRESdriven by the SmartTrucks in tests conducted in Germany and routes completed on average 8 % faster.
30%IMPROVEMENT IN CARBON EFFICIENCYby 2020.
20
Bangalore, the “Silicon Valley of India” and the country’s third largest city, is also one of its ad-ministrative, industrial, commercial and service cen-tres. You have to know the city’s maze of streets and alleyways well to fi nd your way around here, even more so to fi nd the quickest way to get from one place to another and avoid congestion. Now try to do that amongst the fl ood of around 4.2 million vehicles toiling through the streets of this mega-city – a number that’s growing all the time. Traffi c jams and delays, not to mention the pungent smell of exhaust fumes, are as commonplace as the cars.
Navigating through the mazeA number of the couriers at dhl’s subsidiary,
Blue Dart, of which dhl holds an 80 % share, now have it a lot easier. Their SmartTrucks help them navigate the quickest route through Bangalore’s busy streets. India’s largest air express provider has been taking part in a trial project to test these intelligent vehicles since summer 2011. What is so special about the SmartTruck? “Shipments are sorted automati-cally before the vehicles leave the distribution cen-tre,” explains Anil Khanna, Managing Director at Blue Dart Express Ltd. Once sorted and loaded, the parcels arrive at their destinations faster than ever with the SmartTruck’s help. The vehicles are equipped with dynamic route-planning software that uses gps technology to calculate the optimal route based on the current order situation in the van. The gps unit follows the van’s every move in real time, automatically reacting to current traffi c infor-mation and incoming orders.
From Berlin to BangaloreAfter successful tests in Berlin, Bonn and
Cologne, the plan was to integrate the system into the global it infrastructure and test the SmartTruck in a mega city outside Europe. Bangalore presented an ideal test location. The city and its 8.5 million residents are experiencing an economic boom. Blue Dart operates an 84,000 m2 logistics centre at the airport just 40 kilometres outside the city. Routes into the city are long and the streets are almost always congested.
Designed in Germany, the SmartTruck system required considerable modifi cation before it could be used in Bangalore. After all, Indian cities are quite different from German ones. For example,
many streets in Bangalore do not have names and there are no house numbers. Delivery addresses are often incomplete and postcodes missing. Teams from Blue Dart and dhl worked together closely to fl esh out the differences that impact the software and develop solutions that led to a custom-built SmartTruck concept for the Indian market.
Higher effi ciency, better serviceBy May 2012, SmartTrucks should be covering
all incoming shipments from the Asia Pacifi c region on fi ve separate inner-city routes in Bangalore – but results are already coming in. “We are seeing higher parcel processing capabilities, shorter transit times, synchronised letter and parcel processes and fewer kilometres being travelled by each vehicle,” says Anil Khanna. This means one thing for our custom-ers: better service. The SmartTruck thus offers a so-lution for one of the most important future chal-lenges for the express business: the growing complexity of logistics, especially in chronically con-gested cities and megacities. That is a considerable
2
3
22

The Indian megacity of Bangalore. 25
competitive edge. “Our customers’ primary concern is that their parcels are collected and delivered on time,” says Mr Khanna.
The environment also winsYet SmartTrucks fulfi l another, equally impor-
tant, goal. They reduce our carbon footprint. In 2008, Deutsche Post DHL was the fi rst global logistics pro-vider to set a clear, quantifi able goal with its envi-ronmental protection programme GoGreen. By 2020, the Group intends to improve the carbon effi ciency of its own operations as well as those of its subcon-tractors by 30 %. Katharina Tomoff, Head of GoGreen at Deutsche Post DHL, points to the importance of this target, particularly in the Asian region: “In emerging markets such as India, we absolutely have to fi nd solutions to grow in an environmentally friendly way.”
The SmartTruck is one of the solutions that will reduce co2 emissions in our daily operations. Al-though we are not yet able to quantify the savings from our ongoing test project in India, the results of
our tests in Germany are encouraging. In Berlin, for example, our intelligent transporters drove on aver-age 15 % fewer kilometres and routes were complet-ed 8 % faster. Shorter routes mean reduced fuel con-sumption and lower emissions. “Solutions such as the SmartTruck help us reduce fuel consumption and underscore our leading role in environmental pro-tection,” says Katharina Tomoff.
2 dhl’s subsidiary, Blue Dart, is the largest air express provider in India.
3 A congested street in the metro-polis of Bangalore.
4 The system uses gps to calculate the optimal route.
5 Vehicle movements are tracked in real time.
6 Tests have resulted in a higher volume of processed parcels and shorter transit times.
4 5
6
23

PLANNING INTELLIGENTLY
1,000PARCELStransported by the SmartTruck each day in the Bonn test region.
15%FEWER KILOMETRESdriven by the SmartTrucks in tests conducted in Germany and routes completed on average 8 % faster.
30%IMPROVEMENT IN CARBON EFFICIENCYby 2020.
20
7 The open road: gps guides the SmartTruck along the optimal route.
8 dhl holds an 80 % share in Blue Dart.
The SmartTruckThe test project was fi rst presented in March 2009. Two vehicles equipped with dynamic route planning commenced delivery oper-ations in Berlin’s Mitte district. Since October 2010, the Group has also used SmartTrucks for express delivery in the Cologne / Bonn region. In the summer of 2011, Bangalore became the fi rst test region outside of Europe. dhl also presented the intelligent delivery vehicle at Expo 2010 in Shanghai.
7
8
24

The Indian megacity of Bangalore. 25

26

GROUP MANAGEMENT REPORT 27 – 122
A G
RO
UP M
AN
AG
EMEN
T REPO
RT

BUSINESS AND ENVIRONMENT 29
Business activities and organisation 29
Disclosures required by takeover law 31
Remuneration of the Board of Management and the Supervisory Board 34
Economic parameters 35
Group management 40
DEUTSCHE POST SHARES 42
ECONOMIC POSITION 46
Overall assessment by the Board of Management 46
Signifi cant events 46
Earnings 46
Financial position 49
Assets and liabilities 58
DIVISIONS 60
Overview 60
mail division 61
express division 67
global forwarding, freight division 72
supply chain division 76
NON-FINANCIAL PERFORMANCE INDICATORS 81
Employees 81
Corporate responsibility 87
Procurement 90
Research and development 92
Customers and quality 92
Brands 95
FURTHER DEVELOPMENTS 97
Report on post-balance-sheet date events 97
OUTLOOK 98
Overall assessment of expected performance 98
Opportunities and risks 98
Strategic focus 110
Future organisation 116
Future economic parameters 117
Revenue and earnings forecast 120
Projected fi nancial position 121

BUSINESS AND ENVIRONMENT
Business activities and organisation
The leading mail and logistics group
Deutsche Post DHL maintains a global network that allows us to off er our custom-
ers everything they need for transporting, storing and processing goods and informa-
tion, from standard products to customised solutions. We aim to fulfi l our customers’
requirements comprehensively and we place great value on quality and sustainability.
Th rough our climate protection, disaster management and education programmes, we
demonstrate social responsibility.
Four operating divisions
Th e Group is organised into four operating divisions, each of which is under the
control of its own divisional headquarters and is subdivided into business units for
reporting purposes.
We are the only provider of universal postal services in Germany. In our MAIL
division, we deliver domestic and international mail and parcels and we are specialists in
dialogue marketing, nationwide press distribution services and all the electronic services
associated with mail delivery. Furthermore, with our e-Postbrief product, we are the fi rst
in the market to off er secure, user-identifi ed written communication on the internet.
Our EXPRESS division off ers courier and express services to business customers
and consumers in more than 220 countries and territories, the most comprehensive
network in the world.
Our GLOBAL FORWARDING, FREIGHT division handles the carriage of goods by rail,
road, air and sea. We are the world’s number one air freight operator, number two ocean
freight operator and one of the leading overland freight forwarders in Europe.
Our SUPPLY CHAIN division is the global market leader in contract logistics,
providing warehousing, managed transport and value-added services at every link in
the supply chain for customers in a variety of industries. We also off er solutions for
corporate information and communications management tailored precisely to the needs
of our customers.
We consolidate the internal services that support the entire Group, including
Finance, IT and Procurement, in our Global Business Services. Th is allows us to make
even more effi cient use of our resources whilst reacting fl exibly to the rapidly changing
demands of our business and our customers.
Group management functions are centralised in the Corporate Center.
Glossary, page 250
Glossary, page 250
Deutsche Post DHL Annual Report 2011
Group Management ReportBusiness and Environment
Business activities and organisation
29

a.01 Organisational structure of Deutsche Post DHL
Corporate Center (ceo’s board department, Finance and Personnel)
mail expressglobal forwarding, freight supply chain
• Mail Communication• Dialogue Marketing• Press Services• Value-Added Services• Parcel Germany• Retail Outlets• Global Mail• Pension Service
• Europe• Americas• Asia Pacifi c• eemea
(Eastern Europe, the Middle East and Africa)
• Global Forwarding• Freight
• Supply Chain• Williams Lea
Global Business Services
A presence that spans the globe
Deutsche Post DHL operates around the world. Th e map shows our most important
locations.
Change in Board of Management
In March 2011, Roger Crook was appointed to the Board of Management as head
of the GLOBAL FORWARDING, FREIGHT division. He succeeded Hermann Ude, who left
the company on 31 March 2011.
New cco position created as cross-divisional dhl function
As at 1 October 2011, we created the position of Chief Commercial Offi cer (CCO)
within the CEO’s board department. Th is position combines the cross-divisional
manage ment of key DHL customers with our innovation activities. Th e goal is to further
strengthen DHL’s customer focus in all its business units.
a.02 Group structure from different perspectives
Corporate governance structure
Management responsibility Legal structure Brand names
Structure pursuant to corporate governance duties and responsibilities (boards and committees)
• Corporate Center• Corporate Divisions• Global Business Services
Structure pursuant to decision-making responsi-bility and reporting lines
• Board departments• Corporate departments• Business departments• Service departments• Regions• Departments
Structure based on the Group’s legal entities
• Deutsche Post ag
Structure pursuant to the brand names used in customer communication
• Deutsche Post• dhl
Further information, page 252 f.
Deutsche Post DHL Annual Report 201130

Disclosures required by takeover law
Disclosures required under sections 289 (4) and 315 (4) of the Handelsgesetzbuch
(HGB – German Commercial Code) and explanatory report
Composition of issued capital, voting rights and transfer of shares
As at 31 December 2011, the company’s share capital totalled € 1,209,015,874 and was
composed of the same number of no-par value registered shares. Each share carries the
same statutory rights and obligations and entitles the holder to one vote at the Annual
General Meeting (AGM). No individual shareholder or group of shareholders is entitled
to special rights, particularly rights granting powers of control.
Th e exercise of voting rights and the transfer of shares are based on the general legal
requirements and the company’s Articles of Association, which do not restrict either
of these activities. Article 19 of the Articles of Association sets out the requirements
that must be met in order to attend the AGM as a shareholder and exercise a voting
right. Only persons entered in the share register shall be considered by the company
to be shareholders. Th e Board of Management is not aware of any agreements between
shareholders that would limit voting rights or the transfer of shares.
Members of the Board of Management receive Stock Appreciation Rights (SAR s)
each year as a long-term remuneration component under the Long-Term Incentive Plan
provided that they each invest cash or Deutsche Post AG shares for each tranche of the
plan. If a Board of Management member sells the shares included in his personal invest-
ment for the tranche or disposes of his personal cash investment before the scheduled
waiting period of four years (three-year waiting period for the 2008 tranche) has expired,
all SAR s from that tranche will be forfeited.
Eligible Group executives receive shares from the company as part of the Share
Matching Scheme. Shares received under the scheme are subject to a four-year lock-up
period.
Shareholdings exceeding 10 % of voting rights
KfW Bankengruppe (KfW), Frankfurt am Main, is our largest shareholder, holding
around 30.5 % of the share capital. Th e Federal Republic of Germany holds an in direct
stake in Deutsche Post AG via KfW. According to the notifi cations we have received
pursuant to sections 21 et seq. of the Wertpapierhandelsgesetz (WpHG – German
Securities Trading Act), KfW and the Federal Republic of Germany are the only share-
holders that own more than 10 % of the share capital, either directly or indirectly.
Appointment and replacement of members of the Board of Management
Th e members of the Board of Management are appointed and replaced in accordance
with the relevant legal provisions (sections 84 and 85 of the Aktiengesetz (AktG – German
Stock Corporation Act) and section 31 of the Mitbestimmungsgesetz (MitbestG – German
Co-determination Act)). In accordance with section 84 of the AktG and section 31 of the
MitbestG, appointments by the Supervisory Board shall be for a maximum term of fi ve
years. Re-appointment or extension of the term of offi ce is permitted for a maximum of
fi ve years in each case. Article 6 of the Articles of Association stipulates that the Board
of Management must have at least two members. Beyond that, the number of board
members is determined by the Supervisory Board, which may also appoint a chairman
and deputy chairman of the Board of Management.
Deutsche Post DHL Annual Report 2011
Group Management ReportBusiness and Environment
Disclosures required by takeover law
31

Amendments to the Articles of Association
In accordance with section 119 (1), number 5 and section 179 (1), sentence 1 of the
AktG, amendments to the Articles of Association are adopted by resolution of the AGM.
In accordance with article 21 (2) of the Articles of Association in conjunction with
sections 179 (2) and 133 (1) of the AktG, such amendments generally require a simple
majority of the votes cast and a simple majority of the share capital represented on the
date of the resolution. In such instances where the law requires a greater majority for
amendments to the Articles of Association, that majority is decisive.
Under article 14 (7) of the Articles of Association, the Supervisory Board has the
authority to resolve amendments to the Articles of Association in cases where the amend-
ments aff ect only the wording. In addition, the AGM resolutions passed on 21 April 2009
(Authorised Capital 2009) and 25 May 2011 (Contingent Capital 2011) authorised the
Supervisory Board to amend the wording of the Articles of Association to refl ect the
respective share issue or the use of authorised capital as well as following the expiry
of the respective authorisation period and/or in the case of non-use of the contingent
capital following the expiry of the periods for exercising warrant or conversion rights, or
conversion obligations. Th e AGM resolution on Contingent Capital 2011 further author-
ises the Supervisory Board to make all other amendments to the Articles of Association
associated with the issue of new shares in cases where the amendments aff ect the word-
ing only. In addition, the AGM resolutions passed on 28 April 2010 (authorisation to
acquire and use treasury shares as well as to acquire treasury shares through derivatives)
authorise the Supervisory Board to amend the wording of the Articles of Association
if the purchased treasury shares are redeemed to refl ect the redemption of shares and
the reduction of share capital. Th e Board of Management is authorised to amend the
information on the number of shares in the Articles of Association if it determines that
the proportion of the other shares in the share capital is increased due to the redemption.
Board of Management authorisation, particularly regarding issue
and buy-back of shares
Th e Board of Management is authorised, subject to the approval of the Super visory
Board, to issue up to 240 million new, no-par value registered shares on or before
20 April 2014 in exchange for cash and/or non-cash contributions and thereby increase
the company’s share capital by up to € 240 million (Authorised Capital 2009, article 5 (2)
of the Articles of Association). To date, the Board of Management has not made use of
such authorisation.
When new shares are issued on the basis of Authorised Capital 2009, the share-
holders are entitled in principle to pre-emptive subscription rights. Such rights may
only be disapplied subject to the requirements specifi ed in article 5 (2) of the Articles of
Association and subject to the consent of the Supervisory Board. Details may be found
in article 5 (2) of the Articles of Association of the company.
Authorised Capital 2009 is a fi nancing and acquisition instrument in accordance
with international standards that allows the company to increase equity quickly, fl exibly
and cost-eff ectively. Th e authorised capital is equivalent to less than 20 % of the share
capital.
An AGM resolution was passed on 25 May 2011 authorising the Board of Manage-
ment, subject to the consent of the Supervisory Board, to issue bonds with warrants,
convertible bonds and/or income bonds as well as profi t participation certifi cates, or a
combination thereof, (hereinaft er referred to collectively as “bonds”) in an aggregate
principal amount of up to € 1 billion, on one or more occasions on or before 24 May 2016,
Deutsche Post DHL Annual Report 201132

thereby granting options or conversion rights for up to 75 million shares having a total
share in the share capital not to exceed € 75 million. Th e bond conditions may also pro-
vide for a conversion obligation at the time of maturity of the bonds or at another time
or may entitle the company or the Group company to grant the bond holders or creditors
shares in the company in lieu of payment of all or part of the sum of money payable. Th e
share capital is contingently increased by up to € 75 million in order to grant shares to
the holders or creditors of the options, conversion rights or conversion obligations aft er
exercise of their rights for the purpose of settling the entitlements related to the options
or rights or fulfi lling the conversion obligations (Contingent Capital 2011, article 5 (3)
of the Articles of Association). When issuing bonds, pre-emptive subscription rights
may only be disapplied subject to the terms of the aforementioned resolution and to the
consent of the Supervisory Board. Further details may be found in the motion adopted
by the AGM under agenda item 6 of the AGM of 25 May 2011.
Authorisation to issue bonds is standard business practice amongst publicly listed
companies. It allows the company to fi nance its activities fl exibly and promptly and
gives it the fi nancial leeway necessary to take advantage of favourable market situations
at short notice, for example by off ering bonds with options, conversion rights or con-
version obligations on shares in the company as a consideration within the context of
company mergers, and when acquiring companies or shareholdings in companies. To
date, the Board of Management has not made use of the authorisation.
Finally, the AGM of 28 April 2010 authorised the company to buy back shares on or
before 27 April 2015 up to an amount not to exceed 10 % of the share capital existing as
at the date of the resolution. Such authorisation is subject to the proviso that at no time
should the shares thus acquired, together with the shares already held by the company,
account for more than 10 % of the share capital. Th e shares may be purchased through
the stock market, a public off er, a public call for off ers of sale from the company’s share-
holders or by some other means in accordance with section 53a of the AktG. Th e author-
isation permits the Board of Management to exercise it for every purpose permissible
under the law, particularly to redeem the purchased treasury shares without a further
AGM resolution, subject to the consent of the Supervisory Board. Details may be found
in the motion adopted by the agm under agenda item 6 of the AGM of 28 April 2010.
To supplement the above authorisation, on 28 April 2010 the AGM also authorised
the Board of Management, within the scope resolved by the AGM of 28 April 2010 in
agenda item 6, to acquire treasury shares through the use of derivatives, namely by ser-
vicing options that, upon their exercise, require the company to acquire treasury shares
(put options), by exercising options that, upon their exercise, grant the company the
right to acquire treasury shares (call options) or by servicing or exercising a combin-
ation of put and call options. All share acquisitions using put options, call options or
a combination of the two are limited to a maximum of 5 % of the share capital existing
on the date of the resolution. Th e term of the options may not exceed 18 months, must
expire by no later than 27 April 2015 and be selected such that treasury shares may not
be acquired by exercising the options aft er 27 April 2015. Details may be found in the
motion adopted by the AGM under agenda item 7 of the agm of 28 April 2010.
It is standard business practice amongst publicly listed companies in Germany for
the AGM to authorise the company to buy back shares. Th e authorisation to repur-
chase shares using derivatives is merely intended to supplement share buyback as a
tool and give the company the opportunity to structure the share repurchase in an
optimum manner.
dp-dhl.com/en/investors.html
dp-dhl.com/en/investors.html
Deutsche Post DHL Annual Report 2011
Group Management ReportBusiness and Environment
Disclosures required by takeover law
33

Any public off er to acquire shares in the company is governed solely by law and
the Articles of Association, including the provisions of the Wertpapiererwerbs- und
Übernahmegesetz (WpÜG – German Securities Acquisition and Takeover Act). Th e AGM
has not authorised the Board of Management to undertake actions within its sphere of
competence to block possible takeover bids.
Signifi cant agreements that are conditional upon a change of control following
a takeover bid and agreements with members of the Board of Management
or employees providing for compensation in the event of a change of control
Deutsche Post AG took out a syndicated credit facility with a volume of € 2 billion
from a consortium of banks. If a takeover occurs, each member of the bank consortium
is entitled under certain conditions to cancel its share of the credit line as well as its share
of outstanding loans and require repayment.
In the event of a change in control, any member of the Board of Management is
entitled to resign his offi ce for good cause within a period of six months following the
change in control, aft er giving three months’ notice as at the end of the month, and to
terminate his Board of Management contract (right to early termination). In the event
of the right to early termination being exercised or a Board of Management contract
being terminated by mutual consent within nine months of the takeover, the Board of
Management member is entitled to payment to compensate the remaining term of his
Board of Management contract. Such payment is limited to the cap pursuant to the rec-
ommendation of section 4.2.3 of the German Corporate Governance Code as amended
on 26 May 2010. Th e agreements are outlined in the remuneration report.
Remuneration of the Board of Management and the Supervisory Board
Th e basic features of the remuneration system for the Board of Management and
the Supervisory Board are described in the Corporate Governance Report under
remuneration report. Th e latter also forms part of the Group Management Report.
Corporate Governance, page 139 f.
Corporate Governance, page 139 f.
Deutsche Post DHL Annual Report 201134

Economic parameters
Global economy continues to grow
Th e global economy continued on its upwards path in 2011, albeit at a slower pace
compared with the prior year. Emerging markets remained the mainstay, although
growth in these countries weakened somewhat over the course of the year. Th e indus-
trial countries, by contrast, suff ered from an economic downturn with growth falling
overall by nearly half, with unusually high discrepancies between regions; whilst some
countries recorded high growth rates, others fell back into recession. Global economic
output in the reporting year increased by 3.8 % (previous year: 5.2 %). However, growth
in global trade slowed considerably, from 12.7 % in 2010 to just under 7 % (IMF: 6.9 %,
OECD: 6.7 %).
a.03 Global economy: growth indicators in 2011
% Gross domestic product (gdp) Exports
Domestic demand
China 9.2 20.3 n / a
Japan – 0.9 0.0 – 0.1
usa 1.7 6.8 1.6
Euro zone 1.6 7.0 0.6
Germany 3.0 8.2 2.1
Data partially estimated, as at 13 February 2012.Sources: Postbank Research, national statistics.
Asian countries again generated the highest economic momentum. Even there, the
upturn lost some speed: growth was 7.9 % compared with the very strong growth of
9.5 % in the prior year.
China’s GDP grew by a robust 9.2 % (previous year: 10.4 %). Exports increased by
20.3 %, down from 31.3 % in the prior year. Since imports were up 24.9 % (previous
year: 38.7 %), the country’s trade surplus decreased noticeably from US$182 billion to
US$155 billion. Th e country, however, remains attractive to foreign investors, who made
direct investments of US$116 billion (previous year: US$106 billion).
Th e Japanese economy suff ered in 2011 from the aft ermath of the devastating earth-
quake in March. Economic output was down sharply in the fi rst half of the year, a decline
that could not be off set by the signifi cant recovery in the second half. Exports, private
consumption and investments were nearly stagnant, whilst imports were up consider-
ably. GDP decreased by 0.9 % (previous year: 4.4 %).
In the United States, the economy picked back up again in the second half of the
year aft er a weak start. Corporate investments trended higher, increasing by around 10 %
(previous year: 15 %). Private consumption grew only marginally again on account of the
weak labour market and moderately rising incomes. Th e economy did not experience
a notable uplift from foreign trade despite the fact that exports continued to increase.
Instead, declining government spending and inventory investment had a substantial
impact on the economic trend. Th e housing market remained a weak spot. GDP only
grew 1.7 % (previous year: 3.0 %).
Deutsche Post DHL Annual Report 2011
Group Management ReportBusiness and Environment
Economic parameters
35

In the euro zone, the moderate 1.6 % increase in GDP (previous year: 1.9 %) was pri-
marily a result of the very good start to the year. As the year progressed, economic output
grew only slightly and may have actually declined in the fourth quarter. Gross fi xed cap-
ital formation and foreign trade provided economic stimulus. By contrast, private house-
holds increased spending only minimally. Th e economy was slowed primarily by the
national debt crisis, which continued to intensify. Th e need to consolidate state budgets
in the countries aff ected continued to rise, with spending cuts and tax increases putting
the brakes on private consumption and corporate investment. Developments varied
greatly again: whilst Germany and Austria recorded high growth rates, the increase in
France was moderate and in Italy weak. Greece and Portugal were in a recession.
German GDP in the reporting year increased by 3.0 % (previous year: 3.7 %), sparked
again by foreign trade. Exports were up by a solid 8 %. However, the primary growth
driver was domestic demand. Corporate and construction spending was up considerably.
Private consumption continued to rise, albeit only moderately. Th e sustained upturn had
a very positive impact on the labour market. Th e average annual number of unemployed
workers in Germany fell by approximately 260,000 to around 2.98 million. Th e country
saw the best unemployment (annual average of 7.1 %) and employment rates (annual
average of over 41 million) since reunifi cation.
Crude oil prices up
At the end of the reporting year, a barrel of Brent Crude was US$107.55 (previous
year: US$94.70). Th e annual average price of oil was around US$111, some 39 % higher
than in the prior year (approximately US$80). Over the course of the year the price of
oil fl uctuated signifi cantly between US$93 and US$127. At the beginning of the year, it
saw a sharp increase based on the robust global economy and the wave of protests in
northern Africa, which also swept Libya, an important oil-producing country. As the
economy cooled, the price decreased again. In addition, the oil supply continued to
increase because the OPEC members exceeded their production quotas.
a.04 Brent Crude spot price and euro / us dollar exchange rate in 2011
€
160 1.65
1.60
140 1.55
1.50
120 1.45
1.40
100 1.35
1.30
80 1.25
1.20
60 1.15January March June September December
Brent Crude spot price per barrel Euro / us dollar exchange rate
Deutsche Post DHL Annual Report 201136

A very volatile euro
Th e European Central Bank (ECB) raised its key interest rate in two phases in April
and July by a total of 0.5 percentage points to 1.5 % in an eff ort to combat rising infl a-
tion. However, the rate was reduced in November and then again in December to 1.0 %,
due to higher economic risks. By contrast, the US Federal Reserve maintained its very
expansive monetary policy, indicating that it intends to keep its key interest rate between
0 % and 0.25 % until well into 2014 as long as unemployment remains high and infl ation
does not increase.
Th e development of both the euro and the US dollar was shaped by the ever- changing
economic outlook and the national debt crisis. Th e strong growth in the euro zone and
the fi rst increase in the ECB’s key interest rate early on caused the euro to rise consider-
ably to its 2011 high of just under US$1.49 in May. Uncertainty regarding the solvency of
some EMU countries, fears of recession and a return to expansive monetary policy at the
ECB led to a strong downwards trend in the second half of the year. Th e euro ended the
year at over US$1.29, a 3.2 % decrease compared with the prior year. Measured against
the pound sterling, the euro posted a 2.5 % loss.
National debt crisis affects bond markets
Th e European national debt crisis caused extremely mixed developments in the
bond markets. Th e yield on German ten-year government bonds declined to a low
of 1.67 % through autumn, rising again by the end of the year to 1.83 % (previous year:
2.96 %). Th e return on ten-year US government bonds decreased even more in 2011 by
1.4 percentage points to 1.88 %. Turbulence involving EMU government bonds put pres-
sure on other segments of the market and, as a result, risk premiums for corporate bonds
increased considerably in the second half of 2011.
International trade continues to grow
International trade continued to grow in the year under review, with trade volumes
(transported quantity in tonnes) increasing by around 6 % worldwide. Trade between
the emerging markets in the Asia Pacifi c region, Latin America and the Middle East
saw above-average growth.
a.05 Trade volumes: compound annual growth rate 2010 to 2011
%
Africa Asia Pacifi c Europe Latin America Middle EastNorth
America ImportsExports
Africa 1.5 11.0 –10.0 0.2 8.3 7.4
Asia Pacifi c 6.2 7.3 4.8 5.5 10.5 2.7
Europe 1.3 7.6 3.4 8.0 11.6 – 0.3
Latin America 1.2 11.4 2.6 6.6 11.3 6.8
Middle East 8.1 10.0 2.4 7.9 8.7 10.6
North America 2.8 8.7 16.5 6.5 8.5 6.1
Source: Copyright © Global Insight (Deutschland) GmbH, 2011. All rights reserved, as at 31 December 2011.
Deutsche Post DHL Annual Report 2011
Group Management ReportBusiness and Environment
Economic parameters
37

a.06 Major trade fl ows: 2011 volumes
million tonnes
Europe
1,847
Africa 45
Middle East
55
Latin America
234
Asia Pacific
3,168
North America
498
Intra-regional More than 300 300 to 100 Less than 100
North America
Exports36
328
143
217
37
761
Imports152
190
86
346
111
885
Latin America
Exports37
506
241
346
46
1,176
Imports30
118
39
217
17
421
Europe
Exports111
226
86
39
110
572
Imports261
844
143
241
185
1,674
Africa
Exports313
261
152
30
28
784
Imports121
111
36
37
69
374
Middle East
Exports69
1,029
185
111
17
1,411
Imports28
225
110
37
46
446
Asia Pacifi c
Exports121
844
190
118
225
1,498
Imports313
226
328
506
1,029
2,402
Africa Asia Pacifi c Europe North America Latin America Middle East
Source: Copyright © Global Insight (Deutschland) GmbH, 2011. All rights reserved, as at 31 December 2011.
Deutsche Post DHL Annual Report 201138

Our markets
Deutsche Post DHL is represented in more than 220 countries and territories. Th e
following table provides an overview of market volumes in key regions. Th e relevant
market parameters and our market shares are detailed in the Divisions chapter.
Factors affecting our business
Our business is materially aff ected by a number of diff erent factors. As part of our
Strategy 2015, we systematically and continuously review these key factors. Beyond
various economic parameters, we have identifi ed four long-term trends that have an
especially large impact on our business:
1 Globalisation: We believe that the logistics industry will continue to outpace the
growth of national economies in the future. Trade fl ows and volume to and from
Asia as well as within Asia will see further sharp increases, as will those in other
emerging regions, such as South America and the Middle East. Our DHL divisions
are in an above-average position in these regions. Hardly any other company in our
industry off ers integrated logistics solutions for all means of transport and in all
parts of the world to the extent that we do.
Page 60 ff.
a.07 Market volumes
Global Europe Americas
Asia Pacifi c, Eastern Europe, Africa and the Middle East
• Cross-border mail market (outbound, 2011): € 6.9 bn 1
• Air freight (2010): 23.1 m tonnes 2
• Ocean freight (2010): 29.3 m teus 3
• Contract logistics (2010): € 147 bn 4
• German mail communi-cation market, business customers (2011): € 4.3 bn 1
• German dialogue marketing market (2011): € 18.5 bn 1
• International express market (2010): € 5.8 bn 5
• Road transport (2010): € 157.9 bn 6
• Domestic mail market usa (2010): € 43.1 bn 7
• International express market (2010): € 5.4 bn 8
• International express market Asia Pacifi c (2010): € 5.4 bn 9
• International express market Eastern Europe, Africa and the Middle East (2010): € 0.5 bn 9
1 Company estimates.2 Data based solely on export freight tonnes. Source: includes content provided by copyright © Global Insight (Deutschland) GmbH, 2011.
All rights reserved, annual reports, press releases and company estimates.3 Twenty-foot equivalent units; estimated part of overall market controlled by forwarders. Source: includes content provided by copyright
© Global Insight (Deutschland) GmbH, 2011. All rights reserved, annual reports, press releases and company estimates.4 Source: Transport Intelligence.5 Includes express product Time Defi nite International. Country base: be, ch, de, es, fr, ie, it, nl, pl, se, uk. Source: Market Intelligence
2011, annual reports, press releases and company estimates.6 Country base: total for 19 European countries, excluding bulk and specialties transport. Source: mrsc mi freight reports 2008 – 2011,
Eurostat 2010.7 Source: usps product revenue, 2011.8 Includes express product Time Defi nite International. Country base: ca, mx, br, us. Source: Market Intelligence 2011, annual reports,
press releases and company estimates.9 Includes express product Time Defi nite International. Country base: au, cn, hk, in, jp, kr, sg, tw as well as ae, ru, tr, za. Source: Market
Intelligence 2011, annual reports, press releases and company estimates.
Deutsche Post DHL Annual Report 2011
Group Management ReportBusiness and Environment
Economic parameters
39

2 Outsourcing: Especially in times of economic uncertainty, companies need to reduce
costs and streamline business processes. Th at is why fi rms are increasingly outsourc-
ing activities that are not part of their core business. Moreover, supply chains are
becoming more complex, international and as a result more prone to disruptions.
Consequently, customers are placing ever more value on stable, integrated solu-
tions that off er a comprehensive range of services and modes of transport, thereby
safeguarding the reliability of supply chains.
3 Digitalisation: Th e internet is changing sustainably the way we exchange goods and
information. We increasingly see electronic communication taking the place of
physical communication. Th is is causing volumes and revenues to decline, espe-
cially in the traditional mail business. We have responded to this by launching
our E-Postbrief product. Th is trend is also causing a boom in online trade, which
presents us with enormous growth potential, especially in our parcel business.
4 Climate change: Environmental awareness is having an impact on the logistics indus-
try as never before. It is not only that our customers are increasingly asking for
climate-neutral products, one of our primary concerns as the world’s leading logistics
company is to do our part to increase CO2 effi ciency. Th at is why we off er our cus-
tomers an extensive range of energy-saving transport options and climate-neutral
products and why we have set ourselves an ambitious climate protection goal.
Legal environment
In view of our leading market position, a large number of our services are subject
to sector-specifi c regulation under the Postgesetz (PostG – German Postal Act). Further
information on this issue and legal risk is contained in the Notes to the consolidated
fi nancial statements.
Group management
ebit after asset charge sees signifi cant increase
Since 2008, Deutsche Post DHL has used EBIT aft er asset charge (EAC) as a key
performance indicator. EAC is calculated by subtracting a cost of capital component, or
asset charge, from EBIT.
By including the cost of capital in our business decisions, we encourage all div-
isions to use resources effi ciently and to organise our operating business to increase
value sustainably whilst generating cash fl ow. In the reporting year, EAC served as a
key performance indicator in addition to EBIT and was also used as a basis on which to
determine management remuneration.
To calculate the asset charge, the net asset base is multiplied by the weighted average
cost of capital (WACC). Th e asset charge calculation is performed each month so that we
can also take fl uctuations in the net asset base into account during the year.
All of our divisions use a standard calculation for the net asset base. Th e key com-
ponents of operating assets are intangible assets, including goodwill, property, plant and
equipment and net working capital. Provisions and operating liabilities are subtracted
from operating assets.
Th e Group’s WACC is defi ned as the weighted average net cost of interest-bearing
liabilities and equity, taking into account company-specifi c risk factors in a beta factor
according to the Capital Asset Pricing Model.
Note 51
a.08 eac calculation
ebit
Asset charge
= Net asset base× Weighted average cost of capital
ebit after asset charge
a.09 Net asset base calculation
Operating assets
• Intangible assets, including goodwill• Property, plant and equipment• Trade receivables, other operating
assets
Operating liabilities
• Operating provisions• Trade payables, other operating
liabilities
Net asset base
Deutsche Post DHL Annual Report 201140

We apply a standard WACC of 8.5 % across the divisions and this also represents a
minimum target for projects and investments within the Group. Th e weighted average
cost of capital is generally adjusted to adhere to the current situation on the fi nancial
markets. However, the goal is not to match every short-term change but to refl ect long-
term trends. WACC is reviewed once annually. As in previous years, we did not change
the WACC in order that our internal resource allocation should not be infl uenced by
short-term fl uctuations in capital market interest rates. A constant WACC also ensures
that EAC is comparable with previous years.
EAC improved substantially in 2011, rising from € 670 million to € 1,229 million. Th e
increase resulted primarily from the improvement in profi tability of our DHL divisions,
whereas the cost of capital went up moderately by 3.6 %.
a.10 ebit after asset charge (eac)
€m 2010adjusted 1
2011 + / – %
ebit 1,835 2,436 32.8
Asset charge –1,165 –1,207 –3.6
eac 670 1,229 83.41 Prior-year fi gures adjusted due to a revision of the calculation base.
Our net asset base increased by € 980 million to € 14,356 million in the reporting
year due, amongst other reasons, to the Group’s increasing investment activity. Advance
payments for cargo aircraft as well as investments in new sorting systems and our
vehicle fl eet increased property, plant and equipment year-on-year by 5.9 %. In addition,
the utilisation of restructuring provisions increased our net asset base. Th e restructuring
provisions had reduced our net asset base as operating liabilities in the prior year. Th e
rise in intangible assets is attributable to currency eff ects, which raised goodwill, and to
the acquisition of Tag Group.
Net working capital was on a par with the prior year despite the fact that revenues
and freight volumes in the DHL divisions increased in the reporting year: the rise in
trade receivables of 6.9 % was more than off set by an increase in trade payables of 8.2 %.
a.11 Net asset base (unconsolidated)
€m 31 Dec. 2010 adjusted1
31 Dec. 2011 + / – %
Intangible assets including goodwill 11,852 12,200 2.9
Property, plant and equipment 6,125 6,488 5.9
Trade receivables 6,011 6,426 6.9
Other operating assets 3,146 3,264 3.8
Operating provisions –3,620 –3,396 6.2
Trade payables – 5,672 – 6,135 – 8.2
Other operating liabilities – 4,466 – 4,491 – 0.6
Net asset base 13,376 14,356 7.31 Prior-year fi gures adjusted due to a revision of the calculation base.
Deutsche Post DHL Annual Report 2011
Group Management ReportBusiness and Environment
Group management
41

DEUTSCHE POST SHARESEuropean national debt crisis affects fi nancial markets
Sentiment in the international equity markets was positive at the beginning of 2011.
Th e EURO STOXX 50, for instance, reached its 2011 high of 3,068 points in February. Th e
devastating earthquake in Japan, however, caused markets to fall, a trend that did not
reverse until companies reported surprisingly positive fi rst quarter fi gures. Th e DAX
peaked at 7,527 points on 2 May. In the second half of the year, the national debt crisis
in the euro zone dominated the equity markets. Th e DAX and EURO STOXX 50 sank to
annual lows of 5,072 and 1,995 points respectively. Equity markets only began to recover
towards the end of the year amidst a persistently volatile environment. Th e DAX ended
the year at 5,898 points, a loss of 14.7 %. Th is was somewhat better than the EURO STOXX
50, which fell 17.5 % year-on-year. Th e Dow Jones Index was up 5.6 %, despite sustained
weakness in the US economy.
a.12 Deutsche Post shares: multi-year review
2005 2006 2007 2008 2009 2010 2011
Year-end closing price € 20.48 22.84 23.51 11.91 13.49 12.70 11.88
High € 21.23 23.75 25.65 24.18 13.79 14.46 13.83
Low € 16.48 18.55 19.95 7.18 6.65 11.18 9.13
Number of shares millions 1,193.9 1,204.0 1 1,208.2 1 1,209.0 1 1,209.0 1,209.0 1,209.0
Market capitalisation as at 31 December €m 24,425 27,461 28,388 14,399 16,309 15,354 14,363
Average trading volume per day shares 3,757,876 5,287,529 6,907,270 7,738,509 5,446,920 5,329,779 4,898,924
Annual performance including dividend % 24.1 14.9 6.9 – 45.5 18.3 –1.4 –1.3
Annual performance excluding dividend % 21.2 11.5 2.9 – 49.3 13.3 – 5.9 – 6.5
Beta factor 2 0.75 0.80 0.68 0.81 0.91 0.95 1.19
Earnings per share3 € 1.99 1.60 1.15 –1.40 0.53 2.10 0.96
Cash fl ow per share 4 € 3.23 3.28 4.27 1.60 – 0.48 1.59 1.96
Price-to-earnings ratio 5 10.3 14.3 20.4 – 8.5 25.5 6.0 12.4
Price-to-cash fl ow ratio 4, 6 6.4 7.0 5.5 7.4 –28.1 8.0 6.1
Dividend €m 836 903 1,087 725 725 786 846 7
Payout ratio % 37.4 47.1 78.6 – 112.6 30.9 72.7 8
Dividend per share € 0.70 0.75 0.90 0.60 0.60 0.65 0.70 7
Dividend yield % 3.4 3.3 3.8 5.0 4.4 5.1 5.9
1 Increase due to exercise of stock options Note 37.2 From 2006: Beta three years; source: Bloomberg.3 Based on consolidated net profi t after deduction of non-controlling interests Note 22.4 Cash fl ow from operating activities.5 Year-end closing price/earnings per share.6 Year-end closing price/cash fl ow per share.7 Proposal.8 Excluding Postbank effects: 57.8 %.
Deutsche Post DHL Annual Report 201142

a.13 Peer group comparison: closing prices
30 Sep.
201130 Dec.
2011 + / – %30 Dec.
201030 Dec.
2011 + / – %
Deutsche Post DHL € 9.63 11.88 23.4 12.70 11.88 – 6.5
PostNL 1 € 3.31 2.46 –25.7 19.21 2.46 – 87.2
FedEx us $ 67.68 83.51 23.4 92.96 83.51 –10.2
ups us $ 63.15 73.19 15.9 72.68 73.19 0.7
Kuehne + Nagel chf 102.80 105.50 2.6 130.00 105.50 –18.81 Previous year’s prices correspond to a different company structure.
Deutsche Post shares lose signifi cantly less than the dax
Our shares started the year 2011 well, reaching a high of € 13.83 on 18 February.
However, the stock price could not escape the downwards trend in the markets despite
the good results for 2010 we reported on 10 March, and only began to reverse course
aft er we reported our fi rst-quarter results on 10 May. Subsequently, it fl uctuated widely
in an uncertain and nervous market, hitting its annual low of € 9.13 on 23 September. It
then performed much better than the DAX and the EURO STOXX 50, a result that was
based in part on the positive trend in our business in the third quarter and our increased
forecast for full-year 2011, and climbed back to close the year at € 11.88 on 30 Decem-
ber 2011, having risen 11.0 % since 9 November 2011 when we published the fi gures for
the fi rst nine months. By comparison, the DAX lost 1.1 % and the EURO STOXX 50 gained
only 0.6 % in this period. Over the year as a whole, our share lost 6.5 % in value, much less
than the DAX and the EURO STOXX 50. Average daily trading volumes of Deutsche Post
shares fell slightly year-on-year to 4.9 million shares (previous year: 5.3 million shares).
a.14 Share price performance
€
16
15
14
13
12
11
10
9
8
7
630 December 2010 31 March 2011 30 June 2011 30 September 2011 30 December 2011
Deutsche Post euro stoxx 50 1 dax 1
1 Rebased to the closing price of Deutsche Post shares on 30 December 2010.
Closing price: € 11.88
Deutsche Post DHL Annual Report 2011
Group Management ReportDeutsche Post Shares
43

Majority of analysts recommend Deutsche Post shares
At the end of 2011, 36 analysts were following Deutsche Post shares. A total of 30
analysts issued a “buy” recommendation on our shares, four more than a year earlier.
Th ree analysts issued a neutral recommendation regarding Deutsche Post shares and
only three recommended selling. Th e average price target decreased slightly at year end
to € 14.66 compared with the prior year (€ 16.35) despite our profi t forecast, which we
raised during the course of the year. Analysts anticipate a weakening macroeconomic
situation and therefore valued the shares lower.
Deutsche Post shares remain popular amongst private investors
Th e number of shares held by private investors rose again compared with the previ-
ous year, increasing from 7.5 % to 10.2 % of all issued shares. KfW Bankengruppe con-
tinued to hold 30.5 % of our shares. Th e free fl oat is 69.5 %. Amongst identifi ed institu-
tional investors, the greatest numbers of issued shares are held in the United Kingdom
(15.0 %), the United States (11.4 %) and Germany (8.2 %). Our 25 largest institutional
investors hold a total of 24.2 % of all issued shares.
Focused investor relations work appreciated
Th e Group having successfully completed all major restructuring eff orts, investors
in 2011 returned their attention to the development of operations and the business
outlook in our divisions. Th is allowed us to take our equity story on the off ensive and
show investors how we are successfully implementing our Strategy 2015.
a.15 Candlestick graph / 30-day moving average
€
14
13
12
11
10
9
8Jan. 2011 Feb. 2011 Mar. 2011 April 2011 May 2011 June 2011 July 2011 Aug. 2011 Sep. 2011 Oct. 2011 Nov. 2011 Dec. 2011
Moving average
The highest price for the weekOpening or closing price
Opening or closing price
The lowest price for the week
Body is black if stock closed lower,body is white if stock closed higher
a.16 Shareholder structure 1
1 As at 31 December 2011.2 On 23 July 2009 KfW issued a convertible
bond on Deutsche Post ag shares (volume: 54.1 million shares). Investors can convert this bond from the first due date for interest until 30 July 2014.
4.5 % KfW convertible bond 2
59.3 % institutional investors
10.2 % private investors
30.5 % KfW Bankengruppe
69.5 % free fl oat
Deutsche Post DHL Annual Report 201144

In the MAIL division, we focused on the solid growth of our parcel business. Th e
Generations Pact agreed upon with the trade unions in October for age-based career solu-
tions in Germany as well as the decision by the German Federal Network Agency on the
future calculation of mail prices also met with a positive response. In our DHL divisions,
investors primarily praised the positive business performance in Asia. Key topics at meet-
ings with investors were the actions we are taking to further expand our market leader-
ship in the region and global trends in volume. Th e market was especially optimistic
about our decision to again raise our full-year outlook in November 2011 despite the fact
that the global economy had weakened overall in the second half of the year.
Once more we conducted a detailed target group analysis using investor targeting
in the reporting year in order to address the specifi c needs of investors in the world’s
most important fi nancial centres. Th e Investor Relations team held a total of 516 separate
meetings with institutional investors in 2011, with members of the Board of Manage-
ment taking part in 107 of those meetings. Th is intense work by our Investor Relations
team was recognised again this year in the renowned Extel Survey conducted by Th om-
son Reuters. We won second place in the transport sector. Our CEO, Dr Frank Appel,
was awarded second place amongst CEO s in our sector and Lawrence Rosen third place
amongst CFO s. In Manager Magazin’s annual ranking, our annual report took fi rst place
amongst DAX companies and was ranked the best annual report overall.
a.17 Shareholder structure by region 1
1 As at 31 December 2011.
11.4 % usa
15.0 % uk
24.7 % Other
48.9 % Germany
Employees, page 84
Deutsche Post DHL Annual Report 2011
Group Management ReportDeutsche Post Shares
45

ECONOMIC POSITION
Overall assessment by the Board of Management
An impressive result achieved
In a time of economic uncertainty, Deutsche Post DHL, as a global logistics com-
pany, achieved an impressive result in fi nancial year 2011. Th anks to our presence in the
world’s growth markets, we were able to increase revenues in all DHL divisions, in some
areas quite considerably. Th e extensive restructuring measures we have implemented in
recent years have substantially improved our profi tability, as refl ected in the noticeable
increase in our margins. Th e MAIL division stabilised revenue, due above all to strong
growth in our parcel business. Given that operating cash fl ows have likewise trended
in a very positive direction and that we continue to benefi t from our good net liquidity
position, the Group’s fi nancial position remains very solid in the opinion of the Board
of Management.
Signifi cant events
Interest in Postbank reclassifi ed
In accordance with the contractual arrangements governing the planned sale
of Postbank to Deutsche Bank, we reclassifi ed our remaining 39.5 % shareholding in
Postbank as held for sale at the end of February 2011. Th e carrying amount of the invest-
ment as at the reclassifi cation date was € 1,801 million.
Earnings
a.18 Selected indicators for results of operations
2010 2011
Revenue €m 51,388 52,829
Profi t from operating activities (ebit) €m 1,835 2,436
Return on sales 1 % 3.6 4.6
Consolidated net profi t for the period 2 €m 2,541 1,163
Earnings per share 3 € 2.10 0.96
Dividend per share € 0.65 0.70 4
1 ebit / revenue.2 After deduction of non-controlling interests, including Postbank.3 Including Postbank.4 Proposal.
Changes in portfolio and reporting
In order to strengthen the focus on our core activities in the Supply Chain business
unit in the United States, we sold Exel Transportation Services Group (ETS), a provider
of freight brokerage and intermodal services in the USA and Canada, on 1 April 2011.
On the same date, we incorporated a specialist provider of internet advertising
services into the MAIL division by acquiring all shares of Adcloud GmbH, Cologne,
Germany.
Deutsche Post DHL Annual Report 201146

Th e acquisition of the 100 % interest in Eurodifarm srl., Lodi, Italy, was completed in
the middle of May 2011. As part of the SUPPLY CHAIN division, the company specialises
in the temperature-controlled distribution of pharmaceutical and diagnostic products.
On 1 June 2011, we acquired all the shares of Standard Forwarding LLC, East Moline,
USA. Th is acquisition expands our freight business capacities in the Freight business unit.
DHL Express Canada sold its domestic business to the transport company Trans-
Force at the end of June and is now focusing on international express services in Canada.
In the middle of July, we acquired Tag EquityCo Limited, Cayman Islands, together
with its subsidiaries. Th e Tag Group is an international provider of marketing execution
and production services. Th e company has been assigned to the Williams Lea business
unit. We expect to achieve synergies and economies of scale through the combined
service off ering.
Due to a change in the legal framework in China, we sold our domestic express
business to the Chinese company Unitop Industry, Shenzhen, in the third quarter.
In the MAIL division, we adjusted our method of reporting revenues and materials
expense in the Williams Lea business unit at the end of 2011. Discounts granted to cus-
tomers are no longer recognised under materials expense but are consistently deducted
from revenues. Th e prior-year fi gures were adjusted.
As at 1 July, we transferred the Home Delivery business in Germany from the SUPPLY
CHAIN division to the MAIL division. Th e signifi cant synergies between this delivery
service and the German parcel business will allow us to cultivate the market in this
sector more intensively.
Consolidated revenue up 2.8 %
In fi nancial year 2011, consolidated revenue rose € 1,441 million or 2.8 % year-on-
year to € 52,829 million. Th e share of consolidated revenue generated abroad increased
from 68.0 % to 68.3 % despite negative currency eff ects of € 642 million. Th e changes in
the portfolio reduced revenue by € 627 million. Without these eff ects, revenue would
have increased by 5.3 %.
In the fourth quarter, revenue rose 2.1 % to € 14,126 million (previous year:
€ 13,835 million). It was impacted by negative currency eff ects of € 42 million and port-
folio changes amounting to € 152 million.
Other operating income declined by 7.5 %, from € 2,217 million to € 2,050 million in
the year under review. Th e higher fi gure last year was largely attributable to the reversal
of provisions recognised for restructuring.
a.19 Consolidated revenue
€ m
2011
52,829
16,743 36,086
2010
51,388
16,434 34,954
Germany Abroad
Deutsche Post DHL Annual Report 2011
Group Management ReportEconomic Position
Earnings
47
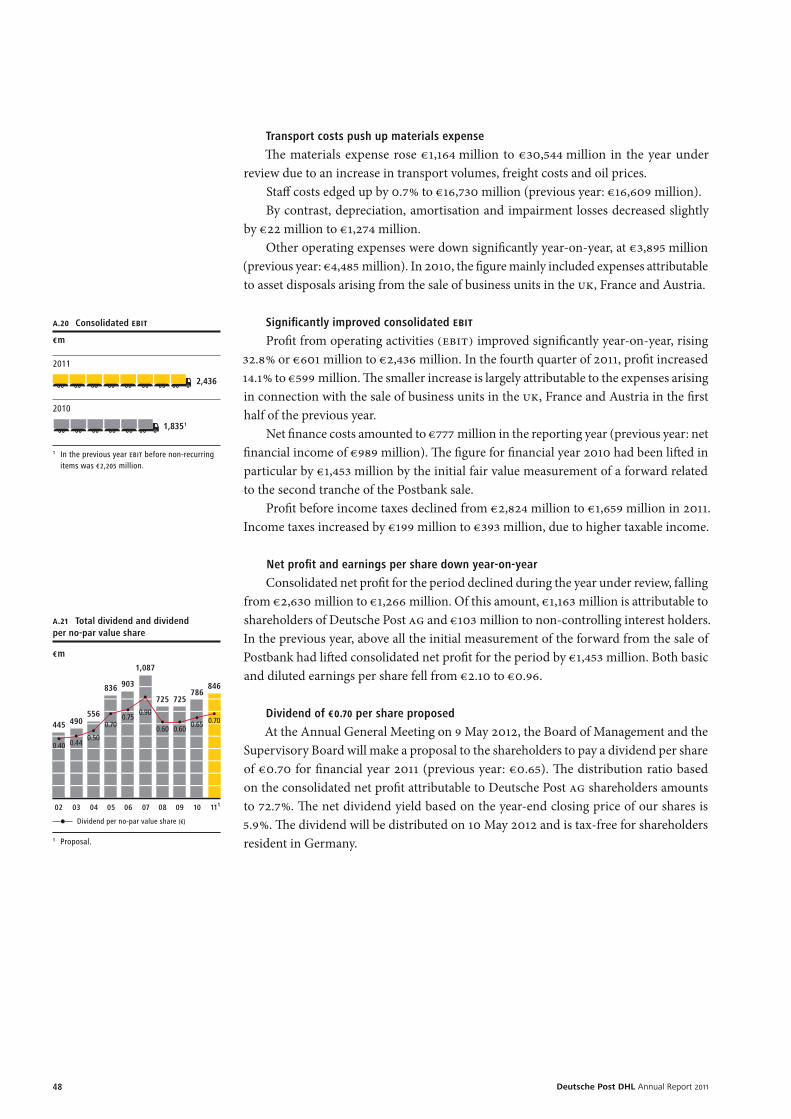
Transport costs push up materials expense
Th e materials expense rose € 1,164 million to € 30,544 million in the year under
review due to an increase in transport volumes, freight costs and oil prices.
Staff costs edged up by 0.7 % to € 16,730 million (previous year: € 16,609 million).
By contrast, depreciation, amortisation and impairment losses decreased slightly
by € 22 million to € 1,274 million.
Other operating expenses were down signifi cantly year-on-year, at € 3,895 million
(previous year: € 4,485 million). In 2010, the fi gure mainly included expenses attribut able
to asset disposals arising from the sale of business units in the UK, France and Austria.
Signifi cantly improved consolidated ebit
Profi t from operating activities (EBIT) improved signifi cantly year-on-year, rising
32.8 % or € 601 million to € 2,436 million. In the fourth quarter of 2011, profi t increased
14.1 % to € 599 million. Th e smaller increase is largely attributable to the expenses arising
in connection with the sale of business units in the UK, France and Austria in the fi rst
half of the previous year.
Net fi nance costs amounted to € 777 million in the reporting year (previous year: net
fi nancial income of € 989 million). Th e fi gure for fi nancial year 2010 had been lift ed in
particular by € 1,453 million by the initial fair value measurement of a forward related
to the second tranche of the Postbank sale.
Profi t before income taxes declined from € 2,824 million to € 1,659 million in 2011.
Income taxes increased by € 199 million to € 393 million, due to higher taxable income.
Net profi t and earnings per share down year-on-year
Consolidated net profi t for the period declined during the year under review, falling
from € 2,630 million to € 1,266 million. Of this amount, € 1,163 million is attributable to
shareholders of Deutsche Post AG and € 103 million to non-controlling interest holders.
In the previous year, above all the initial measurement of the forward from the sale of
Postbank had lift ed consolidated net profi t for the period by € 1,453 million. Both basic
and diluted earnings per share fell from € 2.10 to € 0.96.
Dividend of € 0.70 per share proposed
At the Annual General Meeting on 9 May 2012, the Board of Management and the
Supervisory Board will make a proposal to the shareholders to pay a dividend per share
of € 0.70 for fi nancial year 2011 (previous year: € 0.65). Th e distribution ratio based
on the consolidated net profi t attributable to Deutsche Post AG shareholders amounts
to 72.7 %. Th e net dividend yield based on the year-end closing price of our shares is
5.9 %. Th e dividend will be distributed on 10 May 2012 and is tax-free for shareholders
resident in Germany.
a.20 Consolidated ebit
€ m
2011
2,436
2010
1,835 1
1 In the previous year ebit before non-recurring items was € 2,205 million.
a.21 Total dividend and dividend per no-par value share
€ m
02 03 04 05 06 07 08 09 10 11 1
Dividend per no-par value share (€)
1 Proposal.
846
1,087
725 725786
0.60 0.600.65
0.900.75
0.70
0.500.440.40
903836
556490445 0.70
Deutsche Post DHL Annual Report 201148

Financial position
Financial management is a centralised function in the Group
Th e Group’s fi nancial management activities include managing cash and liquidity,
hedging interest rate, currency and commodity price risk, ensuring Group fi nancing,
issuing guarantees and letters of comfort and liaising with rating agencies. We manage
processes centrally, allowing us to work effi ciently and successfully manage risk.
Responsibility for these activities rests with Corporate Finance at Group head-
quarters in Bonn, which is supported by three Regional Treasury Centres in Bonn
(Germany), Fort Lauderdale (USA) and Singapore. Th ese act as interfaces between head-
quarters and the operating companies, advise the companies on all fi nancial manage-
ment issues and ensure compliance with Group-wide requirements.
Corporate Finance’s main task is to minimise fi nancial risk and the cost of capital,
whilst preserving the Group’s lasting fi nancial stability and fl exibility. In order to main-
tain its unrestricted access to the capital markets, the Group continues to aim for a credit
rating appropriate to the sector. We therefore monitor particularly closely the ratio of
our operating cash fl ows to our adjusted debt. Adjusted debt refers to the Group’s net
debt, allowing for unfunded pension obligations and liabilities under operating leases.
Maintaining fi nancial fl exibility and low cost of capital
Th e Group’s fi nance strategy builds on the principles and aims of fi nancial manage-
ment. In addition to the interests of shareholders, the strategy also takes lender require-
ments into account. Th e goal is for the Group to maintain its fi nancial fl exibility and low
cost of capital by ensuring a high degree of continuity and predictability for investors.
A key component of this strategy is a target rating of “BBB+”, which is managed via
a dynamic performance metric known as funds from operations to debt (FFO to debt),
calculated on a rolling 12-month basis. Our strategy additionally includes a sustained
dividend policy and clear priorities regarding the use of excess liquidity, which will
initially be used for investing in the operating business and to fund a portion of our
pension liabilities. Once this has been achieved, we would aim to improve our rating
to “A–” before using liquidity for additional dividend payments or share repurchases.
Deutsche Post DHL Annual Report 2011
Group Management ReportEconomic PositionFinancial position
49

Funds from operations (FFO) represents operating cash fl ows before changes in
working capital plus interest and dividends received less interest paid and adjusted for
operating leases, pensions and non-recurring income or expenses, as shown in the fol-
lowing calculation. In addition to fi nancial liabilities and available cash and cash equiva-
lents, the fi gure for debt also includes operating lease liabilities as well as unfunded
pension liabilities.
a.23 ffo to debt
€m
2010 2011
Operating cash fl ow before changes in working capital 2,109 2,234
Interest and dividends received 59 72
Interest paid 183 163
Adjustment for operating leases 1,055 1,104
Adjustment for pensions 198 153
Non-recurring income / expenses 531 208
Funds from operations (ffo) 3,769 3,608
Reported fi nancial liabilities 7,022 7,010
Financial liabilities related to the sale of Deutsche Postbank ag 4,164 4,344
Financial liabilities at fair value through profi t or loss 115 137
Adjustment for operating leases 5,527 5,295
Adjustment for pensions 5,323 5,639
Surplus cash and near-cash investments 1 2,893 2,286
Debt 10,700 11,177
ffo to debt (%) 35.2 32.31 Surplus cash and near-cash investments are defi ned as cash and cash equivalents and investment funds callable at sight,
less cash needed for operations.
a.22 Finance strategy
Credit rating
• Maintain “bbb +” and “Baa1” ratings, respectively.• ffo to debt introduced as dynamic performance metric.
Dividend policy
• Pay out 40 % – 60 % of net profi t.• Consider cash fl ows and continuity.
Excess liquidity
1. Invest in the operating business.2. Increase plan assets for German pension plans.3. Aim for credit ratings of “a –” and “a 3”, respectively.4. Pay out special dividend or execute share buy-back
programme.
Debt portfolio
• Syndicated credit facility taken out as liquidity reserve.• Bonds could be issued to cover long-term capital
requirement.
Investors
• Reliable and consistent information from the company.
• Predictability of expected returns.
Group
• Preserve fi nancial and strategic fl exibility.• Assure low cost of capital (wacc) 1.
1 Weighted average cost of capital Group management, page 40.
Deutsche Post DHL Annual Report 201150

FFO to debt declined versus the prior year, primarily due to the decrease in our
liquidity as a result of higher capital expenditure. Funds from operations also decreased
slightly in the reporting year.
Cash and liquidity managed centrally
Th e cash and liquidity of our globally active subsidiaries is managed centrally by
Corporate Treasury. More than 80 % of the Group’s external revenue is consolidated in
cash pools and used to balance internal liquidity needs. In countries where this prac-
tice is ruled out for legal reasons, internal and external borrowing and investment are
arranged centrally by Corporate Treasury. In this context, we observe a balanced bank-
ing policy in order to remain independent of individual banks. Our subsidiaries’ intra-
group revenue is also pooled and managed by our in-house bank in order to avoid
external bank charges and margins through intercompany clearing. Payment transac-
tions are executed in accordance with uniform guidelines using standardised processes
and IT systems.
Limiting market risk
Th e Group uses both primary and derivative fi nancial instruments to limit market
risk. Interest rate risk is managed exclusively via swaps. Currency risk is additionally
hedged using forward transactions, cross-currency swaps and options. We pass on
most of the risk arising from commodity fl uctuations to our customers and manage
the remaining risk by means of commodity swaps. Th e parameters, responsibilities and
controls governing the use of derivatives are laid down in internal guidelines.
Flexible and stable fi nancing
Th e Group covers its long-term fi nancing requirements by maintaining a balanced
ratio of equity to liabilities. Th is ensures our fi nancial stability as well as providing
adequate fl exibility. Our most important source of funds is net cash from operating
activities.
Since our liquidity remains good, the fi ve-year syndicated credit facility issued in
December 2010 at a total volume of € 2 billion was not drawn down during the year
under review. Th is syndicated credit facility guarantees us favourable market condi-
tions and acts as a secure, long-term liquidity reserve. It does not contain any covenants
concerning the Group’s fi nancial indicators.
As part of our banking policy, we spread our business volume widely and maintain
long-term relationships with the fi nancial institutions we entrust with our business. In
addition to credit lines, we meet our borrowing requirements through other independ-
ent sources of fi nancing, including bonds, structured fi nance products and operating
leases. Most debt is taken out centrally in order to leverage economies of scale and
specialisation benefi ts and hence to minimise the cost of capital.
In view of the fact that the bond issued by Deutsche Post Finance B.V. in the amount
of € 0.7 billion will fall due in October 2012, as well as of the European Commission’s
state aid ruling, the Board of Management has decided to establish a Debt Issuance
Programme in the amount of € 3 billion. Th is off ers us the possibility of issuing bonds
in customised tranches up to a stipulated total amount and enables us to react fl exibly
to changing market conditions.
Note 48
Note 51
Deutsche Post DHL Annual Report 2011
Group Management ReportEconomic PositionFinancial position
51

Group issues guarantees and letters of comfort
Deutsche Post AG provides security for the loan agreements, leases and supplier
contracts entered into by Group companies, associates or joint ventures by issuing letters
of comfort, sureties or guarantees as needed. Th is practice allows better conditions to
be negotiated locally. Th e sureties are provided and monitored centrally.
Creditworthiness of the Group remains adequate
Credit ratings represent an independent and current assessment of a company’s
credit standing. Th e ratings are based on a quantitative analysis and measurement of
the annual report and appropriate planning data. Qualitative factors, such as industry-
specifi c features and the company’s market position and range of products and services,
are also taken into account.
Th e creditworthiness of our Group is reviewed on an ongoing basis by rating
agencies Standard & Poor’s and Moody’s Investors Service. In the second half of 2011, both
agencies confi rmed their ratings of “BBB+” and “Baa1”, respectively. Th is means that
the capacity of the Group to meet its fi nancial obligations continues to be classifi ed as
adequate. Deutsche Post DHL is well positioned in the transport and logistics sector
with these ratings. Th e following table shows the ratings as at the reporting date and the
underlying factors. Th e complete and current analyses by the rating agencies and the
rating categories can be found on our website. Th e eff ects of the EU state aid ruling are
described in the outlook section of the Annual Report.
standardandpoors.com,moodys.com
dp-dhl.com/en/investors.html
Note 51
a.24 Agency ratings
Rating factors Rating factors
Standard & Poor’s
Long-term: bbb + 1
Short-term: a-2 1
Outlook: stable 1
• Global network, with leading market positions in international European and Asian express delivery services.
• Dominant position in the German mail market.
• Largest global integrated logistics provider.
• Strong diversifi cation and good scale benefi t.
• Structural volume decline in the mail business and margin dilution from the lower-margin logistics business.
• Regulatory risk evidenced by recent legislation where Deutsche Post lost its value-added-tax exemption for business customers.
• Signifi cant exposure to the cyclical, highly fragmented and fairly low-margin integrated logistics markets.
Moody’s Investors Service
Long-term: Baa1Short-term: p-2Outlook: stable
• Scale and global presence as one of the largest logistics companies in the world.
• Large and relatively robust mail business.
• Success in restoring profi tability at the logistics activities while reducing the negative impact of a change in vat treatment at the mail division.
• Improved liquidity profi le thanks to syndicated credit facility and conservative financial profile of the Group.
• Improving operating performances and key credit metrics.
• Exposure to mature mail business and overall macroeconomic trends.
• Increased liberalization of the German mail market.
1 Credit watch negative.
Deutsche Post DHL Annual Report 201152

Liquidity and sources of funds
As at the balance sheet date, the Group had cash and cash equivalents of € 3.1 bil-
lion (previous year: € 3.4 billion) at its disposal. A large portion of this is accounted for
by Deutsche Post AG. Most of the cash is invested centrally on the money market and
these short-term money market investments had a volume of € 1.8 billion at the balance
sheet date.
Th e fi nancial liabilities reported in our balance sheet break down as follows:
a.25 Financial liabilities
€m
2010 2011
Bonds 1,682 1,659
Due to banks 359 163
Finance lease liabilities 210 175
Liabilities to Group companies 137 102
Liabilities at fair value though profi t or loss 115 137
Other 4,519 4,774
7,022 7,010
Th e largest single items are the two listed bonds issued by Deutsche Post Finance B.V.
as well as the project fi nance received from the European Investment Bank for mail
sorting centres in Germany and an IT centre in the Czech Republic.
Other fi nancial liabilities mainly comprise the transaction with Deutsche Postbank
AG shares in the form of a mandatory exchangeable bond, cash collateral and a hedging
liability. Further information on recognised financial liabilities is contained in the Notes.
Operating leases remain an important source of funding for the Group. We mainly
use operating leases to fi nance real estate but also aircraft , vehicle fl eets and IT equip-
ment.
a.26 Operating lease liabilities by asset class
€m
2010 2011
Land and buildings 5,554 5,294
Technical equipment and machinery 115 80
Other equipment, operating and offi ce equipment, transport equipment, miscellaneous 471 486
Aircraft 951 765
7,091 6,625
Operating lease obligations decreased signifi cantly year-on-year to € 6.6 billion
because the reduction in the remaining terms of legacy agreements, especially for real
estate and aircraft , is not matched by the same volume of new leases.
Note 44
Note 50
Deutsche Post DHL Annual Report 2011
Group Management ReportEconomic PositionFinancial position
53

Capital expenditure rises in line with expectations
Th e Group’s aggregate capital expenditure (capex) amounted to € 1,716 million at
the end of 2011 (previous year: € 1,262 million), up 36 %.
Funds were used mainly to replace and increase assets as follows: € 1,430 million was
invested in property, plant and equipment and € 286 million in intangible assets exclud-
ing goodwill. Investments in property, plant and equipment were mainly attributable to
advance payments and assets under development (€ 637 million). Of this amount, 45 %
was allotted to Express Aviation. Th e remaining investments in property, plant and
equipment were distributed as follows: transport equipment (€ 277 million), technical
equipment and machinery (€ 238 million), IT equipment (€ 95 million) and other operat-
ing and offi ce equipment (€ 87 million).
Our investments continued to focus strongly on Europe, the Americas and Asia.
Within Europe, investments were centred on Germany and the UK, whereas in the
Americas, key focus was on the United States, Mexico, Canada and Brazil. In Asia Pacifi c
investments centred on China, India, Australia and Singapore.
mail invests in technology and quality leadership
Capital expenditure in the MAIL division fell in the reporting year from € 446 mil-
lion to € 433 million. Investments related in particular to technical equipment and ma-
chinery (€ 138 million), internally generated soft ware (€ 90 million) and other operating
and offi ce equipment (€ 62 million). We continue to invest in our technology and quality
leadership in the mail market: the fl at sorters purchased have a higher throughput and
CO2 effi ciency to further improve delivery. We are also testing carbon-neutral delivery
and taking measures intended to ease the work load of our employees, for example
a.27 Capex by region
€m
Germany
1,057
733
Americas
203
210
Europe (excluding Germany)
248
174
Asia Pacifi c
152
94
Other regions
56
51
2011 2010
a.28 Capex and depreciation, amortisation and impairment losses, full year
mail expressglobal forwarding,
freight supply chainCorporate Center /
Other Group
2010
adjusted2011 2010 2011 2010 2011 2010
adjusted2011 2010 2011 2010 2011
Capex (€m) 446 433 286 602 102 135 214 252 214 294 1,262 1,716
Depreciation, amortisation and impairment losses (€m) 332 354 373 337 98 101 289 287 204 195 1,296 1,274
Ratio of capex to depreciation, amortisation and impairment losses 1.34 1.22 0.77 1.79 1.04 1.34 0.74 0.88 1.05 1.51 0.97 1.35
a.29 Capex and depreciation, amortisation and impairment losses, q4
mail expressglobal forwarding,
freight supply chainCorporate Center /
Other Group
2010
adjusted2011 2010 2011 2010 2011 2010
adjusted2011 2010 2011 2010 2011
Capex (€m) 146 200 134 245 34 61 81 73 104 96 499 675
Depreciation, amortisation and impairment losses (€m) 103 119 87 88 25 26 74 78 48 49 337 360
Ratio of capex to depreciation, amortisation and impairment losses 1.42 1.68 1.54 2.78 1.36 2.35 1.09 0.94 2.17 1.96 1.48 1.88
Deutsche Post DHL Annual Report 201154

by buying e-bikes, work clothing and new operating equipment. We have expanded
electronic platforms such as the E-Postbrief and our DieRedaktion.de journalists’ por-
tal. To consolidate and expand our market leadership in Germany, we made major in-
vestments in our parcel business during 2011. One focus was our Production Concept
2012, which is aimed at establishing fl exible IT structures and systems and adjusting
production capacities to increasing shipment volumes. To meet customer demand,
we expanded our network of Packstations. We continued to extend our MeinPaket.de
shopping portal for small and medium-sized e-commerce retailers to strengthen this
customer group’s ties with our company. We also restructured and improved the retail
outlet network of Deutsche Post AG.
express strengthens infrastructure
In the EXPRESS division, capital expenditure rose by 110 % to € 602 million (previ-
ous year: € 286 million). During 2010 investments had been scaled back in the light of
the global economic crisis. In the reporting year the investing activity was resumed to
meet our regular investment requirements and actually increased in line with our strong
growth. Capital expenditure in property, plant and equipment related mainly to advance
payments and assets under development (€ 429 million), technical equipment and
machinery (€ 50 million), aircraft (€ 36 million), IT (€ 21 million) and transport equip-
ment (€ 20 million). Investments in intangible assets related to soft ware (€ 7 million),
as well as to advance payments and intangible assets under development (€ 3 million).
Th e advance payments and investments were primarily made to purchase new air-
craft and carry out regulatory maintenance of the existing fl eet. Th e ground network
infrastructure has been strengthened throughout the regions. In the Asia Pacifi c region,
we are currently investing in our new North Asia Hub in Shanghai. We have also bol-
stered our presence in the growth markets of India and China. In the Americas region,
we focused investment on Mexico, Canada and our hub in Cincinnati (USA). In Europe,
we modernised our Leipzig hub as well as terminals in Italy, the UK, Austria and Sweden.
global forwarding, freight expands it solutions
In the GLOBAL FORWARDING, FREIGHT division, a total of € 135 million was invested
in the year under review (previous year: € 102 million). Of this fi gure, € 100 million was
attributable to the Global Forwarding business unit, where we continued to improve
IT solutions for our global applications. Additionally, we fi tted out and modernised our
warehouses, especially in the Asia Pacifi c and Europe regions.
Funds of € 35 million were invested in the Freight business unit, where they were
used primarily for property, plant and equipment and transport equipment in the UK
and Germany.
Deutsche Post DHL Annual Report 2011
Group Management ReportEconomic PositionFinancial position
55

supply chain invests in growth
In the SUPPLY CHAIN division, capex rose by 18 % compared with the prior year to
€ 252 million (previous year: € 214 million). Of that amount, € 223 million related to the
Supply Chain business unit, € 26 million to the Williams Lea business and € 3 million
to central entities. Approximately 60 % of the funds were used to support new business.
Th e Americas region focused on new business investments, primarily in the Consumer,
Retail, Life Sciences & Healthcare sectors and in Latin America in the Automotive sec-
tor. In the UK, there has been continued investment within the Retail and Consumer
sectors to expand the warehousing and transport solutions for new and existing cus-
tomers, along with major investments in the Life Sciences & Healthcare sector to assist
with start-ups and ongoing transport operations. Capital expenditure was signifi cantly
lower in other parts of Europe, where most funds were expended for replacement and
renewal investments. In our Williams Lea business unit we concentrated primarily on
marketing solutions and IT development.
Cross-divisional investments increase
Cross-divisional capital expenditure rose from € 214 million in 2010 to € 294 million
in 2011. Capital expenditure for the purchase of vehicles had been considerably reduced
in previous years, resulting in a signifi cantly higher demand for new vehicles in the
reporting year. IT investments increased as well, essentially due to licence purchases.
Increase in net cash from operating activities
Net cash from operating activities rose € 444 million in 2011 to € 2,371 million. Th is
was largely attributable to the improved EBIT and the cash infl ow from changes in work-
ing capital. Gains from disposals of non-current assets in the amount of € 54 million
(previous year: losses of € 279 million) have been adjusted in the net loss from disposal
of non-current assets line item. Th e resulting cash fl ow is presented in net cash used in
investing activities. Th e cash infl ow before changes in working capital also increased, up
from € 2,109 million to € 2,234 million. Th e cash infl ow of € 137 million from changes
in working capital is mainly due to the smaller increase in receivables and other assets
than in the previous year. In 2010, changes in working capital resulted in a cash outfl ow
of € 182 million.
a.31 Selected cash fl ow indicators
€m
2010 2011
Cash and cash equivalents as at 31 December 3,415 3,123
Change in cash and cash equivalents 284 –305
Net cash from operating activities 1,927 2,371
Net cash from / used in investing activities 8 –1,129
Net cash used in fi nancing activities –1,651 –1,547
a.30 Operating cash fl ow by division, 2011
€m
924
express
1,146
global forwarding, freight
657
supply chain
394
Deutsche Post DHL Annual Report 201156

Net cash used in investing activities amounted to € 1,129 million. Investments in
property, plant and equipment (€ 1,716 million) were the most signifi cant item in this
area. Th ese were used mainly to expand our European and Asian infrastructures and
modernise our IT, and for investments in the aircraft fl eet. Disposals of non-current
assets resulted in a net cash infl ow of € 285 million, compared with a net cash outfl ow
of € 12 million in the previous year, which was due in part to the sale of the day- defi nite
domestic express business in France and the UK. Th e proceeds from the sale of subsidiar-
ies and other business units amounting to € 58 million in the reporting year were mainly
attributable to the sale of Exel Transportation Service and of DHL Express Canada’s
domestic express business. € 84 million was used to acquire subsidiaries and other busi-
ness units, mainly for the purchase of Tag, Eurodifarm and Standard Forwarding. In the
previous year, net cash from investing activities amounted to € 8 million, mainly due to
the sale of money market funds in the amount of € 1,200 million. During the year under
review, we sold money market funds in the amount of € 403 million.
In the past, free cash fl ow was characterised by substantial changes in fi nancial
assets. In order to improve the informative value of free cash fl ow from an operat-
ing perspective, we have changed the way we report this indicator, as shown in the
following table.
a.32 Calculation of free cash fl ow
€m
2010 2011 Q4 2010 Q4 2011
Net cash from operating activities 1,927 2,371 1,025 1,262
Sale of property, plant and equipment and intangible assets 198 211 72 17
Acquisition of property, plant and equipment and intangible assets –1,174 –1,716 – 425 – 646
Cash outfl ow arising from change in property, plant and equipment and intangible assets – 976 –1,505 –353 – 629
Disposal of subsidiaries and other business units –265 58 3 –1
Acquisition of subsidiaries and other business units –74 – 84 0 –14
Cash outfl ow arising from acquisitions / divestments –339 –26 3 –15
Interest received 55 72 19 17
Interest paid –183 –163 – 47 –27
Net interest paid –128 – 91 –28 –10
Free cash fl ow 484 749 647 608
Free cash fl ow increased from € 484 million in the previous year to € 749 million. In
the fourth quarter of 2011, free cash fl ow changed from € 647 million in the previous
year to € 608 million.
Net cash used in fi nancing activities declined by € 104 million year-on-year to
€ 1,547 million. Th e largest item in this area was the dividend payment to our share-
holders, which increased by € 61 million to € 786 million. In addition, the change in
fi nancial liabilities resulted in a € 224 million decline in the cash outfl ow year-on-year, to
€ 417 million due in part to the early repayment of a municipal bond in the previous year.
Cash and cash equivalents fell from € 3,415 million as at 31 December 2010 to
€ 3,123 million due to the changes in the cash fl ows from the individual activities.
Deutsche Post DHL Annual Report 2011
Group Management ReportEconomic PositionFinancial position
57

Assets and liabilities
a.33 Selected indicators for net assets
2010 2011
Equity ratio % 28.3 29.2
Net liquidity (–)/net debt (+) €m –1,382 – 938
Net interest cover 14.3 26.8
ffo to debt 1 % 35.2 32.31 Calculation Financial position, page 50.
Consolidated total assets increase
Th e Group’s total assets amounted to € 38,408 million as at 31 December 2011,
€ 645 million higher than at 31 December 2010.
Since the planned sale of Postbank is expected to take place in less than 12 months,
it was necessary to reclassify all of the associated non-current assets and liabilities to the
relevant current balance sheet items. In addition, the carrying amount of the investment
in Postbank was reclassifi ed as held for sale.
Th ese reclassifi cations were the main reason why non-current assets declined by
€ 3,268 million to € 21,225 million: investments in associates and non-current fi nancial
assets decreased by € 1,797 million and € 2,509 million respectively. Intangible assets rose
by € 348 million to € 12,196 million, largely because the acquisition of Tag, Eurodifarm
and Standard Forwarding and currency translation diff erences increased goodwill. At
€ 6,493 million, property, plant and equipment also exceeded the previous year’s level
(€ 6,130 million). A large proportion of this is attributable to investments in infrastruc-
ture. Deferred tax assets increased by € 180 million to € 1,153 million year-on-year.
At € 17,183 million, current assets were € 3,913 million higher than at 31 Decem-
ber 2010. Current fi nancial assets rose from € 655 million to € 2,498 million, largely as
a result of the above-mentioned reclassifi cations in connection with the sale of Postbank.
Th e positive business performance also had an impact on receivables and other current
assets, which increased from € 8,641 million to € 9,089 million. By contrast, cash and
cash equivalents declined from € 3,415 million to € 3,123 million. Assets held for sale
increased from € 113 million to € 1,961 million as at the reporting date, mainly because
the remaining equity interest in Postbank was reclassifi ed.
At € 11,009 million, equity attributable to Deutsche Post shareholders was € 498 mil-
lion or 4.7 % higher than at 31 December 2010. Whilst consolidated net profi t for the
period and positive currency eff ects increased equity, it was reduced by the dividend
payment to our shareholders.
Deutsche Post DHL Annual Report 201158

Current and non-current liabilities increased by € 561 million from € 17,640 million
to € 18,201 million, primarily because trade payables rose by € 461 million to € 6,168 mil-
lion. At € 4,106 million, other current liabilities were slightly higher than the prior-year
fi gure (€ 4,047 million). At € 7,010 million, fi nancial liabilities remained practically un-
changed from their level as at 31 December 2010 (€ 7,022 million). However, there was
a fundamental change in the maturity structure: the liabilities relating to the planned
Postbank sale were reclassifi ed from non-current fi nancial liabilities to current fi nancial
liabilities, in line with the methodology applied to the related assets. Current and non-
current provisions were reduced from € 9,427 million to € 9,008 million, mainly due to
the utilisation of restructuring provisions.
Balance sheet indicators remain positive
Our net liquidity declined from € 1,382 million as at 31 December 2010 to € 938 mil-
lion as at 31 December 2011, in part because cash paid to acquire property, plant and
equipment and intangible assets increased substantially to € 1,716 million (previous year:
€ 1,174 million). Th e equity ratio improved by 0.9 percentage points to 29.2 %. Net inter-
est cover shows the extent to which net interest obligations are covered by EBIT. Th is
indicator increased from 14.3 to 26.8. As we have net liquidity, the informative value of
net gearing is limited. We therefore do not present or comment on it here.
a.34 Net liquidity (–) / net debt (+)
€m
2010 2011
Non-current fi nancial liabilities 6,275 1,346
Current fi nancial liabilities 747 5,588
Financial liabilities 7,022 6,934
Cash and cash equivalents 3,415 3,123
Current fi nancial assets 655 2,498
Long-term deposits 1 120 56
Positive fair value of non-current fi nancial derivatives 1 2,531 94
Financial assets 6,721 5,771
Financial liabilities to Williams Lea minority shareholders 28 36
Mandatory exchangeable bond 2 2,796 2,926
Collateral for the put option 2 1,248 1,298
Net effect from measurement of Postbank derivatives 3 2,389 2,159
Non-cash adjustments 1,683 2,101
Net liquidity (–) / net debt (+) −1,382 −9381 Reported in non-current fi nancial assets in the balance sheet.2 Reported in non-current or current fi nancial liabilities in the balance sheet.3 Reported in non-current or current fi nancial assets and liabilities in the balance sheet.
Deutsche Post DHL Annual Report 2011
Group Management ReportEconomic Position
Assets and liabilities
59

DIVISIONS
Overview
a.35 Key fi gures by operating division
€m 2010 adjusted
2011 +/– % Q4 2010 adjusted
Q4 2011 +/– %
Revenue 13,913 13,973 0.4 3,825 3,853 0.7
of which Mail Communication 5,597 5,430 –3.0 1,487 1,458 –2.0
Dialogue Marketing 2,595 2,605 0.4 713 690 –3.2
Press Services 797 782 –1.9 209 201 –3.8
Value-Added Service 229 238 3.9 59 66 11.9
Parcel Germany 2,927 3,179 8.6 888 972 9.5
Retail Outlets 800 822 2.8 217 226 4.1
Global Mail 1,735 1,693 –2.4 480 467 –2.7
Pension Service 102 100 –2.0 24 23 – 4.2
Consolidation / Other – 869 – 876 – 0.8 –252 –250 0.8
Profi t from operating activities (ebit) 1,120 2 1,107 –1.2 224 3 246 9.8
Return on sales (%) 1 8.1 7.9 – 5.9 6.4 –
Operating cash fl ow 1,042 924 −11.3 544 487 −10.5
express
Revenue 11,111 11,766 5.9 2,904 3,122 7.5
of which Europe 4,960 5,009 1.0 1,270 1,318 3.8
Americas 1,831 1,887 3.1 478 489 2.3
Asia Pacifi c 3,374 3,718 10.2 897 996 11.0
eemea (Eastern Europe, the Middle East and Africa) 1,216 1,284 5.6 326 351 7.7
Consolidation / Other –270 –132 51.1 – 67 –32 52.2
Profi t from operating activities (ebit) 497 4 927 86.5 218 5 248 13.8
Return on sales (%) 1 4.5 7.9 – 7.5 7.9 –
Operating cash fl ow 904 1,146 26.8 251 454 80.9
global forwarding, freight
Revenue 14,341 15,044 4.9 3,898 3,936 1.0
of which Global Forwarding 10,725 11,094 3.4 2,914 2,907 – 0.2
Freight 3,735 4,088 9.5 1,018 1,064 4.5
Consolidation / Other –119 –138 –16.0 –34 –35 –2.9
Profi t from operating activities (ebit) 383 6 429 12.0 131 7 126 –3.8
Return on sales (%) 1 2.7 2.9 – 3.4 3.2 –
Operating cash fl ow 244 657 > 100 141 260 84.4
supply chain
Revenue 13,061 13,223 1.2 3,502 3,548 1.3
of which Supply Chain 11,997 11,999 0.0 3,209 3,182 – 0.8
Williams Lea 1,062 1,225 15.3 294 367 24.8
Consolidation / Other 2 –1 – –1 –1 –
Profi t from operating activities (ebit) 231 8 362 56.7 46 9 73 58.7
Return on sales (%) 1 1.8 2.7 – 1.3 2.1 –
Operating cash fl ow 343 394 14.9 125 183 46.41 ebit / revenue.2 Before non-recurring items (adjusted): € 1,154 million.3 Before non-recurring items (adjusted): €254 million.4 Before non-recurring items: € 785 million.5 Before non-recurring items: € 239 million.6 Before non-recurring items: € 390 million.7 Before non-recurring items: € 132 million.8 Before non-recurring items (adjusted): € 272 million.9 Before non-recurring items (adjusted): € 62 million.
Deutsche Post DHL Annual Report 201160

mail division
BUSINESS UNITS AND MARKET POSITIONS
The postal service for Germany
Deutsche Post DHL is Europe’s largest postal company. We deliver 65 million let-
ters every working day in Germany alone. We off er all types of products and services to
both private and business customers, ranging from standard letters and merchandise to
special services such as cash on delivery and registered mail. Customer service is always
our number one priority: today, our customers can purchase stamps at retail outlets,
stamp dispensers, online or via text message.
Our E-Postbrief product, launched in July 2010, provides a secure, confi dential and
reliable platform for electronic communication. It can be used for everything from
personalised customer communication to bulk mailing. E-Postbrief allows companies,
public authorities and private individuals not only to meet high security standards but
also to reduce processing costs.
Our mail business is focused on Germany, where the mail market has been fully
liberalised since the beginning of 2008. Since July 2010, we have been required to apply
value added tax to revenues generated from business customers. Since then competition
has become more intense, whilst at the same time the increasing use of electronic com-
munication is resulting in a continuing shrinkage of the German mail market. In the year
under review, the market for business communications was approximately € 4.3 billion
(previous year, adjusted: € 4.6 billion). We adjusted how we present the market shares
to more precisely refl ect actual market conditions. Here we report on the competitive
business customer market. We now indicate those companies that are service providers
BUSINESS UNITS AND PRODUCTS CUSTOMERS
39 million households
3 million business customers
2 – 3 million retail outlet customers per working day
Mail Communication
Mail products
Special services
Franking
Philately
Dialogue Marketing
Advertising mail
Tailored end-to-end solutions
Special services
Press Services
Press distribution services
Special services
Value-Added Services
Mailroom services
Printing services
Document management
Parcel Germany
Parcel products
Special services
Packstations
Global Mail
Mail import and export
Cross-border mail
Mail services in domestic markets outside of Germany
Special services
Pension Service
Database administration
Payment processes
NETWORK IN GERMANY
82 mail centres
33 parcel centres
Approximately 2,500 Pack stations
Approximately 1,000 Paketboxes
Approximately 20,000 retail outlets and points of sale
65 million letters per working day
2.9 million parcels per working day
a.36 Domestic mail communication market, business customers 2011
Market volume: €4.3 billion
Source: company estimate.
36.3 % Competition
63.7 % Deutsche Post
Deutsche Post DHL Annual Report 2011
Group Management ReportDivisions
mail division
61

to business customers, i.e., both competitors who off er end-to-end solutions as well
as consolidators who off er partial services. Our market share declined slightly from
64.4 % to 63.7 %.
Targeted and cross-media advertising
Advertisers can use our solutions to design and print advertising mail themselves
and send it at reasonable rates via our company. Dialogue marketing is only eff ective if
addresses are constantly updated without breaching data protection regulations. We pro-
vide our customers with online tools and services to ensure the quality of their addresses
and for the effi cient identifi cation of target groups. Companies may rent addresses from
these identifi ed target groups from us for their own advertising campaigns as needed.
We also off er our customers a broad range of digital dialogue marketing solutions to use
for cross-media and targeted communication.
Th e German dialogue marketing market comprises advertising mail along with tele-
phone and e-mail marketing. In the reporting year, this market shrank slightly by 1.1 % year-
on-year to a volume of € 18.5 billion. Some companies considerably reduced advertising
expenditure, especially the charitable sector and lottery organisations. We were able to
achieve a slight increase in our share of this highly fragmented market to 13.5 %.
Newspaper and magazine subscriptions
We deliver newspapers and magazines throughout Germany and on the day
specifi ed by the customer. Our Press Services business unit off ers customers two
products in this context: preferred periodicals, which is the traditional method publishers
use to post the publications to which their customers have subscribed, and standard
periodicals, which companies primarily use to distribute customer or employee maga-
zines via Deutsche Post DHL. We also partner with publishers to sell subscriptions to
over 500 newspapers and magazines both online and offl ine as part of our Deutsche
Post Leser service, a service that has seen much success. Our special services include
electronic address updating as well as complaint and quality management. In addi-
tion, we off er publishers and journalists an online marketplace for journalistic content:
DieRedaktion.de.
According to company estimates, the German press services market had a total
volume of 15.9 billion items in 2011, a decline of 3.0 % on the prior year. Newspaper and
magazine circulation has decreased although weights have seen a slight recovery. Our
competitors are mainly companies that deliver regional daily newspapers. In an overall
shrinking market, we continued to maintain our share at 11.4 %.
Value-added services support customers’ mail communications
Our customers entrust us with components of their mail communications value
chain. We operate their mailrooms and provide them with printing, enveloping and
scanning services. Beyond this, Williams Lea employs its cutting-edge information tech-
nology to print and envelope the hybrid option of the E-Postbrief product.
a.37 Domestic dialogue marketing market, 2011
Market volume: €18.5 billion
Source: company estimate.
13.5 % Deutsche Post
86.5 % Competition
Glossary, page 250
Glossary, page 250
a.38 Domestic press services market, 2011
Market volume: 15.9 billion items
Source: company estimate.
11.4 % Deutsche Post
88.6 % Competition
Deutsche Post DHL Annual Report 201162

Posting and collecting parcels around the clock
At some 20,000 retail outlets and points of sale, around 2,500 Packstations and
around 1,000 Paketboxes, we are available for our customers practically everywhere
to send and collect parcels and small packages at any time they like. We ship about
2.9 million of these items in Germany each working day. Our Packstations are located
in approximately 1,600 towns and cities across Germany. Nearly 90 % of all residents in
Germany are just about ten minutes or less away from the nearest Packstation.
Private customers can also go online to purchase shipping boxes, buy postage for
parcels, place collection orders and track items.
We are also continually evolving our services for business customers. We transport
catalogues, goods and returns and we support both online buyers and sellers, a busi-
ness that continues to boom, from the moment the order is placed and the purchase is
made to shipping the product and hedging against non-payment. Our shopping portal,
MeinPaket.de, is a pertinent example. Designed with small and medium-sized retailers
in mind, customers can use it to position their products online. MeinPaket.de places
security for retailers and shoppers at centre stage. Th e site uses a central checkout func-
tion that allows customers to make purchases in a secure environment. With our Home
Delivery service we can now also off er our customers in Germany transport services for
heavy shipments such as furniture or large appliances.
Th e German parcel market volume totalled around € 7.3 billion in 2011, nearly
7 % more than the prior year. For years now, e-commerce has been a central driver of
growth. In 2011 Germans purchased products online at record levels, leading to another
year of double-digit growth in e-commerce. Th is had a positive impact on growth in the
mail-order and parcel services businesses. Overall, we expanded our market share in the
reporting year to approximately 40 %.
Sending mail and small packages internationally
Our core market of Germany is not the only place in which we off er our services.
We also carry mail across borders and off er international dialogue marketing services.
In addition, we serve business customers in key domestic mail markets, including the
United States, the UK and Spain. Since the end of 2010 we have off ered return services to
online retailers in ten European countries, this is a service we intend to expand in 2012.
Delivering high-quality services is important to us. We rank amongst the top postal
companies in the world in terms of transit times, and the innovative products we intro-
duce to respond to customer and market needs set us apart from the competition. Our
portfolio therefore includes physical, hybrid and electronic written communications,
giving customers the fl exibility to decide what best suits their needs. Foreign custom-
ers tap into our expertise and experience in order to do business successfully on the
German market.
a.39 Domestic parcel market, 2011
Market volume: €7.3 billion
Source: company estimate.
39.5 % dhl
60.5 % Competition
a.40 International mail market, 2011 (outbound)
Market volume: €6.9 billion
Source: company estimate.
15.7 % dhl
84.3 % Competition
Deutsche Post DHL Annual Report 2011
Group Management ReportDivisions
mail division
63

Th e global market volume for outbound international mail was approximately
€ 6.9 billion in 2011 (previous year, adjusted on account of new UPU fi gures: € 6.7 bil-
lion). Th e market is growing because the economy is recovering from the crisis and more
heavy items are being shipped instead of simple letters. Despite increasing competition,
we were able to grow with the market and maintain our share of 15.7 %.
REVENUE AND EARNINGS PERFORMANCE
Revenue slightly above prior year on fewer working days
As at 1 July 2011, we transferred the Home Delivery business in Germany from the
SUPPLY CHAIN division to the MAIL division. We report on this service for deliveries to
both private and business customer addresses as part of our Parcel Germany business
unit.
Th rough the third quarter of 2011, part of the reduction in revenue resulting from
customer discounts was recognised under materials expense rather than revenue. Th e
prior-year fi gures were adjusted.
In the year under review, revenue was € 13,973 million, slightly above the prior year’s
fi gure of € 13,913 million despite the fact that the number of working days was down by
0.3. Th e fourth quarter contained 1.1 working days fewer than the same period in the
prior year.
Since 1 July 2010, we have been required to apply VAT to revenues generated from
business customers. In order to retain this key customer group, we increased our gradu-
ated discount scale, which lowered our revenue. We encountered negative currency
eff ects of € 23 million in the year 2011.
Number of business customer letters stable
In the Mail Communication business unit, we delivered the same volume of letters
on behalf of our business customers as we did in the prior year. Th e fact that there were
1.1 fewer working days was only noticeable in the fourth quarter. Revenue in fi nancial
year 2011 declined from € 5,597 million to € 5,430 million on account of the increased
discounts. Even though we retained and won quality-conscious customers, some of our
price-sensitive customers turned to competitors.
In the regulated mail sector, we kept prices stable as dictated by the price-cap
procedure. According to a comparative study that we conducted, our postage rates still
rank amongst the lowest in Europe. Th e survey accounted for both the nominal price for
sending a standard letter (20 g) by the fastest method and key macroeconomic factors
such as purchasing power and labour costs.
a.41 Mail Communication: volumes
mail items (millions)
2010 2011 + / – % Q4 2010 Q4 2011 + / – %
Business customer letters 6,566 6,564 0.0 1,742 1,697 –2.6
Private customer letters 1,260 1,245 –1.2 378 362 – 4.2
Total 7,826 7,809 – 0.2 2,120 2,059 –2.9
Glossary, page 250
Deutsche Post DHL Annual Report 201164

Addressed advertising mail up slightly
In the Dialogue Marketing business unit, we optimised our portfolio in the fourth
quarter, which meant cutting ties with a number of customers. Sales volumes were down
slightly whilst profi tability improved. In the fi rst three quarters of the reporting year,
sales volumes increased for addressed advertising mail and for our product Einkauf-
aktuell. Customers are again expanding their advertising budgets. In the reporting year,
revenue in the Dialogue Marketing business unit was up 0.4 % to € 2,605 million (previ-
ous year: € 2,595 million).
a.42 Dialogue Marketing: volumes
mail items (millions)
2010 2011 + / – % Q4 2010 Q4 2011 + / – %
Addressed advertising mail 6,074 6,123 0.8 1,697 1,660 –2.2
Unaddressed advertising mail 4,285 4,105 – 4.2 1,247 1,149 –7.9
Total 10,359 10,228 –1.3 2,944 2,809 – 4.6
Press services revenue down
Revenue in the Press Services business unit totalled € 782 million in the report-
ing year, 1.9 % below the prior-year fi gure of € 797 million. Circulations continued their
downwards trend in the German press services market and some publications were
discontinued. Nevertheless, average publication weights remained stable.
Value-added service business grows considerably
Revenue in the Value-Added Services business unit reached € 238 million in the
reporting year, exceeding the prior year’s fi gure of € 229 million by 3.9 %. Th e rise was
even more palpable in the fourth quarter, during which revenue was up 11.9 % to € 66 mil-
lion (previous year, adjusted: € 59 million). We were able to generate growth above all in
our document management and mailroom services.
Strong growth trend in parcel business continues
In our Parcel Germany business unit, revenue in the reporting year was € 3,179 mil-
lion, exceeding the prior-year fi gure of € 2,927 million. Th is refl ects growth of a pleasing
8.6 %. Th e fourth quarter saw even higher revenue, rising 9.5 % to € 972 million (previous
year: € 888 million). Th e fl ourishing e-commerce business is the primary reason for this
strong growth. Our range of products and delivery services are playing a signifi cant role
in this growth. With our Home Delivery service, since the middle of 2011 we have now
also been able to off er our customers in Germany transport services for heavy shipments
such as furniture or large appliances.
a.43 Parcel Germany: volumes
parcels (millions) 2010adjusted
2011 + / – % Q4 2010adjusted
Q4 2011 + / – %
Business customer parcels 1 678 755 11.4 201 226 12.4
Private customer parcels 114 115 0.9 38 39 2.6
Total 792 870 9.8 239 265 10.91 Including intra-group revenue.
Deutsche Post DHL Annual Report 2011
Group Management ReportDivisions
mail division
65

Retail outlets generate increased revenue
Revenue generated by our approximately 20,000 retail outlets and sales points
amounted to €822 million in the reporting year, a 2.8 % increase over the previous year
(€800 million). Growth in the fourth quarter amounted to 4.1 %.
International mail portfolio adjusted
In the Global Mail business, revenue and volumes declined year-on-year primar-
ily because we discontinued the bulk mail business in the Netherlands. Full-year 2011
revenue was €1,693 million, 2.4 % below the prior year (€1,735 million). In the fourth
quarter, revenue declined by 2.7 % to €467 million (previous year: €480 million). Rev-
enue in the reporting year was impacted by negative currency eff ects of €23 million. We
saw encouraging growth in our traditional export business and in international mail
from the United States and the Asia Pacifi c region.
a.44 Mail International: volumes
mail items (millions)
2010 2011 + / – % Q4 2010 Q4 2011 + / – %
Global Mail 6,005 2,987 – 50.3 1,497 638 – 57.4
ebit below prior year’s high fi gure due to vat
EBIT in the MAIL division was €1,107 million in fi nancial year 2011, 1.2 % below the
prior year’s high fi gure of €1,120 million. Th e VAT-related discounts in the mail business
and expenses from investments in digital growth areas put pressure on earnings. In the
fourth quarter of 2011, earnings improved from €224 million to €246 million. Return
on sales was 7.9 % in the reporting year.
Operating cash fl ow was €924 million (previous year, adjusted: €1,042 million). Th is
was impacted by the VAT requirement introduced on 1 July 2010 and the changes in
working capital associated with it. Working capital was €–913 million and below the
prior-year fi gure of €–947 million.
Deutsche Post DHL Annual Report 201166

express division
BUSINESS UNITS AND MARKET POSITIONS
World market leader for international express services
In the EXPRESS division, we transport urgent documents and goods reliably and on
time from door to door. Our network spans more than 220 countries and territories, in
which some 100,000 employees provide services for more than 2.5 million customers.
As a global network operator that applies standardised processes, we are well aware that
the quality of our services and the satisfaction of our customers are crucial in determin-
ing our success. Th at is why we are constantly optimising our service to keep our cus-
tomer commitments and respond specifi cally to customers’ wishes. It is not by accident
that DHL is the world market leader in international express services.
Standardised portfolio of time-defi nite products
International, time-defi nite courier and express shipments are our core business.
Our Time Defi nite and Same Day services off er a choice of delivery at either a specifi c
time or as quickly as possible. In some markets, our portfolio is complemented by Day
Defi nite service as well as special services such as Collect and Return and Medical Express.
Customers in high-tech industries in particular use our Collect and Return service, in
which goods in need of repair are collected from the end user, taken in for repairs and
then returned to the user.
DHL has also increased activities for customers in the Life Sciences & Healthcare
sector, as well as improving processes in clinical trials transport and introducing glob-
ally applicable standards. Since 2011 we have tracked all Medical Express shipments in
real time at our quality control centres. Th is allows us to respond immediately to any
disruptions in the process of transporting these ultra-sensitive shipments.
In our Same Day product line, we have expanded our DHL Jetline service to a num-
ber of countries, including India. Urgent shipments requiring same-day delivery are
collected within one hour of the customer’s order and fl own on the next fl ight to reach
their destination as soon as possible. Th is is made possible by our comprehensive and
fl exible network.
We work constantly on making it as easy as possible for customers to do business
with us. Customers can use the new Receiver Paid service to import documents and
goods from more than 220 countries and territories, even if they are not registered with
us, and thus benefi t from our global presence. Our customer service takes the order
directly and the customer pays the invoice upon collecting the shipment at one of our
Service Points.
PRODUCTS
dhl Time Definite
dhl Same Day
dhl Day Definite
REGIONS
Europe
Americas
Asia Pacific
eemea (Eastern Europe, the Middle East and Africa)
NETWORK
220 countries and territories
3 main global hubs
34,000 Service Points
2.5 million customers
31,000 vehicles
Glossary, page 250
Deutsche Post DHL Annual Report 2011
Group Management ReportDivisions
express division
67

Our aircraft fl eet – economical and ecological all over the world
In 2011, we increased the capacity of our intercontinental aircraft fl eet by adding
four Boeing 747s and one 777. Th is allows us to off er our customers additional connec-
tions between Europe, Asia and America, which improves our service and shortens
delivery times.
To meet the rising demand in Asia, we put two additional Boeing 747s into oper-
ation during the reporting year to service the regional routes between Hong Kong and
Shanghai and between Hong Kong and Tokyo. For routes within Europe, we have pur-
chased eighteen Airbus A300-600s that are currently being converted in Dresden from
passenger aircraft to freighters and which will be delivered to us successively until 2013.
Th e new aircraft will not only enable us to expand our capacity in response to increasing
demand but will also contribute to meeting climate protection goals. Compared with the
old aircraft , the new aircraft will use up to 20 % less fuel and emit less CO2. We are thus
supporting the Group’s sustainability strategy. Another key factor is how aircraft capacity
is utilised. Our load factor is approximately 75 % on intercontinental routes, which is
again well over the international sector average of approximately 51 %.
Well positioned in the global express business
DHL has again succeeded in maintaining its leading position in the international
express business. As in the previous year, we led the international express market in all
regions outside of the Americas. Moreover, we are continuing to expand our presence
and infrastructure in growth markets such as Asia, for example through construction
of the North Asia Hub in Shanghai, which will go into operation in 2012.
Leading position in Europe maintained
In Europe, we raised our market share in the international express segment to 38 %
in 2010, thus remaining the market leader. To meet increasing demand we expanded
the loading area at our Leipzig hub. A total of 3,000 new jobs were created in the region.
Th e site is becoming increasingly important globally: more than 50 aircraft take off and
land in Leipzig each day. Th is testifi es to the success of our focus on the international
express business and the improvement of our service quality.
Demand rises in the Americas region
Our focus on the international express business has also continued to prove fruitful
in the US market. In 2011, we expanded our global hub in Cincinnati in order to meet
rising demand from international customers for time-critical shipments.
In September, we launched a direct route between Cincinnati and Panama. Th e new
route cuts one day off delivery time from all locations in the USA, Canada, Asia and
the Caribbean islands to Panama and from Panama to all DHL destinations worldwide.
At the end of June 2011 we divested our domestic business in Canada. However,
we agreed on a ten-year partnership with TransForce, the new owner. Th is allows us to
take optimum advantage of our respective strengths in the international and domestic
segments for the benefi t of our customers.
Corporate responsibility, page 87
a.45 European international express market, 2010 1, 2: top 4
Market volume: € 5,788 million
1 Includes the tdi express product.2 Country base: be, ch, de, es, fr, ie, it, nl,
pl, se, uk.
Source: Market Intelligence 2011, annual reports and desk research.
23 % ups
16 % tnt
11 % FedEx
38 % dhl
a.46 Americas international express market, 2010 1, 2: top 4
Market volume: € 5,387 million
1 Includes the tdi express product.2 Country base: br, ca, mx, us.
Source: Market Intelligence 2011, annual reports and desk research.
32 % ups
13 % dhl
1 % tnt
51 % FedEx
Deutsche Post DHL Annual Report 201168

Market leadership strengthened in Asia
In Asia, we expanded our leading market position in the international express busi-
ness by two percentage points to 36 %. We have broadened our service in this important,
profi table market with respect to guaranteed pre-9 and pre-12 deliveries: these shipments
can now be sent to Europe to three times as many postcodes as before. Additionally, the
number of Asian countries from which customers can send this product to the United
States has doubled. Demand in the region for the product increased by 67 %.
Following the devastating earthquake in Japan in March 2011, we were able to
resume service aft er just 48 hours without endangering the safety of our employees or
failing to adhere to any legal requirements. Due to the eff orts of our employees, we had
resumed full service quality aft er just one week.
Constant growth in emerging markets
In the EEMEA region (Eastern Europe, the Middle East and Africa), recent market
studies indicate that we improved our market share in the international express business
by one additional percentage point to 47 % compared with 2009. We have been growing
steadily in these markets for many years, and our leading position has been confi rmed
at an even higher level.
In 2011 we were faced with special challenges due to political unrest in North Africa
and the Middle East. Nonetheless we remained a reliable partner for our customers.
In Bahrain, Egypt and Syria we were able to maintain our service. In other countries,
disruptions occurred only when we were subject to legal restrictions or were not able
to fully ensure the safety of our employees.
REVENUE AND EARNINGS PERFORMANCE
International shipment volumes boost revenue growth strongly
We increased revenue substantially in the EXPRESS division with a rise of 5.9 % in
2011 to €11,766 million (previous year: €11,111 million). Th e increase occurred despite
the fact that the prior-year fi gure still included revenue of €334 million from businesses
that have since been sold: the day-defi nite domestic businesses in the UK and France and
the domestic express businesses in China, Canada and Australia. Excluding these sales
and negative currency eff ects of €226 million, revenue grew by an encouraging 10.9 %.
Th e rise in revenue was mainly attributable to the rise in international time-defi nite
shipment volumes.
In the Time Defi nite International (TDI) product line, our customers sent 10.2 %
more shipments each day in the reporting year than in the prior year and weight per
shipment rose by 6.9 %. Additional revenues from fuel surcharges partially off set the
higher fuel costs.
Per-day shipment volumes for the TDI product line again improved signifi cantly
in the fourth quarter, rising 11.6 % compared with the fourth quarter of 2010 and even
exceeding the annual average. Th e business disposals referred to above resulted in daily
shipment volumes increasing by only 1.3 % on the prior-year quarter in the Time Defi nite
Domestic (TDD) product line and declining by 11.3 % year-on-year in the Day Defi nite
Domestic (DDD) product line.
a.47 Asia Pacifi c international express market, 2010 1, 2: top 4
Market volume: € 5,430 million
1 Includes the tdi express product.2 Country base: au, cn, hk, in, jp, kr, sg, tw.
Source: Market Intelligence 2011, annual reports and desk research.
21 % FedEx
12 % ems
10 % ups
36 % dhl
a.48 International express market in the eemea region, 2010 1, 2: top 4
Market volume: € 544 million
1 Includes the tdi express product.2 Country base: ae, ru, tr, za.
Source: Market Intelligence 2011, annual reports and desk research.
17 % tnt
12 % ups
6 % FedEx
47 % dhl
Deutsche Post DHL Annual Report 2011
Group Management ReportDivisions
express division
69

a.49 express: revenue by product
€m per day 1 2010 adjusted
2011 + / – % Q4 2010 adjusted
Q4 2011 + / – %
Time Defi nite International (tdi) 27.4 30.8 12.4 29.0 32.9 13.4
Time Defi nite Domestic (tdd) 5.0 5.2 4.0 5.3 5.2 –1.9
Day Defi nite Domestic (ddd) 4.8 3.6 –25.0 4.2 3.5 –16.71 To assure comparability, product revenues were translated at uniform exchange rates. These revenues are also the basis for the weighted
calculation of working days.
a.50 express: volumes by product
thousands of items per day 1
2010 adjusted
2011 + / – % Q4 2010 adjusted
Q4 2011 + / – %
Time Defi nite International (tdi) 490 540 10.2 517 577 11.6
Time Defi nite Domestic (tdd) 643 684 6.4 678 687 1.3
Day Defi nite Domestic (ddd) 501 411 –18.0 468 415 –11.31 To assure comparability, product revenues were translated at uniform exchange rates. These revenues are also the basis for the weighted
calculation of working days.
Volumes up substantially in the Europe region
In the Europe region we posted revenue of €5,009 million in the reporting year,
slightly surpassing last year’s level of €4,960 million. Th e fi gure for 2010 still included
revenue of €201 million related to the sold day-defi nite domestic businesses in the
UK and France. Excluding these sales and positive currency eff ects of €10 million, the
increase in revenue amounted to 4.8 % and was primarily due to the considerable rise of
10.3 % in daily shipment volumes in the TDI product line compared with the prior year.
At 12.2 %, growth in daily TDI volumes was even higher in the fourth quarter of 2011
than for the year as a whole and in the preceding quarters.
Revenue up sharply in the Americas region
Revenue in the Americas region surpassed the prior-year amount, growing by 3.1 %
to €1,887 million in 2011 (previous year: €1,831 million). Th is fi gure includes the sale of
our domestic express business in Canada in the amount of €109 million and negative
currency eff ects of €116 million. Excluding these factors, revenue rose markedly in the
Americas region with an increase of 15.3 %.
Daily shipment volumes in the TDI product line grew by 12.5 % year-on-year. At
15.1 %, growth in the fourth quarter was even higher, primarily due to our sustained
good business trend in the United States.
Asia Pacifi c region continues to drive express business
Th e Asia Pacifi c region continues to drive growth in our express business. Revenue
climbed by 10.2 % year-on-year to €3,718 million (previous year: €3,374 million), despite
the fact that the prior-year fi gure still included revenue of €24 million from the sold
domestic express businesses in China and Australia. Excluding these sales and nega-
tive currency eff ects of €50 million, the rise in revenue was an impressive 12.4 % in the
reporting year.
Deutsche Post DHL Annual Report 201170

Per-day shipment volumes in the TDI product line increased by 10.3 % in 2011 com-
pared with the prior year, with fourth-quarter growth amounting to 10.5 %.
Business in the eemea region improves steadily
Despite the challenges due to the political unrest in the Middle East, our revenue
in the EEMEA region (Eastern Europe, the Middle East and Africa) rose by 5.6 % to
€1,284 million, up from €1,216 million in the previous year. Th is fi gure contains nega-
tive currency eff ects of €80 million. Excluding these eff ects, growth amounted to 12.2 %.
Daily shipment volumes increased on the prior year in all product lines.
ebit reaches a record high
EBIT for the EXPRESS division rose from €497 million in 2010 to €927 million in
the reporting year, its highest level to date. Return on sales also increased signifi cantly,
growing from 4.5 % to 7.9 %. Th e fact that we achieved higher revenues and volumes in
all regions and focused keenly on international express services made a major contribu-
tion to this improvement. Th e previous year’s EBIT had been impacted by restructuring
costs in the amount of €288 million, mainly due to the disposals in France and the UK.
EBIT for the fourth quarter of 2011 improved from €218 million to €248 million year-
on-year, with return on sales amounting to 7.9 % (previous year: 7.5 %). In the fourth
quarter of 2010, earnings had been impacted by restructuring costs of €21 million.
Due to higher income, lower cash outfl ows for restructuring and strict working
capital management, operating cash fl ow amounted to €1,146 million in the year under
review (previous year: €904 million). In the fourth quarter, operating cash fl ow grew
signifi cantly from €251 million to €454 million.
Deutsche Post DHL Annual Report 2011
Group Management ReportDivisions
express division
71

global forwarding, freight division
BUSINESS UNITS AND MARKET POSITIONS
Broker between customers and freight carriers
With its wide range of coverage and comprehensive off ering for transporting freight
by air, sea or land, DHL is one of the leading global logistics companies. Th e products
and services off ered by our Global Forwarding and Freight business units extend from
standardised logistics operations to multimodal transport solutions and highly indi-
vidualised industrial projects. Our workforce of around 42,000 employees co-operates
with reliable partners to ensure that our operations run smoothly and are carried out
to our customers’ satisfaction.
Our business model is very asset-light, as it is based on the brokerage of transport
services between our customers and freight carriers. Th is allows us to consolidate ship-
ments to achieve higher volumes and to leverage our purchasing power. Moreover, our
wide network coverage enables us to optimise goods routing.
Market leader in air freight and number two in ocean freight
In the Global Forwarding business unit, DHL is the world leader in air freight services
and one of the leading providers of ocean freight services. Around 30,000 employees
work to ensure the transport of all kinds of goods by air or sea every day. Our products
and services cover standard transport, multi-link transport chains and specialised solu-
tions such as industrial projects for specifi c sectors, including temperature-controlled
and secure shipments. To complement our product off er, we provide additional trans-
port-related services that include handling customs formalities and providing insur-
ance services and warehousing solutions, and the integrated management of customers’
end-to-end supply chains aimed at making them more effi cient. Most of our custom-
ers come from the Technology, Automotive, Chemicals, Consumer, Retail (including
Fashion & Apparel) and Energy sectors. We also provide customised solutions to niche
industries such as motor sport.
REGIONS
Global Forwarding
Worldwide > 150 countries and territories
Freight
Europe, cis, the Middle East, North Africa, usa> 50 countries
LOCATIONS
Global Forwarding
> 850 branches
Freight
> 160 branches
PRODUCTS
Global Forwarding
Air freight
Ocean freight
Industrial projects
Transport management
Customs clearance
Freight
Full truckload
Part truckload
Less than truckload
Intermodal transport
a.51 Air freight market, 2010: top 4
thousand tonnes 1
1 Data based solely on export freight tonnes.
Source: annual reports, publications and com-pany estimates.
1,225 db Schenker
948 Kuehne + Nagel
892 Panalpina
2,458 dhl
Deutsche Post DHL Annual Report 201172

Air freight market weaker than in prior year
Aft er high volumes in 2010, the air freight market was weak in the fi rst half of 2011,
followed by a signifi cant drop in volumes in the second half of the year. According to
IATA, the global airline industry association, worldwide freight tonne kilometres fl own
had dropped 5 % by the end of September compared with the end of March. Load factors
also declined due to carriers adding new cargo aircraft to their fl eets.
In its air freight business, DHL transports a signifi cant share of the world’s technol-
ogy and manufacturing products. Transport volumes in these sectors were weaker than
in the rest of the market during the year under review.
Th e numerous natural disasters and political instability seen in 2011 had only a mar-
ginal impact on our air freight business. Our operations in Japan were able to maintain
services in the aft ermath of the devastating earthquake of 11 March.
Ocean freight business sees lower volume growth
Th e ocean freight market remained on a relatively steady growth path compared
with the prior year, although it weakened towards the end of the year. Despite slower
market growth, new capacities were added, which led to a drop in freight rates. Our
volumes in the full-container-load (FCL) market were on par with the prior year though
somewhat behind the market pace, owing to strategic customer portfolio decisions at
the end of 2010, which led to a major one-time loss in volume. We did make signifi cant
gains in our less-than-container-load (LCL) business.
Road freight market experiences solid growth
Th e European road freight market showed growth of 3 % to 5 % in 2011, driven by
increases in volumes and prices. DHL’s Freight business unit will continue to be number
two in the European market. With some 12,000 employees around the world, we have a
strong footprint both inside and outside Germany. In 2011, we outperformed the overall
market in terms of growth. We are currently developing new products and services to
further strengthen our market position.
REVENUE AND EARNINGS PERFORMANCE
Freight forwarding business increases revenue and earnings
Th e GLOBAL FORWARDING, FREIGHT division increased revenue in the reporting
year by 4.9 % to €15,044 million (previous year: €14,341 million). Excluding negative cur-
rency eff ects of €146 million, revenue growth was 5.9 %. Overall, our freight forwarding
business performed well and was profi table despite noticeable weakening in the market.
Moreover, we restructured our Global Forwarding business unit organisation in the sec-
ond half of the year, by changing the structure of our global and regional headquarters.
Th is adjustment resulted in non-recurring costs of €16 million in the fourth quarter.
a.52 Ocean freight market, 2010: top 4
thousand teus 1
1 Twenty-foot equivalent units. At the beginning of 2011 we adapted our systems for recording transport volumes, which also resulted in a slight retroactive adjustment.
Source: annual reports, publications and company estimates.
2,728 dhl
1,647 db Schenker
1,241 Panalpina
2,945 Kuehne + Nagel
a.53 European road transport market, 2010: top 5
Market volume: €157.9 billion 1
1 Country base: total for 19 European countries, excluding bulk and specialties transport.
Source: mrsc mi freight reports 2008 – 2011, Eurostat 2010.
1.8 % dsv
3.4 % db Schenker
1.5 % Dachser
1.3 % Geodis
2.4 % dhl
Deutsche Post DHL Annual Report 2011
Group Management ReportDivisions
global forwarding, freight division
73

In the Global Forwarding business unit, revenue increased by 3.4 % from €10,725 mil-
lion to €11,094 million. Th e increase was 5.2 % aft er adjustment for negative currency
eff ects of €193 million. We were able to improve gross profi ts by 7.4 % to €2,468 million
in the reporting year (previous year: €2,298 million).
Gross profi ts in air and ocean freight at high level
In fi nancial year 2011, gross profi ts in the air and ocean freight business continued
their positive trend, although revenues and volumes came under pressure in the second
half of the year. Fuel prices remained high whilst freight rates declined. Overall, we were
able to stabilise our margins at a high level.
Our air freight volumes were down slightly by 1.3 % compared with the prior year.
Full-year revenue increased 2.6 %. In the fourth quarter revenue was down 4.3 % as a
result of a considerable cooling in the air freight market in the second half of the year and
because the normally high seasonal business did not materialise in the fourth quarter.
Consequently, our fourth-quarter volumes were 6.8 % below the prior year. Nevertheless,
we increased full-year gross profi t by 6.3 %. We benefi ted from the improved purchasing
conditions that resulted from greater market capacities.
a.54 Global Forwarding: revenue
€m
2010 2011 + / – % Q4 2010 Q4 2011 + / – %
Air freight 5,431 5,573 2.6 1,500 1,436 – 4.3
Ocean freight 3,446 3,544 2.8 925 895 –3.2
Other 1,848 1,977 7.0 489 576 17.8
Total 10,725 11,094 3.4 2,914 2,907 – 0.2
a.55 Global Forwarding: volumes
thousands
2010
adjusted 1
2011 + / – % Q4 2010 adjusted 1
Q4 2011 + / – %
Air freight tonnes 4,435 4,378 –1.3 1,185 1,105 – 6.8
of which exports tonnes 2,458 2,447 – 0.4 656 624 – 4.9
Ocean freight teu s 2 2,728 2,724 – 0.1 681 682 0.11 At the beginning of 2011 we adapted our systems for recording transport volumes, which also resulted in a slight retroactive adjustment.2 Twenty-foot equivalent units.
In ocean freight, we maintained our volumes in the reporting year despite the weak
economic trend. We also considerably improved our margins. Revenue was up year-on-
year by 2.8 %. We saw a year-on-year decline in revenue of 3.2 % in the fourth quarter,
which was attributable to the seasonal price surcharges that were applied in the previous
year. Nevertheless, we increased full-year gross profi t by 16.0 %, primarily because we
focused on selective growth in attractive areas of business.
In our industrial project business (in table A.54 reported as part of Other), revenue
and gross profi t performed much better in the second half of the year, as expected, aft er
a subdued fi rst half. Revenue and gross profi t saw encouraging growth compared with
the prior year.
Deutsche Post DHL Annual Report 201174

Overland transport sees stable growth
Th e Freight business unit generated revenue of €4,088 million in 2011, exceeding the
previous year’s fi gure of €3,735 million by 9.5 %. Th is includes positive currency eff ects of
€47 million. Excluding these eff ects revenue exceeded the previous year’s fi gure by 8.2 %.
Revenue increases were seen primarily in Germany, the Nordic countries and Eastern
Europe. In the United States, we acquired Standard Forwarding in June 2011 with an
eye towards developing our overland transport business outside Europe. Th is business
generated around 1 % of the business unit’s revenue growth. Despite persistent pressure
on margins because peak season business was more pronounced than in the prior year,
gross profi t was €1,054 million, exceeding the prior-year fi gure by 6.4 %. Overall we
increased our productivity on account of strict cost management, increased business
and a stable workforce, amongst other things.
Strongly improved ebit and operating cash fl ow
Due to high gross profi t margins and strict cost management, EBIT in the GLOBAL
FORWARDING, FREIGHT division was up signifi cantly from €383 million to €429 million.
Th is increase refl ects a gain of 12.0 %. Th e prior-year EBIT fi gure contained restructuring
costs of €7 million. Return on sales amounted to 2.9 % in the reporting year (previous
year: 2.7 %). In the fourth quarter EBIT declined by 3.8 % from €131 million to €126 mil-
lion. Th e prior-year fi gure contained restructuring costs of €1 million. Fourth-quarter
earnings were impacted primarily by the structural adjustments of €16 million described
above; return on sales therefore declined from 3.4 % to 3.2 %.
Despite revenue growth, net working capital was signifi cantly below the prior year,
due to improved receivables management especially in the fourth quarter. Th us, we
improved operating cash fl ow signifi cantly in the reporting year by €413 million to
€657 million (previous year: €244 million).
Deutsche Post DHL Annual Report 2011
Group Management ReportDivisions
global forwarding, freight division
75

supply chain division
BUSINESS UNITS AND MARKET POSITIONS
Customer-centred outsourcing solutions
Th e SUPPLY CHAIN division comprises the two business units of Supply Chain and
Williams Lea. In the Supply Chain business, we provide contract logistics solutions along
the entire supply chain for customers from a wide variety of sectors. Williams Lea is a
global provider of business process outsourcing and a specialist in corporate information
solutions, the management of companies’ information and communication processes.
End-to-end offering in contract logistics
In the Supply Chain business, we provide customers in many industry sectors with
logistics services along the entire supply chain. From planning, sourcing, production,
storage and delivery to returns logistics and value-added services, customers rely on us
to ensure a smooth logistics fl ow.
a.56 Logistics and value-added services along the entire supply chain
Raw materials
DistributionProduction fl ows
ReturnsInbound transport
Outbound transport
Warehousing
dhl Supply Chain Services
1 2 3 54 6
1 Plan – Laying the foundation for a supply chain
2 Source – Getting the materials at the time required
3 Make – Supporting product manufacturing
4 Store & Customise – Getting it ready to sell
5 Deliver – Getting it where it needs to be
6 Return – Bringing it back when it’s not needed
SUPPLY CHAIN LOGISTICS SOLUTIONS
Warehousing Value-added services
Distribution Business process outsourcing
Managed transport Supply Chain management and consulting
SUPPLY CHAIN FOCUS SECTORS
Consumer
Retail
Technology
Life Sciences & Healthcare
Automotive
Energy
WILLIAMS LEA SERVICES
Marketing Solutions
Office Document Solutions
Customer Correspondence Management
SUPPLY CHAIN PRODUCTS
Lead Logistics Provider
Co-Packing
Integrated Logistics Procurement
Technical Services
e-Fulfilment
Airline Business Solutions
Glossary, page 250
Deutsche Post DHL Annual Report 201176

We off er warehousing, distribution, managed transport and value-added services
as well as business process outsourcing, supply chain management and consulting
solutions. We ensure that our customers’ products and information reach their markets
quickly and effi ciently, thus securing them competitive advantages. With local insight
and global scale, we serve customers in more than 60 countries and support them in
optimising their complex processes.
In order to strengthen the focus on our core business of contract logistics, in
April 2011 we disposed of Exel Transportation Services Group (ETS), a provider of
freight brokerage and intermodal services in North America.
Our Supply Chain business provides expert solutions in six focus sectors: Consumer,
Retail, Technology, Life Sciences & Healthcare, Automotive and Energy. In 2011, we
aligned our global management structure to enable the development and implementa-
tion of sector-specifi c supply chain solutions at a cross-regional level. In addition, each
sector head is supported by a team of dedicated specialists who handle the customer
projects and ensure implementation of global sector solutions on a regional level.
Consumer and Retail are two of our largest sectors. Both of these off er major growth
potential for the division, since we manage the supply chains all the way from the source
of supply to the end customer. Th is calls for fl exibility, reliability and cost effi ciency as
the key value drivers for our services in these sectors, which range from international
inbound logistics and warehouse and transport services to packaging and other value-
added services.
Customers in the Technology sector require fast, fl exible and effi cient supply chains,
and demand for integrated product and service logistics is increasing. Our off erings
portfolio ranges from inbound-to-manufacturing services and warehouse and transport
services to integrated packaging, returns management and technical services. Th is is
one of the sectors in which customers are increasingly requesting integrated solutions,
which are being developed across all DHL divisions.
We are also increasingly providing integrated solutions in the Life Sciences & Health-
care industry, where supply chains and logistics processes are still evolving in many parts
of the world. Cost pressure is growing steadily and quality control at the highest possible
level is a must for all our customers. In the reporting year we acquired Eurodifarm, a
specialist in the controlled-temperature distribution of pharmaceutical and diagnostic
products. Th e purchase strengthens our market leadership in Italy in this sector.
Th e Automotive industry is one of our truly global sectors. Production is continu-
ing to shift to emerging markets such as China, India and Brazil, in which we have a
strong presence. For our inbound-to-manufacturing, aftermarket logistics and lead logistics
provider solutions, the key factor is our ability to off er a high degree of global fl exibility
and reliability whilst lowering costs.
Th e fast-growing Energy sector is another market in which the DHL divisions pro-
vide integrated logistics solutions for both the build and run phases of major projects.
With our Maintenance, Repair & Operation services we off er streamlined supply chain
solutions that can reduce costs by 20 % whilst increasing maintenance productivity by
up to 25 %.
Glossary, page 250
Glossary, page 250
Glossary, page 250
Deutsche Post DHL Annual Report 2011
Group Management ReportDivisions
supply chain division
77

Experts in corporate information solutions
Williams Lea specialises in outsourced corporate communication and information
management, ranging from offi ce document and marketing solutions to customer cor-
respondence management. We off er these solutions to customers in the fi nancial, retail,
consumer goods, pharmaceutical, publishing and public sectors as well as the legal sector.
In July 2011, we acquired Tag Group, an international provider of marketing
execution and production services. Th e acquisition expands our fast-growing market-
ing solutions business.
Global market leader in contract logistics
DHL is the global market leader in contract logistics with a market share of 8.3 %
(2010). In this highly fragmented market, the top ten players account for only about
23 % of the overall market, the size of which is estimated to be €147 billion. We are the
regional market leader in our key regions of North America, Europe and Asia Pacifi c
and also have a very strong position in rapidly growing markets such as Brazil, India,
China and Mexico. We are confi dent that we shall succeed in leveraging our global
expertise and good relationships with multinational corporations in order to expand
our business in these markets.
Our Williams Lea business unit leads the market in outsourcing information man-
agement and marketing production. Th is market is also highly fragmented and consists
largely of specialists off ering either a very limited set of services or occupying exclusive
niches. Due to our broad range of international services and long-lasting customer
relationships, we have been able to build on our leading market position. In addition,
we are leveraging DHL’s excellent customer relationships to win new business in the
Williams Lea business unit.
REVENUE AND EARNINGS PERFORMANCE
Revenue up 5.7 % excluding portfolio changes and currency effects
As at 1 July 2011, we transferred the Home Delivery business in Germany to the
MAIL division. Th e prior-year segment reporting fi gures were adjusted accordingly.
Th e principal objective in the SUPPLY CHAIN division was to achieve profi table
growth from a leaner organisation with increased revenues and improved operational
effi ciency. With this in mind we streamlined organisational processes and made a num-
ber of portfolio changes that impacted the year-on-year revenue and earnings trend. Th ese
included the sale of Exel Transportation Services (ETS) and the acquisitions of Euro-
difarm and Tag Group.
a.57 Contract logistics market, 2010: top 10
Market volume: €147 billion
Source: Transport Intelligence; fi gures estimated except for dhl, ceva, Kuehne + Nagel; exchange rates: as at April 2011.
1.3 % Penske
1.1 % Sankyu
1.1 % fiege
1.1 % ups scs
1.6 % Hitachi
1.4 % Norbert Dentressangle
1.7 % Wincanton
2.2 % Kuehne + Nagel
2.3 % ceva
8.3 % dhl
Earnings, page 46 f.
Deutsche Post DHL Annual Report 201178

Revenue increased by 1.2 % year-on-year to €13,223 million in fi nancial year 2011
(previous year: €13,061 million). Th e sale of ETS and negative currency eff ects reduced
revenue growth by €683 million and the acquisitions of Eurodifarm and Tag increased
revenue by €103 million. Excluding these major eff ects, revenue grew by 5.7 % with the
Life Sciences & Healthcare and Automotive sectors providing the largest increase.
Fourth-quarter revenue increased by 1.3 % from €3,502 million to €3,548 million.
Excluding the portfolio changes and currency eff ects mentioned above, revenue growth
was 4.3 %.
Substantial share of revenue generated from key customers
Revenue in the Supply Chain business unit totalled €11,999 million in the reporting
year, much in line with the prior-year level of €11,997 million. Growth amounted to 5.2 %
excluding the ETS disposal, the Eurodifarm acquisition and negative currency eff ects.
Revenue from our 19 key global customers grew by 6.7 % to represent almost 16 % of total
revenue in the Supply Chain business.
In the Americas region, the sale of ETS reduced the growth achieved in our focus
sectors with the Consumer sector seeing the largest impact. Good progress was made
in the Life Sciences & Healthcare and Energy sectors due to increased business activity
and additional revenue from new business.
Th e Asia Pacifi c region continued to achieve the highest level of regional revenue
growth, particularly in Australia, China, Th ailand and India. In Australia we gained
new business in the Life Sciences & Healthcare sector and in China we benefi ted from
a steady rise in domestic demand. Operations in those Japanese areas aff ected by the
earthquake in March 2011 returned to full capacity.
Revenue also improved due to increased volumes and new business gains in the
UK, Africa and Eastern Europe. We continued to expand the Life Sciences & Health-
care sector, as evidenced by higher revenue in the UK businesses and the acquisition of
Eurodifarm in Italy.
Williams Lea revenue increased by 15.3 % in 2011 to €1,225 million (previous year:
€1,062 million). Excluding the revenue generated by the Tag acquisition and adverse
currency eff ects, growth was 11.8 %. Most of this growth came from the Marketing
Solutions business in the Americas and new business in the European banking sector.
Additional contracts worth €1.3 billion concluded
In the Supply Chain business unit we concluded additional contracts worth
approximately €1.3 billion in annualised revenue with both new and existing customers.
Th is represents around 1,200 contracts with an average deal size of just over €1 million,
an 8 % increase over 2010. We increased new business in all of our focus sectors and
furthered our “above-the-wing” product off ering in Airline Business Solutions through
the new Qantas contract in Australia. Th e annualised contract renewal rate remained at
the high level achieved in 2010.
Williams Lea continued to win new business, including a number of sizeable
Marketing Solutions contracts.
a.58 supply chain:revenue by sector, 2011
Total revenue: €13,223 million
7 % Supply Chain Others
2 % Energy
7 % Automotive
9 % Williams Lea
12 % Technology
17 % Life Sciences & Healthcare
20 % Consumer
26 % Retail
a.59 supply chain:revenue by region, 2011
Total revenue: €13,223 million
27 % Americas
10 % Asia Pacifi c
63 % Europe / Middle East / Africa
Deutsche Post DHL Annual Report 2011
Group Management ReportDivisions
supply chain division
79

Earnings increase signifi cantly
EBIT for the SUPPLY CHAIN division improved signifi cantly in 2011 with a rise of
56.7 % to €362 million (previous year: €231 million). Th e increase included a gain on
the disposal of ETS amounting to €23 million, including transaction costs. Th e prior-
year fi gure contained restructuring costs of €41 million. Th e EBIT margin continued to
improve, rising from 1.8 % to 2.7 % primarily due to an increase in business activity and
continued focus on operating improvement and cost reduction initiatives.
Fourth-quarter EBIT improved from €46 million in the prior year to €73 million.
Th e EBIT margin for the quarter was 2.1 % (previous year: 1.3 %).
Operating cash fl ow was €394 million for 2011, an increase of €51 million over the
€343 million achieved in the previous year. Higher earnings and lower cash outfl ows for
restructuring were partly off set by an increase in working capital.
Deutsche Post DHL Annual Report 201180

NON-FINANCIAL PERFORMANCE INDICATORS
Employees
Slight increase in number of employees
As a global mail and logistics provider, our business is all about people. Our com-
pany rests on our employees, who possess a wide range of qualifi cations and perform a
great variety of functions. With their talents, skills and commitment, these individuals
make an important contribution every day to our becoming the provider of choice for
our customers and the investment of choice for our shareholders. Th is is how we realise
our Strategy 2015 and ensure our sustained economic success.
As at 31 December 2011, we employed 423,502 full-time equivalents in more than
220 countries and territories and therefore 1.1 % more than in the previous year. Staff costs
rose slightly also as a result by 0.7 % to €16,730 million (previous year: €16,609 million).
a.60 Number of employees
2010 2011 + / – %
At year-end
Headcount 1 467,088 471,654 1.0
Full-time equivalents 2 418,946 423,502 1.1
of which mail 3 146,005 147,487 1.0
express 87,536 84,440 –3.5
global forwarding, freight 41,359 41,881 1.3
supply chain 3 130,710 136,810 4.7
Corporate Center / Other 13,336 12,884 –3.4
of which Germany 165,781 168,108 1.4
Europe (excluding Germany) 3 108,241 108,208 0.0
Americas 68,268 70,291 3.0
Asia Pacifi c 61,239 61,112 – 0.2
Other regions 3 15,417 15,783 2.4
Average for the year
Headcount 464,471 467,188 0.6
of which hourly workers and salaried employees 413,830 418,375 1.1
Civil servants 46,866 44,421 – 5.2
Trainees 3,775 4,392 16.3
Full-time equivalents 421,274 423,348 0.51 Including trainees.2 Excluding trainees.3 Adjusted.
In the MAIL division, the number of employees rose slightly by 1.0 % to 147,487. New
personnel were hired particularly in the Parcel Germany business unit, which benefi ted
from strong growth in e-commerce. Th e eff ect of the new hires was partially off set by
the discontinuation of our bulk mail business in the Netherlands.
Deutsche Post DHL Annual Report 2011
Group Management ReportNon-Financial Performance Indicators
Employees
81

In the EXPRESS division, the number of employees dropped by 3.5 % to 84,440 (pre-
vious year: 87,536) because we sold our domestic express businesses in Canada, China
and Australia. Excluding the eff ects of these disposals, we employed slightly more people
than in the prior year, primarily to handle the heavy volumes.
Th e number of full-time equivalents in the GLOBAL FORWARDING, FREIGHT div-
ision went up by 1.3 % to 41,881 due to our purchase of Standard Forwarding in the USA.
Th e SUPPLY CHAIN division increased its staff level by 4.7 % to 136,810 due to the
acquisition of Tag Group, an international marketing service provider, and to growth
in new and existing business in Asia Pacifi c, the Americas and the UK.
At Corporate Center/Other, the number of employees declined by 3.4 % to 12,884.
Productivity was further increased in indirect functions such as IT and real estate.
We continue to employ most of our personnel in Germany, where the number of
employees rose slightly, as in the Americas and the Other regions. Employee numbers
dropped slightly in the Asia Pacifi c region, due above all to the sale of our domestic
express business in China.
Our current planning calls for increasing slightly the number of employees in fi nan-
cial year 2012.
Fostering a Group-wide leadership culture
Quality personnel management is a core element of sustainable company develop-
ment. Our executives therefore make a crucial contribution to implementing our Group
strategy. However, only when they align their personnel management styles towards our
guiding principle of “respect and results” are they able to serve as role models. We have
defi ned the following fi ve competencies to ensure good management. Executives should:
• make customers more successful,
• shape direction,
• drive high performance,
• support the development of others and
• be willing to work on their own development.
To further these objectives, we have developed initiatives aimed at promoting a
comprehensive leadership culture across the entire Group. Executives attend multi-day
workshops designed to help them refl ect on and fi nd ways to improve their own conduct.
We are already implementing this training initiative for upper and middle management
with additional levels to follow.
Employee survey provides yardstick for progress
Our Group-wide employee opinion survey is the main tool we use for measuring
the advances we have made in implementing Group strategy and how executive con-
duct has progressed. We conducted the survey for the fi ft h time in 2011 with 80 % of all
employees participating (previous year: 79 %). Th e fi ndings improved across all survey
questions and key performance indicators for the third year in a row, thus indicating a
stable upwards trend.
Th e highest scores were awarded to the categories of “customer promise” (80 %;
previous year: 77 %), “co-operation” (77 %; previous year: 74 %) and “working conditions”
(76 %; previous year: 73 %). Th e category “strategy” registered one of the highest growth
rates at 70 %, an improvement of 6 percentage points on the prior year. We also made
progress in the area of “active leadership”, which increased from 63 % in the previous
year to 67 %. Th is parameter will fl ow directly into senior management evaluations. Th e
ratings for measures taken as a result of the preceding survey also improved (2011: 59 %;
a.61 Employees by region, 2011 1
1 Full-time equivalents as at 31 December.
40 % Germany
17 % Americas
14 % Asia Pacifi c
4 % Other regions
25 % Europe (excluding Germany)
Deutsche Post DHL Annual Report 201182

previous year: 53 %). Compared with other companies, this is a good result. Neverthe-
less, we would like to continue to improve in 2012 and increase the sustainability of our
follow-up measures.
Development and growth opportunities for our workforce
Th e main task of quality personnel services is to promote the development and
growth of our employees. In 2011, over 80,000 of our employees around the world
took advantage of the more than 3,500 courses available through mylearningworld.net,
our online training platform. We cultivate selected top performers by off ering them the
opportunity to obtain an MBA or to participate in special programmes to promote talent.
Our goal is to fi ll more management positions from our own ranks and we encourage
our employees to gather experience in diff erent divisions.
Our internal placement rate for upper and middle management fell slightly to 85.2 %
in the reporting year, down from 88.9 % in the previous year. In 2011, 11.7 % of internal
job placements involving these management positions were cross-divisional (previ-
ous year: 15.3 %; amongst upper management: 24.8 %). To improve comparability, we
expanded the basis for calculating cross-divisional moves to include both upper and
middle manage ment.
Our divisions also off er programmes designed to meet their own specifi c needs. In
the MAIL division, the focal point of our personnel development eff orts is shift ing from
participation in seminars to on-the-job training. More than 20,000 employees received
sector-specifi c training during the reporting year.
In the EXPRESS division, all employees completed the basic course of the extensive
Certifi ed International Specialist training programme. All will participate in further
specialised training.
In the GLOBAL FORWARDING, FREIGHT division, more than 26,000 employees
(62 %) in this division have completed at least one e-learning course.
In the SUPPLY CHAIN division, around 3,500 sales employees were trained in special
sales skills. In addition, more than 1,500 managers participated in our Leadership
Enrichment Programme during the reporting year.
Strategic personnel planning
In many countries, the demographics are undergoing a notable shift and thus
directly aff ect the composition of the working population. Our employment struc-
ture is also being increasingly impacted, presenting us with both a challenge and an
opportunity for forward-looking personnel work. To analyse the changing situation and
provide an early warning system, we have developed an instrument known as Strategic
Workforce Management, which supplies answers based on facts to questions such as
the risks related to employees’ ageing and to workforce capacity, to succession planning,
transfer options and need-based adaptation of training programmes. Now that we have
successfully completed three test projects in Germany and Mexico, Strategic Workforce
Management will be carried over to other countries.
Deutsche Post DHL Annual Report 2011
Group Management ReportNon-Financial Performance Indicators
Employees
83

Generations Pact made for age-based career solutions at Deutsche Post
In October 2011, Deutsche Post AG and the trade unions agreed upon a trendsetting
model for age-based working solutions. Th e goal is to enable older employees to work
actively until they reach the legal retirement age, allowing us to retain their knowledge
and experience for the business.
Th e Generations Pact supplements the partial retirement programme available
under German law. During the active working phase, our employees can invest in so-
called working-time accounts and use this investment immediately before they enter
retirement. We have also set up a demographic fund to increase the payments received
by employees during the partial retirement phase.
Th e Generations Pact is also intentionally designed to improve employment
opportunities for young people. More than 1,000 trainees will be hired in 2012 upon
completing their training and around 2,350 temporary employees have already received
off ers of permanent employment at the end of 2011 / at the beginning of 2012.
Making the most of our diversity
We think of the diversity of our workforce as an opportunity and a competitive edge.
Th at is why Diversity Management is an established part of our long-term personnel
strategy. Th rough a host of activities, we intend to identify the diversity that is alive and
well in our Group, to integrate employees and to win over applicants. Today, we are
already a multicultural company; employees from more than 150 countries work for us
in Germany alone.
We are committed to ensuring that people with a disability enjoy equal treatment
when it comes to taking part in working life. Th e average annual employment rate of
people with a disability is 8.3 % at Deutsche Post AG (as at 27 January 2012), well above
the national average in the German private sector of 3.9 % in 2009 (source: Bundes-
agentur für Arbeit (German federal employment agency)). Furthermore, we again held
a competition to design barrier-free workplaces during the year under review.
In 2011, our Diversity Management was awarded the German Diversity Prize spon-
sored by Henkel, McKinsey and Wirtschaft swoche magazine in the category of “most
diverse employer”.
Increasing the share of women in management positions
We are an equal opportunity employer. In 2011, we again placed particular emphasis
on increasing the share of women in management positions. We consulted specialists
and executives in various divisions and regions to identify barriers to advancement and
develop growth initiatives for female talent. In connection with a joint declaration by
all DAX 30 companies, we have made it our goal to fi ll 25 % to 30 % of all management
positions becoming vacant with women. Currently, the share of women in executive
positions in the Group is 17.6 % worldwide (previous year: 14.6 % amongst top executives;
16.9 % amongst all management positions). In order to ensure uniform presentation
of these fi gures, the basis for calculation was adjusted and now includes upper and
middle management .
In addition, since 2010 the Group has been participating in an EU-funded project
called “INNOVATIVE! Leading together with women”. Th e project aims to create aware-
ness amongst executives and employees, encourage them to participate and reinforce
the ability of highly qualifi ed women to further their careers.
a.62 Gender distribution in management 1, 2011
1 Based on upper and middle management.
82.4 % Men
17.6 % Women
Deutsche Post DHL Annual Report 201184

a.63 Work-life balance 1
Headcount
2010 2011
State-regulated parental leave 2,036 1,809
Unpaid holiday for family reasons 2,419 2,286
Part-time employees 2 63,126 65,322
Share of part-time employees (%) 36.9 37.51 Includes employees of Deutsche Post ag.2 Excluding in partial retirement in the release phase.
Providing opportunities for young people
We hired approximately 1,950 trainees and students in Germany during the re-
porting year. Around 1,000 young people were off ered an employment contract aft er
completing their training. Since 2008, more than 3,500 such trainees have become
permanent, full-time employees. We foster the top 5 % of our trainees in Germany
in our Top-Azubi talent programme. Th ese trainees are off ered special seminars and
permanent contracts upon successfully completing their training. Furthermore, we give
young people whose career prospects seem bleak a chance of a traineeship as part of
our Perspektive Gelb job entrance programme. In 2011, we took on nearly 80 % of the
approximately 120 participants in the class of 2010.
Acquiring young talent
We are increasingly making use of the internet to reach potential young applicants.
Each year, we publish more than 12,000 job openings online and receive an average of
over 120,000 applications. Th e Top Employer Web Benchmark 2010 put out by Poten-
tialpark Communications, a market research institute, ranked our online career portal
amongst the top fi ve in Germany and Europe.
Our Group-wide Graduate Opportunities Worldwide (GROW) programme is aimed
at attracting suitable young people for specialist and leadership positions. We hired
26 college and university graduates in the reporting year. In an eff ort to be considered
an employer of choice amongst students, we created the JOIN internship programme in
Germany in addition to the traditional internship. It complements our partnership with
AIESEC, the international student-run organisation.
Systematically promoting health and safety
To maintain and promote the health and safety of our workforce, we employ a
Group-wide system that is closely tied to risk management. Th e system includes, for
example, our Corporate Health Award, with which we recognise exemplary health initia-
tives within the Group each year. Targeted initiatives and activities are implemented to
improve our employees’ health. Our Health Work Group is an example of one of these
initiatives. At 7.4 %, we managed to maintain the illness rate for 2011 in Germany at the
prior-year level.
As a transport company, road safety is a central part of our preventative eff orts in
the area of occupational safety. We implement traffi c safety measures including appro-
priate online training on a Group-wide basis, we co-operate with domestic and inter-
national traffi c safety organisations and we develop informational materials for accident
prevention.
a.64 Traineeships, Deutsche Post DHL, worldwide 1
1 Number of trainees, annual average: 4,392.
10.3 % Forwarding and logis tics services specialists
8.5 % Berufsakademie students
50.6 % Courier, express and postal services specialists
22.6 % Other traineeships
8.0 % Warehousing logistics specialists
a.65 Illness rate 1
2011
7.4 %
2010
7.4 %
1 All organisational units in Germany.
Deutsche Post DHL Annual Report 2011
Group Management ReportNon-Financial Performance Indicators
Employees
85

Our corporate health management system received yet more awards in 2011: the
European Commission and the BKK Bundesverband (German association of com-
pany health insurance funds) presented us with the German Corporate Health Award.
We received the Corporate Health Award from the Handelsblatt business newspaper
and EuPD Research, a market research institute, for integrating our corporate health
management system into all of our principles and processes. Certifi cation and testing
organisation TÜV Rheinland renewed the ISO 9001:2008 certifi cation of our occupa-
tional health and safety organisation’s quality management system once again in the
reporting year.
a.66 Occupational safety 1
2010 2011 4
Number of workplace accidents 2 17,374 3 12,829
Accident rate (number of accidents per 1,000 employees per year) 100 74
Number of working days lost due to accidents (calendar days) 377,889 3 320,613
Working days lost per accident 21.8 25.0
Number of fatalities due to workplace accidents 0 21 Includes employees of Deutsche Post ag.2 Accidents when at least one working day is lost, including accidents on the way to and from work.3 Adjusted.4 As at 2 February 2012, accident reports possible until 1 March.
Implementing our employees’ ideas
Suggestions for improvements coming from our employees help to make our Group
more economical and improve our ability to compete in the market. In 2011, Deutsches
Institut für Ideen- und Innovationsmanagement GmbH (Idea Management Centre)
honoured us as the “company with the best idea management in Germany”. We received
the DeutscherIdeenPreis™ (German idea award) from Deutsches Institut für Betriebs-
wirtschaft (German institute for business management) as the top-ranking corporation
in the service, commerce and education sector. We also made it to the fi nal round of the
Innovationspreis der Deutschen Wirtschaft (German business award for innovation). In
addition to Germany, we have thus far introduced our successful overall concept for idea
management to 27 organisational units worldwide and made it available in 16 languages.
During the year under review, we held a Group-wide ideas competition on the topic of
“simplifi cation”. Some 10,000 suggestions were received, many of which were used to
make progress in this core element of our Strategy 2015. Our successful idea manage-
ment proves just how much potential can be unleashed in a business like logistics when
employees play an active role.
a.67 Idea management
2010 2011
Savings per employee € 470.83 496.43
Suggestions for improvements number 227,803 214,337
Accepted suggestions for improvements number 183,323 174,680
Benefi t €m 219.5 234.1
Cost 1 €m 9.3 8.41 Based in part on forecasts.
Deutsche Post DHL Annual Report 201186

Corporate responsibility
Striking a balance between economic and social responsibility goals
Corporate responsibility is an integral part of our Strategy 2015. Th erefore, we put our
experience and global presence to good use to help people and the environment, striking
a balance between our economic and social responsibility goals. “Living responsibility”
is our motto for the Group’s corporate responsibility initiatives. We focus on protect-
ing the environment (GoGreen), helping to manage disasters (GoHelp) and promoting
education (GoTeach). We also support the voluntary work of our employees. In 2011,
we called on our workforce around the world for the fi rst time to take part in Global
Volunteer Day. More than 50,000 staff members in over 160 countries volunteered their
time to help children, young people and senior citizens. Our Living Responsibility Fund
is used to support fi nancially the local community projects for which our employees
volunteer.
Interacting with stakeholders
In February 2011 we invited representatives from industry, politics, the media and
society to Corporate Responsibility Day for the fi rst time and discussed the prospects
for corporate responsibility with them. We shall continue this dialogue and ask the
stakeholders, for example, what we can do to raise our commitment.
Our performance again received high ratings
In 2011 our performance in the area of corporate responsibility again received high
ratings from independent qualifi ed agencies and institutes. Sustainable Asset Manage-
ment gave us a rating of 87 out of 100 points (previous year: 85 points). Th e average score
for other transport and logistics companies was 59 points. Th e DJSI World and Europe
indices as well as FTSE4Good again confi rmed our company’s membership and we
continue to be listed by the French rating agency Vigeo in the Advanced Sustainability
Performance Index Eurozone. With a score of 99 out of 100 points (previous year: 97)
from the Carbon Disclosure Project, we have taken a leading position worldwide in the
Carbon Disclosure Leadership Index (CDLI).
In our Corporate Responsibility Report, which will be published on our website on
3 May 2012, we shall provide additional information and key performance indicators
on corporate responsibility that are not included in the Group Management Report.
Improve co2 effi ciency by 30 % by 2020
We aim to minimise the impact of our business operations on the environment
and, as early as 2008, we were the fi rst logistics company ever to set a quantifi able CO2
effi ciency target. By the year 2020 we intend to improve the CO2 effi ciency of our own
operations and those of our subcontractors by 30 % compared with 2007. In the process
we shall reduce our operating costs and open up new market opportunities.
Strategic focus, page 110 ff.
dp-dhl.com/en/responsibility.html
Deutsche Post DHL Annual Report 2011
Group Management ReportNon-Financial Performance Indicators
Corporate responsibility
87

We account for and quantify our CO2 emissions based on the principles of the
internationally recognised ghg Protocol Corporate Standard. In our European air freight
business, this also includes the requirements of the European Union Emissions Trading
System (EU ETS). In order to maintain consistency following the integration of aviation
into the EU ETS, we changed the distinction between our own and subcontracted air
freight transports (Scope 1 and Scope 3) to comply with these rules and adjusted the
prior-year fi gures accordingly.
Th e GHG Protocol distinguishes between direct carbon emissions from sources
owned or controlled by an entity (Scope 1) and indirect emissions resulting from the
consumption of purchased energy (Scope 2) or from our transport subcontractors
(Scope 3). In the reporting year we expect Scope 3 to be approximately 80 % of the total.
More detailed information will be provided in the Corporate Responsibility Report.
In 2011, our Scope 1 and Scope 2 carbon emissions were approximately 5.3 million
tonnes (previous year, adjusted: 5.0 million tonnes). Th ese CO2 emissions resulted from
our direct use of roughly 490 million litres of liquid fuel (diesel, petrol etc.), 20 million
kilowatt hours of gaseous fuels (natural gas, biogas) as well as 1,020 million kilograms
(aft er redefi nition; corresponds to 1,275 million litres) of kerosene and 3,180 million
kilowatt hours of energy (electricity, green electricity, natural gas etc.) in our facilities.
Th e rise in our Scope 1 carbon emissions was mainly due to the increased demand for
air transport, which we operate ourselves to a large extent.
GoGreen – progress in all fi ve action areas
Our GoGreen programme consists of fi ve essential action areas. We made substantial
progress in all areas in the reporting year.
• Providing transparency: We use our internal fi nancial system to record data on our
carbon emissions. Th is is done by using recorded fuel and energy consumption data
and transport data, for example, from fl ight logs. We started to use this system to
calculate the emissions of our transport subcontractors (Scope 3). We intend to roll
this out across the entire Group by the end of 2012.
• Improving effi ciency: Around the world we have more than 4,000 vehicles in oper-
ation that are powered by hybrid or electric engines, burn alternative fuels or have
received electronic or aerodynamic improvements. Th is is how we are doing our
part to help protect the environment and reduce our carbon footprint. We are in
the process of installing intelligent lighting and heating systems in our buildings
and we have begun using renewable resources, for example by installing rainwater
treatment and solar energy facilities.
• Mobilising employees: We continued to raise awareness amongst our employees about
our GoGreen programme through training and by introducing a carbon calculator.
In the reporting year, for instance, an online portal for company cars was launched.
Drivers are now able to monitor their fuel consumption and compare it to the com-
pany average to raise awareness about their own consumption. As part of World
Environment Day, over 15,000 employees from 180 countries took part in a variety
of community initiatives to help protect their local environments. Th rough these
initiatives our staff helped Deutsche Post DHL donate 6,000 trees to the organisa-
tion Plant for the Planet.
ghgprotocol.org/standards
a.68 co2 emissions, 2011
Total: around 5.3 million tonnes1
1 Scopes 1 and 2.
61 % Air transport
23 % Road transport
16 % Real estate
dp-dhl.com/en/responsibility/environment.html
Deutsche Post DHL Annual Report 201188

• Offering green solutions: Our GoGreen products and services off er customers the
opportunity to improve their green balance sheet. Using carbon certifi cates from
climate protection projects, they can off set the emissions that result from their ship-
ments. Th ese products are available in our mail, parcel and express business in more
than 40 countries (previous year: 30). In our logistics business, GoGreen is available
worldwide. Furthermore, in our GLOBAL FORWARDING, FREIGHT division we off er
the Carbon Dashboard, which enables customers to see the CO2 emissions along
their entire logistics chain, a tool that will help them improve their carbon effi ciency.
• Demonstrating leadership: At the global level, we are working towards a reason-
able framework for pricing CO2 as well as standards for measuring carbon dioxide.
We advocate investment incentives for carbon-effi cient solutions and related
research projects. We are one of the founding members of the Aviation Initiative
for Renewable Energy in Germany (AIREG), which promotes the use of renewable
energy in aviation in Germany. We have also played a signifi cant role in driving the
European alliance to make fuel consumption in road transport more trans parent.
Similar initiatives have been started in China and India; other Asian countries
will follow.
GoHelp – three areas of disaster management
We leverage our global presence, logistics expertise and the commitment of our
employees for our disaster management initiatives. We engage in three areas to help people
in disaster-prone regions: disaster preparedness, disaster response and recovery.
Th e Get Airports Ready for Disaster (GARD) programme prepares local author-
ities and airport staff for possible disasters. Our DHL Disaster Response Teams (DRT s)
provide support on the ground when disaster strikes. Th e Group’s We Help Each Other
(WHEO) fund enables employees to donate money for colleagues aff ected by a natural
disaster. We provide the support as part of the GARD and DRT programmes in co-
operation with the United Nations (UN), free of charge.
In the year under review, we ran GARD training programmes together with the UN
Development Programme in Bangladesh and Indonesia. Further training programmes
are planned in 2012 in Asia and South America.
Our DRT s are backed by a pool of more than 400 trained employees around the
world who are ready to deploy in an emergency within 72 hours. In 2011 our teams
deployed twice: for the earthquake in New Zealand and the fl oods in El Salvador.
In 2011 around 835 employees from the United States, Japan, Poland, Th ailand and
New Zealand, amongst others, received fi nancial assistance from the WHEO fund.
dp-dhl.com/en/responsibility/society.html
Deutsche Post DHL Annual Report 2011
Group Management ReportNon-Financial Performance Indicators
Corporate responsibility
89

GoTeach – better education and greater equality in education
As one of the world’s largest employers with a high demand for qualifi ed employ-
ees, Deutsche Post DHL promotes better education and educational systems. We have
partnered with the organisations Teach For All and sos Children’s Villages since 2010. Our
co-operation with these organisations is personifi ed primarily by the voluntary com-
mitment of our employees.
• Teach For All: Th e network currently includes organisations in 23 countries that
recruit outstanding university graduates to work as assistant teachers, known as
fellows, for two years in underprivileged schools. Deutsche Post DHL is supporting
Teach For All’s goal to expand the network to over 30 countries by the year 2013. In
addition, we are working closely with six country organisations in Argentina, Chile,
Germany, India, Peru and Spain. A further partnership in Brazil is planned for 2012.
• sos Children’s Villages: Th is partnership fosters the empowerment and employabil-
ity of young people between 15 and 25. We guide them in their preparations for
their careers and provide them with initial work experience. Since 2011, we have
partnerships in Brazil, Madagascar, South Africa and Vietnam. Th e programmes
are tailored to the precise needs in each country in co-operation with the partner
organisation. Other countries are to follow.
• UPstairs: We off er our employees’ children the opportunity to earn a higher school-
leaving qualifi cation or degree through scholarships. In the year under review,
60 scholarships were awarded in South Africa, Mexico, Indonesia and Romania. In
the year 2012, UPstairs will be introduced in at least 60 countries. We shall increase
the number of scholarships to over 1,000 by the year 2014.
Procurement
Rise in expenditure
In the year under review, the Group centrally purchased goods and services having
a total value of approximately €9.1 billion (previous year: €8.5 billion). As in previ-
ous years, this fi gure does not include transport services, which are generally procured
separately by the divisions. However, the divisions received support from Procurement,
which was greater in 2011 than in previous years. Procurement works continuously to
reduce the Group’s expenditures and this includes providing support to the divisions to
make important investments cost-eff ectively.
Corporate Procurement, for instance, has been providing support in the area of
aviation since 2011, including involvement in the purchase of 18 new Airbus A300-600
aircraft . A further example is a master agreement for aircraft fuel, into which the depart-
ment entered for European Air Transport, an express business and a Group subsidiary
operating out of the hub in Leipzig, Germany. Th e agreement reduces annual costs by
more than €1 million; the fuel can be called off as needed and fewer fuel transports
increase energy effi ciency.
Th e procurement team supported the MAIL division in the reporting year with the
selection and order placement of new sorting solutions. Capacity and processing speed
increased by around 40 % as a result during the testing phase.
dp-dhl.com/en/responsibility/society/global_partnership_with_teach_for_all.html
dp-dhl.com/en/responsibility/society/global_partnership_with_sos_childrens_villages.html
a.69 Procurement expenses, 2011
Volume: €9.1 billion
26 % Services
14 % it and communications
13 % Ground fl eet
8 % Network supplies
29 % Real estate
7 % Production systems
3 % Air fl eet
Deutsche Post DHL Annual Report 201190

Procurement again focused on evaluating key suppliers and developing the Group’s
relationships with them. Th e new fi nancing and payment model which we have been
testing in co-operation with a bank since 2010 in Germany and other European countries,
was expanded in the reporting year. Th e Group benefi ts from this new model because it
allows the divisions to optimise their working capital. Our suppliers also benefi t as the
model opens up advantageous fi nancing options.
Procurement makes progress as an internal service department
Procurement is a centralised function in the Group. Th e heads of Global Sourcing
and their 14 category managers work closely with regional procurement managers and
report to the head of Corporate Procurement. Th is allows us to bundle the Group’s
worldwide requirements and still meet the local needs of the business units.
Procurement is an internal service department, which we reorganised to some
extent in the reporting year. We reduced the number of procurement regions from fi ve
to four and we now take greater advantage of regional co-operations. In our Global
Sourcing departments, we consolidated product categories and thereby leveraged syn-
ergies. Furthermore, a category manager was named for “new procurement services”.
Th ese new services also include procurement services provided by our operating
divisions for customers with increasing support from Procurement. We off er integrated
procurement and logistics services, especially in our supply chain business. In 2011, we
expanded these services in all of our procurement regions.
Environmentally aware procurement
A “green team” of staff members from a number of regions and product categories
makes sure that the purchasing decisions made take account of environmental aspects.
In 2011, we completed a comprehensive analysis to determine how much of the
electricity consumed by the Group stems from renewable energy sources. Th e result
was around 40 % worldwide. Th e goal is to increase this fi gure considerably. Th e project
team has developed some initial national-level initiatives.
We had already introduced a global paper policy in 2010, stipulating that priority
was given to purchasing and using recycled paper. It applies to purchases of paper, paper
products, printed materials and packaging materials, and any external service provider
making purchases for the Group must also observe this policy. During the past years, the
share of recycled paper in use by the Group increased continuously. Th e Group has made
a commitment to use paper and paper products as effi ciently and sparingly as possible.
Procurement also supports the divisions with recycling projects. For example, waste
recycling was optimised at 15 Global Mail locations in the Americas region.
Continuous modernisation of our vehicle fl eet also plays an important role in pro-
tecting the environment. For example, 1,300 new low-emission Mercedes-Benz Sprinters
were utilised for parcel delivery. Th e 3.5-tonne vans run on low-emission Euro-5 engines.
Most of the vehicles purchased in the reporting year contribute to lower emissions,
including 250 lorries from Iveco, Mercedes-Benz, MAN and DAF. 154 new vehicles which
emit fewer pollutants were added to our express fl eet in Mexico.
Deutsche Post DHL Annual Report 2011
Group Management ReportNon-Financial Performance Indicators
Procurement
91

We are testing vehicles with environmentally friendly drive systems in a number
of test projects. Of particular note are the electric vehicles being tested for mail and
parcel delivery in Germany. A total of six electric scooters and 53 electric-powered vans
are currently being evaluated. In the greater Berlin area, ten electric urban delivery
vehicles were in operation for testing in the reporting year. We are also testing 12 Renault
Kangoos, 18 Mercedes-Benz Vito E-Cells and 13 Iveco Electric Dailys. Our delivery vehi-
cle fl eet in New York’s Manhattan was converted to hybrid and electric vans. As a result
we anticipate our CO2 emissions will be reduced by half compared with conventional
vehicles.
In the lorry category, we began in the reporting year to test the next generation of
Mercedes-Benz Atego hybrid vehicles. DHL Express trialled the SmartTruck for the fi rst
time outside Germany in the megacity of Bangalore in southern India. Th ese trials were
preceded by successful test runs in Berlin and the Cologne/Bonn area.
Greater use of procurement systems
Th e use of IT applications to procure goods and services more effi ciently again
increased in 2011. Our GeT electronic ordering system, for instance, was used mainly
in Germany, the United States, Mexico and several other European countries. Use of
the system increased over the year and it was prepared for launch in Asia, where it is
scheduled to be introduced in 2012.
We also use e-sourcing to make our procurement processes more effi cient and trans-
parent. Th is allows us to handle all the steps in the tender process electronically. To foster
adoption of the system, we set up a help desk in eight languages to assist suppliers. Th e
system, administered by a central team, is now also being used in other countries.
Research and development
As a service provider, the Group does not engage in research and development
activities in the narrower sense and therefore has no signifi cant expenses to report in
this connection.
Customers and quality
Innovative technology translates into competitive advantage in the mail business
We operate a fi rst-class, effi cient and environmentally friendly nationwide transport
and delivery network in Germany consisting of 82 mail centres and 33 parcel centres
that process 65 million letters and some 2.9 million parcels each working day. In the
reporting year, we slightly increased the high level of automation in our mail business,
which is over 90 %.
Our customers rate the quality of our services based on whether posted items reach
their destinations quickly, reliably and undamaged. We again achieved excellent results
in letter transit times within Germany: according to surveys conducted by Quotas, a
quality research institute, well over 95 % of the letters posted during our daily open-
ing hours or before fi nal post box collections are delivered to their recipients the next
day. In order to ensure this level of quality in the long term, our quality management
is based on a system that is certifi ed each year by TÜV Nord, a recognised certifi cation
and testing organisation.
Deutsche Post DHL Annual Report 201192

In the parcel business, we nearly achieved the previous year’s very good transit time
results. Just under 90 % of the deliveries we collected from business customers reached
their destination the next day. Since 2008, our internal system for measuring parcel
transit times has been certifi ed by TÜV Rheinland.
For international letters, transit times are determined by the International Post
Co-operation. According to EU specifi cations, 85 % of all cross-border letters posted
within the EU must be delivered within three days of posting. We exceeded this specifi -
cation signifi cantly with a rate of 96 %.
Our E-Postbrief product meets high data protection and security standards as
described in the risk report. Furthermore, Kommission für Jugendmedienschutz der
Landesmedienanstalten (German Commission for the Protection of Minors in the
Media) certifi ed the product’s age-control mechanism with the highest possible level
of quality.
Due to our co-operation with retailers, our approximately 20,000 retail outlets and
sales points have increased average weekly opening times from 49 to 50 hours. Surveys
of our retail outlet customers are conducted annually by the TNS Infratest Kunden-
monitor Deutschland, the largest consumer satisfaction study in Germany, to determine
their level of satisfaction with our services. Our service quality has been receiving top
marks for years. In the reporting year, we maintained our high marks from the previous
year: more than 90 % of customers were served within three minutes. Overall, impartial
mystery shoppers tested our retail outlets approximately 30,000 times over the year for
the study using a method certifi ed by TÜV Rheinland.
A central characteristic of the quality of our products is also environmental protec-
tion. In Germany, we employ a TÜV Nord-certifi ed environmental management system
in our mail and parcel businesses. As part of our GoGreen initiative, we off er private and
business customers climate-neutral shipping options. We are also testing vehicles with
hybrid and electric drive technology as well as energy-saving lighting in our facilities.
Service quality translates into competitive advantage in the express business
As in the past, our chief priority in 2011 was to deliver the best-possible service
quality to our customers. Th is objective places high demands on our products, processes,
infrastructure and employees. We track the ever-changing requirements of our custom-
ers and measure our services proactively and reactively, by, for instance, using mystery
shoppers and by maintaining a dialogue with customers on various media platforms.
As part of our First Choice initiative, we work steadily on improving our internal and
external processes. For instance, an employee survey taken at our largest customer in
the UK indicated a need to make some changes in customer service. In response, we set
up a separate service hotline for the customer and trained our employees accordingly.
Any problems that arise can now be handled much more quickly. Th e satisfi ed customer
subsequently extended its contract.
As experts in the international express business, we also off er solutions for small and
medium-size enterprises. Since 2011 we have been providing them with comprehensive
shipping information simply and transparently on our website under Small Business
Solutions.
Opportunities and risks, page 107
Corporate responsibility, page 88 f.
Strategic focus, page 111
dhl.com
Deutsche Post DHL Annual Report 2011
Group Management ReportNon-Financial Performance Indicators
Customers and quality
93

We are able to track shipments worldwide and dynamically adjust our processes
using state-of-the-art quality control centres. Should unforeseen events occur, fl ight
and shipment routes, for example, can be altered immediately. In the case of sensitive
shipments, we immediately take all necessary measures to ensure that the items reach
the recipient at the agreed time and in the agreed quality. It has been part of our standard
procedure in further improving our service to track all premium products, for example
Medical Express shipments, at our quality control centres until they are delivered.
Operational safety, compliance with standards and the quality of service at our facili-
ties are reviewed regularly. Around 170 locations have been certifi ed by the Transported
Asset Protection Association (TAPA), one of the world’s most renowned safety associ-
ations. Th is has also applied to all gateways in the United States since 2011. In 2010, we
began recording all certifi cation processes using a uniform system and managing them
globally. Since then we have been ISO 9001-certifi ed in Europe. Moreover, we meet the
fundamental ISO 14001 environmental management standard in 22 European countries.
We aim to achieve certifi cation pursuant to these two ISO standards in all regions and
all countries.
Customer proximity translates into competitive advantage
in the freight forwarding business
Striving to understand and fulfi l our customers’ expectations, we again surveyed
more than 19,000 participants in 47 countries to fi nd out how satisfi ed they are with
our services. Th ese key customers account for 69 % of total revenue in the GLOBAL FOR-
WARDING, FREIGHT division. Based on the results of the customer survey, all country
organisations have developed and implemented specifi c plans for improvements.
In making these improvements, we utilise the First Choice methodology aimed at put-
ting the customer at the centre of all our activities. In the year under review, we began
working with 18 of our top global customers to analyse and improve their processes as
part of our Customer Improvement Programme. We are currently developing similar
plans with another 52 customers. 780 individual activities started in 2011 have already
delivered upwards of €70 million in increased revenue as well as cost savings of over
€12 million.
Customers are becoming increasingly aware that our continuous improvement
process off ers them added value. For example, we received the Global Supplier Award
from ZF Friedrichshafen in November 2011, making us the fi rst logistics provider ever to
receive the award. ZF Friedrichshafen is a leading global automotive supplier for drive-
line and chassis technology with 121 production companies in 27 countries. In bestowing
the award, the company recognised its successful co-operation with us.
For a customer in the Electronics sector, we improved our on-time performance
from 92 % to 97 % and exceeded the customer’s expectations for shipping quantities by
more than 600,000 freight shipments annually.
For another customer in the European air freight sector we developed a dedicated
Aerospace Service Desk managing all infl ows and outfl ows of goods in the region. Th is
enhances the customer’s transparency regarding costs, transport and inventories.
For the Life Sciences & Healthcare sector, dhl Solutions and Innovations (dsi) intro-
duced smart sensor technology to monitor key functions such as temperature. Th e new
technology enables customers to obtain in-transit data related to their temperature-
sensitive goods.
Glossary, page 250
Strategic focus, page 111
Glossary, page 250
Deutsche Post DHL Annual Report 201194

Quality translates into competitive advantage in the supply chain business
Our goal is to lead the supply chain industry in every respect. We therefore imple-
ment practices and methodologies that provide our customers with the highest level of
service and the most added value. We use globally tested processes in order to off er our
customers everywhere comparable solutions and uniformly high service standards. Our
relentless drive to improve our processes has paid off , as witnessed by the results of a
customer survey from 2010: eight out of ten customers confi rm DHL as their provider
of choice in the supply chain business.
We have defi ned a number of performance indicators, such as safety, productivity
and inventory accuracy, which enable us to measure and monitor the quality of our
service. In 2011, we again achieved more than 95 % of our service standards worldwide.
In order to enhance and ensure the existing high quality of service to our customers,
in 2011 we implemented the Path to Quality programme as the quality management
system used within the supply chain business to ensure consistency, transparency, sim-
plicity and robustness of logistics processes. Customers recognise the benefi ts of the
results achieved using the Path to Quality system, which was featured in Quality World,
a trade publication.
Brands
Value of our brands growing steadily
A high level of awareness and a positive brand image are very important for our suc-
cess as a global service provider. Th is is why we work continuously to ensure professional
brand management. In line with our Strategy 2015, we are optimising our position as
Die Post für Deutschland (the postal service for Germany) and the logistics company for
the world, and independent studies show that we are on the right track.
a.70 Brands and business units
Deutsche Post DHL
Division mail expressglobal forwarding,freight supply chain
Brand
Brand area
Deutsche Post
• Mail Communication
• Dialogue Marketing
• Value-Added Services
• Press Services• Philately• Pension Services
dhl
• Global Mail• Parcel
Germany
dhl
• Express
dhl
• Global Forwarding
• Freight
dhl
• Supply Chain
Sub-brand • Williams Lea
Deutsche Post DHL Annual Report 2011
Group Management ReportNon-Financial Performance Indicators
Brands
95

In 2011, consulting company Semion Brand-Broker calculated Deutsche Post’s brand
value to be €12,946 million. Th e 2 % increase in value ranks us number six amongst the
most valuable German brands for the second time in a row. Factors analysed included
fi nancial value, brand protection, brand image and brand strength.
In the Global 500 rankings of Brand Finance plc, London, a UK market research
company, the DHL brand climbed 16 places from number 107 in 2010 to number 91 in
2011. Brand Finance calculates current brand value by benchmarking the strength, risk
and future potential of a brand relative to the competition. Th e study put the brand
value of DHL at US$9.78 billion in 2011, up from US$7.30 billion in the previous year.
Employees shape the image of the Deutsche Post brand
Th e way in which our employees perform their daily tasks and conduct themselves
towards customers has a lasting impact on the brand image of Deutsche Post. In the
year under review, we continued to support our employees in acting as active ambas-
sadors of our brand. For example, we promote their identifi cation with the brand via
an internal motivational platform known as the Deutsche Post Fan Club. We provide
employees with sports clothing, support their participation in recreational sports and
group excursions to events that we sponsor. Th is includes the popular Deutsche Touren-
wagen Masters (DTM – German Touring Car Masters) race series. Our sponsoring and
logistics partnership with DTM will continue and be used extensively in our internal and
external brand communications.
At the end of 2011, we launched what is known as the “Extranet” to provide informa-
tion to our many employees without internet access at work. Th e Extranet allows them
to access company feature content from their personal computers.
e-Postbrief product successfully promoted
We use our position as an offi cial partner of Deutscher Fußball-Bund (DFB – the
German football federation) to promote the Deutsche Post brand. Along with ongo-
ing participation in the DFB Cup, in 2011 we were a premium partner for the women’s
national team and a national sponsor for the FIFA Women’s World Cup, successfully
promoting the E-Postbrief in an integrated campaign. According to an external study,
Deutsche Post had the highest level of awareness of all German world cup sponsors. An
internal market study indicated that the brand had reached its highest popularity level
since we began recording data in 2009.
We also used our new partnership with the Deutsche Post Marathon Bonn 2011 as
a communication platform for the E-Postbrief. Our sponsorship of this major sport-
ing event shows our support of the city in which our Group is headquartered. Several
hundred of our employees took part in the marathon.
Sharper focus on dhl brand
During the reporting year, we aligned the DHL brand strategy more closely with our
business strategy and targeted our international campaigns towards greater emphasis
on DHL as the umbrella brand.
Deutsche Post DHL Annual Report 201196

In 2011 DHL continued its global integrated brand campaign, which targets top deci-
sion makers in large corporations. Th e main message of the campaign is our customer
promise to off er simplifi ed services and sustainable solutions.
Since May 2011, DHL has also been carrying out its global “international specialists”
campaign in 43 countries. Th e campaign focuses on our competence as a provider of
international express deliveries. Th e advertising campaign received the Stevie Award at
the 8th Annual International Business Awards in Abu Dhabi in the business services
category.
Partnerships strengthen dhl brand
In addition to traditional advertising, we continue to use sponsorships as a vehicle to
strengthen our brand image. In 2011, we maintained our proven international logistics
partnerships with Formula 1, IMG Fashion Weeks and the Leipzig Gewandhausorchester.
DHL was also involved in the Volvo Ocean Race for the fi rst time. Likewise, we
became a main sponsor and the offi cial logistics partner of Manchester United. As the
offi cial logistics partner of the 2011 Rugby World Cup in the autumn of 2011 in New
Zealand, DHL was also able to showcase its brand.
All together, we took part in some 120 events in 40 countries in the reporting year
as part of the DHL partner programme, bringing our logistics solutions to life.
FURTHER DEVELOPMENTS
Report on post-balance-sheet date events
Net profi t and dividend unaffected by eu state aid ruling
On 25 January 2012, the European Commission concluded the formal state aid
investigation that it had initiated on 12 September 2007. Th e issues are described in detail
in the Notes. According to its decision, the Commission is requiring Deutsche Post AG
to repay this state aid to the Federal Republic of Germany in the amount of €500 mil-
lion to €1 billion, plus interest. No other state aid proceedings involving the Group are
pending at the European Commission. Deutsche Post AG is of the opinion that the
European Commission’s decision of 25 January 2012 cannot withstand legal review and
will appeal to the European Court of Justice in Luxembourg. Accounting will take place
in accordance with the envisaged procedures.
Postbank transaction to be completed soon
Th e procedure to exercise the put option on 12.1 % of Deutsche Postbank AG shares
was initiated in January 2012.
Note 51
Deutsche Post DHL Annual Report 2011
Group Management ReportFurther Developments
Report on post-balance-sheet date events
97

OUTLOOK
Overall assessment of expected performance
Our strong position as market leader in the German mail and parcel business and in
nearly all of our logistics activities is the best possible basis for our further growth. We
expect consolidated EBIT for full-year 2012 to reach between €2.5 billion and €2.6 bil-
lion, assuming that the world economy will grow by 3 % to 3.5 % and world trade will
exceed that growth. Th e MAIL division is likely to contribute between €1.0 billion and
€1.1 billion to consolidated EBIT. Compared with the previous year, we expect an ad-
ditional improvement in overall earnings to approximately €1.9 billion in the DHL divi-
sions. At around €–0.4 billion, the Corporate Center / Other result should be on a par
with the previous year. Consolidated net profi t before eff ects from the Postbank trans-
action is expected to continue to improve in 2012 in line with our operating business.
Opportunities and risks
OPPORTUNITY AND RISK-CONTROLLING PROCESSES
Uniform reporting standards for opportunity and risk-controlling processes
As an internationally operating logistics company, we are faced with numerous
changes. Our aim is to identify the resulting opportunities and risks at an early stage
and to manage them with the goal of achieving a sustained increase in enterprise value.
Our Group-wide opportunity and risk control system facilitates this aim. Each quarter,
our managers estimate the impact of future scenarios and evaluate the opportunities and
risks in their departments. Risks can also be reported at any time on an ad hoc basis. Th e
approvals required by the risk management process ensure that management is closely
involved at diff erent hierarchical levels.
Our early identifi cation process leads to uniform reporting standards for risk man-
agement in the Group. We make constant improvements to the IT application used for
this purpose. We also use a Monte Carlo simulation for the purpose of aggregating risk
in standard evaluations.
Th is stochastic model takes the probability of occurrence of the underlying risk and
rewards into consideration and is based on the law of large numbers. For each risk, one
million randomly selected scenarios are combined with each other from the distribution
functions for the individual risks. Th e resulting totals are shown in a graph of frequency
of occurrence, which thus acts as an indication of the probability of budget deviations for
each unit reviewed. Th e graph indicates a smaller range between the absolute extreme
scenarios within which the earnings for the division have a high probability of falling.
Th e following graph shows an example of such a simulation:
Deutsche Post DHL Annual Report 201198

Th e most important steps in our opportunity and risk management process:
1 Identify and assess: Opportunities and risks are defi ned as potential deviations from
projected earnings. Managers in all divisions and regions provide an estimate of
our opportunities and risks on a quarterly basis and document relevant actions.
Th ey use scenarios to assess best, expected and worst cases. Each identifi ed risk is
assigned to one or more managers, who assess it, monitor it, specify possible pro-
cedures for going forward and then fi le a report. Th e same applies to opportunities.
Th e results are compiled in a database.
a.71 Monte Carlo simulation
Frequency of occurrencein one million simulation steps (incidence density)
Bandwidth with 95 % probability
– aa € m + bb € m + zz € m
Deviation from planned ebit
Planned ebit Most common value in one million simulation steps (“mode”) “Worse than expected” “Better than expected”
a.72 Opportunity and risk management process
Divisions Opportunity and risk-controlling processes Board of Management Internal auditors
1 Identify and assessAssess
Defi ne measures
Analyse
Identify
5 ControlReview results
Review measures
Monitor early warning indicators
Internal auditors review
processes
2 Aggregate and reportReview
Supplement and change
Aggregate
Report
3 Overall strategy / risk management / compliance
DetermineManage
4 Operating measuresPlan
Implement
Deutsche Post DHL Annual Report 2011
Group Management ReportOutlook
Opportunities and risks
99

2 Aggregate and report: Th e control units responsible collect the results, evaluate them
and review them for plausibility. If individual fi nancial eff ects overlap, they are
noted in our database and accounted for in the aggregation. Aft er being approved
by the department head, all results are passed on to the next level in the hierarchy.
Th e “aggregate and report” step is complete when Corporate Controlling reports to
the Group Board of Management on the signifi cant opportunities and risks as well
as any overall impact each division might experience. In addition, opportunities
and risks are aggregated for key organisational levels. We use two methods for this.
In the fi rst method, we calculate a possible spectrum of results for the divisions
and add the respective scenarios together. Th e totals for “worst case” and “best case”
indicate the total spectrum of results for the division in question. Within these ex-
tremes, the total “expected cases” shows current expectations. Th e second method
involves use of a Monte Carlo simulation, the results of which are regularly included
in the opportunity and risk reports to the Board of Management at the divisional
level.
3 Overall strategy: Th e Group Board of Management determines fundamental oppor-
tunities and risks to which the divisions are exposed and indicates how these can be
managed successfully. Th e reports made by Corporate Controlling provide a regular
basis of information for the overall management of opportunities and risks.
4 Operating measures: As part of the strategy, the divisions determine the measures to
be used to take advantage of opportunities and manage risks. Th ey use cost-benefi t
analyses to assess whether opportunities should be taken and whether risks can be
avoided, mitigated or transferred to third parties.
5 Control: For key opportunities and risks, early warning indicators have been defi ned
that are monitored constantly by those responsible. Corporate Internal Audit has
the task of ensuring that the Board of Management’s specifi cations are adhered to.
It also reviews the quality of the entire opportunity and risk management operation.
Th e control units regularly analyse all parts of the process as well as the reports from
Internal Audit and the independent auditors with the goal of identifying potential
for improvement and make adjustments where necessary.
Internal accounting control and risk management system
(disclosures required under section 315 (2), number 5 of the Handelsgesetzbuch
(hgb – German Commercial Code) and explanatory report)
Deutsche Post DHL uses an internal accounting control system to ensure that Group
accounting adheres to generally accepted accounting principles. Th is system is intended
to make sure that statutory provisions are complied with and that both internal and
external accounting provide a valid depiction of business processes in fi gures. All fi gures
are to be entered and processed accurately and completely. Accounting mistakes are to
be avoided in principle and signifi cant assessment errors uncovered promptly.
Deutsche Post DHL Annual Report 2011100

Th e control system design comprises organisational and technical measures that
extend to all companies in the Group. Centrally standardised accounting guidelines
govern the reconciliation of the single-entity fi nancial statements and ensure that in-
ternational fi nancial reporting standards (EU-IFRS s) are applied in a uniform manner
throughout the Group. All Group companies are required to use a standard chart of
accounts. Oft en, accounting processes are pooled in a shared services centre in order
to centralise and standardise them. Th e IFRS fi nancial statements of the separate Group
companies are recorded in a standard, SAP-based system and then processed at a central
location where one-step consolidation is performed. Other components of our control
system include automatic plausibility reviews and system validations of the accounting
data. In addition, manual checks are carried out regularly at a decentralised level by
those responsible locally (by a chief fi nancial offi cer, for example) and at a central level
by Corporate Accounting and Reporting, Taxes and Corporate Finance at the Cor porate
Center. Over and above the aforementioned internal accounting control system and
risk management structures, Corporate Internal Audit is an essential component of
the Group’s controlling and monitoring system. Using risk-based auditing pro cedures,
Corporate Internal Audit examines the processes related to fi nancial reporting and
reports its results to the Board of Management. Upstream and downstream checks and
analyses of the reported data are performed under chronological aspects. If necessary, we
call in outside experts, for instance, in the case of pension provisions. Finally, the Group’s
standardised process for preparing fi nancial statements using a centrally administered
fi nancial statements calendar guarantees a structured and effi cient accounting process.
OPPORTUNITIES
Opportunities arising from market trends and our market position
Some of the Group’s primary opportunities lie in continuing to develop our markets
as well as in our strategic positioning. We want to be the provider of choice for custom-
ers, which is why we are aligning our services even more closely to their needs. We are
also improving our cost structures and processes.
A number of key factors have a strong impact on our business and open up numer-
ous opportunities.
Th e most important of these are our prospects for further growth. Advancing glo-
balisation means that the logistics industry will continue to grow much faster than
national economies. We therefore anticipate attractive growth rates in all of the logistics
sectors in which we operate. Th is is especially true of Asia, where trade fl ows will con-
tinue to increase both within the continent and to other regions. We will benefi t from
this more than most given that our DHL divisions are better positioned in Asia than our
competitors. Th is also applies to regions such as South America and the Middle East,
which continue to see robust growth. We are well positioned in the emerging economies
of Brazil, Russia, India, China and Mexico (BRIC + M) and want to take advantage of
arising opportunities.
Deutsche Post DHL Annual Report 2011
Group Management ReportOutlook
Opportunities and risks
101

Further growth prospects will result from closer co-operation between the DHL
divisions. We off er integrated logistics and transport solutions from a single source
to an ever-increasing extent, which gives us a major competitive advantage. DHL
Solutions & Innovations (DSI) pools expertise within DHL and uses it to develop new
solutions across the Group. Sector Management is our method of developing solutions
for customers in selected industries as well as services tailored to the requirements of
rapidly growing regions and customer segments. Against this backdrop we have created
the new Chief Commercial Officer position that combines all cross-DHL initiatives, includ-
ing our central key account management and innovations.
Online communication and e-business are creating demand for transporting docu-
ments and goods. Th is in turn creates growth opportunities for us in our mail and parcel
businesses.
Finally, environmental awareness on the part of customers brings opportunities for
above-average growth. Customers want to reduce their carbon emissions permanently,
which is why they are increasingly requesting energy-effi cient transport and climate-
neutral products. We lead our sector in this area, off ering carbon-neutral mail, parcel
and express products plus air and ocean freight transport.
Utilising our employees’ ideas
As part of the Idea Management programme our employees have over the past years
suggested many new products and process improvements. Th is promotes corporate
innovation and allows cost savings to be made.
Opportunities in the divisions
In the strategic focus section, we have described the market opportunities we see in
the various divisions and the strategies and goals we are pursuing to take advantage of
these opportunities.
RISKS
Risk categories and specifi c risks
Th e risks set out in the following are those which we presently consider to have a
signifi cant, potentially negative, impact on our earnings, fi nancial position and assets
and liabilities. Th ey are not necessarily the only risks to which the Group is exposed.
Our business activities could also be adversely aff ected by additional factors of which
we are currently unaware or which we do not yet consider to be material.
Risks arising from the political and regulatory environment
Risks associated with the general business environment primarily arise from the fact
that the Group provides some of its services in a regulated market. A large number of the
services rendered by Deutsche Post AG and its subsidiaries are subject to sector-specifi c
regulation by the Bundesnetzagentur (German federal network agency) pursuant to the
Postgesetz (PostG – German Postal Act). Th is regulatory authority approves or reviews
prices, formulates the terms of downstream access and undertakes special monitoring
of market abuse. Th e general regulatory risk could lead to a decline in revenue and
earnings in the event of detrimental decisions.
Business activities and organisation, page 30
Employees, page 86
Strategy and goals of the divisions, page 112 ff.
Glossary, page 250
Glossary, page 250
Deutsche Post DHL Annual Report 2011102
In 2011, the regulatory authority announced a benchmark decision specifying the
conditions that would apply in 2012 and 2013 to regulation under the price-cap pro-
cedure for mail prices requiring approval. Th is stipulates that the general rate of infl a-
tion and the expected productivity growth rate for Deutsche Post AG are the key factors
applicable to mail prices subject to approval. Prices must be lowered if the infl ation
rate in the reference period is lower than the productivity growth rate specifi ed by the
regulatory authority. In the year under review, the regulatory authority approved the
prices to be charged in 2012 for the products regulated under the price-cap procedure.
Th e German tax authorities have announced their intention to qualify several VAT-
exempt mail products retroactively as subject to VAT. We assume that amended tax
assess ments will be reissued for all open tax periods. Th e VAT exemption for postal
services is based on European law (postal services directive, VAT directive) and national
German law (Postgesetz – Postal Act), the Post-Universaldienstleistungsverordnung
(Postal Universal Service Ordinance) and the Umsatzsteuergesetz (Value Added Tax
Act)). Based on these laws, Deutsche Post AG classifi es its postal services either as VAT-
exempt or VAT-liable. Th e German tax authorities have reviewed this assessment over
the years and have not objected to it. Should the VAT tax assessments be amended, we
shall take legal action where appropriate. Despite our view that the products’ exemption
complies with current European and German law, we cannot rule out the possibility of
additional tax payments.
Since 1 July 2010, as a result of the revision of the relevant tax exemption provi-
sions, the VAT exemption has only applied to specifi c universal services in Germany
that are not subject to individually negotiated agreements or provided on special terms
(discounts etc.). Deutsche Post AG does not believe that the legislative amendment fully
complies with the applicable specifi cations of European Community law. Due to the
legal uncertainty resulting from the new legislation, Deutsche Post AG is endeavouring
to clarify certain key issues with the tax authorities. Although Deutsche Post AG has
implemented the required measures to a large extent, in the event of diff ering legal
opinions on the part of Deutsche Post AG and the tax authorities, Deutsche Post AG will
consider pursuing the matter in court.
Risks arising from market and sector-specifi c conditions
In addition to the regulatory environment, market and sector-specifi c conditions
have a signifi cant eff ect on the business performance of the Group.
We pay close attention to economic trends in all regions, particularly in the indus-
trial countries. Despite the volatile climate, demand for logistics services rose in 2011
and our revenues increased accordingly. However, we cannot rule out the possibility
of an economic downturn in specifi c regions and a stagnation or decrease in transport
quantities.
Th e national debt crisis in the euro zone represents another element of uncertainty,
not only for logistics companies, and has lowered economic expectation. Cost fl exibil-
ity is therefore becoming increasingly necessary to allow a fast response to changes in
market demand.
Deutsche Post DHL Annual Report 2011
Group Management ReportOutlook
Opportunities and risks
103

In recent years, the Group has taken measures to achieve a high level of cost fl ex-
ibility. Even though experts see a substantial risk of an economic downturn in 2012, we
regard the likelihood of this signifi cantly aff ecting our forecast earnings as low due to
our sound preparations, the experience we gathered during the last economic crisis and
our global presence.
Th e probability of customer insolvencies is at a normal low level, for which reason
we do not anticipate any signifi cant losses due to insolvency on the part of customers
from a current perspective.
Key factors for success in the mail and logistics business are quality, customers’
confi dence in their business partners and competitive prices. Due to our high quality
and the savings generated in recent years, we consider ourselves in a position to keep
any potential risk to our projected earnings from competition at a fairly low level. Our
various Group initiatives also play a key role in securing our strong competitive position.
Security risks
According to security agencies, terrorism presents a particularly high risk for the
western world. However, no specifi c threats to people, institutions or enterprises are
known to us at present. We nonetheless share the assessment of the authorities and take
the heightened security risk seriously. For this reason, we analyse global threat levels on
an ongoing basis and conduct regular reviews of our security concepts, adapting them
where necessary.
Aft er package bombs were posted from Yemen and Greece in 2010, postal com-
panies and government authorities all over the world agreed to increase air traffi c
security. Deutsche Post DHL’s security concepts fulfi l the statutory requirements, as
confi rmed by numerous reviews by the authorities. Moreover, we shall continue to work
together with all relevant security agencies, air traffi c authorities, representatives of
national legislative authorities and industry associations in order to ensure a high level
of security and a low probability of any signifi cant incidents occurring. Not only shall
we comply in full with all security guidelines and regulations enacted globally or by
individual countries or authorities, we shall also add our own high standards to them.
We intend to make a contribution to further improving all aspects of security in the
interest of our customers, business partners and employees.
Risks arising from corporate strategy
Over the past years, the Group has ensured that its activities are well positioned in
the world’s fastest growing regions and markets. We have also created effi cient structures
in all areas to allow us to fl exibly adapt our capacities and costs to demand as a pre-
requisite for lasting, profi table business success. With respect to the strategic orientation
of the Group, we are now focusing on our core competencies in the mail and logistics
businesses with an eye towards growing organically and simplifying our processes for
the benefi t of customers.
Deutsche Post DHL Annual Report 2011104

In the MAIL division, we are responding to the challenges presented by the structural
change from a physical to a digital business. We have counteracted the risk arising from
changing demand by expanding our range of services. Due to the e-commerce boom,
we expect our parcel business to continue growing robustly in the coming years and are
therefore extending our parcel network. We are also expanding our range of electronic
communications services, securing our standing as the quality leader and, where pos-
sible, making our transport and delivery costs more fl exible. We follow developments
in the market very closely. Although customer demand will change signifi cantly over
the long term, we regard the risk to successful operations in the MAIL division as low
due to the measures introduced.
In the EXPRESS division, our future success depends above all on general factors
such as trends in the competitive environment, costs and quantities transported. Aft er
having spent recent years successfully restructuring our business and substantially im-
proving cost structures, we are now focusing on growth in our international business.
We anticipate an increase in shipment volumes on routes to and from Asia in particular.
Based on this expected growth, we are making strategic investments into our network,
services, employees and the DHL brand. Against the backdrop of the past developments
and the overall outlook, we do not see any unusual strategic risk for the EXPRESS division.
In the GLOBAL FORWARDING, FREIGHT division, we purchase transport services
from airlines, shipping companies and freight carriers rather than providing them our-
selves. As a result, in a worst-case scenario there is a risk that we shall not be able to
pass on all price increases to our customers. Th e extent of the risk essentially depends
on the trend in the supply, demand and price of transport services as well as the dur-
ation of our contracts.
Our SUPPLY CHAIN division provides customers in a variety of industries with so-
lutions along the entire logistics chain. Our success is linked closely to our customers’
business trends. Since we off er customers a widely diversifi ed range of products in dif-
ferent sectors all over the world, we can diversify our risk portfolio and balance out the
incumbent risks. Moreover, our future success also depends on our ability to continu-
ously improve our existing business and to grow in our most important markets.
Risks arising from internal processes
Logistics services are generally provided in bulk. Th ey require a complex operat-
ing infrastructure with high quality standards to avoid any disruptions to the fl ow of
shipments. To consistently guarantee reliability and on-time delivery, processes must
be organised so as to proceed smoothly with no technical or personnel-related glitches.
Any weaknesses with regard to posting and collection, sorting, transport, warehousing
or delivery could seriously compromise our competitive position. We therefore adapt all
processes to current circumstances as needed. We also take preventive measures to guard
against disruptions or malfunctions in our operational processes. Should disruptions
nonetheless occur, contingency plans will go into eff ect to minimise the consequences.
Deutsche Post DHL Annual Report 2011
Group Management ReportOutlook
Opportunities and risks
105

As an example, back in 2005 we began formulating plans in all divisions to respond
to a pandemic emergency, including setting up an international crisis team. Although
the risk of a pandemic has declined since then, we still aim to minimise the risk of infec-
tion for our employees in the event of an emergency whilst maintaining our business
operations.
Overall, we regard the probability that the Group will experience signifi cant eff ects
due to downtime as low. In addition, some risks from downtime are reduced by our
insurance policies.
In addition, we use our First Choice methodology to continuously improve our
processes and align them even more closely to the requirements of customers. Should
this involve capital expenditure, the Board of Management decides on any sums in
excess of €25 million. Board of Management committees make decisions on investments
of more than €10 million, with a lower threshold of €5 million applying to Corporate
Center/Other. Th e Board of Management members are regularly informed of invest-
ment decisions so that they can identify any signifi cant risk early and take the necessary
countermeasures.
As a service provider, we do not conduct research and development in the narrower
sense. Th ere are therefore no material risks to report in this area.
Risks arising from information technology
Th e Information Security Committee is tasked with our Group-wide information
system security. To fulfi l this responsibility, it has defi ned standards, procedures and
guidelines based on ISO 27001, the international standard for information security
management. In addition, Group Risk Management, IT Audit, Data Protection and
Corporate Security assess and monitor IT risk on an ongoing basis. Th e goal is continu-
ous IT system operation and the prevention of unauthorised access to our systems and
databases.
Our operations can only run seamlessly if our essential IT systems are always avail-
able. To ensure this, we design our systems to protect against complete system failures.
In addition to data centres in Germany, we also operate two central data centres in the
Czech Republic and Malaysia, which allow us geographical separation and local replica-
tion of systems.
Access to our systems and data is limited. Employees can only access the data they
need to do their job. All systems and data are backed up on a regular basis and critical
data are replicated across data centres.
All soft ware is updated frequently to address bugs, close gaps in security and
increase functionality. We employ a patch management process, a defi ned procedure
for managing soft ware upgrades, to control risks that could arise from outdated soft ware
or from soft ware upgrades.
We make all eff orts to manage the low-probability, high-impact incidents in order
to provide the high level of service that our customers have come to expect. Despite
these measures, an element of risk involving medium to high fi nancial consequences
cannot be ruled out entirely.
Deutsche Post DHL Annual Report 2011106

Security is our pledge for the E-Postbrief product. All attempts to attack the soft -
ware have been repelled to date. In 2011, the product passed its fi rst surveillance audit.
Th is annual audit is carried out by the German Federal Offi ce for Information Security
in accordance with ISO 27001. In addition, the certifi cation and testing organisation
Technischer Überwachungsverein certifi ed that the E-Postbrief product complies with
data protection regulations.
Risks arising from environmental management
Our Group-wide risk management system also monitors environmental policy
developments. An example is the EU’s expansion of its emissions trading system to
include air traffi c. All airlines taking off from or landing in Europe are obliged to partici-
pate in this mandatory system from 2012 on. Th e system requires the airlines to submit
emissions rights on the basis of their actual CO2 emissions.
We believe that our Group is well equipped to limit any fi nancial risk thanks to
the GoGreen programme, which aims to improve our carbon effi ciency by 30 % by 2020
compared with 2007 levels. We modernise our aircraft fl eet and optimise our network
and load factor on an ongoing basis. Th ese measures are designed to save fuel and thus
reduce our carbon credit requirement. Aircraft operators are allocated emissions rights
free of charge on the basis of their 2010 transport quantities. Emissions rights must be
purchased at auction for any emissions not covered by the rights allocated. We consider
the fi nancial impact of these risks to be fairly low, despite the fact that their probability
of occurrence is relatively high.
Risks arising from human resources
Th e dedication and skills of our employees are essential to our future success. For
this reason, we want to become the employer of choice in our sector. Competition
remains high for qualifi ed specialists and executives. Demographic change means that
our staff are ageing, particularly in Germany, our largest market, and the pool of poten-
tial young talent is becoming smaller. Th e risk therefore exists that we shall not be able
to recruit and retain a suffi cient number of suitable employees.
In order to reduce this risk, we provide our employees with a motivating work
environment and off er them suitable opportunities to take part in professional and em-
ployee development programmes. Th e results of our annual employee survey show that
we continue to make progress in this area: compared with the previous year, employee
approval ratings for “working conditions” improved by three percentage points to 76 %,
and the ratings for “learning and development” rose by fi ve percentage points to 68 %.
In many countries, the age structure and social structures are undergoing a notable
shift and thus directly aff ecting the composition of the working population. To analyse
the changing situation, we have developed an instrument known as Strategic Workforce
Management, which supplies answers based on facts to questions such as the risks re-
lated to employees’ work capacity and aging.
Deutsche Post AG has entered into a Generations Pact with the trade unions to take
account of the changing employment structure. Th e Generations Pact enables older
employees to remain on the job whilst at the same time improving employment
opportunities for young people.
Corporate responsibility, page 87
Employees, page 82 f.
Employees, page 84
Deutsche Post DHL Annual Report 2011
Group Management ReportOutlook
Opportunities and risks
107

In 2011, we placed particular emphasis on increasing the share of women in manage-
ment positions. Our goal is to fi ll 25 % to 30 % of all management positions becoming
vacant with women in the future. Th is should also contribute to meeting our needs for
executives.
According to the United Nations and the World Economic Forum, there is a risk of
a substantial increase in chronic, i. e., non-contagious, diseases all over the world. We are
responding to this risk by continuously updating our health management programme,
which has received multiple awards. State-of-the-art health management helps us to
overcome the challenges of demographic change, become an employer of choice, assure
high productivity levels and assume social responsibility.
Although we fi nd the fi nancial impact of these risks to be moderate, we see the prob-
ability of occurrence as low due to the measures we have implemented.
Financial risks
Th e transaction to sell the shares in Deutsche Postbank AG held by Deutsche Post AG
was restructured on 14 January 2009. Th e amended agreement provides for sale of the
shares in three tranches.
Th e fi rst tranche involved the sale of 50 million Postbank shares via contribution
as a non-cash capital increase in return for 50 million hedged new shares in Deutsche
Bank AG, with any claims to payment of a purchase price for the shares thereby waived.
Th e Deutsche Bank shares were held by Deutsche Post AG for a short period and were
sold between April and July of 2009.
As at 31 December 2011, Deutsche Post AG was still in possession of 86,417,432
Postbank shares. In the second tranche, 60 million Postbank shares will be transferred in
exchange for a mandatory exchangeable bond subscribed to by Deutsche Bank AG with
a cash value at the time of closing of €2,568 million. Th e bond will be fully exchanged
aft er three years. It accrues interest at a rate of 4 % per year and will mature on 25 Feb-
ruary 2012.
Th e remaining 26,417,432 Postbank shares will be transferred via the exercise of call
and put options as agreed between Deutsche Post AG and Deutsche Bank AG. Both the
call and the put options can be exercised between the third and fourth years aft er the
date on which the agreement was concluded (25 February 2009). In January 2012, the
process to exercise the put option was initiated by Deutsche Post AG.
Th e changes in the fair value of the forward transaction (second tranche) and the
call and put options (third tranche) led to volatility on the balance sheet during the
fi nancial year. Until the shares are fully transferred, the changes in the fair value of the
options and the forward transaction will continue to impact net fi nancial income / net
fi nance costs. Th e risk involved is described in greater detail in the Notes to the consoli-
dated fi nancial statements along with information on other fi nancial risks. We do not
consider the risks described therein to represent a threat to the continued existence of
the Group as a going concern.
Note 48
Deutsche Post DHL Annual Report 2011108

Risks from pending legal proceedings
Th e European Commission’s decision of 25 January 2012 concluded the for-
mal state aid investigation that it had initiated on 12 September 2007. In its review
of the funding of civil servants’ pensions, the European Commission concluded that
Deutsche Post AG had received illegal state aid in this area. It said that the pension
relief granted to Deutsche Post AG by the Bundesnetzagentur during the price approval
process led to Deutsche Post AG having to pay lower social security contributions for
civil servants than its competitors pay for salaried employees, resulting in a benefi t
to Deutsche Post AG of between €500 million and €1 billion that it must repay to the
Federal Republic of Germany. Th e precise amount has to be calculated by the Federal
Republic. Deutsche Post AG is of the opinion that the European Commission’s decision
of 25 January 2012 cannot withstand legal review and will appeal to the European Court
of Justice in Luxembourg.
More information about the state aid proceedings and other information on legal risk
are provided in the Notes. We do not regard the risks ensuing from pending legal pro-
ceedings as representing a threat to the Group’s continued existence as a going concern.
Other risks faced by the Group
Our fi nancing and insurance strategy enabled us to make signifi cant savings in 2011
as well. It separates insurable risk into two groups.
Th e fi rst group comprises risks with a high probability of occurrence and low indi-
vidual cost. Th ese risks are insured via what is known as a captive, an insurance company
owned by the Group that is able to insure such risks at a lower cost than commer-
cial insurers. Th e majority of our insurance expenditure is incurred for this risk group,
which along with lower costs off ers other advantages. Costs remain stable as the Group is
less aff ected by changes in the availability and price of outside insurance. We receive reli-
able data on the basis of which we can analyse risk with a high probability of occurrence
and low individual cost. We can then set minimum standards and targets for such risk.
Th e second group consists of risks that have a low probability of occurrence but
could entail high losses, such as air transport risks. Th ese risks are transferred to com-
mercial insurers.
Audits are currently underway at DHL Express (USA) and Airborne Inc. under the
unclaimed property laws in the United States. According to these laws, unclaimed prop-
erty must either be returned to its rightful owner or the home country of the most recent
owner or, if this is not known, the country in which the company is domiciled. Th e
probability of a signifi cant fi nancial impact on the Group is fairly low.
Note 51
Deutsche Post DHL Annual Report 2011
Group Management ReportOutlook
Opportunities and risks
109

OVERALL ASSESSMENT OF RISK POSITION
No identifi able risks threatening the Group
Deutsche Post DHL is well positioned in terms of its operations. Strategically, the
Group is positioned to benefi t from momentum on the markets. We have laid the foun-
dation for the company to continue on an upwards path, regardless of whether the
economic upswing continues or economic output returns to normal. We are even well
prepared for a possible economic collapse given that in previous years we have further
optimised our cost structures and in many cases we can make them more fl exible. In
Germany, our future corporate profi ts could be aff ected by changes in the regulatory
conditions pertaining to the domestic mail market. On the whole, based on the Group’s
early warning system and in the estimation of the Board of Management of the Group, in
the past fi nancial year there were no identifi able risks for the Group which, individually
or collectively, cast doubt upon the Group’s ability to continue as a going concern, nor
are any such risks apparent in the foreseeable future.
Strategic focus
CORPORATE STRATEGY
Strong competitive position will support further growth
Deutsche Post DHL has operations all over the world. We off er our customers com-
prehensive services that extend to all modes of transport and all links in the supply
chain. We are the market leader in the German mail business and in nearly all of our
logistics activities. Th is strong competitive position is the best possible basis for our
further growth.
Achievements of Strategy 2015 are gauged regularly
Our Strategy 2015 has three objectives: we want to be the provider of choice for
customers, an attractive investment for shareholders and the employer of choice for our
staff . Our Group strategy is closely intertwined with the business strategies of our div-
isions. We take regular stock of the progress we make in terms of customer and employee
satisfaction as well as the growth and profi tability of our divisions.
As the largest company in our industry, we also take our environmental and social
responsibility seriously. Th e programmes and initiatives we have implemented in this
respect are summarised by our motto of “living responsibility”.
Since the manner in which a company’s employees act and behave is vital in deter-
mining its ability to perform at a high level, our guiding principle is “respect and results”.
Attaining fi rst-class results is a fundamental prerequisite for our becoming the employer
of choice for our employees, the provider of choice for our customers and the investment
of choice for our shareholders.
Strategy and goals of the divisions, page 112 ff.
Corporate responsibility, page 87
Deutsche Post DHL Annual Report 2011110

Good results achieved from growth and simplifi cation initiatives
Our Strategy 2015 is intended to help us to unlock our full potential. We also want
to make it as easy as possible for customers to meet their logistics requirements. In 2010
we therefore introduced Group-wide initiatives aimed at “growth and simplifi cation”.
Th e initiatives generated very good results in the year under review.
We aim for growth in our core products that exceeds the annual growth of their
respective markets by one to two percentage points. Our Sector Management solutions
for customers in selected industrial sectors have been especially successful, as have
been our services tailored to the needs of fast-growing regions and customer segments.
Against this backdrop, we have created the new position of Chief Commercial Officer, who
oversees all cross-DHL initiatives including our central key account management and
innovations.
With respect to the “simplifi cation” part of our motto, we have succeeded in im-
proving internal and external processes alike. We have grown and at the same time
measurably increased customer satisfaction by focusing our business activities even more
intently on the advantages off ered by our comprehensive range of products and our
global presence.
Taking Strategy 2015 to the next level
We adhere to our priorities of growth and simplifi cation in implementing our
Group strategy, both on a divisional level and in terms of selected cross-divisional issues.
Th e business strategies of the divisions provide the basis and are supplemented by the
following cross-divisional initiatives intended to increase the satisfaction of customers,
employees and investors:
• Chief Commercial Offi cer: Th e newly created position of Chief Commercial Officer will be
geared towards the industrial sectors in order to reinforce customer centricity in all
DHL business units. Our goal is to provide excellent consulting in industry-specifi c
solutions along with transparent, smoothly running processes at the customer in-
terface. Our account managers will be provided with the appropriate training and
central support to allow them to perform these duties with even greater success.
• bric + m: We are well positioned in the emerging economies of Brazil, Russia, India,
China and Mexico (BRIC + M) and want to take advantage of the opportunities pre-
senting themselves in these markets. Each month, workshops are held to discuss and
make decisions on strategic and tactical procedure. Th e workshops are supported
directly by the Group Board of Management.
• First Choice: Th us far our Group-wide initiatives to enhance service quality and
customer centricity have focused on using uniform instruments to improve internal
processes in particular. We shall continue to develop additional components with
the goal of ensuring a uniform management philosophy to support decentralised
change processes and decision-making processes.
• Finance: In the area of fi nance we plan to simplify processes and structures, inten-
sify our co-operation with business partners and increase application of the shared
services approach. Th is will allow us to improve our eff ectiveness and reduce our
fi nance costs.
Business activities and organisation, page 30
Customers and quality, page 92 ff.
Strategy and goals of the divisions, page 112 ff.
Business activities and organisation, page 30
Deutsche Post DHL Annual Report 2011
Group Management ReportOutlook
Strategic focus
111

• Personnel: We want to increase standardisation in our global personnel processes
and to simplify them even more in order to gain added resources for improving our
service quality in the future. We shall continue to promote diversity in the Group, to
improve co-operation between the divisions and to support cross-divisional career
moves. We also want to increase the share of women in executive positions. In con-
nection with a joint declaration by all DAX 30 companies, we have made it our goal
to fi ll 25 % to 30 % of all management positions becoming vacant with women.
• it: Given the increased importance of IT as a driver for product benefi ts and innov-
ations, our CEO has assumed responsibility for the Group-wide IT Board. Measures
have been agreed on to ensure that our IT will represent an even greater competitive
advantage in the future.
STRATEGY AND GOALS OF THE DIVISIONS
mail division
Th e following strategic approaches are how we aim to meet the challenges of our
business, both today and in the future. Our central goal is to ensure that our MAIL
division continues to make a stable contribution of at least €1 billion to the Group’s
earnings in the future.
• Making costs more fl exible: To achieve this goal, we are always adapting our networks
to changing market conditions and making costs more fl exible. We cut costs wher-
ever possible and sensible. We also retain the high quality of our services and protect
the environment. Ideally, we search for solutions that meet several goals at once: a
new generation of machines in our mail centres, for instance, not only raises the
level of automation and quality but also lowers production costs and carbon dioxide
(CO2) emissions. In our parcel business, a new production system allows us to sort
and transport parcels more effi ciently, saving costs along the way.
• Providing the highest quality to our customers: We want to off er our customers the
best service at the highest level of quality and at fair prices. We are, therefore, mod-
ernising the sorting equipment and IT architecture in our mail network on an on-
going basis. We are also investing in our parcel network and adapting it to increas-
ing volumes. We are working faster: 95 % of all items sent in Germany reach their
destination the next day. Moreover, our customers receive real-time track and trace
data and we are doing this with the environment in mind: the majority of our
delivery services in Germany will be completely carbon neutral in the future. Prox-
imity to our customers is important to us. We operate by far the largest network
of fi xed- location retail outlets in Germany, consisting of some 20,000 outlets and
sales points. Th is includes our network of around 2,500 Packstations. We are also
expanding our successful co-operation with retailers.
• Motivating our workforce: Th e key to high quality and high performance are happy
and dedicated employees, day in and day out. Th e 2011 collective agreement in
Germany established an innovative Generations Pact. We demonstrate how much we
value our people by listening to them, equipping them with state-of-the-art tools,
counselling them on health issues and, at some locations, making childcare available.
Glossary, page 250
Employees, page 84
Deutsche Post DHL Annual Report 2011112

• Tapping new online markets: We are taking advantage of our expertise in physical
communications to off er competent electronic communications. Th e internet is
already facilitating customers’ access to our services, allowing them, for example,
to calculate and purchase postage and also locate retail outlets and Packstations
online and by mobile telephone. We are investing in future growth areas in all
our businesses: beyond our E-Postbrief product, our platform for secure electronic
communications, we are active in the growing industry of online advertising. We
operate Europe’s largest platform for targeting (online advertising space marketing),
provide the largest online German marketplace for journalistic content, and we are
the fi rst parcel delivery service in Germany to operate its own online shop. New
user-friendly features beyond its basic features will be added to the E-Postbrief.
express division
Our “FOCUS” strategic programme extends to four areas:
• Employee motivation: Our employees are very important to us and constitute our
main competitive advantage in retaining current customers and winning new
ones. Our Certifi ed International Specialist (CIS) training initiative ensures that
employees have the requisite knowledge of the international express business at
their disposal. Th e programme additionally reinforces the team atmosphere in and
loyalty to the division. All employees in international shipping, whether couriers
or call centre staff , are expected to consider themselves DHL ambassadors and place
the customer at the centre of their work. We regularly honour employees who have
proved to be outstanding International Specialists through special achievements.
Since September 2011, all our employees have been CIS-certifi ed. Th ey are now being
trained in additional modules specifi c to their functions.
• Service quality: We are increasing our focus on promoting customer loyalty through
high service quality in order to diff erentiate ourselves from the competition. To
this end, we keep a constant eye on changing customer requirements and adapt our
services accordingly. We are improving our workfl ows to make us the provider of
choice when it comes to speed, reliability and cost-effi ciency. At our quality control
centres we track shipments globally and adapt processes dynamically to enable us to
guarantee quick delivery, even in the event of unforeseen circumstances. Reliability
and speed are vital to our position as experts in international shipping.
• Customer loyalty: Th e customer is always the focus of attention of our approximately
100,000 employees. We make it as easy as possible for our customers to give feed-
back on our performance, from conventional customer service to in-person surveys.
Moreover, we use our First Choice methodology constantly to review customer be-
haviour and customer response and to draw the necessary conclusions, starting with
the customer’s very fi rst contact with the call centre, internet site or sales employee
all the way to delivery of the shipment to the recipient and invoicing.
Glossary, page 250
Deutsche Post DHL Annual Report 2011
Group Management ReportOutlook
Strategic focus
113

• Profi tability: To ensure a stable earnings contribution and continue growing over
the long term, we monitor costs continuously and make sustainable investments in
our business. For instance, we are expanding and revamping our fl eet of aircraft to
enable us to off er additional and more frequent fl ight connections. An international
advertising campaign has been initiated to increase the name recognition of the DHL
brand. We also actively seek profi table business opportunities, for example through
the establishment of a new hub in Shanghai to expand our Asia business. We un-
cover potential and take measures accordingly to improve our earnings through
targeted monitoring of our portfolio. Each country and each location in our network
has contributed to these endeavours.
global forwarding, freight division
We are well positioned in our markets due to our global product off ering in air and
ocean freight and in overland transport. We aim to continuously achieve growth that
exceeds the market average and to consolidate our leading position. To achieve this goal,
we pursue three approaches:
Customer orientation and sector growth
We are in the process of strengthening our expertise and expanding our off ers for
individual sectors. In the Life Sciences & Healthcare sector, DHL has expanded its in-
frastructure footprint to encompass 27 competence centres. Th e 100 % acquisition of
LifeConEx is signifi cant in enhancing our service portfolio in this sector.
In the Engineering & Manufacturing sector, we now service European aerospace
customers’ needs via a single point of contact. In Asia, we have expanded our network
by adding stations in, for example, China, Singapore and New Zealand.
In the Retail sector, we have implemented several regional direct-to-store distribu-
tion concepts that reduce inventory levels and simplify customs clearance in multiple
destination countries. Th is solution is highly effi cient for retailers expanding into new
markets such as Asia.
In the Automotive sector, we decided to invest in setting up a network of compe-
tence centres. Th e centres commenced operations in January 2011 in China, India, the
USA, Germany, Brazil and Mexico with further ones planned. Th e objective is to ensure
that customers receive the highest level of operational excellence.
Increasing our presence in key and growth markets
We are increasing our international presence in all the areas in which we see the
greatest growth opportunities. In the key Chinese market, increasing domestic con-
sumption is moving the transport business inland. To capitalise on this trend, we added
four branches and 17 sales offi ces to our network in 2011. We have also continued to grow
in the south-east Asia market, having, for example, established additional branches in
Vietnam, Pakistan and Indonesia. We also set up 30 new connections for the lcl market
from Asia to Europe, in the Middle East, and to Latin America and Africa, accelerating
our cargo movement in these growing trade lanes. To leverage the benefi ts of increased
trade in the ASEAN free trade zone, we consolidated our network connecting Singa-
pore, Th ailand and Malaysia. Th e Asia Connect service also opens the door for the
future setup of road freight between China and south-east Asia. In the United States,
we invested in eight new sales locations and further expanded our air freight trade lane
traffi c from North America to Russia, India, China, Mexico and South Korea.
Brands, page 97
Glossary, page 250
Deutsche Post DHL Annual Report 2011114

In Europe, we established in the Global Forwarding business unit direct export
services from Central and Eastern Europe to Asia via the port of Koper in Slovenia.
Customers who forward their LCL transports via Koper achieve signifi cantly shorter
transit times than those available on routes through ports in northern Europe.
To simplify our air freight services between Europe and North America, we launched
Liberty STAR in May 2011. Th is product off ers air freight shipments between the two
continents with defi ned transit times and at all-inclusive rates.
Arranging processes effi ciently
We are in the process of creating the necessary basis for providing the highest level
of operational excellence. For example, we have signifi cantly reduced the complexity of
our information technology. For key customers, we are making increasing use of stand-
ardised IT applications and thus considerably enhancing the transparency of transport
routes and costs. Our customer self-service portal, DHLi.com, is being adopted by a
rising number of customers.
In order to reduce costs and simplify the IT landscape, we have decommissioned
approximately 10 % of our legacy applications and reduced our corresponding invest-
ments. Th e cost savings are being invested in several initiatives to standardise our busi-
ness processes and make them more effi cient, thus allowing seamless interaction of all
global IT applications with future target environments, standardised IT support and
automated soft ware updates. In addition, we have launched a global programme for
harmonising our hardware. We are prepared to accept short-term hindrances to earn-
ings growth for the sake of these measures.
supply chain division
Our Growth Th rough Excellence strategy introduced in 2010 is based on two main
pillars:
1 Continuous improvement of our existing business.
2 Profi table growth in our key sectors and solutions.
1 Continuous improvement: We intend to keep improving in the areas of performance,
effi ciency and capability and have established three initiatives to support this aim:
Operations Excellence, Cost Leadership and Organisational Capability. With our
Operations Excellence programme, we promote operational and technical stand-
ards aimed at guaranteeing the sustainability of our performance. We also apply
the proven First Choice methodology to sustain the achievements we have realised
and improve on them even further. Our Cost Leadership initiative is intended to
reduce costs signifi cantly and to manage them eff ectively in order to increase our
overall profi tability. We achieve this by leveraging purchasing effi ciency, operating
discipline and best practices. We thus succeeded in substantially reducing our di-
rect costs in 2011. Organisational Capability seeks to develop leadership qualities
and enhance employee commitment. We want to attract new talent and retain and
develop our existing talent. To this end, we have launched a top talent management
programme.
Strategic focus, page 111
Deutsche Post DHL Annual Report 2011
Group Management ReportOutlook
Strategic focus
115

2 Profi table growth: Our Profi table Growth pillar also consists of three initiatives: Sector
Focus, Strategic Products Replication and Sales Eff ectiveness. In the Sector Focus
programme, we continuously deepen our expertise in our sectors of Consumer,
Retail, Technology, Life Sciences & Healthcare, Automotive and Energy. For each of
these sectors, we have established dedicated global sector teams to off er our custom-
ers comprehensive supply chain solutions and to ensure knowledge exchange on best
practices across regions and business units. In our Strategic Products Replication
initiative, we develop and reproduce logistics solutions aimed at simplifying our
customers’ business processes. In doing so, we take our cue from proven operating
standards and practices. One example of such a comprehensive solution in the
Technology sector is our Technical Services off ering. Technical services refer to
processes that are integrated into the respective supply chain solutions and which
signifi cantly reduce warehouse and transport costs as a result of shorter repair cycles.
Together with Acer, a customer of ours in India, we signifi cantly simplifi ed that
company’s processes by combining the former 21 spare parts warehouses into three
regional repair centres. DHL does not only manage the spare parts but ensures that
the defective devices are collected at Acer’s local service providers and carries out the
required repair activities as well as subsequent delivery of the units to the customers.
Th us far we have replicated six strategic products worldwide: Lead Logistics Provider,
Co-Packing, Integrated Logistics & Procurement, Technical Services, E-Fulfi lment and Air-
line Business Solutions. In our Sales Eff ectiveness programme, we continuously improve
the performance of our sales organisation by bolstering sales processes and customer sup-
port. We are learning to understand our customers’ business objectives and strategies bet-
ter, which enables us to off er them added value. Feedback from customers and customer
surveys also assists us in continuously enhancing the eff ectiveness of our sales activities.
Future organisation
Change in Board of Management
Th e Supervisory Board of Deutsche Post AG resolved on 14 December 2011 to
appoint Angela Titzrath to the Group Board of Management. As at 1 May 2012, she will
succeed Walter Scheurle, who will resign his post as Board Member for Personnel eff ec-
tive as at the end of April following twelve years of successful service. He will continue
to assist the company in an advisory capacity until he enters retirement.
Deutsche Post DHL Annual Report 2011116

Future economic parameters
Economic upturn with risks
Th e global economy is likely to maintain its growth course in 2012 but there are
considerable risks. Sharply rising commodity prices may cause infl ation to increase
appreciably, especially in emerging markets, and may signifi cantly slow the upturn. Th e
national debt crisis in the euro zone in particular may have a highly adverse eff ect
on international fi nancial markets. If these risks remain manageable, the International
Monetary Fund (IMF) expects an increase in global economic output of 3.3 %. At the start
of the year, most institutes were still giving relatively conservative estimates of growth
in global trade (IMF: 3.8 %, OECD: 4.8 %).
a.73 Global economy: growth forecasts
%
2011 2012
Global trade volume 6.9 3.8
Real gross domestic product
Global 3.8 3.3
Industrial nations 1.6 1.2
Emerging markets 6.2 5.4
Central and Eastern Europe 5.1 1.1
cis countries 4.5 3.7
Emerging markets in Asia 7.9 7.3
Middle East and northern Africa 3.1 3.2
Latin America and the Caribbean 4.6 3.6
Sub-Saharan Africa 4.9 5.5
Source: International Monetary Fund (imf) world economic outlook, January 2012.
In China, the government is making eff orts to keep infl ation under control and to
slow down the economy. Th e economy is therefore expected to grow somewhat more
slowly (IMF: 8.2 %).
Th e Japanese economy may be able to recover from the economic downturn. Exports
are forecast to increase considerably and gross fi xed capital formation will also likely see
a strong rise on account of the rebuilding eff orts aft er the earthquake. A rise in private
consumption is anticipated. GDP is therefore expected to grow (IMF: 1.7 %, OECD: 2.0 %,
Postbank Research: 2.1 %).
In the United States, the economy is projected to revive but not to gain any sig-
nifi cant momentum. Investments in machinery and equipment as well as construction
spending are expected to increase. Th e surplus on the housing market, however, is likely
to curb the upwards trend. Private consumption will probably rise moderately, refl ect-
ing the slight decline in unemployment. Foreign trade and government spending is not
expected to provide stimulus. Forecasts call for GDP growth to accelerate slightly overall
(IMF: 1.8 %, OECD: 2.0 %, Postbank Research: 2.4 %).
Deutsche Post DHL Annual Report 2011
Group Management ReportOutlook
Future economic parameters
117

Th e euro zone economy is expected to experience a profound weak phase. To com-
bat the national debt crisis, spending will be cut and taxes increased, which will likely
also slow private consumption and gross fi xed capital formation. As a result of weak
domestic demand, imports are likely to rise at a considerably slower pace than exports
so that foreign trade may have a positive impact on growth. However, total GDP is likely
to increase only marginally (ECB: 0.3 %, Postbank Research: 0.6 %). A decline in eco-
nomic output cannot be ruled out. Th e vast discrepancies between the member states
are likely to remain.
Th is development will probably slow the German economy noticeably, an eff ect
that will be seen mostly in exports. Investments in machinery and equipment as well as
construction spending are expected to increase but not by as much as in 2011. Annual
average employment fi gures are forecast to rise considerably, which is likely to boost
private consumption further. However, GDP is expected to record only weak to moderate
growth (Sachverständigenrat: 0.9 %, Postbank Research: 1.2 %).
If the global economy grows, the demand for crude oil will increase. Th e supply will
probably be expanded as this occurs and, as a result, crude oil prices are likely to see
only a moderate average increase in 2012.
Th e US Federal Reserve has announced that it will keep its key interest rate at a
very low level for a longer period of time. A consistent rate between 0 % and 0.25 % can
therefore be expected for 2012. Th e ECB will probably keep its key interest rate at 1.0 %.
Nevertheless, capital market interest rates may rise, although a weak economy and low
key interest rates are likely to keep yield spreads tight.
World trade grows, especially through Asia
Th e trend in the industrial countries is likely to be shaped by elevated economic
risks. Consequently, the emerging markets in Asia are again expected to play a signifi -
cant role in the growth of global trade in the year 2012. Whilst growth in global trade
volumes (transported quantity in tonnes) is likely to remain unchanged at approximately
6% in 2012, growth on the Asian routes is projected to increase further.
Mail business in the digital age
Demand for mail in Germany depends on the trend in the ways our customers
communicate and the extent to which electronic media continue to replace the physi-
cal letter. We expect the market for mail communication to shrink, though demand for
communication in general will continue to rise. By introducing the e-Postbrief, we have
taken the fi rst step towards utilising our expertise in physical communication to off er
competent electronic communications and generate new business in the process. We
have also prepared ourselves for continued, intense competition.
According to forecasts by the Zentralverband der deutschen Werbewirtschaft ( German
advertising federation), the German advertising market will grow marginally again in
2012. Th is market is cyclical and currently fi nds itself in transition. We are seeing an
overall shift in advertising expenditures as companies budget more for digital media
and less for traditional advertising. Th e trend towards targeted advertising and combin-
ations with internet off ers is likely to continue. Moreover, we expect companies to resort
increasingly to more economical forms of advertising. We intend to consolidate our
position in the liberalised market for paper-based advertising and to expand our share
in the advertising market as a whole by integrating online marketing.
Glossary, page 250
Deutsche Post DHL Annual Report 2011118

Th e press services market is likely to keep contracting slightly because of the increas-
ing use of new media. Th e economic trend will aff ect subscription numbers and average
weights, thus also impacting our future revenue. We plan to increase the number of
digital products we off er in this business unit.
Th e international mail market takes its cue from how business customers com-
municate. Th is is an area in which we aim to tap into new business related to our core
competency: mail, parcels and small packages.
In the parcel market, which is likely to continue to grow in Germany, we expect to
profi t from business and private customer activities in the online marketplace. We shall
continue to drive this development and to expand our market position with our own
range of products and delivery services.
International express business continues to grow
Experience shows that growth of the international express market is highly depend-
ent on the general economy. Despite the restrained projections for overall economic
growth, however, we are optimistic regarding 2012 in light of the trend in our shipment
volumes.
Th is also applies to our earnings. A continuing focus on costs together with initia-
tives to increase effi ciency and quality will make a crucial contribution to improving
earnings. Targeted, sustainable investments are necessary for our future growth. We are
confi dent that we are able to remain on a growth path and further strengthen or defend
our leading market position.
Moderate market growth in the freight forwarding business
Th e decline in demand that set in during the second half of 2011 in the logistics and
freight forwarding sector is likely to continue in the coming months because the overall
economic outlook for 2012 is more moderate.
In the air freight market, freight rates are strongly infl uenced by the supply side and
the willingness of carriers to reduce their capacities. Some have already announced such
intentions. Growth opportunities are seen in inter-Asian trade and in the expanding
Chinese domestic market.
Th e ocean freight market, currently shaped by low margins, and even losses in some
areas, fi nds itself in a phase of consolidation. Th e number of market players is likely to
decline and those who remain are therefore expected to experience considerable growth.
Global trade and the demand for sea freight are expected to continue to increase, espe-
cially on trade lanes between Asia and Latin America and within Asia as well as between
Asia and the Middle East. We also anticipate that freight rates will remain at their cur-
rent level until the second quarter of 2012. Th is is due to increasing market capacities.
Supply-side capacity adjustments are foreseen in the short and medium term so that
rates are likely to increase in 2012 on the whole. Th is will, in turn, put more pressure
on margins in the freight forwarding sector.
In 2011, road transport volumes recovered from the crisis. For 2012 we anticipate
regular market growth, assuming long-term growth rates.
Deutsche Post DHL Annual Report 2011
Group Management ReportOutlook
Future economic parameters
119

Supply Chain market remains resilient
Due to the nature of the industry, the market for contract logistics stayed relatively
resilient throughout the most recent economic downturn, a development that appears
likely to continue in 2012.
Demand for Supply Chain services is expected to see particularly robust growth in
emerging markets such as China, India, Brazil and Mexico.
At Williams Lea, we anticipate strong growth on the basis of our unique product
off ering and the increasing development of our broad DHL customer base, especially
within the Marketing Solutions business, which was enhanced by the acquisition of Tag.
Despite the uncertainty of the economic climate, our business model in combin-
ation with our extensive global reach and Growth Th rough Excellence strategy ensure
that we shall continue to improve our existing business steadily and to grow new busi-
ness profi tably.
Revenue and earnings forecast
Th e global economy is expected to continue to see moderate growth in 2012 with an
increase of 3 % to 3.5 %. Th e international trading volumes relevant for our business are
likely to exceed the projected growth of the global economy. We are therefore anticipat-
ing the corresponding revenue growth, particularly in the DHL divisions.
For fi nancial year 2012, we expect consolidated EBIT to reach between €2.5 bil-
lion and €2.6 billion. Th e MAIL division is likely to contribute between €1.0 billion and
€1.1 billion to this fi gure. Compared with the previous year, we expect an additional
improvement in overall earnings to approximately €1.9 billion in the DHL divisions. At
around €–0.4 billion, the Corporate Center / Other result should be on a par with the
previous year.
We plan to increase capital expenditure by approximately 6 % to €1.8 billion. We
shall remain around this level in the following years. In line with our Group strategy,
we are targeting organic growth and anticipate only a few small acquisitions in 2012, as
in the previous year. In 2012, operating cash fl ow will only be impacted to a very minor
extent by the restructuring measures resolved in 2009.
Even in the face of an uncertain economic climate, particularly in the western
economies, we believe that the Group will experience good earnings momentum. Th e
positive trend in our earnings that we are anticipating for 2012 is likely to continue
into 2013. Th e cost reduction measures and growth programmes initiated in the MAIL
division are expected to stabilise EBIT, even though letter volumes are likely to continue
their slow decline due to electronic substitution. In the DHL divisions, we expect EBIT,
taking the earnings contribution in 2010 as the baseline, to improve at an annual average
of 13 % to 15 % in the period from 2011 to 2015 as trading volumes continue to recover.
Consolidated net profi t before eff ects from the Postbank transaction is expected to
continue to improve in 2012 in line with our operating business.
Our fi nance strategy calls for paying out 40 % to 60 % of net profi ts as dividends as
a general rule. At the Annual General Meeting on 9 May 2012, we intend to propose
to the shareholders that a dividend per share of €0.70 be paid for fi nancial year 2011
(previous year: €0.65).
Deutsche Post DHL Annual Report 2011120

Projected fi nancial position
Rating fi gures to feel temporary effect
As a result of the state aid ruling of the European Commission and the associated
cash outfl ow, our signifi cant rating fi gures will be aff ected temporarily. Th e rating agency
Standard & Poor’s has accordingly put our credit rating on credit watch with negative
implications. Th erefore, we cannot rule out the possibility that our rating will be lowered
throughout the course of the year.
Liquidity remains solid
We anticipate a deterioration in our liquidity in the fi rst half of 2012 as a result of
the annual prepayment due to Bundes-Pensions-Service für Post und Telekommuni-
kation in January and the dividend payment for fi nancial year 2011 in May. However,
our operating liquidity situation will improve again signifi cantly towards the end of the
year due to the upturn in business that is normal in the second half.
In view of the October 2012 maturity date for the bond issued by Deutsche Post
Finance B. V. in the amount of €0.7 billion and the state aid ruling of the European
Commission, we are nevertheless currently analysing the option of refi nancing under
the Debt Issuance Programme. Since the cash outfl ow cannot be fully covered by available
liquidity, we intend to borrow from the capital market during the course of the year.
Th e fact that the mandatory exchangeable bond (second tranche) subscribed in
connection with the sale of Postbank will mature on 25 February 2012 has no impact
on our net debt or liquidity, given that the bond will be settled via a transfer of Postbank
shares and not in the form of cash.
Capital expenditure continues to remain high
We will continue to make investments in 2012. All in all, we plan to increase capital
expenditure by approximately 6 % to €1.8 billion. We shall remain around this level in
the following years. Th e majority of the spending will go for IT, machinery, transport
equipment and aircraft .
In the MAIL division, we shall be further expanding our parcel network in addition
to reinforcing digital growth areas. Investments in the mail and parcel business will
increase versus the prior year.
In the EXPRESS division, we intend to increase investments in line with business
growth. We shall be renewing and expanding our global network in order to sustain
our high quality level even in the face of increasing volumes. Investments will centre on
our aircraft fl eet and in some countries also extend to the infrastructure on the ground.
In the GLOBAL FORWARDING, FREIGHT division, capital expenditure is expected to
rise in 2012. We plan to optimise IT solutions in the Global Forwarding business unit.
Regionally, we shall be investing primarily in Asia, Europe, the Middle East and Africa.
Note 51
Financial position, page 51
Deutsche Post DHL Annual Report 2011
Group Management ReportOutlook
Projected fi nancial position
121

In the SUPPLY CHAIN division, investments are likewise expected to increase,
although no substantial projects are planned. Additional investments will focus on
supporting new business and securing and expanding existing business in America
and the UK.
Cross-divisional capital expenditure will decrease slightly year-on-year in 2012.
Investments will again be centred on our vehicle fl eet and IT.
This Annual Report contains forward-looking statements that relate to the business, fi nancial performance and results of oper-ations of Deutsche Post ag. Forward-looking statements are not historical facts and may be identifi ed by words such as “believes”,
“expects”, “predicts”, “intends”, “projects”, “plans”, “estimates”, “aims”, “foresees”, “anticipates”, “targets” and similar expressions. As these statements are based on current plans, estimates and projections, they are subject to risks and uncertainties that could cause actual results to be materially different from the future development, performance or results expressly or implicitly assumed in the forward-looking statements. Readers are cautioned not to place undue reliance on these forward-looking statements, which apply only as at the date of this presentation. Deutsche Post ag does not intend or assume any obligation to update these forward-looking statements to refl ect events or circumstances after the date of this Annual Report.
Any internet sites referred to in the Group Management Report do not form part of the report.
Deutsche Post DHL Annual Report 2011122

CORPORATE GOVERNANCE 123 – 148
B COR
POR
ATE G
OV
ERN
AN
CE

REPORT OF THE SUPERVISORY BOARD 125
SUPERVISORY BOARD 129
Members of the Supervisory Board 129
Committees of the Supervisory Board 129
BOARD OF MANAGEMENT 130
MANDATES 132
Mandates held by the Board of Management 132
Mandates held by the Supervisory Board 132
CORPORATE GOVERNANCE REPORT 133
Remuneration report 139

DEAR SHAREHOLDERS,
In the 2011 fi nancial year, despite a turbulent economic and political environment, Deutsche Post DHL
took positive steps towards its three targets: to be the provider, investment and employer of choice.
Advising and overseeing the Board of Management
In 2011, the Supervisory Board scrutinised Group and divisional strategy and performance at four
Supervisory Board meetings and at a closed meeting. At the meetings, the Board of Management pro-
vided us with detailed information on the situation and direction of the company and the Group, on
strategic initiatives and all key issues related to planning and implementation and on opportunities and
risks for business performance. We regularly discussed the global economic situation, the eff ects of the
amended value added tax legislation and regulatory issues as well as the development of acquisitions and
products within the divisional growth strategies. Amongst the matters discussed was the acquisition of
Tag EquityCo Limited in July 2011. All important decisions were discussed in detail with the Board of
Management. It informed us in a timely and comprehensive manner regarding business performance, key
business transactions and projects in the divisions, compliance organisation and compliance management,
as well as the company’s risk exposure and risk management. Th e Board of Management also provided
the chairman of the Supervisory Board with continuous updates between Supervisory Board meetings.
Measures requiring the consent of the Supervisory Board were discussed in even greater depth. Such
measures were considered in advance by the relevant committees and the results of their deliberations
were presented by the respective committee chairs to the plenary meetings.
WULF VON SCHIMMELMANNChairman
REPORT OF THE SUPERVISORY BOARD
Deutsche Post DHL Annual Report 2011
Corporate GovernanceReport of the Supervisory Board
125

Four meetings during the reporting year
Two Supervisory Board meetings were held in the fi rst half and two in the second half of the year. All
members participated in at least two meetings.
At the fi nancial statements meeting on 9 March 2011, with the auditors in attendance, we discussed
and approved the annual and consolidated fi nancial statements for 2010. At that meeting we accepted
Hermann Ude’s resignation from the Board of Management and approved the conditions of his severance
agreement. Th e Supervisory Board appointed Roger Crook to succeed him as a member of the Board of
Management for three years until March 2014 and agreed on the terms of his contract of employment. Ken
Allen was appointed as a member of the Board of Management for a further fi ve years until March 2017.
In addition, we dealt with aspects of Board of Management remuneration, decided on the disposal of the
US subsidiary Exel Transportation Services (ETS) and discussed the results of the effi ciency review of the
work of the Supervisory Board.
At the Supervisory Board meeting of 30 June 2011, we examined, amongst other matters, aspects of
the Board of Management’s remuneration, in particular its appropriateness. In addition, we discussed
how the company could support Supervisory Board members by providing them with basic and further
training measures.
At the meeting of 7 September 2011, we agreed to extend Lawrence Rosen’s mandate and contract
for a further fi ve years until August 2017. Prior to the meeting, the company organised a Directors’ Day
to provide Supervisory Board members with basic and further training. Selected speakers talked about
current topics and developments, including accounting and corporate governance. Following the meeting,
the Supervisory Board held a one-and-a-half-day closed meeting to discuss in detail the implementation
of Strategy 2015 within the Group and the divisions. In order to provide an outside perspective to sup-
plement the views of the Group, the Supervisory Board invited a number of high-ranking guest speakers.
At the Supervisory Board’s last meeting of the year on 14 December 2011, we adopted the business plan
for 2012. Th e Supervisory Board extended the Board of Management mandate and employment contract
of Chief Executive Offi cer Dr Frank Appel for another fi ve years until October 2017 and appointed Angela
Titzrath as a member of the Board of Management and as Labour Director for three years. Angela Titzrath
will succeed Walter Scheurle who, aft er twelve successful years as the Board Member for Personnel, is
retiring at his own request. We discussed again the remuneration of the Board of Management, including
the agreement of targets for 2012. We also submitted our Declaration of Conformity with the German
Corporate Governance Code.
Hard work by the committees
Th e Executive Committee met six times during the year under review. Th e agenda focused primarily
on business-related questions and Board of Management matters, such as the appointment of Board of
Management members and the remuneration for the Board of Management.
Th e Personnel Committee met four times, examining in detail the proportion of women in execu-
tive positions in the Group. Similarly, the Group’s voluntary commitment announced in October 2011
was addressed at length as were the measures planned and implemented to promote women to executive
positions. Another topic was the annual employee opinion survey.
Th e Finance and Audit Committee met seven times. Hero Brahms, the committee’s chairman, is a
fi nan cial expert as defi ned by section 100 (5) and section 107 (4) of the Aktiengesetz (AktG – German Stock
Corporation Act). At its February meeting, the committee examined the annual and consolidated fi nancial
statements for 2010. Th e auditors attended this meeting. Following the Annual General Meeting (AGM),
the Finance and Audit Committee hired the auditors to perform an audit of the 2011 annual and con-
solidated fi nancial statements and the focal points of the audit were also determined. Th e auditors were
likewise charged with reviewing the quarterly fi nancial reports and the interim fi nancial report for the fi rst
half of the year. Th e quarterly fi nancial reports and the interim fi nancial report for the fi rst half of the year
were discussed by the committee together with the Board of Management and the auditors.
Deutsche Post DHL Annual Report 2011126

With regard to the acquisition and disposal of companies, the committee meeting of 28 February 2011
discussed the sale of the US subsidiary Exel Transportation Services (ETS) and was informed about the
acquisition of Eurodifarm srl. and AdCloud GmbH. Owing to his supervisory board mandate at Live
Holding AG, which has an indirect holding in AdCloud, Hero Brahms did not participate in the discus-
sion and resolutions concerning AdCloud. At the June meeting, the acquisition of Tag EquityCo Limited
was again discussed.
Th e committee dealt at regular intervals with the Group’s business development and the internal
control and risk management system. Discussions related above all to risk management across the Group
together with the main risk factors for the Group. Th e committee discussed compliance organisation
and compliance management, as well as the fi ndings of the reviews carried out by Internal Audit. It also
approved the 2012 Audit Plan. Th e appropriateness of the Group’s accounting system was discussed by
the committee together with the auditor.
Th e Nomination Committee met once in 2011 and recommended to the Supervisory Board and the
AGM the re-election of Hero Brahms, Werner Gatzer and Elmar Toime and proposed the appointment
of Prof. Dr-Ing. Katja Windt and Th omas Kunz owing to the departure of Willem G. van Agtmael and
Harry Roels.
Th e chairs of the committees reported on the committees’ deliberations in the subsequent plenary
meetings.
In 2011, there were no meetings of the Mediation Committee formed pursuant to section 27 (3) of the
Mitbestimmungsgesetz (MitbestG – German Co-determination Act).
Changes to the composition of the Supervisory Board and Board of Management
Th e following changes occurred in 2011 with regard to the shareholder representatives of the Super-
visory Board of Deutsche Post AG: Willem G. van Agtmael and Harry Roels did not off er themselves
for re-election and left the Supervisory Board at the end of the AGM of 25 May 2011. At the 2011 AGM
Prof. Dr-Ing. Katja Windt and Th omas Kunz were appointed until the end of the AGM that will ratify the
acts of management carried out during the fi nancial year 2015. Werner Gatzer and Elmar Toime were
re-elected for the same term of offi ce. Hero Brahms was re-elected until the end of the AGM that will rule
on ratifi cation of the acts of management for fi nancial year 2013. Th ere were no changes to the employee
representatives.
Th e company’s Board of Management changed as follows: Hermann Ude resigned from the Board of
Management on 8 March 2011. Roger Crook was appointed to succeed him as the member of the Board of
Management responsible for GLOBAL FORWARDING, FREIGHT from 9 March 2011. Th e Board of Manage-
ment mandate of Ken Allen was extended on 9 March 2011, that of Lawrence Rosen on 7 September 2011
and that of Dr Frank Appel on 14 December 2011, each for fi ve years. Walter Scheurle announced his
intention to retire in 2012. Angela Titzrath was named his successor as Board Member for Personnel and
as Labour Director.
Confl ict of interest reported
Hero Brahms announced at the Supervisory Board meeting of 9 March 2011 that as a precaution, he
had not participated in the discussions and decision-making of the Finance and Audit Committee meeting
of 28 February 2011 concerning the purchase of AdCloud GmbH, in order to avoid a potential confl ict
of interest. Hero Brahms holds a supervisory board mandate at Live Holding AG, which has an indirect
interest in AdCloud. Werner Gatzer also participated in the Supervisory Board discussions regarding the
intention of the German tax authorities to qualify several mail products that Deutsche Post AG considers
to be VAT exempt retroactively as subject to VAT. Th e tax authorities of the German federal states are
responsible for administering VAT. Th ere was therefore no confl ict of interests.
Deutsche Post DHL Annual Report 2011
Corporate GovernanceReport of the Supervisory Board
127

Company in compliance with all recommendations of the German Corporate Governance Code
In December 2011, the Board of Management and the Supervisory Board submitted an unquali-
fi ed Declaration of Conformity pursuant to section 161 of the AktG and published it on the company’s
website. Th e declarations from previous years can also be viewed on this website. In fi nancial year 2011,
Deutsche Post AG complied with all recommendations of the German Corporate Governance Code as
amended on 26 May 2010. Th e company plans to continue complying with the recommendations of
the code as amended on 26 May 2010. Th e Corporate Governance Report (page 133 ff .) contains further
information on corporate governance within the company as well as the remuneration report.
Annual and consolidated fi nancial statements audited
Th e auditors appointed by the AGM, PricewaterhouseCoopers Aktiengesellschaft Wirtschaft s prü-
fungsgesellschaft , Düsseldorf, (PwC) audited the annual and consolidated fi nancial statements for fi nan-
cial year 2011, including the respective management reports, and issued unqualifi ed audit opinions. PwC
also conducted the review of the quarterly fi nancial reports and the interim report for the fi rst half of
the year.
Following a detailed preliminary assessment by the Finance and Audit Committee, the Supervisory
Board reviewed the annual and consolidated fi nancial statements and the management reports for fi nan-
cial year 2011 at the fi nancial statements meeting held on 7 March 2012. Th e review included the Board
of Management’s proposal for the appropriation of the unappropriated surplus. Th e auditors’ reports
were made available to all Supervisory Board members and were discussed in detail with the Board of
Management and the auditors in attendance. Th e Supervisory Board concurred with the results of the
audit and approved the annual and consolidated fi nancial statements for fi nancial year 2011. Based on the
fi nal outcome of the examination of the annual and consolidated fi nancial statements, on the manage-
ment reports and on the proposal for the appropriation of the unappropriated surplus by the Supervisory
Board and the Finance and Audit Committee, there are no objections to be raised. Th e Supervisory Board
endorses the Board of Management’s proposal for the appropriation of the unappropriated surplus and
the payment of a dividend of € 0.70 per share.
We would like to thank the Board of Management and all the employees of the Group for their par-
ticularly hard work in the past year. Th e Supervisory Board is confi dent that the company is very well
prepared for the future.
Bonn, 7 March 2012
Th e Supervisory Board
Wulf von SchimmelmannChairman
f
Deutsche Post DHL Annual Report 2011128

b.01 Members of the Supervisory Board b.02 Committees of the Supervisory Board
Shareholder representatives
Prof. Dr Wulf von Schimmelmann (Chair)Former ceo of Deutsche Postbank ag
Hero BrahmsManagement consultant
Werner GatzerState Secretary, Federal Ministry of Finance
Prof. Dr Henning KagermannFormer ceo of sap ag
Thomas Kunz (since 25 May 2011)President of Danone Waters, member of the Executive Committee of Danone s.a., France (until 30 September 2011)
ceo of Danone Dairy, member of the Executive Committee of Danone s.a., France (since 1 October 2011)
Roland OetkerManaging Partner, roi Verwaltungsgesell-schaft mbH
Dr Ulrich SchröderChief Executive Offi cer, KfW Bankengruppe
Dr Stefan SchulteChair of the Executive Board of Fraport ag
Elmar ToimeManaging Director, e Toime Consulting Ltd.
Prof. Dr-Ing. Katja Windt (since 25 May 2011)Professor of Global Production Logistics at Jacobs University, Bremen
Left in fi nancial year 2011
Willem G. van Agtmael (until 25 May 2011)Managing Partner, e. Breuninger GmbH & Co.
Harry Roels (until 25 May 2011)
Employee representatives
Andrea Kocsis (Deputy Chair)Deputy Chair of ver.di National Executive Board and Head of Postal Services, Forwarding Companies and Logistics on the ver.di National Executive Board
Wolfgang AbelHead of Postal Services, Forwarding Companies and Logistics, ver.di Regional District of Hamburg
Rolf BauermeisterHead of Postal Services, Co-determination and Youth and Head of National Postal Services Group at ver.di national adminis-tration
Heinrich Josef BuschChair of the Group and Company Executive Representation Committee, Deutsche Post ag
Thomas KoczelnikChair of the Group Works Council, Deutsche Post ag
Anke KufaltMember of the Works Council, dhl Global Forwarding GmbH, Hamburg
Andreas SchädlerChair of the General Works Council, Deutsche Post ag
Sabine SchielmannMember of the Executive Board of the General Works Council, Deutsche Post ag
Helga ThielDeputy Chair of the General Works Council, Deutsche Post ag
Stefanie WeckesserDeputy Chair of the Works Council, Deutsche Post ag, mail Branch, Augsburg
Executive Committee
Prof. Dr Wulf von Schimmelmann (Chair)
Andrea Kocsis (Deputy Chair)
Rolf Bauermeister
Werner Gatzer
Roland Oetker
Stefanie Weckesser
Finance and Audit Committee
Hero Brahms (Chair)
Wolfgang Abel (Deputy Chair)
Werner Gatzer
Thomas Koczelnik
Dr Stefan Schulte
Helga Thiel
Personnel Committee
Andrea Kocsis (Chair)
Prof. Dr Wulf von Schimmelmann (Deputy Chair)
Thomas Koczelnik
Roland Oetker
Mediation Committee (pursuant to section 27 (3) of the German Co-determination Act)
Prof. Dr Wulf von Schimmelmann (Chair)
Andrea Kocsis (Deputy Chair)
Rolf Bauermeister
Roland Oetker
Nomination Committee
Prof. Dr Wulf von Schimmelmann (Chair)
Werner Gatzer
Roland Oetker
SUPERVISORY BOARD
Deutsche Post DHL Annual Report 2011
Corporate GovernanceSupervisory Board
129

BOARD OF MANAGEMENT
1 DR FRANK APPEL CHIEF EXECUTIVE OFFICER
Born in 1961Member since November 2002,ceo since February 2008Appointed until October 2017
3 ROGER CROOK GLOBAL FORWARDING, FREIGHT
Born in 1957Member since March 2011Appointed until March 2014
5 JÜRGEN GERDES MAIL
Born in 1964Member since July 2007Appointed until June 2015
7 WALTER SCHEURLE PERSONNEL
Born in 1952Member from April 2000 until April 2012
2 KEN ALLEN EXPRESS
Born in 1955Member since February 2009Appointed until February 2017
4 BRUCE EDWARDS SUPPLY CHAIN
Born in 1955Member since March 2008Appointed until March 2016
6 LAWRENCE ROSEN FINANCE, GLOBAL BUSINESS SERVICES
Born in 1957Member since September 2009Appointed until August 2017
Former member of the Board of Management
HERMANN UDE GLOBAL FORWARDING, FREIGHT
Born in 1961Member from March 2008 until March 2011
New member of the Board of Management
ANGELA TITZRATH PERSONNEL
Born in 1966Member from May 2012Appointed until April 2015
Deutsche Post DHL Annual Report 2011130

3 2 4 1 5 76
Deutsche Post DHL Annual Report 2011
Corporate GovernanceBoard of Management
131

b.04 Mandates held by the Supervisory Board
Shareholder representatives
Membership of supervisory boards required by law
Prof. Dr Wulf von Schimmelmann (Chair)Maxingvest ag
Hero BrahmsGeorgsmarienhütte Holding GmbH (Deputy Chair)
Wincor Nixdorf ag (until 23 January 2012)
Live Holding ag (Chair)
Telefunken se (Chair, until 31 March 2011)
Krauss-Maffei-Wegmann GmbH & Co. kg
Werner Gatzerg.e.b.b. mbH
Bundesdruckerei GmbH
öpp Deutschland ag (until 3 January 2011)
Flughafen Berlin-Schönefeld GmbH (since 8 April 2011)
Prof. Dr Henning Kagermannbmw ag
Deutsche Bank ag
Münchener Rückversicherungs- Gesellschaft ag
Roland OetkerEvotec ag (since 16 June 2011)
Dr Ulrich SchröderDeutsche Telekom ag
KfW ipex-Bank GmbH (until 31 March 2011)
deg – Deutsche Investitions- und Entwicklungsgesellschaft mbH
Elmar Toimemessage ag (Chair)
Membership of comparable bodies
Prof. Dr Wulf von Schimmelmann (Chair)Accenture Corp., Ireland (Board of Directors)
Western Union Company, usa (Board of Directors)
Thomson Reuters Corp., Canada (Board of Directors), since 20 July 2011
Hero Brahmsm. m. Warburg & Co. KGaA (Shareholders’ Committee), until 14 April 2011
Zumtobel ag, Austria (Supervisory Board, Deputy Chair)
Prof. Dr Henning KagermannNokia Corporation, Finland (Board of Directors)
Wipro Ltd., India (Board of Directors)
Roland OetkerRheinisch-Bergische Verlagsgesellschaft mbH (Supervisory Board), since 8 April 2011
Dr Ulrich Schröder“Marguerite 2020”: European Fund for Energy, Climate Change and Infrastructure (Supervisory Board)
Elmar ToimeBlackbay Ltd., United Kingdom ( Non-Executive Director)
Postea Inc., usa (Non-Executive Chairman)
Left in fi nancial year 2011
Willem G. van Agtmael (until 25 May 2011)Charlottenklinik für Augenheilkunde (Board of Trustees)
Employee representatives
Membership of supervisory boards required by law
Rolf BauermeisterDeutsche Postbank ag
Andreas Schädlerpsd Bank Köln eG (Chair)
Helga Thielpsd Bank Köln eG (Deputy Chair)
MANDATESb.03 Mandates held by the Board of Management
Membership of supervisory boards required by law
Lawrence RosenDeutsche Postbank ag
Membership of comparable bodies
Ken Allendhl Sinotrans International Air Courier Ltd. 1 (Board of Directors)
Roger Crookdhl Global Forwarding Management (Asia Pacifi c) Pte. Ltd.1 (Board of Directors)
Bruce EdwardsAshtead plc (Board of Directors)
Greif, Inc. (Board of Directors)
Williams Lea Group Limited 1 (Board of Directors)
Williams Lea Holdings plc 1 (Board of Directors, Chair)
1 Group mandate.
Deutsche Post DHL Annual Report 2011132

CORPORATE GOVERNANCE REPORT(Annual Corporate Governance Statement pursuant to section 289a of the hgb)
In this Annual Corporate Governance Statement, the company presents the main com-
ponents of Deutsche Post DHL’s corporate governance structure. Th ese include the
Declaration of Conformity from the Board of Management and Supervisory Board,
information regarding signifi cant corporate governance practices that exceed the legal
requirements, information concerning the working methods of the Board of Manage-
ment and the Supervisory Board and details regarding the composition and working
methods of the executive committees and other committees, as well as the targets for
the composition of the Supervisory Board.
Company in compliance with all recommendations of the German Corporate
Governance Code
In December 2011, the Board of Management and the Supervisory Board again
submitted an unqualifi ed Declaration of Conformity pursuant to section 161 of the
Aktiengesetz (AktG – German Stock Corporation Act), which reads as follows:
“Th e Board of Management and the Supervisory Board of Deutsche Post AG declare
that the recommendations made by the Government Commission on the German
Corporate Governance Code as amended on 26 May 2010 have been complied with
since the last Declaration of Conformity in December 2010 and that Deutsche Post AG
intends to comply with all recommendations of the Code as amended on 26 May 2010
in the future.”
We also implemented the suggestions set forth in the code, with one exception: the
Annual General Meeting (AGM) will only be broadcast on the internet until the start of
the general debate.
Specifi c corporate governance practices
With the guiding principle of “respect and results”, we set our corporate govern-
ance the daily challenge of achieving fi rst-class results whilst adhering to our sense of
responsibility for the needs of our employees and customers. As a globally operating
company and corporate citizen, we bear great responsibility for the environment and
for living conditions in the regions in which we operate. Th is is a responsibility that we
take seriously.
In 2011 we carried out another employee opinion survey, in which 80 % of our
employees took part. We are proud that, on the whole, our employees are satisfi ed with
their working conditions. Th e results will be carefully analysed at all levels and inten-
sively discussed since they indicate where we can make improvements.
In addition, we regularly collect data on how satisfi ed customers are with our
services. Th e Kundenmonitor independent market study in 2011 indicated that 95 % of
private customers surveyed in Germany were satisfi ed with the Deutsche Post mail and
retail outlet service.
Our corporate responsibility rests on the competencies of the company and the expe-
rience of our employees. We want to lead the way in innovative and sustainable logis-
tics solutions. Pursuant to our motto “living responsibility”, we focus on three areas:
GoGreen (environmental protection), GoHelp (disaster management) and GoTeach
(promoting education). We are the fi rst global logistics provider to set itself a quantita-
tive carbon effi ciency target. We had set ourselves the goal of improving carbon effi -
dp-dhl.com/en/investors.html
Employees, page 82 f.
Corporate responsibility, page 87 ff.
Deutsche Post DHL Annual Report 2011
Corporate GovernanceCorporate Governance Report
133

ciency in our own processes by 10 % by 2012 but managed to exceed this target in 2011.
To support the programme we have developed our own controlling solution. Carbon
emissions are managed and reported by means of defi ned indicators. In recognition of
this, Deutsche Post DHL received the fi rst Green Controlling Prize to be awarded by
the Péter Horváth Foundation and the Internationaler Controller Verein (international
controllers’ association). Th e Group was again confi rmed by leading indices as a member
on the strength of its commitment to corporate responsibility.
Within the framework of the GoHelp programme, we apply our expertise towards
helping people in disaster areas quickly. In this context, our Disaster Response Teams
were deployed in New Zealand and El Salvador. In addition, we provided disaster-
prevention training to the managers of the international airports in Nepal, Bangladesh
and Indonesia.
With our GoTeach programme, we take action worldwide to improve education and
promote fair opportunities for education. We concluded partnerships with organisations
that supply university graduates to work as temporary schoolteachers in underprivileged
areas, implemented a scholarship programme for the children of our employees and
initiated a partnership with the child-aid organisation SOS Children’s Villages.
As part of our commitment to social responsibility, we encouraged our employees
to get involved in Global Volunteer Day for the fi rst time in 2011. More than 50,000 of
our employees volunteered to help children, young people and the elderly. In addition,
we used the Living Responsibility Fund to support our employees’ voluntary commit-
ment in local projects.
Code of Conduct, diversity and compliance management
Deutsche Post DHL has developed a Code of Conduct that has been applicable in
all regions and in all divisions since mid-2006. Th e Code of Conduct lays down guide-
lines for day-to-day workplace conduct for some 470,000 employees. Our principles
are respect, tolerance, honesty, openness, integrity towards employees and customers
and willingness as a company to assume social responsibility.
Th e Code of Conduct also sets out our commitment to the health and well-being of
our employees as well as equal opportunities and diversity.
We consider the health and safety of our employees to be prerequisites for perfor-
mance and motivation and a key to the company’s continued success. Our global health
policy, a multitude of measures to promote health and the numerous awards we have
won are a refl ection of the high esteem that our exemplary company health manage-
ment system has enjoyed for years. In 2011, for the second year in a row, we won the
Corporate Health Award in the transport/logistics category granted under the auspices
of the German Federal Ministry of Labour and Social Aff airs.
In 2011 Deutsche Post DHL won the fi rst ever German Diversity Award in the Most
Diverse Employer category. Concerning the promotion of women to executive positions,
in October 2011 Deutsche Post DHL undertook to ensure that women occupied 25 %
to 30 % of all upper and middle managerial positions for which there was a vacancy. To
achieve this objective, we have already implemented targeted development actions and
will supplement our catalogue of measures.
Deutsche Post DHL Annual Report 2011134

Th e Supervisory Board discussed in detail the Group’s diversity strategy, with par-
ticular focus on the objective of increasing the number of women on the Board of
Management. It sees the eff orts for greater diversity as being part of long-term succes-
sion planning, for which the Supervisory Board and Board of Management are jointly
responsible. In the opinion of the Supervisory Board, the targeted increase in the num-
ber of women in executive positions is necessary to ensure that, overall, more suitable
female candidates are available for vacant positions on the Board of Management. Th is
will allow the Supervisory Board to give more consideration to women when appointing
members to the Board of Management. Th e international composition of the Board of
Management already strongly refl ects the global activity of the company.
Th e Code of Conduct is underpinned by two guidelines. Th e anti-corruption policy
gives clear instructions on how to handle gift s, benefi ts and off ers of hospitality. Im-
proper payments (bribery) are prohibited. Th e competition compliance policy gives
specifi c guidance on the prohibition of agreements with competitors. Th e code of con-
duct for suppliers is included in all new procurement contracts and has been added
to existing long-term framework agreements. It obliges them to adhere to ethical and
ecological standards. A ban on child and forced labour is in place. Salaries and working
times must comply with national laws and regulations.
At Deutsche Post DHL, the Chief Compliance Offi cer is responsible for the compli-
ance management system and reports directly to the Chief Financial Offi cer. Important
compliance management activities include the process to identify possible compliance
risks, the evaluation of business partners with regard to compliance, the procedures for
reporting potential breaches of laws or guidelines, policy management and the develop-
ment and implementation of training and communication measures.
Th e Chief Compliance Offi cer is supported by the Global Compliance Offi ce, which
establishes compliance management standards on a Group-wide scale and supports the
corresponding activities of the divisions.
In 2011, pursuant to Deutsche Post DHL’s continuous review and development of
the compliance management system, the position of Divisional Compliance Offi cer was
created in all of the four operating divisions. Th ese offi cers report to the board member
responsible for the divisions concerned. Th e Divisional Compliance Offi cer supplies
input for the Chief Compliance Offi cer’s report to the Group’s Board of Management,
with information on compliance cases and how they are dealt with as well as advances
in the development of compliance organisation and processes. Th e Chief Compliance
Offi cer is also advised by the Compliance Committee, which is composed of members
from the divisions and representatives of certain corporate departments such as Internal
Audit and Controlling.
Working methods of the Board of Management and the Supervisory Board
As a German listed public limited company, Deutsche Post follows a dual manage-
ment system. Th e Board of Management is responsible for the management of the com-
pany. It is appointed, overseen and advised by the Supervisory Board.
In addition to the board departments of the Chief Executive Offi cer (CEO), the
CFO and the Board Member for Personnel, the Board of Management also includes the
operating board departments of MAIL, GLOBAL FORWARDING, FREIGHT, EXPRESS and
SUPPLY CHAIN.
Members, page 130Mandates, page 132
Deutsche Post DHL Annual Report 2011
Corporate GovernanceCorporate Governance Report
135

With the consent of the Supervisory Board, the Board of Management has established
rules of procedure that lay down objectives for structure, management and co-operation
within the Board of Management. Within this framework, each board member manages
his department independently and informs the rest of the Board on key developments at
regular intervals. Th e Board of Management as a whole decides on matters of particular
signifi cance for the company or the Group. In addition to tasks that it is prohibited by
law from delegating, these include all decisions that must be presented to the Supervisory
Board for approval. Th e entire Board of Management also decides on matters brought
forth by one member of the Board of Management for decision by the Board of Manage-
ment as a whole.
In making their decisions, the members of the Board of Management may not pur-
sue personal interests or exploit business opportunities due to the company for their
own benefi t. Th ey are required to disclose any confl icts of interest to the Supervisory
Board without delay.
Th e Supervisory Board advises and oversees the Board of Management and appoints
the members of the Board of Management. It has established rules of procedure that
include the fundamental principles of its internal structure, a catalogue of Board of Man-
agement transactions requiring its approval and rules for the Supervisory Board committees.
It meets at least twice every six months based on the calendar year, with special meet-
ings being held whenever particular developments or measures need to be discussed
or decided quickly. In fi nancial year 2011, the Supervisory Board met for four plenary
meetings, 18 committee meetings and a closed meeting, as described in the report of the
Supervisory Board.
Th e Board of Management and the Supervisory Board are in regular contact regard-
ing strategic measures, planning, business development, risk exposure and risk manage-
ment as well as company compliance. Th e Board of Management informs the Supervisory
Board promptly and comprehensively on all topics of signifi cance.
All Supervisory Board decisions, particularly those concerning transactions that
require its approval, are deliberated and discussed extensively in the relevant commit-
tees. At each plenary meeting, the Supervisory Board is informed in detail about the
work and decisions of its committees.
In making their decisions, the members of the Supervisory Board may not pursue
personal interests or exploit business opportunities due to the company for their own
benefi t. Th ey are required to disclose any confl icts of interest to the Supervisory Board.
Any signifi cant confl icts of interest on the part of a Supervisory Board member that
are not merely temporary in nature should lead to that member’s resignation from the
Board. In the Supervisory Board’s estimation, the Supervisory Board contains a suf-
fi cient number of independent members.
Members, page 129Mandates, page 132
Page 129
Page 125 ff.
Deutsche Post DHL Annual Report 2011136

Executive committees and Supervisory Board committees
Executive committees prepare decisions to be made by the Board of Management
as a whole and make decisions on matters assigned to them. Th eir duties include pre-
paring or deciding on investments and transactions in the various divisions. Th e MAIL
Steering Committee is responsible for the MAIL division and the cross-divisional DHL
Executive Committee is in charge of the EXPRESS, GLOBAL FORWARDING, FREIGHT and
SUPPLY CHAIN divisions. Th e CEO, the CFO and the respective board members of the
divisions are represented on the committees. In addition, the Board Member for Person-
nel is a member of the MAIL Steering Committee. Along with the relevant members of
the Board of Management, the executive committees also include fi rst-tier executives
below the Board of Management level, in some cases on a permanent basis (those, for
example, responsible for the operating business) and in some cases to assist with special
topics. Procurement and Controlling are called in to consult on capital expenditure, for
instance, and Corporate Finance, Corporate Development and Legal Services in the case
of acquisitions. Th e DHL Executive Committee and the MAIL Steering Committee each
meet at least once a month.
Furthermore, business review meetings take place once per quarter. Th ese meetings
are part of the strategic performance dialogue between the divisions, the CEO and the
CFO. Th ey comprise discussions on strategic measures, operating topics and the budget
situation of the divisions.
For the members of the Board of Management, see Board of Management and mandates
held by the Board of Management.
Th e Supervisory Board has formed fi ve committees to ensure effi cient discharge of
its duties; in particular, these committees prepare the resolutions of the plenary meetings
of the Supervisory Board. Decisions on certain topics are delegated by the Supervisory
Board to the individual committees for fi nal decision.
Th e Executive Committee’s duties include arranging the appointment of members
of the Board of Management and the establishment of management board remuneration
by the plenary meeting of the Supervisory Board. Th e current members of the Executive
Committee are Wulf von Schimmelmann (Chair), Andrea Kocsis (Deputy Chair), Rolf
Bauermeister, Werner Gatzer, Roland Oetker and Stefanie Weckesser.
Th e Finance and Audit Committee oversees the accounting process, the eff ectiveness
of the internal control system, the risk management and internal auditing systems as
well as the fi nancial statement audit. It examines questions of compliance and discusses
the half-yearly and quarterly fi nancial reports with the Board of Management before
they are published. Based on its own preliminary assessment, it makes proposals for the
approval of the annual and consolidated fi nancial statements by the Supervisory Board.
Th e current members of the Finance and Audit Committee are Hero Brahms (Chair),
Wolfgang Abel (Deputy Chair), Werner Gatzer, Th omas Koczelnik, Stefan Schulte and
Helga Th iel. Th e chairman of the Finance and Audit Committee, Hero Brahms, is a
fi nancial expert as defi ned by sections 100 (5) and 107 (4) of the AktG.
Th e Personnel Committee discusses human resources principles for the Group. Th e
Personnel Committee’s current members are Andrea Kocsis (Chair), Wulf von Schim-
melmann (Deputy Chair), Th omas Koczelnik and Roland Oetker.
Pages 130 and 132
Deutsche Post DHL Annual Report 2011
Corporate GovernanceCorporate Governance Report
137

Th e Mediation Committee carries out the duties assigned to it pursuant to the Mit-
bestimmungsgesetz (MitbestG – German Co-determination Act). Th e current mem-
bers of the Mediation Committee are Wulf von Schimmelmann (Chair), Andrea Kocsis
(Deputy Chair), Rolf Bauermeister and Roland Oetker.
Th e Nomination Committee presents to the shareholder representatives on the
Super visory Board recommendations on the choice of members of the Supervisory
Board by the AGM. In doing so, it takes into consideration the objectives adopted by the
Supervisory Board concerning its composition. Th e current members of the Nomination
Committee are Wulf von Schimmelmann (Chair), Werner Gatzer and Roland Oetker.
Information about the work of the Supervisory Board and its committees in fi nan-
cial year 2011 is also contained in the report of the Supervisory Board. You can fi nd in-
formation about the members of the Supervisory Board and the composition of the
Supervisory Board committees under the sections Supervisory Board and mandates held
by the Supervisory Board.
Targets for the composition of the Supervisory Board
In December 2010, the Supervisory Board determined specifi c goals with regard
to its composition:
Nominations put forward by the Supervisory Board for the election of Supervisory
Board members at the AGM should focus solely on the good of the company. In this
context, the Supervisory Board is aiming to increase the proportion of women on
the full Supervisory Board from the current 25 % to 30 % by 2015.
Th e present composition of the Supervisory Board already adequately refl ects the
company’s international operations. Th e Supervisory Board aims to maintain this
and to continue to consider candidates in future nominations at the AGM who, by
virtue of their background, education or profession, possess special international
knowledge and experience.
Confl icts of interest amongst members of the Supervisory Board stand in the way
of the independent and eff ective guidance and supervision of the Board of Manage-
ment. Th e Supervisory Board decides in each individual case, within the scope of
the law and in accordance with the German Corporate Governance Code, how to
deal with potential or arising confl icts of interest.
In accordance with the age limit decided by the Supervisory Board and anchored in
its rules of procedure, nominations for the election of Supervisory Board members
will take into account the fact that the term of offi ce is intended to end, at the latest,
at the close of the duly convened AGM following the member’s 72nd birthday.
Th e current composition of the Supervisory Board meets the abovementioned targets.
Prof. Dr-Ing. Katja Windt, who was elected by the 2011 AGM, is an established logistics
specialist and has an excellent reputation, also in other industries. Her election brought
the proportion of women on the Supervisory Board to 30 %. Th e company’s international
operations are adequately taken into account. Swiss-born Th omas Kunz, recently elected
at the 2011 AGM, possesses extensive knowledge and experience gained in his many years
as a member of the top management team within the French Danone group.
Page 125 ff.
Pages 129 and 132
Deutsche Post DHL Annual Report 2011138

Stock option plans for members of the Board of Management and executives
Specifi c details of stock option plans and similar share-based incentive schemes
off ered by the company, insofar as they concern the Board of Management, are given
in the remuneration report.
Senior executives of the Group take part in a global Share Matching Scheme. Within
the framework of this plan, executives of grades B to D of our Role Classifi cation System
(RCS) must invest 15 %, and may invest up to 50 %, of their annual variable remuneration
in Deutsche Post stock at the current share price. Executives of grades E and F may invest
up to 50 % of their annual variable remuneration. Aft er a four-year holding period and
a corresponding period of affi liation with the Group, the executives receive one bonus
share for every Deutsche Post share purchased and continuously held under the plan.
In addition, selected executives receive stock appreciation rights (SAR s) in annual
tranches as a long-term remuneration component. Apart from the fact that they do
not need to make a personal investment, the structure of this remuneration element
corresponds to that described in the remuneration report for the Board of Management.
Remuneration report
Th e remuneration report also forms part of the Group Management Report.
Remuneration structure of the Group Board of Management in fi nancial year 2011
Th e total remuneration paid to individual Board of Management members for
fi nan cial year 2011 was determined by the Supervisory Board, which held consulta-
tions to resolve on the remuneration system for the Board of Management, including
the main contractual elements. In so doing it obtained advice from an independent
remuneration consultant.
Th e Board of Management remuneration refl ects the size and global reach of the
company, its economic and fi nancial situation and the roles and achievements of the
individual members. It is set to ensure competitiveness with comparable German and
inter national companies, thus incentivising the Board of Management members to
deliver maximum performance and achieve results.
Th e remuneration paid to the Board of Management for 2011 is in line with standard
market practice, appropriate to the tasks involved and designed to reward performance;
it comprises fi xed (non-performance-related) elements and variable (performance-
related) elements, which include short, medium and long-term incentives.
Non-performance-related components are the annual base salary (fi xed annual
remuneration), fringe benefi ts and pension commitments. Th e annual base salary is
paid in twelve equal monthly instalments retroactively at the end of each month. Fringe
benefi ts mainly comprise the use of company cars, supplements for insurance premiums
and special allowances and benefi ts for assignments outside the home country.
Th e variable remuneration paid to the Board of Management is predominantly me-
dium and long-term based. Half of the variable remuneration consists of a long-term
incentive plan with a four-year calculation period; the other half is made up of an annual
bonus linked to the company’s yearly profi ts, with 50 % of the annual bonus fl owing into
a medium-term component with a three-year calculation period. Th us only 25 % of the
variable remuneration component is paid out on the basis of a one-year calculation.
Page 139 ff.
Note 52
Page 139 ff.
Deutsche Post DHL Annual Report 2011
Corporate GovernanceCorporate Governance Report
Remuneration report
139

Th e medium-term component described is applicable to all employment contracts
and contract renewals entered into aft er the eff ective date of the Gesetz zur Angemessen-
heit der Vorstandsvergütung (VorstAG – German Act on the Appropriateness of Manage-
ment Board Remuneration) (5 August 2009). For all contracts concluded prior to that
date, 25 % of the annual bonus fl ows into the medium-term component until the cessa-
tion of the term of the contract.
Th e amount of the annual bonus is set at the due discretion of the Supervisory Board
on the basis of the company’s performance. Th e individual annual bonus amounts refl ect
the extent to which predefi ned targets are achieved, missed or exceeded.
For all Board of Management members, the Group’s EBIT aft er asset charge per-
formance metric, including the asset charge on goodwill before goodwill impairment
(EAC), is the main parameter used in this calculation. For the Board of Management
members in charge of the MAIL, GLOBAL FORWARDING, FREIGHT, EXPRESS and SUPPLY
CHAIN divisions, the EAC of their respective division is also a key parameter. Further-
more, an employee-related target is agreed with all Board of Management members
based on the annual employee opinion survey, as are additional targets.
Achievement of the upper targets for the fi nancial year that have been agreed based
on demanding objectives is rewarded with the maximum annual bonus not to exceed
100 % of the annual base salary. If the targets specifi ed for the fi nancial year are only
partially reached or completely missed, the annual bonus will be paid on a pro-rata basis
or not at all. Th e Supervisory Board may also elect to award an appropriate special bonus
for extraordinary achievement.
Th e annual bonus is not paid in full in a single instalment on the basis of having
reached the agreed targets. Instead, 50 % of the annual bonus fl ows into a medium-
term component with a three-year calculation period (performance phase of one year,
sustainability phase of two years). Th is medium-term component will be paid out aft er
expiry of the sustainability phase subject to the condition that EAC, as an indicator of
sustainability, is reached during the sustainability phase. Otherwise, payment of the
medium-term component is forfeited without compensation. Th is demerit system puts
greater emphasis on sustainable company development in determining management
board remuneration and sets long-term incentives.
Stock appreciation rights (SAR s) are granted as a long-term remuneration com-
ponent based on the Long-Term Incentive Plan resolved by the Supervisory Board in
2006 (2006 LTIP).
Each SAR entitles the holder to receive a cash settlement equal to the diff erence
between the average closing price of Deutsche Post shares for the fi ve trading days
preceding the exercise date and the exercise price of the SAR. In 2011, the members of
the Board of Management each invested 10 % of their annual base salary as a personal
fi nancial investment. Th e waiting period for the stock appreciation rights is four years
from the date on which they were granted. Aft er expiration of the waiting period and
provided an absolute or relative performance target has been achieved, the SAR s can be
exercised wholly or partially for a period of two years. Any SAR s not exercised during
this two-year period will expire.
Deutsche Post DHL Annual Report 2011140

To determine how many, if any, of the SAR s granted can be exercised, the average
share price or the average index value for the reference period is compared with that
of the performance period. Th e reference period comprises the last twenty consecutive
trading days prior to the issue date. Th e performance period is the last sixty trading
days before the end of the waiting period. Th e average share price (closing price) is
calculated as the average closing price of Deutsche Post shares in Deutsche Börse AG’s
Xetra electronic trading system.
A maximum of four out of every six SAR s can be “earned” via the absolute perfor-
mance target and a maximum of two via the relative performance target. If neither an
absolute nor a relative performance target is met by the end of the waiting period, the
SAR s attributable to the related tranche will expire without replacement or compensation.
One SAR is earned each time the closing price of Deutsche Post shares exceeds the
issue price by at least 10 %, 15 %, 20 % or 25 %. Th e relative performance target is tied to
the performance of the shares in relation to the STOXX Europe 600 Index (SXXP, ISIN
EU0009658202). It is met if the share price equals the index performance during the
performance period or if it outperforms the index by at least 10 %.
Remuneration from stock appreciation rights is limited to 300 % of the annual tar-
get cash compensation (annual base salary plus the annual target bonus). Moreover, it
may be limited by the Supervisory Board in the event of extraordinary circumstances.
Provisions to cap severance payments pursuant to the Corporate Governance Code rec-
ommendation, change-of-control provisions and post-contractual non-compete clauses
In accordance with the recommendation of section 4.2.3 of the German Corporate
Governance Code as amended on 26 May 2010, Board of Management contracts con-
tain a provision stipulating that in the event of premature termination of a Board of
Management member’s contract without good cause, the severance payment may com-
pensate no more than the remaining term of the contract. Th e severance payment is
limited to a maximum amount of two years’ remuneration including fringe benefi ts
(severance payment cap). All contracts concluded since 9 March 2011 contain a clause
stipulating that no special remuneration paid may be taken into account in the calcula-
tion of the severance payment cap, nor may the value of rights allocated from long-term
incentive plans.
In the event of a change in control, any member of the Board of Management is
entitled to resign his offi ce for good cause within a period of six months following the
change in control, aft er giving three months’ notice as at the end of the month, and to
terminate their Board of Management contract (right to early termination).
Th e contractual provisions stipulate that a change of control exists if a shareholder
has acquired control within the meaning of section 29 (2) of the Wertpapiererwerbs-
und Übernahmegesetz (WpÜG – German Securities Acquisition and Takeover Act) via
possession of at least 30 % of the voting rights, including the voting rights attributable
to such shareholder by virtue of acting in concert with other shareholders as set forth
in section 30 of the WpÜG or if a control agreement has been concluded with the com-
pany as a dependent entity in accordance with section 291 of the Aktiengesetz (AktG –
German Stock Corporation Act) and such agreement has taken eff ect or if the company
has merged with another legal entity outside of the Group pursuant to section 2 of the
Umwandlungsgesetz (UmwG – German Reorganisation and Transformation Act), unless
the value of such other legal entity as determined by the agreed conversion rate is less
than 50 % of the value of the company.
Deutsche Post DHL Annual Report 2011
Corporate GovernanceCorporate Governance Report
Remuneration report
141

In the event that the right to early termination is exercised or a Board of Manage-
ment contract is terminated by mutual consent within nine months of the change of
control, the Board of Management member is entitled to payment to compensate the
remaining term of his Board of Management contract. Such payment is limited to 150 %
of the severance payment cap pursuant to the recommendation of the German Corpo-
rate Governance Code. Th e amount of the payment is reduced by 25 % if the Board of
Management member has not reached the age of 60 upon leaving the company. If the
remaining term of the Board of Management contract is less than two years and the
Board of Management member has not reached the age of 62 upon leaving the company,
the payment will correspond to the severance payment cap. Th e same applies if a Board
of Management contract expires prior to the Board of Management member’s reaching
the age of 62 because less than nine months remained on the term of the contract at the
time of the change of control and the contract was not renewed.
Board of Management members are also subject to a non-compete clause, taking
eff ect on the cessation of their contracts. During the one-year non-compete period, for-
mer Board of Management members receive 100 % of their last contractually stipulated
annual base salary on a pro-rata basis as compensation each month. Any other income
earned during the non-compete period is subtracted from the compensation paid. Th e
amount of the compensation payment itself is deducted from any severance payments
or pension payments. Prior to or concurrent with cessation of the Board of Management
contract, the company may declare its waiver of adherence to the non-compete clause.
In such case, the company will be released from the obligation to pay compensation
due to a restraint on competition six months aft er receipt of such declaration. Lawrence
Rosen is subject to a non-compete clause eff ective for two years aft er the cessation of
his contract. During this period, he will receive 75 % of his last contractually stipulated
annual base salary on a pro-rata basis each month. Any other earned income will be
deducted from the compensation paid during the non-compete period, provided such
other income, together with the compensation payment, exceeds the last base salary
paid on a monthly basis. No provisions have been made that would allow the company
to unilaterally waive the non-compete clause.
Apart from the aforementioned arrangements, no member of the Board of Manage-
ment in offi ce at 31 December 2011 has been promised any further benefi ts aft er leaving
the company.
Other provisions
Hermann Ude’s Board of Management contract was rescinded as at the end of
31 March 2011 and he was paid the sum of €2,972,083. Just as with active Board of
Management members, the pension capital on his virtual pension account will accrue
interest at an annual rate equal to the “iBoxx Corporates AA 10 + Annual Yield” rate, or
at an annual rate of 2.25 % at minimum, until his pension benefi ts fall due. Hermann Ude
is subject to a non-compete clause and a non-solicitation clause until 31 March 2012. He
is being paid a sum of €77,500 each month by way of compensation during this period
for a total of €930,000 and will retain possession of the SAR s allocated to him.
Deutsche Post DHL Annual Report 2011142

Amount of remuneration paid to active members of the Group Board of Management
in fi nancial year 2011
Th e remuneration paid to active members of the Board of Management in fi nancial
year 2011 totalled €12.05 million (previous year: €11.97 million). Th is amount comprised
€7.41 million in non-performance-related components (previous year: €7.07 million)
and €4.64 million in the performance-related component paid out (previous year:
€4.90 million). An additional €2.32 million of the performance-related component was
transferred to the medium-term component and will be paid out in 2014 subject to the
condition that the required EAC, as an indicator of sustainability, is reached.
Th e members of the Board of Management were granted a total of 2,771,178 SAR s
in fi nancial year 2011 for a total value of €6.96 million (previous year: €4.99 million) at
the time of issue (1 July 2011). Th e following table presents the total remuneration paid
to active Board of Management members:
b.05 Remuneration paid to the Group Board of Management in 2011: cash components
€
Non-performance-relatedPerformance-
related
Board membersAnnual
base salary Fringe benefi ts Annual bonus Total
Share of annual bonus transferred to medium-term
component 2
Dr Frank Appel, Chairman 1,745,017 33,990 1,308,804 3,087,811 436,268
Ken Allen 835,833 119,222 626,123 1,581,178 208,708
Roger Crook (since 9 March 2011) 579,797 142,092 290,228 1,012,117 290,228
Bruce Edwards 919,902 91,758 496,451 1,508,111 421,317
Jürgen Gerdes 930,000 22,906 465,000 1,417,906 465,000
Lawrence Rosen 1 860,000 19,270 645,000 1,524,270 215,000
Walter Scheurle 930,000 19,892 697,500 1,647,392 232,500
Hermann Ude (until 8 March 2011) 163,188 3,242 108,861 275,291 53,4851 In fi nancial year 2011, an additional €473,000 was paid out as part of the compensation for rights that lapsed as a result of his transfer
to Deutsche Post ag. The compensation payment is described in the 2009 Annual Report.2 This amount will be paid out in 2014 provided the sustainability indicator is fulfi lled.
b.06 Remuneration paid to the Group Board of Management in 2011: share-based component with long-term incentive effect
€
Number of sar s
Value of sar s on grant date (1 July 2011)
Change in value of total sar s granted from 2008 to 2011 on 31 Dec. 2011 compared
with value on grant dateActive board members
Dr Frank Appel, Chairman 689,502 1,730,650 –2,748,612
Ken Allen 342,630 860,001 –1,092,314
Roger Crook (since 9 March 2011) 284,862 715,003 –250,679
Bruce Edwards 370,518 930,000 –1,753,956
Jürgen Gerdes 370,518 930,000 –1,753,956
Lawrence Rosen 342,630 860,001 –1,092,314
Walter Scheurle 370,518 930,000 –1,753,956
Deutsche Post DHL Annual Report 2011
Corporate GovernanceCorporate Governance Report
Remuneration report
143

Remuneration paid to the Group Board of Management in the previous year (2010)
b.07 Remuneration paid to the Group Board of Management in 2010: cash components
€
Non-performance-relatedPerformance-
related
Board membersAnnual
base salary Fringe benefi ts Annual bonus Total
Share of annual bonus transferred to medium-term
component 2
Dr Frank Appel, Chairman 1,661,973 48,452 1,246,480 2,956,905 415,493
Ken Allen 715,000 105,542 525,096 1,345,638 175,032
Bruce Edwards 860,000 94,898 643,646 1,598,544 214,549
Jürgen Gerdes 895,000 23,191 555,000 1,473,191 340,000
Lawrence Rosen 1 860,000 20,476 645,000 1,525,476 215,000
Walter Scheurle 912,500 17,697 670,140 1,600,337 223,380
Hermann Ude 834,664 15,036 612,977 1,462,677 204,3261 An additional €1,869,000 was paid out in the fi nancial year as part of the compensation for rights that lapsed as a result of his transfer
to Deutsche Post ag. The compensation payment totalling €2.55 million is described in the 2009 Annual Report.2 This amount will be paid out in 2013 provided the sustainability indicator is fulfi lled.
b.08 Remuneration paid to the Group Board of Management in 2010: share-based component with long-term incentive effect
€
Number of sar s
Value of sar s on grant date (1 July 2010)
Change in value of total sar s granted from 2007 to 2010 on 31 Dec. 2010 compared
with value on grant dateActive board members
Dr Frank Appel, Chairman 375,000 997,500 –2,166,250
Ken Allen 250,000 665,000 –378,930
Bruce Edwards 250,000 665,000 – 909,182
Jürgen Gerdes 250,000 665,000 –1,378,519
Lawrence Rosen 250,000 665,000 –130,300
Walter Scheurle 250,000 665,000 –1,783,700
Hermann Ude 250,000 665,000 – 909,182
Pension commitments under the previous system
Dr Frank Appel, Jürgen Gerdes and Walter Scheurle have direct, fi nal-salary based
pension commitments on the basis of their individual contracts, providing for benefi ts
in case of permanent disability, death or retirement. If the contract of a member ends
aft er at least fi ve years of service on the Board of Management, the entitlements he has
acquired will vest in full. Members become entitled to benefi ts due to permanent dis-
ability aft er at least fi ve years of service. Eligibility for retirement benefi ts begins at the
earliest at the age of 55 or at the age of 62 in the case of Jürgen Gerdes. Th e members
of the Board of Management may choose between annuity payments and a lump sum
payment. Th e benefi t amount depends on the pensionable income and the pension level
derived from the years of service.
Pensionable income consists of the fi xed annual remuneration (annual base salary)
computed on the basis of the average salary over the last 12 calendar months of employ-
ment. Members of the Board of Management appointed for the fi rst time between 2002
and 2007 attain a pension level of 25 % aft er fi ve years of service on the Board of Manage-
ment. Th e maximum pension level of 50 % is attained aft er ten years of service. For
active Board of Management members appointed prior to 2002, the maximum pension
level is 60 %. Depending on the individual contractual arrangements, the pension level
Deutsche Post DHL Annual Report 2011144

increases gradually based on either the period of service or the periods of appointment
on the Board of Management. Subsequent pension benefi ts increase or decrease to re-
fl ect changes in the consumer price index in Germany.
b.09 Pension commitments under the previous system in fi nancial year 2011: individual breakdown
Pension commitments
Pension level on
31 Dec. 2011 %
Maximum pension level
%
Service cost for pension obligation, fi nancial year 2011
€
Present value (dbo) as at
31 Dec. 2011 €
Dr Frank Appel, Chairman 25 50 552,899 7,180,293
Jürgen Gerdes 1 0 50 166,362 3,804,581
Walter Scheurle 60 60 651,031 8,324,557
Total 1,370,292 19,309,4311 Minimum period not yet complete. In the event of benefi ts being paid, the provisions of the previous system will apply.
b.10 Pension commitments under the previous system in the previous year (2010): individual breakdown
Pension commitments
Pension level on
31 Dec. 2010 %
Maximum pension level
%
Service cost for pension obligation, fi nancial year 2010
€
Present value (dbo) as at
31 Dec. 2010 €
Dr Frank Appel, Chairman 25 50 495,558 5,898,215
Jürgen Gerdes 1 0 50 139,017 2,798,820
Walter Scheurle 60 60 615,154 7,212,421
Total 1,249,729 15,909,4561 Minimum period not yet complete. In the event of benefi ts being paid, the provisions of the previous system will apply.
Pension commitments under the new system
Since 4 March 2008, newly appointed Board of Management members have received
pension commitments based on a defi ned contribution plan rather than the previous
commitments, which were based on fi nal salary. Under the defi ned contribution pension
plan, the company credits an annual amount of 35 % of the annual base salary to a vir-
tual pension account for the Board of Management member concerned. Th e maximum
contribution period is 15 years. Since fi nancial year 2010, pension capital has accrued
interest at an annual rate equal to the “iBoxx Corporates AA 10 + Annual Yield” rate,
or at an annual rate of 2.25 % at minimum, and will continue to do so until the pension
benefi ts fall due. Previously, the pension capital accrued interest at the discount rate
applicable to pension provisions recognised for tax purposes. Th e pension benefi ts are
paid out in a lump sum in the amount of the value accumulated in the pension account.
Th e benefi ts fall due when the Board of Management member reaches the age of 62 or
in the case of invalidity or death whilst being employed. In the event of benefi ts falling
due, the pension benefi ciary may opt to receive an annuity payment in lieu of a lump
sum payment. If this option is exercised, the capital is converted to an annuity payment,
taking into account the average “iBoxx Corporates AA 10+ Annual Yield” for the past
ten full calendar years as well as the individual data of the surviving dependants and a
future pension increase of 1 %.
Deutsche Post DHL Annual Report 2011
Corporate GovernanceCorporate Governance Report
Remuneration report
145

b.11 Board of Management pension commitments under the new system in fi nancial year 2011: individual breakdown
€ Total contribution
for 2011
Present value (dbo) as at
31 Dec. 2011Service cost for pension
obligation, financial year 2011
Ken Allen 250,250 705,775 266,023
Roger Crook (since 9 March 2011) 187,688 189,914 0
Bruce Edwards 301,000 1,114,883 322,872
Lawrence Rosen 301,000 1,636,856 326,478
Hermann Ude (until 8 March 2011) 677,250 1 1,765,277 333,183
Total 1,717,188 5,412,705 1,248,5561 The total contribution for 2011 consists of a pro-rata amount for three months in the amount of €75,250 plus the €602,000 credited
to Hermann Ude in connection with his departure from the company.
b.12 Board of Management pension commitments under the new system in the previous year (2010): individual breakdown
€ Total contribution
for 2010
Present value (dbo) as at
31 Dec. 2010Service cost for pension
obligation, financial year 2010
Ken Allen 250,250 458,199 263,643
Bruce Edwards 301,000 804,427 320,152
Lawrence Rosen 301,000 1,367,910 321,947
Hermann Ude 250,250 1,140,262 267,532
Total 3,770,798 1,173,274
Benefi ts for former Board of Management members
Benefi ts paid to former members of the Board of Management or their surviving
dependants amounted to €7.4 million in fi nancial year 2011 (previous year: €5.7 mil-
lion). Th e defi ned benefi t obligation (DBO) for current pensions calculated under IFRS s
amounted to €57.0 million (previous year: €42.9 million). Th e change (€13.3 million)
is due to the greater number of pensioners as their pension benefi ts have fallen due. No
additional obligations have been incurred in this context. Rather, the existing obliga-
tions due to pension entitlements including the 2011 service costs have decreased to
€25.7 million (previous year: €35.4 million).
Supervisory Board remuneration
Pursuant to article 17 of the Articles of Association of Deutsche Post AG resolved
by the Annual General Meeting, the annual remuneration paid to the members of the
Supervisory Board comprises a non-performance-related, i.e., fi xed, component, a vari-
able component geared towards sustainable corporate development and the attendance
allowance.
Th e fi xed component has been gradually adjusted to the average fi gure for DAX 30
enterprises. Since 1 January 2011, it has amounted to €40,000 (previous year: €30,000).
Th e variable remuneration component for fi nancial year 2011 will amount to €1,000 for
each €0.02 by which the consolidated net profi t per share for fi nancial year 2013 exceeds
the consolidated net profi t per share for fi nancial year 2010. Th is variable remuneration
component will fall due for payment as at the end of the 2014 AGM. Th e variable remu-
neration component is subject to a cap equal to 50 % of the fi xed component.
Deutsche Post DHL Annual Report 2011146

Th e Supervisory Board chairman and the Supervisory Board committee chairs
receive an additional 100 % of the fi xed and variable remuneration, and the Super visory
Board deputy chair and committee members receive an additional 50 %. Th is does not
apply to the Mediation or Nomination Committees. Th ose who only serve on the Super-
visory Board or its committees, or act as chair or deputy chair, for part of the year are
remunerated on a pro-rata basis.
Supervisory Board members receive an attendance allowance of €1,000 for each
plenary meeting of the Supervisory Board or committee meeting that they attend, as in
2010. Th ey are entitled to reimbursement of out-of-pocket cash expenses incurred in the
exercise of their offi ce. Any value added tax charged on Supervisory Board remuneration
or out-of-pocket expenses is reimbursed.
Th e remuneration for 2011 totalled €1,410,000 (previous year: €1,097,000). Th e
following table shows the remuneration paid to each Supervisory Board member:
b.13 Remuneration paid to Supervisory Board members in 2011
€ Fixed component
Attendance allowance TotalBoard members
Prof. Dr Wulf von Schimmelmann (Chair) 140,000 16,000 156,000
Andrea Kocsis (Deputy Chair) 120,000 14,000 134,000
Wolfgang Abel 60,000 10,000 70,000
Willem van Agtmael (until 25 May 2011) 15,000 1,000 16,000
Rolf Bauermeister 60,000 10,000 70,000
Hero Brahms 80,000 11,000 91,000
Heinrich Josef Busch 40,000 4,000 44,000
Werner Gatzer 80,000 16,000 96,000
Prof. Dr Henning Kagermann 40,000 3,000 43,000
Thomas Koczelnik 80,000 15,000 95,000
Anke Kufalt 40,000 4,000 44,000
Thomas Kunz (since 25 May 2011) 25,000 2,000 27,000
Roland Oetker 80,000 15,000 95,000
Harry Roels (until 25 May 2011) 15,000 1,000 16,000
Andreas Schädler 40,000 4,000 44,000
Sabine Schielmann 40,000 4,000 44,000
Dr Ulrich Schröder 40,000 3,000 43,000
Dr Stefan Schulte 60,000 9,000 69,000
Helga Thiel 60,000 11,000 71,000
Elmar Toime 40,000 4,000 44,000
Stefanie Weckesser 60,000 10,000 70,000
Prof. Dr-Ing. Katja Windt (since 25 May 2011) 25,000 3,000 28,000
Th e remuneration system applicable in fi nancial year 2009 provided for perfor-
mance-related remuneration with a long-term incentive eff ect that would have fallen
due for payment as at the end of the 2012 AGM. Th is remuneration component would
have been payable (previous year: no payment) in the event of an increase in the con-
solidated revenue for 2011 compared with 2008. Since this requirement was not met,
no performance-related remuneration with long-term incentive eff ect will be paid out
for fi nancial year 2009.
Deutsche Post DHL Annual Report 2011
Corporate GovernanceCorporate Governance Report
Remuneration report
147

b.14 Remuneration paid to Supervisory Board members in 2010
€ Fixed component
Attendance allowance TotalBoard members
Prof. Dr Wulf von Schimmelmann (Chair) 105,000 16,000 121,000
Andrea Kocsis (Deputy Chair) 90,000 12,000 102,000
Wolfgang Abel 45,000 12,000 57,000
Willem van Agtmael 30,000 4,000 34,000
Rolf Bauermeister 45,000 8,000 53,000
Hero Brahms 60,000 12,000 72,000
Heinrich Josef Busch 30,000 4,000 34,000
Werner Gatzer 60,000 14,000 74,000
Annette Harms (until 6 October 2010) 23,750 3,000 26,750
Prof. Dr Henning Kagermann 30,000 4,000 34,000
Thomas Koczelnik 60,000 16,000 76,000
Anke Kufalt 30,000 3,000 33,000
Roland Oetker 60,000 13,000 73,000
Harry Roels 30,000 4,000 34,000
Andreas Schädler 30,000 4,000 34,000
Sabine Schielmann (since 27 October 2010) 6,250 1,000 7,250
Dr Ulrich Schröder 30,000 4,000 34,000
Dr Stefan Schulte 45,000 10,000 55,000
Helga Thiel 45,000 12,000 57,000
Elmar Toime 30,000 4,000 34,000
Stefanie Weckesser 45,000 7,000 52,000
Deutsche Post DHL Annual Report 2011148

CONSOLIDATED FINANCIAL STATEMENTS 149 – 246
C CON
SOLID
ATED
FINA
NC
IAL STA
TEMEN
TS

INCOME STATEMENT 151
STATEMENT OF COMPREHENSIVE INCOME 152
BALANCE SHEET 153
CASH FLOW STATEMENT 154
STATEMENT OF CHANGES IN EQUITY 155
NOTES TO THE CONSOLIDATED FINANCIAL STATEMENTS OF DEUTSCHE POST AG 156
BASIS OF PREPARATION 156
1 Basis of accounting 156
2 Consolidated group 156
3 Signifi cant transactions 160
4 New developments in international accounting under ifrs s 161
5 Adjustment of prior-period amounts 164
6 Currency translation 164
7 Accounting policies 164
8 Exercise of judgement in applying the accounting policies 170
9 Consolidation methods 171
SEGMENT REPORTING 172
10 Segment reporting 172
INCOME STATEMENT DISCLOSURES 175
11 Revenue 175
12 Other operating income 175
13 Materials expense 175
14 Staff costs / employees 176
15 Depreciation, amortisation and impairment losses 176
16 Other operating expenses 177
17 Net income from associates 177
18 Net other fi nancial income / net other fi nance costs 177
19 Income taxes 178
20 Consolidated net profi t for the period 179
21 Non-controlling interests 179
22 Earnings per share 179
23 Dividend per share 179
BALANCE SHEET DISCLOSURES 180
24 Intangible assets 180
25 Property, plant and equipment 182
26 Investment property 183
27 Investments in associates 183
28 Non-current fi nancial assets 183
29 Other non-current assets 184
30 Deferred taxes 184
31 Inventories 184
32 Income tax assets and liabilities 185
33 Receivables and other current assets 185
34 Current fi nancial assets 185
35 Cash and cash equivalents 185
36 Assets held for sale and liabilities associated with assets held for sale 185
37 Issued capital 186
38 Other reserves 187
39 Retained earnings 188
40 Equity attributable to Deutsche Post ag shareholders 189
41 Non-controlling interests 189
42 Provisions for pensions and similar obligations 189
43 Other provisions 195
44 Financial liabilities 196
45 Other liabilities 198
46 Trade payables 199
CASH FLOW DISCLOSURES 199
47 Cash fl ow disclosures 199
OTHER DISCLOSURES 201
48 Risks and fi nancial instruments of the Group 201
49 Contingent liabilities 215
50 Other fi nancial obligations 215
51 Litigation 216
52 Share-based payment 217
53 Related party disclosures 218
54 Auditor’s fees 221
55 Exercise of options under section 264 (3) of the hgb 222
56 Declaration of Conformity with the German Corporate Governance Code 222
57 Signifi cant events after the balance sheet date 222
58 List of shareholdings 223
RESPONSIBILITY STATEMENT 245
INDEPENDENT AUDITOR’S REPORT 246

1 January to 31 December
€ m
Note2010
adjusted 1
2011
Revenue 11 51,388 52,829
Other operating income 12 2,217 2,050
Total operating income 53,605 54,879
Materials expense 13 –29,380 –30,544
Staff costs 14 –16,609 –16,730
Depreciation, amortisation and impairment losses 15 –1,296 –1,274
Other operating expenses 16 – 4,485 –3,895
Total operating expenses – 51,770 – 52,443
Profi t from operating activities (ebit) 1,835 2,436
Net income from associates 17 56 60
Other fi nancial income 2,251 590
Other fi nance costs –1,335 –1,391
Foreign currency result 17 –36
Net other fi nancial income / net other fi nance costs 18 933 – 837
Net fi nancial income / net fi nance costs 989 –777
Profi t before income taxes 2,824 1,659
Income taxes 19 –194 –393
Consolidated net profi t for the period 20 2,630 1,266
attributable to Deutsche Post ag shareholders 2,541 1,163
attributable to non-controlling interests 21 89 103
Basic earnings per share (€) 22 2.10 0.96
Diluted earnings per share (€) 22 2.10 0.96
1 Note 5.
C.01 INCOME STATEMENT
Deutsche Post DHL Annual Report 2011
Consolidated Financial StatementsIncome Statement
151

1 January to 31 December
€ m
Note 2010 2011
Consolidated net profi t for the period 2,630 1,266
Currency translation reserve
Changes from unrealised gains and losses 522 193
Changes from realised gains and losses 20 –26
Other changes in retained earnings
Changes from unrealised gains and losses 1 1
Changes from realised gains and losses 0 0
Hedging reserve in accordance with ias 39
Changes from unrealised gains and losses – 67 – 5
Changes from realised gains and losses 109 2
Revaluation reserve in accordance with ias 39
Changes from unrealised gains and losses 6 –7
Changes from realised gains and losses –16 0
Revaluation reserve in accordance with ifrs 3
Changes from unrealised gains and losses –1 –1
Changes from realised gains and losses 0 0
Income taxes relating to components of other comprehensive income 19 1 –1
Share of other comprehensive income of associates (after tax) 93 10
Other comprehensive income (after tax) 668 166
Total comprehensive income 3,298 1,432
attributable to Deutsche Post ag shareholders 3,197 1,331
attributable to non-controlling interests 101 101
C.02 STATEMENT OF COMPREHENSIVE INCOME
Deutsche Post DHL Annual Report 2011152
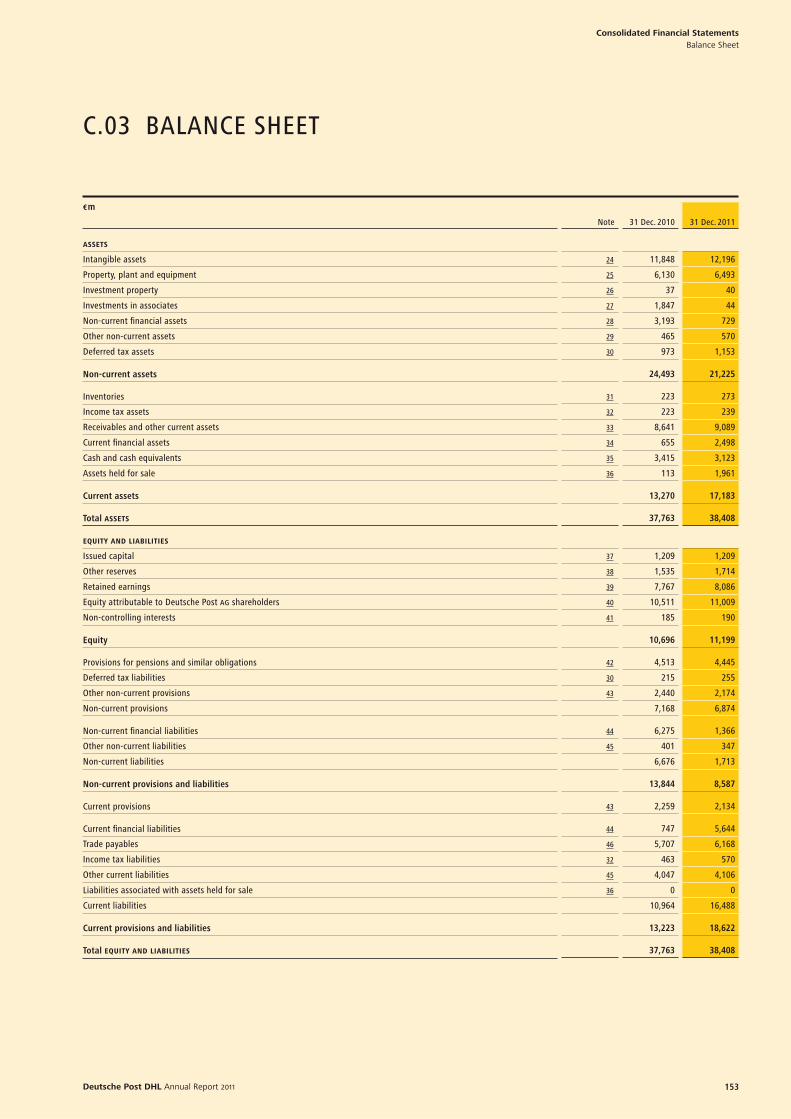
€ m
Note 31 Dec. 2010 31 Dec. 2011
assets
Intangible assets 24 11,848 12,196
Property, plant and equipment 25 6,130 6,493
Investment property 26 37 40
Investments in associates 27 1,847 44
Non-current fi nancial assets 28 3,193 729
Other non-current assets 29 465 570
Deferred tax assets 30 973 1,153
Non-current assets 24,493 21,225
Inventories 31 223 273
Income tax assets 32 223 239
Receivables and other current assets 33 8,641 9,089
Current fi nancial assets 34 655 2,498
Cash and cash equivalents 35 3,415 3,123
Assets held for sale 36 113 1,961
Current assets 13,270 17,183
Total assets 37,763 38,408
equity and liabilities
Issued capital 37 1,209 1,209
Other reserves 38 1,535 1,714
Retained earnings 39 7,767 8,086
Equity attributable to Deutsche Post ag shareholders 40 10,511 11,009
Non-controlling interests 41 185 190
Equity 10,696 11,199
Provisions for pensions and similar obligations 42 4,513 4,445
Deferred tax liabilities 30 215 255
Other non-current provisions 43 2,440 2,174
Non-current provisions 7,168 6,874
Non-current fi nancial liabilities 44 6,275 1,366
Other non-current liabilities 45 401 347
Non-current liabilities 6,676 1,713
Non-current provisions and liabilities 13,844 8,587
Current provisions 43 2,259 2,134
Current fi nancial liabilities 44 747 5,644
Trade payables 46 5,707 6,168
Income tax liabilities 32 463 570
Other current liabilities 45 4,047 4,106
Liabilities associated with assets held for sale 36 0 0
Current liabilities 10,964 16,488
Current provisions and liabilities 13,223 18,622
Total equity and liabilities 37,763 38,408
C.03 BALANCE SHEET
Deutsche Post DHL Annual Report 2011
Consolidated Financial StatementsBalance Sheet
153

1 January to 31 December
€ m
Note 2010 2011
Consolidated net profi t for the period attributable to Deutsche Post ag shareholders 1 2,541 1,163
Consolidated net profi t for the period attributable to non-controlling interests 89 103
Income taxes 194 393
Net other fi nancial income / net other fi nance costs – 933 837
Net income from associates – 56 – 60
Profi t from operating activities (ebit) 1,835 2,436
Depreciation, amortisation and impairment losses 1,296 1,274
Net loss / income from disposal of non-current assets 279 – 54
Non-cash income and expense 27 –7
Change in provisions – 953 – 897
Change in other non-current assets and liabilities –74 – 63
Income taxes paid –301 – 455
Net cash from operating activities before changes in working capital 2,109 2,234
Changes in working capital
Inventories 1 –37
Receivables and other current assets –1,258 – 406
Liabilities and other items 1,075 580
Net cash from operating activities 47.1 1,927 2,371
Subsidiaries and other business units –265 58
Property, plant and equipment and intangible assets 198 211
Other non-current fi nancial assets 55 16
Proceeds from disposal of non-current assets –12 285
Subsidiaries and other business units –74 – 84
Property, plant and equipment and intangible assets –1,174 –1,716
Other non-current fi nancial assets –28 – 80
Cash paid to acquire non-current assets –1,276 –1,880
Interest received 55 72
Dividend received 4 0
Current fi nancial assets 1,237 394
Net cash from / used in investing activities 47.2 8 –1,129
Proceeds from issuance of non-current fi nancial liabilities 20 18
Repayments of non-current fi nancial liabilities – 597 –338
Change in current fi nancial liabilities – 64 – 97
Other fi nancing activities 54 – 60
Proceeds from transactions with non-controlling interests 0 0
Cash paid for transactions with non-controlling interests –73 –1
Dividend paid to Deutsche Post ag shareholders –725 –786
Dividend paid to non-controlling interest holders –73 – 99
Purchase of treasury shares –10 –21
Interest paid –183 –163
Net cash used in fi nancing activities 47.3 –1,651 –1,547
Net change in cash and cash equivalents 284 –305
Effect of changes in exchange rates on cash and cash equivalents 67 13
Changes in cash and cash equivalents associated with assets held for sale 0 0
Changes in cash and cash equivalents due to changes in consolidated group 0 0
Cash and cash equivalents at beginning of reporting period 3,064 3,415
Cash and cash equivalents at end of reporting period 47.4 3,415 3,1231 The profi t before income taxes item on the basis of which cash fl ows are calculated has been changed to consolidated net profi t for the period attributable to Deutsche Post ag shareholders
to increase transparency. The presentation of the prior-year fi gures has been adjusted. This change did not affect the calculation.
C.04 CASH FLOW STATEMENT
Deutsche Post DHL Annual Report 2011154

C.05 STATEMENT OF CHANGES IN EQUITY
1 January to 31 December
€ m
Issued capital
Other reserves
Retained earnings
Equity attributable to Deutsche
Post ag shareholders
Non- controlling
interests Total equity Capital
reservesias 39
reserves
ifrs 3 revaluation
reserve
Currency translation
reserve
Note 37 38 38 38 38 39 40 41
Balance at 1 January 2010 1,209 2,147 –70 7 –1,215 6,098 8,176 97 8,273
Capital transactions with owner
Dividend 0 0 0 0 0 –725 –725 – 67 –792
Transactions with non- controlling interests 0 0 0 0 0 –147 –147 54 – 93
Changes in non-controlling interests due to changes in consolidated group 0 0 0 0 0 0 0 0 0
Purchase of treasury shares –1 0 0 0 0 – 9 –10 0 –10
Share Matching Scheme (issuance) 0 20 0 0 0 0 20 0 20
Share Matching Scheme (exercise) 1 – 9 0 0 0 8 0 0 0
– 862 –13 – 875
Total comprehensive income
Consolidated net profi t for the period 0 0 0 0 0 2,541 2,541 89 2,630
Currency translation differences 0 0 0 0 533 0 533 12 545
Other changes 0 0 123 –1 0 1 123 0 123
3,197 101 3,298
Balance at 31 December 2010 1,209 2,158 53 6 – 682 7,767 10,511 185 10,696
Balance at 1 January 2011 1,209 2,158 53 6 – 682 7,767 10,511 185 10,696
Capital transactions with owner
Dividend 0 0 0 0 0 –786 –786 – 99 – 885
Transactions with non- controlling interests 0 0 0 0 0 – 59 – 59 0 – 59
Changes in non-controlling interests due to changes in consolidated group 0 0 0 0 0 0 0 3 3
Purchase of treasury shares –2 0 0 0 0 –20 –22 0 –22
Share Matching Scheme (issuance) 0 33 0 0 0 0 33 0 33
Share Matching Scheme (exercise) 2 –21 0 0 0 20 1 0 1
– 833 – 96 – 929
Total comprehensive income
Consolidated net profi t for the period 0 0 0 0 0 1,163 1,163 103 1,266
Currency translation differences 0 0 0 0 165 0 165 –2 163
Other changes 0 0 3 –1 0 1 3 0 3
1,331 101 1,432
Balance at 31 December 2011 1,209 2,170 56 5 – 517 8,086 11,009 190 11,199
Deutsche Post DHL Annual Report 2011
Consolidated Financial StatementsStatement of Changes in Equity
155

NOTES TO THE CONSOLIDATED FINANCIAL STATEMENTS OF DEUTSCHE POST AG
BASIS OF PREPARATION
1 Basis of accounting
As a listed company, Deutsche Post AG prepared its consoli-
dated fi nancial statements in accordance with the International
Financial Reporting Standards (IFRS s), as adopted by the European
Union (EU), and the provisions of commercial law to be additionally
applied in accordance with section 315 a (1) of the Handels gesetzbuch
(HGB – German Commercial Code). Th e fi nancial statements
represent an annual fi nancial report within the meaning of the
Transparenzrichtlinie- Umsetzungsgesetz (TUG – Transparency Direc-
tive Implementing Act) (section 37 v of the Wert papierhandelsgesetz
(WpHG – German Securities Trading Act) dated 5 January 2007.
Th e requirements of the Standards applied have been satisfi ed
in full, and the consolidated fi nancial statements therefore provide
a true and fair view of the Group’s net assets, fi nancial position and
results of operations.
Th e consolidated fi nancial statements consist of the income
statement and the statement of comprehensive income, the balance
sheet, the cash fl ow statement, the statement of changes in equity
and the Notes. In order to improve the clarity of presentation, vari-
ous items in the balance sheet and in the income statement have
been combined. Th ese items are disclosed and explained separately
in the Notes. Th e income statement has been classifi ed in accord-
ance with the nature of expense method.
Th e accounting policies, as well as the explanations and dis-
closures in the Notes to the IFRS consolidated fi nancial statements
for fi nancial year 2011, are generally based on the same accounting
policies used in the 2010 consolidated fi nancial statements. Excep-
tions to this are the changes in international fi nancial reporting
under the IFRS s described in Note 4 that have been required to
be applied by the Group since 1 January 2011 and the adjustment
of prior-period amounts disclosed in Note 5. Th e accounting pol-
icies are explained in Note 7.
Th e fi nancial year of Deutsche Post AG and its consolidated
subsidiaries is the calendar year. Deutsche Post AG, whose regis-
tered offi ce is in Bonn, Germany, is entered in the commercial reg-
ister of the Bonn Local Court.
Th ese consolidated fi nancial statements were authorised for
issue by a resolution of the Board of Management of Deutsche
Post AG dated 17 February 2012.
Th e consolidated fi nancial statements are prepared in euros
(€). Unless otherwise stated, all amounts are given in millions of
euros (€ million, € m).
2 Consolidated group
In addition to Deutsche Post AG, the consolidated fi nancial
statements for the period ended 31 December 2011 include all Ger-
man and foreign companies in which Deutsche Post AG directly
or indirectly holds a majority of voting rights, or whose activities
it can control in some other way. Th e companies are consolidated
from the date on which the Group is able to exercise control.
Th e companies listed in the table below are consolidated in
addition to the parent company Deutsche Post AG.
Consolidated group
2010 2011
Number of fully consolidated companies ( subsidiaries)
German 80 76
Foreign 747 754
Number of proportionately consolidated joint ventures
German 1 1
Foreign 16 13
Number of companies accounted for using the equity method (associates) 1
German 28 31
Foreign 31 281 The interest in Deutsche Postbank ag has been measured in accordance with ifrs 5
since March 2011.
Th e complete list of the Group’s shareholdings in accordance
with section 313 (2) nos. 1 to 4 and (3) of the HGB can be found in
Note 58.
Acquisitions in 2011
Acquisitions, 2011
Country Segment Interest in %Date
of acquisitionName
Adcloud GmbH ( Adcloud), Cologne Germany mail 100 1 April 2011
Eurodifarm srl. (Eurodifarm), Lodi Italy supply chain 100 11 May 2011
Standard Forward-ing llc (Standard Forwarding), East Moline usa
global forwarding, freight 100 1 June 2011
Tag EquityCo Limited (Tag Equity), Grand Cayman
Cayman Islands supply chain 100 11 July 2011
LifeConEx llc (LifeConEx), Plantation usa
global forwarding, freight 100 29 July 2011
Post Logistics Australasia, Melbourne (Post Logistics Australasia) Australia supply chain Asset deal
1 October 2011
Deutsche Post DHL Annual Report 2011156

Insignifi cant acquisitions in 2011
In the period up to 31 December 2011, Deutsche Post DHL
acquired further subsidiaries that did not materially aff ect the
Group’s net assets, fi nancial position and results of operations,
either individually or in the aggregate. Th ese insignifi cant acquisi-
tions are presented in the following:
Adcloud is a specialised provider of internet advertising space
marketing and placement services. Eurodifarm is a specialist in the
temperature-controlled distribution of pharmaceutical and diag -
nostic products. Standard Forwarding, a US company in the for-
warding business, was acquired in order to expand capacity in
the Freight business unit. Deutsche Post DHL acquired all of the
shares of its LifeConEx LLC, USA, joint venture, previously held by
LCAG USA Inc., USA. Th is company provides end-to-end cold chain
logistics services for the life sciences industry. Th e change in the
method of consolidation resulted in a gain of € 1.3 million, which
is reported in other operating income. Under the terms of an asset
deal, DHL Supply Chain Pty. Limited, Australia, has acquired from
Post Logistics Australasia assets and liabilities relating to its road
freight transport and warehousing and storage services.
Insignifi cant acquisitions, 2011
€ m Carrying amount Adjustments Fair value1 January to 31 December
assets
Non-current assets 17 – 17
Current assets 25 – 25
Cash and cash equivalents 8 – 8
50 – 50
equity and liabilities
Non-current liabilities and provisions 6 – 6
Current liabilities and provisions 40 – 40
46 – 46
Net assets 4
Goodwill, 2011
€ m
Fair value
Cost 63
Less net assets 4
Plus effects from change in consolidation method 1
Goodwill 60
Th e transaction costs for the insignifi cant acquisitions
amounted to € 2.6 million.
acquisition of tag equityIn mid-July 2011, Deutsche Post DHL acquired the company
Tag EquityCo Limited, Cayman Islands, together with its subsid-
iaries. Tag Equity is an international provider of marketing execu-
tion and production services. Th e company has been assigned to
the Williams Lea business unit within the SUPPLY CHAIN segment.
Final purchase price allocation is presented in the following tables.
Final purchase price allocation for Tag Equity
€ m Carrying amount Adjustments Fair value
assets
Non-current assets 13 – 13
Customer relationships – 47 47
Brand name – 4 4
Software – 11 11
Current assets 54 – 54
Cash and cash equivalents 5 – 5
72 62 134
equity and liabilities
Non-current liabilities and provisions – – –
Deferred tax liabilities – 16 16
Current liabilities and provisions 102 – 102
102 16 118
Net assets 16
Th e customer relationships will be amortised over 20 years
using the straight-line method, whilst the soft ware will be amor-
tised over fi ve years. Th e brand name has an indefi nite useful life.
Goodwill for Tag Equity
€ m
Fair value
Cost 91
Less net assets 16
Goodwill 75
Th e transaction costs for this acquisition amounted to € 6 mil-
lion. In addition, shareholder loans of € 33 million were repaid.
Th e companies contributed € 76 million to consolidated rev-
enue and € 11 million to consolidated EBIT since the date of initial
consolidation. Inclusion of the companies as at 1 January 2011
would have aff ected consolidated revenue by adding € 67 million
and consolidated EBIT by adding € 8 million.
Deutsche Post DHL Annual Report 2011
Consolidated Financial StatementsNotes
Basis of preparation
157

Insignifi cant acquisitions, 2010
€ m Carrying amount Adjustments Fair value1 January to 31 December
assets
Non-current assets 0 – 0
Current assets 1 – 1
Cash and cash equivalents 0 – 0
1 – 1
equity and liabilities
Non-current liabilities and provisions 0 – 0
Current liabilities and provisions 0 – 0
0 – 0
Net assets 1
Goodwill, 2010
€ m
Fair value
Cost 23
Less net assets 1
Difference 22
Less non-controlling interests 1 2
Goodwill 201 Non-controlling interests were recognised at their carrying amount.
Inclusion of the companies as at 1 January 2010 would not
have materially aff ected consolidated revenue and consolidated EBIT.
A total of € 23 million was spent in fi nancial year 2010 on
acquiring subsidiaries and € 51 million for subsidiaries acquired
in previous years. Th e purchase prices of the acquired companies
were paid in cash. Further information about cash fl ows can be
found in Note 47.
Variable purchase prices, which are given in the table below,
were agreed for the acquisitions:
Contingent consideration
Period for fi nancial
years from / toResults
range from
Fair value of payment obligationBasis
Revenue and gross income 2011 to 2013€ 0 to € 25
million € 5.8 million
ebitda2011
and 2012 unlimited € 1 million
Revenue and ebitda 2011 to 2013€ 0 to
€ 3 million € 2 million
Th e insignifi cant companies contributed € 68 million to con-
solidated revenue and €–3 million to consolidated EBIT since the
date of initial consolidation. Inclusion of the companies as at 1 Jan-
uary 2011 would not have materially aff ected consolidated revenue
and consolidated EBIT.
€ 98 million was expended on purchasing subsidiaries in
the period up to 31 December 2011, plus a further € 8 million
for subsidiaries already acquired in previous years. In addition,
Deutsche Post DHL received € 8 million in purchase price adjust-
ments relating to companies acquired in previous years. Th e pur-
chase prices of the acquired companies were paid in cash.
Acquisitions in 2010
In the period up to 31 December 2010, Deutsche Post DHL
acquired two entities that did not materially aff ect the Group’s net
assets, fi nancial position and results of operations either individu-
ally or in the aggregate.
Deutsche Post DHL Annual Report 2011158

Disposal and deconsolidation effects in 2011
Th e disposal and deconsolidation eff ects of companies and
business units in fi nancial year 2011 were as follows:
Disposal and deconsolidation effects, 2011
€ m Exel Transpor-tation Services
dhl Express Canada Miscellaneous Total1 January to 31 December
Non-current assets 0 11 2 13
Current assets 0 2 0 2
Assets held for sale 1 113 0 18 131
Cash and cash equivalents 0 0 10 10
Assets 113 13 30 156
Non-current liabilities and provisions 0 0 0 0
Current liabilities and provisions 0 5 11 16
Liabilities associated with assets held for sale 1 62 0 11 73
Equities and liabilities 62 5 22 89
Net assets 51 8 8 67
Total consideration received 55 10 2 67
Income (+) / expenses (–) from the currency translation reserve 24 1 1 26
Non-controlling interests 0 0 3 3
Deconsolidation gain (+) / loss (–) 28 3 –2 291 Data before deconsolidation.
Disposal gains are shown under other operating income;
disposal losses are reported under other operating expenses.
supply chain segmentIn April 2011, Deutsche Post DHL sold the freight forwarding
company Exel Transportation Services Inc., USA, including Exel
Trucking Inc., USA, and Exel Transportation Services Inc. (Can-
a dian Branch), Canada, to the US-based Hub Group. Th e assets
and liabilities as at 31 March 2011 were presented as held for sale in
accordance with IFRS 5.
express segmentAt the end of June 2011, DHL Express Canada sold its domes-
tic Canadian express business to TransForce, a transport company.
Th e two companies have entered into a ten-year strategic alliance.
Th e domestic express business is to be handled by TransForce’s
Loomis Express subsidiary. DHL Express Canada will continue to
provide international express services.
Th e sale of four Chinese companies, the sale of assets of the
Australian company Western Australia and the sale of Northern
Kope Parcel Express, Australia, are reported in the Miscellaneous
column. Th e assets and liabilities had previously been classifi ed in
accordance with IFRS 5.
global forwarding, freight segmentPart of the transport and warehouse services business of DHL
Freight Netherlands B. V., the Netherlands, was sold in the third
quarter of 2011. Th e eff ects are presented in the Miscellaneous
column.
Deutsche Post DHL Annual Report 2011
Consolidated Financial StatementsNotes
Basis of preparation
159

Th e consolidated joint ventures relate primarily to Express
Couriers Ltd., New Zealand, EV Logistics, Canada, AeroLogic
GmbH, Germany, and Bahwan Exel LLC, Oman. Shareholdings
are disclosed in Note 58.
3 Signifi cant transactions
planned sale of deutsche postbank groupOn 25 February 2009, Deutsche Bank AG received a 22.9 %
interest in Deutsche Postbank AG from Deutsche Post DHL in re-
turn for 50 million Deutsche Bank shares from a capital increase.
Th e Deutsche Bank AG share package was sold on the market in
the period up to the beginning of July 2009. 25 million shares
were fully collateralised using a forward and call / put transaction.
Th e additional proceeds generated from this transaction are due
to Deutsche Bank AG and have been deposited with Deutsche
Bank AG as collateral. Settlement for the derivatives and thus the
release of the collateral will take place upon exercise of the man-
datory exchangeable bond in 2012. Th e sale of the interest in
Deutsche Postbank AG aff ected earnings in 2009 by € 571 million.
Of this amount, € 444 million is due to the deconsolidation gain.
Eff ective 1 January 2010, the IASB clarifi ed the scope exemp-
tion in IAS 39.2 (g) with regard to the maturity of transactions
related to the sale of shares required for settlement. Forward trans-
actions no longer fall under the exemption provided by IAS 39.2 (g)
if it is clear upon the conclusion of a contract that the settlement of
such transactions exceeds the time required. For the presentation
of the planned Postbank sale, this means that the forward trans-
action embedded in the mandatory exchangeable bond, which was
previously not recognised, must now be recognised. Th e forward
transaction was recognised in profi t or loss as at 1 January 2010 at
its fair value of € 1,453 million. Th e value of the forward transaction
was € 1,493 million as at 31 December 2011. Changes in fair value of
€ –160 million in 2011 (previous year: € 200 million) are presented
in net other fi nancial income / net other fi nance costs; Note 18.
Disposal and deconsolidation effects in 2010
Disposal and deconsolidation effects, 2010
€ m
dhl Express uk
dhl Express France; dhl
Freight Francedhl Supply
Chain Austria Miscellaneous Total1 January to 31 December
Non-current assets 0 1 37 1 39
Current assets 0 0 36 0 36
Assets held for sale 1 54 69 0 5 128
Cash and cash equivalents 0 0 7 0 7
Assets 54 70 80 6 210
Non-current liabilities and provisions 0 0 19 0 19
Current liabilities and provisions 0 0 47 0 47
Liabilities associated with assets held for sale 1 39 91 0 2 132
Equity and liabilities 39 91 66 2 198
Net assets 15 –21 14 4 12
Total consideration received –26 –243 1 4 –264
Income (+) / expenses (–) from the currency translation reserve –12 0 0 0 –12
Deconsolidation gain (+) / loss (–) – 53 –222 –13 0 –2881 Data before deconsolidation.
In March of the previous year, DHL Express UK sold its
day-defi nite domestic business. In April, DHL Supply Chain
Austria sold parts of its contract logistics operations. Th e sale of
DHL Express France’s day-defi nite domestic business, and of DHL
Freight France’s champagne business, was completed in June. Th e
disposal eff ects attributable to Fulfi lment Plus GmbH, Germany,
Exel Delamode Logistics SRL, Romania, and Innogistics LLC, USA,
are presented together in the Miscellaneous column. Th e decon-
solidations resulted in an aggregate loss of € 288 million, which is
reported under other operating expenses.
Joint ventures
Th e following table provides information about the balance
sheet and income statement items attributable to the signifi cant
joint ventures included in the consolidated fi nancial statements:
As at 31 December
€ m
2010 1 2011 1
balance sheet
Intangible assets 97 100
Property, plant and equipment 20 24
Receivables and other assets 64 73
Cash and cash equivalents 16 17
Trade payables, other liabilities 68 66
Provisions 12 17
Financial liabilities 63 63
income statement
Revenue 2 260 271
Profi t from operating activities (ebit) 13 221 Proportionate single-entity fi nancial statement data.2 Revenue excluding intra-group revenue.
Deutsche Post DHL Annual Report 2011160

4 New developments in international accounting under ifrs s
Th e following Standards, changes to Standards and Interpre-
tations are required to be applied on or aft er 1 January 2011:
Effective for fi nancial years beginning on
or after Signifi cance
ias 32 (Financial Instruments: Presentation) 1 February 2010Relevant, not signifi cant
Improvements to ifrs s (2010)1 July 2010 /
1 January 2011Relevant, not signifi cant
ifric 19 (Extinguishing Financial Liabilities with Equity Instruments) 1 July 2010
Relevant, not signifi cant
ias 24 (Related Party Disclosures) 1 January 2011
Early application of partial exemp-tion; relevant
ifric 14 (Prepayments of a Minimum Funding Requirement) 1 January 2011
Relevant, not signifi cant
Th e amendment to IAS 32 (Financial Instruments: Presen-
tation) regarding the classifi cation of rights issues requires rights,
options and warrants on a fi xed number of the entity’s own equity
instruments for a fi xed amount of any currency to be reported as
equity instruments if they are off ered pro rata to all existing owners
of the same class of equity instruments. Th e amendments had no
material eff ect on the consolidated fi nancial statements.
On 6 May 2010, the IASB issued its minor annual Improve-
ments to IFRS s. Unless otherwise provided for in individual cases,
the changes are required to be applied retrospectively for the fi rst
time for fi nancial years commencing on or aft er 1 January 2011.
Th e changes had no signifi cant infl uence on the consolidated fi nan-
cial statements.
IFRIC 19 (Extinguishing Financial Liabilities with Equity
Instruments) clarifi es how to account for equity instruments if
an entity renegotiates the terms of a fi nancial liability and issues
equity instruments to fully or partially extinguish the fi nancial
liability. Th e eff ects on the consolidated fi nancial statements were
insignifi cant.
Th e amendments to IAS 24 (Related Party Disclosures) pri-
marily comprise modifi ed defi nitions, the introduction of a par-
tial exemption from the disclosure requirements for government-
related entities and clarifi cation that executory contracts are also
reportable transactions. Deutsche Post DHL has applied the partial
exemption since 31 December 2010. Th e changes result in addi-
tional disclosure requirements.
As part of the planned sale of Deutsche Postbank shares, an
additional interest of 27.4 % will be transferred to Deutsche Bank AG
aft er three years, in February 2012, when a mandatory exchange-
able bond on Postbank shares becomes due (second tranche). Th e
mandatory exchangeable bond was issued by Deutsche Post AG
in February 2009 and was fully subscribed by Deutsche Bank AG.
Th e bond will be exercised through the transfer of 60 million
Deutsche Postbank AG shares. As at 31 December 2011, the liability
amounted to around € 2.9 billion including interest (previous year:
€ 2.8 billion). In a third tranche, Deutsche Post AG and Deutsche
Bank AG have agreed on options for the possible sale / purchase of
a further 12.1 % of the Postbank shares. Th e exercise period for the
options commences on the fi rst working day aft er the exercise of
the mandatory exchangeable bond and ends in February 2013.
As the planned Postbank sale is expected to occur in the fi rst
quarter of 2012, all related non-current assets and liabilities were
reported as current assets and liabilities. Th e options have been re-
ported under current fi nancial assets and current fi nancial liabil-
ities since the fi rst quarter of 2011. Deutsche Bank AG provided col-
lateral in the amount of around € 1.2 billion for the purchase price
of the remaining 12.1 % of Postbank shares, which is recognised in
current fi nancial liabilities along with the interest expense.
Th e remaining 39.5 % interest in Deutsche Postbank AG previ-
ously accounted for using the equity method and presented under
investments in associates was reclassifi ed as held for sale at the end
of February 2011; Note 36.
Th e eff ects of the planned Postbank sale are as follows for 2011:
Effects of the planned Postbank sale
€ m
2010 2011
balance sheet
Investments in associates / assets held for sale 1,797 1,916
Non-current / current fi nancial assets 2,509 2,278
Non-current / current fi nancial liabilities 4,164 4,344
income statement
Net income from associates 52 58
Net other fi nancial income / net other fi nance costs 1,517 –359
See Note 57 for further developments in relation to the
Postbank sale.
Deutsche Post DHL Annual Report 2011
Consolidated Financial StatementsNotes
Basis of preparation
161

Issue date
Effective for fi nancial years
beginning on or after Signifi cance
ifrs 9 (Financial Instruments)12 November
20091 January
2015 Under review
Severe Hyperinfl ation and Removal of Fixed Dates for First-time Adopters (Amendments to ifrs 1)
20 December 2010 1 July 2011 Irrelevant
Deferred Tax: Recovery of Under-lying Assets (Amendments to ias 12)
20 December 2010
1 January 2012 Under review
ifrs 10 (Consolidated Financial Statements) 12 May 2011
1 January 2013 Under review
ifrs 11 (Joint Arrangements) 12 May 20111 January
2013 Under review
ifrs 12 (Disclosures of Interests in Other Entities) 12 May 2011
1 January 2013
Increased disclosure requirements
ias 27 (Separate Financial Statements) 12 May 2011
1 January 2013 Under review
ias 28 (Investments in Associates and Joint Ventures) 12 May 2011
1 January 2013 Under review
ifrs 13 (Fair Value Measurement) 12 May 20111 January
2013
Increased disclosure requirements
Presentation of Items of Other Comprehensive Income ( Amendments to ias 1) 16 June 2011 1 July 2012
Relevant, not signifi cant
Amendments to ias 19 ( Employee Benefi ts) 16 June 2011
1 January 2013 Relevant
ifric 20 (Stripping Costs in the Production Phase of a Surface Mine)
19 October 2011
1 January 2013 Irrelevant
Offsetting Financial Assets and Financial Liabilities (Amendments to ias 32 (Financial Instruments))
16 December 2011
1 January 2014 Under review
Disclosures – Offsetting Financial Assets and Financial Liabilities (Amendments to ifrs 7 (Financial Instruments: Disclosures))
16 December 2011
1 January 2013 Under review
On 12 November 2009, the IASB issued IFRS 9 (Financial
Instruments), the objective of which is to lay down principles for
the classifi cation and measurement of fi nancial instruments. IFRS 9
initially introduced new guidance for the classifi cation and meas-
urement of fi nancial assets. Additional guidance on the recognition,
classifi cation and measurement of liabilities was issued by the IASB
on 28 November 2010. Th e exposure draft s on Amortised Cost
and Impairment dated 5 November 2009 and Hedge Accounting
dated 9 December 2010 are currently being discussed with the aim
of including both draft s in IFRS 9 following fi nal discussion, and
hence of replacing IAS 39. Th is guidance is required to be applied
retrospectively for the fi rst time for fi nancial years beginning on or
aft er 1 January 2015. Earlier application is permitted. Th e EU has
deferred the decision on whether to endorse this Standard for the
time being. Th e corresponding eff ects on the Group of the parts of
IFRS 9 that have already been issued are being assessed.
Th e amendments to IFRIC 14 (Prepayments of a Minimum
Funding Requirement) are relevant if a pension plan provides for a
minimum funding requirement and the entity makes prepayments
towards this. In comparison with the existing rules, the economic
benefi t of prepayments by an entity that reduce future contribu-
tions due to the minimum funding requirement is recognised as an
asset. Th e application of the amended Interpretation has no mater-
ial eff ect on the consolidated fi nancial statements.
New accounting pronouncements adopted by the eu
and required to be applied in future
Th e following Standards, changes to Standards and Interpre-
tations have already been endorsed by the European Union. How-
ever, they will only be required to be applied in the future.
Effective for fi nancial years beginning on
or after Signifi cance
Disclosures – Transfers of Financial Assets (Amendments to ifrs 7) 1 July 2011
Relevant, not signifi cant
Th e amendments to IFRS 7 (Financial Instruments: Disclos-
ures) concern additional disclosure requirements for transfers of
fi nancial assets that should enable users of fi nancial statements to
gain a better understanding of the eff ects of risks remaining with
the entity. Th e amendments are eff ective for fi nancial years be-
ginning on or aft er 1 July 2011. Th e eff ects on the Group are not
signifi cant.
New accounting requirements not yet adopted by the eu
(endorsement procedure)
Th e IASB and the IFRIC issued further Standards and Inter-
pretations in fi nancial year 2011 and in previous years whose appli-
cation is not yet mandatory for fi nancial year 2011. Th e application
of these IFRS s is dependent on their adoption by the EU.
Deutsche Post DHL Annual Report 2011162

On 12 May 2011, IFRS 13 (Fair Value Measurement) was is-
sued, which sets out a uniform, cross-standard framework for the
measurement of fair value. In addition, IFRS 13 requires a specifi c
presentation of the techniques used to determine fair value. Th e
application of the new standard will result in additional disclosure
requirements.
Th e amendments to IAS 1 (Presentation of Items of Other
Comprehensive Income) require entities in future to classify items
presented in other comprehensive income by whether or not they
will be reclassifi ed to profi t or loss in subsequent periods (recycl-
ing). Th e amendments have no signifi cant eff ect on the consoli-
dated fi nan cial statements.
On 16 June 2011, the IASB issued a revised version of IAS 19
(Employee Benefi ts). Th ese requirements signifi cantly aff ect the
recognition and measurement of the cost of defi ned benefi t plans
and termination benefi ts. Furthermore, there are corresponding
eff ects on the balance sheet and additional disclosure requirements
for employee benefi ts. In relation to defi ned benefi t plans, the recog-
nition of actuarial gains and losses (remeasurements) in other com-
prehensive income for the period, and the future use of a uniform
discount rate for provisions for pensions and similar obligations,
and for pension assets, are of particular signifi cance. Th e eff ects
of the detailed requirements on the recognition of administrative
expenses are still being assessed. Th e same applies to the changes in
relation to the classifi cation of termination benefi ts.
Th e amendments to IAS 32 (Financial Instruments: Presenta-
tion) provide clarifi cation on the conditions for the off setting of
fi nancial assets and liabilities in the balance sheet. A right of set-
off must be legally enforceable for all counterparties, both in the
normal course of business and also in the event of insolvency, and
it must exist at the balance sheet date. In addition, the Standard
specifi es which gross settlement systems can be regarded as net
settlement for this purpose. Th e additions to IFRS 7 arising from
these amendments require comprehensive disclosure of the rights
of set-off , especially for those rights that do not result in off setting
under IFRS s.
Th e amendment to IAS 12 (Deferred Tax: Recovery of Under-
lying Assets) introduces a mandatory rebuttable presumption in
respect of the treatment of temporary taxable diff erences for invest-
ment properties where the fair value model is applied in accordance
with IAS 40. Th e new rule is important for countries where the tax
rules governing the use and the sale of such assets diff er. As part
of this amendment, SIC-21 (Income Taxes – Recovery of Revalued
Non-Depreciable Assets) was also incorporated into IAS 12. Th e ef-
fects on the consolidated fi nancial statements are being assessed.
IFRS 10 (Consolidated Financial Statements) introduces a
uniform defi nition of control for all entities that are to be consoli-
dated in the consolidated fi nancial statements. Th e standard also
contains comprehensive requirements on determining a relation-
ship where control exists. IFRS 10 supersedes IAS 27 (Consolidated
and Separate Financial Statements) as well as SIC-12 (Consolida-
tion – Special Purpose Entities). Special purpose entities previ-
ously consolidated in accordance with SIC-12 are now subject to
IFRS 10. Th e eff ects on the Group are currently being assessed.
IFRS 11 (Joint Arrangements) supersedes IAS 31 (Interests
in Joint Ventures). Th e previous option to proportionately con-
solidate for joint ventures has been removed. Changes in the new
Standard’s terminology and the classifi cation of entities as joint
ventures must, however, be considered, and not all joint ventures
that are currently subject to proportionate consolidation will have
to be accounted for under the equity method in the future. IFRS 11
provides a uniform defi nition of the term “joint arrangements”
and distinguishes between joint operations and joint ventures. Th e
interest in a joint operation is recognised on the basis of direct
rights and obligations, whereas the interest in the profi t or loss of a
joint venture must be accounted for under the equity method. Th e
mandatory application of the equity method to joint ventures will
now follow the requirements of the revised IAS 28 (Investments in
Associates and Joint Ventures). Th e eff ects on the Group are cur-
rently being assessed.
IFRS 12 (Disclosure of Interests in Other Entities) combines
the disclosure requirements for all interests in subsidiaries, joint
ventures, associates and unconsolidated structured entities into
a single standard. Under IFRS 12, an entity is required to provide
quantitative and qualitative disclosures about the types of risks
and fi nancial eff ects associated with the entity’s interests in other
en tities. IFRS 12 results in increased disclosure requirements.
Th e existing standards IAS 27 (Consolidated and Separate
Finan cial Statements) and IAS 28 (Investments in Associates) were
revised in conjunction with the new standards IFRS 10, IFRS 11 and
IFRS 12. IAS 27 (Separate Financial Statements) (revised 2011) now
only contains requirements applicable to separate fi nancial state-
ments. IAS 28 was renamed as IAS 28 (Investment in Associates
and Joint Ventures) (revised 2011) and the scope of application was
extended to include accounting for joint ventures under the equity
method. Th e requirements of SIC-13 (Jointly Controlled Entities –
Non-Monetary Contributions by Venturers) were incorporated
into IAS 28.
Deutsche Post DHL Annual Report 2011
Consolidated Financial StatementsNotes
Basis of preparation
163

Th e carrying amounts of non-monetary assets recognised at
consolidated companies operating in hyperinfl ationary economies
are generally indexed in accordance with IAS 29 and thus refl ect
the current purchasing power at the balance sheet date.
In accordance with IAS 21, receivables and liabilities in the
fi nancial statements of consolidated companies that have been
prepared in local currencies are translated at the closing rate as
at the balance sheet date. Currency translation diff erences are rec-
ognised in other operating income and expenses in the income
statement. In fi nancial year 2011, income of € 185 million (previ-
ous year: € 197 million) and expenses of € 189 million (previous
year: € 195 million) resulted from currency translation diff erences.
In contrast, currency translation diff erences relating to net invest-
ments in a foreign operation are recognised in other comprehen-
sive income.
7 Accounting policies
Uniform accounting policies are applied to the annual
fi nan cial statements of the entities that have been included in the
consolid ated fi nancial statements. Th e consolidated fi nancial state-
ments are prepared under the historical cost convention, except
where items are required to be recognised at their fair value.
Revenue and expense recognition
Deutsche Post DHL’s normal business operations consist of
the provision of logistics services. All income relating to normal
business operations is recognised as revenue in the income state-
ment. All other income is reported as other operating income.
Revenue and other operating income is generally recognised when
services are rendered, the amount of revenue and income can be
reliably measured and in all probability the economic benefi ts
from the transactions will fl ow to the Group. Operating expenses
are recognised in income when the service is utilised or when the
expenses are incurred.
Intangible assets
Intangible assets are measured at amortised cost. Intangible
assets comprise internally generated and purchased intangible
assets and purchased goodwill.
Internally generated intangible assets are capitalised at cost
if it is probable that their production will generate an infl ow of
future economic benefi ts and the costs can be reliably measured.
In the Group, this concerns internally developed soft ware. If the
criteria for capitalisation are not met, the expenses are recognised
immediately in income in the year in which they are incurred. In
addition to direct costs, the production cost of internally devel-
oped soft ware includes an appropriate share of allocable produc-
tion overhead costs. Any borrowing costs incurred for qualifying
assets are included in the production cost. Value added tax arising
in conjunction with the acquisition or production of intangible
assets is included in the cost if it cannot be deducted as input tax.
Capitalised soft ware is amortised using the straight-line method
over useful lives of between two and fi ve years.
5 Adjustment of prior-period amounts
Income statement
€ m 2010 Adjustments 2010adjusted
Revenue 51,481 – 93 51,388
Materials expense –29,473 93 –29,380
Up until the third quarter of 2011, part of the reduction in
income attributable to customer discounts was recognised under
materials expense rather than revenue. Th e prior-period amounts
were adjusted. No opening balance sheet as at 1 January 2010 is
presented because it was not aff ected by the adjustment.
6 Currency translation
Th e fi nancial statements of consolidated companies prepared
in foreign currencies are translated into euros (€) in accordance
with IAS 21 using the functional currency method. Th e functional
currency of foreign companies is determined by the primary eco-
nomic environment in which they mainly generate and use cash.
Within the Group, the functional currency is predominantly the
local currency. In the consolidated fi nancial statements, assets and
liabilities are therefore translated at the closing rates, whilst peri-
odic income and expenses are generally translated at the monthly
closing rates. Th e resulting currency translation diff erences are
recognised in other comprehensive income. In fi nancial year 2011,
currency translation diff erences amounting to € 165 million (previ-
ous year: € 533 million) were recognised in other comprehensive
income (see the statement of comprehensive income and statement
of changes in equity).
Goodwill arising from business combinations aft er 1 Janu-
ary 2005 is treated as an asset of the acquired company and there-
fore carried in the functional currency of the acquired company.
Th e exchange rates for the currencies that are signifi cant for
the Group were as follows:
Closing rates Average rates
Currency Country2010
EUR 1 =2011
EUR 1 =2010
EUR 1 =2011
EUR 1 =
usd usa 1.34 1.29 1.32 1.40
chf Switzerland 1.25 1.22 1.37 1.23
gbp uk 0.86 0.84 0.86 0.87
sek Sweden 8.97 8.93 9.49 9.01
Deutsche Post DHL Annual Report 2011164

Impairment
At each balance sheet date, the carrying amounts of intan-
gible assets, property, plant and equipment and investment prop-
erty are reviewed for indications of impairment. If there are any
such indications, an impairment test must be carried out. Th is is
done by determining the recoverable amount of the relevant asset
and comparing it with the carrying amount.
In accordance with IAS 36, the recoverable amount is the
asset’s fair value less costs to sell or its value in use, whichever is
higher. Th e value in use is the present value of the pre-tax cash
fl ows expected to be derived from the asset in future. Th e discount
rate used is a pre-tax rate of interest refl ecting current market
conditions. If the recoverable amount cannot be determined for
an individual asset, the recoverable amount is determined for the
smallest identifi able group of assets to which the asset in question
can be allocated and which generates independent cash fl ows (cash
generating unit – CGU). If the recoverable amount of an asset is
lower than its carrying amount, an impairment loss is recognised
immediately in respect of the asset. If, aft er an impairment loss has
been recognised, a higher recoverable amount is determined for
the asset or the CGU at a later date, the impairment loss is reversed
up to a carrying amount that does not exceed the recoverable
amount. Th e increased carrying amount attributable to the rever-
sal of the impairment loss is limited to the carrying amount that
would have been determined (net of amortisation or depreciation)
if no impairment loss had been recognised in the past. Th e rever-
sal of the impairment loss is recognised in the income statement.
Impairment losses recognised in respect of goodwill may not be
reversed.
Since January 2005, goodwill has been accounted for using
the impairment-only approach in accordance with IFRS 3. Th is
stipulates that goodwill must be subsequently measured at cost,
less any cumulative adjustments from impairment losses. Pur-
chased goodwill is therefore no longer amortised and instead is
tested for impairment annually in accordance with IAS 36, regard-
less of whether any indication of possible impairment exists, as in
the case of intangible assets with an indefi nite useful life. In addi-
tion, the obligation remains to conduct an impairment test if there
is any indication of impairment. Goodwill resulting from company
acquisitions is allocated to the identifi able groups of assets (CGU s
or groups of CGU s) that are expected to benefi t from the synergies
of the acquisition. Th ese groups represent the lowest reporting level
at which the goodwill is monitored for internal management pur-
poses. Th e carrying amount of a CGU to which goodwill has been
allocated is tested for impairment annually and whenever there is
an indication that the unit may be impaired. Where impairment
losses are recognised in connection with a CGU to which goodwill
has been allocated, the existing carrying amount of the goodwill
is reduced fi rst. If the amount of the impairment loss exceeds the
carrying amount of the goodwill, the diff erence is allocated to the
remaining non-current assets in the CGU.
Intangible assets are amortised using the straight-line
method over their useful lives. Licences are amortised over the
term of the licence agreement. Capitalised customer relationships
are amortised using the straight-line method over a period of fi ve
to 20 years. Impairment losses are recognised in accordance with
the principles described in the section headed Impairment.
Intangible assets that are not aff ected by legal, economic,
contractual, or other factors that might restrict their useful lives
are considered to have indefi nite useful lives. Th ey are not amor-
tised but are tested for impairment annually or whenever there
are indications of impairment. Th ey mainly include brand names
from business combinations. Impairment testing is carried out in
accordance with the principles described in the section headed
Impairment.
Property, plant and equipment
Property, plant and equipment is carried at cost, reduced by
accumulated depreciation and valuation allowances. In addition
to direct costs, production cost includes an appropriate share of
allocable production overhead costs. Borrowing costs that can be
allocated directly to the purchase, construction or manufacture
of property, plant and equipment are capitalised. Value added tax
arising in conjunction with the acquisition or production of items
of property, plant or equipment is included in the cost if it cannot
be deducted as input tax. Depreciation is generally charged using
the straight-line method. Th e Group uses the estimated useful lives
indicated below for depreciation.
Useful lives
years
2010 2011
Buildings 5 to 50 5 to 50
Technical equipment and machinery 3 to 10 3 to 10
Passenger vehicles 4 to 6 4 to 6
Trucks 5 to 8 5 to 8
Aircraft 15 to 20 15 to 20
Other vehicles 3 to 8 3 to 8
it systems 3 to 8 3 to 8
Other operating and offi ce equipment 3 to 10 3 to 10
If there are indications of impairment, an impairment test
must be carried out; see the section headed Impairment.
Deutsche Post DHL Annual Report 2011
Consolidated Financial StatementsNotes
Basis of preparation
165

Fair value option
Th e Group applied the fair value option for the fi rst time for
fi nancial year 2006. Under this option, fi nancial assets or fi nan-
cial liabilities may be measured at fair value through profi t or loss
on initial recognition if this eliminates or signifi cantly reduces a
measurement or recognition inconsistency (accounting mismatch).
Th e Group makes use of the option in order to avoid accounting
mismatches.
Financial assets
Financial assets are accounted for in accordance with the pro-
visions of IAS 39, which distinguishes between four categories of
fi nancial instruments.
available-for-sale financial assetsTh ese fi nancial instruments are non-derivative fi nancial
assets and are carried at their fair value, where this can be meas-
ured reliably. If a fair value cannot be determined, they are carried
at cost. Changes in fair value between reporting dates are generally
recognised in other comprehensive income (revaluation reserve).
Th e reserve is reversed to income either upon disposal or if the fair
value falls below cost more than temporarily. If, at a subsequent
balance sheet date, the fair value of a debt instrument has increased
objectively as a result of events occurring aft er the impairment loss
was recognised, the impairment loss is reversed in the appropriate
amount. Impairment losses recognised in respect of equity instru-
ments may not be reversed to income. If equity instruments are
recognised at fair value, any reversals must be recognised in other
comprehensive income. No reversals may be made in the case of
equity instruments that were recognised at cost. Available-for-sale
fi nancial instruments are allocated to non-current assets unless
the intention is to dispose of them within 12 months of the bal-
ance sheet date. In particular, investments in unconsolidated sub-
sidiaries, marketable securities and other equity investments are
reported in this category.
held-to-maturity financial assetsFinancial instruments are assigned to this category if there is
an intention to hold the instrument to maturity and the economic
conditions for doing so are met. Th ese fi nancial instruments are
non-derivative fi nancial assets that are measured at amortised cost
using the eff ective interest method.
Finance leases
A lease fi nancing transaction is an agreement in which the
lessor conveys to the lessee the right to use an asset for a speci-
fi ed period in return for a payment or a number of payments. In
accordance with IAS 17, benefi cial ownership of leased assets is
attributed to the lessee if the lessee bears substantially all risks and
rewards incident to ownership of the leased asset. To the extent
that benefi cial ownership is attributable to the Group as the lessee,
the asset is capitalised at the date on which use starts, either at fair
value or at the present value of the minimum lease payments if
this is less than the fair value. A lease liability in the same amount
is recognised under non-current liabilities. Th e lease is measured
subsequently at amortised cost using the eff ective interest method.
Th e depreciation methods and estimated useful lives correspond to
those of comparable purchased assets.
Operating leases
For operating leases, the Group reports the leased asset at
amortised cost as an asset under property, plant and equipment
where it is the lessor. Th e lease payments recognised in the period
are shown under other operating income. Where the Group is the
lessee, the lease payments made are recognised as lease expense
under materials expense. Lease expenses and income are recog-
nised using the straight-line method.
Investments in associates
Investments in associates are accounted for using the equity
method in accordance with IAS 28 (Investments in Associates).
Based on the cost of acquisition at the time of purchase of the in-
vestments, the carrying amount of the investment is increased or
reduced annually to refl ect the share of earnings, dividends distrib-
uted and other changes in the equity of the associates attributable
to the investments of Deutsche Post AG or its consolidated subsidi-
aries. Th e goodwill contained in the carrying amounts of the in-
vestments is accounted for in accordance with IFRS 3. Investments
in companies accounted for using the equity method are impaired
if the recoverable amount falls below the carrying amount.
Financial instruments
A fi nancial instrument is any contract that gives rise to a
fi nan cial asset of one entity and a fi nancial liability or equity in-
strument of another entity. Financial assets include in particular
cash and cash equivalents, trade receivables, originated loans and
receivables, and derivative fi nancial assets held for trading. Finan-
cial liabilities include contractual obligations to deliver cash or
another fi nancial asset to another entity. Th ese mainly comprise
trade payables, liabilities to banks, liabilities arising from bonds
and fi nance leases, and derivative fi nancial liabilities.
Deutsche Post DHL Annual Report 2011166

A fair value hedge hedges the fair value of recognised assets
and liabilities. Changes in the fair value of both the derivatives and
the hedged item are recognised in income simultaneously.
A cash fl ow hedge hedges the fl uctuations in future cash fl ows
from recognised assets and liabilities (in the case of interest rate
risks), highly probable forecast transactions as well as unrecog-
nised fi rm commitments that entail a currency risk. Th e eff ective
portion of a cash fl ow hedge is recognised in the hedging reserve in
equity. Ineff ective portions resulting from changes in the fair value
of the hedging instrument are recognised directly in income. Th e
gains and losses generated by the hedging transactions are initially
recognised in equity and are then reclassifi ed to profi t or loss in
the period in which the asset acquired or liability assumed aff ects
profi t or loss. If a hedge of a fi rm commitment subsequently results
in the recognition of a non-fi nancial asset, the gains and losses
recognised directly in equity are included in the initial carrying
amount of the asset (basis adjustment).
Net investment hedges in foreign entities are treated in the
same way as cash fl ow hedges. Th e gain or loss from the eff ective
portion of the hedge is recognised in other comprehensive income,
whilst the gain or loss attributable to the ineff ective portion is rec-
ognised directly in income. Th e gains or losses recognised in other
comprehensive income remain there until the disposal or partial
disposal of the net investment. Detailed information on hedging
transactions can be found in Note 48.2.
Regular way purchases and sales of fi nancial assets are rec-
ognised at the settlement date, with the exception of held-for-
trading instruments, particularly derivatives. A fi nancial asset is
derecognised if the rights to receive the cash fl ows from the asset
have expired. Upon transfer of a fi nancial asset, a review is made
under the requirements of IAS 39 governing disposal as to whether
the asset should be derecognised. A disposal gain / loss arises upon
disposal. Th e remeasurement gains / losses recognised in other
comprehensive income in prior periods must be reversed as at the
disposal date. Financial liabilities are derecognised if the payment
obligations arising from them have expired.
loans and receivablesTh ese are non-derivative fi nancial assets with fi xed or deter-
minable payments that are not quoted on an active market. Unless
held for trading, they are recognised at cost or amortised cost at
the balance sheet date. Th e carrying amounts of money market
receivables correspond approximately to their fair values due to
their short maturity. Loans and receivables are considered current
assets if they mature not more than 12 months aft er the balance
sheet date; otherwise, they are recognised as non-current assets. If
the recoverability of receivables is in doubt, they are recognised
at amortised cost, less appropriate specifi c or collective valuation
allowances. A write-down on trade receivables is recognised if
there are objective indications that the amount of the outstanding
receivable cannot be collected in full. Th e write-down is recognised
in the income statement via a valuation account.
financial assets at fair value through profit or lossAll fi nancial instruments held for trading and derivatives that
do not satisfy the criteria for hedge accounting are assigned to this
category. Th ey are generally measured at fair value. All changes
in fair value are recognised in income. All fi nancial instruments
in this category are accounted for at the trade date. Assets in this
category are recognised as current assets if they are either held for
trading or will likely be realised within 12 months of the balance
sheet date.
To avoid variations in net profi t resulting from changes in the
fair value of derivative fi nancial instruments, hedge accounting is
applied where possible and economically useful. Gains and losses
from the derivative and the related hedged item are recognised in
income simultaneously. Depending on the hedged item and the
risk to be hedged, the Group uses fair value hedges and cash fl ow
hedges.
Th e carrying amounts of fi nancial assets not carried at fair
value through profi t or loss are tested for impairment at each bal-
ance sheet date and whenever there are indications of impairment.
Th e amount of any impairment loss is determined by compar-
ing the carrying amount and the fair value. If there are objective
indications of impairment, an impairment loss is recognised in the
income statement under other operating expenses or net fi nancial
income / net fi nance costs. Impairment losses are reversed if there
are objective reasons arising aft er the balance sheet date indicat-
ing that the reasons for impairment no longer exist. Th e increased
carry ing amount resulting from the reversal of the impairment loss
may not exceed the carrying amount that would have been deter-
mined (net of amortisation or depreciation) if the impairment loss
had not been recognised. Impairment losses are recognised within
the Group if the debtor is experiencing signifi cant fi nancial diffi -
culties, it is highly probable that the debtor will be the subject of
bankruptcy proceedings, there are material changes in the issuer’s
technological, economic, legal or market environment, or the fair
value of a fi nancial instrument falls below its amortised cost for a
prolonged period.
Deutsche Post DHL Annual Report 2011
Consolidated Financial StatementsNotes
Basis of preparation
167

Cash and cash equivalents
Cash and cash equivalents comprise cash, demand deposits
and other short-term liquid fi nancial assets with an original ma-
turity of up to three months and are carried at their principal
amount. Overdraft facilities used are recognised in the balance
sheet as amounts due to banks.
Share-based payment
Assumptions regarding the price of Deutsche Post AG’s shares
and assumptions regarding employee fl uctuation are taken into
account when measuring the value of share-based payments for
executives (Share Matching Scheme, SMS), which are required to
be accounted for as equity-settled share-based payments pursuant
to IFRS 2. Assumptions are also made regarding the conversion
behaviour of executives with respect to their relevant bonus por-
tion. Share-based payment arrangements are entered into each year,
with 1 January of the respective year being the grant date for that
year’s tranche. All assumptions are reviewed on a quarterly basis.
Th e resulting staff costs are recognised pro rata in profi t or loss to
refl ect the services rendered as consideration during the vesting
period (lock-up period). Obligations that in future are settled by
issuing shares in Deutsche Post AG and do not provide the execu-
tives with a choice of settlement are recognised in equity pursuant
to IFRS 2.
Stock appreciation rights issued to members of the Board of
Management and executives are measured on the basis of an option
pricing model in accordance with IFRS 2. Th e stock appreciation
rights are measured on each reporting date and on the settle ment
date. Th e amount determined for stock appreciation rights that will
probably be exercised is recognised pro rata in income under staff
costs to refl ect the services rendered as consideration during the
vesting period (lock-up period). A provision is recognised for the
same amount.
Pension obligations
In a number of countries, the Group maintains defi ned bene-
fi t pension plans based on the pensionable compensation and
length of service of employees. Th ese pension plans are funded
via external plan assets and provisions for pensions and similar
obligations. Pension obligations are measured using the projected
unit credit method prescribed by IAS 19 for defi ned benefi t plans.
Th is involves making certain actuarial assumptions. In accord-
ance with IAS 19.92, actuarial gains and losses are recognised only
to the extent that they exceed the greater of 10 % of the present
value of the obligations or of the fair value of plan assets (10 % cor-
ridor). Th e excess is allocated over the expected remaining work-
ing lives of the active employees and recognised in income. Th e
interest expense and expected return on plan assets components of
the pension expense are reported under net fi nancial income / net
fi nance costs, the other components under staff costs.
Th e Group also contributes to a number of defi ned contribu-
tion pension plans. Contributions to these pension plans are recog-
nised as staff costs.
Investment property
In accordance with IAS 40, investment property is property
held to earn rentals or for capital appreciation or both, rather than
for use in the supply of services, for administrative purposes, or
for sale in the normal course of the company’s business. It is meas-
ured in accordance with the cost model. Depreciable investment
property is depreciated over a period of between fi ve and 50 years
using the straight-line method. Th e fair value is determined on
the basis of expert opinions. Impairment losses are recognised in
accordance with the principles described under the section headed
Impairment.
Inventories
Inventories are assets that are held for sale in the ordinary
course of business, are in the process of production, or are con-
sumed in the production process or in the rendering of services.
Th ey are measured at the lower of cost or net realisable value. Valu-
ation allowances are charged for obsolete inventories and slow-
moving goods.
Government grants
In accordance with IAS 20, government grants are recognised
at their fair value only when there is reasonable assurance that the
conditions attaching to them will be complied with and that the
grants will be received. Th e grants are reported in the income
statement and are generally recognised as income over the periods
in which the costs they are intended to compensate are incurred.
Where the grants relate to the purchase or production of assets,
they are reported as deferred income and recognised in the income
statement over the useful lives of the assets.
Assets held for sale and liabilities associated with
assets held for sale
Assets held for sale are assets available for sale in their pre-
sent condition and whose sale is highly probable. Th e sale must be
expected to qualify for recognition as a completed sale within one
year of the date of classifi cation. Assets held for sale may consist of
individual non-current assets, groups of assets (disposal groups),
or components of an entity (discontinued operations). Liabilities
intended to be disposed of together with the assets in a single
transaction form part of the disposal group or discontinued oper-
ation and are also reported separately as liabilities associated with
assets held for sale. Assets held for sale are no longer depreciated
or amortised, but are recognised at the lower of their fair value less
costs to sell and the carrying amount. Gains and losses arising from
the remeasurement of individual non-current assets or disposal
groups classifi ed as held for sale are reported in profi t or loss from
continuing operations until the fi nal date of disposal. Gains and
losses arising from the measurement to fair value less costs to sell
of discontinued operations classifi ed as held for sale are reported
in profi t or loss from discontinued operations. Th is also applies to
the profi t or loss from operations and the gain or loss on disposal
of these components of an entity.
Deutsche Post DHL Annual Report 2011168

Some of the defi ned benefi t pension plans have been closed
to new entrants (e.g., in the UK) or additionally to further increases
in benefi ts for existing benefi ciaries (e.g., in the USA); in these cases,
there has been a switch to defi ned contribution plans.
In 2011, employer contributions totalling € 198 million were
paid in respect of defi ned contribution pension plans for the
Group’s hourly workers and salaried employees (previous year:
€ 237 million).
Other provisions
Other provisions are recognised for all legal or constructive
obligations to third parties existing at the balance sheet date that
have arisen as a result of past events, that are expected to result
in an outfl ow of future economic benefi ts and whose amount can
be measured reliably. Th ey represent uncertain obligations that are
carried at the best estimate of the expenditure required to settle
the obligation. Provisions with more than one year to maturity are
discounted at market rates of interest that refl ect the risk, region
and time to settlement of the obligation. Th e discount rates used
in the fi nancial year were between 0.5 % and 10.75 % (previous year:
0.5 % to 11.5 %).
Provisions for restructurings are only established in accord-
ance with the above-mentioned criteria for recognition if a detailed,
formal restructuring plan has been drawn up and communicated
to those aff ected.
Th e technical reserves (insurance) consist mainly of out-
standing loss reserves and IBNR (incurred but not reported claims)
reserves. Outstanding loss reserves represent estimates of ultimate
obligations in respect of actual claims or known incidents expected
to give rise to claims, which have been reported to the company
but which have yet to be fi nalised and presented for payment. Out-
standing loss reserves are based on individual claim valuations
carried out by the company or its ceding insurers. IBNR reserves
represent estimates of ultimate obligations in respect of incidents
taking place on or before the balance sheet date that have not been
reported to the company but will nonetheless give rise to claims
in the future. Such reserves also include provisions for potential
errors in settling outstanding loss reserves. Th e company carries
out its own assessment of ultimate loss liabilities using actuarial
methods and also commissions an independent actuarial study of
these each year in order to verify the reasonableness of its estimates.
pension plans for civil servant employees in germanyDeutsche Post AG pays contributions to defi ned contribution
plans for civil servants in accordance with statutory provisions.
Under the provisions of the Gesetz zum Personalrecht der
Beschäft igten der früheren Deutschen Bundespost (PostPersRG –
Deutsche Bundespost Former Employees Act), introduced as
article 4 of the Gesetz zur Neuordnung des Postwesens und der
Tele kommunikation (PTNeuOG – German Posts and Telecom-
munications Reorganisation Act), Deutsche Post AG makes benefi t
and assistance payments from a special pension fund for postal
civil servants operated jointly, since early 2001, by the Deutsche
Bundes post successor companies, the Bundes-Pensions-Service
für Post und Telekommunikation e. V. (BPS-PT), to retired employ-
ees or their surviving dependants who are entitled to benefi ts on
the basis of a civil service appointment. Th e amount of Deutsche
Post AG’s payment obligations is governed by section 16 of the
PostPersRG. Since 2000, this act has obliged Deutsche Post AG
to pay into this special pension fund for postal civil servants an
annual contribution of 33 % of the gross compensation of its active
civil servants and the notional gross compensation of civil servants
on leave of absence who are eligible for a pension.
In the year under review, expenses resulting from Deutsche
Post AG’s contributions to the BPS-PT amounted to € 531 million
(previous year: € 541 million).
Under section 16 of the PostPersRG, the federal government
takes appropriate measures to make good the diff erence between
the current payment obligations of the special pension fund for
postal civil servants on the one hand, and the funding companies’
current contributions or other return on assets on the other, and
guarantees that the special pension fund for postal civil servants is
able at all times to meet the obligations it has assumed in respect
of its funding companies. Insofar as the federal government makes
payments to the special pension fund for postal civil servants un-
der the terms of this guarantee, it cannot claim reimbursement
from Deutsche Post AG.
pension plans for hourly workers and salaried employeesTh e obligations under defi ned benefi t pension plans for the
Group’s hourly workers and salaried employees relate primarily
to pension obligations in Germany and signifi cant funded obliga-
tions in the UK, the Netherlands, Switzerland and the USA. Th ere
are various commitments to individual groups of employees. Th e
commitments usually depend on length of service and fi nal salary
(e.g., the UK), are based on the amount of contributions paid (e.g.,
Switzerland), or take the form of a fl at-rate contribution system
(e.g., Germany).
Deutsche Post DHL Annual Report 2011
Consolidated Financial StatementsNotes
Basis of preparation
169

8 Exercise of judgement in applying the accounting policies
Th e preparation of IFRS-compliant consolidated fi nancial
statements requires the exercise of judgement by management.
All estimates are reassessed on an ongoing basis and are based
on historical experience and expectations with regard to future
events that appear reasonable under the given circumstances. For
example, this applies to assets held for sale. In this case, it must be
determined whether the assets are available for sale in their pres-
ent condition and whether their sale is highly probable. If this is
the case, the assets and the associated liabilities are reported and
measured as assets held for sale and liabilities associated with
assets held for sale.
Estimates and assessments made by management
Th e preparation of the consolidated fi nancial statements
in accordance with IFRS s requires management to make certain
assumptions and estimates that may aff ect the amounts of the assets
and liabilities included in the balance sheet, the amounts of income
and expenses, and the disclosures relating to contingent liabilities.
Examples of the main areas where assumptions, estimates and the
exercise of management judgement occur are the recognition of
provisions for pensions and similar obligations, the calculation of
discounted cash fl ows for impairment testing and purchase price
allocations, taxes and legal proceedings.
When determining the provisions for pensions and similar
obligations, the discount rate used is an important factor that has
to be estimated. An increase or a reduction of one percentage point
in the discount rate used would result in a reduction or increase of
around € 930 million in the present value of the total obligations of
pension plans in Germany. For Group companies in the UK, such
a change in the discount rate would result in a decrease or increase
in the present value of the total obligation of around € 600 million.
Since actuarial gains and losses are spread over a number of years
if they exceed 10 % of the higher of the defi ned benefi t obligation
and the fair value of the plan assets, changes in the discount rate
used for the Group’s benefi t plans have only a partial eff ect or no
eff ect at all on the expense or the carrying amount of the provisions
recognised in the following fi nancial year.
Th e Group has operating activities around the globe and
is subject to local tax laws. Management can exercise judgement
when calculating the amounts of current and deferred taxes in the
relevant countries. Although management believes that it has made
a reasonable estimate relating to tax matters that are inherently
uncertain, there can be no guarantee that the actual outcome of
these uncertain tax matters will correspond exactly to the original
estimate made. Any diff erence between actual events and the esti-
mate made could have an eff ect on tax liabilities and deferred taxes
in the period in which the matter is fi nally decided. Th e amount
recognised for deferred tax assets could be reduced if the estimates
of planned taxable income or the tax benefi ts achievable as a result
of tax planning strategies are revised downwards, or in the event
that changes to current tax laws restrict the extent to which future
tax benefi ts can be realised.
Financial liabilities
On initial recognition, fi nancial liabilities are carried at fair
value less transaction costs. Th e price determined on a price-
effi cient and liquid market or a fair value determined using the
treasury risk management system deployed within the Group is
taken as the fair value. In subsequent periods the fi nancial liabil-
ities are measured at amortised cost. Any diff erences between the
amount received and the amount repayable are recognised in in-
come over the term of the loan using the eff ective interest method.
Liabilities
Trade payables and other liabilities are carried at amortised
cost. Th e fair value of the liabilities corresponds more or less to
their carrying amount.
Deferred taxes
In accordance with IAS 12, deferred taxes are recognised for
temporary diff erences between the carrying amounts in the IFRS
fi nan cial statements and the tax accounts of the individual entities.
Deferred tax assets also include tax reduction claims which arise from
the expected future utilisation of existing tax loss carryforwards and
which are likely to be realised. In compliance with IAS 12.24 (b) and
IAS 12.15 (b), deferred tax assets or liabilities were only recognised
for temporary diff erences between the carrying amounts in the IFRS
fi nancial statements and in the tax accounts of Deutsche Post AG
where the diff erences arose aft er 1 January 1995. No deferred tax
assets or liabilities are recognised for temporary diff erences result-
ing from initial diff erences in the opening tax accounts of Deutsche
Post AG as at 1 January 1995. Further details on deferred taxes from
tax loss carryforwards can be found in Note 30.
In accordance with IAS 12, deferred tax assets and liabilities
are calculated using the tax rates applicable in the individual coun-
tries at the balance sheet date or announced for the time when the
deferred tax assets and liabilities are realised. Th e tax rate of 29.8 %
applied to German Group companies comprises the corporation
tax rate plus the solidarity surcharge, as well as a municipal trade
tax rate that is calculated as the average of the diff erent munici-
pal trade tax rates. Foreign Group companies use their individual
income tax rates to calculate deferred tax items. Th e income tax
rates applied for foreign companies amount to up to 41 %.
Income taxes
Income tax assets and liabilities are measured at the amounts
for which repayments from or payments to the tax authorities are
expected to be received or made.
Contingent liabilities
Contingent liabilities represent possible obligations whose
existence will be confi rmed only by the occurrence or non-occur-
rence of one or more uncertain future events not wholly within the
control of the enterprise. Contingent liabilities also include certain
obligations that will probably not lead to an outfl ow of resources
embodying economic benefi ts, or where the amount of the outfl ow
of resources embodying economic benefi ts cannot be measured
with suffi cient reliability. In accordance with IAS 37, contingent
liabilities are not recognised as liabilities; see Note 49.
Deutsche Post DHL Annual Report 2011170

mated amounts. In such cases, the assumptions made and, where
necessary, the carrying amounts of the relevant assets and liabil-
ities are adjusted accordingly.
At the date of preparation of the consolidated fi nancial state-
ments, there is no indication that any signifi cant change in the
assumptions and estimates made will be required, so that on the
basis of the information currently available it is not expected that
there will be any signifi cant adjustments in fi nancial year 2012 to
the carrying amounts of the assets and liabilities recognised in the
fi nancial statements.
9 Consolidation methods
Th e consolidated fi nancial statements are based on the IFRS
fi nancial statements of Deutsche Post AG and the subsidiaries,
joint ventures and associates included in the consolidated fi nancial
statements, prepared in accordance with uniform accounting pol-
icies as at 31 December 2011 and audited by independent auditors.
Acquisition accounting for subsidiaries included in the
consolidated fi nancial statements uses the purchase method of
accounting. Th e cost of the acquisition corresponds to the fair
value of the assets given up, the equity instruments issued and the
liabilities incurred or assumed at the transaction date. Acquisition-
related costs are recognised as expenses. Contingent consideration
is recognised at fair value at the date of initial consolidation.
Joint ventures are proportionately consolidated in accord-
ance with IAS 31. Assets and liabilities, as well as income and
expenses, of jointly controlled companies are included in the con-
solidated fi nancial statements in proportion to the interest held in
these companies. Proportionate acquisition accounting as well as
recognition and measurement of goodwill use the same methods
as applied to the consolidation of subsidiaries.
Companies on which the parent can exercise signifi cant
infl uence (associates) are accounted for in accordance with the
equity method using the purchase method of accounting. Any
goodwill is recognised under investments in associates.
Intra-group revenue, other operating income and expenses
as well as receivables, liabilities and provisions between consoli-
dated companies are eliminated. Intercompany profi ts or losses
from intra-group deliveries and services not realised by sale to
third parties are eliminated.
Goodwill is regularly reported in the Group’s balance sheet
as a consequence of business combinations. When an acquisition
is initially recognised in the consolidated fi nancial statements, all
identifi able assets, liabilities and contingent liabilities are meas-
ured at their fair values at the date of acquisition. One of the most
important estimates this requires is the determination of the fair
values of these assets and liabilities at the date of acquisition. Land,
buildings and offi ce equipment are generally valued by independ-
ent experts, whilst securities for which there is an active market
are recognised at the quoted exchange price. If intangible assets
are identifi ed in the course of an acquisition, their measurement
can be based on the opinion of an independent external expert
valuer, depending on the type of intangible asset and the complex-
ity involved in determining its fair value. Th e independent expert
determines the fair value using appropriate valuation techniques,
normally based on expected future cash fl ows. In addition to the
assumptions about the development of future cash fl ows, these
valuations are also signifi cantly aff ected by the discount rates used.
Impairment testing for goodwill is based on assumptions with
respect to the future. Th e Group carries out these tests annually and
also whenever there are indications that goodwill has become im-
paired. Th e recoverable amount of the CGU must then be calculated.
Th is amount is the higher of fair value less costs to sell and value in
use. Determining value in use requires adjustments and estimates
to be made with respect to forecasted future cash fl ows and the
discount rate applied. Although management believes that the
assumptions made for the purpose of calculating the recoverable
amount are appropriate, possible unforeseeable changes in these
assumptions – e.g., a reduction in the EBIT margin, an increase in
the cost of capital or a decline in the long-term growth rate – could
result in an impairment loss that could negatively aff ect the Group’s
net assets, fi nancial position and results of operations.
Pending legal proceedings in which the Group is involved
are disclosed in Note 51. Th e outcome of these proceedings could
have a signifi cant eff ect on the net assets, fi nancial position and
results of operations of the Group. Management regularly analyses
the information currently available about these proceedings and
recognises provisions for probable obligations including estimated
legal costs. Internal and external legal advisers participate in mak-
ing this assessment. In deciding on the necessity for a provision,
management takes into account the probability of an unfavourable
outcome and whether the amount of the obligation can be esti-
mated with suffi cient reliability. Th e fact that an action has been
launched or a claim asserted against the Group, or that a legal dis-
pute has been disclosed in the Notes, does not necessarily mean
that a provision is recognised for the associated risk.
All assumptions and estimates are based on the circum-
stances prevailing and assessments made at the balance sheet
date. For the purpose of estimating the future development of the
business, a realistic assessment was also made at that date of the
economic environment likely to apply in the future to the diff erent
sectors and regions in which the Group operates. In the event of
developments in this general environment that diverge from the
assumptions made, the actual amounts may diff er from the esti-
Deutsche Post DHL Annual Report 2011
Consolidated Financial StatementsNotes
Basis of preparation
171

External revenue is the revenue generated by the divisions
from non-Group third parties. Internal revenue is revenue gen-
erated with other divisions. If comparable external market prices
exist for services or products off ered internally within the Group,
these market prices or market-oriented prices are used as transfer
prices (arm’s length principle). Th e transfer prices for services for
which no external market exists are generally based on incremen-
tal costs.
SEGMENT REPORTING
10 Segment reporting
Segments by division
€ m
mail express global forwarding,
freight supply chainCorporate Center /
Other Consolidation Group
1 Jan. to 31 Dec. 2010 1, 2 2011 2010 2011 2010 2011 2010 1 2011 2010 1 2011 2010 1 2011 2010 2 2011
External revenue 13,822 13,877 10,788 11,383 13,738 14,385 12,969 13,119 71 65 0 0 51,388 52,829
Internal revenue 91 96 323 383 603 659 92 104 1,231 1,195 –2,340 –2,437 0 0
Total revenue 13,913 13,973 11,111 11,766 14,341 15,044 13,061 13,223 1,302 1,260 –2,340 –2,437 51,388 52,829
Profi t / loss from operating activities (ebit) 1,120 1,107 497 927 383 429 231 362 –395 –389 –1 0 1,835 2,436
Net income from associates 0 1 0 0 4 1 0 0 52 58 0 0 56 60
Segment assets 4,100 4,325 8,323 8,663 7,727 7,931 5,959 6,314 1,167 3,167 –246 –254 27,030 30,146
Investments in associates 8 0 28 28 15 16 0 0 1,796 0 0 0 1,847 44
Segment liabilities 3 2,875 2,919 2,525 2,699 2,777 2,944 2,863 2,924 818 820 –188 –186 11,670 12,120
Capex 446 433 286 602 102 135 214 252 214 294 0 0 1,262 1,716
Depreciation and amortisation 315 323 349 331 98 101 285 274 191 195 0 0 1,238 1,224
Impairment losses 17 31 24 6 0 0 4 13 13 0 0 0 58 50
Total depreciation, amortisation and impairment losses 332 354 373 337 98 101 289 287 204 195 0 0 1,296 1,274
Other non-cash expenses 373 321 792 189 73 108 144 115 58 40 0 0 1,440 773
Employees 4 148,066 147,434 88,384 86,100 41,729 42,847 129,331 133,615 13,764 13,352 0 0 421,274 423,348
Information about geographical areas
€ m
GermanyEurope
(excluding Germany) Americas Asia Pacifi c Other regions Group
1 Jan. to 31 Dec. 2010 2 2011 2010 2011 2010 2011 2010 2011 2010 2011 2010 2 2011
External revenue 16,434 16,743 16,951 17,475 8,888 8,808 7,147 7,611 1,968 2,192 51,388 52,829
Non-current assets 4,085 4,465 7,198 7,313 3,261 3,376 3,231 3,361 329 329 18,104 18,844
Capex 733 1,057 174 248 210 203 94 152 51 56 1,262 1,716 1 Adjusted prior-period amounts, see segment reporting disclosures.2 Adjustment of prior-period amounts, see Note 5.3 Including non-interest-bearing provisions.4 Average fte s.
10.1 Segment reporting disclosures
Deutsche Post DHL reports four operating segments; these
are managed independently by the responsible segment manage-
ment bodies in line with the products and services off ered and
the brands, distribution channels and customer profi les involved.
Components of the entity are defi ned as a segment on the basis of
the existence of segment managers with bottom-line responsibility
who report directly to Deutsche Post DHL’s top management.
Deutsche Post DHL Annual Report 2011172

supply chain
Th e division specialises in contract logistics and provides
warehousing and transport services as well as value-added services
along the entire supply chain in the diff erent sectors. Th e division
also off ers end-to-end solutions for corporate information and
communications management. Th e division’s business units are
Supply Chain and Williams Lea. Eff ective 1 July 2011, the Home
Delivery business in Germany was transferred from the SUPPLY
CHAIN division to the MAIL division. Th e following companies
are aff ected: DHL Home Delivery GmbH, DHL Solutions Großgut
GmbH and IT4Logistics AG. Th e aim is to use existing common
functions and overlaps to enable selective market targeting and
open up new growth opportunities. Th e prior-period amounts
were adjusted accordingly.
In addition to the reportable segments given above, segment
reporting comprises the following categories:
Corporate Center / Other
Corporate Center / Other comprises Global Business Services
(GBS), the Corporate Center, non-operating activities and other
business activities. Th e profi t / loss generated by GBS is allocated
to the operating segments, whilst its assets and liabilities remain
with GBS (asymmetrical allocation). Goodwill of €–114 million
arising from earlier intra-group transactions was reclassifi ed from
Cor porate Center / Other to Consolidation. Th e adjustment had no
eff ect on the business segments. Th e prior-period amounts were
adjusted accordingly.
Consolidation
Th e data for the divisions are presented following consolida-
tion of interdivisional transactions. Th e transactions between the
divisions are eliminated in the Consolidation column. Goodwill
of € –114 million arising from earlier intra-group transactions was
reclassifi ed from Corporate Center / Other to Consolidation. Th e
adjust ment had no eff ect on the business segments. Th e prior-
period amounts were adjusted accordingly.
10.3 Information about geographical areas
Th e main geographical areas in which the Group is active are
Germany, Europe, the Americas, Asia Pacifi c and Other regions.
External revenue, non-current assets and capex are disclosed for
these regions. Revenue, assets and capex are allocated to the indi-
vidual regions on the basis of the domicile of the reporting entity.
Non-current assets primarily comprise intangible assets, property,
plant and equipment and other non-current assets.
Th e expenses for IT services provided in the IT service cen-
tres are allocated to the divisions by cause. Th e additional costs
resulting from Deutsche Post AG’s universal postal service obliga-
tion (nationwide retail outlet network, delivery every working day),
and from its obligation to assume the compensation structure as
the legal successor to Deutsche Bundespost, are allocated to the
MAIL division.
In keeping with internal reporting, capital expenditure
(capex) is disclosed. Additions to intangible assets net of goodwill
and to property, plant and equipment are reported in the capex
fi gure. Depreciation, amortisation and impairment losses relate to
the segment assets allocated to the individual divisions. Other non-
cash expenses relate primarily to expenses from the recognition of
provisions.
Refl ecting the Group’s predominant organisational structure,
the primary reporting format is based on the divisions. Th e Group
distinguishes between the following divisions:
10.2 Segments by division
In addition to the transport and delivery of written commu-
nications, the MAIL division is positioned as an end-to-end service
provider for the management of written communications. Th e
division comprises the following business units: Mail Communi-
cation, Dialogue Marketing, Press Services, Value-Added Services,
Parcel Germany, Global Mail, Retail Outlets and the Pension
Service. Eff ective 1 July 2011, the Home Delivery business in Ger-
many was transferred from the SUPPLY CHAIN division to the MAIL
division. Th e following companies are aff ected: DHL Home Delivery
GmbH, DHL Solutions Großgut GmbH and IT4Logistics AG. Th e
aim is to use existing common functions and overlaps to enable
selective market targeting and open up new growth opportunities.
Th e prior-period amounts were adjusted accordingly.
express
Th e EXPRESS division off ers international and domestic
courier and express services to business and private customers. Th e
division comprises the Express Europe, Express Americas, Express
Asia Pacifi c and Express EEMEA business units.
global forwarding, freight
Th e activities of the GLOBAL FORWARDING, FREIGHT division
comprise the transportation of goods by rail, road, air and sea. Th e
division’s business units are Global Forwarding and Freight.
Deutsche Post DHL Annual Report 2011
Consolidated Financial StatementsNotes
Segment reporting
173

Th e following table shows the reconciliation of
Deutsche Post DHL’s total liabilities to the segment liabilities. Th e
interest-bearing components of the provisions and liabilities as
well as income tax liabilities and deferred taxes are deducted.
Reconciliation of segment liabilities
€ m
2010 2011
Total equity and liabilities 37,763 38,408
Equity –10,696 –11,199
Consolidated liabilities 27,067 27,209
Non-current provisions –7,168 – 6,874
Non-current liabilities – 6,676 –1,713
Current provisions –298 –287
Current liabilities –1,255 – 6,215
Segment liabilities 11,670 12,120
of which Corporate Center / Other 1 818 820
Total for reportable segments 1 11,040 11,486
Consolidation 1 –188 –1861 Prior-period amounts adjusted, see segment reporting disclosures.
10.4 Reconciliation of segment amounts
Reconciliation of segment amounts to consolidated amounts
Reconciliation
€ m
Total for reportable segments Corporate Center / OtherReconciliation to Group /
Consolidation Consolidated amount
2010 1 2011 2010 2011 2010 1 2011 2010 1 2011
External revenue 51,317 52,764 71 65 0 0 51,388 52,829
Internal revenue 1,109 1,242 1,231 1,195 –2,340 –2,437 0 0
Revenue 52,426 54,006 1,302 1,260 –2,340 –2,437 51,388 52,829
Other operating income 1,863 1,825 1,509 1,305 –1,155 –1,080 2,217 2,050
Materials expense –30,334 –31,644 –1,408 –1,335 2,362 2,435 –29,380 –30,544
Staff costs –15,726 –15,854 – 902 – 894 19 18 –16,609 –16,730
Other operating expenses – 4,906 – 4,429 – 692 – 530 1,113 1,064 – 4,485 –3,895
Depreciation, amortisation and impairment losses –1,092 –1,079 –204 –195 0 0 –1,296 –1,274
Profi t / loss from operating activities (ebit) 2,231 2,825 –395 –389 –1 0 1,835 2,436
Net income from associates 4 2 52 58 0 0 56 60
Net other fi nancial income / net other fi nance costs – – – – – – 933 – 837
Income taxes – – – – – – –194 –393
Consolidated net profi t for the period – – – – – – 2,630 1,266
of which attributable to
Deutsche Post ag shareholders – – – – – – 2,541 1,163
Non-controlling interests – – – – – – 89 1031 Prior-period amounts adjusted, see Note 5 and segment reporting disclosures.
Th e following table shows the reconciliation of
Deutsche Post DHL’s total assets to the segment assets. Financial
assets, income tax assets, deferred taxes, cash and cash equiva-
lents as well as additional interest-bearing asset components are
deducted.
Reconciliation of segment assets
€ m
2010 2011
Total assets 37,763 38,408
Investment property –37 – 40
Non-current fi nancial assets including investments in associates – 5,040 –773
Other non-current assets –387 – 454
Deferred tax assets – 973 –1,153
Income tax assets –223 –239
Receivables and other assets –35 –10
Current fi nancial assets – 623 –2,470
Cash and cash equivalents –3,415 –3,123
Segment assets 27,030 30,146
of which Corporate Center / Other 1 1,167 3,167
Total for reportable segments 1 26,109 27,233
Consolidation 1 –246 –2541 Prior-period amounts adjusted, see segment reporting disclosures.
Deutsche Post DHL Annual Report 2011174

Other operating income decreased mainly because income
from reversals of provisions for restructurings was higher in the
previous year.
Amongst other things, gains on disposal of non-current assets
include € 28 million in deconsolidation eff ects from the sale of the
US-based Exel Transportation Services Group; Note 2.
Subsidies relate to grants for the purchase or production of
assets. Th e grants are reported as deferred income and recognised
in the income statement over the useful lives of the assets.
Miscellaneous other operating income includes a large num-
ber of smaller individual items.
13 Materials expense
€ m
2010 2011
Cost of raw materials, consumables and supplies, and of goods purchased and held for resale
Goods purchased and held for resale 1,512 1,564
Aircraft fuel 690 1,034
Fuel 744 804
Packaging material 308 290
Spare parts and repair materials 93 85
Offi ce supplies 72 69
Other expenses 91 111
3,510 3,957
Cost of purchased services
Transportation costs 17,823 18,329
Cost of temporary staff 1,871 1,953
Expenses from non-cancellable leases 1,693 1,640
Maintenance costs 969 974
it services 652 659
Expenses from cancellable leases 453 485
Expenses for the use of Postbank branches 484 450
Commissions paid 411 440
Other lease expenses (incidental expenses) 184 239
Other purchased services 1 1,330 1,418
25,870 26,587
Materials expense 29,380 30,5441 Prior-period amount adjusted, see Note 5.
Th e increase in the materials expense is due on the one hand
to higher aircraft fuel prices, and on the other hand to higher trans-
portation costs as a result of the expansion of business activities.
Other expenses include a large number of individual items.
INCOME STATEMENT DISCLOSURES
11 Revenue
€ m
2010 1 2011
Revenue 51,388 52,8291 Prior-period amounts adjusted, see Note 5.
Revenue increased by € 1,441 million (2.8 %) year-on-year to
€ 52,829 million. Th e increase was due to the following factors:
Factors affecting revenue increase
€ m
2011
Organic growth 2,710
Portfolio changes 1 – 627
Currency translation effects – 642
Total 1,4411 See explanations in Note 2.
As in the prior-year period, there was no revenue in fi nancial
year 2011 that was generated on the basis of barter transactions.
Revenue was up year-on-year in almost all areas.
Th e further classifi cation of revenue by division and the alloca-
tion of revenue to geographical areas are presented in the segment
reporting.
12 Other operating income
€ m
2010 2011
Income from the reversal of provisions 509 398
Income from currency translation differences 197 185
Rental and lease income 173 177
Insurance income 169 165
Income from fees and reimbursements 142 143
Income from work performed and capitalised 124 117
Gains on disposal of non-current assets 55 116
Income from the remeasurement of liabilities 111 98
Commission income 93 94
Reversals of impairment losses on receivables and other assets 81 89
Income from prior-period billings 49 49
Income from the derecognition of liabilities 42 34
Income from loss compensation 21 21
Recoveries on receivables previously written off 11 17
Income from derivatives 16 13
Subsidies 10 11
Income from trade-related insurance deductions 4 7
Miscellaneous 410 316
Other operating income 2,217 2,050
Deutsche Post DHL Annual Report 2011
Consolidated Financial StatementsNotes
Income statement disclosures
175
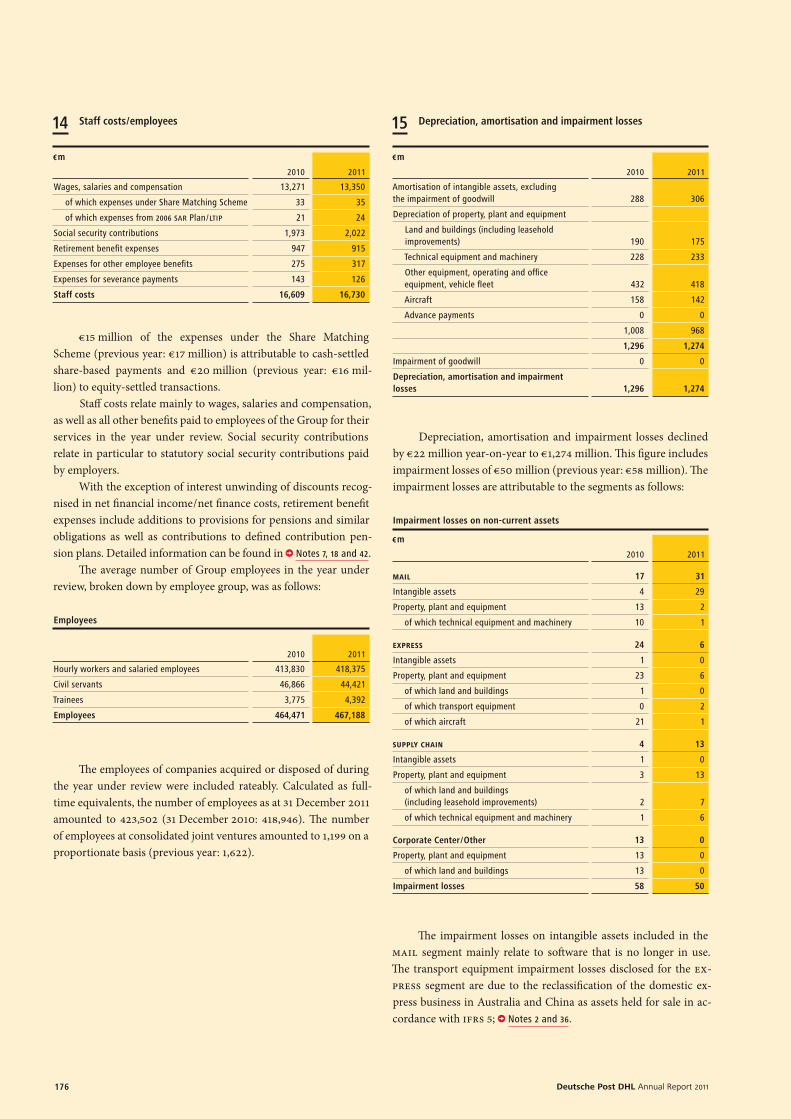
15 Depreciation, amortisation and impairment losses
€ m
2010 2011
Amortisation of intangible assets, excluding the impairment of goodwill 288 306
Depreciation of property, plant and equipment
Land and buildings (including leasehold improvements) 190 175
Technical equipment and machinery 228 233
Other equipment, operating and offi ce equipment, vehicle fl eet 432 418
Aircraft 158 142
Advance payments 0 0
1,008 968
1,296 1,274
Impairment of goodwill 0 0
Depreciation, amortisation and impairment losses 1,296 1,274
Depreciation, amortisation and impairment losses declined
by € 22 million year-on-year to € 1,274 million. Th is fi gure includes
impairment losses of € 50 million (previous year: € 58 million). Th e
impairment losses are attributable to the segments as follows:
Impairment losses on non-current assets
€ m
2010 2011
mail 17 31
Intangible assets 4 29
Property, plant and equipment 13 2
of which technical equipment and machinery 10 1
express 24 6
Intangible assets 1 0
Property, plant and equipment 23 6
of which land and buildings 1 0
of which transport equipment 0 2
of which aircraft 21 1
supply chain 4 13
Intangible assets 1 0
Property, plant and equipment 3 13
of which land and buildings (including leasehold improvements) 2 7
of which technical equipment and machinery 1 6
Corporate Center / Other 13 0
Property, plant and equipment 13 0
of which land and buildings 13 0
Impairment losses 58 50
Th e impairment losses on intangible assets included in the
MAIL segment mainly relate to soft ware that is no longer in use.
Th e transport equipment impairment losses disclosed for the EX-
PRESS segment are due to the reclassifi cation of the domestic ex-
press business in Australia and China as assets held for sale in ac-
cordance with IFRS 5; Notes 2 and 36.
14 Staff costs / employees
€ m
2010 2011
Wages, salaries and compensation 13,271 13,350
of which expenses under Share Matching Scheme 33 35
of which expenses from 2006 sar Plan / ltip 21 24
Social security contributions 1,973 2,022
Retirement benefi t expenses 947 915
Expenses for other employee benefi ts 275 317
Expenses for severance payments 143 126
Staff costs 16,609 16,730
€ 15 million of the expenses under the Share Matching
Scheme (previous year: € 17 million) is attributable to cash-settled
share-based payments and € 20 million (previous year: € 16 mil-
lion) to equity-settled transactions.
Staff costs relate mainly to wages, salaries and compensation,
as well as all other benefi ts paid to employees of the Group for their
services in the year under review. Social security contributions
relate in particular to statutory social security contributions paid
by employers.
With the exception of interest unwinding of discounts recog-
nised in net fi nancial income / net fi nance costs, retirement benefi t
expenses include additions to provisions for pensions and similar
obligations as well as contributions to defi ned contribution pen-
sion plans. Detailed information can be found in Notes 7, 18 and 42.
Th e average number of Group employees in the year under
review, broken down by employee group, was as follows:
Employees
2010 2011
Hourly workers and salaried employees 413,830 418,375
Civil servants 46,866 44,421
Trainees 3,775 4,392
Employees 464,471 467,188
Th e employees of companies acquired or disposed of during
the year under review were included rateably. Calculated as full-
time equivalents, the number of employees as at 31 December 2011
amounted to 423,502 (31 December 2010: 418,946). Th e number
of employees at consolidated joint ventures amounted to 1,199 on a
proportionate basis (previous year: 1,622).
Deutsche Post DHL Annual Report 2011176

17 Net income from associates
€ m
2010 2011
Net income from associates 56 60
Investments in companies on which a signifi cant infl uence
can be exercised and which are accounted for using the equity
method contributed € 60 million (previous year: € 56 million) to
net fi nancial income / net fi nance costs. € 58 million (previous year:
€ 52 million) of this amount is attributable to Deutsche Postbank AG,
which has been accounted for as an associate since March 2009
and measured in accordance with IFRS 5 since March 2011.
18 Net other fi nancial income / net other fi nance costs
€ m
2010 2011
Other fi nancial income
Interest income 52 74
Income from other equity investments and fi nancial assets 7 8
Other fi nancial income 2,192 508
2,251 590
Other fi nance costs
Interest expenses –712 – 660
of which on discounted provisions for pensions and other provisions –362 –299
Write-downs of fi nancial assets –102 – 98
Other fi nance costs – 521 – 633
–1,335 –1,391
Foreign currency result 17 –36
Net other fi nancial income / net other fi nance costs 933 – 837
Write-downs of fi nancial assets also contain impairments
of € 63 million (previous year: € 52 million) in Corporate Center /
Other of the equity interest in Deutsche Postbank AG due to the
decline in the share price at the time of reclassifi cation as well as a
further € 9 million (previous year: € 16 million) impairment in the
MAIL segment of the equity-accounted company Unipost Servicios
Generales S. L., Spain.
Net fi nancial income / net fi nance costs includes interest in-
come of € 74 million (previous year: € 52 million) as well as interest
expense of € 660 million (previous year: € 712 million). Th ese result
from fi nancial assets and liabilities that were not measured at fair
value through profi t or loss.
Th e main factor aff ecting the net other fi nance costs of
€ 837 million (previous year: net other fi nancial income of € 933 mil-
lion) is the planned sale of Postbank. In addition, this item includes
the changes in value resulting from the measurement of the
Deutsche Postbank shares before and aft er they were reclassifi ed as
held for sale in accordance with IFRS 5; Notes 3 and 36.
16 Other operating expenses
€ m
2010 2011
Travel and training costs 323 343
Other business taxes 376 315
Cost of purchased cleaning, transport and security services 287 289
Warranty expenses, refunds and compensation payments 228 241
Telecommunication costs 249 234
Advertising expenses 164 220
Write-downs of current assets 217 210
Insurance costs 124 203
Consulting costs 192 198
Expenses from currency translation differences 195 189
Offi ce supplies 183 173
Entertainment and corporate hospitality expenses 132 151
Services provided by the Federal Posts and Telecommunications Agency 78 111
Other public relations expenses 117 93
Expenses for public relations and customer support 65 86
Voluntary social benefi ts 140 80
Expenses from disposal of assets 421 69
Commissions paid 65 63
Legal costs 207 62
Contributions and fees 41 61
Monetary transaction costs 30 33
Prior-period other operating expenses 17 31
Audit costs 30 30
Expenses from derivatives 71 28
Donations 19 17
Additions to provisions 116 9
Miscellaneous 398 356
Other operating expenses 4,485 3,895
Th e decrease in other operating expenses is due primarily
to the higher losses on the disposal of assets in the previous year.
Th ese related to the deconsolidation losses on the sale of business
activities in the UK, France and Austria; Note 2.
Miscellaneous other operating expenses include a large num-
ber of smaller individual items.
Taxes other than income taxes are either recognised under
the related expense item or, if no specifi c allocation is possible,
under other operating expenses.
Deutsche Post DHL Annual Report 2011
Consolidated Financial StatementsNotes
Income statement disclosures
177

Th e diff erence between the expected and the eff ective income
tax expense is due to temporary diff erences between the carrying
amounts in the IFRS fi nancial statements and in the tax accounts
of Deutsche Post AG resulting from initial diff erences in the open-
ing tax accounts as at 1 January 1995. In accordance with IAS 12.15
(b) and IAS 12.24 (b), the Group did not recognise any deferred
tax assets in respect of these temporary diff erences, which relate
mainly to property, plant and equipment as well as to provisions
for pensions and similar obligations. Th e remaining temporary dif-
ferences between the carrying amounts in the IFRS fi nancial state-
ments and in the opening tax accounts amounted to € 0.8 billion as
at 31 December 2011 (previous year: € 0.9 billion).
Th e eff ects from deferred tax assets of German Group com-
panies not recognised for tax loss carryforwards and temporary
diff erences relate primarily to Deutsche Post AG and members of
its consolidated tax group. Eff ects from deferred tax assets of for-
eign companies not recognised for tax loss carryforwards and tem-
porary diff erences relate primarily to the Americas region.
€ 39 million (previous year: € 714 million) of the eff ects from
deferred tax assets not recognised for tax loss carryforwards and
temporary diff erences relates to the reduction of the eff ective
income tax expense due to the utilisation of tax loss carryforwards
and temporary diff erences for which deferred tax assets had previ-
ously not been recognised. In addition, the recognition of deferred
taxes previously not recognised for tax loss carryforwards and of
deductible temporary diff erences from a prior period reduced the
deferred tax expense by € 144 million (previous year: € 399 mil-
lion). Eff ects from unrecognised deferred tax assets amounting to
€ 239 million (previous year: € 634 million, write-down) were due
to a valuation allowance recognised for a deferred tax asset. Other
eff ects from unrecognised deferred tax assets primarily relate to
loss carryforwards for which no deferred taxes were recognised.
A deferred tax asset in the amount of € 881 million (previous
year: € 759 million) was recognised in the balance sheet for com-
panies that reported a loss in the previous year or in the current
period as, based on tax planning, realisation of the tax asset is
probable.
In fi nancial year 2011, as in the previous year, German Group
companies were not aff ected by tax rate changes. Th e change in
the tax rate in some foreign tax jurisdictions did not lead to any
signifi cant eff ects.
Th e eff ective income tax expense includes prior-period tax
expenses from German and foreign companies in the amount of
€ 106 million (previous year: expense of € 75 million).
Effects of planned sale of Postbank
€ m
2010 2011
Interest expense on exchangeable bond –125 –130
Interest expense on cash collateral – 48 – 50
Net gain / loss on recognition and subsequent measurement of the forward 1,653 –160
Net gain / loss on measurements of the option (tranche iii) 89 –71
Impairment loss (–) on measurement of shares before reclassifi cation under ifrs 5 – 52 – 63
Impairment loss (–) / reversal of impairment loss (+) on shares under ifrs 5 0 115
Total 1,517 –359
Impairment loss (–) / reversal of impairment loss (+) on
shares under IFRS 5 comprises impairment losses of € 136 million
off set against impairment loss reversals of € 251 million.
19 Income taxes
€ m
2010 2011
Current income tax expense – 467 – 565
Current recoverable income tax 5 21
– 462 – 544
Deferred tax expense from temporary differences – 94 –29
Deferred tax income from tax loss carryforwards 362 180
268 151
Income taxes –194 –393
Th e reconciliation to the eff ective income tax expense is
shown below, based on consolidated net profi t before income taxes
and the expected income tax expense:
Reconciliation
€ m
2010 2011
Profi t before income taxes 2,824 1,659
Expected income taxes – 842 – 494
Deferred tax assets not recognised for initial differences 27 14
Deferred tax assets of German Group companies not recognised for tax loss carryforwards and temporary differences 430 164
Deferred tax assets of foreign Group companies not recognised for tax loss carryforwards and temporary differences –77 54
Effect of current taxes from previous years –75 –106
Tax-exempt income and non-deductible expenses 311 – 68
Differences in tax rates at foreign companies 32 43
Income taxes –194 –393
Deutsche Post DHL Annual Report 2011178

22 Earnings per share
Basic earnings per share are computed in accordance with
IAS 33 (Earnings per Share) by dividing consolidated net profi t by
the average number of shares. Basic earnings per share for fi nancial
year 2011 were € 0.96 (previous year: € 2.10).
Basic earnings per share
2010 2011
Consolidated net profi t for the period attributable to Deutsche Post ag shareholders € m 2,541 1,163
Weighted average number of shares outstanding number 1,208,951,725 1,208,878,374
Basic earnings per share € 2.10 0.96
To compute diluted earnings per share, the average number
of shares outstanding is adjusted for the number of all potentially
dilutive shares. Executives were entitled to 5,040,103 rights to
shares as at the reporting date.
Diluted earnings per share
2010 2011
Consolidated net profi t for the period attributable to Deutsche Post ag shareholders € m 2,541 1,163
Weighted average number of shares outstanding number 1,208,951,725 1,208,878,374
Potentially dilutive shares 1 number 1,122,990 1,799,459
Weighted average number of shares for diluted earnings 1 number 1,210,074,715 1,210,677,833
Diluted earnings per share € 2.10 0.961 The adjustment of the prior-year fi gure had no effect on diluted earnings.
23 Dividend per share
A dividend per share of € 0.70 is being proposed for fi nan-
cial year 2011. Based on the 1,209,015,874 shares recorded in the
commercial register as at 31 December 2011, this corresponds to
a dividend distribution of € 846 million. In the previous year the
dividend amounted to € 0.65 per share. Further details on the divi-
dend distribution can be found in Note 40.
Th e following table presents the tax eff ects on the compo-
nents of other comprehensive income:
Other comprehensive income
€ m
Before taxes Income taxes After taxes
2011
Currency translation reserve 167 0 167
Other changes in retained earnings 1 0 1
Hedging reserve in accordance with ias 39 –3 1 –2
Revaluation reserve in accordance with ias 39 –7 –2 – 9
Revaluation reserve in accordance with ifrs 3 –1 0 –1
Share of other comprehensive income of associates 10 0 10
Other comprehensive income 167 –1 166
2010
Currency translation reserve 542 0 542
Other changes in retained earnings 1 0 1
Hedging reserve in accordance with ias 39 42 2 44
Revaluation reserve in accordance with ias 39 –10 –1 –11
Revaluation reserve in accordance with ifrs 3 –1 0 –1
Share of other comprehensive income of associates 93 0 93
Other comprehensive income 667 1 668
20 Consolidated net profi t for the period
In fi nancial year 2011, the Group generated a consolidated net
profi t for the period of € 1,266 million (previous year: € 2,630 mil-
lion). Of this fi gure, € 1,163 million (previous year: € 2,541 million)
was attributable to Deutsche Post AG shareholders.
21 Non-controlling interests
Th e net profi t attributable to non-controlling interest holders
increased by € 14 million to € 103 million.
Deutsche Post DHL Annual Report 2011
Consolidated Financial StatementsNotes
Income statement disclosures
179

Th e additions to goodwill represent the goodwill of Tag Equity,
Eurodifarm, Standard Forwarding, Adcloud and LifeConEx;
Note 2.
Of the net disposals of goodwill, € 23 million relates to the
Exel Transportation Services Group, € 3 million to DHL Express
Canada and € 1 million to the partial disposal of Parcel Direct
Group Pty. Ltd.; Notes 2 and 36.
BALANCE SHEET DISCLOSURES
24 Intangible assets
24.1 Overview
€ m
Internally generated intangible
assetsPurchased
brand namesPurchased
customer lists
Other purchased intangible
assets Goodwill
Advance payments and
intangible assets under development Total
Cost
Balance at 1 January 2010 1,033 446 805 1,417 11,291 96 15,088
Additions to consolidated group 0 0 0 0 20 0 20
Additions 103 0 0 62 4 40 209
Reclassifi cations –20 0 0 37 0 –26 – 9
Disposals – 41 0 0 –170 –11 –20 –242
Currency translation differences 12 16 54 37 455 2 576
Balance at 31 December 2010 / 1 January 2011 1,087 462 859 1,383 11,759 92 15,642
Additions to consolidated group 0 4 49 12 136 0 201
Additions 98 0 0 106 4 82 290
Reclassifi cations 8 0 0 47 0 – 42 13
Disposals –37 0 0 –39 –34 –11 –121
Currency translation differences 2 15 32 7 209 1 266
Balance at 31 December 2011 1,158 481 940 1,516 12,074 122 16,291
Amortisation and impairment losses
Balance at 1 January 2010 711 416 305 1,042 1,048 32 3,554
Additions to consolidated group 0 0 0 0 0 0 0
Amortisation 92 1 70 119 0 0 282
Impairment losses 0 0 0 6 0 0 6
Reclassifi cations – 4 0 0 – 5 0 –1 –10
Reversals of impairment losses 0 0 0 0 0 0 0
Disposals –35 0 0 –122 0 0 –157
Currency translation differences 11 15 21 25 45 2 119
Balance at 31 December 2010 / 1 January 2011 775 432 396 1,065 1,093 33 3,794
Additions to consolidated group 0 0 0 1 0 0 1
Amortisation 98 0 71 108 0 0 277
Impairment losses 28 0 0 1 0 0 29
Reclassifi cations 0 0 0 1 0 0 1
Reversals of impairment losses 0 0 0 –1 0 0 –1
Disposals –25 0 0 –28 –7 0 – 60
Currency translation differences 3 14 18 3 15 1 54
Balance at 31 December 2011 879 446 485 1,150 1,101 34 4,095
Carrying amount at 31 December 2011 279 35 455 366 10,973 88 12,196
Carrying amount at 31 December 2010 312 30 463 318 10,666 59 11,848
Purchased soft ware, concessions, industrial rights, licences
and similar rights and assets are reported under purchased intan-
gible assets. Internally generated intangible assets relate to develop-
ment costs for internally developed soft ware.
Deutsche Post DHL Annual Report 2011180

Th e cash fl ow projections are based on the detailed plan-
ning for EBIT, depreciation / amortization and investment planning
adopted by management, as well as changes in net working capital,
and take both internal historical data and external macroeconomic
data into account. From a methodological perspective, the detailed
planning phase covers a three-year planning horizon from 2012 to
2014. It is supplemented by a perpetual annuity representing the
value added from 2015 onwards. Th is is calculated using a long-
term growth rate, which is determined for each CGU separately and
which is shown in the table below. Th e growth rates applied are
based on long-term real growth fi gures for the relevant economies,
growth expectations for the relevant sectors and long-term infl a-
tion forecasts for the countries in which the CGU s operate. Th e
cash fl ow forecasts are based both on past experience and on the
eff ects of the anticipated future general market trend. In addition,
the forecasts take into account growth in the respective geograph-
ical submarkets and in global trade, and the ongoing trend towards
outsourcing logistics activities. Cost trend forecasts for the trans-
portation network and services also have an impact on value in use.
Th e pre-tax cost of capital is based on the weighted average
cost of capital. Th e (pre-tax) discount rates for the individual CGU s
and the growth rates assumed in each case for the perpetual annu-
ity are shown in the following table:
24.2 Allocation of goodwill to cgu s
€ m
2010 2011
Total goodwill 1 10,666 10,973
mail 662 687
mail National 94 n. a.
mail International 568 n. a.
express 4,158 4,161
global forwarding, freight
dhl Global Forwarding 3,723 3,843
dhl Freight 268 280
supply chain
dhl Supply Chain 1,647 1,699
Williams Lea 322 4171 Goodwill from reconciliation amounts to € –114 million (previous year: € –114 million).
Th e structure of the MAIL CGU has been adjusted compared
with the previous year. Th e MAIL National and MAIL International
CGU s have been combined in accordance with the criteria set out in
IAS 36.68 as they are no longer managed separately by top manage-
ment. Th e prior-period amount was adjusted on a pro forma basis
to assure comparability.
For the purposes of annual impairment testing in accordance
with IAS 36, the Group determines the recoverable amount of a
CGU on the basis of its value in use. Th is calculation is based on
projections of free cash fl ows that are initially discounted at a rate
corresponding to the post-tax cost of capital. Pre-tax discount rates
are then determined iteratively.
% Discount rates Growth rates
2010 2011 2010 2011
supply chain
dhl Supply Chain 9.5 9.2 2.5 2.5
Williams Lea 9.7 7.8 2.0 2.0
global forwarding, freight
dhl Freight 9.6 9.4 2.0 2.0
dhl Global Forwarding 9.5 9.2 2.5 2.5
mail 1 n. a. 8.6 n. a. 0.5
mail National 9.2 n. a. 0.0 n. a.
mail International 8.8 n. a. 1.0 n. a.
express 2 10.6 n. a. 2.0 n. a.1 In fi nancial year 2011, the mail National and mail International cgu s were combined in accordance with the criteria set out in ias 36.68. 2 No fi gures given for fi nancial year 2011 due to the application of ias 36.99 in the year under review.
All conditions set out in IAS 36.99 were met for the EXPRESS
CGU as at 31 December 2011, with the result that no new detailed
calculation was made of the recoverable amount. Th ere was no risk
of impairment as at 31 December 2011.
Deutsche Post DHL Annual Report 2011
Consolidated Financial StatementsNotes
Balance sheet disclosures
181

When performing the impairment test, Deutsche Post DHL
conducted sensitivity analyses as required by IAS 36.134. Th ese
analyses did not reveal any risk of impairment to goodwill.
On the basis of these assumptions and the impairment tests
carried out for the individual CGU s to which goodwill was allo-
cated, it was established that the recoverable amounts for all CGU s
exceed their carrying amounts. No impairment losses were recog-
nised on goodwill in any of the CGU s as at 31 December 2011.
25 Property, plant and equipment
25.1 Overview
€ m
Land and buildings
Technical equipment
and machinery
Other equipment, operating and offi ce
equipment Aircraft
Vehicle fl eet and transport
equipment
Advance payments and
assets under development Total
Cost
Balance at 1 January 2010 4,677 4,197 2,389 1,612 1,921 130 14,926
Additions to consolidated group 0 0 0 0 0 0 0
Additions 76 266 157 68 212 279 1,058
Reclassifi cations 9 61 26 59 7 –164 –2
Disposals –281 –222 –188 –316 –207 –15 –1,229
Currency translation differences 132 114 97 10 36 4 393
Balance at 31 December 2010 / 1 January 2011 4,613 4,416 2,481 1,433 1,969 234 15,146
Additions to consolidated group 24 18 9 0 6 0 57
Additions 60 238 182 36 277 637 1,430
Reclassifi cations 26 128 43 120 63 – 414 –34
Disposals – 87 –268 –140 –120 –269 –18 – 902
Currency translation differences 28 18 2 – 9 3 7 49
Balance at 31 December 2011 4,664 4,550 2,577 1,460 2,049 446 15,746
Depreciation and impairment losses
Balance at 1 January 2010 1,992 3,227 1,754 689 1,061 –17 8,706
Additions to consolidated group 0 0 0 0 0 0 0
Depreciation 173 216 225 137 204 0 955
Impairment losses 17 12 2 21 1 0 53
Reclassifi cations –10 7 1 0 0 11 9
Reversals of impairment losses –3 0 –1 –3 0 0 –7
Disposals –156 –189 –162 –276 –178 11 – 950
Currency translation differences 73 76 76 4 21 0 250
Balance at 31 December 2010 / 1 January 2011 2,086 3,349 1,895 572 1,109 5 9,016
Additions to consolidated group 18 10 5 0 1 0 34
Depreciation 167 226 209 141 205 0 948
Impairment losses 8 7 2 1 2 0 20
Reclassifi cations – 6 –11 0 0 11 0 – 6
Reversals of impairment losses – 4 –1 0 0 0 0 – 5
Disposals –73 –254 –129 –111 –226 –2 –795
Currency translation differences 22 18 4 –7 4 0 41
Balance at 31 December 2011 2,218 3,344 1,986 596 1,106 3 9,253
Carrying amount at 31 December 2011 2,446 1,206 591 864 943 443 6,493
Carrying amount at 31 December 2010 2,527 1,067 586 861 860 229 6,130
Advance payments relate only to advance payments on items
of property, plant and equipment for which the Group has paid
advances in connection with uncompleted transactions. Assets
under development relate to items of property, plant and equip-
ment in progress at the balance sheet date for whose production
internal or third-party costs have already been incurred.
Deutsche Post DHL Annual Report 2011182

Investments in associates principally relate to Air Hong Kong
Ltd, China, Danzas AEI Emirates LLC, United Arab Emirates and
Unipost Servicios Generales S. L., Spain. Th e complete list is shown
in Note 58 in the list of shareholdings.
Th e decline in investments in associates is largely due to
the reclassifi cation as held for sale at the end of February 2011 of
the carrying amount of the investment in Deutsche Postbank AG
(€ 1,801 million); Notes 3 and 36.
Further disclosures on impairment losses are contained in
Note 18.
Th e following tables show a summary of the aggregate in-
come statements and balance sheets of the associates. Th e amounts
do not relate to the shares attributable to Deutsche Post DHL, but
are presented based on a notional 100 % shareholding.
Aggregate results
€ m
2010 2011
Revenue 8,841 1 584
Net profi t for the year 139 41 For Deutsche Postbank ag, revenue includes interest income, commission income
and net trading income.
Aggregate balance sheets
€ m
2010 2011
Assets 215,179 513
Liabilities and provisions 209,451 410
28 Non-current fi nancial assets
€ m
2010 2011
Available-for-sale fi nancial assets 142 172
Loans and receivables 468 428
Assets at fair value through profi t or loss 2,531 94
Held-to-maturity fi nancial assets 5 0
Lease receivables 47 35
Non-current fi nancial assets 3,193 729
Th e decrease in assets at fair value through profi t or loss
resulted from the reclassifi cation of the put option related to the
planned sale of the interest in Deutsche Postbank to Deutsche
Bank AG. Th is was reclassifi ed as current due to its maturity date;
see also Note 34. Th is item also includes derivatives for hedging
the currency risk.
25.2 Finance leases
Th e following assets are carried as non-current assets result-
ing from fi nance leases:
€ m
2010 2011
Land and buildings 57 51
Technical equipment and machinery 8 6
Other equipment, operating and offi ce equipment 25 17
Aircraft 281 249
Vehicle fl eet and transport equipment 3 4
Finance leases 374 327
Th e corresponding liabilities from fi nance leases are included
under fi nancial liabilities; see Note 44.3.
26 Investment property
€ m
2010 2011
Cost
As at 1 January 45 53
Reclassifi cations 10 13
Disposals –3 – 5
Currency translation differences 1 0
As at 31 December 53 61
Depreciation
As at 1 January 13 16
Reclassifi cations 3 5
As at 31 December 16 21
Carrying amount as at 31 December 37 40
Rental income for this property amounted to € 3 million (pre-
vious year: € 1 million), whilst the related expenses amounted to
€ 4 million (previous year: € 2 million). Th e fair value amounted to
€ 90 million (previous year: € 77 million).
27 Investments in associates
Investments in associates changed as follows:
€ m
2010 2011
As at 1 January 1,772 1,847
Changes in Group’s share of equity
Changes recognised in profi t or loss 56 60
Profi t distributions – 4 0
Changes recognised in other comprehensive income 93 10
Impairment losses – 69 –72
Elimination of intercompany profi ts and losses –1 0
Reclassifi ed to current assets 0 –1,801
Carrying amount as at 31 December 1,847 44
Deutsche Post DHL Annual Report 2011
Consolidated Financial StatementsNotes
Balance sheet disclosures
183

€ 523 million (previous year: € 387 million) of the deferred
taxes on tax loss carryforwards relates to tax loss carryforwards in
Germany and € 158 million (previous year: € 112 million) to foreign
tax loss carryforwards.
No deferred tax assets were recognised for tax loss carry-
forwards of around € 12.4 billion (previous year: € 10.9 billion) and
for temporary diff erences of around € 2,097 million (previous year:
€ 2,724 million), as it can be assumed that the Group will prob-
ably not be able to use these tax loss carryforwards and tempor-
ary diff erences in its tax planning. A refi ned method for deter-
mining unused loss carryforwards was applied for the fi rst time
as at the current balance sheet date. Th e prior-period amounts
were adjusted. Most of the loss carryforwards are attributable to
Deutsche Post AG. It will be possible to utilise them for an indefi n-
ite period of time. In the case of the foreign companies, the sig-
nifi cant loss carry forwards will not lapse before 2024.
Deferred taxes have not been recognised for temporary dif-
ferences of € 572 million (previous year: € 375 million) relating to
earnings of German and foreign subsidiaries because these tempor-
ary diff erences will probably not reverse in the foreseeable future.
Maturity structure
€ m
Short-term Long-term Netting Total
2011
Deferred tax assets 571 908 –326 1,153
Deferred tax liabilities 326 255 –326 255
2010
Deferred tax assets 171 1,084 –282 973
Deferred tax liabilities 98 399 –282 215
31 Inventories
Standard costs for inventories of postage stamps and spare
parts in freight centres amounted to € 13 million (previous year:
€ 13 million). Th ere was no requirement to charge signifi cant valu-
ation allowances on these inventories.
€ m
2010 2011
Raw materials, consumables and supplies 161 170
Finished goods and goods purchased and held for resale 44 55
Work in progress 13 28
Spare parts for aircraft 5 20
Advance payments 0 0
Inventories 223 273
Write-downs on non-current fi nancial assets amounting to
€ 13 million (previous year: € 13 million) were recognised in the
income statement because the assets were impaired. € 12 million
(previous year: € 10 million) of this amount is attributable to assets
at fair value through profi t or loss and € 1 million (previous year:
€ 3 million) to available-for-sale fi nancial assets.
Compared with the market rates of interest prevailing at
31 December 2011 for comparable non-current fi nancial assets,
most of the housing promotion loans are low-interest or interest-
free loans. Th ey are recognised in the balance sheet at a present value
of € 15 million (previous year: € 16 million). Th e principal amount
of these loans totals € 17 million (previous year: € 22 million).
Details on restraints on disposal are contained in Note 48.2
(Collateral).
29 Other non-current assets
€ m
2010 2011
Pension assets 375 453
Miscellaneous 90 117
Other non-current assets 465 570
Further information on pension assets can be found in
Note 42.
30 Deferred taxes
€ m 2010 2011
Assets Liabilities Assets Liabilities
Intangible assets 39 210 38 224
Property, plant and equipment 85 43 92 44
Non-current fi nancial assets 13 71 22 54
Other non-current assets 4 50 7 49
Other current assets 33 18 40 48
Provisions 196 12 269 40
Financial liabilities 332 61 215 75
Other liabilities 54 32 115 47
Tax loss carryforwards 499 – 681 –
Gross amount 1,255 497 1,479 581
Netting –282 –282 –326 –326
Carrying amount 973 215 1,153 255
Deutsche Post DHL Annual Report 2011184

34 Current fi nancial assets
€ m
2010 2011
Available-for-sale fi nancial assets 420 8
Loans and receivables 150 215
Held-to-maturity fi nancial assets 0 0
Financial assets at fair value through profi t or loss 38 2,234
Lease receivables 47 41
Current fi nancial assets 655 2,498
Th e increase in assets at fair value through profi t or loss is
attributable to the reclassifi cation of the put option related to the
planned sale of the interest in Deutsche Postbank; see Note 28.
Of the available-for-sale fi nancial assets, € 8 million (previ-
ous year: € 407 million) was measured at fair value. Details on re-
straints on disposal are contained in Note 48.2 (Collateral).
35 Cash and cash equivalents
€ m
2010 2011
Cash equivalents 2,056 1,914
Bank balances 837 751
Cash in transit 350 311
Cash 28 18
Other cash and cash equivalents 144 129
Cash and cash equivalents 3,415 3,123
32 Income tax assets and liabilities
€ m
2010 2011
Income tax assets 223 239
Income tax liabilities 463 570
All income tax assets and liabilities are current and have
maturities of less than one year.
33 Receivables and other current assets
€ m
2010 2011
Trade receivables 6,011 6,426
Prepaid expenses 683 672
Current tax receivables 490 586
Deferred revenue 508 480
Income from cost absorption 83 86
Creditors with debit balances 37 39
Receivables from sale of assets 17 29
Receivables from Group companies 35 27
Receivables from employees 31 25
Receivables from loss compensation (recourse claims) 19 23
Receivables from insurance business 20 16
Receivables from cash-on-delivery 13 13
Receivables from Bundes-Pensions-Service für Post und Telekommunikation e. V. 14 11
Receivables from private postal agencies 8 8
Miscellaneous other assets 672 648
Receivables and other current assets 8,641 9,089
Of the tax receivables, € 470 million (previous year: € 388 mil-
lion) relates to VAT, € 71 million (previous year: € 66 million) to
customs and duties, and € 45 million (previous year: € 36 million)
to other tax receivables. Miscellaneous other assets include a large
number of individual items.
36 Assets held for sale and liabilities associated with assets
held for sale
Th e amounts reported under these items mainly relate to the
following:
€ m Assets Liabilities
2010 2011 2010 2011
Investment in Deutsche Postbank ag (Corporate Center / Other) 0 1,916 0 0
Deutsche Post ag – real estate (Corporate Center / Other) 71 21 0 0
Deutsche Post Immobilienentwicklung Grundstücksgesellschaft mbH & Co. Logistikzentren kg, Germany – real estate (Corporate Center / Other) 25 15 0 0
us Express Aviation, usa – aircraft (express segment) 12 4 0 0
Miscellaneous 5 5 0 0
Assets held for sale and liabilities associated with assets held for sale 113 1,961 0 0
Deutsche Post DHL Annual Report 2011
Consolidated Financial StatementsNotes
Balance sheet disclosures
185

Deutsche Post Immobilienentwicklung Grundstücksgesell-
schaft , Germany, still plans to sell two properties. Th ese properties,
as well as two other properties, the sale of which has in the mean-
time been completed, were reclassifi ed in the previous year from
property, plant and equipment to assets held for sale. Th e most
recent appraisal prior to reclassifi cation had resulted in an impair-
ment loss of € 13 million.
Surplus aircraft capacity that was no longer required fol-
lowing the restructuring of US Express Aviation was classifi ed in
accordance with IFRS 5 in the previous year.
37 Issued capital
37.1 Share capital
KfW Bankengruppe (KfW), see Note 53.1, holds 30.5 %
of Deutsche Post AG’s share capital. Th e proportion of free fl oat
shares amounts to 69.5 %.
Share ownership as at 31 December
number of shares
2010 2011
KfW 368,277,358 368,277,358
Free fl oat 840,738,516 840,738,516
Share capital as at 31 December 1,209,015,874 1,209,015,874
37.2 Issued capital and purchase of treasury shares
Th e issued capital was € 1,209 million. It is composed of
1,209,015,874 no-par value registered shares (ordinary shares) with
a notional interest in the share capital of € 1 per share and is fully
paid up.
Changes in issued capital
€
2010 2011
As at 1 January 1,209,015,874 1,209,015,874
Treasury shares acquired –769,794 –1,676,178
Treasury shares issued 769,794 1,676,178
As at 31 December 1,209,015,874 1,209,015,874
Deutsche Post AG acquired 1.67 million shares at a total price
of € 21 million, including transaction costs, in a number of trans-
actions in order to settle entitlements due under the 2010 tranche
of the bonus programme for executives (Share Matching Scheme).
Th e average purchase price per share was € 12.79. Th e acquisition of
treasury shares reduced the issued capital.
Th e notional value of the treasury shares is deducted from
issued capital, and the diff erence between the notional value and
the reported value of the treasury shares is deducted from retained
earnings.
As part of the planned sale of Deutsche Postbank shares and
in accordance with the contractual arrangements, the shares of
Deutsche Postbank AG held by Deutsche Post AG amounting to a
39.5 % interest (86,417,432 shares) were reclassifi ed as held for sale
at the end of February 2011. Following reclassifi cation, the invest-
ment in Deutsche Postbank is measured in accordance with IFRS 5.
Key fi gures for Deutsche Postbank shares
31 Dec. 2010 31 Dec. 2011
Fair value of interest in Deutsche Postbank € m 1,797 2,086
Stock market price € 20.80 24.135
In 2010, the write-down of the carrying amount of the invest-
ment due to the decline in the share price amounted to € 52 million.
In the fi nancial year under review, the last measurement of the carry-
ing amount of the investment prior to its reclassifi cation resulted
in an impairment loss of € 63 million. Th is was presented in write-
downs of fi nancial assets; see Note 18. Additional write-downs
of € 136 million were recognized following the reclassifi cation of
the Deutsche Postbank interest to assets held for sale in Febru-
ary 2011. In accordance with IFRS 5.21, any subsequent increase in
fair value less costs to sell of the held-for-sale interest in Deutsche
Postbank AG must be recognised as a gain, but not in excess of
the cumulative impairment loss. All previous write-downs in the
total amount of € 251 million were reversed due to the increase in
Postbank’s share price to € 24.13 as at the end of 2011.
Th e equity item includes € 81 million in income from the
IAS 39 revaluation reserve and € 44 million in expenses from the
currency translation reserve that are attributable to Deutsche
Postbank AG.
Th e partial sale of the Australian domestic express business
of Parcel Direct Group Pty Ltd., Australia, was completed for the
sale of the assets of Western Australia and Northern Kope. Th e sale
of other assets realised € 1 million from the currency translation
reserve; see also Note 2.
Of the € 71 million planned property sales by Deutsche
Post AG, sales of € 15 million were completed in the fi nancial year
and properties worth € 34 million were reclassifi ed back to non-
current assets.
Deutsche Post DHL Annual Report 2011186

38.1 Capital reserves
€ m
2010 2011
Capital reserves as at 1 January 2,147 2,158
Additions
Issue of rights under 2009 Share Matching Scheme 6 3
Issue of rights under 2010 Share Matching Scheme 14 17
Issue of rights under 2011 Share Matching Scheme 0 13
Exercise of rights under 2009 Share Matching Scheme – 9 0
Exercise of rights under 2010 Share Matching Scheme 0 –21
Capital reserves as at 31 December 2,158 2,170
An amount of € 33 million (31 December 2010: € 20 million)
was transferred to the capital reserves in the period up to 31 De-
cember 2011 for the 2009, 2010 and 2011 tranches of the Share
Matching Scheme.
Th e exercise of the rights to shares under the 2010 tranche
in April 2011 reduced the capital reserves by € 21 million (previous
year: € 9 million for the 2009 tranche) due to the issuance of treas-
ury shares in this amount to the executives.
38.2 Revaluation reserve in accordance with ias 39
Th e revaluation reserve comprises gains and losses from
changes in the fair value of available-for-sale fi nancial assets that
have been recognised in other comprehensive income. Th is reserve
is reversed to profi t or loss either when the assets are sold or other-
wise disposed of, or if the fair value of the assets falls permanently
below their cost.
€ m
2010 2011
As at 1 January 7 87
Currency translation differences 1 1
Unrealised gains / losses 5 – 8
Share of associates 90 13
Realised gains / losses –16 0
Revaluation reserve as at 31 December before tax 87 93
Deferred taxes –1 –3
Revaluation reserve as at 31 December after tax 86 90
Th e issued capital increased again when the shares were is-
sued to the executives. Changes in treasury shares are presented in
the statement of changes in equity.
Authorised / contingent capital as at 31 December 2011
Amount € m Purpose
Authorised Capital 2009 240
Increase in share capital against cash / non-cash contributions (until 20 April 2014)
Contingent Capital 2011 75Issue of option / conversion rights (24 May 2016)
On 25 May 2011, the Annual General Meeting resolved to
contingently increase the share capital by up to € 75 million to grant
option or conversion rights or to settle conversion obligations to
the holders of bonds with warrants, convertible bonds and / or
income bonds, as well as profi t participation certifi cates (Contin-
gent Capital 2011).
37.3 Authorisation to acquire treasury shares
By way of a resolution adopted by the Annual General Meet-
ing on 28 April 2010, the company is authorised to acquire treas-
ury shares in the period to 27 April 2015 of up to 10 % of the share
capital existing when the resolution was adopted. Th e authorisa-
tion permits the Board of Management to exercise it for every
purpose permitted by law, and in particular to pursue the goals
mentioned in the resolution by the Annual General Meeting. In
addition, the Board of Management is authorised to acquire treas-
ury shares using derivatives. As at the reporting date in the pre-
vious year, Deutsche Post AG did not hold any treasury shares on
31 December 2011.
37.4 Disclosures on corporate capital
Th e equity ratio was 29.2 % in fi nancial year 2011 (previous
year: 28.3 %). Th e company’s capital is monitored using the net gear-
ing ratio which is defi ned as net debt divided by the total of equity
and net debt. Due to the company’s net liquidity, the informa tive
value of this key fi gure is limited and it has therefore not been
disclosed.
38 Other reserves
€ m
2010 2011
Capital reserves 2,158 2,170
Revaluation reserve in accordance with ias 39 86 90
Hedging reserve in accordance with ias 39 –33 –34
Revaluation reserve in accordance with ifrs 3 6 5
Currency translation reserve – 682 – 517
Other reserves 1,535 1,714
Deutsche Post DHL Annual Report 2011
Consolidated Financial StatementsNotes
Balance sheet disclosures
187

38.5 Currency translation reserve
Th e currency translation reserve includes the translation
gains and losses from the consolidation of the subsidiaries report-
ing in foreign currency.
€ m
2010 2011
As at 1 January –1,215 – 682
Changes recognised in profi t or loss 20 –26
Changes recognised in other comprehensive income 513 191
Currency translation reserve as at 31 December – 682 – 517
39 Retained earnings
As well as the undistributed consolidated profi ts generated in
prior periods, retained earnings also contain the eff ects from trans-
actions with non-controlling interests. Changes in the reserves
during the fi nancial year are also presented in the statement of
changes in equity.
€ m
2010 2011
As at 1 January 6,098 7,767
Dividend payment –725 –786
Consolidated net profi t for the period 2,541 1,163
Transactions with non-controlling interests –147 – 59
Miscellaneous other changes 0 1
Retained earnings as at 31 December 7,767 8,086
Th e transactions with non-controlling interests of € 59 mil-
lion largely relate to an option to acquire the remaining interest
(24 %) in DHL Lemuir Logistics Private Limited, India. In addition,
the transactions include the acquisition of the remaining 15 % of
shares in Trade Clippers Cargo, Bangladesh, and the further acqui-
sition of 45 % of the shares of SNAS Lebanon SARL, Lebanon. Th e
transactions with non-controlling interests reported in an amount
of € 147 million in the previous year related to the acquisition of the
remaining shares in ASTAR Air Cargo Holdings, LLC, USA, which
had already been fully consolidated as a special purpose entity.
Retained earnings include the reserve for treasury shares,
which changed as follows:
€ m
2010 2011
As at 1 January 0 –1
Treasury shares acquired – 9 –20
Treasury shares issued 8 20
Reserve for treasury shares as at 31 December –1 –1
Changes in treasury shares are presented in the statement of
changes in equity.
38.3 Hedging reserve in accordance with ias 39
Th e hedging reserve is adjusted by the eff ective portion of a
cash fl ow hedge. Th e hedging reserve is released to profi t or loss
when the hedged item is settled.
€ m
2010 2011
As at 1 January –78 –36
Additions – 67 – 4
Disposals in balance sheet (basis adjustment) 0 0
Disposals in income statement 109 1
Hedging reserve as at 31 December before tax –36 –39
Deferred taxes 3 5
Hedging reserve as at 31 December after tax –33 –34
Th e change in the hedging reserve is mainly the result of
the recognition of previously unrealised gains and losses from
hedging future operating currency transactions. In the fi nancial
year, unrealised losses totalling € 10 million and unrealised gains
totalling € 8 million from the hedging reserve were recognised in
operating profi t under other operating expenses (previous year:
unrealised losses of € 12 million were recognised in other operat-
ing expenses). Th ere were no disposals in net fi nancial income / net
fi nance costs in the fi nancial year (previous year: € 97 million). Fur-
thermore, there were no adjusting entries for hedging trans actions
related to the acquisition of non-current non-fi nancial assets (pre-
vious year: € 0 million). Deferred taxes have been recognised in
respect of the hedging reserve.
38.4 Revaluation reserve in accordance with ifrs 3
€ m
2010 2011
As at 1 January 7 6
Changes recognised in other comprehensive income –1 –1
Revaluation reserve in accordance with ifrs 3 as at 31 December 6 5
Th e revaluation reserve in accordance with IFRS 3 includes
the hidden reserves of DHL Logistics Co. Ltd., China (formerly
Exel-Sinotrans Freight Forwarding Co. Ltd.) from purchase price
allocation. Th ese are attributable to the customer relationships
contained in the 50 % interest previously held and to adjustments
to deferred taxes.
Deutsche Post DHL Annual Report 2011188

41 Non-controlling interests
Th is balance sheet item includes adjustments for the interests
of non-Group shareholders in the consolidated equity from acqui-
sition accounting, as well as their interests in profi t or loss. Th e
interests relate primarily to the following companies:
€ m
2010 2011
dhl Sinotrans International Air Courier Ltd., China 84 86
Blue Dart Express Limited, India 18 19
Lemuir Logistics Private Limited, India 18 17
Tradeteam Limited, uk 18 12
Other companies 47 56
Non-controlling interests 185 190
40 Equity attributable to Deutsche Post ag shareholders
Th e equity attributable to Deutsche Post AG shareholders in
fi nancial year 2011 amounted to € 11,009 million (previous year:
€ 10,511 million).
Dividends
Dividends paid to the shareholders of Deutsche Post AG
are based on the net retained profi t of € 1,519 million reported in
Deutsche Post AG’s annual fi nancial statements in accordance with
the Handelsgesetzbuch (HGB – German Commercial Code). Th e
amount of € 673 million remaining aft er deduction of the planned
total dividend of € 846 million (which corresponds to € 0.70 per
share) will be carried forward.
Total dividend € m
Dividend per share
€
Dividend distributed in fi nancial year 2011 for the year 2010 786 0.65
Dividend distributed in fi nancial year 2010 for the year 2009 725 0.60
Th e dividend is tax-exempt for shareholders resident in Ger-
many. No capital gains tax (investment income tax) will be with-
held on the distribution.
42 Provisions for pensions and similar obligations
Th e information below on pension obligations is generally
broken down into the following areas: Germany, UK and Other.
42.1 Provisions for pensions and similar obligations by area
€ m
Germany uk Other Total
31 December 2011
Provisions for pensions and similar obligations 4,096 140 209 4,445
Pension assets 0 266 187 453
Net pension provisions 4,096 –126 22 3,992
31 December 2010
Provisions for pensions and similar obligations 4,150 157 206 4,513
Pension assets 0 196 179 375
Net pension provisions 4,150 –39 27 4,138
Deutsche Post DHL Annual Report 2011
Consolidated Financial StatementsNotes
Balance sheet disclosures
189

42.2 Actuarial assumptions
Th e majority of the Group’s defi ned benefi t obligations relates
to plans in Germany and the UK. In addition, signifi cant pension
plans are provided in other euro zone countries, Switzerland and
the USA. Th e actuarial measurement of the main benefi t plans was
based on the following assumptions:
%
Germany ukOther
euro zone Switzerland usa
31 December 2011
Discount rate 4.75 4.75 4.75 2.50 4.75
Rate of future salary increase 2.50 3.49 2.15 2.75 –
Future infl ation rate 2.00 3.00 2.00 1.50 –
31 December 2010
Discount rate 5.00 5.50 5.00 2.75 5.50
Rate of future salary increase 2.50 3.44 2.57 3.00 –
Future infl ation rate 2.00 3.00 2.00 1.50 –
For the German Group companies, life expectancy was cal-
culated using the Richttafeln 2005 G mortality tables published by
Klaus Heubeck. Life expectancy for the British pension plans was
based on the mortality rates used for the last funding valuation.
Th ese are based on plan-specifi c mortality analyses and include a
premium for an expected increase in future life expectancy. Other
countries used their own mortality tables.
42.3 Computation of expense for the period
Th e following average expected return on plan assets was
used to compute the expense for the period:
%
Germany ukOther
euro zone Switzerland usa
31 December 2011
Average expected return on plan assets 3.72 5.81 5.65 4.00 6.50
31 December 2010
Average expected return on plan assets 4.15 6.25 5.69 4.25 7.00
Th e average expected return on plan assets was determined
by reference to long-term bond yields (government and corporate).
In this process, suitable risk premiums were applied on the basis of
historical market returns and current market expectations taking
plan asset structures into account.
Deutsche Post DHL Annual Report 2011190

42.4 Reconciliation of the present value of the defi ned benefi t
obligation, the fair value of plan assets and the pension
provisions
€ m
Germany uk Other Total
2011
Present value of defi ned benefi t obligation at 31 December for wholly or partly funded benefi ts 4,097 3,943 1,640 9,680
Present value of defi ned benefi t obligation at 31 December for unfunded benefi ts 3,377 8 192 3,577
Present value of total defi ned benefi t obligation at 31 December 7,474 3,951 1,832 13,257
Fair value of plan assets at 31 December –2,106 –3,714 –1,549 –7,369
Unrecognised gains (+) / losses (–) –1,272 –364 –262 –1,898
Unrecognised past service cost 0 0 0 0
Asset adjustment for asset ceiling 0 1 1 2
Net pension provisions at 31 December 4,096 –126 22 3,992
Pension assets at 31 December 0 266 187 453
Provisions for pensions and similar obligations at 31 December 4,096 140 209 4,445
2010
Present value of defi ned benefi t obligation at 31 December for wholly or partly funded benefi ts 4,003 3,294 1,589 8,886
Present value of defi ned benefi t obligation at 31 December for unfunded benefi ts 3,272 8 183 3,463
Present value of total defi ned benefi t obligation at 31 December 7,275 3,302 1,772 12,349
Fair value of plan assets at 31 December –2,122 –3,378 –1,519 –7,019
Unrecognised gains (+) / losses (–) –1,003 36 –232 –1,199
Unrecognised past service cost 0 0 0 0
Asset adjustment for asset ceiling 0 1 6 7
Net pension provisions at 31 December 4,150 –39 27 4,138
Pension assets at 31 December 0 196 179 375
Provisions for pensions and similar obligations at 31 December 4,150 157 206 4,513
Deutsche Post DHL Annual Report 2011
Consolidated Financial StatementsNotes
Balance sheet disclosures
191

42.5 Changes in the present value of total defi ned benefi t obligation
€ m
Germany uk Other Total
2011
Present value of total defi ned benefi t obligation at 1 January 7,275 3,302 1,772 12,349
Current service cost, excluding employee contributions 79 28 35 142
Employee contributions 9 14 15 38
Interest cost 356 177 76 609
Benefi t payments – 481 –168 – 83 –732
Past service cost 13 0 –1 12
Curtailments 0 0 –7 –7
Settlements 0 – 9 –11 –20
Transfers 0 2 0 2
Acquisitions / divestitures 0 3 0 3
Actuarial gains (–) / losses (+) 223 469 15 707
Currency translation effects 0 133 21 154
Present value of total defi ned benefi t obligation at 31 December 7,474 3,951 1,832 13,257
2010
Present value of total defi ned benefi t obligation at 1 January 7,130 3,004 1,530 11,664
Current service cost, excluding employee contributions 76 31 35 142
Employee contributions 8 17 15 40
Interest cost 366 178 73 617
Benefi t payments – 487 –166 – 90 –743
Past service cost 13 1 –3 11
Curtailments 0 – 5 –2 –7
Settlements 0 0 –1 –1
Transfers 4 3 0 7
Acquisitions / divestitures 3 0 –2 1
Actuarial gains (–) / losses (+) 162 137 106 405
Currency translation effects 0 102 111 213
Present value of total defi ned benefi t obligation at 31 December 7,275 3,302 1,772 12,349
Deutsche Post DHL Annual Report 2011192

42.6 Changes in the fair value of plan assets
€ m
Germany uk Other Total
2011
Fair value of plan assets at 1 January 2,122 3,378 1,519 7,019
Employer contributions 160 85 39 284
Employee contributions 0 14 15 29
Expected return on plan assets 89 200 80 369
Gains (+) / losses (–) on plan assets – 65 86 –38 –17
Benefi t payments –202 –167 –74 – 443
Transfers 2 2 0 4
Acquisitions 0 4 0 4
Settlements 0 – 9 –11 –20
Currency translation effects 0 121 19 140
Fair value of plan assets at 31 December 2,106 3,714 1,549 7,369
2010
Fair value of plan assets at 1 January 2,073 3,060 1,339 6,472
Employer contributions 169 106 31 306
Employee contributions 0 4 15 19
Expected return on plan assets 88 207 79 374
Gains (+) / losses (–) on plan assets 1 59 41 101
Benefi t payments –209 –165 –77 – 451
Transfers –1 3 0 2
Acquisitions 1 0 0 1
Settlements 0 0 –1 –1
Currency translation effects 0 104 92 196
Fair value of plan assets at 31 December 2,122 3,378 1,519 7,019
Th e plan assets are composed of fi xed-income securities
(45 %; previous year: 42 %), equities and investment funds (18 %;
previous year: 30 %), real estate (17 %; previous year: 19 %), cash
and cash equivalents (6 %; previous year: 4 %), insurance contracts
(4 %; previous year: 4 %) and other assets (10 %; previous year: 1 %).
Other assets primarily comprise alternative investments and over-
lay mandates for risk-based allocation management, which were
used to signifi cantly reduce equity risk in 2011.
79 % (previous year: 79 %) of the real estate has a fair value of
€ 1,011 million (previous year: € 1,043 million) and is owner-occu-
pied by Deutsche Post AG.
42.7 Funded status
€ m 2007 Total
2008 Total
2009 Total
2010 Total
2011 Total
Present value of defi ned benefi t obligations at 31 December 13,529 12,246 11,664 12,349 13,257
Fair value of plan assets at 31 December –7,772 – 6,235 – 6,472 –7,019 –7,369
Funded status 1 5,757 6,011 5,192 5,330 5,8881 The funded status is recognised until fi nancial year 2008 with the amounts
of Deutsche Postbank Group included.
Deutsche Post DHL Annual Report 2011
Consolidated Financial StatementsNotes
Balance sheet disclosures
193

€ m 2007 Total
2008 Total
2009 Total
2010 Total
2011 Total
Experience gains (+) / losses (–) on defi ned benefi t obligations 116 11 61 50 –29
Gains (+) / losses (–) on defi ned benefi t obligations arising from changes in assumptions 1,298 635 – 561 – 455 – 678
Total actuarial gains (+) / losses (–) on defi ned benefi t obligations 1 1,414 646 – 500 – 405 –7071 Total actuarial gains and losses on defi ned benefi t obligations are recognised
until fi nancial year 2008 with the amounts of the Deutsche Postbank Group included.
42.8 Gains and losses
€ m 2007 Total
2008 Total
2009 Total
2010 Total
2011 Total
Actual return on plan assets 473 – 632 509 475 352
Expected return on plan assets 439 415 335 374 369
Experience gains (+) / losses (–) on plan assets 1 34 –1,047 174 101 –171 The experience gains and losses on plan assets are recognised until fi nancial year 2008
with the amounts of the Deutsche Postbank Group included.
42.9 Changes in net pension provisions
€ m
Germany uk Other Total
2011
Net pension provisions at 1 January 4,150 –39 27 4,138
Pension expense 377 3 46 426
Benefi t payments –279 –1 – 9 –289
Employer contributions –160 – 85 –39 –284
Employee contributions 9 0 0 9
Acquisitions / divestitures 0 –1 0 –1
Transfers –1 0 0 –1
Currency translation effects 0 –3 –3 – 6
Net pension provisions at 31 December 4,096 –126 22 3,992
2010
Net pension provisions at 1 January 4,204 59 23 4,286
Pension expense 378 –7 41 412
Benefi t payments –278 –1 –13 –292
Employer contributions –169 –106 –31 –306
Employee contributions 8 13 0 21
Acquisitions / divestitures 2 0 –2 0
Transfers 5 0 –2 3
Currency translation effects 0 3 11 14
Net pension provisions at 31 December 4,150 –39 27 4,138
Payments amounting to € 572 million are expected with regard
to net pension provisions in 2012. Of this amount, € 294 million is
attributable to the Group’s expected direct pension payments and
€ 278 million to expected employer contributions to pension funds.
Deutsche Post DHL Annual Report 2011194

42.10 Pension expense
€ m
Germany uk Other Total
2011
Current service cost, excluding employee contributions 79 28 35 142
Interest cost 356 177 76 609
Expected return on plan assets – 89 –200 – 80 –369
Recognised past service cost 13 0 –1 12
Amortisation of unrealised gains (–) / losses (+) 18 –2 24 40
Effects of curtailments 0 0 – 6 – 6
Effects of settlements 0 0 3 3
Effects of asset ceiling 0 0 – 5 – 5
Pension expense 377 3 46 426
2010
Current service cost, excluding employee contributions 76 31 35 142
Interest cost 366 178 73 617
Expected return on plan assets – 88 –207 –79 –374
Recognised past service cost 14 1 –3 12
Amortisation of unrealised gains (–) / losses (+) 10 – 4 26 32
Effects of curtailments 0 – 6 –2 – 8
Effects of settlements 0 0 0 0
Effects of asset ceiling 0 0 – 9 – 9
Pension expense 378 –7 41 412
€ 186 million (previous year: € 169 million) of the entire pen-
sion expense was included in staff costs in 2011, and € 240 million
(previous year: € 243 million) was included in net other fi nancial
income / net other fi nance costs.
43 Other provisions
€ m Non-current Current Total
2010 2011 2010 2011 2010 2011
Other employee benefi ts 924 779 259 274 1,183 1,053
Restructuring provisions 696 603 452 328 1,148 931
Technical reserves (insurance) 374 398 179 190 553 588
Postage stamps 0 0 450 450 450 450
Miscellaneous provisions 446 394 919 892 1,365 1,286
2,440 2,174 2,259 2,134 4,699 4,308
43.1 Changes in other provisions
€ m Other employee
benefi tsRestructuring
provisions
Technical reserves
(insurance)Postage stamps
Miscellaneous provisions Total
As at 1 January 2011 1,183 1,148 553 450 1,365 4,699
Changes in consolidated group 0 0 –1 0 4 3
Utilisation – 535 –277 – 63 – 450 – 599 –1,924
Currency translation differences 8 20 5 0 10 43
Reversal – 92 – 97 – 4 0 –204 –397
Unwinding of discount 21 17 8 0 11 57
Reclassifi cation 0 3 –2 0 –1 0
Additions 468 117 92 450 700 1,827
As at 31 December 2011 1,053 931 588 450 1,286 4,308
Deutsche Post DHL Annual Report 2011
Consolidated Financial StatementsNotes
Balance sheet disclosures
195

43.2 Miscellaneous provisions
€ m
2010 2011
Tax provisions 404 384
Litigation costs 121 134
Risks from business activities 135 105
Postal Civil Service Health Insurance Fund 33 31
Assistance payments to civil servants 20 18
Miscellaneous other provisions 652 614
Miscellaneous provisions 1,365 1,286
Of the tax provisions, € 264 million (previous year: € 273 mil-
lion) relates to VAT, € 4 million (previous year: € 17 million) to cus-
toms and duties, and € 116 million (previous year: € 114 million) to
other tax provisions.
Risks from business activities comprise obligations such as
expected loss and warranty obligations. Miscellaneous other provi-
sions include a large number of individual items.
Th e subsidies for the Postal Civil Service Health Insurance
Fund in the amount of € 19 million (previous year: € 21 million) pre-
viously reported as staff -related provisions were disclosed together
with the provision for the Postal Civil Service Health Insurance Fund
in the year under review. Th e prior-period amounts were adjusted.
Th e provision for other employee benefi ts primarily covers
workforce reduction expenses (severance payments, transitional
benefi ts, partial retirement etc.).
Th e restructuring provisions comprise all expenses resulting
from the restructuring measures within the US express business as
well as in other areas of the Group. Th ese measures relate primarily
to termination benefi t obligations to employees (partial retirement
programmes, transitional benefi ts) and expenses from the closure
of terminals, for example.
Technical reserves (insurance) mainly consist of outstand-
ing loss reserves and IBNR reserves; further details can be found
in Note 7.
Th e provision for postage stamps covers outstanding obli-
gations to customers for letter and parcel deliveries from postage
stamps sold but still unused by customers, and is based on studies
by market research companies. It is measured at the nominal value
of the stamps issued.
43.3 Maturity structure
Th e maturity structure of the provisions recognised in fi nan-
cial year 2011 is as follows:
€ m
Less than 1 year
More than 1 year
to 2 years
More than 2 years
to 3 years
More than 3 years
to 4 years
More than 4 years
to 5 yearsMore
than 5 years Total
2011
Other employee benefi ts 274 229 155 104 77 214 1,053
Restructuring provisions 328 109 403 15 12 64 931
Technical reserves (insurance) 190 166 79 49 33 71 588
Postage stamps 450 0 0 0 0 0 450
Miscellaneous provisions 892 159 71 28 18 118 1,286
2,134 663 708 196 140 467 4,308
44 Financial liabilities
€ m Non-current Current Total
2010 2011 2010 2011 2010 2011
Bonds 1,682 963 0 696 1,682 1,659
Due to banks 44 6 315 157 359 163
Finance lease liabilities 183 148 27 27 210 175
Liabilities to Group companies 27 65 110 37 137 102
Liabilities recognised at fair value through profi t or loss 15 11 100 126 115 137
Other fi nancial liabilities 4,324 173 195 4,601 4,519 4,774
Financial liabilities 6,275 1,366 747 5,644 7,022 7,010
Deutsche Post DHL Annual Report 2011196

44.1 Bonds
Th e following table contains further details on the company’s
most signifi cant bonds. Th e bonds issued by Deutsche Post Finance
B. V. are fully guaranteed by Deutsche Post AG.
Major bonds
2010 2011
Nominal coupon Issue volume Issuer
Carrying amount
€ mFair value
€ m
Carrying amount
€ mFair value
€ m
Bond 2002 / 2012 5.125 % € 679 million Deutsche Post Finance b. v. 713 718 696 698
Bond 2003 / 2014 4.875 % € 926 million Deutsche Post Finance b. v. 954 992 948 984
44.2 Amounts due to banks
Th e following table contains the terms and conditions of
signifi cant individual contracts reported under amounts due to
banks. Th e liabilities due to banks mentioned are fully guaranteed
by Deutsche Post AG.
Terms and conditions
Bank Interest rate End of term
Carrying amount 2010
€ m
Carrying amount 2011
€ m
Deutsche Post International b. v., Netherlands European Investment Bank, Luxembourg 4.923 % 12 / 2011 123 0
Deutsche Post International b. v., Netherlands European Investment Bank, Luxembourg3-month
fl oater 06 / 2011 8 0
Deutsche Post International b. v., Netherlands European Investment Bank, Luxembourg 5.81 % 02 / 2011 7 0
Other 221 163
359 163
All liabilities due to the European Investment Bank, Luxem-
bourg, expired in the reporting period. Th e remaining liabilities
of € 163 million mainly comprise current overdraft facilities due to
various banks.
44.3 Finance lease liabilities
Finance lease liabilities mainly relate to the following items:
Leasing partner Interest rate End of term Asset2010
€ m2011
€ m
Deutsche Post Immobilien GmbH, GermanyLorac Investment Management Sarl 6 % 2016 Real estate 11 9
dhl Express (us) Inc., usaWachovia Financial Services; Wells Fargo 6.74 % 2019 / 2022
Sorting system software 36 36
scm Supply Chain Management Inc., Canada Bank of Nova Scotia variable 2012 / 2013
Warehouse, offi ce equipment 34 22
Deutsche Post ag, Germanyt-Systems International GmbH, Germany 6.5 % 2015 it equipment 15 10
Deutsche Post DHL Annual Report 2011
Consolidated Financial StatementsNotes
Balance sheet disclosures
197

44.5 Other fi nancial liabilities
€ m
2010 2011
Mandatory exchangeable bond (with accrued interest)
Deutsche Post ag 2,796 2,926
Other liabilities related to the planned sale of Deutsche Postbank shares
Deutsche Post ag 1,368 1,418
Loan notes due to Exel’s existing shareholders
Deutsche Post ag 40 0
Miscellaneous fi nancial liabilitiesOther Group
companies 315 430
Other fi nancial liabilities 4,519 4,774
Th e other fi nancial liabilities mainly result from the transac-
tions related to the planned sale of Deutsche Postbank shares. Th e
fi nancial liabilities consist of a mandatory exchangeable bond on
60 million Postbank shares, cash collateral for the acquisition of
another 26 million Postbank shares and payments on settled hedg-
ing transactions entered into to hedge Deutsche Bank shares; see
Note 3.
Th e leased assets are recognised in property, plant and
equipment at carrying amounts of € 327 million (previous year:
€ 374 million). Th e diff erence between the carrying amounts of the
assets and the liabilities results from longer useful lives of the as-
sets compared with a shorter repayment period for the lease instal-
ments and unscheduled repayments of lease obligations. Th e no-
tional amount of the minimum lease payments totals € 198 million
(previous year: € 234 million).
Maturity structure
€ m Present value (fi nance lease liabilities)
Minimum lease payments (notional amount)
2010 2011 2010 2011
Less than 1 year 27 27 33 35
More than 1 year to 5 years 108 70 120 77
More than 5 years 75 78 81 86
Total 210 175 234 198
44.4 Financial liabilities at fair value through profi t or loss
Th e amounts reported under this item relate to the negative
fair values of derivative fi nancial instruments.
€ m
2010 2011
Financial liabilities at fair value through profi t or loss 115 137
45 Other liabilities
€ m Non-current Current Total
2010 2011 2010 2011 2010 2011
Other liabilities 401 347 4,047 4,106 4,448 4,453
Deutsche Post DHL Annual Report 2011198

Th ere is no signifi cant diff erence between the carrying
amounts and the fair values of the other liabilities due to their short
maturities or market interest rates. Th ere is no signifi cant interest
rate risk because most of these instruments bear fl oating rates of
interest at market rates.
46 Trade payables
Trade payables also include liabilities to Group companies in
the amount of € 33 million (previous year: € 35 million).
€ m
2010 2011
Trade payables 5,707 6,168
€ 955 million of the trade payables (previous year: € 844 mil-
lion) is attributable to Deutsche Post AG. Trade payables primar-
ily have a maturity of less than one year. Th e reported carrying
amount of trade payables corresponds to their fair value.
CASH FLOW DISCLOSURES
47 Cash fl ow disclosures
Th e cash fl ow statement is prepared in accordance with IAS 7
(Statement of Cash Flows) and discloses the cash fl ows in order to
present the source and application of cash and cash equivalents.
It distinguishes between cash fl ows from operating, investing and
fi nancing activities. Cash and cash equivalents are composed of
cash, cheques and bank balances with a maturity of not more than
three months, and correspond to the cash and cash equivalents
reported on the balance sheet. Th e eff ects of currency translation
and changes in the consolidated group are adjusted when calculat-
ing cash and cash equivalents.
47.1 Net cash from operating activities
Cash fl ows from operating activities are calculated by adjust-
ing consolidated net profi t / loss for tax expenses, net fi nancial in-
come / net fi nance costs and non-cash factors, as well as taxes paid,
changes in provisions and in other non-current assets and liabil-
ities (net cash from operating activities before changes in working
capital). Adjustments for changes in working capital (excluding
fi nancial liabilities) result in net cash from or used in operating
activities.
45.1 Breakdown of other liabilities
€ m
2010 2011
Tax liabilities 884 954
Incentive bonuses 609 592
Compensated absences 385 401
Deferred income, of which non-current: 76 (previous year: 73) 323 336
Wages, salaries, severance payments 288 292
Payables to employees and members of executive bodies 165 227
Liabilities from the sale of residential building loans, of which non-current: 221 (previous year: 273) 278 223
Social security liabilities 181 152
Debtors with credit balances 116 124
Overtime claims 100 102
cod liabilities 58 76
Other compensated absences 70 63
Accrued rentals 23 27
Liabilities from cheques issued 20 21
Liabilities from loss compensation 15 17
Accrued insurance premiums for damages and similar liabilities 19 16
Insurance liabilities 13 9
Miscellaneous other liabilities, of which non-current: 50 (previous year: 55) 901 821
4,448 4,453
Of the tax liabilities, € 523 million (previous year: € 504 mil-
lion) relates to VAT, € 280 million (previous year: € 252 million) to
customs and duties, and € 151 million (previous year: € 128 million)
to other tax liabilities.
Th e liabilities from the sale of residential building loans relate
to obligations of Deutsche Post AG to pay interest subsidies to bor-
rowers to off set the deterioration in borrowing terms in conjunc-
tion with the assignment of receivables in previous years, as well as
pass-through obligations from repayments of principal and inter-
est for residential building loans sold.
Miscellaneous other liabilities include a large number of
individual items.
45.2 Maturity structure
€ m
2010 2011
Less than 1 year 4,047 4,106
More than 1 year to 2 years 43 38
More than 2 years to 3 years 15 34
More than 3 years to 4 years 13 13
More than 4 years to 5 years 30 11
More than 5 years 300 251
Maturity structure of other liabilities 4,448 4,453
Deutsche Post DHL Annual Report 2011
Consolidated Financial StatementsNotes
Cash fl ow disclosures
199

markedly by € 604 million to € 1,880 million. In particular, sig-
nifi cant investments were made in expanding the infrastructure in
Europe and Asia, the IT systems and the aircraft fl eet. Th e change
in current fi nancial assets contributed a cash infl ow of € 394 million
largely due to the sale of money market funds. Th is is € 843 million
lower than in the previous year, in which the sale of money market
funds led to a cash infl ow of € 1,200 million.
Th e following assets were acquired and liabilities assumed as
a result of company acquisitions; see also Note 2:
€ m
2010 2011
Non-current assets 0 92
Current assets (excluding cash and cash equivalents) 1 79
Provisions 0 22
Other liabilities 0 142
Free cash fl ow is a combination of net cash provided by oper-
ating activities and net cash used in investing activities. In the past,
free cash fl ow was aff ected by signifi cant fl uctuations in fi nancial
assets. Th e calculation was adjusted to increase the informative
value of this indicator for operating purposes, as outlined in the
following table:
Calculation of free cash fl ow
€ m
2010 2011
Net cash from operating activities 1,927 2,371
Sale of property, plant and equipment, and intangible assets 198 211
Acquisition of property, plant and equipment, and intangible assets –1,174 –1,716
Cash outfl ow arising from change in property, plant and equipment, and intangible assets – 976 –1,505
Disposals of subsidiaries and other business units –265 58
Acquisition of subsidiaries and other business units –74 – 84
Cash outfl ow arising from acquisitions / divestitures –339 –26
Interest received 55 72
Interest paid –183 –163
Net interest paid –128 – 91
Free cash fl ow 484 749
Net cash from operating activities before changes in work-
ing capital increased by € 125 million year-on-year to € 2,234 mil-
lion. Th is is largely due to the markedly improved EBIT, which rose
by € 601 million to € 2,436 million. Th e depreciation, amortisation
and impairment losses contained in EBIT are non-cash eff ects and
are therefore adjusted. Th ey decreased from € 1,296 million to
€ 1,274 million. Th e gains on the disposal of non-current assets of
€ 54 million are not attributable to operating activities. Th ey have
therefore been adjusted in the net loss from the disposal of non-
current assets and are presented instead in the cash fl ows from in-
vesting activities. In the previous year, losses from the disposal of
non-current assets of € 279 million were incurred, primarily as a
result of the sale of business units in the UK, France and Austria.
Th e reduction in working capital led to a cash infl ow of € 137 mil-
lion, in particular because receivables and other assets rose by less
than in the previous year. In the comparative period, the rise in
working capital resulted in cash outfl ows of € 182 million. In the
reporting period, net cash from operating activities increased by
€ 444 million from € 1,927 million to € 2,371 million.
Non-cash income and expense
€ m
2010 2011
Expense from remeasurement of assets 103 91
Income from remeasurement of liabilities –145 –108
Income (previous year: expense) from disposal of assets 51 – 8
Staff costs relating to Share Matching Scheme 16 20
Miscellaneous 2 –2
Non-cash income and expense 27 –7
47.2 Net cash used in investing activities
Cash fl ows from investing activities mainly result from cash
received from disposals of non-current assets (divestitures) and
cash paid for investments in non-current assets. Interest and divi-
dends received from investing activities as well as cash fl ows from
changes in current fi nancial assets are also included.
Investing activities resulted in a cash outfl ow of € 1,129 million
in the year under review, compared to a cash infl ow of € 8 million
in the previous year. Divestitures of non-current assets, especially
property, plant and equipment, and intangible assets, led to a cash
infl ow of € 285 million. In the previous year, the sale of business
units outlined previously was the main contributing factor to
cash outfl ows in this area. Investments in non-current assets rose
Deutsche Post DHL Annual Report 2011200

OTHER DISCLOSURES
48 Risks and fi nancial instruments of the Group
48.1 Risk management
As a result of its operating activities, the Group is exposed to
fi nancial risks that may arise from changes in exchange rates, com-
modity prices and interest rates. Th e Group manages these risks
centrally through the use of non-derivative and derivative fi nan-
cial instruments. Derivatives are used exclusively to mitigate non-
derivative fi nancial risks, and fl uctuations in their fair value may
not be assessed separately from the underlying transaction.
Th e Group’s internal risk guidelines govern the universe of
actions, responsibilities and controls regarding the use of deriva-
tives. Financial transactions are recorded, assessed and processed
using proven risk management soft ware, which regularly docu-
ments the eff ectiveness of hedging relationships. To limit coun-
terparty risk from fi nan cial transactions, the Group only enters
into transactions with prime-rated banks. Each counterparty is
assigned a counterparty limit, the utilisation of which is regu-
larly monitored. Th e Group’s Board of Management is informed
internally at regular intervals about existing fi nancial risks and the
hedging instruments deployed to mitigate them. Financial instru-
ments are accounted for in accordance with IAS 39.
Liquidity management
Th e ultimate objective of central liquidity management is to
secure the solvency of Deutsche Post DHL and its Group com-
panies at all times. To achieve this objective, liquidity in the Group
is centralised as much as possible in cash pools and managed in the
Corporate Center.
Th e centrally available liquidity reserves (funding avail-
ability), consisting of central short-term fi nancial investments and
committed credit lines, are the key control parameter. Th e target is
to have at least € 2 billion available in central credit lines.
Th e Group had central liquidity reserves of € 3.8 billion (pre-
vious year: € 4.6 billion) at the reporting date, consisting of central
fi nancial investments amounting to € 1.8 billion plus a syndicated
credit line of € 2 billion.
Free cash fl ow is considered to be an indicator of how much
cash is available to the company for dividend payments or the
repayment of debt. Although the cash outfl ow arising from the
change in property, plant and equipment, and intangible assets
rose considerably, a reduced cash outfl ow arising from acquisitions
or divestitures, and in particular a much improved EBIT, led to a
noticeable increase in free cash fl ow from € 484 million in the pre-
vious year to € 749 in the year under review.
47.3 Net cash used in fi nancing activities
Net cash used in fi nancing activities of € 1,547 million was
€ 104 million lower than in the previous year. Once again, the divi-
dend payment to the shareholders of Deutsche Post AG, which rose
by € 61 million to € 786 million, was the largest payment in this area.
In contrast, repayments of non-current liabilities were lower and
declined from € 597 million to € 338 million in the reporting period.
Th e previous year was particularly aff ected by the repayment of a
municipal bond in the amount of € 178 million in the United States.
Also in the previous year, the acquisition of the remaining shares in
the air cargo company Astar Air Cargo led to payments for trans-
actions with non-controlling interests that were not matched by
equivalent payments in the year under review. Interest paid was
reduced by € 20 million to € 163 million.
47.4 Cash and cash equivalents
Th e cash infl ows and outfl ows described above produced
cash and cash equivalents of € 3,123 million; see Note 35. Th is rep-
resents a year-on-year reduction of € 292 million. Currency trans-
lation diff erences of € 13 million had an off setting eff ect.
Deutsche Post DHL Annual Report 2011
Consolidated Financial StatementsNotes
Other disclosures
201

Th e maturity structure of primary fi nancial liabilities within
the scope of IFRS 7 based on cash fl ows is as follows:
Maturity structure: remaining maturities
€ m
Less than 1 year
More than 1 year
to 2 years
More than 2 years
to 3 years
More than 3 years
to 4 years
More than 4 years
to 5 yearsMore
than 5 years
As at 31 December 2011
Non-current fi nancial liabilities 71 184 995 21 34 198
Other liabilities 0 4 4 3 3 207
Non-current liabilities 71 188 999 24 37 405
Current fi nancial liabilities 5,582 0 0 0 0 0
Trade payables 6,168 0 0 0 0 0
Other liabilities 317 0 0 0 0 0
Current liabilities 12,067 0 0 0 0 0
As at 31 December 2010
Non-current fi nancial liabilities 80 5,285 130 1,000 29 115
Other liabilities 0 6 5 5 4 256
Non-current liabilities 80 5,291 135 1,005 33 371
Current fi nancial liabilities 747 0 0 0 0 0
Trade payables 5,707 0 0 0 0 0
Other liabilities 266 0 0 0 0 0
Current liabilities 6,720 0 0 0 0 0
Th e mandatory exchangeable bond (zero bond) of € 2,568 mil-
lion plus interest that was issued in February 2009 and fully sub-
scribed by Deutsche Bank was reclassifi ed to current fi nancial liabil-
ities in February 2011; see Note 3. Its settlement in February 2012
will not result in any cash fl ows. Deutsche Post AG is required to
transfer 60 million shares of Deutsche Postbank AG to Deutsche
Bank AG to settle the liability. In addition to the mandatory ex-
changeable bond, the cash collateral of € 1,161 million plus interest
issued by Deutsche Bank AG in February 2009 as an advance paid
on the written put option on 26,417,432 Postbank shares was also
reclassifi ed to current fi nancial liabilities in the fi rst quarter of 2011.
Th e put option can be exercised by Deutsche Post AG for the fi rst
time on 28 February 2012. A further current fi nancial liability of
€ 120 million relates to the transactions settled to hedge Deutsche
Bank shares during the sale of the fi rst 50 million Postbank shares
in 2009; see Note 3. Th ere is collateral in the same amount.
Deutsche Post DHL Annual Report 2011202

Th e maturity structure of the derivative fi nancial instruments
based on cash fl ows is as follows:
Maturity structure: remaining maturities
€ m
Less than 1 year
More than 1 year
to 2 years
More than 2 years
to 3 years
More than 3 years
to 4 years
More than 4 years
to 5 yearsMore
than 5 years
As at 31 December 2011
Derivative receivables – gross settlement
Cash outfl ows –1,240 – 9 –2 0 0 0
Cash infl ows 1,311 16 14 0 0 0
Net settlement
Cash infl ows 10 0 0 0 0 0
Derivative liabilities – gross settlement
Cash outfl ows –1,729 –15 –161 0 0 0
Cash infl ows 1,642 9 165 0 0 0
Net settlement
Cash outfl ows – 4 –2 0 0 0 0
As at 31 December 2010
Derivative receivables – gross settlement
Cash outfl ows –1,303 –119 –11 – 6 0 0
Cash infl ows 1,361 151 16 14 0 0
Net settlement
Cash infl ows 9 0 0 0 0 0
Derivative liabilities – gross settlement
Cash outfl ows –2,930 – 46 –12 –154 0 0
Cash infl ows 2,822 34 8 165 0 0
Net settlement
Cash outfl ows – 6 0 0 0 0 0
Derivative fi nancial instruments entail both rights and obli-
gations. Th e contractual arrangement defi nes whether these rights
and obligations can be off set against each other and therefore
result in a net settlement, or whether both parties to the contract
will have to perform their obligations in full (gross settlement).
No cash fl ows were reported in the maturity bands for “More than
3 years to 4 years”, “More than 4 years to 5 years” and “More than
5 years” as at 31 December 2011, because all existing derivatives
will mature by 2014.
Th e derivatives on shares of Deutsche Postbank AG entered
into with Deutsche Bank AG are not included in the overview as
they do not result in cash fl ows.
Deutsche Post DHL Annual Report 2011
Consolidated Financial StatementsNotes
Other disclosures
203

In total, currency forwards and currency swaps with a
notion al amount of € 3,317 million (previous year: € 4,603 million)
were outstanding at the balance sheet date. Th e corresponding fair
value was €–27 million (previous year: €–65 million). Th ere were
no currency options at the end of 2011 (previous year: € 0 mil-
lion). Th e Group also held cross-currency swaps with a notional
amount of € 173 million (previous year: € 211 million) and a fair
value of €–6 million (previous year €–14 million) to hedge long-
term foreign currency fi nancing.
Currency risks resulting from translating assets and liabilities
of foreign operations into the Group’s currency (translation risk)
were not hedged as at 31 December 2011.
Of the unrealised gains or losses from currency derivatives
recognised in equity as at 31 December 2011 in accordance with
IAS 39, €–22 million (previous year: €–19 million) is expected to be
recognised in income in the course of 2012.
IFRS 7 requires the disclosure of quantitative risk data, show-
ing how profi t or loss and equity are aff ected by changes in exchange
rates at the reporting date. Th e impact of these changes in exchange
rates on the portfolio of foreign currency fi nancial instruments is
assessed by means of a value at risk calculation (95 % confi dence /
one-month holding period). It is assumed that the portfolio as at
the reporting date is representative for the full year.
Eff ects of hypothetical changes in exchange rates on trans-
lation risk do not fall within the scope of IFRS 7. Th e following as-
sumptions are used as a basis for the sensitivity analysis:
Primary fi nancial instruments in foreign currencies used by
Group companies were hedged by Deutsche Post AG’s in-house
bank, with Deutsche Post AG setting and guaranteeing monthly
exchange rates. Exchange rate-related changes therefore have no
eff ect on the profi t or loss and equity of the Group companies.
Where, in individual cases, Group companies are not permitted to
participate in in-house banking for legal reasons, their currency
risks from primary fi nancial instruments are fully hedged locally
through the use of derivatives. Th ey therefore have no impact on
the Group’s risk position.
currency risk and currency managementTh e international business activities of Deutsche Post DHL
expose it to currency risks that are split internally for risk manage-
ment purposes into balance sheet risks and currency risks from
planned future transactions.
Balance sheet currency risks arise from the measurement and
settlement of items in foreign currencies that have been recognised
if the exchange rate on the measurement or settlement date diff ers
from the rate on recognition. Th e resulting foreign exchange dif-
ferences directly impact profi t or loss. In order to mitigate this im-
pact as far as possible, all signifi cant balance sheet currency risks
within the Group are centralised at Deutsche Post AG through the
in-house bank function. Th e centralised risks are aggregated by
Corporate Treasury to calculate a net position per currency and
hedged externally based on value at risk limits. Th e currency-
related value at risk (95 % / one-month holding period) for the port-
folio concerned totalled € 4 million (previous year: € 3 million) at
the reporting date; the limit was a maximum of € 5 million.
Th e notional amount of the currency forwards and currency
swaps used to manage balance sheet currency risks amounted to
€ 2,030 million at the reporting date (previous year: € 3,383 mil-
lion); the fair value was €–4 million (previous year: €–45 million).
For simplifi cation purposes, fair value hedge accounting was not
applied to the derivatives used, which are reported as trading
derivatives instead.
Planned currency risks arise from the settlement of future
foreign currency transactions at exchange rates that may diff er
from the rates originally planned or calculated. Th ese currency
risks are also captured and managed centrally in Corporate Treas-
ury. Th e goal is to hedge 50 % to 80 % of the net risk per foreign cur-
rency and thereby to hedge the originally planned exchange rates.
At the reporting date, around 47 % of the foreign currency risk for
current transactions in 2012 was hedged. Th e relevant hedging
transactions are recognised using cash fl ow hedge accounting; see
Note 48.3 (Cash fl ow hedges).
Deutsche Post DHL Annual Report 2011204

Th e quantitative risk data relating to interest rate risk re-
quired by IFRS 7 is presented in the form of a sensitivity analysis.
Th is method determines the eff ects of hypothetical changes in mar-
ket interest rates on interest income, interest expense and equity as
at the reporting date. Th e following assumptions are used as a basis
for the sensitivity analysis:
Primary variable-rate fi nancial instruments are subject to
interest rate risk and must therefore be included in the sensitiv-
ity analysis. Primary variable-rate fi nancial instruments that were
transformed into fi xed-income fi nancial instruments using cash
fl ow hedges are not included. Changes in market interest rates for
derivative fi nancial instruments used as a cash fl ow hedge aff ect
equity by changing fair values and must therefore be included in
the sensitivity analysis. Fixed-income fi nancial instruments meas-
ured at amortised cost are not subject to interest rate risk.
Designated fair value hedges of interest rate risk are not in-
cluded in the analysis because the interest-related changes in fair
value of the hedged item and the hedging transaction almost fully
off set each other in profi t or loss for the period. Only the variable
portion of the hedging instrument aff ects net fi nan cial income / net
fi nance costs and must be included in the sensitivity analysis.
If the market interest rate level as at 31 December 2011
had been 100 basis points higher, net fi nance costs would have
increased by € 8 million (previous year: increased by € 4 mil-
lion). A market interest rate level 100 basis points lower would
have had the opposite eff ect. A change in the market interest rate
level by 100 basis points would aff ect the fair values of the inter-
est rate derivatives recognised in equity. A rise in interest rates in
this fi nancial year would not have increased equity (previous year:
€ 0 million), nor would a reduction have reduced equity (previous
year: € 0 million).
Hypothetical changes in exchange rates have an eff ect on
the fair values of Deutsche Post AG’s external derivatives that is
reported in profi t or loss; they also aff ect the foreign currency
gains and losses from remeasurement at the closing date of the
in-house bank balances, balances from external bank accounts as
well as internal and external loans extended by Deutsche Post AG.
Th e foreign currency value at risk of the foreign currency items
concerned was € 4 million at the reporting date (previous year:
€ 3 million). In addition, hypothetical changes in exchange rates
aff ect equity and the fair values of those derivatives used to hedge
unrecognised fi rm commitments and highly probable forecast cur-
rency transactions, which are designated as cash fl ow hedges. Th e
foreign currency value at risk of this risk position was € 21 million
at 31 December 2011 (previous year: € 25 million). Th e total foreign
currency value at risk was € 23 million at the reporting date (previ-
ous year: € 24 million). Th e total amount is lower than the sum of
the individual amounts given above, owing to interdependencies.
interest rate risk and interest rate managementTh e fair value of interest rate hedging instruments was calcu-
lated on the basis of discounted expected future cash fl ows using
Corporate Treasury’s risk management system.
As at 31 December 2011, the Group had entered into inter-
est rate swaps with a notional volume of € 1,005 million (previous
year: € 1,005 million). Th e fair value of this interest rate swap pos-
ition was € 48 million (previous year: € 71 million). As in the previ-
ous year, there were no interest rate options at the reporting date.
Th e share of instruments with short-term interest lock-ins
did not change signifi cantly during the course of 2011. Financial
liabilities with short-term interest lock-ins currently represent 55 %
of total fi nancial liabilities. Th e eff ect of interest rate changes on
the Group’s fi nancial position remains insignifi cant. Fixed-income
fi nan cial liabilities in connection with the planned Postbank sale
are not included in this analysis as these liabilities are paid in
Postbank shares and therefore no interest rate risk arises.
Deutsche Post DHL Annual Report 2011
Consolidated Financial StatementsNotes
Other disclosures
205

Th e fair value of the forward was € 1,493 million as at 31 De-
cember 2011 (previous year: € 1,653 million). Th e net fair value of
the options was € 665 million as at 31 December 2011 (previous
year: € 736 million). Changes in the fair value of the forward and
the options are included in net fi nancial income / net fi nance costs
until the instruments are exercised or expire. Had the fair value of
Postbank shares been 10 % lower as at 31 December 2011, the net
fair value of the share price derivatives would have increased by
€ 209 million, generating additional income of € 209 million (pre-
vious year: € 180 million) in net fi nancial income / net fi nance costs.
An increase in the Postbank share price would have had the op-
posite eff ect and would have resulted in a charge to net fi nancial
income / net fi nance costs.
credit riskTh e credit risk incurred by the Group is the risk that counter-
parties fail to meet their obligations arising from operating activi-
ties and from fi nancial transactions. To minimise credit risk from
fi nancial transactions, the Group only enters into transactions with
prime-rated counterparties. Th e Group’s heterogeneous customer
structure means that there is no risk concentration. Each coun-
terparty is assigned an individual limit, the utilisation of which is
regularly monitored. A test is performed at the balance sheet dates
to establish whether an impairment loss needs to be charged on
the positive fair values due to the individual counterparties’ credit
quality. Th is was not the case for any of the counterparties as at
31 December 2011.
Default risks are continuously monitored in the operating
business. Th e aggregate carrying amounts of fi nancial assets rep-
resent the maximum default risk. Trade receivables amounting to
€ 6,426 million (previous year: € 6,011 million) are due within one
year. Th e following table gives an overview of receivables that are
past due:
market riskAs in the previous year, most of the risks arising from com-
modity price fl uctuations, in particular fl uctuating prices for kero-
sene and marine diesel fuels, were passed on to customers via oper-
ating measures. However, the impact of the related fuel surcharges
is delayed by one to two months, so that earnings may be aff ected
temporarily if there are signifi cant short-term fuel price variations.
In addition, a small number of commodity swaps for diesel
and marine diesel fuel were used to control residual risks. Th e
notional amount of these commodity swaps was € 6 million (previ-
ous year: € 42 million) with a fair value of € 1 million (previous year:
€ 5 million).
IFRS 7 requires the disclosure of a sensitivity analysis, present-
ing the eff ects of hypothetical commodity price changes on profi t
or loss and equity. Changes in commodity prices would aff ect the
fair value of the derivatives used to hedge highly probable forecast
commodity purchases (cash fl ow hedges) and the hedging reserve
in equity. Since all commodity price derivatives are accounted for
as cash fl ow hedges, changes to the commodity prices would aff ect
equity, but not profi t or loss.
A 10 % increase in the commodity prices underlying the
derivatives as at the balance sheet date would have increased fair
values and hence equity by € 0 million (previous year: € 5 million).
A corresponding decline in commodity prices would also have had
no eff ect.
Balance sheet risks associated with changes in share prices
arise for the Group from the derivative fi nancial instruments
on the Deutsche Postbank AG shares held by Deutsche Post AG
entered into under the Amendment Agreement Regarding the
Acquisition of Shares in Deutsche Postbank AG. In addition to a
forward on 60 million Deutsche Postbank shares, put and call op-
tions on 26,417,432 shares were agreed. Th e contractual partner in
both cases is Deutsche Bank AG.
€ m Past due at reporting date and not impaired
Carrying amount before
impairment loss
Neither impaired nor due as at the
reporting dateLess than
30 days31 to
60 days61 to
90 days91 to
120 days121 to
150 days151 to
180 days >180 days
As at 31 December 2011
Trade receivables 6,655 4,509 746 680 261 114 50 38 28
As at 31 December 2010
Trade receivables 6,242 4,133 900 514 197 97 51 19 34
Deutsche Post DHL Annual Report 2011206

Trade receivables changed as follows:
€ m
2010 2011
Gross receivables
As at 1 January 5,135 6,242
Changes 1,107 413
As at 31 December 6,242 6,655
Valuation allowances
As at 1 January –254 –231
Changes 23 2
As at 31 December –231 –229
Carrying amount as at 31 December 6,011 6,426
All other fi nancial instruments are neither past due nor
impaired. Th e heterogeneous structure of the counterparties pre-
vents risk concentration. Other assets are expected to be collectible
at any time.
48.2 Collateral
€ 189 million (previous year: € 301 million) of collateral is rec-
ognised in non-current fi nancial assets as at the balance sheet date.
Th is relates primarily to liabilities in conjunction with the settle-
ment of Deutsche Post AG’s residential building loans.
Collateral of € 170 million is recognised in current fi nancial
assets (previous year: € 39 million). Th e majority of this concerns
collateral relating to the sale of the Deutsche Postbank AG shares
still held by Deutsche Post. Deutsche Post AG is required to deposit
payments from hedging transactions already settled as part of the
sale of Deutsche Bank shares as collateral with Deutsche Bank AG.
Th e collateral deposited is released when the mandatory exchange-
able bond is exercised in February 2012. Other short-term collat-
eral relates to the QTE leases.
In addition, Deutsche Post AG pledged 86,417,432 shares of
Deutsche Postbank AG to Deutsche Bank AG. Th e collateral for
60 million shares will be released when the mandatory exchange-
able bond is exercised in February 2012; it will be released for the
remaining 26,417,432 shares when one of the options is exercised
(see market risk).
Deutsche Post DHL Annual Report 2011
Consolidated Financial StatementsNotes
Other disclosures
207

48.3 Derivative fi nancial instruments
Th e following table gives an overview of the recognised de-
rivative fi nancial instruments used in the Group and their fair
values. Derivatives with amortising notional volumes are reported
in the full amount at maturity.
Derivative fi nancial instruments
€ m
2010 2011
Fair values 2011 by maturity
Assets Liabilities
No-tional
amountFair
value
No-tional
amount
Fair value
of assets
Fair value
of liabil-ities
Total fair
value
Less than
1 year
Up to 2
years
Up to 3
years
Up to 4
years
Up to 5
years> 5
years
Less than
1 year
Up to 2
years
Up to 3
years
Up to 4
years
Up to 5
years> 5
years
Interest rate products
Interest rate swaps 1,005 71 1,005 48 0 48 22 0 26 0 0 0 0 0 0 0 0 0
of which cash fl ow hedges 163 18 163 16 0 16 0 0 16 0 0 0 0 0 0 0 0 0
of which fair value hedges 842 53 842 32 0 32 22 0 10 0 0 0 0 0 0 0 0 0
of which held for trading 0 0 0 0 0 0 0 0 0 0 0 0 0 0 0 0 0 0
Other 0 0 0 0 0 0 0 0 0 0 0 0 0 0 0 0 0 0
1,005 71 1,005 48 0 48 22 0 26 0 0 0 0 0 0 0 0 0
Currency transactions
Currency forwards 2,280 –33 1,483 20 – 44 –24 20 0 0 0 0 0 – 43 –1 0 0 0 0
of which cash fl ow hedges 1,052 –20 1,045 15 –37 –22 15 0 0 0 0 0 –36 –1 0 0 0 0
of which net investment hedges 0 0 0 0 0 0 0 0 0 0 0 0 0 0 0 0 0 0
of which held for trading 1,228 –13 438 5 –7 –2 5 0 0 0 0 0 –7 0 0 0 0 0
Currency options 0 0 0 0 0 0 0 0 0 0 0 0 0 0 0 0 0 0
of which cash fl ow hedges 0 0 0 0 0 0 0 0 0 0 0 0 0 0 0 0 0 0
Currency swaps 2,323 –32 1,834 33 –36 –3 33 0 0 0 0 0 –36 0 0 0 0 0
of which cash fl ow hedges 168 0 242 5 – 6 –1 5 0 0 0 0 0 – 6 0 0 0 0 0
of which held for trading 2,155 –32 1,592 28 –30 –2 28 0 0 0 0 0 –30 0 0 0 0 0
Cross-currency swaps 211 –14 173 0 – 6 – 6 0 0 0 0 0 0 –2 0 – 4 0 0 0
of which cash fl ow hedges 173 – 6 163 0 – 4 – 4 0 0 0 0 0 0 0 0 – 4 0 0 0
of which fair value hedges 38 –8 10 0 –2 –2 0 0 0 0 0 0 –2 0 0 0 0 0
of which held for trading 0 0 0 0 0 0 0 0 0 0 0 0 0 0 0 0 0 0
4,814 –79 3,490 53 – 86 –33 53 0 0 0 0 0 – 81 –1 – 4 0 0 0
Commodity price transactions
Commodity price swaps 42 5 6 1 0 1 1 0 0 0 0 0 0 0 0 0 0 0
of which cash fl ow hedges 42 5 6 1 0 1 1 0 0 0 0 0 0 0 0 0 0 0
Equity price transactions
Equity forwards 2,946 1,653 2,946 1,493 0 1,493 1,493 0 0 0 0 0 0 0 0 0 0 0
of which held for trading 2,946 1,653 2,946 1,493 0 1,493 1,493 0 0 0 0 0 0 0 0 0 0 0
Equity options 2,596 736 2,596 665 0 665 665 0 0 0 0 0 0 0 0 0 0 0
of which held for trading 2,596 736 2,596 665 0 665 665 0 0 0 0 0 0 0 0 0 0 0
5,542 2,389 5,542 2,158 0 2,158 2,158 0 0 0 0 0 0 0 0 0 0 0
Deutsche Post DHL Annual Report 2011208

cash flow hedgesTh e Group uses currency forwards and swaps to hedge the
cash fl ow risks from future foreign currency operating revenue
and expenses. Th e fair values of currency forwards and swaps
amounted to €–26 million at the reporting date (previous year:
€–15 million). Th e hedged items will aff ect cash fl ow for the most
part in 2012.
Currency forwards with a fair value of €–3 million (previ-
ous year: €–10 million) as at the reporting date were entered into
to hedge the currency risk of future lease payments and annuities
denominated in foreign currencies. Th e payments for the hedged
items are made in instalments, with the fi nal payment due in 2013.
Th e Group is exposed to cash fl ow risks from contracted
aircraft purchases in connection with future payments in US dol-
lars. Th ese risks were hedged using forward transactions and cur-
rency swaps. Th e fair value of these cash fl ow hedges amounted to
€ 6 million as at 31 December 2011 (previous year: € 5 million). Th e
aircraft will be added in 2012. Gains or losses on hedges are off set
against cost and recognised in profi t or loss upon the amortisation
of the asset.
Risks arising from fi xed-interest foreign currency invest-
ments were hedged using synthetic cross-currency swaps, with
the investments being transformed into fi xed-interest euro in-
vestments. Th ese synthetic cross-currency swaps hedge the cur-
rency risk, and their fair values at the reporting date amounted to
€ 12 million (previous year: € 15 million).
Th e risks from the purchase of diesel and marine diesel fuels,
which cannot be passed on to customers, were hedged using com-
modity swaps that fall due in 2012. Th e fair value of these cash
fl ow hedges amounted to € 1 million as at year-end (previous year:
€ 5 million). Th ere was minor hedge ineff ectiveness.
Th e forward and the put and call options on the shares of
Deutsche Postbank AG are recognised in the equity price trans-
actions item.
fair value hedgesInterest rate swaps were used to hedge the fair value risk
of fi xed-interest euro-denominated liabilities. Th e fair values of
these interest rate swaps amount to € 32 million (previous year:
€ 53 million). As at 31 December 2011, there was also a € 13 million
(previous year: € 19 million) adjustment to the carrying amount
of the underlying hedged item arising from an interest rate swap
unwound in the past. Th e adjustment to the carrying amount is
amortised over the remaining term of the liability using the eff ec-
tive interest method, and reduces future interest expense.
In addition, cross-currency swaps were used to hedge liabil-
ities in foreign currency against negative changes in the market,
with the liability being transformed into a variable-interest euro-
denominated liability. Th is hedged the fair value risk of the interest
and currency component. Th e fair value of this interest rate swap
position was €–2 million as at 31 December 2011 (previous year:
€ –8 million).
Th e following table gives an overview of the gains and
losses arising from the hedged items and the respective hedging
transactions:
Ineffective portion of fair value hedges
€ m
2010 2011
Losses (–) / gains (+) on hedged items –1 19
Losses (–) / gains (+) on hedging transactions 3 –21
Balance (ineffective portion) 2 –2
Deutsche Post DHL Annual Report 2011
Consolidated Financial StatementsNotes
Other disclosures
209

48.4 Additional disclosures on the fi nancial instruments
used in the Group
Th e Group classifi es fi nancial instruments equivalent to the
respective balance sheet items. Th e following table reconciles the
classes to the categories given in IAS 39 and the respective fair
values:
Reconciliation of carrying amounts in the balance sheet as at 31 December 2011
€ m
Carrying amount Carrying amount by measurement category in accordance with IAS 39
Financial assets and liabilities at fair value through profi t or loss Available-for-sale fi nancial assets
Trading Fair value option
assets
Non-current fi nancial assets 729
at cost 566 0 0 103
at fair value 163 0 68 69
Other non-current assets 570
outside ifrs 7 570 0 0 0
Receivables and other current assets 9,089
at cost 7,685 0 0 0
outside ifrs 7 1,404 0 0 0
Current fi nancial assets 2,498
at cost 256 0 0 0
at fair value 2,242 2,191 0 8
outside ifrs 7 0 0 0 0
Cash and cash equivalents 3,123 0 0 0
Total assets 16,009 2,191 68 180
equity and liabilities
Non-current fi nancial liabilities 1 –1,366
at cost –1,355 0 0 0
at fair value –11 – 6 0 0
outside ifrs 7 0 0 0 0
Other non-current liabilities –347
at cost –221 0 0 0
outside ifrs 7 –126 0 0 0
Current fi nancial liabilities – 5,644
at cost – 5,518 0 0 0
at fair value –126 – 82 0 0
Trade payables – 6,168 0 0 0
Other current liabilities – 4,106
at cost –317 0 0 0
outside ifrs 7 –3,789 0 0 0
Total equity and liabilities –17,631 – 88 0 01 Some of the bonds included in fi nancial liabilities were designated as a hedged item in a fair value hedge and are thus subject to a basis adjustment.
They are therefore recognised neither at full fair value nor at amortised cost.
Deutsche Post DHL Annual Report 2011210

Other fi nancial instruments outside the scope of IAS 39
Fair value of fi nancial instruments under IFRS 7
Loans and receivables / other fi nancial liabilities Held-to-maturity assets
Derivatives designated as hedging instruments
Lease receivables / fi nance lease liabilities
428 0 0 35 566
0 0 26 0 163
0 0 0 0 0
7,685 0 0 0 7,685
0 0 0 0 0
215 0 0 41 256
0 0 43 0 2,242
0 0 0 0 0
3,123 0 0 0 3,123
11,451 0 69 76 –
–1,207 0 0 –148 –1,355
0 0 – 5 0 –11
0 0 0 0 0
–221 0 0 0 –221
0 0 0 0 0
– 5,491 0 0 –27 – 5,518
0 0 – 44 0 –126
– 6,168 0 0 0 – 6,168
–317 0 0 0 –317
0 0 0 0 0
–13,404 0 – 49 –175 –
Deutsche Post DHL Annual Report 2011
Consolidated Financial StatementsNotes
Other disclosures
211

Reconciliation of carrying amounts in the balance sheet as at 31 December 2010
€ m
Carrying amount Carrying amount by measurement category in accordance with IAS 39
Financial assets and liabilities at fair value through profi t or loss Available-for-sale fi nancial assets
Trading Fair value option
assets
Non-current fi nancial assets 3,193
at cost 588 0 0 68
at fair value 2,605 2,390 66 74
Other non-current assets 465
outside ifrs 7 465 0 0 0
Receivables and other current assets 8,641
at cost 7,305 0 0 0
outside ifrs 7 1,336 0 0 0
Current fi nancial assets 655
at cost 210 0 0 13
at fair value 445 21 0 407
outside ifrs 7 0 0 0 0
Cash and cash equivalents 3,415 0 0 0
Total assets 16,369 2,411 66 562
equity and liabilities
Non-current fi nancial liabilities 1 – 6,275
at cost – 6,260 0 0 0
at fair value –15 –1 0 0
outside ifrs 7 0 0 0 0
Other non-current liabilities – 401
at cost –273 0 0 0
outside ifrs 7 –128 0 0 0
Current fi nancial liabilities –747
at cost – 610 0 0 0
at fair value –137 –137 0 0
Trade payables – 5,707 0 0 0
Other current liabilities – 4,047
at cost –245 0 0 0
outside ifrs 7 –3,802 0 0 0
Total equity and liabilities –17,177 –138 0 01 Some of the bonds included in fi nancial liabilities were designated as a hedged item in a fair value hedge and are thus subject to a basis adjustment.
They are therefore recognised neither at full fair value nor at amortised cost.
No assets were reclassifi ed in fi nancial years 2011 and 2010.
Deutsche Post DHL Annual Report 2011212

Other fi nancial instruments outside the scope of IAS 39
Fair value of fi nancial instruments under IFRS 7
Loans and receivables / other fi nancial liabilities Held-to-maturity assets
Derivatives designated as hedging instruments
Lease receivables / fi nance lease liabilities
468 5 0 47 588
0 0 75 0 2,605
0 0 0 0 0
7,305 0 0 0 7,305
0 0 0 0 0
150 0 0 47 210
0 0 17 0 445
0 0 0 0 0
3,415 0 0 0 3,415
11,338 5 92 94 –
– 6,077 0 0 –183 – 6,510
0 0 –14 0 –15
0 0 0 0 0
–273 0 0 0 –277
0 0 0 0 0
– 583 0 0 –27 – 610
0 0 0 0 –137
– 5,707 0 0 0 – 5,707
–245 0 0 0 –245
0 0 0 0 0
–12,885 0 –14 –210 –
Deutsche Post DHL Annual Report 2011
Consolidated Financial StatementsNotes
Other disclosures
213

Th e following table presents the methods used to determine
the fair value for each class:
Financial assets and liabilities: 2011
€ m
1 2 3Level
ClassQuoted
market prices
Measurement using key
inputs based on observable
market data
Measurement using key inputs
not based on observable
market data
Non-current fi nancial assets at fair value 137 26 0
Current fi nancial assets at fair value 8 2,234 0
Non-current fi nancial liabilities at fair value 0 – 5 – 6
Current fi nancial liabilities at fair value 0 – 82 – 44
Th e fair value of currency forwards was measured on the basis
of discounted expected future cash fl ows, taking forward rates on
the foreign exchange market into account. Th e currency options
were measured using the Black-Scholes option pricing model.
Level 2 includes commodity, interest rate and currency deriva-
tives, and the forward and options entered into in the context of the
planned sale of the Deutsche Postbank AG shares.
Level 3 mainly comprises options entered into in connection
with intercompany transactions. Th ese options are measured using
recognised valuation models, taking plausible assumptions into
account; measurement depends largely on fi nancial ratios. Losses
of € 13 million from the change in fair value impacted net fi nancial
income / net fi nance costs in 2011; see Note 18.
Financial assets and liabilities: 2010
€ m
1 2 3Level
ClassQuoted
market prices
Measurement using key
inputs based on observable
market data
Measurement using key inputs
not based on observable
market data
Non-current fi nancial assets at fair value 140 2,465 0
Current fi nancial assets at fair value 407 38 0
Non-current fi nancial liabilities at fair value 0 –15 0
Current fi nancial liabilities at fair value 0 –100 –37
If there is an active market for a fi nancial instrument (e.g.,
stock exchange), the fair value is determined by reference to the
market or quoted exchange price at the balance sheet date. If no fair
value is available in an active market, the quoted prices in an active
market for similar instruments or recognised valuation techniques
are used to determine the fair value. Th e valuation techniques
used incorporate the key factors determining the fair value of the
fi nancial instruments using valuation parameters that are derived
from the market conditions as at the balance sheet date. Counter-
party risk is analysed on the basis of the current credit default
swaps signed by the counterparties. Th e fair values of other non-
current receivables and held-to-maturity fi nancial investments
with remaining maturities of more than one year correspond to
the present values of the payments related to the assets, taking into
account current interest rate parameters.
Cash and cash equivalents, trade receivables and other receiv-
ables have predominantly short remaining maturities. As a result,
their carrying amounts as at the reporting date are approximately
equivalent to their fair values. Trade payables and other liabilities
generally have short remaining maturities; the recognised amounts
approximately represent their fair values.
Available-for-sale fi nancial assets include shares in partner-
ships and corporations in the amount of € 103 million (previous
year: € 81 million). Th ere is no active market for these instruments.
As no future cash fl ows can be reliably determined, the fair values
cannot be determined using valuation techniques. Th e shares of
these entities are recognised at cost. Th ere are no plans to sell or
derecognise signifi cant shares of the available-for-sale fi nancial as-
sets recognised as at 31 December 2011 in the near future. As in the
previous year, no signifi cant shares measured at cost were sold in
the fi nancial year. Available-for-sale fi nancial assets measured at
fair value relate to equity and debt instruments.
Financial assets at fair value through profi t or loss include
securities to which the fair value option was applied, in order to
avoid accounting inconsistencies. Th ere is an active market for
these assets, which are recognised at fair value.
Deutsche Post DHL Annual Report 2011214

50 Other fi nancial obligations
In addition to provisions, liabilities and contingent liabilities,
there are other fi nancial obligations amounting to € 6,625 million
(previous year: € 7,091 million) from non-cancellable operating
leases as defi ned by IAS 17.
Th e Group’s future non-cancellable payment obligations un-
der leases are attributable to the following asset classes:
Lease obligations
€ m
2010 2011
Land and buildings 5,554 5,294
Aircraft 951 765
Transport equipment 439 443
Technical equipment and machinery 115 80
Other equipment, operating and offi ce equipment 20 31
it equipment 12 12
Lease obligations 7,091 6,625
Th e decrease in lease obligations by € 466 million to € 6,625 mil-
lion is a consequence of the reduction in the remaining terms of leg-
acy agreements, especially for real estate and aircraft , which are not
matched by the same volume of new leases.
Maturity structure of minimum lease payments
€ m
2010 2011
Less than 1 year 1,433 1,479
More than 1 year to 2 years 1,199 1,100
More than 2 years to 3 years 914 867
More than 3 years to 4 years 731 668
More than 4 years to 5 years 557 526
More than 5 years 2,257 1,985
Maturity structure of minimum lease payments 7,091 6,625
Th e present value of discounted minimum lease payments is
€ 5,003 million (previous year: € 5,311 million), based on a discount
factor of 6.50 % (previous year: 6.50 %). Overall, rental and lease
payments amounted to € 2,364 million (previous year: € 2,330 mil-
lion), of which € 1,640 million (previous year: € 1,693 million)
relates to non-cancellable leases. € 2,526 million (previous year:
€ 2,745 million) of future lease obligations from non-cancellable
leases is primarily attributable to Deutsche Post Immobilien
GmbH.
Th e purchase obligation for investments in non-current
assets amounted to € 90 million (previous year: € 194 million).
Th e net gains and losses on fi nancial instruments classifi ed in
accordance with the individual measurement categories in IAS 39
are as follows:
Net gains and losses by measurement category
€ m
2010 2011
Loans and receivables –75 – 94
Held-to-maturity fi nancial assets 0 0
Financial assets and liabilities at fair value through profi t or loss
Trading 1,757 231
Fair value option 7 –1
Other fi nancial liabilities – 84 1
Th e net gains and losses mainly include the eff ects of the fair
value measurement, impairment and disposals (disposal gains /
losses) of fi nancial instruments. In fi nancial year 2011, the meas-
urement of the forward and the options entered into to transfer
the remaining Postbank shares had a material eff ect on net gains
and losses. Th e derivatives had a much stronger eff ect in 2010 as
the eff ect on net gains and losses of the forward on 60 million
Postbank shares had to be fully recognised for the fi rst time due to
the amendment to IAS 39.2g. Dividends and interest are not taken
into account for the fi nancial instruments measured at fair value
through profi t or loss. Disclosures on net gains or losses on avail-
able-for-sale fi nancial assets can be found in Note 38. Income and
expenses from interest and commission agreements of the fi nan-
cial instruments not measured at fair value through profi t or loss
are explained in the income statement disclosures.
49 Contingent liabilities
Th e Group’s contingent liabilities total € 2,767 million (previous
year: € 2,469 million). € 24 million of the contingent liabilities relates
to guarantee obligations (previous year: € 12 million), € 119 million
to warranties (previous year: € 133 million) and € 125 million to
liabilities from litigation risks (previous year: € 153 million). Th e
other contingent liabilities amounting to € 2,499 million (previous
year: € 2,171 million) mainly relate to obligations from formal state
aid proceedings, see Notes 51 and 57, and tax-related items.
In addition, there is a contingent liability to the French tax
authorities, which is not included in total contingent liabilities.
Th e tax authorities have not yet provided documentation about
the matter at issue. It is therefore impossible to estimate the actual
amount of this liability, preventing its recognition.
Deutsche Post DHL Annual Report 2011
Consolidated Financial StatementsNotes
Other disclosures
215

Th e European Commission’s decision of 25 January 2012
concluded the formal state aid investigation that it had initiated on
12 September 2007. Th e investigation focused on whether the Fed-
eral Republic of Germany, using state resources, overcompensated
Deutsche Post AG or its legal predecessor Deutsche Bundespost
POSTDIENST for the cost of providing universal services between
1989 and 2007 and whether the company was thereby granted state
aid incompatible with EU law. According to the decision opening
the investigation, the Commission intended to examine all pub-
lic transfers, public guarantees, statutorily granted exclusive rights,
the price regulation of letter services and the public funding of
civil servants’ pensions during the period in question. Also to be
investigated was the cost allocation within Deutsche Post AG and
its predecessor between the regulated letter service, the universal
service and competitive services. Th is also relates to cooperation
agreements between Deutsche Post AG and Deutsche Postbank AG
as well as between Deutsche Post AG and the business parcel ser-
vice marketed by DHL Vertriebs GmbH. Th e Monopolkommission
(German Monopoly Commission) had also previously alleged
that Deutsche Post AG permits Deutsche Postbank AG to use its
retail outlets at below-market rates, and that in so doing it contra-
venes the prohibition on state aid enshrined in the EC Treaty. Th e
European Commission extended its offi cial state aid proceedings
on 10 May 2011. Th e extension concerned the funding arrange-
ments for civil servants’ pensions, which were to be examined
more closely, including the pension obligations factored into the
price approval process.
In its decision of 25 January 2012, the European Commission
concluded that Deutsche Post AG and its predecessor, Deutsche
Bundespost POSTDIENST, did not receive any excessive state fund-
ing for the universal services provided in the years 1989 to 2007 and
that therefore no incompatible state aid was granted. Equally, the
European Commission found no evidence of illegal state aid with
respect to the guarantees issued by the German state. It also did
not fi nd fault with the cooperation agreements between Deutsche
Post AG and Deutsche Postbank AG, and between Deutsche
Post AG and DHL Vertriebs GmbH. Th e European Commission
did not revisit the 1999 sale of shares of Deutsche Postbank AG to
Deutsche Post AG in its ruling.
However, in its review of the funding of civil servants’ pen-
sions, the European Commission concluded that Deutsche Post AG
had received illegal state aid in this area. It said that the pension
relief granted to Deutsche Post AG by the Bundesnetzagentur
during the price approval process led to Deutsche Post AG hav-
ing to pay lower social security contributions for civil servants
than its competitors pay for salaried employees, resulting in a
benefi t to Deutsche Post AG of between € 500 million and € 1 bil-
lion. According to the Commission, this benefi t represents illegal
state aid that must be repaid by Deutsche Post AG to the Federal
Republic of Germany. Th e precise amount has to be calculated by
the Federal Republic. Deutsche Post AG is of the opinion that the
European Commission’s decision of 25 January 2012 cannot with-
stand legal review and will appeal to the European Court of Justice
in Luxembourg.
51 Litigation
Many of the services provided by Deutsche Post AG and its
subsidiaries are subject to sector-specifi c regulation by the Bundes-
netzagentur (German federal network agency) under the Postgesetz
(German Postal Act). Th e Bundesnetzagentur approves or reviews
prices, formulates the terms of downstream access and has special
supervisory powers to combat market abuse. Th is general regula-
tory risk could lead to a decline in revenue and earnings in the
event of negative decisions.
Legal risks arise, amongst other things, from appeals by an
association and a competitor against the price approvals under the
price cap procedure for 2003, 2004 and 2005, and by the asso-
ciation against the price approval under the price cap procedure
for 2008. Although the appeals by the association against price
approvals for the years 2003 to 2005 were fi nally dismissed by
the Münster Higher Administrative Court, they are now, however,
being continued in the Münster Higher Administrative Court, as
the court of second instance, due to a successful constitutional
complaint.
Legal risks also result from appeals by Deutsche Post against
other price approvals granted by the regulatory authority.
Deutsche Post AG increased its discounts for downstream
access on 1 July 2010. Deutsche Post competitors and their as-
sociations fi led complaints against these discount increases with
the Bundesnetzagentur. Th ey claim that the increased discounts
confl ict, in particular, with regulatory requirements. However, the
Bundesnetzagentur discontinued its review proceedings by way of
a notifi cation of 15 September 2010 aft er having found no viola-
tion of the applicable regulations. In October 2011, several com-
petitors of Deutsche Post AG brought an action in the Cologne
Administrative Court against the Bundesnetzagentur with the aim
of reversing the discount increases. Th e claim has not yet been
served on Deutsche Post AG and it is therefore not currently pos-
sible to assess the specifi c risks arising from this. Deutsche Post AG
considers its charges for downstream access and the discount
increases to be in compliance with the regulatory and other legal
requirements. However, no assurance can be given that the courts
will not come to a diff erent conclusion that would have negative
eff ects on Deutsche Post AG’s revenue and earnings.
In its decision dated 14 June 2011, the Bundesnetz agentur
concluded that First Mail Düsseldorf GmbH, a subsidiary of
Deutsche Post AG, and Deutsche Post AG had contravened the
discounting and discrimination prohibitions under the Postgesetz.
Th e com panies were instructed to remedy the breaches that had
been identi fi ed. Both companies appealed against the ruling
to the Cologne Administrative Court. Furthermore, First Mail
Düsseldorf GmbH fi led an application to suspend the execution
of the ruling until a decision was reached in the principal proceed-
ings. Th e Cologne Administrative Court and the Münster Higher
Administrative Court both dismissed this application. First Mail
Düsseldorf GmbH announced in December 2011 that it would
cease trading at the end of the year and it retracted its appeal
on 19 December 2011. Deutsche Post AG continues to pursue its
appeal against the Bundes netzagentur ruling.
Deutsche Post DHL Annual Report 2011216

In the consolidated fi nancial statements as at 31 Decem-
ber 2011, € 33 million (previous year: € 20 million) was recognised
in equity for the grant of variable remuneration components; see
table in Note 38.1.
2006 Stock Appreciation Rights (sar) Plan for executives
Since 3 July 2006, selected executives have received annual
tranches of SAR s under the Long-Term Incentive Plan introduced
in 2006. Th is allows them to receive a cash payment within a de-
fi ned period in the amount of the diff erence between the respective
price of Deutsche Post shares and the fi xed issue price if demand-
ing performance targets are met. All SAR s under the 2006 and
2007 tranches expired at the end of the respective waiting periods,
since the performance targets were not met. Aft er the expiry of the
waiting period for the 2008 tranche on 30 June 2011, two-sixths of
the SAR s granted became exercisable. However, they could not be
exercised so far because the share price has not yet exceeded the
issue price of € 18.40.
Long-Term Incentive Plan (2006 ltip) for members of the Board
of Management
Since 1 July 2006, the members of the Board of Management
receive SAR s under the 2006 Long-Term Incentive Plan. Each SAR
under the 2006 LTIP entitles the holder to receive a cash settle-
ment equal to the diff erence between the average closing price of
Deutsche Post shares during the last fi ve trading days before the
exercise date and the issue price of the SAR.
Th e members of the Board of Management each invested 10 %
of their fi xed annual remuneration (annual base salary) as a per-
sonal fi nancial investment in 2011. Th e number of SAR s issued to
the members of the Board of Management is determined by the
Super visory Board. Following a four-year waiting period (or fol-
lowing a three-year waiting period for SAR s issued up to 2008,
inclusive) that begins on the issue date, the SAR s granted can be
fully or partly exercised within a period of two years provided an
absolute or relative performance target is achieved at the end of
the waiting period. Any SAR s not exercised during this two-year
period will expire. To determine how many – if any – of the granted
SAR s can be exercised, the average share price or the average index
is compared for the reference period and the performance period.
Th e reference period comprises the last 20 consecutive trading days
before the issue date. Th e performance period is the last 60 trading
days before the end of the waiting period. Th e average (closing)
price is calculated as the average closing price of Deutsche Post
shares in Deutsche Börse AG’s Xetra trading system.
Th e absolute performance target is met if the closing price of
Deutsche Post shares is at least 10, 15, 20 or 25 % above the issue
price. Th e relative performance target is tied to the performance
of the shares in relation to the STOXX Europe 600 Index (SXXP,
ISIN EU0009658202). It is met if the share price equals the index
performance during the performance period or if it outperforms
the index by at least 10 %.
In October 2007 DHL Global Forwarding, along with all
other major players in the freight forwarding industry, received a
request for information from the Competition Directorate of the
European Commission, a subpoena from the United States Depart-
ment of Justice’s Antitrust Division and requests for information
from competition authorities in other jurisdictions in connection
with a formal investigation into the setting of surcharges and fees
in the international freight forwarding industry. In January 2008,
an antitrust class action was initiated in the New York District
Court on behalf of purchasers of freight forwarding services in
which Deutsche Post AG and DHL are named as defendants. Th is
civil action appears to be based on the fact that antitrust investiga-
tions are ongoing, but not on any known outcome or quantifi ed
loss. Deutsche Post DHL is not able to predict or comment on the
outcome of the investigations or the prospects of the class action,
but believes its fi nancial exposure in relation to both is limited.
52 Share-based payment
Share-based payment for executives (Share Matching Scheme)
Th e new system to grant variable remuneration components
for some of the Group’s executives introduced in 2009, which is
accounted for as an equity-settled share-based payment transaction
in accordance with IFRS 2, was extended to include other groups
of Group executives in 2010. Under this system, certain executives
receive part of their variable remuneration for the fi nan cial year
in the form of shares of Deutsche Post AG in the following year
(incentive shares); all Group executives can specify an increased
equity component individually by converting a further portion
of their variable remuneration for the fi nancial year (investment
shares). If certain conditions are met, the executive will again be
awarded the same number of Deutsche Post AG shares four years
later (matching shares).
Share Matching Scheme
2009
tranche2010
tranche2011
tranche
Grant date 1 Nov. 2009 1 Jan. 2010 1 Jan. 2011
Term months 53 63 63
End of term March 2014 March 2015 March 2016
Share price at grant date € 11.48 13.98 12.90
Number of incentive shares
in thousands 430 638 691
Number of matching shares expected
in thousands 762 1,674 1,913
Deutsche Post DHL Annual Report 2011
Consolidated Financial StatementsNotes
Other disclosures
217

A maximum of four out of every six SAR s can be “earned” via
the absolute performance target, and a maximum of two via the
relative performance target. If neither an absolute nor a relative
performance target is met by the end of the waiting period, the
SAR s attributable to the related tranche will expire without replace-
ment or compensation. More details on the 2006 LTIP tranches are
shown in the following table:
2006 ltip
2007 tranche 2008 tranche 2009 tranche 2010 tranche 2011 tranchesar s
Issue date 1 July 2007 1 July 2008 1 July 2009 1 July 2010 1 July 2011
Issue price in € 24.02 18.40 9.52 12.27 12.67
Waiting period expires 30 June 2010 30 June 2011 30 June 2013 30 June 2014 30 June 2015
Th e fair value of the 2006 SAR Plan and the Long-Term
Incentive Plan for members of the Board of Management (2006
LTIP) was determined using a stochastic simulation model. As a
result, an expense of € 24 million was recognised for fi nancial year
2011 (previous year: € 21 million).
See Note 53.2 for further disclosures on share-based pay-
ment for members of the Board of Management. A provision for
the 2006 LTIP and the 2006 SAR Plan (Board of Management
and executives) was recognised as at the balance sheet date in the
amount of € 61 million (previous year: € 37 million).
53 Related party disclosures
53.1 Related party disclosures (companies and Federal Republic
of Germany)
All companies classifi ed as related parties that are controlled
by the Group or on which the Group can exercise signifi cant infl u-
ence are recorded in the list of shareholdings, see Note 58, together
with information on the equity interest held, their equity and their
net profi t or loss for the period, broken down by geographical areas.
Deutsche Post AG maintains a variety of relationships with
the Federal Republic of Germany and other companies controlled
by the Federal Republic of Germany.
Th e federal government is a customer of Deutsche Post AG
and as such uses the company’s services. Deutsche Post AG has
direct business relationships with the individual public authorities
and other government agencies as independent individual custom-
ers. Th e services provided for these customers are insignifi cant in
respect of Deutsche Post AG’s overall revenue.
relationships with kfw bankengruppeKfW Bankengruppe (KfW) supports the federal government
in continuing to privatise companies such as Deutsche Post AG or
Deutsche Telekom AG. In 1997, KfW, together with the federal gov-
ernment, developed a “placeholder model” as a tool to privatise
government-owned companies. Under this model, the federal gov-
ernment sells all or part of its investments to KfW with the aim of
fully privatising these state-owned companies. On this basis, KfW
has purchased shares of Deutsche Post AG from the federal gov-
ernment in several stages since 1997 and executed various capital
market transactions using these shares. KfW’s current interest in
Deutsche Post AG’s share capital is 30.5 %. Deutsche Post AG is thus
considered to be an associate of the federal government.
relationships with the bundesanstalt für post und telekommunikationTh e Bundesanstalt für Post und Telekommunikation e. V.
(BAnstPT) is a government agency and falls under the technical
and legal supervision of the German Federal Ministry of Finance.
Under the Bundesanstalt-Reorganisationsgesetz (German Federal
Agency Reorganisation Act), which entered into force on 1 Decem-
ber 2005, the Federal Republic of Germany directly undertakes
the tasks relating to holdings in postal service successor com-
panies through the Federal Ministry of Finance. It is therefore no
longer necessary for the BAnstPT to perform the “tasks associated
with ownership”. Th e BAnstPT manages the social facilities such
as the Postal Civil Service Health Insurance Fund, the recreation
programme, the Versorgungsanstalt der Deutschen Bundespost
(VAP) and the welfare service for Deutsche Post AG, Deutsche
Postbank AG and Deutsche Telekom AG, as well as setting the ob-
jectives for social housing. Th e tasks are performed on the basis
of agency agreements. In 2011, Deutsche Post AG was invoiced for
€ 70 million (previous year: € 72 million) in instalment payments
relating to services provided by the BAnstPT.
relationships with the german federal ministry of financeIn fi nancial year 2001, the German Federal Ministry of
Finance and Deutsche Post AG entered into an agreement that gov-
erns the terms and conditions of the transfer of income received
by Deutsche Post AG from the levying of the settlement pay-
ment under the Gesetze über den Abbau der Fehl subventionierung
im Wohnungs wesen (German Acts on the Reduction of Misdi-
rected Housing Subsidies) relating to housing benefi ts granted
by Deutsche Post. In fi nancial year 2011 Deutsche Post AG paid
€ 0.03 million to the federal government for the fi nal settlement for
fi nancial year 2010 and € 0.06 million for fi nancial year 2011. As
agreed, the fi nal settlement for fi nancial year 2011 will be made by
1 July 2012.
Deutsche Post DHL Annual Report 2011218

to € 64 million in 2011 (previous year: € 63 million). Th e rent
was always paid on time. Deutsche Post Pensions-Treuhand
GmbH & Co. KG owns 100 % of Deutsche Post Pensionsfonds AG,
which was established at the end of 2009. No receivables or
liabilities were due as at 31 December 2011. Th ere were no sales
relation ships between external authorities and a Group company
of Deutsche Post AG in 2011.
relationships with unconsolidated companies, associates and joint venturesIn addition to the consolidated subsidiaries, the Group has
direct and indirect relationships with unconsolidated companies,
associates and joint ventures deemed to be related parties of the
Group in the course of its ordinary business activities. As part of
these activities, all transactions for the provision of goods and ser-
vices entered into with unconsolidated companies were conducted
on an arm’s length basis at standard market terms and conditions.
Transactions were conducted in fi nancial year 2011 with major
related parties, resulting in the following items in the consolidated
fi nancial statements:
€ m
2010 2011
Receivables 35 27
from associates 21 18
from joint ventures 5 5
from unconsolidated companies 9 4
Loans 33 33
to associates 0 0
to joint ventures 19 20
to unconsolidated companies 14 13
Receivables from in-house banking 3 3
from associates 0 0
from joint ventures 3 3
from unconsolidated companies 0 0
Financial liabilities 137 102
to associates 94 28
to joint ventures 10 5
to unconsolidated companies 33 69
Liabilities 35 33
to associates 17 10
to joint ventures 15 22
to unconsolidated companies 3 1
Revenue 287 290
from associates 267 269
from joint ventures 19 20
from unconsolidated companies 1 1
Expenses 1 600 629
due to associates 469 445
due to joint ventures 101 163
due to unconsolidated companies 30 21 1 Relate to materials expense and staff costs.
Deutsche Post AG issued letters of commitment in the amount
of € 140 million for these companies. Of this amount, € 109 million
was attributable to associates, € 26 million to joint ventures and
€ 5 million to unconsolidated companies.
Deutsche Post AG also entered into an agreement with the
Federal Ministry of Finance dated 30 January 2004 relating to the
transfer of civil servants to German federal authorities. Under this
agreement, civil servants are seconded with the aim of transferring
them initially for six months, and are then transferred permanently
if they successfully complete their probation. Once a permanent
transfer is completed, Deutsche Post AG contributes to the cost
incurred by the federal government by paying a fl at fee. In 2011,
this initiative resulted in 15 permanent transfers (previous year: 21)
and 10 secondments with the aim of a permanent transfer in 2012
(previous year: 9).
relationships with the german federal employment agencyDeutsche Post AG and the German Federal Employment
Agency entered into an agreement dated 12 October 2009 relating
to the transfer of Deutsche Post AG civil servants to the Federal
Employment Agency. In 2011, this initiative resulted in 39 perma-
nent transfers.
relationships with deutsche telekom ag and its subsidiariesTh e federal government holds around 32 % of the shares of
Deutsche Telekom AG directly and indirectly (via KfW Banken-
gruppe). A control relationship exists between Deutsche Telekom
and the federal government because the federal government,
despite its non-controlling interest, has a secure majority at
the Annual General Meeting due to its average presence there.
Deutsche Telekom is therefore a related party of Deutsche Post AG.
In fi nancial year 2011, Deutsche Post DHL provided goods and
services (mainly transport services for letters and parcels) for
Deutsche Telekom AG and purchased goods and services (such as
IT products) from Deutsche Telekom.
relationships with deutsche bahn ag and its subsidiariesDeutsche Bahn AG is wholly owned by the German govern-
ment. Owing to this control relationship, Deutsche Bahn AG is a
related party to Deutsche Post AG. Deutsche Post DHL has vari-
ous business relationships with the Deutsche Bahn Group. Th ese
mainly consist of transport service agreements.
bundes-pensions-service für post und telekommunikation e. v.Information on the Bundes-Pensions-Service für Post- und
Telekommunikation e. V. (BPS-PT) can be found in Note 7.
relationship with pension fundsTh e real estate with a fair value of € 1,011 million (previ-
ous year: € 1,043 million) of which Deutsche Post Betriebsrenten
Service e. V. (DPRS) and / or Deutsche Post Pensions-Treuhand
GmbH & Co. KG, Deutsche Post Betriebsrenten-Service e. V. & Co.
Objekt Gronau KG and Deutsche Post Grundstücks-Vermietungs-
gesellschaft beta mbH Objekt Leipzig KG are the legal or benefi -
cial owners, is exclusively let to Deutsche Post Immobilien GmbH.
Rental expense for Deutsche Post Immobilien GmbH amounted
Deutsche Post DHL Annual Report 2011
Consolidated Financial StatementsNotes
Other disclosures
219

As well as the above-mentioned benefi ts for their work on
the Supervisory Board, the employee representatives who are on
the Supervisory Board and who are employed by the Group also
receive their normal salaries for their work in the company. Th ese
salaries are determined at levels that are commensurate with the
salary appropriate for the function or work performed in the
company.
Post-employment benefi ts are recognised as the service cost
resulting from the pension provisions for active members of the
Board of Management.
Th e share-based payment amount relates to the relevant ex-
pense recognised for fi nancial years 2010 and 2011. It is itemised
in the following table:
Share-based payment
thousands of € 2010 3 2011
sar s sar s
Dr Frank Appel, Chairman 97 199
Ken Allen 225 111
Roger Crook 1 0 58
Bruce Edwards 78 114
Jürgen Gerdes 68 114
Lawrence Rosen 225 111
Walter Scheurle 58 114
Hermann Ude 2 78 438
Share-based payment 829 1,2591 Since 9 March 2011.2 Until 8 March 2011.3 In the current fi nancial year the changes in the value of tranches already earned were
itemised for the fi rst time. The prior-period amounts were adjusted accordingly.
Further details on the share-based payment granted to the
members of the Board of Management in fi nancial years 2010 and
2011 are presented in the following tables:
53.2 Related party disclosures (individuals)
In accordance with IAS 24, the Group also reports on trans-
actions between the Group and related parties or members of their
families. Related parties are defi ned as the Board of Management,
Supervisory Board, second-level executives and the members of
their families.
Th ere were no reportable transactions or legal transactions
involving related parties in fi nancial year 2011 with the exception
of an existing master postage agreement in the amount of € 1 mil-
lion between Deutsche Post DHL and a member of the Supervisory
Board.
Th e remuneration of key management personnel of the
Group requiring disclosure under IAS 24 comprises the remuner-
ation of the active members of the Board of Management and the
Supervisory Board. Th e active members of the Board of Manage-
ment and the Supervisory Board were remunerated as follows:
€ m
2010 2011
Short-term employee benefi ts (less share-based payment) 13 13
Post-employment benefi ts 2 3
Termination benefi ts 0 4
Share-based payment 1 1 1
Total 16 211 In the current fi nancial year the changes in the value of tranches already earned were
itemised for the fi rst time. The prior-period amounts were adjusted accordingly. See also the table “Share-based payment”.
Share-based payment for Board of Management members in 2011
number Dr Frank Appel Ken Allen Roger Crook 1
Bruce Edwards
Jürgen Gerdes
Lawrence Rosen
Walter Scheurle
Hermann Ude 2
sar s
Outstanding sar s as at 1 January 2011 1,080,000 576,958 271,056 720,000 720,000 490,000 720,000 720,000
sar s granted 689,502 342,630 284,862 370,518 370,518 342,630 370,518 0
sar s lapsed 345,000 57,972 27,176 230,000 230,000 0 230,000 230,000
sar s exercised 0 0 0 0 0 0 0 0
Outstanding sar s as at 31 December 2011 1,424,502 861,616 528,742 860,518 860,518 832,630 860,518 490,000
Of which exercisable sar s as at 31 December 2011 0 28,986 13,588 0 0 0 0 0
Weighted average settlement price in € Not exercised
Weighted average exercise price in € Not exercised
Weighted average term to maturity in years 2.73 2.62 2.81 2.65 2.65 2.62 2.65 2.011 Since 9 March 2011.2 Until 8 March 2011.
Deutsche Post DHL Annual Report 2011220

shareholdings of the board of management and supervisory boardAs at 31 December 2011, shares held by the Board of Manage-
ment and the Supervisory Board of Deutsche Post AG amounted to
less than 1 % of the company’s share capital.
reportable transactionsTh e transactions of Board of Management and Supervisory
Board members involving securities of the company notifi ed to
Deutsche Post AG in accordance with section 15 a of the Wert-
papierhandelsgesetz (WpHG – German Securities Trading Act) can
be viewed on the company’s website at www.dp-dhl.com.
54 Auditor’s fees
Th e following fees for services rendered by the auditor of the
consolidated fi nancial statements, PricewaterhouseCoopers Aktien-
gesellschaft Wirtschaft sprüfungsgesellschaft , were recognised as an
expense in fi nancial year 2011 and in the previous year:
€ m
2010 2011
Audits of the fi nancial statements 5 5
Other assurance or valuation services 2 2
Tax advisory services 0 0
Other services 1 2
Auditor’s fees 8 9
Share-based payment for Board of Management members in 2010
number Dr Frank Appel Ken Allen
Bruce Edwards
Jürgen Gerdes
Lawrence Rosen
Walter Scheurle Hermann Ude
sar s
Outstanding sar s as at 1 January 2010 925,000 370,896 523,562 618,706 240,000 690,000 523,562
sar s granted 375,000 250,000 250,000 250,000 250,000 250,000 250,000
sar s lapsed 220,000 43,938 53,562 148,706 0 220,000 53,562
sar s exercised 0 0 0 0 0 0 0
Outstanding sar s as at 31 December 2010 1,080,000 576,958 720,000 720,000 490,000 720,000 720,000
of which exercisable sar s as at 31 December 2010 0 0 0 0 0 0 0
Weighted average settlement price in € Not exercised
Weighted average exercise price in € Not exercised
Weighted average term to maturity in years 2.21 2.63 2.21 2.21 3.01 2.21 2.21
board of management remunerationTh e total remuneration paid to the active members of the
Board of Management in fi nancial year 2011 including the com-
ponents with a long-term incentive eff ect totalled € 19.0 million
(previous year: € 17.0 million). Of this amount, € 7.4 million (previ-
ous year: € 7.1 million) is attributable to non-performance-related
components (annual base salary and fringe benefi ts), € 4.6 million
(previous year: € 4.9 million) to performance-related components
(variable components) and € 7.0 million (previous year: € 5.0 mil-
lion) to components with a long-term incentive eff ect (SAR s). Th e
number of SAR s was 2,771,178 (previous year: 1,875,000).
former members of the board of managementTh e remuneration of former members of the Board of
Manage ment or their surviving dependants amounted to € 7.4 mil-
lion in the year under review (previous year: € 5.7 million). Th e
defi ned benefi t obligation (DBO) for current pensions calculated
under IFRS s amounted to € 57.0 million (previous year: € 42.9 mil-
lion). Th e change (€ 13.3 million) is due to the greater number of
pensioners as their pension benefi ts have fallen due; no additional
obligations have been incurred in this context. Rather, the existing
obligations due to pension entitlements, including the 2011 service
costs, decreased to € 25.7 million (previous year: € 35.4 million).
remuneration of the supervisory boardTh e total remuneration of the Supervisory Board in fi nan-
cial year 2011 amounted to approximately € 1.4 million (previous
year: € 1.1 million); € 1.2 million of this amount was attributable
to a fi xed component (previous year: € 0.9 million), € 0 million
to performance-related remuneration (previous year: € 0 mil-
lion) and € 0.2 million to attendance allowances (previous year:
€ 0.2 million).
Further information on the itemised remuneration of the
Board of Management and the Supervisory Board can be found in
the Corporate Governance Report. Th e remuneration report con-
tained in the Corporate Governance Report also forms part of the
Group Management Report.
Deutsche Post DHL Annual Report 2011
Consolidated Financial StatementsNotes
Other disclosures
221

51. European Air Transport Leipzig GmbH
52. First Mail Düsseldorf GmbH
53. Gerlach Zolldienste GmbH
54. InterServ Gesellschaft für Personal-
u. Beraterdienst leistungen mbH
55. ITG GmbH Internationale Spedition
56. SGB GmbH
57. Werbeagentur Janssen GmbH
58. Williams Lea Deutschland GmbH
59. Williams Lea GmbH
60. Williams Lea Inhouse Solutions GmbH
61. Zweite End of Runway Development Leipzig GmbH
56 Declaration of Conformity with the German Corporate
Governance Code
Th e Board of Management and the Supervisory Board of
Deutsche Post AG jointly submitted the Declaration of Conformity
with the German Corporate Governance Code for fi nancial year
2011 required by section 161 of the Aktiengesetz (AktG – German
Stock Corporation Act). Th is Declaration of Conformity can be
accessed online at www.corporate-governance-code.de and at
www.dp-dhl.com.
57 Signifi cant events after the balance sheet date
On 25 January 2012, the European Commission concluded
the formal state aid investigation that it had initiated on 12 Septem-
ber 2007. Th e issues are described in detail in Note 51, Litigation.
According to its decision, the Commission is requiring Deutsche
Post AG to repay this state aid to the Federal Republic of Germany
in the amount of € 500 million to € 1 billion plus interest. No other
state aid proceedings involving the Group are pending at the
European Commission. Deutsche Post AG is of the opinion that the
European Commission’s decision of 25 January 2012 cannot with-
stand legal review and will appeal to the European Court of Justice
in Luxembourg. Accounting will take place in accordance with the
envisaged procedures.
Th e procedure to exercise the put option on 12.1 % of Deutsche
Postbank AG shares was initiated in January 2012.
55 Exercise of options under section 264 (3) of the hgb
For fi nancial year 2011, Deutsche Post AG has exercised the
simplifi cation options under section 264 (3) of the HGB for the fol-
lowing companies:
1. Agheera GmbH
2. Albert Scheid GmbH
3. Danzas Deutschland Holding GmbH
4. Danzas Grundstücksverwaltung Groß-Gerau GmbH
5. Deutsche Post Adress Beteiligungsgesellschaft mbH
6. Deutsche Post Assekuranz Vermittlungs GmbH
7. Deutsche Post Beteiligungen Holding GmbH
8. Deutsche Post Com GmbH
9. Deutsche Post Consult GmbH
10. Deutsche Post Customer Service Center GmbH
11. Deutsche Post DHL Beteiligungen GmbH
12. Deutsche Post DHL Corporate Real Estate Management
GmbH
13. Deutsche Post DHL Corporate Real Estate Management
GmbH & Co. Logistikzentren KG
14. Deutsche Post DHL Inhouse Consulting GmbH
15. Deutsche Post DHL Research and Innovation GmbH
16. Deutsche Post Direkt GmbH
17. Deutsche Post Fleet GmbH
18. Deutsche Post Immobilien GmbH
19. Deutsche Post Investments GmbH
20. Deutsche Post IT Brief GmbH
21. Deutsche Post IT Services GmbH
22. Deutsche Post Real Estate Germany GmbH
23. Deutsche Post Shop Essen GmbH
24. Deutsche Post Shop Hannover GmbH
25. Deutsche Post Shop München GmbH
26. Deutsche Post Technischer Service GmbH
27. DHL Airways GmbH
28. DHL Automotive GmbH
29. DHL Automotive Off enau GmbH
30. DHL BwLog GmbH
31. DHL Express Germany GmbH
32. DHL Food Services GmbH
33. DHL Freight Germany Holding GmbH
34. DHL Freight GmbH
35. DHL Global Forwarding GmbH
36. DHL Global Forwarding Management GmbH
37. DHL Global Management GmbH
38. DHL Home Delivery GmbH
39. DHL HUB Leipzig GmbH
40. DHL International GmbH
41. DHL Logistics GmbH
42. DHL Solution Großgut GmbH
43. DHL Solutions Fashion GmbH
44. DHL Solutions GmbH
45. DHL Solutions Retail GmbH
46. DHL Supply Chain Management GmbH
47. DHL Trade Fair & Events GmbH
48. DHL Verwaltungs GmbH
49. Erste End of Runway Development Leipzig GmbH
50. Erste Logistik Entwicklungsgesellschaft MG GmbH
Deutsche Post DHL Annual Report 2011222

58 List of shareholdings
Affi liated companies included in the consolidated fi nancial statements
HeadquartersGroup
equity share % CurrencyEquity
thousandsNet income thousandsName
Europe
abis GmbH Germany, Frankfurt / Main 70.00 eur 315 566
Adcloud GmbH Germany, Cologne 100.00 eur – 907 – 932
Adcloud Operations Spain s. l. Spain, Madrid 100.00 eur –27 –30
Admagic Limited United Kingdom, London 100.00 eur 8,211 587
Aerocar b. v. Netherlands, Amsterdam 100.00 eur 7,645 3,986
Agheera GmbH 6, 9 Germany, Bonn 100.00 eur 25 0
Albert Scheid GmbH 6, 9 Germany, Cologne 100.00 eur 1,022 0
Applied Distribution Group Limited 5 United Kingdom, Bracknell 100.00 eur 5,956 0
Axial sa Belgium, Seneffe 100.00 eur 2,295 – 65
Blue Funnel Bulkships Limited 5 United Kingdom, Bracknell 100.00 eur –2,646 0
Cargus Express Curier s. r. l. Romania, Bucharest 100.00 eur –10,743 –2,607
Cargus International s. r. l. Romania, Bucharest 100.00 eur 1,258 1,688
Container Services Amsterdam b. v. 5 Netherlands, Amsterdam 100.00 eur 245 0
cpj Travel Limited 5 United Kingdom, Hounslow 100.00 eur 0 0
danmar Lines ag Switzerland, Basel 100.00 eur 24,583 7
Danzas (uk) Limited 5 United Kingdom, Staines 100.00 eur 1,197 0
Danzas Chemicals GmbH 8 Germany, Düsseldorf 100.00 eur –1,267 0
Danzas Deutschland Holding GmbH 6, 9 Germany, Frankfurt / Main 100.00 eur 4,025 0
danzas Fashion b. v. Netherlands, Venlo 100.00 eur –26,703 – 532
Danzas Fashion nv Belgium, Grimbergen 100.00 eur 12 –1
Danzas Fashion Service Centers b. v. Netherlands, Waalwijk 100.00 eur 507 –138
Danzas Grundstücksverwaltung Frankfurt GmbH 6, 9 Germany, Frankfurt / Main 100.00 eur 22,679 0
Danzas Grundstücksverwaltung Groß-Gerau GmbH 6, 9 Germany, Hamburg 100.00 eur 26 0
Danzas Holding ag Switzerland, Basel 100.00 eur 126,500 21,590
Danzas Kiev Ltd. Ukraine, Kiev 100.00 eur –2,142 –218
Danzas Verwaltungs GmbH Germany, Frankfurt / Main 100.00 eur 23,576 1,149
Danzas, s. l. Spain, San Sebastián 100.00 eur 211,654 56,231
Darshaan Properties Ltd. Ireland, Dublin 100.00 eur 0 – 93
Deutsche Post Adress Beteiligungsgesellschaft mbH 6, 9 Germany, Bonn 100.00 eur 30 0
Deutsche Post Adress Geschäftsführungs GmbH Germany, Bonn 51.00 eur 35 18
Deutsche Post Adress GmbH & Co. kg Germany, Bonn 51.00 eur 9,987 18,342
Deutsche Post Assekuranz Vermittlungs GmbH 6, 9 Germany, Bonn 55.00 eur 51 0
Deutsche Post Beteiligungen Holding GmbH 6, 9 Germany, Bonn 100.00 eur 6,655,052 0
Deutsche Post Com GmbH 6, 9 Germany, Bonn 100.00 eur 1,126 0
Deutsche Post Consult GmbH 6, 9 Germany, Bonn 100.00 eur 3,858 0
Deutsche Post Customer Service Center GmbH 6, 9 Germany, Monheim 100.00 eur 43 0
Deutsche Post DHL Beteiligungen GmbH 6, 9 Germany, Bonn 100.00 eur 882,025 0
Deutsche Post DHL Corporate Real Estate Management GmbH 6, 9 Germany, Bonn 100.00 eur 51 0
Deutsche Post DHL Corporate Real Estate Management GmbH & Co. Logistikzentren kg Germany, Bonn 100.00 eur 1,300 –772
Deutsche Post DHL Inhouse Consulting GmbH 6, 9 Germany, Bonn 100.00 eur 25 0
Deutsche Post DHL Research and Innovation GmbH 6, 9 Germany, Bonn 100.00 eur 7,500 0
Deutsche Post Direkt GmbH 6, 9 Germany, Bonn 100.00 eur 60 0
Deutsche Post Finance b. v. Netherlands, Maastricht 100.00 eur 13,693 798
Deutsche Post Fleet GmbH 6, 9 Germany, Bonn 100.00 eur 511,115 0
Deutsche Post Global Mail (Belgium) nv Belgium, Brussels 100.00 eur 1,104 5
Deutsche Post Global Mail (France) sas France, Issy-les-Moulineaux 100.00 eur 2,535 363
Deutsche Post Global Mail (Netherlands) b. v. Netherlands, Utrecht 100.00 eur 2,899 912
Deutsche Post Global Mail (Switzerland) ag Switzerland, Basel 100.00 eur 682 282
Reported ifrs data.1 Only subgroup data available. 2 Amounts from 2009. 3 Amounts from 2010. 4 Data not available. 5 Dormant. 6 Amounts after profi t transfer. 7 a Inclusion in accordance with ias 27.13 (a). 7 b Inclusion in accordance with ias 27.13 (b – d). 8 In liquidation. 9 Local gaap. 10 Voting rights. 11 Company is included in group fi nancial statements of Deutsche Postbank ag. 12 Amounts from 2008. 13 Inclusion in accordance with sic 12 (spe). 14 Not included because they do not have signifi cant infl uence on the Group’s net assets, fi nancial position and results of operations.
Deutsche Post DHL Annual Report 2011
Consolidated Financial StatementsNotes
Other disclosures
223

Affi liated companies included in the consolidated fi nancial statements
HeadquartersGroup
equity share % CurrencyEquity
thousandsNet income thousandsName
Deutsche Post Global Mail (uk) Limited 5 United Kingdom, Croydon 100.00 eur 8,258 0
Deutsche Post Immobilien GmbH 6, 9 Germany, Bonn 100.00 eur 25 0
Deutsche Post Insurance Limited Ireland, Dublin 100.00 eur 10,985 –29
Deutsche Post International b. v. 1 Netherlands, Amsterdam 100.00 eur 8,458,661 374,463
TheNetherlands622009 b. v. 1 Netherlands, Apeldoorn 100.00 eur – –
Deutsche Post Investments GmbH 6, 9 Germany, Bonn 100.00 eur 400,025 0
Deutsche Post it brief GmbH 6, 9 Germany, Bonn 100.00 eur 11,160 0
Deutsche Post it Services GmbH 6, 9 Germany, Bonn 100.00 eur 39,226 0
Deutsche Post Mail Distribution (Netherlands) b. v. Netherlands, Apeldoorn 100.00 eur – 8,184 – 92
Deutsche Post Nederland c. v. Netherlands, Utrecht 100.00 eur – 80,083 –11,093
Deutsche Post Real Estate Germany GmbH 6, 9 Germany, Bonn 100.00 eur 13,838 0
Deutsche Post Reinsurance s. a. Luxembourg, Luxembourg 100.00 eur 2,240 0
Deutsche Post Shop Essen GmbH 6, 9 Germany, Essen 100.00 eur 25 0
Deutsche Post Shop Hannover GmbH 6, 9 Germany, Hanover 100.00 eur 25 0
Deutsche Post Shop München GmbH 6, 9 Germany, Munich 100.00 eur 25 0
Deutsche Post Technischer Service GmbH 6, 9 Germany, Bonn 100.00 eur 4,012 0
Deutsche Post Zahlungsdienste GmbH 6, 9 Germany, Bonn 100.00 eur 1,000 0
dhl Supply Chain (Finland) Oy Finland, Vantaa 100.00 eur 4,703 897
dhl (Cyprus) Ltd. Cyprus, Nikosia 100.00 eur 3,094 – 54
dhl Air Limited United Kingdom, Hounslow 100.00 eur 13,712 3,171
dhl AirWays GmbH 6, 9 Germany, Cologne 100.00 eur 2,152 0
dhl Automotive GmbH 6, 9 Germany, Hamburg 100.00 eur 4,091 0
dhl Automotive Offenau GmbH 6, 9 Germany, Bonn 100.00 eur 71 0
dhl Automotive s. r. o. Czech Republic, Prague 100.00 eur 6,093 –1,596
dhl Aviation (France) sas France, Roissy-en-France 100.00 eur 1,463 38
dhl Aviation (Italy) S. r. l. Italy, Milan 100.00 eur 3,594 –295
dhl Aviation (Netherlands) b. v. Netherlands, Amersfoort 100.00 eur 4,378 313
dhl Aviation (uk) Limited United Kingdom, Hounslow 100.00 eur 7,640 920
dhl Aviation nv / sa Belgium, Zaventem 100.00 eur 19,510 494
dhl Beautiran sa France, La Plaine Saint-Denis 100.00 eur 1,672 –1,571
Exel Beziers sarl France, La Plaine Saint-Denis 100.00 eur – 506 –186
dhl Bwlog GmbH 6, 9 Germany, Mönchengladbach 100.00 eur 11,615 0
dhl Distribution Holdings (uk) Limited United Kingdom, Hounslow 100.00 eur 41,419 39,036
dhl Ekspres (Slovenija), d. o. o. Slovenia, Trzin 100.00 eur –112 –266
dhl Elancourt sarl France, La Plaine Saint-Denis 100.00 eur 3,524 1,356
dhl Estonia as Estonia, Tallinn 100.00 eur 7,355 1,066
dhl Exel Slovakia, s. r. o. Slovakia, Bratislava 100.00 eur 274 878
dhl Exel Supply Chain (Denmark) a / s Denmark, Kastrup 100.00 eur –19,461 397
dhl Exel Supply Chain (Poland) Sp. z o. o. Poland, Warsaw 100.00 eur –3,732 –1,630
dhl Exel Supply Chain (Sweden) ab Sweden, Stockholm 100.00 eur 10,789 – 4,136
dhl Exel Supply Chain Euskal-Log, s. l. u. Spain, Barcelona 100.00 eur 7,040 233
dhl Exel Supply Chain Hungary Limited Hungary, Ullo 100.00 eur 608 89
dhl Exel Supply Chain Limited United Kingdom, Bedford 100.00 eur 449,352 – 4,422
dhl Exel Supply Chain Portugal, s. a. Portugal, Alverca 100.00 eur 6,208 –1,772
dhl Exel Supply Chain (Spain), s. l. u. Spain, Madrid 100.00 eur 16,184 –3,579
dhl Exel Supply Chain Trade (Poland) Sp. z o. o. Poland, Warsaw 100.00 eur 431 – 80
dhl Exel Supply Chain Trollhättan ab Sweden, Stockholm 100.00 eur –3,518 – 6,366
dhl Express (Austria) GmbH Austria, Guntramsdorf 100.00 eur –192 –10,583
dhl Express (Belgium) nv Belgium, Ternat 100.00 eur 9,317 2,255
dhl Express (Czech Republic) s. r. o. Czech Republic, Ostrava 100.00 eur 10,056 3,867
dhl Express (Denmark) a / s Denmark, Brøndby 100.00 eur 84,901 5,614
dhl Express (France) sas France, Roissy-en-France 100.00 eur – 43,869 –3,751
dhl Express (Hellas) s. a. Greece, Athens 100.00 eur 4,898 5,597
dhl Express (Iceland) ehf Iceland, Reykjavik 100.00 eur 91 1
dhl Express (Ireland) Ltd. Ireland, Dublin 100.00 eur 483 1,092
dhl Express (Italy) S. r. l. Italy, Milan 100.00 eur 57,894 8,112
Deutsche Post DHL Annual Report 2011224

Affi liated companies included in the consolidated fi nancial statements
HeadquartersGroup
equity share % CurrencyEquity
thousandsNet income thousandsName
dhl Express (Luxembourg) s. a. Luxembourg, Contern 100.00 eur 5,059 821
dhl Express (Netherlands) b. v. Netherlands, Amersfoort 100.00 eur 9,250 14,677
dhl Express (Norway) as Norway, Oslo 100.00 eur 16,038 – 6,064
dhl Express (Poland) Sp. z o. o. Poland, Warsaw 100.00 eur 55,694 27,615
dhl Express (Schweiz) ag Switzerland, Basel 100.00 eur 17,500 6,578
dhl Express (Slovakia), spol. s r. o. Slovakia, Bratislava 100.00 eur 4,321 – 438
dhl Express (uk) Limited United Kingdom, Hounslow 100.00 eur –30,333 – 89
dhl Express Bulgaria eood Bulgaria, Sofi a 100.00 eur 1,883 1,031
dhl Express Germany GmbH 6, 9 Germany, Bonn 100.00 eur 6,618 0
dhl Express Hungary Forwarding and Services llc Hungary, Budapest 100.00 eur 6,927 2,607
dhl Express Iberia s. l. 1 Spain, San Sebastián 100.00 eur 154,811 28,241
Denalur spe, s. l. 1 Spain, San Sebastián 100.00 eur – –
dhl Express a Coruna Spain, s. l. 1 Spain, San Sebastián 100.00 eur – –
dhl Express Alacant Spain s. l. 1 Spain, San Sebastián 100.00 eur – –
dhl Express Araba Spain s. l. 1 Spain, San Sebastián 100.00 eur – –
dhl Express Barcelona Spain s. l. 1 Spain, San Sebastián 100.00 eur – –
dhl Express Bizkaia Spain s. l. 1 Spain, San Sebastián 100.00 eur – –
dhl Express Cantabria Spain s. l. 1 Spain, San Sebastián 100.00 eur – –
dhl Express Castello Spain s. l. 1 Spain, San Sebastián 100.00 eur – –
dhl Express Ciudad Real Spain, s. l. 1 Spain, Ciudad Real 100.00 eur – –
dhl Express Gipuzkoa Spain s. l. 1 Spain, San Sebastián 100.00 eur – –
dhl Express Girona Spain s. l. 1 Spain, San Sebastián 100.00 eur – –
dhl Express Huelva Spain s. l. 1 Spain, San Sebastián 100.00 eur – –
dhl Express Illes Balears Spain, s. l. 1 Spain, Barcelona 100.00 eur – –
dhl Express Jaén Spain s. l. 1 Spain, Ciudad Real 100.00 eur – –
dhl Express Lugo, Spain s. l. 1 Spain, San Sebastián 100.00 eur – –
dhl Express Madrid Spain s. l. 1 Spain, San Sebastián 100.00 eur – –
dhl Express Malaga Spain s. l. 1 Spain, Málaga 100.00 eur – –
dhl Express Navarra Spain, s. l. 1 Spain, Navarra 100.00 eur – –
dhl Express Pontevedra Spain s. l. 1 Spain, Vigo 100.00 eur – –
dhl Express Servicios s. l. 1 Spain, San Sebastián 100.00 eur – –
dhl Express Sevilla Spain s. l. 1 Spain, Sevilla 100.00 eur – –
dhl Express Tarragona Spain s. l. 1 Spain, San Sebastián 100.00 eur – –
dhl Express Valencia Spain s. l. 1 Spain, San Sebastián 100.00 eur – –
dhl Express Valladolid Spain s. l. 1 Spain, San Sebastián 100.00 eur – –
dhl Express Zaragoza Spain, s. l. 1 Spain, Zaragoza 100.00 eur – –
dhl Pony Express Limited 1, 5 United Kingdom, Hounslow 100.00 eur 6,343 0
dhl @home Limited 1, 5 United Kingdom, Hounslow 100.00 eur – –
Rosier Distribution Limited 1, 5 United Kingdom, Hounslow 100.00 eur – –
Russel Davies Properties Limited 1, 5 United Kingdom, Hounslow 100.00 eur – –
Russell Davies Limited 1, 5 United Kingdom, Hounslow 100.00 eur – –
dhl Express Macedonia d. o. o. e. l. Macedonia, Skopje 100.00 eur 1,005 225
dhl Express Portugal, Lda. Portugal, Moreira da Maia 100.00 eur 16,622 2,467
dhl Express Services (France) sas France, Roissy-en-France 100.00 eur –1,195 7,113
dhl Fashion (France) sas France, La Plaine Saint-Denis 100.00 eur 2,383 –14,221
dhl Finance Services b. v. Netherlands, Maastricht 100.00 eur 1,795 – 402
dhl FoodServices GmbH 6, 9 Germany, Cologne 100.00 eur 258 0
dhl Freight (Belgium) nv Belgium, Grimbergen 100.00 eur 4,963 –196
dhl Freight (France) sas France, Marne-la-Vallée 100.00 eur 3,538 – 5,471
dhl Freight (Netherlands) b. v. Netherlands, Tiel 100.00 eur – 9,594 – 4,059
dhl Freight (Sweden) ab Sweden, Stockholm 100.00 eur 41,020 4,940
dhl Freight and Contract Logistics (uk) Limited United Kingdom, Milton Keynes 100.00 eur –2,339 2,517
Reported ifrs data.1 Only subgroup data available. 2 Amounts from 2009. 3 Amounts from 2010. 4 Data not available. 5 Dormant. 6 Amounts after profi t transfer. 7 a Inclusion in accordance with ias 27.13 (a). 7 b Inclusion in accordance with ias 27.13 (b – d). 8 In liquidation. 9 Local gaap. 10 Voting rights. 11 Company is included in group fi nancial statements of Deutsche Postbank ag. 12 Amounts from 2008. 13 Inclusion in accordance with sic 12 (spe). 14 Not included because they do not have signifi cant infl uence on the Group’s net assets, fi nancial position and results of operations.
Deutsche Post DHL Annual Report 2011
Consolidated Financial StatementsNotes
Other disclosures
225

Affi liated companies included in the consolidated fi nancial statements
HeadquartersGroup
equity share % CurrencyEquity
thousandsNet income thousandsName
dhl Freight Finland Oy Finland, Vantaa 100.00 eur 16,717 4,935
dhl Freight Germany Holding GmbH 6, 9 Germany, Düsseldorf 100.00 eur 301,204 0
dhl Freight GmbH 6, 9 Germany, Düsseldorf 100.00 eur 10,737 0
dhl Freight Hungary Forwarding and Logistics Ltd. Hungary, Budapest 100.00 eur 47 –195
dhl Freight Services (Netherlands) b. v. Netherlands, Tiel 100.00 eur 5,358 2,735
dhl Freight Spain, s. l. Spain, San Sebastián 100.00 eur 5,331 282
dhl gbs (uk) Limited United Kingdom, Bracknell 100.00 eur 9,648 2,626
dhl Global Forwarding – dgf Industrial Project (dgf ip) sas France, La Garenne-Colombes 100.00 eur 1,272 – 463
dhl Global Forwarding (Austria) GmbH Austria, Vienna 100.00 eur 18,407 1,008
dhl Global Forwarding (Belgium) nv Belgium, Zaventem 100.00 eur 16,140 3,953
dhl Global Forwarding (cz) s. r. o. Czech Republic, Prague 100.00 eur 25,218 1,912
dhl Global Forwarding (Denmark) a / s Denmark, Kastrup 100.00 eur 11,972 266
dhl Global Forwarding (Finland) Oy Finland, Vantaa 100.00 eur 4,693 2,771
dhl Global Forwarding (France) sas France, La Plaine Saint-Denis 100.00 eur 49,556 7,929
dhl Global Forwarding (Ireland) Limited Ireland, Dublin 100.00 eur 9,401 2,647
dhl Global Forwarding (Italy) S. p. A. Italy, Milan 100.00 eur 48,995 16,985
dhl Global Forwarding (Luxembourg) s. a. Luxembourg, Luxembourg 100.00 eur 1,799 438
dhl Global Forwarding (Netherlands) b. v. Netherlands, Hoofddorp 100.00 eur 19,985 10,050
dhl Global Forwarding (Norway) as Norway, Gardermoen 100.00 eur 445 –1,275
dhl Global Forwarding (sweden) ab Sweden, Kista 100.00 eur 18,048 3,985
dhl Global Forwarding (uk) Limited United Kingdom, Staines 100.00 eur 157,847 36,127
dhl Global Forwarding GmbH 6, 9 Germany, Frankfurt / Main 100.00 eur 14,658 0
dhl Global Forwarding Hellas s. a. of International Transportation and Logistics Greece, Piraeus 100.00 eur 5,734 – 414
dhl Global Forwarding Hungary Kft. Hungary, Vecses 100.00 eur 14,615 3,137
dhl Global Forwarding Management GmbH 6, 9 Germany, Bonn 100.00 eur 25 0
dhl Global Forwarding Portugal, Lda. Portugal, Moreira da Maia 100.00 eur 3,678 1,276
dhl Global Forwarding Sp. z o. o. Poland, Lodz 100.00 eur 8,627 3,321
dhl Global Forwarding Spain, s. l. u. Spain, Madrid 100.00 eur 19,144 6,061
dhl Global Mail (uk) Limited United Kingdom, Bracknell 100.00 eur – 42,408 –26,300
dhl Global Mail Nordic ab Sweden, Stockholm 100.00 eur 1,268 1,045
dhl Global Mail ooo Russia, Moscow 100.00 eur 6 –22
dhl Global Management GmbH 6, 9 Germany, Bonn 100.00 eur 3,618,590 0
dhl Group Services nv / sa Belgium, Zaventem 100.00 eur 1,369 3
dhl Holding (France) sas France, Roissy-en-France 100.00 eur 761,551 14,019
dhl Holding (Italy) S. r. l. Italy, Milan 100.00 eur 254,299 13,721
dhl Holdings (Ireland) Ltd. Ireland, Dublin 100.00 eur 93 0
dhl Home Delivery GmbH 6, 9 Germany, Bonn 100.00 eur 179 0
dhl Hub Leipzig GmbH 6, 9 Germany, Schkeuditz 100.00 eur 3,412 0
dhl Information Services (Europe) s. r. o. Czech Republic, Prague 100.00 eur 84,488 4,566
dhl Inter Limited 5 United Kingdom, Moss End 100.00 eur 0 0
dhl International (Albania) Ltd. Albania, Tirana 100.00 eur 403 153
dhl International (Ireland) Ltd. Ireland, Dublin 100.00 eur 1,055 6
dhl International (Romania) s. r. l. Romania, Bucharest 100.00 eur 3,221 849
dhl International (uk) Limited United Kingdom, Hounslow 100.00 eur 38,624 7,917
dhl International (Ukraine) jsc Ukraine, Kiev 100.00 eur 2,502 229
dhl International ab 8 Sweden, Stockholm 100.00 eur 4,100 0
dhl International b. v. Netherlands, The Hague 100.00 eur 11,604 4,795
dhl International d. o. o. Croatia, Zagreb 100.00 eur 2,165 295
dhl International Express (France) sas France, Roissy-en-France 100.00 eur 26,805 2,777
dhl International GmbH 6, 9 Germany, Bonn 100.00 eur 1,353,453 0
dhl International Ltd. Malta, Luqa 100.00 eur 456 21
dhl International nv / sa Belgium, Diegem 100.00 eur 11,143 2,133
dhl International zao, Russia Russia, Moscow 100.00 eur 10,663 39,570
dhl International-Sarajevo d. o. o. Bosnia and Herzegovina, Sarajevo 100.00 eur 474 115
dhl Investments Limited United Kingdom, St. Helier 100.00 eur –33,770 –2,822
Deutsche Post DHL Annual Report 2011226

Affi liated companies included in the consolidated fi nancial statements
HeadquartersGroup
equity share % CurrencyEquity
thousandsNet income thousandsName
dhl Latvia sia Latvia, Riga 100.00 eur – 8 342
dhl Logistica d. o. o. Slovenia, Brnik 100.00 eur 1,235 340
dhl Logistics (Schweiz) ag Switzerland, Basel 100.00 eur 37,679 7,456
dhl Logistics (Slovakia), spol. s r. o. Slovakia, Senec 100.00 eur 4,208 1,580
dhl Logistics (Ukraine) Ltd. Ukraine, Kiev 100.00 eur 70 –72
dhl Logistics GmbH 6, 9 Germany, Hamburg 100.00 eur 895 0
dhl Logistics ooo Russia, Chimki 100.00 eur 7,514 7,535
dhl Logistics s. r. l. Romania, Bucharest 100.00 eur 882 151
dhl Logistik Service GmbH Austria, Vienna 100.00 eur –342 741
dhl Management (Schweiz) ag Switzerland, Basel 100.00 eur 26,583 4,104
dhl Management Services Limited United Kingdom, Hounslow 100.00 eur 218 16
dhl Medjunarodni Vazdusni Ekspres d. o. o. Serbia, Belgrade 100.00 eur 2,894 456
dhl Mitry sarl France, La Plaine Saint-Denis 100.00 eur –3,428 –1,832
dhl Nordic ab Sweden, Stockholm 100.00 eur 74,989 7,859
dhl Packaging s. r. o. Czech Republic, Pohořelice 70.00 eur –116 114
dhl Pipelife Logistik GmbH Austria, Vienna 100.00 eur 107 –118
dhl Quality Cargo as Norway, Oslo 100.00 eur 973 –384
dhl Rail ab Sweden, Trelleborg 100.00 eur 436 272
dhl Sainghin sarl France, La Plaine Saint-Denis 100.00 eur –2,683 –1,466
dhl Sandouville sarl France, La Plaine Saint-Denis 100.00 eur 63 10
dhl sc Transport sasu France, La Plaine Saint-Denis 100.00 eur – 436 –1,896
dhl Service Central eurl France, La Plaine Saint-Denis 100.00 eur 1,001 1,360
dhl Services Limited United Kingdom, Milton Keynes 100.00 eur 147,947 51,099
dhl Services Logistiques sas France, La Plaine Saint-Denis 100.00 eur 4,721 –3,486
dhl Shoe Logistics s. r. o. Czech Republic, Pohořelice 100.00 eur 1,123 21
dhl Solutions (Belgium) nv Belgium, Mechelen 100.00 eur 27,348 –1,056
dhl Solutions (France) sas France, La Plaine Saint-Denis 100.00 eur 27,886 –3,603
dhl Solutions Fashion GmbH 6, 9 Germany, Essen 100.00 eur 102 0
dhl Solutions GmbH 6, 9 Germany, Hamburg 100.00 eur 9,240 0
dhl Solutions Großgut GmbH 6, 9 Germany, Bonn 100.00 eur 1,051 0
dhl Solutions Retail GmbH 6, 9 Germany, Unna 100.00 eur 49 0
dhl Solutions s. r. o. Czech Republic, Ostrava 100.00 eur 6,350 259
dhl Stenvreten Kommanditbolag Sweden, Stockholm 100.00 eur –1,712 0
dhl Stock Express sas France, La Plaine Saint-Denis 100.00 eur 5,155 – 5,669
dhl Strasbourg sarl France, La Plaine Saint-Denis 100.00 eur – 58 –280
dhl Supply Chain (Belgium) nv Belgium, Mechelen 100.00 eur 5,037 –1,048
dhl Supply Chain (Ireland) Limited Ireland, Dublin 100.00 eur 14,354 815
dhl Supply Chain (Italy) S. p. A. Italy, Milan 100.00 eur 37,665 – 65
dhl Supply Chain (Netherlands) b. v. Netherlands, Tilburg 100.00 eur 67,855 10,161
dhl Supply Chain (Norway) as Norway, Oslo 100.00 eur 5,935 3,457
dhl Supply Chain Management b. v. Netherlands, Tilburg 100.00 eur –27,624 1,175
dhl Supply Chain Management GmbH 6, 9 Germany, Bonn 100.00 eur 25 0
dhl Supply Chain, s. r. o. Czech Republic, Pohořelice 100.00 eur 8,739 2,152
dhl Systems Limited United Kingdom, Milton Keynes 100.00 eur 207 196
dhl Technical Distribution b. v. Netherlands, Veghel 100.00 eur –2,132 – 41
dhl Trade Fairs & Events GmbH 6, 9 Germany, Frankfurt / Main 100.00 eur 607 0
dhl Trade Fairs and Events (uk) Limited United Kingdom, Staines 85.00 eur 355 164
dhl Vehicle Services (uk) Limited United Kingdom, Hounslow 100.00 eur 0 1,796
dhl Vertriebs GmbH & Co. ohg 6, 9 Germany, Bonn 100.00 eur 45,000 0
dhl Verwaltungs GmbH 6, 9 Germany, Bonn 100.00 eur 162 0
dhl Voigt International GmbH Germany, Neumünster 51.00 eur 1,379 1,050
dhl Wahl International GmbH Germany, Bielefeld 51.00 eur 1,121 415
Reported ifrs data.1 Only subgroup data available. 2 Amounts from 2009. 3 Amounts from 2010. 4 Data not available. 5 Dormant. 6 Amounts after profi t transfer. 7 a Inclusion in accordance with ias 27.13 (a). 7 b Inclusion in accordance with ias 27.13 (b – d). 8 In liquidation. 9 Local gaap. 10 Voting rights. 11 Company is included in group fi nancial statements of Deutsche Postbank ag. 12 Amounts from 2008. 13 Inclusion in accordance with sic 12 (spe). 14 Not included because they do not have signifi cant infl uence on the Group’s net assets, fi nancial position and results of operations.
Deutsche Post DHL Annual Report 2011
Consolidated Financial StatementsNotes
Other disclosures
227

Affi liated companies included in the consolidated fi nancial statements
HeadquartersGroup
equity share % CurrencyEquity
thousandsNet income thousandsName
dhl Worldwide Express Logistics nv / sa Belgium, Diegem 100.00 eur 21,125 3,330
dhl Worlwide Network nv / sa Belgium, Diegem 100.00 eur 20,759 1,223
dz Specialties b. v. Netherlands, Utrecht 100.00 eur 87,685 4,674
Erste End of Runway Development Leipzig GmbH 6, 9 Germany, Cologne 100.00 eur 25 0
Erste Logistik Entwicklungsgesellschaft mg GmbH 6, 9 Germany, Hanover 100.00 eur 25 0
Eurodifarm S. r. l. Italy, Casalmaiocco (Lodi) 100.00 eur 7,221 2,195
European Air Transport Leipzig GmbH 6, 9 Germany, Schkeuditz 100.00 eur 1,798 0
Exel (European Services Centre) Ltd. 5 Ireland, Dublin 100.00 eur 0 0
Exel (Wommelgem) nv Belgium, Wommelgem 100.00 eur – 4,195 –778
Exel Czech Republic s. r. o. 5 Czech Republic, Prague 100.00 eur 382 0
Exel de Portugal Transitários Lda. Portugal, Lisbon 100.00 eur 86 – 5
Exel Eiendom as Norway, Oslo 100.00 eur 12,582 366
Exel Environmental Developments Limited United Kingdom, Bracknell 100.00 eur 0 –1
Exel Europe Limited United Kingdom, Milton Keynes 100.00 eur 376,903 81,994
Exel Finance (1986) Limited 5 United Kingdom, Bedford 100.00 eur 0 0
Exel Finance Limited United Kingdom, Bedford 100.00 eur 372 68
Exel France sa France, La Plaine Saint-Denis 100.00 eur 158,586 15,247
Exel Freight Management (uk) Limited United Kingdom, Bracknell 100.00 eur 13,025 5,294
Exel Freight sas France, Roissy-en-France 100.00 eur 303 244
Exel Group Holdings (Nederland) b. v. Netherlands, Veghel 100.00 eur 50,637 –1,168
Exel Head Offi ce Services Limited 5 United Kingdom, Bedford 100.00 eur 0 0
Exel Healthcare (Belgium) nv Belgium, Mechelen 100.00 eur 81,268 24,638
Exel Holdings Limited United Kingdom, Bedford 100.00 eur 760,709 53,511
Exel Insurance Limited United Kingdom, St. Peter Port 100.00 eur 8,219 188
Exel International Holdings (Belgium) nv Belgium, Mechelen 100.00 eur 89,813 725
Exel International Holdings (Netherlands 1) b. v. Netherlands, Veghel 100.00 eur 694,148 –1,512
Exel International Holdings (Netherlands 2) b. v. Netherlands, Veghel 100.00 eur 1,095,510 4,792
Exel Investments Limited United Kingdom, Bracknell 100.00 eur 232,992 59,497
Exel Investments Netherlands b. v. Netherlands, Veghel 100.00 eur 225 0
Exel Limited United Kingdom, Bracknell 100.00 eur 924,302 4,824
Exel Logistics (Northern Ireland) Limited United Kingdom, Mallusk 100.00 eur 14 15
Exel Logistics Property Limited United Kingdom, Bedford 100.00 eur 56,725 2,412
Exel Management Services No 2 Limited 5 United Kingdom, Bracknell 100.00 eur 0 0
Exel Overseas Limited United Kingdom, Bracknell 100.00 eur 229,037 72,135
Exel Supply Chain Solutions Ltd. Ireland, Dublin 100.00 eur 63 383
Exel uk Limited United Kingdom, Bracknell 100.00 eur 52,395 2,502
f.x. Coughlin b. v. Netherlands, Duiven 100.00 eur 2,744 396
f. x. Coughlin (u. k.) Limited United Kingdom, Bracknell 100.00 eur 3,027 488
fact Denmark a / s Denmark, Kastrup 100.00 eur 722 86
Fashion Logistics Limited United Kingdom, Bracknell 100.00 eur 1,053 617
First Mail Düsseldorf GmbH 6, 9 Germany, Düsseldorf 100.00 eur –2,242 0
Formation e-Document Solutions Limited United Kingdom, London 100.00 eur 12 0
Freight Indemnity and Guarantee Company Limited United Kingdom, Bedford 100.00 eur 20 0
Fusion Premedia Group Limited United Kingdom, London 100.00 eur –12 0
Gerlach & Co Internationale Expediteurs b. v. Netherlands, Venlo 100.00 eur 2,776 375
Gerlach & Co. nv Belgium, Antwerp 100.00 eur 5,459 287
Gerlach ag Switzerland, Basel 100.00 eur 7,367 6,301
Gerlach Customs Services eood Bulgaria, Sofi a 100.00 eur –13 14
Gerlach European Customs Services, spol. s r. o. Slovakia, Senec 100.00 eur 114 – 42
Gerlach Sp. z o. o. Poland, Gluchowo / Komorniki 100.00 eur 597 44
Gerlach Spol s. r. o. Czech Republic, Rudna u Prahy 100.00 eur 3,034 2,264
Gerlach Zolldienste GmbH 6, 9 Germany, Düsseldorf 100.00 eur 102 0
Giorgio Gori S. r. l. Italy, Collesalvetti (Livorno) 60.00 eur 20,756 7,726
Giorgio Gori (France) sas France, Châtenoy-le-Royal 100.00 eur 1,484 315
Global Mail (Austria) Ges. m. b. H. Austria, Vienna 100.00 eur 1,703 51
Gori Iberia s. l. Spain, Barcelona 100.00 eur 1,757 851
Deutsche Post DHL Annual Report 2011228

Affi liated companies included in the consolidated fi nancial statements
HeadquartersGroup
equity share % CurrencyEquity
thousandsNet income thousandsName
Gori Iberia Transitários, Limitada Portugal, Matosinhos 60.00 eur 834 468
Güll GmbH Germany, Lindau (Lake Constance) 51.00 eur 3,250 569
Henderson Line Limited 8 United Kingdom, Glasgow 100.00 eur 121 0
Higgs International Limited United Kingdom, Bracknell 100.00 eur 13,691 505
Historia Sp. z o. o. 8 Poland, Piaseczno 100.00 eur –143 0
Hull, Blyth (Angola) Limited United Kingdom, Bracknell 100.00 eur – 6,548 –1,405
Hyperion Properties Limited 5 United Kingdom, Bedford 100.00 eur – 5,363 0
Interlanden b. v. 1 Netherlands, Apeldoorn 100.00 eur –21,586 6,478
Wegener Transport b. v. 1 Netherlands, Apeldoorn 70.00 eur – –
interServ Gesellschaft für Personal- und Beraterdienstleistungen mbH 6, 9 Germany, Bonn 100.00 eur 76 0
itg Global Logistics b. v. Netherlands, Amsterdam 100.00 eur 479 –140
itg GmbH Internationale Spedition und Logistik 6, 9 Germany, Schwaig / Oberding 100.00 eur 2,494 0
itg Internationale Spedition GmbH Austria, Vienna 100.00 eur 59 7
Joint Retail Logistics Limited United Kingdom, Bracknell 100.00 eur 0 993
Kampton Ireland, Cork 100.00 eur – 90 –12
Karukera Transit sas France, Pointe-à-Pitre 100.00 eur 1,190 –163
Laible ag Speditionen Switzerland, Schaffhausen 100.00 eur 1,275 767
llc Customs Broker Russia, Khimki 100.00 eur –14 –23
llc Customs Services Russia, Khimki 100.00 eur 509 499
llc dhl Express Russia, Khimki 100.00 eur –350 –364
llc Williams Lea Russia, Moscow 100.00 eur –216 –194
McGregor Cory Limited United Kingdom, Bracknell 100.00 eur 19,829 4,019
McGregor Sea & Air Services Limited United Kingdom, Bracknell 100.00 eur 359 0
Mercury Holdings Limited United Kingdom, Bracknell 100.00 eur 1,912 0
Multimar Seefrachtenkontor Gesellschaft m. b. H. Austria, Vienna 100.00 eur 278 0
National Carriers Limited United Kingdom, Bedford 100.00 eur 45 42
nfc International Holdings (Ireland) Ireland, Dublin 100.00 eur 39,467 883
nugg.ad ag predictive behavioral targeting Germany, Berlin 100.00 eur 1,229 955
Ocean Group Investments Limited United Kingdom, Bracknell 100.00 eur 16,640 5,793
Ocean Overseas (Luxembourg) Sarl Luxembourg, Luxembourg 100.00 eur 1,858 4,748
Ocean Overseas Holdings Limited United Kingdom, Bracknell 100.00 eur 476,073 54,243
Orbital Secretaries Limited 5 United Kingdom, Hounslow 100.00 eur 0 0
Outrack Credit (uk) Limited 5 United Kingdom, Hounslow 100.00 eur 1 0
Pharma Logistics b. v. Netherlands, Rotterdam 100.00 eur 359 16
Pharma Logistics nv Belgium, Mechelen 100.00 eur 12,254 2,179
Power Europe (Cannock) Limited United Kingdom, Bracknell 100.00 eur 1,366 2,577
Power Europe (Doncaster) Limited United Kingdom, Bracknell 100.00 eur 1,049 1,073
Power Europe Development Limited United Kingdom, Bracknell 100.00 eur 0 0
Power Europe Development No. 3 Limited United Kingdom, Bracknell 100.00 eur 450 502
Power Europe Limited United Kingdom, Bracknell 100.00 eur –1,086 – 526
Power Europe Operating Limited United Kingdom, Bracknell 100.00 eur 8,827 2,297
ppl cz s. r. o. Czech Republic, Prague 100.00 eur 85,399 10,100
Presse-Service Güll GmbH Switzerland, St. Gallen 51.00 eur 856 335
rdc Properties Limited United Kingdom, Bracknell 100.00 eur 49 46
Rosier Tankers Limited 5 United Kingdom, Hounslow 100.00 eur –3,213 0
Ross House (al) Limited 5 United Kingdom, Bracknell 100.00 eur 359 0
Scherbauer Spedition GmbH 7b Germany, Neutraubling 50.00 eur 4,388 1,601
Selektvracht b. v. Netherlands, Utrecht 100.00 eur 12,660 4,493
sgb Speditionsgesellschaft mbH 6, 9 Germany, Munich 100.00 eur 3,812 0
Smoke and Mirrors Productions Limited United Kingdom, London 100.00 eur 6,426 970
Speedmail International Limited 5 United Kingdom, London 100.00 eur 10,461 0
Reported ifrs data.1 Only subgroup data available. 2 Amounts from 2009. 3 Amounts from 2010. 4 Data not available. 5 Dormant. 6 Amounts after profi t transfer. 7 a Inclusion in accordance with ias 27.13 (a). 7 b Inclusion in accordance with ias 27.13 (b – d). 8 In liquidation. 9 Local gaap. 10 Voting rights. 11 Company is included in group fi nancial statements of Deutsche Postbank ag. 12 Amounts from 2008. 13 Inclusion in accordance with sic 12 (spe). 14 Not included because they do not have signifi cant infl uence on the Group’s net assets, fi nancial position and results of operations.
Deutsche Post DHL Annual Report 2011
Consolidated Financial StatementsNotes
Other disclosures
229
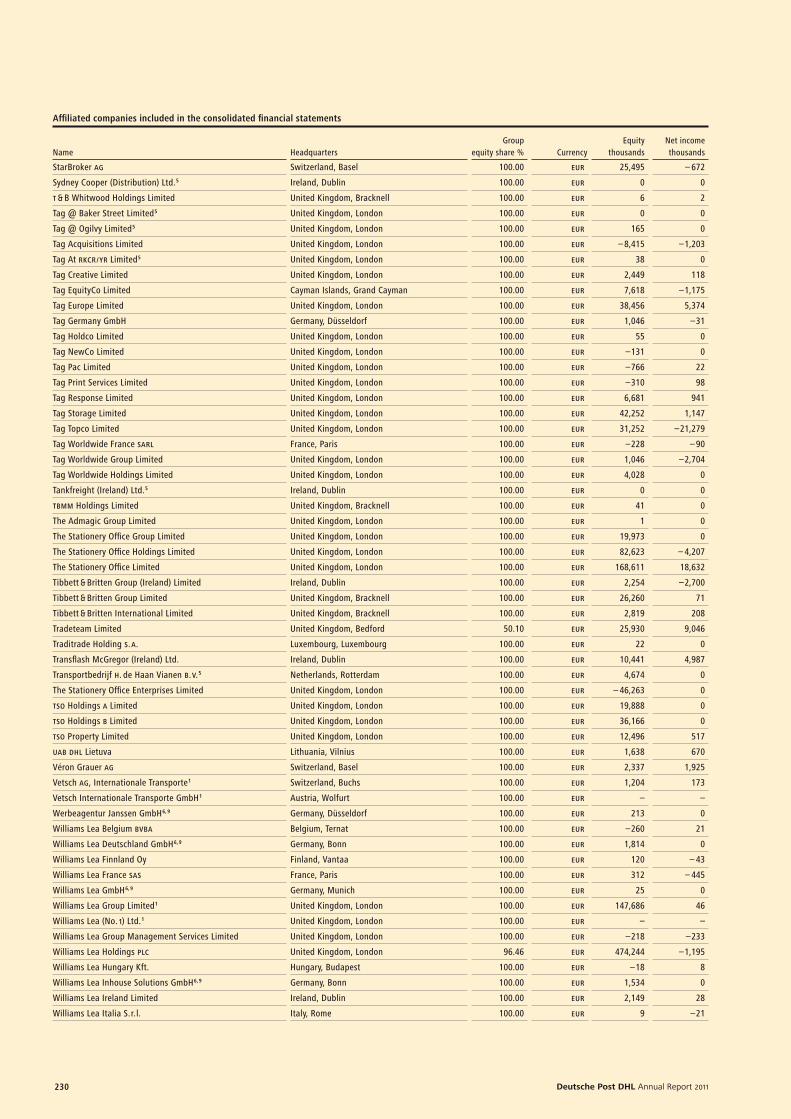
Affi liated companies included in the consolidated fi nancial statements
HeadquartersGroup
equity share % CurrencyEquity
thousandsNet income thousandsName
StarBroker ag Switzerland, Basel 100.00 eur 25,495 – 672
Sydney Cooper (Distribution) Ltd. 5 Ireland, Dublin 100.00 eur 0 0
t & B Whitwood Holdings Limited United Kingdom, Bracknell 100.00 eur 6 2
Tag @ Baker Street Limited 5 United Kingdom, London 100.00 eur 0 0
Tag @ Ogilvy Limited 5 United Kingdom, London 100.00 eur 165 0
Tag Acquisitions Limited United Kingdom, London 100.00 eur – 8,415 –1,203
Tag At rkcr / yr Limited 5 United Kingdom, London 100.00 eur 38 0
Tag Creative Limited United Kingdom, London 100.00 eur 2,449 118
Tag EquityCo Limited Cayman Islands, Grand Cayman 100.00 eur 7,618 –1,175
Tag Europe Limited United Kingdom, London 100.00 eur 38,456 5,374
Tag Germany GmbH Germany, Düsseldorf 100.00 eur 1,046 –31
Tag Holdco Limited United Kingdom, London 100.00 eur 55 0
Tag NewCo Limited United Kingdom, London 100.00 eur –131 0
Tag Pac Limited United Kingdom, London 100.00 eur –766 22
Tag Print Services Limited United Kingdom, London 100.00 eur –310 98
Tag Response Limited United Kingdom, London 100.00 eur 6,681 941
Tag Storage Limited United Kingdom, London 100.00 eur 42,252 1,147
Tag Topco Limited United Kingdom, London 100.00 eur 31,252 –21,279
Tag Worldwide France sarl France, Paris 100.00 eur –228 – 90
Tag Worldwide Group Limited United Kingdom, London 100.00 eur 1,046 –2,704
Tag Worldwide Holdings Limited United Kingdom, London 100.00 eur 4,028 0
Tankfreight (Ireland) Ltd. 5 Ireland, Dublin 100.00 eur 0 0
tbmm Holdings Limited United Kingdom, Bracknell 100.00 eur 41 0
The Admagic Group Limited United Kingdom, London 100.00 eur 1 0
The Stationery Offi ce Group Limited United Kingdom, London 100.00 eur 19,973 0
The Stationery Offi ce Holdings Limited United Kingdom, London 100.00 eur 82,623 – 4,207
The Stationery Offi ce Limited United Kingdom, London 100.00 eur 168,611 18,632
Tibbett & Britten Group (Ireland) Limited Ireland, Dublin 100.00 eur 2,254 –2,700
Tibbett & Britten Group Limited United Kingdom, Bracknell 100.00 eur 26,260 71
Tibbett & Britten International Limited United Kingdom, Bracknell 100.00 eur 2,819 208
Tradeteam Limited United Kingdom, Bedford 50.10 eur 25,930 9,046
Traditrade Holding s. a. Luxembourg, Luxembourg 100.00 eur 22 0
Transfl ash McGregor (Ireland) Ltd. Ireland, Dublin 100.00 eur 10,441 4,987
Transportbedrijf h. de Haan Vianen b. v. 5 Netherlands, Rotterdam 100.00 eur 4,674 0
The Stationery Offi ce Enterprises Limited United Kingdom, London 100.00 eur – 46,263 0
tso Holdings a Limited United Kingdom, London 100.00 eur 19,888 0
tso Holdings b Limited United Kingdom, London 100.00 eur 36,166 0
tso Property Limited United Kingdom, London 100.00 eur 12,496 517
uab dhl Lietuva Lithuania, Vilnius 100.00 eur 1,638 670
Véron Grauer ag Switzerland, Basel 100.00 eur 2,337 1,925
Vetsch ag, Internationale Transporte 1 Switzerland, Buchs 100.00 eur 1,204 173
Vetsch Internationale Transporte GmbH 1 Austria, Wolfurt 100.00 eur – –
Werbeagentur Janssen GmbH 6, 9 Germany, Düsseldorf 100.00 eur 213 0
Williams Lea Belgium bvba Belgium, Ternat 100.00 eur –260 21
Williams Lea Deutschland GmbH 6, 9 Germany, Bonn 100.00 eur 1,814 0
Williams Lea Finnland Oy Finland, Vantaa 100.00 eur 120 – 43
Williams Lea France sas France, Paris 100.00 eur 312 – 445
Williams Lea GmbH 6, 9 Germany, Munich 100.00 eur 25 0
Williams Lea Group Limited 1 United Kingdom, London 100.00 eur 147,686 46
Williams Lea (No. 1) Ltd. 1 United Kingdom, London 100.00 eur – –
Williams Lea Group Management Services Limited United Kingdom, London 100.00 eur –218 –233
Williams Lea Holdings plc United Kingdom, London 96.46 eur 474,244 –1,195
Williams Lea Hungary Kft. Hungary, Budapest 100.00 eur –18 8
Williams Lea Inhouse Solutions GmbH 6, 9 Germany, Bonn 100.00 eur 1,534 0
Williams Lea Ireland Limited Ireland, Dublin 100.00 eur 2,149 28
Williams Lea Italia S. r. l. Italy, Rome 100.00 eur 9 –21
Deutsche Post DHL Annual Report 2011230

Affi liated companies included in the consolidated fi nancial statements
HeadquartersGroup
equity share % CurrencyEquity
thousandsNet income thousandsName
Williams Lea Limited United Kingdom, London 100.00 eur 64,073 8,658
Williams Lea Netherlands b. v. Netherlands, Amsterdam 100.00 eur –1,379 –770
Williams Lea s. l. Spain, Barcelona 100.00 eur 9 –155
Williams Lea Sweden ab Sweden, Nyköping 100.00 eur 882 –3
Williams Lea uk Limited United Kingdom, London 100.00 eur 384 22
Williams Lea Ukraine Ukraine, Kiev 100.00 eur 133 43
Williams Lea, s. r. o. Czech Republic, Brno 100.00 eur 1,800 – 9
World Writers Limited United Kingdom, London 100.00 eur 8,747 1,466
Zweite Logistik Entwicklungsgesellschaft mg GmbH 6, 9 Germany, Bonn 100.00 eur 25 0
Americas
Advance Logistics Inc. usa, Westerville 100.00 eur 307 375
aei Drawback Services Inc. usa, Miami 100.00 eur 11,319 1,081
Aero Express del Ecuador (TransAm) Ltda. Ecuador, Guayaquil 100.00 eur 1,923 407
Aero Express del Ecuador TransAm Cia Ltd. (Colombian Branch) Colombia, Bogotá 100.00 eur 503 493
Agencia de Aduanas dhl Express Colombia Ltda. Colombia, Bogotá 100.00 eur 2,058 – 42
agencia de aduanas dhl global forwarding (colombia) s. a. nivel 1 Colombia, Bogotá 100.00 eur 2,816 –229
Air Express International usa, Inc. usa, Miami 100.00 eur –33,993 –16,578
astar Air Cargo Holdings, llc usa, Miami 100.00 eur –188,424 –205
Circuit Logistics Inc. Canada, Toronto 100.00 eur 155 125
Compass Logistics Inc. usa, Westerville 100.00 eur – 4 0
Connect Logistics Services Inc. Canada, Toronto 100.00 eur 2,424 5,593
Danzas Corporation usa, Miami 100.00 eur –29,987 2,443
dhl (Bahamas) Limited Bahamas, Nassau 100.00 eur 949 – 85
dhl (Barbados) Ltd. Barbados, Christ Church 100.00 eur 1,625 – 60
dhl (Bolivia) srl Bolivia, Santa Cruz de la Sierra 100.00 eur 6,539 1,412
dhl (bvi) Ltd. British Virgin Islands, Tortola 100.00 eur 1,679 29
dhl (Costa Rica) s. a. Costa Rica, San José 100.00 eur 12,274 – 4,068
dhl (Honduras) s. a. de c. v. Honduras, San Pedro Sula 100.00 eur 5,524 2,112
dhl (Jamaica) Ltd. Jamaica, Kingston 100.00 eur 1,164 –28
dhl (Paraguay) s. r. l. Paraguay, Asunción 100.00 eur 6,433 2,278
dhl (Trinidad and Tobago) Limited Trinidad and Tobago, Port of Spain 100.00 eur –178 –16
dhl (Uruguay) s. r. l. Uruguay, Montevideo 100.00 eur 9,980 4,060
dhl Aero Expresso s. a. 7a Panama, Panama City 49.00 eur 23,363 2,110
dhl Arwest (Panama) s. a. 1 Panama, Panama City 100.00 eur –3,138 349
Corporación Arwest de Mexico s. a. de c. v. 1 Mexico, Mexico City 100.00 eur – –
dhl Arwest (Guatemala) s. a. 1 Guatemala, Guatemala City 100.00 eur – –
dhl Arwest de Mexico s. a. de c. v. 1 Mexico, Ecatepec 100.00 eur – –
dhl Aviation (Costa Rica) s. a. Costa Rica, San José 100.00 eur 2,136 303
dhl Aviation Americas, Inc. usa, Plantation 100.00 eur 1,633 61
dhl Corporate Services sc México Mexico, Tepotzotlán 100.00 eur 5,412 –1,072
dhl Customer Support (Costa Rica) s. a. Costa Rica, San José 100.00 eur 87 437
dhl Customs (Costa Rica) s. a. Costa Rica, San José 100.00 eur –1,057 –1,394
dhl Customs Brokerage Ltd. Canada, Mississauga 100.00 eur –1,404 – 966
dhl de Guatemala s. a. 7a Guatemala, Guatemala City 49.00 eur 12,243 1,365
dhl Dominicana sa Dominican Republic, Santo Domingo 100.00 eur 2,126 –141
dhl Exel Supply Chain (Argentina) s. a. Argentina, Buenos Aires 100.00 eur 3,878 – 5,981
dhl Express (Argentina) s. a. Argentina, Buenos Aires 100.00 eur 13,175 1,692
dhl Express (Brazil) Ltda. Brazil, São Paulo 100.00 eur 22,247 10,252
dhl Express (Canada) Ltd. Canada, Mississauga 100.00 eur –215,703 –22,217
dhl Express (Chile) Ltda. Chile, Santiago de Chile 100.00 eur 33,975 19,514
dhl Express (Ecuador) s. a. Ecuador, Quito 100.00 eur 5,404 2,297
Reported ifrs data.1 Only subgroup data available. 2 Amounts from 2009. 3 Amounts from 2010. 4 Data not available. 5 Dormant. 6 Amounts after profi t transfer. 7 a Inclusion in accordance with ias 27.13 (a). 7 b Inclusion in accordance with ias 27.13 (b – d). 8 In liquidation. 9 Local gaap. 10 Voting rights. 11 Company is included in group fi nancial statements of Deutsche Postbank ag. 12 Amounts from 2008. 13 Inclusion in accordance with sic 12 (spe). 14 Not included because they do not have signifi cant infl uence on the Group’s net assets, fi nancial position and results of operations.
Deutsche Post DHL Annual Report 2011
Consolidated Financial StatementsNotes
Other disclosures
231

Affi liated companies included in the consolidated fi nancial statements
HeadquartersGroup
equity share % CurrencyEquity
thousandsNet income thousandsName
dhl Express (El Salvador) s. a. de c. v. 1 El Salvador, San Salvador 100.00 eur 2,649 1,584
dhl Logistics de El Salvador s. a. de c. v. 1 El Salvador, San Salvador 100.00 eur – –
dhl Express (usa), Inc. usa, Plantation 100.00 eur 50,701 34,858
dhl Express Aduanas Peru s. a. c. Peru, Callao 100.00 eur 2,199 370
dhl Express Aduanas Venezuela c. a. Venezuela, Caracas 100.00 eur 2,313 1,637
dhl Express Colombia Ltda. Colombia, Bogotá 100.00 eur 7,216 2,764
dhl Express México, s. a. de c. v. Mexico, Mexico City 100.00 eur 25,147 18,878
dhl Express Peru s. a. c. Peru, Callao 100.00 eur 12,078 2,545
dhl Fletes Aereos, c. a. Venezuela, Caracas 100.00 eur 13,869 4,002
dhl Freight usa Inc. usa, Plantation 100.00 eur –3,966 –2,022
dhl Global Customer Solutions (usa) Inc. usa, Plantation 100.00 eur 2,169 962
dhl Global Forwarding (Argentina) s. a. Argentina, Buenos Aires 100.00 eur 7,016 404
dhl Global Forwarding (Canada) Inc. Canada, Mississauga 100.00 eur 63,319 5,393
dhl Global Forwarding (Chile) s. a. Chile, Santiago de Chile 100.00 eur 16,927 2,658
dhl Global Forwarding (Colombia) Ltda. Colombia, Bogotá 100.00 eur 2,261 – 54
dhl Global Forwarding (Ecuador) s. a. Ecuador, Quito 100.00 eur 1,173 –1,766
dhl Global Forwarding (El Salvador) s. a. 1 El Salvador, San Salvador 100.00 eur 1,000 286
dhl Zona Franca El Salvador s. a. 1 El Salvador, Antiguo Cuscatlán 100.00 eur – –
dhl Global Forwarding (Guatemala) s. a. 1 Guatemala, Guatemala City 100.00 eur 4,703 1,210
Carga Aerea Internacional s. a. (carinter) 1 Guatemala, Guatemala City 100.00 eur – –
dhl Zona Franca (Guatemala) s. a. 1 Guatemala, Guatemala City 100.00 eur – –
Transportes Expresos Internacionales (Interexpreso) s. a. 1 Guatemala, Guatemala City 100.00 eur – –
dhl Global Forwarding (Mexico) s. a. de c. v. Mexico, Mexico City 100.00 eur 15,202 4,458
dhl Global Forwarding (Nicaragua) s. a. Nicaragua, Managua 100.00 eur 47 95
dhl Global Forwarding (Panama) s. a. 1 Panama, Panama City 100.00 eur 3,761 242
dhl Holding Panama Inc. 1 Panama, Panama City 100.00 eur – –
dhl Global Forwarding Deposito Aduanero (Colombia) s. a. Colombia, Bogotá 100.00 eur 3,098 847
dhl Global Forwarding Management Latin America Inc. usa, Coral Gables 100.00 eur 620 0
dhl Global Forwarding Peru s. a. 1 Peru, Lima 100.00 eur 4,448 717
dhl Global Forwarding Aduanas Peru s. a. 1 Peru, Callao 100.00 eur – –
dhl Global Forwarding Venezuela, c. a. Venezuela, Caracas 100.00 eur 14,536 10,909
dhl Global Forwarding Zona Franca (Colombia) s. a. Colombia, Bogotá 100.00 eur –377 –2,754
dhl Holding Central America Inc. 1 Panama, Panama City 100.00 eur 45,364 5,913
Lagents & Co. srl 1, 7b Costa Rica, San José 50.00 eur – –
dhl Information Services (Americas), Inc. usa, Plantation 100.00 eur 1,907 450
dhl International Antilles sarl Martinique, Le Lamentin 100.00 eur – 663 – 52
dhl International Express Ltd. Canada, Mississauga 100.00 eur 79,988 – 410
dhl International Haiti sa Haiti, Port-au-Prince 100.00 eur 211 –174
dhl Logistics (Brazil) Ltda. Brazil, São Paulo 100.00 eur 63,083 43,149
dhl Management Cenam s. a. Costa Rica, Heredia 100.00 eur 3,362 – 45
dhl Metropolitan Logistics sc Mexico s. a. de c. v. Mexico, Tepotzotlán 100.00 eur 10,560 –30
dhl Network Operations (usa), Inc. usa, Plantation 100.00 eur –190,308 – 4,215
dhl Nicaragua, s. a. Nicaragua, Managua 100.00 eur 743 42
dhl of Curacao n. v. Dutch Antilles, Curaçao 100.00 eur 555 – 402
dhl Panama s. a. Panama, Panama City 100.00 eur 2,702 200
dhl Regional Services, Inc. usa, Plantation 100.00 eur 1,719 1,077
dhl s. a. Guatemala, Guatemala City 100.00 eur 2,718 98
dhl Sint Maarten n. v. Dutch Antilles, Philipsburg 100.00 eur 1,517 313
dhl Solutions (usa), Inc. usa, Westerville 100.00 eur –17,765 –316
dhl Worldwide Express (Aruba) nv 5 Aruba, Oranjestad 100.00 eur 5 0
Dimalsa Logistics Inc. Puerto Rico, San Juan 100.00 eur 1,216 445
dpwn Financing (usa) 1, llc usa, Plantation 100.00 eur 0 0
dpwn Financing (usa) 2, llc usa, Plantation 100.00 eur 0 0
dpwn Financing (usa), lp usa, Plantation 100.00 eur 1,737 763
dpwn Holdings (usa), Inc. usa, Plantation 100.00 eur 5,164,537 –16,098
Exel Automocion s. a. de c. v. Mexico, Tepotzotlán 100.00 eur 9,919 2,361
Deutsche Post DHL Annual Report 2011232

Affi liated companies included in the consolidated fi nancial statements
HeadquartersGroup
equity share % CurrencyEquity
thousandsNet income thousandsName
Exel Canada Ltd. Canada, Toronto 100.00 eur 2,758 6,074
dhl Supply Chain (Chile) s. a. Chile, Santiago 100.00 eur 2,400 567
ec Logistica s. a. Argentina, Buenos Aires 51.00 eur 210 129
Exel Direct Inc. usa, Westerville 100.00 eur 33,082 –1,642
Exel Global Logistics do Brasil s. a. Brazil, São Paulo 100.00 eur 4,041 – 40
Exel Global Logistics Inc. usa, Palm City 100.00 eur –790 – 4
Exel Inc. usa, Westerville 100.00 eur 164,776 30,361
Exel Investments Inc. usa, Wilmington 100.00 eur 641,414 25,126
Exel Logistics Argentina s. a. Argentina, Buenos Aires 100.00 eur 518 –13
Exel Logistics do Nordeste Ltda. Brazil, Camaçari 100.00 eur 2,483 –2,061
Exel Supply Chain Services de México, s. a. de c. v. Mexico, Tepotzotlán 100.00 eur – 882 – 598
f. x. Coughlin do Brasil Ltda. Brazil, São Paulo 100.00 eur – 5,660 0
Freshlink Canada Ltd. Canada, Toronto 100.00 eur 190 –186
Galaxy Logistics Inc. usa, Westerville 100.00 eur – 5,451 – 405
Genesis Logistics Inc. usa, Westerville 100.00 eur 17,121 4,881
Giorgio Gori usa, Inc. usa, Baltimore 100.00 eur 5,634 2,129
Global Mail, Inc. usa, Weston 100.00 eur 113,330 2,180
Global Mail Terminal Operations (usa) llc 8 usa, Weston 100.00 eur 0 0
Gori Argentina s. a. Argentina, Mendoza 96.76 eur 1,883 1,026
gori chile s. a. Chile, Santiago de Chile 99.00 eur 5,577 913
Harmony Logistics Canada Inc. Canada, Toronto 100.00 eur 629 740
Harvest Logistics Inc. usa, Westerville 100.00 eur 396 361
Heartland Logistics Inc. usa, Westerville 100.00 eur 1,000 572
Hyperion Inmobilaria s. a. de c. v. Mexico, Tepotzotlán 100.00 eur 3,034 337
Ibryl Inc. Cayman Islands, George Town 100.00 eur –28,312 –1,285
Integracion Aduanera s. a. Costa Rica, San José 51.00 eur 530 –27
itg International Transports, Inc. usa, Boston 100.00 eur 555 42
LifeConEx llc usa, Plantation 100.00 eur –2,208 – 615
Llano Logistics lp usa, Westerville 100.00 eur 3,390 –107
Marias Falls Insurance Co., Ltd. Bermuda, Hamilton 100.00 eur 33,840 1,956
Matrix Logistics Inc. usa, Westerville 100.00 eur 0 0
Matrix Logistics Services Ltd. Canada, Toronto 100.00 eur 128 604
Mercury Airfreight International Inc. usa, Avenel 100.00 eur 777 55
Mercury Holdings Inc. usa, Avenel 100.00 eur 220 0
Northstar Logistics Inc. 5 usa, Westerville 100.00 eur 0 0
Pinnacle Logistics Inc. 5 usa, Westerville 100.00 eur 0 0
Polar Air Cargo Worldwide, Inc. 7b usa, Purchase 49.00 eur 10,151 –124
Relay Logistics Inc. Canada, Toronto 100.00 eur –228 –231
Saturn Integrated Logistics Inc. Canada, Toronto 100.00 eur 166 405
scm Supply Chain Management Inc. Canada, Toronto 100.00 eur 8,534 3,952
Sky Courier, Inc. usa, Sterling 100.00 eur 15,325 5,571
South Bay Terminals llc usa, Westerville 100.00 eur –7,234 175
Standard Forwarding llc usa, East Moline 100.00 eur 6,276 720
Summit Logistics Inc. Canada, Toronto 100.00 eur 312 1,614
Tag São Paulo Serviço de Consultória Ltda. Brazil, São Paulo 100.00 eur –186 –154
Tag Worldwide (usa) Inc. usa, New York 100.00 eur 4,428 1,002
Tag Worldwide Canada Inc. 5 Canada, Richmond Hill 100.00 eur 0 0
Tafi nor s. a. Uruguay, Montevideo 100.00 eur 7 0
tedi Translogic Express Dedicated Inc. Canada, Mississauga 100.00 eur 374 356
Tibbett & Britten Group Canada Inc. Canada, Toronto 100.00 eur 1,898 58,446
Tibbett & Britten Group North America, llc usa, Westerville 100.00 eur –11,900 –219
Tracker Logistics Inc. Canada, Toronto 100.00 eur 474 353
Reported ifrs data.1 Only subgroup data available. 2 Amounts from 2009. 3 Amounts from 2010. 4 Data not available. 5 Dormant. 6 Amounts after profi t transfer. 7 a Inclusion in accordance with ias 27.13 (a). 7 b Inclusion in accordance with ias 27.13 (b – d). 8 In liquidation. 9 Local gaap. 10 Voting rights. 11 Company is included in group fi nancial statements of Deutsche Postbank ag. 12 Amounts from 2008. 13 Inclusion in accordance with sic 12 (spe). 14 Not included because they do not have signifi cant infl uence on the Group’s net assets, fi nancial position and results of operations.
Deutsche Post DHL Annual Report 2011
Consolidated Financial StatementsNotes
Other disclosures
233

Affi liated companies included in the consolidated fi nancial statements
HeadquartersGroup
equity share % CurrencyEquity
thousandsNet income thousandsName
Transcare Supply Chain Management Inc. Canada, Toronto 100.00 eur 112 59
Unidock’s Assessoria e Logistica de Materiais Ltda. Brazil, Barueri 100.00 eur 5,207 –3,318
Vensecar Internacional, c. a. Venezuela, Maiquetía 100.00 eur 20,082 1,020
Venture Logistics s. a. de c. v. Mexico, Tepotzotlán 100.00 eur 3,875 875
Western Distribution Centers Alberta Inc. Canada, Toronto 100.00 eur 1 180
Williams Lea (Brazil) Assessória Em Soluções Empresariais Ltda. Brazil, Rio de Janeiro 100.00 eur 106 –337
Williams Lea (Canada), Inc. Canada, Montréal 100.00 eur 848 155
Williams Lea Argentina s. a. Argentina, Buenos Aires 100.00 eur –327 – 62
Williams Lea Holdings, Inc. usa, Chicago 100.00 eur 52,908 0
Williams Lea Inc. usa, Chicago 100.00 eur 106,096 18,177
Williams Lea México, s. de r. l. de c. v. Mexico, Mexico City 100.00 eur –301 –11
Wilmington Air Park, llc usa, Plantation 100.00 eur –298,471 – 4,150
Zenith Logistics Inc. Canada, Toronto 100.00 eur 768 359
Asia Pacifi c
Air Express International (Malaysia) Sdn. Bhd. 7a Malaysia, Puchong 49.00 eur 2,455 102
Asia Overnight (Thailand) Ltd. Thailand, Bangkok 100.00 eur 806 109
Asia-Pacifi c Information Services Sdn. Bhd. Malaysia, Puchong 100.00 eur 22,287 1,715
Blue Dart Aviation Ltd. 13 India, Mumbai 49.00 eur 4,700 316
Blue Dart Express Limited India, Mumbai 81.03 eur 104,611 18,126
Danzas (China) Ltd. China, Hong Kong 100.00 eur – 5,325 2,371
Danzas aei (hk) Limited China, Hong Kong 100.00 eur 37 –14
Danzas aei Logistics (Shanghai) Co. Ltd. China, Shanghai 100.00 eur 2,222 –126
Danzas Intercontinental, Inc. (Philippines) 7a, 8 Philippines, Manila 40.00 eur – 82 0
Danzas pty. Limited 8 Australia, Melbourne 100.00 eur 2,909 0
danzasmal Domestic Logistics Services Sdn. Bhd. 7a Malaysia, Kuala Lumpur 49.00 eur 1,004 652
Deutsche Post Global Mail (Australia) Pty Ltd. Australia, Mascot 100.00 eur –3,612 2,862
dhl (Chengdu) Service Ltd. China, Chengdu 100.00 eur 395 –34
dhl Air Freight Forwarder Sdn. Bhd. 7a Malaysia, Kuala Lumpur 49.00 eur 2,213 – 80
dhl Asia Pacifi c Shared Services Sdn. Bhd. Malaysia, Kuala Lumpur 100.00 eur –2,622 278
dhl Aviation (Hong Kong) Ltd. China, Hong Kong 99.36 eur 8,197 416
dhl Aviation (Philippines), Inc. 8 Philippines, Makati City 100.00 eur 0 0
dhl Aviation Services (Shanghai) Co., Ltd. China, Shanghai 99.36 eur 19,282 – 4,341
dhl Danzas Air & Ocean (Cambodia) Ltd. 5 Cambodia, Phnom Penh 100.00 eur 27 0
Exel Distribution (Thailand) Ltd. Thailand, Nonthaburi 100.00 eur 21,733 1,425
dhl Exel Logistics (Malaysia) Sdh. Bhd. 7a Malaysia, Petaling Jaya 49.00 eur 2,777 194
dhl Exel Supply Chain Management Phils., Inc. Philippines, Manila 100.00 eur 1,656 144
dhl Exel Supply Chain Phils., Inc. Philippines, Manila 100.00 eur 466 – 914
dhl Express (Australia) Pty Ltd. Australia, Sydney 100.00 eur 15,847 3,509
dhl Express (Brunei) Sdn. Bhd. Brunei Darussalam, Bandar Seri Begawan 90.00 eur 521 4
dhl Express (Cambodia) Ltd. Cambodia, Phnom Penh 100.00 eur 417 147
dhl Express (Fiji) Ltd. Fiji, Suva 100.00 eur 703 120
dhl Express (Hong Kong) Limited China, Hong Kong 100.00 eur 14,993 4,191
dhl Express (India) Pvt. Ltd. India, Mumbai 100.00 eur 28,308 4,574
dhl Express (Macau) Ltd. Macau, Macau 100.00 eur 330 47
dhl Express (Malaysia) Sdn. Bhd. Malaysia, Kuala Lumpur 70.00 eur 8,849 3,204
dhl Express (New Zealand) Limited New Zealand, Auckland 100.00 eur 5,398 716
dhl Express (Papua New Guinea) Ltd Papua New Guinea, Port Moresby 100.00 eur 865 229
dhl Express (Philippines) Corp. Philippines, Makati City 100.00 eur 5,242 – 449
dhl Express (Singapore) Pte. Ltd. Singapore, Singapore 100.00 eur 125,988 4,334
dhl Express (Taiwan) Corp. Taiwan, Taipeh 100.00 eur 13,053 5,461
dhl Express (Thailand) Limited 7a Thailand, Bangkok 49.00 eur 5,115 – 48
dhl Express International (Thailand) Ltd. Thailand, Bangkok 100.00 eur 6,638 1,104
dhl Express Lda East Timor, Dili 100.00 eur 393 5
dhl Express Nepal Pvt. Ltd. Nepal, Kathmandu 100.00 eur 797 236
dhl Global Forwarding (Australia) Pty Ltd. Australia, Tullamarine 100.00 eur 69,945 16,950
Deutsche Post DHL Annual Report 2011234

Affi liated companies included in the consolidated fi nancial statements
HeadquartersGroup
equity share % CurrencyEquity
thousandsNet income thousandsName
dhl Global Forwarding (Bangladesh) Limited Bangladesh, Dhaka 100.00 eur 316 67
dhl Global Forwarding (China) Co., Ltd. China, Shanghai 100.00 eur 112,836 23,715
dhl Global Forwarding (Fiji) Limited 5 Fiji, Lautoka 100.00 eur 353 0
dhl Global Forwarding (Hong Kong) Limited China, Hong Kong 100.00 eur –73,365 3,085
dhl Global Forwarding (Korea) Ltd. South Korea, Seoul 100.00 eur 16,876 8,827
dhl Global Forwarding (Malaysia) Sdn. Bhd. Malaysia, Kuala Lumpur 100.00 eur 13,930 5,175
dhl Global Forwarding (New Zealand) Limited New Zealand, Auckland 100.00 eur 14,336 1,852
dhl Global Forwarding (Philippines) Inc. Philippines, Manila 100.00 eur 1,177 –274
dhl Global Forwarding (png) Limited 5 Papua New Guinea, Port Moresby 74.00 eur –123 0
dhl Global Forwarding (Singapore) Pte. Ltd. Singapore, Singapore 100.00 eur 96,044 16,307
dhl Global Forwarding (Singapore) Pte. Ltd., Taiwan Branch Taiwan, Taipeh 100.00 eur 6,025 5,557
dhl Global Forwarding (Thailand) Limited Thailand, Bangkok 100.00 eur 28,732 2,227
dhl Global Forwarding (Vietnam) Corporation 7a Vietnam, Ho Chi Minh City 49.00 eur 3,958 512
dhl Global Forwarding Caledonie New Caledonia, Noumea 100.00 eur 1,931 277
dhl Global Forwarding Japan k. k. Japan, Tokyo 100.00 eur 21,876 5,794
dhl Global Forwarding Lanka (Private) Limited Sri Lanka, Colombo 70.00 eur – 404 –212
dhl Global Forwarding Management (Asia Pacifi c) Pte. Ltd. Singapore, Singapore 100.00 eur 224,665 32,571
dhl Global Forwarding Pakistan (Private) Limited Pakistan, Karachi 100.00 eur 1,298 720
dhl Global Forwarding Polynesie s. a. r. l. French Polynesia, Faaa 100.00 eur 4,211 323
dhl Global Mail (Japan) k. k. Japan, Tokyo 100.00 eur 375 66
dhl Global Mail (Singapore) Pte. Ltd. Singapore, Singapore 100.00 eur 1,269 1,331
dhl Holdings (New Zealand) Limited New Zealand, Auckland 100.00 eur 12,972 5,412
dhl Incheon Hub Limited (Korea) South Korea, Incheon 100.00 eur 7,151 763
dhl International Guinea Ecuatorial srl Republic of Equatorial Guinea, Malabo 100.00 eur –282 –285
dhl International Kazakhstan, too Kazakhstan, Almaty 100.00 eur 2,135 1,534
dhl isc (Hong Kong) Limited China, Hong Kong 100.00 eur 8,120 1,685
dhl Japan Inc. Japan, Tokyo 100.00 eur 68,811 3,919
dhl Keells (Private) Limited 7b Sri Lanka, Colombo 50.00 eur 3,543 410
dhl Korea Limited South Korea, Seoul 95.00 eur 25,880 884
dhl Lao Limited Laos, Vientiane 100.00 eur 648 282
dhl Lemuir Logistics Private Limited India, Mumbai 76.00 eur 61,824 11,872
dhl Logistics (Beijing) Co., Ltd. China, Beijing 100.00 eur –16,792 905
dhl Logistics (Cambodia) Ltd. Cambodia, Phnom Penh 100.00 eur 2,185 455
dhl Logistics (China) Co., Ltd. China, Beijing 100.00 eur 66,499 25,946
dhl Logistics (Kazakhstan) too Kazakhstan, Aksai 100.00 eur 2,131 122
dhl Logistics (Shenzhen) Co., Ltd. China, Shenzhen 100.00 eur 4,700 1,860
dhl Pakistan (Private) Limited Pakistan, Karachi 100.00 eur 5,085 1,282
dhl Project & Chartering (China) Limited China, Hong Kong 100.00 eur –1,801 –2,847
dhl Properties (Malaysia) Sdn. Bhd. Malaysia, Shah Alam 69.98 eur 10,905 4,893
dhl scm k. k. Japan, Saitama 100.00 eur 48 374
dhl Sinotrans Bonded Warehouse (Beijing) Co., Ltd. China, Beijing 100.00 eur 2,254 664
dhl Sinotrans International Air Courier Ltd. 7a China, Beijing 50.00 eur 190,110 82,302
dhl Supply Chain (Australia) Pty Limited Australia, Mascot 100.00 eur 28,612 10,808
dhl Supply Chain (Hong Kong) Limited China, Hong Kong 100.00 eur 38,367 –232
dhl Supply Chain (Korea) Ltd. South Korea, Seoul 100.00 eur 1,996 460
dhl Supply Chain (Malaysia) Sdn. Bhd. Malaysia, Petaling Jaya 100.00 eur 4,970 17
dhl Supply Chain (New Zealand) Limited New Zealand, Auckland 100.00 eur 29,408 3,313
dhl Supply Chain (Taiwan) Co. Ltd. Taiwan, Taipeh 100.00 eur 26 –263
Exel Logistics (Far East) Ltd. Thailand, Bangkok 100.00 eur 5,453 22
dhl Supply Chain (Vietnam) Limited Vietnam, Ho Chi Minh City 100.00 eur –1,937 –1,714
dhl Supply Chain k. k. Japan, Tokyo 100.00 eur –24,024 1,042
dhl Supply Chain Service k. k. Japan, Tokyo 100.00 eur 1,078 – 8
Reported ifrs data.1 Only subgroup data available. 2 Amounts from 2009. 3 Amounts from 2010. 4 Data not available. 5 Dormant. 6 Amounts after profi t transfer. 7 a Inclusion in accordance with ias 27.13 (a). 7 b Inclusion in accordance with ias 27.13 (b – d). 8 In liquidation. 9 Local gaap. 10 Voting rights. 11 Company is included in group fi nancial statements of Deutsche Postbank ag. 12 Amounts from 2008. 13 Inclusion in accordance with sic 12 (spe). 14 Not included because they do not have signifi cant infl uence on the Group’s net assets, fi nancial position and results of operations.
Deutsche Post DHL Annual Report 2011
Consolidated Financial StatementsNotes
Other disclosures
235

Affi liated companies included in the consolidated fi nancial statements
HeadquartersGroup
equity share % CurrencyEquity
thousandsNet income thousandsName
dhl Supply Chain Singapore Pte. Ltd. Singapore, Singapore 100.00 eur 29,009 4,263
dhl Worldwide Express (Bangladesh) Private Limited Bangladesh, Dhaka 90.00 eur 2,129 1,008
dhl-vnpt Express Ltd. Vietnam, Ho Chi Minh City 51.00 eur 2,680 599
Dongguan dhl Supply Chain Co., Ltd. China, Dongguan 100.00 eur 760 236
Exel (Australia) Pty Ltd. Australia, Victoria 100.00 eur 4,402 0
Exel Consolidation Services Limited China, Hong Kong 100.00 eur 2,307 – 8
Exel Japan (Finance) Ltd. Japan, Tokyo 100.00 eur 13,735 177
Exel Logistics (China) Co. Ltd China, Shanghai 100.00 eur –12,288 – 5,121
Exel Logistics Services Lanka (Private) Ltd. Sri Lanka, Colombo 99.00 eur –110 –333
Exel Thailand Ltd. 8 Thailand, Bangkok 100.00 eur 854 0
Gori Australia Pty Ltd. Australia, Brighton-Le-Sands 100.00 eur 5,428 3,184
mdf Australia Pty Limited t / a creatis Australia, Sydney 100.00 eur 1,305 0
msas Global Logistics (Far East) Limited China, Hong Kong 100.00 eur 1,147 7,244
pt danzas sarana perkasa Indonesia, Jakarta 100.00 eur 246 218
pt Birotika Semesta 13 Indonesia, Jakarta 0.00 eur 2,864 921
pt Cargotama Multi Servisindo 5 Indonesia, Jakarta 100.00 eur 0 –28
pt dhl Exel Supply Chain Indonesia Indonesia, Jakarta 90.34 eur 1,526 196
pt dhl Global Forwarding Indonesia Indonesia, Jakarta 100.00 eur 8,533 2,972
Shanghai Danzas Freight Agency Co. Ltd. China, Shanghai 100.00 eur 832 – 94
Singha Sarn Co. Ltd Thailand, Bangkok 100.00 eur – 60 –10
StarBroker (Hong Kong) Limited China, Hong Kong 100.00 eur 42 –2
Tag India Private Limited India, New Delhi 100.00 eur – 42 – 43
Tag Worldwide (Shanghai) Co Ltd. China, Shanghai 100.00 eur –379 –358
Tag Worldwide (Singapore) Pte. Ltd. Singapore, Singapore 100.00 eur – 439 82
Tag Worldwide Australia pty Ltd. Australia, Parramatta 100.00 eur 320 127
Tibbett & Britten Asia Pte. Ltd. Singapore, Singapore 100.00 eur 13 –173
Trade Clippers Cargo Limited Bangladesh, Dhaka 85.00 eur 871 641
Williams Lea (Beijing) Limited China, Beijing 100.00 eur 1,501 748
Williams Lea (Hong Kong) Limited China, Hong Kong 100.00 eur 2,709 261
Williams Lea Asia Limited China, Hong Kong 100.00 eur 9 237
Williams Lea India Private Limited India, New Delhi 100.00 eur 3,771 1,634
Williams Lea Japan Limited Japan, Tokyo 100.00 eur 3,729 605
Williams Lea Private Limited Singapore, Singapore 100.00 eur –186 198
Williams Lea Pty Limited Australia, Sydney 100.00 eur –1,939 226
Other regions
Air & Ocean General Transport Forwarding and Customs Clearance llc Iraq, Baghdad 100.00 eur 319 277
Buddingtrade 33 (Proprietary) Limited 5 South Africa, Benoni 100.00 eur 2,352 0
Danzas Abu Dhabi llc 7b United Arab Emirates (uae), Abu Dhabi 49.00 eur 5,166 605
Danzas Bahrain wll 7b Bahrain, Manama 40.00 eur 1,228 790
dhl (Ghana) Limited Ghana, Accra 100.00 eur 1,622 – 445
dhl (Israel) Ltd. Israel, Tel Aviv 100.00 eur 7,452 864
dhl (Mauritius) Ltd. Mauritius, Port Louis 100.00 eur 919 342
dhl (Namibia) (Pty) Ltd. Namibia, Windhoek 100.00 eur 668 214
dhl (Tanzania) Ltd. Tanzania, Dar es Salaam 100.00 eur 684 – 408
dhl Aviation (Maroc) sa Morocco, Casablanca 100.00 eur 1,555 –1
dhl Aviation (Nigeria) Ltd. Nigeria, Lagos 100.00 eur 192 33
dhl Aviation (Pty) Limited South Africa, Johannesburg 100.00 eur 4,856 51
dhl Aviation eemea b. s. c. (c) Bahrain, Manama 100.00 eur 769 0
dhl Aviation Kenya Ltd. Kenya, Nairobi 100.00 eur 16 0
dhl Egypt wll Egypt, Cairo 100.00 eur 658 233
dhl Exel Supply Chain Kenya Limited Kenya, Nairobi 100.00 eur 6,429 1,570
dhl Express Maroc s. a. Morocco, Casablanca 100.00 eur – 687 –1,083
dhl Global Forwarding & Co. llc 7b Oman, Muscat 40.00 eur 4,819 1,444
dhl Global Forwarding (Angola) – Comércio e Transitários, Limitada Angola, Luanda 99.99 eur –1,271 2,637
Deutsche Post DHL Annual Report 2011236

Affi liated companies included in the consolidated fi nancial statements
HeadquartersGroup
equity share % CurrencyEquity
thousandsNet income thousandsName
dhl Global Forwarding (Cameroon) plc Cameroon, Douala 62.00 eur – 546 –130
dhl Global Forwarding (Kenya) Limited Kenya, Nairobi 100.00 eur –2,008 –2,932
dhl Global Forwarding (Kuwait ) Company wll 7b Kuwait, Safat 49.00 eur 5,844 2,274
dhl Global Forwarding (Senegal) s. a. Senegal, Dakar 100.00 eur –1,169 – 847
dhl Global Forwarding (Uganda) Limited Uganda, Kampala 100.00 eur –147 – 473
dhl Global Forwarding (Congo) sa Republic of Congo, Pointe-Noire 100.00 eur –27 –173
dhl global forwarding cote d’ivoire sa Ivory Coast, Abidjan 100.00 eur –121 –15
dhl Global Forwarding (Gabon) sa Gabon, Libreville 99.00 eur 272 – 423
dhl Global Forwarding Lebanon s. a. l. 7b Lebanon, Beirut 50.00 eur 1,863 781
dhl Global Forwarding Nigeria Limited Nigeria, Lagos 100.00 eur 1,055 318
dhl Global Forwarding Qatar llc 7b Qatar, Doha 49.00 eur 1,387 763
dhl Global Forwarding Egypt s. a. e. Egypt, Cairo 100.00 eur 4,038 –2,943
dhl Global Forwarding sa (Pty) Limited South Africa, Boksburg 74.99 eur 12,590 1,028
dhl Global Forwarding Tasimacilik a. s. Turkey, Istanbul 100.00 eur 8,734 1,342
dhl International (Algeria) sarl Algeria, Algiers 100.00 eur 3,338 874
dhl International (Angola) – Transportadores Rápidos Limitada Angola, Luanda 100.00 eur 2,603 – 871
dhl International (Bahrain) wll 7b Bahrain, Manama 49.00 eur 51 0
dhl International (Congo) sprl Democratic Republic of Congo, Kinshasa 100.00 eur 1,694 – 531
dhl International (Gambia) Ltd. Gambia, Kanifi ng 100.00 eur 27 – 85
dhl International (Liberia) Ltd. Liberia, Monrovia 100.00 eur –223 169
dhl International (Pty) Ltd. South Africa, Isando 74.99 eur 16,359 2,951
dhl International (Pvt) Ltd. Zimbabwe, Harare 100.00 eur 1,360 68
dhl International (sl) Ltd. Sierra Leone, Freetown 100.00 eur 709 85
dhl International (Uganda) Ltd. Uganda, Kampala 100.00 eur 459 23
dhl International b. s. c. (c) Bahrain, Manama 100.00 eur 345 211
dhl International Benin sarl Benin, Cotonou 100.00 eur 886 264
dhl International Botswana (Pty) Ltd. Botswana, Gaborone 100.00 eur 129 191
dhl International Burkina Faso sarl Burkina Faso, Ouagadougou 100.00 eur 605 – 84
dhl International Cameroon sarl Cameroon, Douala 100.00 eur 1,531 –124
dhl International Centrafrique sarl Central African Republic, Bangui 100.00 eur 287 –24
dhl International Chad sarl Chad, Ndjamena 100.00 eur – 69 –166
dhl International Congo sarl Republic of Congo, Brazzaville 100.00 eur 1,308 –3,859
dhl International Cote D’Ivoire sarl Ivory Coast, Abidjan 100.00 eur 1,075 –1,230
dhl International Gabon sarl Gabon, Libreville 100.00 eur – 597 142
dhl International Guinee sarl Guinea, Conakry 100.00 eur 301 – 52
dhl International Iran pjsc Iran, Tehran 100.00 eur 4,431 190
dhl International Madagascar sa Madagascar, Antananarivo 100.00 eur 321 – 527
dhl International Malawi Ltd. Malawi, Blantyre 100.00 eur 436 153
dhl International Mali sarl Mali, Bamako 100.00 eur 349 –300
dhl International Mauritanie sarl Mauretania, Nouakchott 100.00 eur 245 206
dhl International Niger sarl Niger, Niamey 100.00 eur 629 220
dhl International Nigeria Ltd. Nigeria, Lagos 100.00 eur 4,251 –264
dhl International Reunion sarl Réunion, Sainte Marie 100.00 eur 173 –128
dhl International Togo sarl Togo, Lomé 100.00 eur 185 –149
dhl International Transportation Co wll 13 Kuwait, Safat 0.00 eur 162 0
dhl International Zambia Limited Zambia, Lusaka 100.00 eur – 971 59
dhl Lesotho (Proprietary) Ltd. Lesotho, Maseru 100.00 eur 192 –10
dhl Logistics Ghana Ltd. Ghana, Tema 100.00 eur 1,412 357
dhl Logistics Kenya Limited Kenya, Nairobi 100.00 eur 183 208
dhl Logistics Morocco s. a. Morocco, Casablanca 100.00 eur –109 –1,772
dhl Logistics Tanzania Limited Tanzania, Dar es Salaam 100.00 eur – 94 33
Reported ifrs data.1 Only subgroup data available. 2 Amounts from 2009. 3 Amounts from 2010. 4 Data not available. 5 Dormant. 6 Amounts after profi t transfer. 7 a Inclusion in accordance with ias 27.13 (a). 7 b Inclusion in accordance with ias 27.13 (b – d). 8 In liquidation. 9 Local gaap. 10 Voting rights. 11 Company is included in group fi nancial statements of Deutsche Postbank ag. 12 Amounts from 2008. 13 Inclusion in accordance with sic 12 (spe). 14 Not included because they do not have signifi cant infl uence on the Group’s net assets, fi nancial position and results of operations.
Deutsche Post DHL Annual Report 2011
Consolidated Financial StatementsNotes
Other disclosures
237

Affi liated companies included in the consolidated fi nancial statements
HeadquartersGroup
equity share % CurrencyEquity
thousandsNet income thousandsName
dhl Lojistik Hizmetleri a. s. Turkey, Istanbul 100.00 eur 11,656 1,202
dhl Mocambique Lda. Mozambique, Maputo 100.00 eur 1,740 812
dhl Operations bv Jordan Services with Limited Liability Jordan, Amman 100.00 eur 518 138
dhl Qatar Limited 7b Qatar, Doha 49.00 eur – 870 –181
dhl Regional Services (Indian Ocean) Ltd. Mauritius, Port Louis 100.00 eur 1 0
dhl Regional Services Limited Nigeria, Lagos 100.00 eur 111 0
dhl International Senegal sarl Senegal, Dakar 100.00 eur 2,418 532
dhl Supply Chain (South Africa) (Pty) Ltd. South Africa, Germiston 100.00 eur –734 –1,927
dhl Swaziland (Proprietary) Ltd. Swaziland, Mbabane 100.00 eur 234 –11
dhl Worldwide Express & Company llc Oman, Ruwi 70.00 eur 229 223
dhl Worldwide Express (Abu Dhabi) llc 7b United Arab Emirates (uae), Abu Dhabi 49.00 eur 63 0
dhl Worldwide Express (Dubai) llc 7b United Arab Emirates (uae), Dubai 49.00 eur 0 0
dhl Worldwide Express (Sharjah) llc 7b United Arab Emirates (uae), Sharjah 49.00 eur 105 0
dhl Worldwide Express Cargo llc 7b United Arab Emirates (uae), Dubai 49.00 eur 63 0
dhl Worldwide Express Ethiopia Private Limited Company Ethiopia, Addis Ababa 73.00 eur 426 516
dhl Worldwide Express Kenya Limited Kenya, Nairobi 51.00 eur 3,068 –2
dhl Worldwide Express Tasimacilik ve Ticaret a. s. Turkey, Istanbul 100.00 eur 22,930 3,760
Document Handling (East Africa) Ltd. Kenya, Nairobi 51.00 eur 55 520
Durra al Hamra al Lamia’a co. Iraq Iraq, Baghdad 100.00 eur 33 0
Exel Contract Logistics Nigeria Ltd. Nigeria, Ikeja 100.00 eur – 632 –1,997
Exel Middle East (Fze) United Arab Emirates (uae), Dubai 100.00 eur 289 0
Exel Supply Chain Services (South Africa) (Pty) Ltd. South Africa, Johannesburg 100.00 eur 15,764 – 55
f. c. (Flying Cargo) International Transportation Ltd. Israel, Lod 100.00 eur 28,248 7,653
Giorgio Gori International Freight Forwards (Pty) Ltd. South Africa, Ferndale 100.00 eur 249 56
Hull, Blyth (Angola) Ltd. (Angolan branch) 1 Angola, Luanda 100.00 eur 5,413 –1,716
Hull Blyth Angola Viagens e Turismo Lda. 1 Angola, Luanda 99.99 eur – –
Kinesis Logistics (Pty) Ltd. 5 South Africa, Germiston 100.00 eur –319 0
Misr Freight Sarl Egypt, Cairo 100.00 eur 310 –35
Sherkate Haml-oNaghl Sarie dhl Kish Iran, Tehran 100.00 eur 0 0
snas Lebanon sarl Lebanon, Beirut 90.00 eur 905 159
snas Trading and Contracting 13 Saudi Arabia, Riyadh 0.00 eur 0 0
ssa Regional Services (Pty) Ltd. South Africa, Johannesburg 100.00 eur 690 –278
Tag mena fze United Arab Emirates (uae), Dubai 100.00 eur –71 – 65
Trans Care Fashion sarl (Morocco) 5 Morocco, Casablanca 100.00 eur – 538 0
Ukhozi Logistics (Pty) Ltd. South Africa, Boksburg 100.00 eur 104 6
Uniauto-Organizações Técnicas e Industriais sarl 5 Angola, Luanda 98.93 eur 16 0
Reported ifrs data.1 Only subgroup data available. 2 Amounts from 2009. 3 Amounts from 2010. 4 Data not available. 5 Dormant. 6 Amounts after profi t transfer. 7 a Inclusion in accordance with ias 27.13 (a). 7 b Inclusion in accordance with ias 27.13 (b – d). 8 In liquidation. 9 Local gaap. 10 Voting rights. 11 Company is included in group fi nancial statements of Deutsche Postbank ag. 12 Amounts from 2008. 13 Inclusion in accordance with sic 12 (spe). 14 Not included because they do not have signifi cant infl uence on the Group’s net assets, fi nancial position and results of operations.
Affi liated companies not included in the consolidated fi nancial statements 14
HeadquartersGroup
equity share % CurrencyEquity
thousandsNet income thousandsName
Europe
Alistair McIntosh Trustee Company Limited 3, 5, 9 United Kingdom, London 100.00 gbp 0 –
Arbuckle, Smith & Company Limited 3, 5, 9 United Kingdom, Glasgow 100.00 gbp 5,298 0
asg Leasing Handelsbolag 3, 5, 9 Sweden, Stockholm 100.00 sek 5 0
Bernard Brook Transport (Elland) Limited 2, 9 United Kingdom, Bracknell 100.00 gbp 887 0
Beteiligungsgesellschaft Privatstraße gvz Eifeltor gbr 4 Germany, Grafschaft-Holzweiler 53.54 eur – –
Calayan Cargo International (bvi) Ltd. 4, 5 United Kingdom, Tortola 100.00 gbp – –
Carbon Limited 2, 5 United Kingdom, London 100.00 gbp 0 –
Cormar Limited 3, 8 United Kingdom, Bracknell 100.00 eur 1,764 739
Deutsche Post DHL Annual Report 2011238

Affi liated companies not included in the consolidated fi nancial statements 14
HeadquartersGroup
equity share % CurrencyEquity
thousandsNet income thousandsName
degemolto Grundstücksverwaltungsgesellschaft mbH & Co. Immobilien-Vermietungs kg 2, 9 Germany, Meinerzhagen 100.00 eur 16 32
Deutsche Post DHL Corporate Real Estate Management GmbH & Co. Objekt Weißenhorn kg 2, 9 Germany, Bonn 100.00 eur 26 –
Deutsche Post gemeinnützige Gesellschaft für sichere und vertrauliche Kommunikation im Internet mbH 4 Germany, Bonn 100.00 eur 25 –
Deutsche Post Grundstücks- Vermietungsgesellschaft beta mbH 6, 9 Germany, Bonn 100.00 eur 17 0
dhl Employee Benefi t Fund asbl/vzw 2, 9 Belgium, Diegem 100.00 eur –240 0
dhl Energy Performance & Management Limited 3, 8 United Kingdom, Bracknell 100.00 eur – 6,008 –1,737
dhl Pensions Investment Fund Limited 4, 5 United Kingdom, Bedford 100.00 gbp – –
dhl Trustees Limited 4, 5 United Kingdom, Bedford 74.00 gbp 0 –
dhl uk Pension Trustees Limited 3, 5, 9 United Kingdom, Hounslow 100.00 gbp 0 –
Elan International (Ireland) Ltd. 4, 5 Ireland, Dublin 100.00 eur – –
Eric Studio Limited 2, 5 United Kingdom, London 100.00 gbp 1,792 –
Excel Logistics Limited 3, 5, 9 United Kingdom, Bracknell 100.00 gbp 0 –
Exel (Africa) Limited 3, 8 United Kingdom, Bracknell 100.00 eur –1,861 –255
Exel (Northern Ireland) Limited 3, 5, 9 United Kingdom, Mallusk 100.00 gbp 511 –
Exel Express Limited 3, 5, 9 United Kingdom, Bracknell 100.00 gbp 0 –
Exel Holdings (Russia) Limited 3, 5, 9 United Kingdom, Bracknell 100.00 gbp –3 –
Exel International Holdings Limited 2, 8 United Kingdom, Bedford 100.00 eur 258,564 1,600
Exel Logistics Limited 9, 12 United Kingdom, Bracknell 100.00 gbp 0 0
Exel Nominee No 2 Limited 3, 5, 9 United Kingdom, Bracknell 100.00 gbp 0 –
Exel Overseas Finance 2, 8 United Kingdom, Bedford 100.00 eur 343,765 15,666
Exel Sand and Ballast Company Limited 3, 5, 9 United Kingdom, Bracknell 100.00 gbp 189 –
Exel Scotland Limited 3, 8 United Kingdom, Glasgow 94.17 eur 2,497 28
Exel Secretarial Services Limited 4, 5 United Kingdom, Bracknell 100.00 gbp – –
Exel Share Scheme Trustees Limited 3, 5, 9 United Kingdom, Bracknell 100.00 gbp 0 –
Exel Taskforce Limited 3, 5, 9 United Kingdom, Bracknell 100.00 gbp – 48 –
Fashionfl ow Limited 3, 5, 9 United Kingdom, Bracknell 100.00 gbp 0 –
forum gelb GmbH 6, 9 Germany, Bonn 100.00 eur 25 0
Higgs Air España s. a. 8 Spain, Barcelona 100.00 eur – –
Industrial & Marine Engineering Co of Nigeria Limited 4 United Kingdom, London 100.00 gbp – –
it4logistics ag 2, 9 Germany, Potsdam 75.10 eur 366 121
kxc (exel) gp investment limited 3, 5, 9 United Kingdom, Bracknell 100.00 gbp 15 –
Lightbox Creative Services Limited 5 United Kingdom, London 100.00 eur – 56 0
McGregor Gow & Holland (1996) Limited 3, 8 United Kingdom, Bracknell 100.00 eur 272 0
Mercury Airfreight Holdings Limited 3, 5, 9 United Kingdom, Bracknell 100.00 gbp 500 –
Mercury Airspeed International b. v. 3, 8 Netherlands, The Hague 100.00 eur – 834 –12
Mexicoblade Limited 3, 5, 9 United Kingdom, London 100.00 gbp –2 –
msas Global Logistics Limited 2, 8 United Kingdom, Bracknell 100.00 eur 63,790 4,290
msas Limited 3, 8 United Kingdom, Bracknell 100.00 eur –3,577 0
nfc Investments Limited 3, 5, 9 United Kingdom, Bracknell 100.00 gbp 1 0
Ocean (bfl) Limited 8, 12 United Kingdom, Bracknell 100.00 eur 1 0
Ocean Group Share Scheme Trustee Limited 3, 5, 9 United Kingdom, Bracknell 100.00 gbp 0 –
Ocean Transport & Trading Limited 2, 8 United Kingdom, Bracknell 100.00 eur 601,233 20,275
ooo asg Road Transport Russia 8 Russia, Moscow 100.00 rub 418 0
Outrack Credit Ireland Ltd. 4, 5 Ireland, Dublin 100.00 eur – –
Packaging Datastore Limited 3, 8 United Kingdom, Bracknell 100.00 eur 0 0
Packaging Management Group Limited3, 8 United Kingdom, Bracknell 100.00 eur 0 0
Pismo Limited 2, 5 United Kingdom, London 100.00 gbp 13 –
Power Europe Development No. 2 Limited 3, 5, 9 United Kingdom, Bracknell 100.00 gbp 0 –
Print to Post Limited 3, 5, 9 United Kingdom, London 100.00 gbp 11 –
Reported ifrs data.1 Only subgroup data available. 2 Amounts from 2009. 3 Amounts from 2010. 4 Data not available. 5 Dormant. 6 Amounts after profi t transfer. 7 a Inclusion in accordance with ias 27.13 (a). 7 b Inclusion in accordance with ias 27.13 (b – d). 8 In liquidation. 9 Local gaap. 10 Voting rights. 11 Company is included in group fi nancial statements of Deutsche Postbank ag. 12 Amounts from 2008. 13 Inclusion in accordance with sic 12 (spe). 14 Not included because they do not have signifi cant infl uence on the Group’s net assets, fi nancial position and results of operations.
Deutsche Post DHL Annual Report 2011
Consolidated Financial StatementsNotes
Other disclosures
239

Affi liated companies not included in the consolidated fi nancial statements 14
HeadquartersGroup
equity share % CurrencyEquity
thousandsNet income thousandsName
Realcause Limited 4, 5 United Kingdom, Bracknell 100.00 gbp – –
Siegfried Vögele Institut (svi) – Internationale Gesellschaft für Dialogmarketing mbH 6, 9 Germany, Königstein 100.00 eur 50 0
sw Post Beheer b. v. 4 Netherlands, Apeldoorn 100.00 eur – –
Tag Studios Limited 2, 5 United Kingdom, London 100.00 gbp –166 –
Tag At Engine Limited 2, 5 United Kingdom, London 100.00 gbp 0 –
Tag At Red Brick Road Limited 2, 5 United Kingdom, London 100.00 gbp 0 –
Tag Design and Interactive Limited 2, 5 United Kingdom, London 100.00 gbp 0 –
Tag Paris gie 4, 8 France, Paris 51.00 eur – –
Tag Worldwide (uk) Limited 2, 5 United Kingdom, London 100.00 gbp 1 –
Tankfreight Limited 3, 5, 9 United Kingdom, Bracknell 100.00 gbp 2 –
The Stationery Offi ce Pension Trustees Limited 3, 5, 9 United Kingdom, London 100.00 gbp 0 –
The Stationery Offi ce Trustees Limited 3, 5, 9 United Kingdom, London 100.00 gbp 0 –
Tibbett & Britten (n. i.) Limited 3, 5, 9 United Kingdom, Ballyclare 100.00 gbp – 5 –
Tibbett & Britten (usa) Limited 2, 8 United Kingdom, Bracknell 100.00 eur 0 0
Tibbett & Britten Applied Limited 3, 5, 9 United Kingdom, Bracknell 100.00 gbp 1 – 835
Tibbett & Britten Automotive Assets Limited 3, 5, 9 United Kingdom, Bracknell 100.00 gbp 0 0
Tibbett & Britten Consumer Group Limited 3, 5, 9 United Kingdom, Bracknell 100.00 gbp 0 –
Tibbett & Britten Consumer Limited 3, 5, 9 United Kingdom, Bracknell 100.00 gbp 10 0
Tibbett & Britten Dairy Logistics Sp. z o. o. 5, 9 Poland, Warsaw 100.00 pln 50 0
Tibbett & Britten Group Iberia Limited 8 United Kingdom, Bracknell 100.00 gbp – –
Tibbett & Britten International Holdings Limited 3, 8 United Kingdom, Bracknell 100.00 eur 0 0
Tibbett & Britten Limited 3, 5, 9 United Kingdom, Bracknell 100.00 gbp 0 –
Tibbett & Britten Pension Trust Limited 3, 5, 9 United Kingdom, Bracknell 100.00 gbp 0 0
Tibbett & Britten Quest Trustees Limited 3, 5, 9 United Kingdom, Bracknell 100.00 gbp 0 0
Track One Logistics Limited 3, 5, 9 United Kingdom, Bracknell 100.00 gbp 92 –
Transcare Gulf Logistics International Limited 4, 5 United Kingdom, Bedford 50.00 gbp – –
Trucks and Child Safety Limited 3, 5, 9 United Kingdom, Bedford 100.00 gbp 100 –
unitrans Deutschland Gesellschaft für Terminverkehre mbH 2, 9 Germany, Düsseldorf 65.38 eur 308 –71
Van Gend & Loos – Euro Express nv 3, 9 Belgium, Ternat 100.00 eur –206 1
Williams Lea (us Acquisitions) Limited 9, 12 United Kingdom, London 100.00 gbp 1 0
Williams Lea Group Quest Trustees Limited3, 5, 9 United Kingdom, London 100.00 gbp 0 –
Williams Lea International Limited 3, 5, 9 United Kingdom, London 100.00 gbp 0 –
Americas
Axis Logistics Inc. 3, 5, 9 Canada, Toronto 100.00 cad 3 0
Deutsche Post World Net usa Inc. 4 usa, Washington 100.00 usd – –
dhl Consumer Services sc México 2, 9 Mexico, Tepotzotlán 100.00 mxn – 5,186 6,704
dhl Express (Belize) Limited 2, 9 Belize, Belize City 100.00 usd 20 0
dhl Global Forwarding (Brazil) Logistics Ltda. 5 Brazil, São Paulo 100.00 brl 50 –
dhl International (Antigua) Ltd. 4, 5 Antigua and Barbuda, St. Johns 100.00 usd – –
dhl Servicios, s. a. de c. v. 2, 9 Mexico, Mexico City 100.00 mxn –251 39
dhl St. Lucia Ltd. 4, 5 St.Lucia, Castries 100.00 xcd – –
Hyperion Properties Inc. 4, 5 usa, Westerville 100.00 usd – –
Inversiones 3340, c. a. 4 Venezuela, Caracas 49.00 vef – –
Power Packaging (Geneva), llc 4, 5 usa, Westerville 100.00 usd – –
Power Packaging, Inc. 4 usa, Westerville 100.00 usd – –
Radix Group International, Inc. 4 usa, Miami 100.00 usd – –
Safe Way Argentina s. a. 3, 5, 9 Argentina, Buenos Aires 99.97 eur 34 0
Skyhawk Transport Ltd. 3, 5, 9 Canada, Mississauga 100.00 cad 35,000 0
usc Distribution Services llc 4 usa, Westerville 100.00 usd – –
Asia Pacifi c
Concorde Air Logistics Ltd. 3, 9 India, Mumbai 99.54 inr 46,490 2,880
dhl Customs Brokerage Corp. 3, 9 Philippines, Pasay City 100.00 php 1,104 – 63
dhl Global Mail (Hong Kong) Limited 5 China, Hong Kong 100.00 usd 0 0
Exel Logistics Delbros Philippines Inc. 5, 8 Philippines, Manila 60.00 php – –
Deutsche Post DHL Annual Report 2011240

Affi liated companies not included in the consolidated fi nancial statements 14
HeadquartersGroup
equity share % CurrencyEquity
thousandsNet income thousandsName
Skyline Air Logistics Ltd. 9 India, Mumbai 99.99 inr 37,808 5,155
Tibbett & Britten Kontena Nasional Sdn. Bhd. 5, 8 Malaysia, Petaling Jaya 60.00 myr – –
Watthanothai Company Ltd. 5, 9 Thailand, Bangkok 49.00 thb 10,100 –
Yamato Dialog & Media Co. Ltd. 3, 9 Japan, Tokyo 49.00 jpy 579,158 56,479
Other regions
Blue Funnel Angola Ltda. 2, 5, 9 Angola, Luanda 99.99 usd – 61 –
Danzas aei (private) Ltd. 4, 5 Kenya, Nairobi 100.00 kes – –
Danzas aei (Private) Ltd. 4, 5 Zimbabwe, Harare 100.00 eur – –
Danzas aei Intercontinental ltd 8 Malawi, Blantyre 100.00 mwk – –
Danzas Intercontinental Pte. Ltd. 2, 9 Mauritius, Port Louis 40.00 usd – 56 – 8
dhl Air Freight Forwarder (Egypt) wll 8 Egypt, Cairo 99.90 egp – –
dhl Danzas Air & Ocean (Kenya) Ltd. 8 Kenya, Nairobi 100.00 kes – –
Elder Dempster Ltda. 2, 5, 9 Angola, Luanda 99.99 usd – 61 –
Exel Domestic Distribution (Pty) Ltd. 8 South Africa, Boksburg 100.00 zar – –
Exel Contract Logistics (sa) (Pty) Ltd. 4, 5 South Africa, Elandsfontein 100.00 zar – –
Nile Perishable (Egypt – Europe – Trans) Ltd. 3 Egypt, Alexandria 97.20 egp – 801 –187
Synergistic Alliance Investments (Pty) Ltd. 2, 5, 9 South Africa, Germiston 100.00 zar –3,341 –
Tibbett & Britten Egypt Ltd. 8 Egypt, Cairo 50.00 egp – –
Reported ifrs data.1 Only subgroup data available. 2 Amounts from 2009. 3 Amounts from 2010. 4 Data not available. 5 Dormant. 6 Amounts after profi t transfer. 7 a Inclusion in accordance with ias 27.13 (a). 7 b Inclusion in accordance with ias 27.13 (b – d). 8 In liquidation. 9 Local gaap. 10 Voting rights. 11 Company is included in group fi nancial statements of Deutsche Postbank ag. 12 Amounts from 2008. 13 Inclusion in accordance with sic 12 (spe). 14 Not included because they do not have signifi cant infl uence on the Group’s net assets, fi nancial position and results of operations.
Joint ventures (proportionate consolidation)
HeadquartersGroup
equity share % CurrencyEquity
thousandsNet income thousandsName
Europe
AeroLogic GmbH Germany, Leipzig 50.00 eur 27,541 9,048
Danzas dv, llc 5 Russia, Yuzhno-Sakhalinsk 50.00 eur 303 0
Americas
ev Logistics Canada, Vancouver 50.00 eur 2,898 1,730
Asia Pacifi c
Express Couriers Limited 1 New Zealand, Wellington 50.00 eur 91,625 8,252
Roadstar Transport Limited 1 New Zealand, Wellington 50.00 eur – –
Parcel Direct Group Pty Limited 1 Australia, Mascot 50.00 eur 4,035 4,216
Couriers Please Pty. Ltd. 1 Australia, Pymble 50.00 eur – –
Express Couriers Australia (sub1) Pty Limited 1 Australia, Mascot 50.00 eur – –
Hills Parcel Direct Pty. Limited 1 Australia, Pymble 50.00 eur – –
Parcel Direct Australia Pty. Limited 1 Australia, Pymble 50.00 eur – –
Parcel Express (sa) Pty Limited 1 Australia, Pymble 50.00 eur – –
Parcel Overnight Direct Pty. Ltd. 1 Australia, Pymble 50.00 eur – –
Other regions
Bahwan Exel llc Oman, Muscat 44.10 eur 908 3,510
Exel Saudia llc Saudi Arabia, Al Khobar 50.00 eur 8,819 2,219
Reported ifrs data.1 Only subgroup data available. 2 Amounts from 2009. 3 Amounts from 2010. 4 Data not available. 5 Dormant. 6 Amounts after profi t transfer. 7 a Inclusion in accordance with ias 27.13 (a). 7 b Inclusion in accordance with ias 27.13 (b – d). 8 In liquidation. 9 Local gaap. 10 Voting rights. 11 Company is included in group fi nancial statements of Deutsche Postbank ag. 12 Amounts from 2008. 13 Inclusion in accordance with sic 12 (spe). 14 Not included because they do not have signifi cant infl uence on the Group’s net assets, fi nancial position and results of operations.
Deutsche Post DHL Annual Report 2011
Consolidated Financial StatementsNotes
Other disclosures
241

Associated companies (accounting treatment in the consolidated fi nancial statements using the equity method)
HeadquartersGroup
equity share % CurrencyEquity
thousandsNet income thousandsName
Europe
All you need GmbH 4 Germany, Berlin 33.00 eur – –
Betriebs-Center für Banken ag 11 Germany, Frankfurt/Main 39.50 eur 299,182 33,227
Betriebs-Center für Banken Processing GmbH 11 Germany, Frankfurt/Main 39.50 eur 4,330 1,280
bhw – Gesellschaft für Wohnungswirtschaft mbH 11 Germany, Hameln 39.50 eur 918,946 0
bhw – Gesellschaft für Wohnungswirtschaft mbH & Co. Immobilienverwaltungs kg 11 Germany, Hameln 39.50 eur 82,451 2,324
bhw Bausparkasse ag 11 Germany, Hameln 39.50 eur 983,831 0
bhw Gesellschaft für Vorsorge mbH 11 Germany, Hameln 39.50 eur 242,370 0
bhw Holding Aktiengesellschaft 11 Germany, Berlin 39.50 eur 912,156 184,653
bhw Immobilien GmbH 11 Germany, Hameln 39.50 eur 2,728 567
bhw Kreditservice GmbH 11 Germany, Hameln 39.50 eur 25 0
Cargo Center Sweden ab 9 Sweden, Stockholm 50.00 sek 20,309 2,476
Deutsche Postbank ag 3, 9 Germany, Bonn 39.50 eur 2,621,072 343,640
Deutsche Postbank Finance Center Objekt GmbH 11 Luxembourg, Munsbach 39.50 eur 50 355
Deutsche Postbank Financial Services GmbH 11 Germany, Frankfurt/Main 39.50 eur 5,000 0
Deutsche Postbank International s. a. 11 Luxembourg, Munsbach 39.50 eur 832,435 91,264
Deutsche Postbank Vermögens-Management s. a. 11 Luxembourg, Munsbach 39.50 eur 31,745 11,325
dpbi Immobilien KGaA 11 Luxembourg, Munsbach 39.50 eur 348 120
dsl Portfolio GmbH & Co. kg 11 Germany, Bonn 39.50 eur 16,659 819
dsl Holding Aktiengesellschaft 11 Germany, Bonn 39.50 eur 63,527 395
dsl Portfolio Verwaltungs GmbH 11 Germany, Bonn 39.50 eur 25 1
pb Factoring GmbH 11 Germany, Bonn 39.50 eur 11,546 0
pb Firmenkunden ag 11 Germany, Bonn 39.50 eur 1,100 0
pb Spezial-Investmentaktiengesellschaft mit Teilgesellschaftsvermögen 11 Germany, Frankfurt/Main 39.50 eur 6,513,539 435,522
Postbank Beteiligungen GmbH 11 Germany, Bonn 39.50 eur 310 0
Postbank Direkt GmbH 11 Germany, Bonn 39.50 eur 20,858 0
Postbank Filial GmbH 11 Germany, Bonn 39.50 eur 25 0
Postbank Filialvertrieb ag 11 Germany, Bonn 39.50 eur 55 0
Postbank Finanzberatung ag 11 Germany, Hameln 39.50 eur 30,130 –19,936
Postbank Immobilien und Baumanagement GmbH 11 Germany, Bonn 39.50 eur 18,874 0
Postbank Immobilien und Baumanagement GmbH & Co. Objekt Leipzig kg 11 Germany, Bonn 35.55 eur 0 739
Postbank Leasing GmbH 11 Germany, Bonn 39.50 eur 500 0
Postbank p. o. s. Transact GmbH 11 Germany, Eschborn 39.50 eur 9,011 2,603
Postbank Support GmbH 11 Germany, Cologne 39.50 eur 759 0
Postbank Systems ag 11 Germany, Bonn 39.50 eur 51,591 0
Postbank Versicherungsvermittlung GmbH 11 Germany, Bonn 39.50 eur 25 0
Unipost Servicios Generales s. l. 1, 3, 9 Spain, Barcelona 37.69 eur 22,340 3,289
Unipost s. a. 1, 3, 9 Spain, Barcelona 37.69 eur – –
Suresa Cit., s. l. 1, 3, 9 Spain, L’Hospitalet de Llobregat 37.69 eur – –
vöb-zvd Bank für Zahlungsverkehrsdienstleistungen GmbH 11 Germany, Bonn 29.62 eur 12,896 4,048
Americas
Deutsche Postbank Funding llc i 11 usa, Wilmington 39.50 eur 25 0
Deutsche Postbank Funding llc ii 11 usa, Wilmington 39.50 eur 4 – 4
Deutsche Postbank Funding llc iii 11 usa, Wilmington 39.50 eur 36 7
Deutsche Postbank Funding llc iv 11 usa, Wilmington 39.50 eur 87 20
Deutsche Postbank Funding Trust i 11 usa, Wilmington 39.50 eur 1 0
Deutsche Postbank Funding Trust ii 11 usa, Wilmington 39.50 eur 1 0
Deutsche Postbank Funding Trust iii 11 usa, Wilmington 39.50 eur 1 0
Deutsche Postbank Funding Trust iv 11 usa, Wilmington 39.50 eur 60 3
Miami mei, llc 10, 11 usa, Dover 0.00 eur 6,981 0
pb Realty Corporation 11 usa, New York 39.50 eur 1,104,031 56,071
Deutsche Post DHL Annual Report 2011242

Associated companies (accounting treatment in the consolidated fi nancial statements using the equity method)
HeadquartersGroup
equity share % CurrencyEquity
thousandsNet income thousandsName
pb (usa) Holdings, Inc. 11 usa, Wilmington 39.50 eur 607,653 0
pb Capital Corporation 11 usa, Wilmington 39.50 eur 488,847 76,590
pb Finance (Delaware), Inc. 11 usa, Wilmington 39.50 eur 176 0
pb Hollywood i Hollywood Station llc 10, 11 usa, Dover 0.00 eur 2,086 348
pb Hollywood ii Lofts llc 10, 11 usa, Dover 0.00 eur 14,066 – 555
pbc Carnegie llc 10, 11 usa, Wilmington 0.00 eur 0 0
pmg Collins, llc 11 usa, Tallahassee 39.50 eur 8,583 901
Asia Pacifi c
Air Hong Kong Ltd. 3, 9 China, Hong Kong 40.00 hkd 350,580 433,237
Tasman Cargo Airlines Pty. Limited 9 Australia, Mascot 48.98 aud 6,522 413
Other regions
Danzas aei Emirates llc 3 United Arab Emirates (uae), Dubai 42.50 aed 208,644 41,018
Reported ifrs data.1 Only subgroup data available. 2 Amounts from 2009. 3 Amounts from 2010. 4 Data not available. 5 Dormant. 6 Amounts after profi t transfer. 7 a Inclusion in accordance with ias 27.13 (a). 7 b Inclusion in accordance with ias 27.13 (b – d). 8 In liquidation. 9 Local gaap. 10 Voting rights. 11 Company is included in group fi nancial statements of Deutsche Postbank ag. 12 Amounts from 2008. 13 Inclusion in accordance with sic 12 (spe). 14 Not included because they do not have signifi cant infl uence on the Group’s net assets, fi nancial position and results of operations.
Unconsolidated joint ventures 14
HeadquartersGroup
equity share % CurrencyEquity
thousandsNet income thousandsName
Europe
Aerologic Management GmbH 3, 8 Germany, Frankfurt / Main 50.00 eur 216 41
malto Grundstücks-Verwaltungsgesellschaft mbH & Co. KG 3, 9, 10 Germany, Grünwald 50.00 eur 140 –
Roster Worldwide Limited 4 United Kingdom, London 48.23 gbp 0 –
Reported ifrs data.1 Only subgroup data available. 2 Amounts from 2009. 3 Amounts from 2010. 4 Data not available. 5 Dormant. 6 Amounts after profi t transfer. 7 a Inclusion in accordance with ias 27.13 (a). 7 b Inclusion in accordance with ias 27.13 (b – d). 8 In liquidation. 9 Local gaap. 10 Voting rights. 11 Company is included in group fi nancial statements of Deutsche Postbank ag. 12 Amounts from 2008. 13 Inclusion in accordance with sic 12 (spe). 14 Not included because they do not have signifi cant infl uence on the Group’s net assets, fi nancial position and results of operations.
Unconsolidated associated companies 14
HeadquartersGroup
equity share % CurrencyEquity
thousandsNet income thousandsName
Europe
Airmail Center Frankfurt GmbH 3, 9 Germany, Frankfurt / Main 20.00 eur 3,342 1,291
Automotive Logistics (uk) Limited 8 United Kingdom, Ipswich 50.00 gbp – –
Balsa Grundstücksverwaltungs s. á. r. l. & Co. Vermietungs kg 2, 9 Germany, Hamburg 100.00 eur 12 –
Bike-Logistik GmbH Gesellschaft für Zweiradtransporte 3, 9 Germany, Nuremberg 25.00 eur 55 2
Dalim Software GmbH 2, 9 Germany, Kehl 22.26 eur 967 302
dcm GmbH & Co Vermögensaufbau Fonds 2 kg 2, 9 Germany, Munich 23.81 eur 4,260 –22
Deutsche Fonds Management GmbH & Co. dcm Rendite-fonds 18 kg 2, 9, 10 Germany, Munich 24.94 eur 51,641 – 51
Diorit Grundstücksverwaltungsgesellschaft mbH & Co. Vermietungs kg 3, 10 Germany, Mainz 24.00 eur 0 –13
European epc Competence Center GmbH 9 Germany, Cologne 30.00 eur 292 53
Expo-Dan 2, 9 Ukraine, Kiev 50.00 uah 680 – 493
Gardermoen Perishable Center as 3, 9 Norway, Gardermoen 33.33 nok 3,793 – 491
Reported ifrs data.1 Only subgroup data available. 2 Amounts from 2009. 3 Amounts from 2010. 4 Data not available. 5 Dormant. 6 Amounts after profi t transfer. 7 a Inclusion in accordance with ias 27.13 (a). 7 b Inclusion in accordance with ias 27.13 (b – d). 8 In liquidation. 9 Local gaap. 10 Voting rights. 11 Company is included in group fi nancial statements of Deutsche Postbank ag. 12 Amounts from 2008. 13 Inclusion in accordance with sic 12 (spe). 14 Not included because they do not have signifi cant infl uence on the Group’s net assets, fi nancial position and results of operations.
Deutsche Post DHL Annual Report 2011
Consolidated Financial StatementsNotes
Other disclosures
243

Unconsolidated associated companies 14
HeadquartersGroup
equity share % CurrencyEquity
thousandsNet income thousandsName
Jurte Grundstücksverwaltungsgesellschaft mbH & Co. Vermietungs kg 3, 9, 10 Germany, Mainz 24.00 eur 0 0
Maxser Holding b. v. 4 Netherlands, Maastricht 30.00 eur – –
profresh Systemlogistik GmbH 3, 9 Germany, Hamburg 33.33 eur 57 17
Americas
bits Limited 3, 4, 9 Bermuda, Hamilton 40.00 bmd – 984 –
Consimex s.a. 3, 9 Colombia, Medellín 29.24 cop 9,728,288 493,933
dhl International (Cayman) Ltd. 3, 4, 9 Cayman Islands, George Town 40.00 kyd – 960 –
Wilmington Commerce Park Partnership 3, 9 usa, Westerville 50.00 usd 506 – 5,332
Other regions
Danzas aei Intercontinental (Mauritius) Ltd. 8 Mauritius, Port Louis 35.00 mur – –
dhl Yemen Company Limited (Express Courier) 2, 9 Yemen, Sanaa 49.00 eur 409 –27
Drakensberg Logistics (Pty) Ltd. 3, 9 South Africa, Germiston 50.00 zar 11,904 2,752
Reported ifrs data.1 Only subgroup data available. 2 Amounts from 2009. 3 Amounts from 2010. 4 Data not available. 5 Dormant. 6 Amounts after profi t transfer. 7 a Inclusion in accordance with ias 27.13 (a). 7 b Inclusion in accordance with ias 27.13 (b – d). 8 In liquidation. 9 Local gaap. 10 Voting rights. 11 Company is included in group fi nancial statements of Deutsche Postbank ag. 12 Amounts from 2008. 13 Inclusion in accordance with sic 12 (spe). 14 Not included because they do not have signifi cant infl uence on the Group’s net assets, fi nancial position and results of operations.
Investments in other companies and large corporations
HeadquartersGroup
equity share % CurrencyEquity
thousandsNet income thousandsName
Europe
Deutsche Post Pensionsfonds ag 3, 9 Germany, Bonn 99.98 eur 3,225 0
Deutsche Post Pensions-Treuhand GmbH & Co. kg 2, 9 Germany, Bonn 99.98 eur 10 0
Asia Pacifi c
Sinotrans Ltd. 1, 3 China, Beijing 5.59 rmb 12,039,989 832,058
Reported ifrs data.1 Only subgroup data available. 2 Amounts from 2009. 3 Amounts from 2010. 4 Data not available. 5 Dormant. 6 Amounts after profi t transfer. 7 a Inclusion in accordance with ias 27.13 (a). 7 b Inclusion in accordance with ias 27.13 (b – d). 8 In liquidation. 9 Local gaap. 10 Voting rights. 11 Company is included in group fi nancial statements of Deutsche Postbank ag. 12 Amounts from 2008. 13 Inclusion in accordance with sic 12 (spe). 14 Not included because they do not have signifi cant infl uence on the Group’s net assets, fi nancial position and results of operations.
Deutsche Post DHL Annual Report 2011244

RESPONSIBILITY STATEMENT
To the best of our knowledge, and in accordance with the ap-
plicable reporting principles, the consolidated fi nancial statements
give a true and fair view of the assets, liabilities, fi nancial position
and profi t or loss of the Group, and the management report of the
Group includes a fair review of the development and performance
of the business and the position of the Group, together with a
description of the material opportunities and risks associated with
the expected development of the Group.
Bonn, 17 February 2012
Deutsche Post AG
Th e Board of Management
Dr Frank Appel Ken Allen
Roger Crook Bruce Edwards
Jürgen Gerdes Lawrence A. Rosen
Walter Scheurle
Deutsche Post DHL Annual Report 2011
Consolidated Financial StatementsResponsibility statement
245

INDEPENDENT AUDITOR’S REPORT
To Deutsche Post AG
Report on the consolidated fi nancial statements
We have audited the consolidated fi nancial statements of
Deutsche Post AG, Bonn, and its subsidiaries, comprising the income
statement and the statement of comprehensive income, the balance
sheet, the cash fl ow statement, the statement of changes in equity
and the notes to the consolidated fi nancial statements for the fi nan-
cial year from 1 January to 31 December 2011.
Board of Management’s responsibility for the consolidated
fi nancial statements
Th e Board of Management of Deutsche Post AG, Bonn, is
responsible for preparation of these consolidated fi nancial state-
ments. Such responsibility extends to the preparation of consoli-
dated fi nancial statements in accordance with the IFRS s as adopted
by the EU and the additional requirements of German law pursuant
to section 315 a (1) Handelsgesetzbuch (HGB – German Commercial
Code) that give a true and fair view of the net assets, fi nancial
position and results of operations of the Group in accordance with
these requirements. Th e Board of Management is also responsible
for such internal control as it determines is necessary to enable the
preparation of consolidated fi nancial statements that are free from
material misstatements, whether due to fraud or error.
Auditors’ responsibility
Our responsibility is to express an opinion on these consoli-
dated fi nancial statements based on our audit. We conducted our
audit in accordance with section 317 HGB and German generally
accepted standards for the audit of fi nancial statements promul-
gated by the Institut der Wirtschaft sprüfer (IDW – Institute of Public
Auditors in Germany), and additionally observed the International
Standards on Auditing (ISA). Th ose standards require that we com-
ply with ethical requirements and plan and perform the audit to
obtain reasonable assurance about whether the consolidated fi nan-
cial statements are free from material misstatements.
An audit involves performing procedures to obtain audit
evidence about the amounts and disclosures in the consolidated
fi nancial statements. Th e procedures selected depend on the audi-
tor’s judgment, including the assessment of the risks of material
misstatement of the consolidated fi nancial statements, whether
due to fraud or error. In making those risk assessments, the audi-
tor considers internal control relevant to the entity’s preparation
of consolidated fi nancial statements that give a true and fair view
in order to design and conduct audit procedures that are appro-
priate in the circumstances, but not for the purpose of expressing
an opinion on the eff ectiveness of the entity’s internal control. An
audit also includes evaluating the appropriateness of accounting
policies used and the reasonableness of accounting estimates made
by management, as well as evaluating the overall presentation of
the consolidated fi nancial statements.
We believe that the audit evidence we have obtained is suf-
fi cient and appropriate to provide a basis for our qualifi ed audit
opinion.
Qualifi ed opinion
Pursuant to section 322 (3) sentence 1 HGB, we hereby state
that our audit has not led to any reservations.
In our opinion based on the fi ndings of our audit, the con-
solidated fi nancial statements comply, in all material respects, with
the IFRS s as adopted by the EU and the additional requirements of
German law pursuant to section 315 a (1) HGB and give a true and
fair view of the net assets and fi nancial position of the Group as
at 31 December 2011 and the results of operations for the fi nancial
year ended on such date in accordance with these requirements.
Report on the group management report
We have audited the group management report of Deutsche
Post AG, Bonn, for the fi nancial year from 1 January to 31 Decem-
ber 2011. Th e Board of Management of Deutsche Post AG, Bonn,
is responsible for preparation of the group management report in
accordance with the requirements of German law pursuant to sec-
tion 315 a (1) HGB. We conducted our audit in accordance with sec-
tion 317 (2) HGB and the generally accepted standards for the audit
of fi nancial statements promulgated by the Institut der Wirtschaft s-
prüfer (IDW) for the audit of group management reports. Th ose
standards require that we plan and perform the audit of the group
management report to obtain reasonable assurance about whether
the group management report is consistent with the consolidated
fi nancial statements and the fi ndings we made during our audit
and, as a whole, provides a suitable understanding of the group’s
position and suitably presents the opportunities and risks of future
development.
Düsseldorf, 17 February 2012
PricewaterhouseCoopers
Aktiengesellschaft
Wirtschaft sprüfungsgesellschaft
Gerd Eggemann Dietmar Prümm
Wirtschaft sprüfer Wirtschaft sprüfer
(German Public Auditor) (German Public Auditor)
Deutsche Post DHL Annual Report 2011246

FURTHER INFORMATION 247 – 256
D FU
RTH
ER INFO
RM
ATIO
N

INDEX 249
GLOSSARY 250
GRAPHS AND TABLES 251
LOCATIONS 252
MULTI-YEAR REVIEW 254
CONTACTS 256
EVENTS IV

A
Advertising mail 65
Air freight 29, 39, 72 ff., 114 f., 119
Annual General Meeting 31 ff., 48, 120, 126 ff., 133, 138, 146 f., 187
Articles of Association 31 ff., 146
Auditor’s report 128, 246
Authorised capital 32, 187
B
Balance sheet 53, 58 f., 153, 156 f., 160 ff., 164 ff., 170 f., 180 ff.
Board of Management 3 ff., 30 ff., 45 f., 48, 99 ff., 110 ff., 116, 125 ff., 130 ff., 133 ff., 139 ff., 168, 187, 217 ff., 245
Board of Management remuneration 31, 34, 126, 137, 139 ff., 221
Bonds 50, 51, 53, 166, 196 f.
Brands 30, 95 ff., 157, 165, 172, 180
C
Capital expenditure 41, 49, 54 ff., 66, 106, 121 f., 137, 173, 200
Cash fl ow 40, 42, 46, 49 f., 56 f., 60, 66, 71, 75, 80, 120, 154, 165, 199 ff., 202 ff., 208 f., 254
Cash fl ow statement 56 f., 154, 156, 199 ff.
Change in control 34, 141 f.
Consolidated net profi t 46, 48, 58, 151, 152, 154, 155, 179, 188, 199, 254
Consolidated revenue 47, 157 f.
Contingent capital 32 f., 187
Contract logistics 29 f., 76 ff., 120, 139, 160, 173
Corporate governance 30, 34, 123 ff., 128, 133 ff., 222
Cost of capital 40 f., 50, 181
Credit lines 51, 201
Credit rating 49 f., 52, 121
D
Declaration of Conformity 126, 128, 133, 222
Dialogue Marketing 30, 60, 62, 65, 95, 173
Dividend 42, 46, 48, 49 f., 57 f., 97, 120, 128, 154, 179, 188 f., 255
E
Earnings per share 42, 46, 48, 151, 179, 255
ebit after asset charge 40 f., 140, 143
e-Postbrief 29, 40, 55, 61 f., 93, 96, 107, 113, 118
Equity ratio 58 f., 187, 255
express 9 ff., 29 f., 39, 47, 52, 54 ff., 60, 67 ff., 81 f., 93 f., 95, 105, 113 f., 119, 121, 159 f., 172 f.
F
Finance strategy 49 ff., 120
First Choice 93 f., 106, 111, 113, 115
Free fl oat 44, 186
Freight 30, 39, 47, 55, 60, 73, 75, 95, 157, 159 f., 173
Freight forwarding business 73, 75, 94, 119, 159
G
Global Business Services 29 f., 173
Global economy 35 f., 45, 98, 117 f., 120
Global Forwarding 30, 55, 60, 72 ff., 95, 114 f., 121, 173
global forwarding, freight 29 f., 54 ff., 60, 72 ff., 81 f., 94 f., 105, 114 f., 121, 127, 159 f., 172 f.
Global Mail 30, 60, 63, 66, 95, 173
GoGreen 23, 87 ff., 93, 107, 133 f.
GoHelp 87, 89, 133 f.
GoTeach 87, 90, 133 f.
Guarantees 49, 52
I
Illness rate 85
Income statement 151, 156, 160 f., 164, 175 ff., 183 f.
Income taxes 48, 151, 152, 154, 170, 178 f.
Investments 41, 49, 54 ff., 58 f., 66, 90, 105 f., 115, 119, 121 f., 137, 200, 254
L
Letters of comfort 49, 52
Liquidity management 51, 201
Living responsibility 87, 110, 133 f.
M
mail 15 ff., 29 f., 39, 45, 47, 52, 54 ff., 60, 61 ff., 81, 92 f., 95, 98, 105, 112 f., 120, 121, 172 f.
Mail Communication 30, 60, 61, 64, 95, 118, 173
Mandates 132
Market shares 61 ff., 68 f., 72 f., 78, 118 f.
Market volumes 39
N
Net asset base 40 f.
Net debt 59, 187
Net gearing 59, 187, 255
Net interest cover 58 f.
O
Ocean freight 29, 39, 72 ff., 102, 114, 119
Oil price 36, 48, 118
Operating cash fl ow 46, 49 f., 56, 60, 66, 71, 75, 80, 120, 254
Opportunities 98 ff., 101 f., 111, 114, 119, 125, 173
Outlook 98 ff.
P
Parcel Germany 15 ff., 30, 60, 63, 65, 81, 95, 173
Pension Service 30, 60, 61, 95, 173
Press Services 30, 60, 62, 65, 95, 119, 173
Price-to-earnings ratio 42, 255
Q
Quality 29, 54, 63, 67 f., 77, 86, 92 ff., 104 f., 112 f.
R
Rating 49 f., 52, 87, 121
Regulation 40, 102 f., 125, 216 f.
Responsibility statement 245
Retail outlets 30, 60, 61, 63, 66, 93, 112, 173
Return on sales 46, 60, 66, 71, 75
Revenue 46, 47, 60, 64 ff., 69 ff., 73 ff., 78 f., 120, 151, 157 f., 160, 164, 172, 175, 254
Risk management 85, 98 ff., 127, 137, 201, 204 f.
Road transport 39, 73, 75, 119, 173
S
Segment reporting 46 f., 78, 172 ff.
Share capital 31 ff., 186 f., 218, 221
Share price 43, 168, 217
Shareholder structure 44 f.
Staff costs 48, 81, 151, 168 f., 176, 195, 200, 219, 255
Strategy 2015 39, 44, 81, 86, 87, 95, 110 ff., 126
Supervisory Board 31 ff., 48, 116, 125 ff., 129, 132, 133 ff., 146 ff., 220 f., 222
Supervisory Board committees 126 f., 129, 137 f., 147
Supervisory Board remuneration 146 ff., 221
supply chain 29 f., 46 f., 54, 56, 60, 64, 76 ff., 81 f., 95, 105, 115 f., 120, 122, 157, 159 f., 172 f.
T
Tax rate 255
Trade volumes 37 f., 118, 120
Training 83, 85, 107
W
wacc 40 f., 50, 181
Williams Lea 30, 47, 56, 59, 60, 62, 78 f., 95, 120, 157, 173
Working capital 40, 56, 66, 71, 75, 80, 91, 181, 200
INDEX
Deutsche Post DHL Annual Report 2011
Further InformationIndex
249

GLOSSARY
Cross-border mail (outbound)All outbound international mail.
Dialogue marketingMarket-orientated activities that apply direct com-munications to selectively reach target groups using a personal, individualised approach.
e-PostbriefA means of secure and reliable online communica-tion that can be delivered both electronically and by traditional mail.
Federal Network Agency (Bundesnetzagentur)German national regulator for electricity, gas, telecommunications, post and railway.
PackstationParcel machine where parcels and small packages can be deposited and collected around the clock.
PaketboxParcel box for franked parcels and small packages (maximum dimensions: 50 × 40 × 30 cm).
Partner outletsPostal retail outlets operated primarily by partners in the retail sector who offer postal services in addition to their core businesses.
Postal Act (Postgesetz)The purpose of the German Postal Act, which took effect on 1 January 1998, is to promote postal competi-tion through regulation and ensure the nationwide provision of appropriate and suffi cient postal services. It includes regulations on licensing, price control and the universal service.
Preferred periodicalA press product of which more than 30 % consists of journalistic reporting.
Price-cap procedureProcedure whereby the German Federal Network Agency approves prices for certain mail products. The agency approves prices on the basis of parameters it stipulates in advance, which set the average changes in these prices within baskets of services defi ned by the agency.
Standard letterLetter measuring a maximum of 235 × 125 × 5 mm and weighing up to 20 g.
Standard periodicalA press product of which no more than 30 % consists of journalistic reporting.
TargetingTarget-specific advertising on websites aimed at achiev ing the highest possible advertising effectiveness.
Aftermarket logisticsLogistics services for manufacturer exchanges, returns and repairs.
Business process outsourcingOutsourcing specifi c business functions to a third-party service provider.
Co-packingPackaging services integrated into supply chain solutions.
Collect and returnGoods are picked up from end users at different addresses, transported to the predetermined repair company, collected after repair and returned to the end user.
ContainerLarge, standardised, lockable storage unit with a volume of more than three cubic metres and a holding capacity of more than fi ve tonnes used to transport a variety of goods.
Contract logisticsComplex logistics and logistics-related services along the value chain that are performed by a contract logistics service provider. Services are tailored to a particular industry or customer and are generally based on long-term contracts.
Day Defi niteDelivery of shipments on a specifi ed day.
dhl Solutions & Innovations (dsi) Unit that brings together the Group’s existing innova-tion drivers, develops innovative solutions and promo-tes cross-divisional co-operation.
e-fulfi lmentFulfi lment services for the e-commerce market.
Full container loadThe container is completely loaded by the sender and handed over to the freight carrier.
Full truckloadComplete capacity of truck is utilised from sender to receiver.
GatewayCollection point for goods intended for export and for further distribution of goods upon import; customs clearance point.
HubCollection centre for the transhipment and consolida-tion of fl ows of goods.
Inbound logisticsSupply of manufacturing and assembly locations.
Inbound-to-manufacturingThe procurement of goods and their transport from the place of origin/manufacture to the production line.
Intermodal transportTransport chain combining different modes of trans-port, often road and rail.
Lead logistics providerA logistics service provider who assumes the organisa-tion of all or key logistics processes for the customer.
Less than container loadLoads that will not fill a container and are consoli-dated for ocean transport.
Less than truckloadShipment weighing approximately three tonnes that is smaller than a full truckload and consolidated with other senders’ and/or receivers’ shipments into one load for transport.
Medical ExpressTime-critical samples (tissue, blood) are transported during the clinical test phase of a new drug.
Part truckloadShipment that does not constitute a full truckload but is transported from point of departure to destination without transhipment.
Same DayDelivery within 24 hours of order placement.
Supply chainA series of connected resources and processes from sourcing materials to delivering goods to consumers.
Twenty-foot equivalent unit (teu)Standardised container unit, 20 foot long, 8 foot wide (6 × 2.4 metres).
Time Defi niteDelivery of time-critical shipments for which the day or time of delivery has been specifi ed or guaranteed.
Transported Asset Protection Association (tapa)A forum that unites manufacturers, logistics providers, freight carriers, law enforcement authorities and other stakeholders with the common aim of reducing losses from international supply chains.
Deutsche Post DHL Annual Report 2011250

GRAPHS AND TABLESCover
01.1 Selected key fi gures i
02 Group structure ii
03 Target-performance comparison iii
04 Events iv
A Group Management Report
Business and Environment
a.01 Organisational structure of Deutsche Post DHL 30
a.02 Group structure from different perspectives 30
a.03 Global economy: growth indicators in 2011 35
a.04 Brent Crude spot price and euro / us dollar exchange rate in 2011 36
a.05 Trade volumes: compound annual growth rate 2010 – 2011 37
a.06 Major trade fl ows: 2011 volumes 38
a.07 Market volumes 39
a.08 eac calculation 40
a.09 Net asset base calculation 40
a.10 ebit after asset charge (eac) 41
a.11 Net asset base (unconsolidated) 41
Deutsche Post Shares
a.12 Deutsche Post shares: multi-year review 42
a.13 Peer group comparison: closing prices 43
a.14 Share price performance 43
a.15 Candlestick graph / 30-day moving average 44
a.16 Shareholder structure 44
a.17 Shareholder structure by region 45
Economic Position
a.18 Selected indicators for results of operations 46
a.19 Consolidated revenue 47
a.20 Consolidated ebit 48
a.21 Total dividend and dividend per no-par value share 48
a.22 Finance strategy 50
a.23 ffo to debt 50
a.24 Agency ratings 52
a.25 Financial liabilities 53
a.26 Operating lease liabilities by asset class 53
a.27 Capex by region 54
a.28 Capex and depreciation, amortisation and impairment losses, full year 54
a.29 Capex and depreciation, amortisation and impairment losses, q4 54
a.30 Operating cash fl ow by division, 2011 56
a.31 Selected cash fl ow indicators 56
a.32 Calculation of free cash fl ow 57
a.33 Selected indicators for net assets 58
a.34 Net liquidity (–) / net debt (+) 59
Divisions
a.35 Key fi gures by operating division 60
a.36 Domestic mail communication market, business customers 2011 61
a.37 Domestic dialogue marketing market, 2011 62
a.38 Domestic press services market, 2011 62
a.39 Domestic parcel market, 2011 63
a.40 International mail market, 2011 (outbound) 63
a.41 Mail Communication: volumes 64
a.42 Dialogue Marketing: volumes 65
a.43 Parcel Germany: volumes 65
a.44 Mail International: volumes 66
a.45 European international express market, 2010 : top 4 68
a.46 Americas international express market, 2010: top 4 68
a.47 Asia Pacifi c international express market, 2010 : top 4 69
a.48 International express market in the eemea region, 2010: top 4 69
a.49 express: revenue by product 70
a.50 express: volumes by product 70
a.51 Air freight market, 2010: top 4 72
a.52 Ocean freight market, 2010: top 4 73
a.53 European road transport market, 2010: top 5 73
a.54 Global Forwarding: revenue 74
a.55 Global Forwarding: volumes 74
a.56 Logistics and value-added services along the entire supply chain 76
a.57 Contract logistics market, 2010: top 10 78
a.58 supply chain: revenue by sector, 2011 79
a.59 supply chain: revenue by region, 2011 79
Non-Financial Performance Indicators
a.60 Number of employees 81
a.61 Employees by region, 2011 82
a.62 Gender distribution in management, 2011 84
a.63 Work-life balance 85
a.64 Traineeships, Deutsche Post DHL, worldwide 85
a.65 Illness rate 85
a.66 Occupational safety 86
a.67 Idea management 86
a.68 co2 emissions, 2011 88
a.69 Procurement expenses, 2011 90
a.70 Brands and business units 95
Outlook
a.71 Monte Carlo simulation 99
a.72 Opportunity and risk management process 99
a.73 Global economy: growth forecasts 117
B Corporate Governance
b.01 Members of the Supervisory Board 129
b.02 Committees of the Supervisory Board 129
b.03 Mandates held by the Board of Management 132
b.04 Mandates held by the Supervisory Board 132
b.05 Remuneration paid to the Group Board of Management in 2011: cash components 143
b.06 Remuneration paid to the Group Board of Management in 2011: share-based component with long-term incentive effect 143
b.07 Remuneration paid to the Group Board of Management in 2010: cash components 144
b.08 Remuneration paid to the Group Board of Management in 2010: share-based component with long-term incentive effect 144
b.09 Pension commitments under the previous system in fi nancial year 2011: individual breakdown 145
b.10 Pension commitments under the previous system in the previous year (2010): individual breakdown 145
b.11 Board of Management pension commit-ments under the new system in fi nancial year 2011: individual breakdown 146
b.12 Board of Management pension commit-ments under the new system in the previ-ous year (2010): individual breakdown 146
b.13 Remuneration paid to Supervisory Board members in 2011 147
b.14 Remuneration paid to Supervisory Board members in 2010 148
C Consolidated Financial Statements
c.01 Income Statement 151
c.02 Statement of Comprehensive Income 152
c.03 Balance Sheet 153
c.04 Cash Flow Statement 154
c.05 Statement of Changes in Equity 155
D Further Information
d.01 Deutsche Post DHL around the world 252
d.02 Key fi gures 2004 to 2011 254
Deutsche Post DHL Annual Report 2011
Further InformationGraphs and Tables
251

LOCATIONSd.01 Deutsche Post DHL around the world 1
Americas Europe
Antigua and Barbuda
Argentina
Aruba
Bahamas
Barbados
Belize
Bermuda
Bolivia
Brazil
British Virgin Islands
Canada
Cayman Islands
Chile
Colombia
Costa Rica
Dominican Republic
Dutch Antilles
Ecuador
El Salvador
Guatemala
Haiti
Honduras
Jamaica
Martinique
Mexico
Nicaragua
Panama
Paraguay
Peru
Puerto Rico
St. Lucia
Trinidad and Tobago
Uruguay
USA
Venezuela
Albania
Austria
Belgium
Bosnia and Herzegovina
Bulgaria
Croatia
Cyprus
Czech Republic
Denmark
Estonia
Finland
France
Germany
Greece
Hungary
Iceland
Ireland
Italy
Latvia
Lithuania
Luxembourg
Macedonia
Malta
Netherlands
Norway
Poland
Portugal
Romania
Russia
Serbia
Slovakia
Slovenia
Spain
Sweden
Switzerland
Ukraine
United Kingdom
1 Countries according to the list of shareholdings.
Deutsche Post DHL Annual Report 2011252

Middle East and Africa Asia Pacifi c
Algeria
Angola
Bahrain
Benin
Botswana
Burkina Faso
Cameroon
Central African Republic
Chad
Democratic Republic of Congo
Egypt
Ethiopia
Gabon
Gambia
Ghana
Guinea
Iran
Iraq
Israel
Ivory Coast
Jordan
Kenya
Kuwait
Lebanon
Lesotho
Liberia
Madagascar
Malawi
Mali
Mauretania
Mauritius
Morocco
Mozambique
Namibia
Niger
Nigeria
Oman
Qatar
Republic of Congo
Republic of Equatorial Guinea
Réunion
Saudi Arabia
Senegal
Sierra Leone
South Africa
Swaziland
Tanzania
Togo
Turkey
Uganda
United Arab Emirates
Yemen
Zambia
Zimbabwe
Australia
Bangladesh
Brunei Darussalam
Cambodia
China
East Timor
Fiji
French Polynesia
India
Indonesia
Japan
Kazakhstan
Laos
Macau
Malaysia
Nepal
New Caledonia
New Zealand
Pakistan
Papua New Guinea
Philippines
Singapore
South Korea
Sri Lanka
Taiwan
Thailand
Vietnam
Deutsche Post DHL Annual Report 2011
Further InformationLocations
253

MULTI-YEAR REVIEWd.02 Key fi gures 2004 to 2011
€ m 2004adjusted
2005adjusted
2006adjusted
2007adjusted
2008adjusted
2009adjusted
2010adjusted
2011
Revenue
mail 12,747 12,878 15,290 14,569 14,393 13,912 13,913 13,973
express 17,557 16,831 13,463 13,874 13,637 9,917 11,111 11,766
logistics 6,786 9,933 24,405 – – – – –
global forwarding, freight – – – 12,959 14,179 11,243 14,341 15,044
supply chain – – – 14,317 13,718 12,183 13,061 13,223
financial services 7,349 7,089 9,593 – – – – –
services – 3,874 2,201 – – – – –
Divisions total 44,439 50,605 64,952 55,719 55,927 47,255 52,426 54,006
Corporate Center / Other (until 2004: Other / Consolidation; until 2006: Consolidation; until 2007: Corporate Center / Other and Consolidation) –1,271 – 6,011 – 4,407 –1,676 1,782 1,527 1,302 1,260
Consolidation – – – – –3,235 –2,581 –2,340 –2,437
Continuing operations – – – 54,043 54,474 46,201 51,388 52,829
Discontinued operations – – – 10,335 11,226 1,634 – –
Total 43,168 44,594 60,545 – – – – –
Profi t / loss from operating activities (ebit)
mail 2,072 2,030 2,094 1,976 2,179 1,391 1,120 1,107
express 117 –23 288 –272 –2,194 –790 497 927
logistics 182 346 751 – – – – –
global forwarding, freight – – – 409 362 174 383 429
supply chain – – – 577 – 920 –216 231 362
financial services 714 863 1,004 – – – – –
services – 679 –229 – – – – –
Divisions total 3,085 3,895 3,908 2,690 – 573 559 2,231 2,825
Corporate Center / Other (until 2004: Other / Consolidation; until 2006: Consolidation; until 2007: Corporate Center / Other and Consolidation) – 84 –131 –36 – 557 –393 –328 –395 –389
Consolidation – – – – 0 0 –1 0
Continuing operations – – – 2,133 – 966 231 1,835 2,436
Discontinued operations – – – 1,060 – 871 –24 – –
Total 3,001 3,764 3,872 – – – – –
Consolidated net profi t / loss for the period 1,740 2,448 2,282 1,873 –1,979 693 2,630 1,266
Cash fl ow / investments / depreciation, amortisation and impairment losses
Total cash fl ow from operating activities 2,336 3,624 3,922 5,151 1,939 – 584 1,927 2,371
Total cash fl ow from investing activities –385 – 5,052 –2,697 –1,053 – 441 –2,710 8 –1,129
Total cash fl ow from fi nancing activities – 493 –1,288 – 865 –1,787 –1,468 1,676 –1,651 –1,547
Investments 2,536 6,176 4,066 2,343 3,169 1,444 1,276 1,880
Depreciation, amortisation and impairment losses 1,821 1,961 1,771 2,196 2,662 1,620 1,296 1,274
Assets and capital structure
Non-current assets 17,027 25,223 26,074 25,764 20,517 22,022 24,493 21,225
Current assets 136,369 147,417 191,624 209,656 242,447 12,716 13,270 17,183
Equity (excluding non-controlling interests) 7,242 10,624 11,220 11,035 7,826 8,176 10,511 11,009
Non-controlling interests 1,623 1,791 2,732 2,778 2,026 97 185 190
Current and non-current provisions 12,441 12,161 14,233 12,276 10,836 9,677 9,427 9,008
Current and non-current liabilities 1 15,064 19,371 20,850 21,544 242,276 16,788 17,640 18,201
Total assets 153,396 172,640 217,698 235,420 262,964 34,738 37,763 38,408
Deutsche Post DHL Annual Report 2011254

2004
adjusted2005
adjusted2006
adjusted2007
adjusted2008
adjusted2009 2010 2011
Employees / staff costs (from 2007: continuing operations)
Total number of employees (headcount including trainees)
as at 31 Dec. 379,828 502,545 520,112 512,147 512,536 477,280 467,088 471,654
Full-time equivalents (excluding trainees) 2
as at 31 Dec. 340,667 455,115 463,350 453,626 451,515 424,686 418,946 423,502
Average number of employees (headcount) 381,492 393,463 507,641 500,252 511,292 488,518 464,471 467,188
Staff costs € m 13,840 14,337 18,616 17,169 18,389 17,021 16,609 16,730
Staff cost ratio 3 % 32.1 32.2 30.7 31.8 33.8 36.8 32.3 31.7
Key fi gures revenue / income / assets and capital structure
Return on sales 4 % 7.0 8.4 6.4 3.9 –1.8 0.5 3.6 4.6
Return on equity (roe) before taxes 5 % 29.2 28.7 21.6 8.6 – 9.0 3.0 29.8 15.2
Return on assets 6 % 1.9 2.3 2.0 0.9 – 0.4 0.2 5.1 6.4
Tax rate 7 % 20.2 19.8 19.7 14.0 – 5.4 6.9 23.7
Equity ratio 8 % 5.8 7.2 6.4 5.9 3.7 23.8 28.3 29.2
Net debt (+) / net liquidity (–) (Postbank at equity) 9 € m –32 4,193 3,083 2,858 2,466 –1,690 –1,382 – 938
Net gearing (Postbank at equity) 10 % – 0.4 28.1 21.4 20.4 23.7 –25.7 –14.8 – 9.1
Dynamic gearing (Postbank at equity) 11 years 0.0 2.4 1.4 1.0 0.7 –1.4 – 0.7 – 0.4
Key stock data
(Diluted) earnings per share 12 € 1.44 1.99 1.60 1.15 –1.40 0.53 2.10 0.96
Cash fl ow per share 12, 13 € 2.10 3.23 3.28 4.27 1.60 – 0.48 1.59 1.96
Dividend distribution € m 556 836 903 1,087 725 725 786 846 14
Payout ratio (distribution to consolidated net profi t) % 34.8 37.4 47.1 78.6 – 112.6 30.9 72.7
Dividend per share € 0.50 0.70 0.75 0.90 0.60 0.60 0.65 0.70 14
Dividend yield (based on year-end closing price) % 3.0 3.4 3.3 3.8 5.0 4.4 5.1 5.9
(Diluted) price / earnings ratio 15 11.7 10.3 14.3 20.4 – 8.5 25.5 6.0 12.4
Number of shares carrying dividend rights millions 1,112.8 1,193.9 1,204.0 1,208.2 1,209.0 1,209.0 1,209.0 1,209.0
Year-end closing price € 16.90 20.48 22.84 23.51 11.91 13.49 12.70 11.881 Excluding liabilities from fi nancial services. 2 2004 including trainees. 3 Staff costs / revenue. 4 ebit / revenue (from 2007: continuing operations). 5 Profi t before income taxes (from 2007:
continuing operations) / average equity (including non-controlling interests). 6 ebit (from 2007: continuing operations) / average total assets. 7 Income taxes / profi t before income taxes. 8 Equity (including non-controlling interests)/total assets. 9 Financial liabilities excluding cash and cash equivalents, current financial assets and long-term deposits. From 2006: excluding
fi nancial liabilities to minority shareholders of Williams Lea. From 2008: please refer to page 59 of the Group Management Report. 10 Net debt / net debt and equity (including non-controlling interests). 11 Net debt / cash fl ow from operating activities. 12 The weighted average number of shares for the period was used for the calculation. 13 Cash fl ow from operating activities. 14 Proposal. 15 Year-end closing price / earnings per share.
Deutsche Post DHL Annual Report 2011
Further Information Multi-year Review
255

CONTACTS
Contacts
Investor Relations
Tel.: + 49 (0) 228 182-6 36 36Fax: + 49 (0) 228 182-6 31 99 e-mail: ir @ deutschepost.de
Press offi ce
Tel.: + 49 (0) 228 182-99 44Fax: + 49 (0) 228 182-98 80 e-mail: pressestelle @deutschepost.de
Publication
Published on 13 March 2012.
Ordering a copy of the Annual Report
External
e-mail: ir @ deutschepost.de dp-dhl.com/en/investors.html
Internal
GeT and dhl WebshopMat. no. 675-602-331
English translation
Deutsche Post Corporate Language Services et al.
The English version of the Annual Report 2011 of Deutsche Post DHL constitutes a translation of the original German version. Only the German version is legally binding, insofar as this does not conflict with legal provisions in other countries.
Deutsche Post DHL Annual Report 2011256

Financial calendar
8 MAY 2012 9 MAY 2012 10 MAY 2012
INTERIM REPORT JANUARY TO MARCH 2012
2012 ANNUAL GENERAL MEETING (FRANKFURT AM MAIN) DIVIDEND PAYMENT
24 MAY 2012 2 AUGUST 2012 8 NOVEMBER 2012
CAPITAL MARKETS DAY (LONDON)
INTERIM REPORT JANUARY TO JUNE 2012
INTERIM REPORT JANUARY TO SEPTEMBER 2012
12 MARCH 2013 14 MAY 2013 29 MAY 2013
ANNUAL REPORT 2012
INTERIM REPORT JANUARY TO MARCH 2013
2013 ANNUAL GENERAL MEETING (FRANKFURT AM MAIN)
30 MAY 2013 6 AUGUST 2013 12 NOVEMBER 2013
DIVIDEND PAYMENT
INTERIM REPORT JANUARY TO JUNE 2013
INTERIM REPORT JANUARY TO SEPTEMBER 2013
Investor events 1
13 – 14 March 2012 j. p. Morgan Transportation Conference (New York)
21 March 2012 Nomura Transport Conference (London)
14 – 15 May 2012 Deutsche Bank German, Swiss & Austrian Corporate Conference (Frankfurt am Main)
13 June 2012 rbc Transport and Infrastructure Investor Day (London)
26 June 2012 Goldman Sachs Business Services Conference (London)
27 June 2012 Davy Transport Conference (London)
6 September 2012 Deutsche Bank Transportation & Aviation Conference (New York)
13 September 2012 ubs Best of Germany Conference (New York)
19 September 2012 Sanford C. Bernstein’s Strategic Decisions Conference (London)1 Further dates, updates as well as information on live webcasts dp-dhl.com/en/investors.html.
04 EVENTS
IV

Deutsche Post agHeadquartersInvestor Relations53250 BonnGermany
dp-dhl.com