Media presentation H1 2018 results - rabobank.com · Dec 16. 43,729. Valuable progress on our...
17
Rabobank Media presentation H1 2018 results 16 August 2018
Transcript of Media presentation H1 2018 results - rabobank.com · Dec 16. 43,729. Valuable progress on our...

RabobankMedia presentation H1 2018 results
16 August 2018

Growing a better world together
Banking for the Netherlands Banking for Food
10 Strategic Top Priorities
• 100% Digital convenience in everything
• Top customer advice nearby
• Growth with innovation
• Top performance• Optimal balance sheet• Exceptionally good
execution
• Concrete socially responsible contribution
• Involved members and communities
• Inspired employees• One-Rabobank culture
Excellent customerfocus
Rock-solidbank
Empoweredemployees
Meaningful cooperative
Strategy overviewFocus on 10 top priorities for 2018-2020
2

Highlights H1 2018 (I)
3
Growth deposit base & loan book • Growth loan book by € 7.6bn • Deposit base increased by € 3.4bn
Excellent customer focus Meaningful cooperative
Most customer-friendly bank • 1st place by consumers as the most customer-friendly
bank in the Netherlands (Customer First Awards)• Sustained increase in domestic Net Promotor Scores
Strong progress in innovation• Rabobank innovation SurePay (IBAN name check) rolled
out to many Dutch banks and insurance companies• 1st Dutch bank to facilitate 3rd party payment initiation• Customers can check account balance or set a spending
alert using their voice via Google Assistant
Client-focused operating model• New client focused operating model for local Rabobanks
in the Netherlands as the foundation for a more effective and efficient banking operation
Industry leading in sustainability• Sustainalytics score: 86 + awarded ‘ESG Industry Leader’ • Oekom Prime: awarded ‘Industry Leader’ in 2017• RobecoSam: score 89 (11th worldwide)
First to launch ‘ESG Leader’ program• Rabobank was first to launch ESG Leader CP/CD program• Driven by Rabobank's 'ESG Industry Leader' status
Rabobank issues short term funding labelled as ESG investment
3rd Kickstart program launched (Food)• Launched Kickstart Waste to drive food waste reduction,
from stimulating innovations to financial support for farmers to improve replanting, logistics and storage
Driving energy efficient housing• Proprietary sustainability scan helps mortgage clients
identify sustainability improvements in their homes• Introduced Green Depot, a 2-year interest-free depot to
finance sustainable home improvements

Highlights H1 2018 (II)
4
Strong net profit• H1 net profit of € 1.7bn (+12%) supported by favorable
economic environment
Rock-solid bank Empowered employees
Comfortable capital position• Well positioned to absorb future
Basel IV and MREL requirements (30.96%)• Expected Non-Preferred Senior issuance in H2 2018
Continued strategic focus• Non-core domestic CRE portfolio divested with FGH Bank
portfolio sale• Repositioned BPD with focus on Dutch and German
market by divesting BPD France (expected closing: Q4)
Improved efficiency• Cost/Income ratio improved to 64.6% with further cost
reduction remaining a point of attention
#1 Employer in the Netherlands• Rabobank awarded #1 favorite employer to work for by
talents (university & higher vocational education)
Diversity strong and improving• Women well-represented in senior management
positions (33% overall, 40% in Managing Board)• Strong cultural diversity in our young talent pool (30%)
235 New start-up ideas generated• Employees from 13 countries generated 235 ideas for
start-ups through our innovation incubator program • Involved in 68 start-up communities and organizer of F&A
innovation events such as FoodBytes! and Terra
High employee mobility• 63% of the employees we had to let go found a job within
six months, which is above average for the banking sector in the Netherlands
+12%(€ 1.7bn)
CET1
Total Capital
15.8%
26.1%
64.6%(-3.0%-point)

Ongoing successful transformation in the Netherlands…Ready for the next phase
5
Phase 3 | Optimize service modelPhase 2 | Regionalize mid- & back officePhase 1 | Implement new governance
January 2016
• Efficiency improvement through process standardization and regionalization of customer call center and operational service centers
• Incorporated digitalization as an integral part of the strategy and change agenda
• Significantly reduced cost and FTE, while increasing Net Promotor Scores (NPS)
• Next step towards a more effective and efficient organization as per 1/1/2019
• Further optimization of omnichannel client service model
• 250 Market teams ensure customer intimacy through face-to-face contact, operating out of 90 banks supported by 14 regional teams
• Anticipating changing client demands and regulatory requirements
• Merger of 106 local Rabobanks with central entity to one legal entity with one banking license and one balance sheet
• More flexible, simple and adaptive structure supporting cooperative values
2016 -2018 June 2018
14 regions of 6-7
Rabobanks

…resulting in higher client appreciation and efficiency
6
37
60
33
56
21
52
Dec 15 Dec 16 Dec 17 Jun 18
NPS private banking customers
NPS retail customers
NPS business customers
Net Promotor Score (domestic market) FTE development Rabobank Group
* Including 1,255 FTEs due to the Athlon sale in 2016 ** This is the balance of -775 FTEs at DRB (of which ~400 FTEs transferred to the central
organization), and +669 FTEs at the other business segments
-106**
Dec 17
45,567
Ambition
43,623
38,500
Jun 18
-8,390*
52,013
Dec 15 Dec 16
43,729

Valuable progress on our financial targets
7
Jun 2017 Dec 2017 Jun 2018 Ambition 2020
Capital
Fully loaded CET1 ratio 14.7% 15.5% 15.8% >14%
Total capital ratio 25.5% 26.2% 26.1% >25%
Profitability
ROIC 7.8% 6.9% 8.8% >8%
C/I ratio 67.6% 71.3% 64.6%
53-54%
Underlying C/I ratio 63.9% 65.3% 62.9%
Funding Wholesale funding € 171bn € 160bn € 164bn < €150bn
Financial targets and results

Positive net profit development
8
In € mn H1 2017 H2 2017 H1 2018
Net interest income 4,454 4,389 4,274
Net fee & commission income 988 927 981
Other results 496 747 774
Total income 5,938 6,063 6,029
Operating expenses 3,755 4,299 3,611
Regulatory levies 258 247 284
Impairment charges -67 -123 -37
Operating profit before tax 1,992 1,640 2,171
Tax 476 482 473
Net profit 1,516 1,158 1,698
Profit & Loss account Net profit (in € mn)
1,522
997
692
1,027
1,158
1,5161,698
2015
2,214
2016
2,024
20182017
2,674H2
H1

Continued strong underlying performance
9
Exceptional items included in operating profit before tax Underlying profit before tax (in € mn)
In € mn H1 2017 H2 2017 H1 2018
Fair Value items -186 -127 -133
Restructuring costs -98 -61 -22
Provision RNA 0 -310 0
Derivatives framework 0 -51 0
Total effect -284 -549 -155
1,992
1,640
2,171
549
155284
H1 2017
2,1892,276
+2%
Operating profit before tax
Exceptional items
H1 2018
2,326
H2 2017

Total income slightly up despite challenging interest rate environment
10
Total income (in € mn)
4,389 4,274
927 981
874
4,454
988
907682
5,938
H1 2017
-186
6,190 6,162
6,029
6,124
6,063
Net fee and commission income
Net interest income
Other results
FV itemsH1 2018
-133
H2 2017
-127

Net interest income impacted by prolonged low interest rate environment
11
Net interest income (in € mn) and Net interest margin (in % of average balance sheet total)
NIM(12m-rolling average)
1.41%1.39%1.33%1.29%1.33%1.33%1.32%
4,657 4,375 4,368 4,454 4,389 4,2744,482
H1 2018H2 2017H1 2017H2 2016H1 2016H2 2015H1 2015

Multi-year transformation program is paying off
12
Operating expenses (in € mn)
H1 2017 H2 2017 H1 2018
C/I ratio 67.6% 75.0% 64.6%
Underlying C/I ratio 63.9% 66.6% 62.9%
2,206 2,266 2,127
1,4511,611
1,462
31061
51
H1 2017
3,755
4,299
3,589
H1 2018
Staff costs
Other Opex
H2 2017
3,657 3,877
Restructuringcosts 22
3,61198
Derivatives frameworkProvision RNA
Development cost/income ratio incl. regulatory levies

Asset quality continues to benefit from economic tail wind
13
Impairment charges (in € mn and in bps of average lending)
-2 bps-3 bps -6 bps
-43 -73
105
-103
41
65
-42
-156
-27
35
-3
H2 2017
-10
H1 2018
0
Domestic Retail
Other
Real Estate
Leasing
WRR
H1 2017
-2-14
-€ 37mn-€ 67mn -€ 123mn

Loan portfolio increased after a few years of slight contraction
14
Composition of private sector loan portfolio (in € bn)
193 193
23 22 2227 27 27
42 42 43
62 61 65
37 36 3727 27 29
192
Domestic Retail F&A
Domestic Retail other SMEs
WRR Wholesale (excl. CRE)
WRR Rural & Retail
Leasing
Jun 18
416
Jan 18
408
Dec 17
Domestic CRE
Domestic Retail mortgages
+2%
411

Deposits from customers and private sector lending (in € bn)
Loan-to-deposit ratio slightly improved
15
1.21 LtD ratio
229 229 235
28 28 25
84 86 87
411 408 416
343
WRR and Other
RaboDirect
347
DRB
341
Dec 17 Jan 18 Jun 18
1.20
Deposits from customersLending
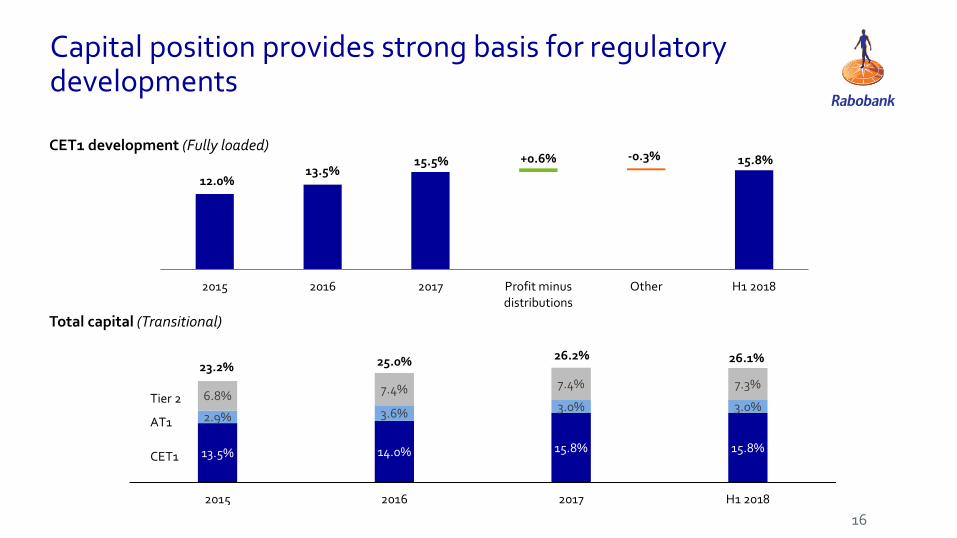
13.5% 14.0% 15.8% 15.8%
2.9% 3.6% 3.0% 3.0%6.8% 7.4% 7.4% 7.3%
2015 2016 2017 H1 2018
Tier 2
AT1
CET1
Capital position provides strong basis for regulatory developments
16
CET1 development (Fully loaded)
Total capital (Transitional)
25.0% 26.2% 26.1%23.2%
12.0%13.5%
15.5% 15.8%+0.6% -0.3%
2015 2016 2017 Profit minusdistributions
Other H1 2018

RabobankMedia presentation H1 2018 results
16 August 2018


![6,029(570$67(5’5,9(6 1iYRGNREVOX]HD~GUæE … · 6,029(570$67(5’5,9(6 0rwlrq&rqwuro 1iyrgnrevox]hd~guæe 0 qlþnplwrþwx $& $& ⁄nrpsdnwqts uryhghqt ⁄yhvwdyqpsuryhghqt 6w˝tgdþnplwrþwx](https://static.fdocuments.in/doc/165x107/5bec8a5509d3f2d6718b9c33/6029570675596-1iyrgnrevoxhdguaee-6029570675596-0rwlrqrqwuro.jpg)