Media eXperience Analyzer - … to the Media eXperience Analyzer ... Understanding the MXA UI ... to...
35
Media eXperience Analyzer Getting Started Guide
Transcript of Media eXperience Analyzer - … to the Media eXperience Analyzer ... Understanding the MXA UI ... to...

Media eXperience Analyzer Getting Started Guide
Intro to the Media eXperience Analyzer ....................................................................................................................... 3
Overview .................................................................................................................................................................... 3
Target Audience & Pre-requisites .............................................................................................................................. 3
System Requirements & Recommended Hardware .................................................................................................. 3
MXA Essentials ............................................................................................................................................................... 4
Collecting traces ........................................................................................................................................................ 4
Opening a trace in MXA ............................................................................................................................................. 5
Understanding the MXA UI ........................................................................................................................................ 6
Selection Trees....................................................................................................................................................... 7
Datasets ................................................................................................................................................................. 8
Panels..................................................................................................................................................................... 8
Data Viewers .......................................................................................................................................................... 9
Zoom Levels ............................................................................................................................................................. 10
Toolbars ................................................................................................................................................................... 11
Control ................................................................................................................................................................. 11
Navigation ............................................................................................................................................................ 13
Mode ................................................................................................................................................................... 14
CPU ...................................................................................................................................................................... 14
Filtering datasets ..................................................................................................................................................... 14
Searching datasets ................................................................................................................................................... 16
Pivoting on datasets in panels ................................................................................................................................. 17
Pivoting on datasets in selection trees .................................................................................................................... 19
Data viewers ................................................................................................................................................................ 20
Properties ................................................................................................................................................................ 20
Callstack ................................................................................................................................................................... 21
ReadyThread ............................................................................................................................................................ 22
Bitmap ..................................................................................................................................................................... 23

Summary .................................................................................................................................................................. 24
Event Dumper .......................................................................................................................................................... 25
Datasets ....................................................................................................................................................................... 26
GPU .......................................................................................................................................................................... 26
DMA Operations .................................................................................................................................................. 26
DX VSync ISR/DPC Cadence ................................................................................................................................. 27
Media ....................................................................................................................................................................... 28
Video Glitches ...................................................................................................................................................... 28
Video Glitches Severity ........................................................................................................................................ 29
Quick Reference .......................................................................................................................................................... 30
Keyboard Shortcuts ................................................................................................................................................. 30
Navigation ................................................................................................................................................................ 32
Common Tasks ......................................................................................................................................................... 33
Frequently Asked Questions & Troubleshooting ......................................................................................................... 34
Release Notes .............................................................................................................................................................. 34
Feedback ...................................................................................................................................................................... 34

INTRO TO THE MEDIA EXPERIENCE ANALYZER
OVERVIEW
Media eXperience Analyzer (MXA) is a tool that engineers can use to analyze visual performance and
then optimize the performance and quality of various media scenarios on Windows devices. MXA helps
performance engineers infer meaningful information from a large amount discrete event data by
representing the events visually and providing powerful filtering capabilities. MXA can be used to
optimize quality, performance, and latency in the following scenarios:
Audio and video playback and transcode
Energy efficiency for media
Real-time communications (Skype)
Camera capture
Casting
MXA supports loading trace files collected on Windows. MXA enables engineers to identify delays and
bottlenecks in the CPU, GPU, network, memory, and disk. It is primarily used to:
Find the root cause of audio and video glitches
Identify opportunities to improve audio video synchronization
Correlate a physical domain with a software domain
Correlate a component’s power usage with system activity
Optimize latency between casting source and sink devices
Optimize devices for full screen video playback and low power audio
Verify critical media threads are enlisted in Multimedia Class Scheduler Service (MMCSS)
TARGET AUDIENCE & PRE-REQUISITES
The primary audiences for this tool are IHVs, OEMs, ODMs, and ISVs that develop or ship media related
software and hardware components on Windows devices. Prior experience with Windows Internals,
Event Tracing for Windows (ETW), Windows Performance Toolkit (WPT), and Multimedia applications is
recommended.
SYSTEM REQUIREMENTS & RECOMMENDED HARDWARE
Minimum Recommended
OS Windows 8.1 Pro amd64 * Windows 10 Pro AMD64

CPU Dual core Quad core or better
Graphics Mid-range DX9 graphics card High-end graphics card
Memory 2GB of RAM ** 4GB of RAM or more ***
Disk Any SSD or HDD that has 5GB or more of
free space
SSD or fast HDD that has 10GB or more of
free space
Monitor Single monitor with 720p resolution Dual monitor setup with monitors that
support resolutions >= 1920 x 1080
* MXA is not supported on Windows N SKUs.
** When opening multiple trace files, that include one ETW log file and two videos, the minimum
memory is 4GB of RAM.
*** The amount of free RAM should be 3 times the size of the trace. For example, when opening a 2GB
trace, the amount of free RAM should be 6GB.
MXA ESSENTIALS
This section describes how to collect, load, and start visualizing events in MXA.
COLLECTING TRACES
MXA supports several trace formats including ETW, Windows software trace preprocessor (WPP), text
power logs, and video files (mp4). The most commonly used trace format is ETW.
There are several ways to collect logs that can be analyzed in MXA:
Windows Performance Recorder (WPR)
Install the Windows Performance Toolkit which ships inside the Windows Assessment and
Deployment Kit (ADK) and use WPRUI.exe or WPR.exe to manually collect an ETW trace. This
MXA installation includes a sample Windows Performance Recorder Profile (WPRP) file,
Multimedia_WPRP.wprp, that contains the essential kernel and user mode providers that are
used for analyzing multimedia and power scenarios.
o Click “Add profiles” in WPRUI to load this custom WPRP file, then collect a trace while a
multimedia scenario is running.

o If the test device has 4GB or more of RAM, set the logging mode to Memory. If it has
less than 4GB of RAM, set the logging mode to File.
Automated media tests in test kits
The GlitchFree media playback performance and quality assessment in the Hardware Lab Kit
(HLK) has an option to generate verbose ETW logs on Windows 10. These logs can be used for
analyzing audio and video glitches in MXA or WPA.
Author an MP4 video using a camcorder
Author an MP4 video of a scenario using a camera or camcorder. Cameras with a higher frame
rate enables more precise correlation between the physical and software domains.
Generate a power trace using a data acquisition board
Instrumented systems and data acquisition boards can be used to generate power text logs that
contain precise power measurements per component or hardware module.
OPENING A TRACE IN MXA
Option 1 – Windows Start screen
If you use WPR or WPRUI to capture an ETW log, MXA has access
to the build and trace symbols path in the trace and will
automatically resolve symbols. In these cases, MXA can be
launched from the Windows Start screen without setting the
symbol path at the command prompt. Manually setting the
_NT_SYMBOL_PATH is required when analyzing a trace that
contains code paths that do not have symbols on the public
symbol server.
For details on how to set the symbol path, refer to Option 2 below.
Option 2 – Command Line
MXA supports loading between 1 and 10 traces from different data sources in the same timeline or
instance of MXA. The offset window can be used to align multiple traces.
1. Set the symbol path
Prior to loading a trace, set the symbol path so that call stacks can be resolved:
a. Launch an elevated command prompt
b. cd /d “C:\Program Files\Media eXperience Analyzer”
c. set
_NT_SYMBOL_PATH=C:\symobls;c:\symcache;srv*\\symbols\symbols;http://msdl.micro
soft.com/download/symbols
2. Load the trace(s) using the following syntax:

# of
traces Sample Syntax Comments
1 xa.exe -i <Path_To_ETW_Trace1.etl> This is the most common usage. It opens
MXA and loads the specified trace file.
2 xa.exe -i <Path_To_ETW_Trace1.etl>
-i1 <Path_To_ETW_Trace2.etl>
Example application for loading two
traces in the same timeline includes a
client/server scenario.
MXA Supports loading 1 to 10 traces in
the same timeline.
3 xa.exe -i <Path_To_ETW_Trace1.etl>
-i1 <Path_To_Video1.etl> -i2
<Path_To_Video2.etl> -p MIRACAST
The -p argument is for MXA profile. The
Miracast MXA profile contains a layout
that is designed for conducting Miracast
performance investigations. This profile
is built-into the tool.
Tip: To reduce the amount of time it takes to load a trace in MXA:
Click “Turn Symbols Off” on the MXA splash screen.
To disable symbol lookup on load from the command line, pass in the “-q” argument.
o Example: xa.exe -i <Path_To_ETW_Trace1.etl> -q
Use a gigabit Ethernet connection instead of Wifi to connect to the network.
Verify the _NT_SYMBOL_PATH has a path to the local symbol cache (eg.
_NT_SYMBOL_PATH=C:\symobls;C:\symcache;).
UNDERSTANDING THE MXA UI
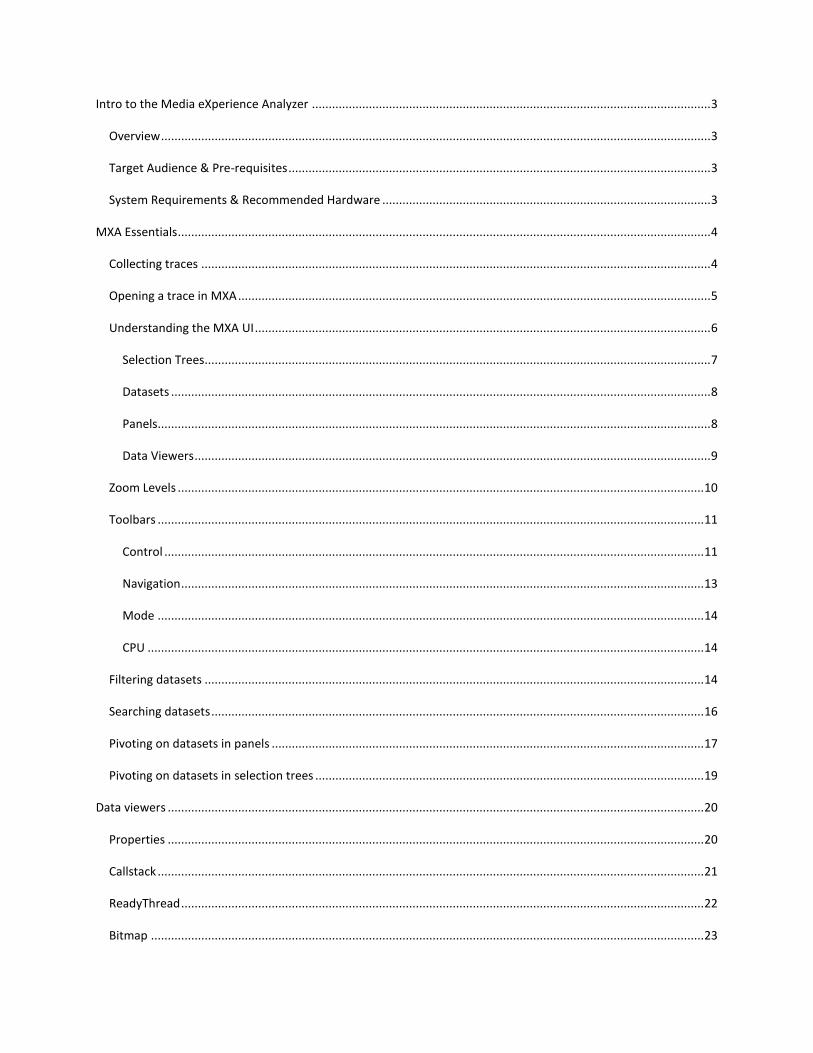
This section describes the 4 major components of the MXA’s UI:
1. Selection Trees are the entry point into a trace.
2. Datasets are logically grouped data accessible from selection trees.
3. Panels are windows that datasets can be visualized in.
4. Data Viewers provide additional details on the elements within a dataset.
On a system that has one monitor, the ideal MXA layout puts the selection tree on the left,
panels in the middle, and data viewers on the right.
To visualize datasets in a trace, drag and drop datasets (eg. CPU Scheduler or GPU DMA
Operations) from the trace selection tree onto a panel.
Hover over events in a panel, to see details about it in the data viewers.
Similar to Visual Studio, all windows in MXA can be re-arranged based on personal preferences or other
monitor configurations. To move a window, drag it to a different location.
Selection Trees
Selection trees contain the path to the trace file at the parent level, followed by logically grouped
datasets at the child level. To bring traces into view, click Traces, Selection Trees, then select the trace.
MXA supports loading several types of traces including ETW, power, and video files.

Selection Tree: ETW Trace
Selection Tree: Power Trace
Selection Tree: Audio/Video MP4 file
Datasets
Selection trees contain the path to the trace file at the parent level. Immediate children of the selection
tree are high-level labels that group datasets in logical groups. For example, in the ETW Trace above, all
CPU related datasets, such as Scheduler and Sampled Profiles exist under the CPU node. Children of
datasets are called data collections and children of data collections are referred to as data units. If a
trace is missing datasets required for analyzing a performance or quality issue, verify the trace was
collected with the full set of ETW providers required for conducting the analysis. MXA contains a sample
WPR profile that contains the ETW providers necessary for analyzing media scenarios.
Panels
Panels are the workspace where most of your interaction and analysis takes place. To visualize data
within datasets, drag and drop datasets onto panels. To create new panels, press CTRL+N or go to the
View menu and click New Panel. An empty panel looks like this:

A panel that had the Utilization GPU dataset dragged onto it looks like this:
Data Viewers
Data viewers provide details or additional debug information around a single event or range of events.
The most commonly used data viewers are Properties, CallStack, and ReadyThread. Here is a brief
overview of the value each data viewer provides. The Data Viewer section covers each of these in more
depth.
Data Viewer Description
Properties Displays event payload information for user and kernel mode events.
CallStack Displays the call stacks from events in CPU Scheduler, CPU Sampled Profile,
and instrumentation datasets.
ReadyThread Displays the call stacks for ReadyThreads in the CPU Scheduler dataset.
Event dumper Displays a list of all events near the current focus of the mouse.
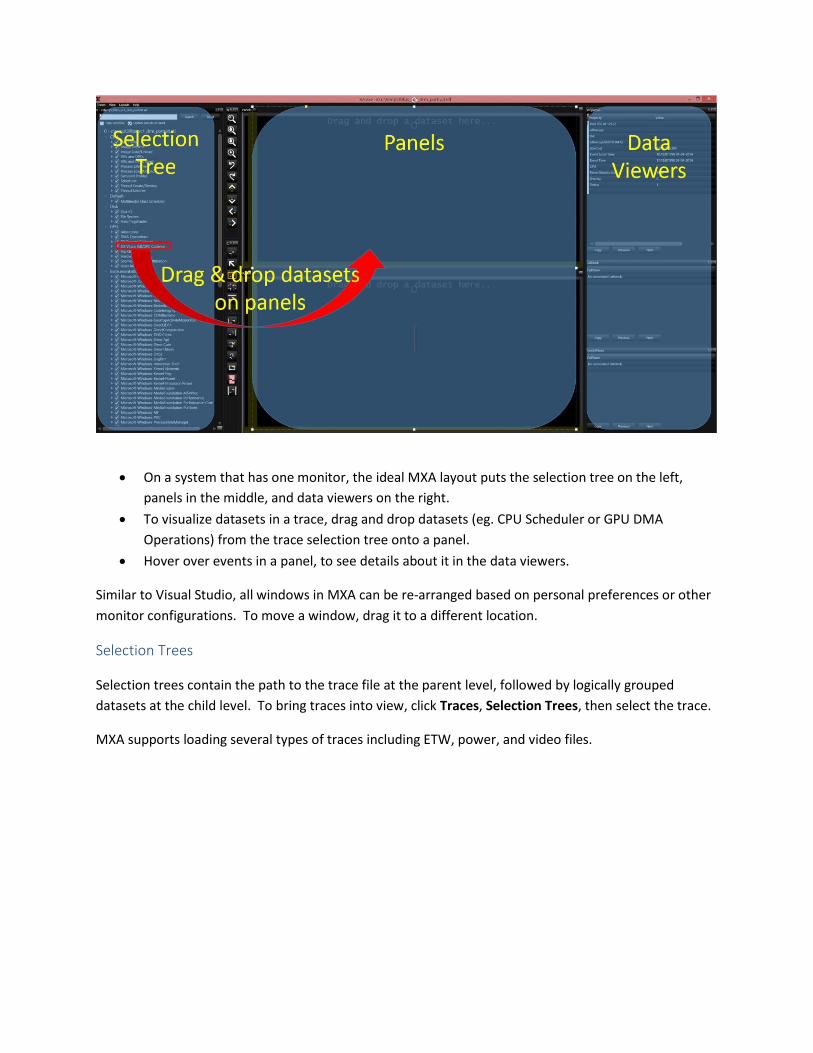
Bitmap
The Bitmap data viewer is used to visualize video frames in a media clip.
Summary
Displays output from custom plugins. For example, the power plugin
displays power stats by pressing ALT + dragging the mouse over a range of
power stats.
ZOOM LEVELS
There are several ways to zoom in and out within the timeline with the mouse and keyboard.
Action Shortcut
Zoom in on a specific part of the timeline Click and drag the mouse cursor over the
portion of the timeline that you want to zoom
in on.
Zoom out to 100% of the full timeline Press Esc
Zoom in <
z
Scroll wheel on mouse
Click zoom in on the control toolbar
Zoom out >
a
Scroll button on mouse
Click zoom out on the control toolbar

Action Shortcut
Auto zoom on the Y axis `
Undo Zoom Click undo zoom in on the control toolbar
Redo Zoom Click redo zoom in on the control toolbar
Toggle between zooming in on full and partial
part of Y axis
Y
TOOLBARS
The toolbars can help you navigate and modify the MXA’s UI. There are four toolbars accessible from
the Toolbars menu:
Controls
Navigation
Mode
CPU
Control
Toggle Vertical Line
Display or hide the vertical line that follows the mouse
movements across all panels. This can help you align
events in multiple datasets.
Toggle Highlight
Highlight or un-highlight an element in a panel. You can
also right-click on an element in a panel and select
Toggle Highlight.
Toggle Border Display or hide the grey border around each panel.
Toggle Grid Display or hide the grid in the background of each panel.

Toggle Top Ruler
Display or hide the ruler at the top of a panel. This ruler
shows the amount of time displayed at the current zoom
level.
Toggle Bottom Ruler
Display or hide the ruler at the bottom of a panel. This
ruler displays the timestamps of the current location in
the trace. (eg. wallclock time).
Toggle Left Ruler Display or hide the ruler on the left side of a panel. This
ruler displays data that is unique to each dataset.
Toggle Right Ruler Display or hide the ruler on the right side of a panel.
This ruler displays data that is unique to each dataset.
Toggle Text
Display or hide the text displayed in the background of
each panel that describes the name of the dataset
presently in view in the panel.
Toggle Help Display or hide the help text that is overlaid on a panel.
Toggle Frame Display or hide the frame of the entire MXA window.
Toggle Red Highlight
Enable or disable the red blinking highlighting feature
that assists with visually identifying events selected in
the selection tree.
Toggle Scalable Y Axis Switch between zooming in on part or all of the Y axis.
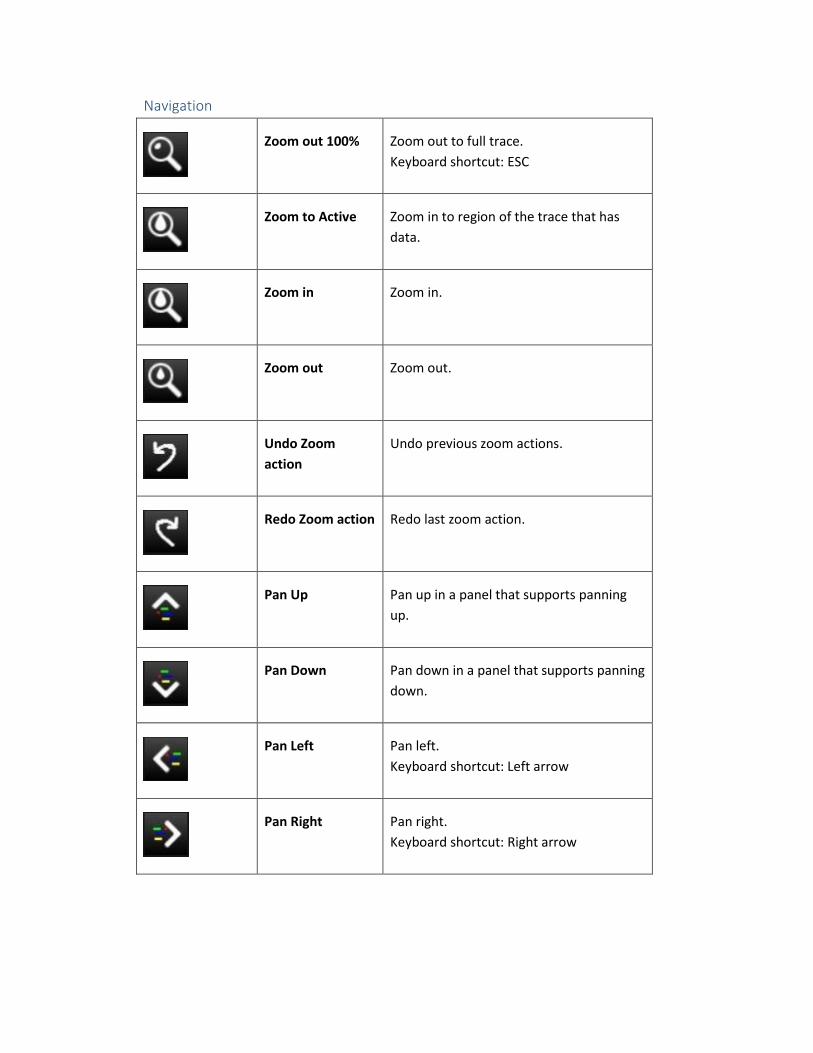
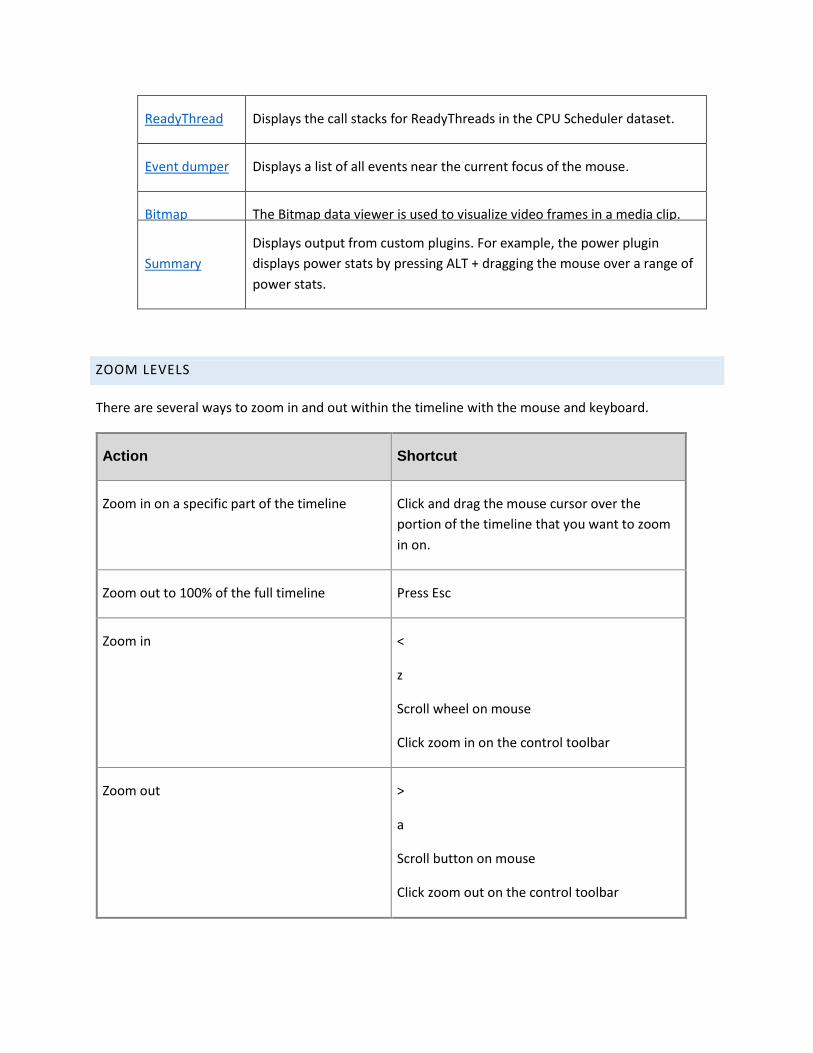
Navigation
Zoom out 100% Zoom out to full trace.
Keyboard shortcut: ESC
Zoom to Active Zoom in to region of the trace that has
data.
Zoom in Zoom in.
Zoom out Zoom out.
Undo Zoom
action
Undo previous zoom actions.
Redo Zoom action Redo last zoom action.
Pan Up Pan up in a panel that supports panning
up.
Pan Down Pan down in a panel that supports panning
down.
Pan Left Pan left.
Keyboard shortcut: Left arrow
Pan Right Pan right.
Keyboard shortcut: Right arrow

Mode
Toggle Color
Mode Backward
Go to the previous color mode
Toggle Color
Mode Forward
Go to the next color mode
Toggle Drawing
Mode Backward
Go to previous dataset pivot
Keyboard shortcut: d
Mouse shortcut: Right click and select pivot
Toggle Drawing
Mode Forward
Go to next dataset pivot
Keyboard shortcut: f
Mouse shortcut: Right click and select pivot
CPU
Display or hide all activity in a panel that contains a
CPU related dataset.
FILTERING DATASETS

Each dataset contains thousands or hundreds of thousands of events. To identify patterns and the cause
of performance issues you can filter out events that are not required for the analysis. One of the filtering
options in MXA is offered in the selection tree. Next to each dataset and each dataset’s child nodes are
check boxes that provide three filtering modes: Show, highlight, and hide elements.
1. Show elements –All elements under the node are displayed. This is the default setting after you
load a trace.
2. Highlight all elements – Click the checkbox next to a dataset once to highlight all elements
under the node.
3. Hide elements – Click the checkbox next to a dataset again, to hide all elements under the node.
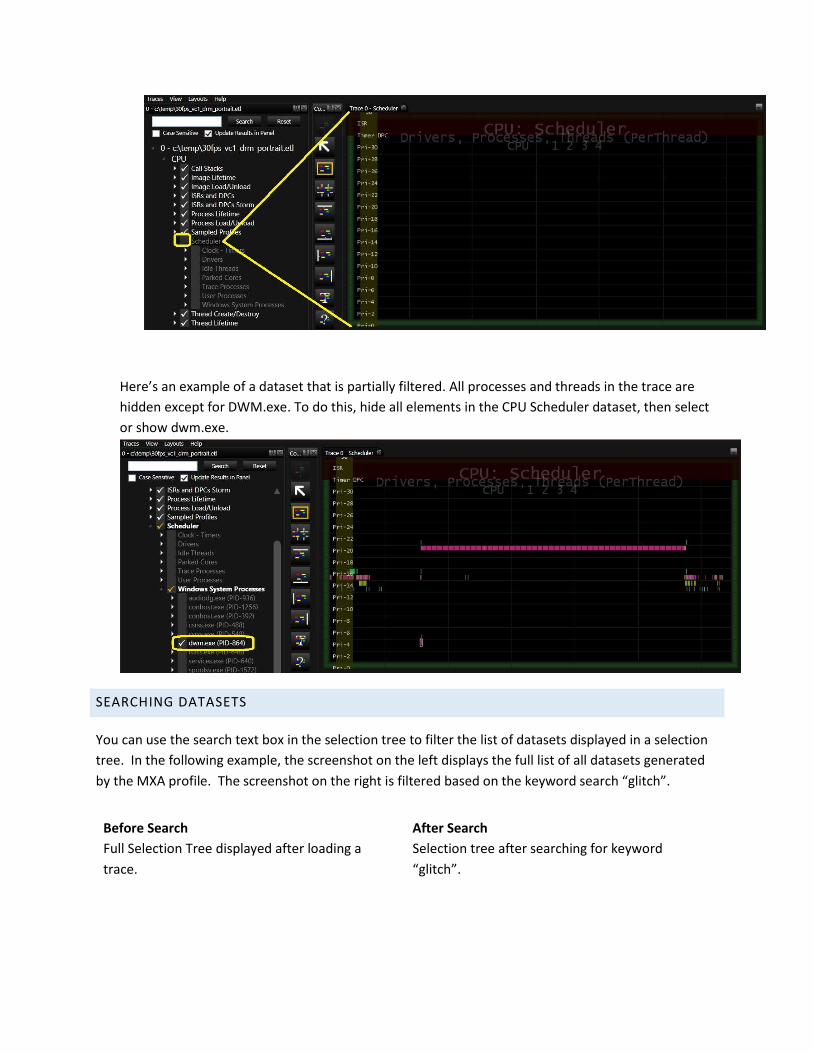
Here’s an example of a dataset that is partially filtered. All processes and threads in the trace are
hidden except for DWM.exe. To do this, hide all elements in the CPU Scheduler dataset, then select
or show dwm.exe.
SEARCHING DATASETS
You can use the search text box in the selection tree to filter the list of datasets displayed in a selection
tree. In the following example, the screenshot on the left displays the full list of all datasets generated
by the MXA profile. The screenshot on the right is filtered based on the keyword search “glitch”.
Before Search
Full Selection Tree displayed after loading a
trace.
After Search
Selection tree after searching for keyword
“glitch”.

PIVOTING ON DATASETS IN PANELS
Most datasets offer several pivots. Pivoting on datasets is done by right clicking on a panel and selecting
a new pivot, by pressing “d”, or “f” on the keyboard.
The following example demonstrates the value of pivoting on datasets:
Example: CPU Scheduler dataset
By default, this dataset displays thread priority in the Y axis. This view enables an engineer to quickly
determine what priority each thread and driver is running at any given point in time. As shown in the
following screenshot, most of the threads in this panel are running at priority 18 or 19.

Changing the pivot to “Drivers, processes, and threads per core”, changes the Y axis from thread priority
to thread activity per core. Each row in the Y axis is now labeled with a core.
Notice how there is no activity on core 2 & 3. If we bring back the parked cores node into the view by
selecting them from the selection tree, we see the cores that were idle were parked. Parked cores are
cores that have become inactive to save power.
This screenshot shows how to visualize parked cores in the CPU Scheduler dataset.

PIVOTING ON DATASETS IN SELECTION TREES
Datasets have a default order in which the child nodes are ordered. Tp change this hierarchy, right-click
the dataset and select a different order or pivot. For example, in the Disk > Disk IO dataset, the default
hierarchy is IO Priority > Process > Thread > IO Type > File Name. In some investigations where the
process and thread of interest are known, it may be easier to pivot on these attributes. The following
screenshot is an example of the types of pivots that are available for the Disk IO dataset.

DATA VIEWERS
Data viewers provide details or additional debug information around a single event or range of events.
The most commonly used data viewers are Properties, CallStack, and ReadyThread. Here is a brief
overview of the value each data viewer provides.
PROPERTIES

The properties data viewer is used to view the properties of an event payload. The event could be a
CSWITCH event or a user mode provider event. The following screenshots are examples of user and
kernel mode event payloads displayed in the properties data viewer.
Microsoft-Windows-MediaEngine
User mode provider
CPU Scheduler
Kernel mode CSWITCH event
CALLSTACK
The CallStack data viewer displays the call stacks from events in CPU Scheduler, CPU Sampled Profile,
and instrumentation datasets. In the following screenshot, this is the NewThreadStack from the CPU
Scheduler CSWITCH event.

CSWITCH / NewThreadStack
When you hover over elements in the CPU Scheduler dataset, the CallStack data viewer displays the call
stack of the CSwitch event or NewThreadStack. The stack on the top is the kernel stack and the one on
the bottom is user mode.
Sampled Profile call stacks
When you hover over elements in the CPU Sampled Profiles dataset, the CallStack data viewer displays
the call stack of a sampled profile event. With stackwalking enabled, the ETW sub-system captures the
instruction pointer and the call stack of what was happening on the CPU every 1ms (default interval).
READYTHREAD
The ReadyThread data viewer displays the call stacks of ReadyThreads in the CPU Scheduler dataset.

BITMAP
The Bitmap data viewer is used to visualize video frames in a media clip. This is commonly used for
Miracast performance analysis where there is a video capture of the source and sink.
To view video frames in the bitmap data viewer:
1. Load a media clip in MXA (eg. xa.exe -i 1080p.mp4)
2. Open the bitmap data viewer: View > Data viewers > Bitmap
3. Drag the video frames into a panel
4. Hover the mouse over a frame

NOTE
The video frames are stored as images in the users temporary folder (%TEMP%) to speed up scrubbing
time. MXA deletes these temp files when the app is closed. Example path to temp files:
C:\Users\<user_name>\AppData\Local\Temp\XA_TMP
SUMMARY
The summary dataviewer displays output from custom MXA plugins. For example, the custom
power parser plugin generates power statistics and displays them in the summary dataviewer.
The following screenshot shows that for a selected range of the power trace (ALT + left mouse click + drag and drop mouse), the system consumed an average of 11.75 Watts and the estimated battery life for this workload is 239 minutes.

EVENT DUMPER
The event dumper data viewer displays a text version of the events the mouse is currently hovering
over. The row that is displayed in larger font size is the event that is currently selected. The event

dumper is commonly used to view a small number of events at one time. It’s also helpful when you
need to export a text version of the events by pressing the “Copy” or “Copy All” buttons.
The “Disable Color” button changes the text to all of the same color instead of using the color that was
assigned to the element.
DATASETS
GPU
DMA Operations
The DMA Operations dataset displays all DMA operations on the GPU. The Y axis in the default pivot
provides activity per GPU adapter, node, and engine.
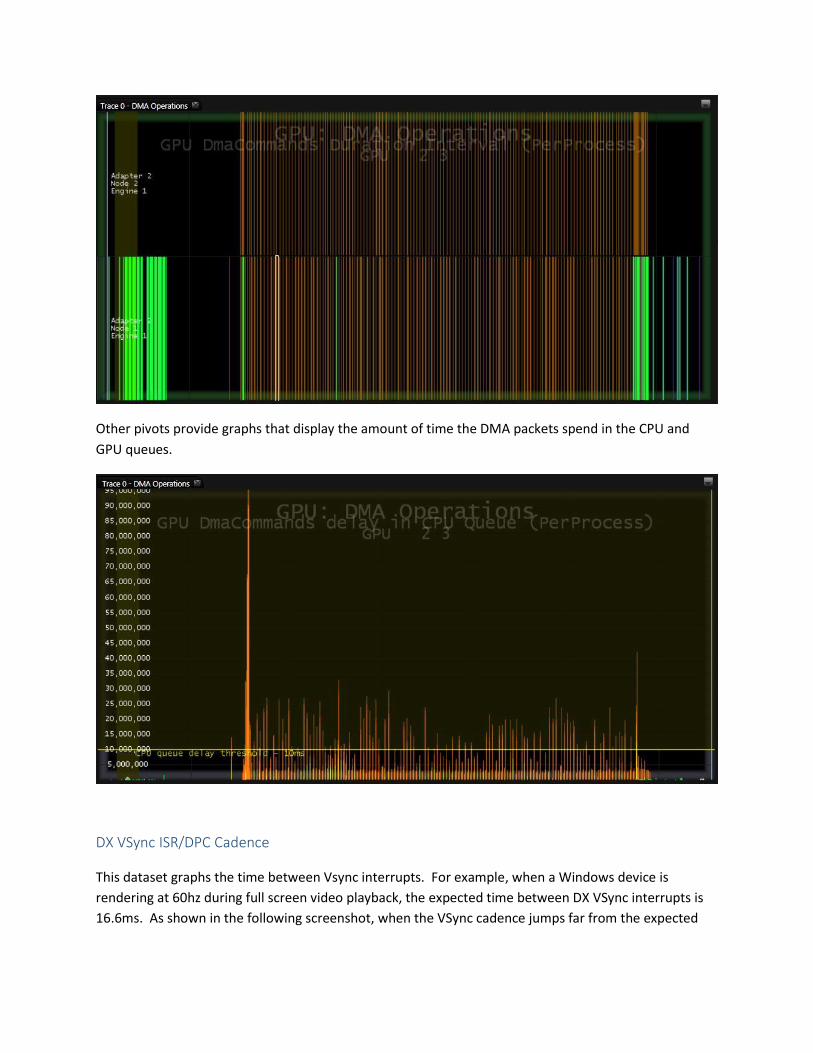
Other pivots provide graphs that display the amount of time the DMA packets spend in the CPU and
GPU queues.
DX VSync ISR/DPC Cadence
This dataset graphs the time between Vsync interrupts. For example, when a Windows device is
rendering at 60hz during full screen video playback, the expected time between DX VSync interrupts is
16.6ms. As shown in the following screenshot, when the VSync cadence jumps far from the expected

value, video glitch events are logged. See the Media video glitch dataset for more information on video
glitches.
MEDIA
Video Glitches
The video glitches dataset in MXA is a collection of events that indicate video frames were dropped or
late. The following events are included in this list.
Event Provider & Task Description
Microsoft-Windows-MediaEngine
Task - VideoFrameGlitch - 23
Indicates a video frame was rendered late. The FramesLate
event property value indicates how many frames were late,
or the severity of the glitch.

Microsoft-Windows-MediaEngine
Task - DroppedFrame - 18
Indicates the media source dropped a frame. This condition
is typically caused by network or disk starvation.
Microsoft-Windows-Dwm-Core
Task - SCHEDULE_GLITCH - 17
Indicates the DWM (Desktop Window Manager) rendered a
frame late. The tGlitch event property value indicates how
late the frame was (eg. 38.77ms which is about 2 vysncs on a
60hz display).
The Y axis contains a row for each core on the system so if the thread that fired a video glitch event was
running on core 0, the glitch event appears on the bottom row.
Video Glitches Severity
The video glitches severity dataset provides a graph of how severity of the Media Engine
VideoFrameGitch events. The Y axis is the FramesLate value of the Media Engine Video glitch event.
This pivot enables engineers to focus on the most severe video glitches. The higher the FramesLate
value, the more severe the video glitch is. In the screenshot below there are 2 panels.
Top panel - The lines in the top panel represent VideoFrameGitch events logged by Media
Engine.
Bottom panel - Provides a pivot on the FramesLate event property of the VideoFrameGitch
event. The glitches that have FramesLate values of 14 – 20 are significantly more severe than
the glitches that were 1 or 2 frames late.

QUICK REFERENCE
KEYBOARD SHORTCUTS

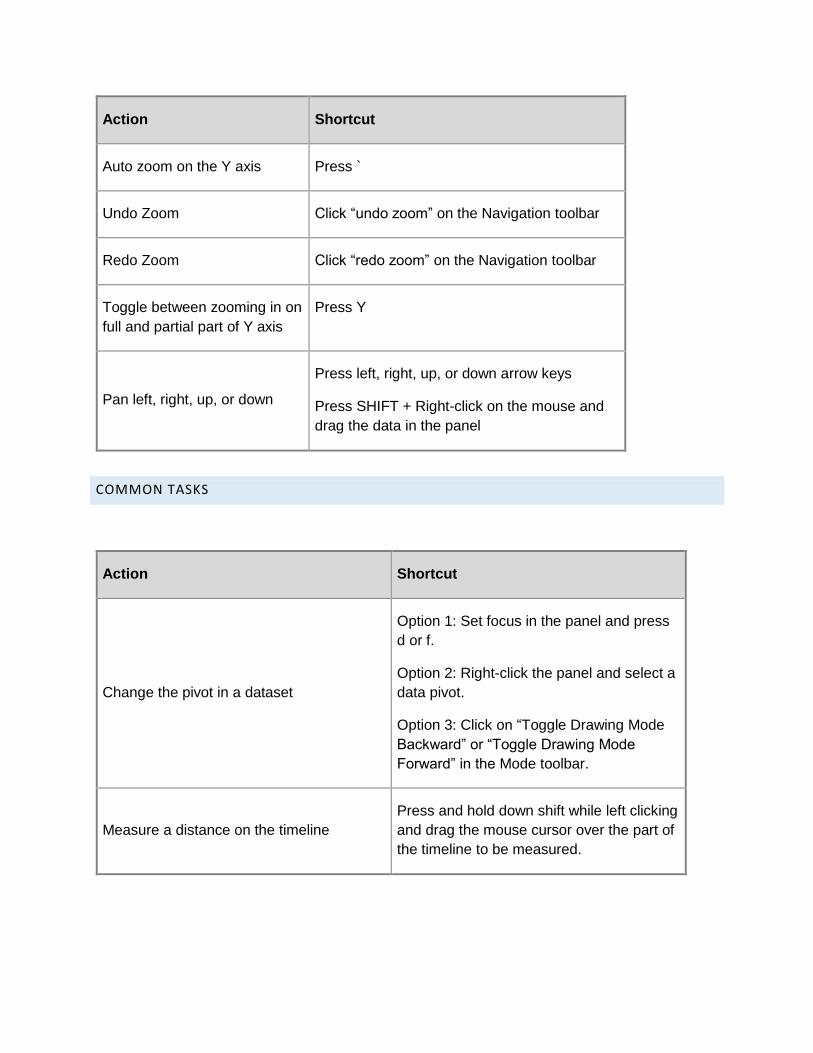
Action Shortcut Purpose
Open a new panel Ctrl + N When you create a new panel, it
provides more real-estate to drag
other datasets into.
Open the Offset Tab Ctrl + O This is used to align traces when
loading multiple traces in the same
timeline.
Da
ta V
iew
ers
Open the CallStack data viewer
Ctrl + C The CallStack data viewer displays
call stacks for events in the CPU
Scheduler, CPU Sampled Profile, and
general instrumentation datasets.
Open the Properties data viewer Ctrl + P View properties of an event payload
Open the Summary data viewer Ctrl + S View summary information of a
dataset or output from a custom MXA
plugin such as the power plugin.
Open the Event Dumper data
viewer
Ctrl + E Displays events in a flat text based
list.
Too
lbars
Open the Navigation toolbar Ctrl + V Contains shortcuts for changing the
zoom level and panning.
Open the Mode Toolbar Ctrl + M Switch color and drawing modes.
Open the Control Toolbar Ctrl + L Modify settings such as whether or
not to display the vertical line across
all panels or toggle the bottom ruler.
Open the CPU Toolbar Ctrl + U Display or hide all activity in a panel
that contains a CPU related dataset.

Action Shortcut Purpose M
achin
e In
fo
Open the General Tab Ctrl + G Displays general hardware system
information of the system that the
trace was collected on.
Open the Display Tab Ctrl + D Displays graphics hardware
information of the system that the
trace was collected on.
Open the Network Tab Ctrl + T Displays networking hardware
information of the system that the
trace was collected on.
NAVIGATION
Action Shortcut
Zoom in on a specific part of
the timeline
Click and drag the mouse cursor over the
portion of the timeline that you want to zoom in
on.
Zoom out to full timeline Press Esc
Zoom in
Press < or z
Use the scroll wheel on mouse
Click “zoom in” on the Navigation toolbar
Zoom out
Press > or a
Use the scroll wheel on mouse
Click “zoom in” on the Navigation toolbar
Action Shortcut
Auto zoom on the Y axis Press `
Undo Zoom Click “undo zoom” on the Navigation toolbar
Redo Zoom Click “redo zoom” on the Navigation toolbar
Toggle between zooming in on
full and partial part of Y axis
Press Y
Pan left, right, up, or down
Press left, right, up, or down arrow keys
Press SHIFT + Right-click on the mouse and
drag the data in the panel
COMMON TASKS
Action Shortcut
Change the pivot in a dataset
Option 1: Set focus in the panel and press
d or f.
Option 2: Right-click the panel and select a
data pivot.
Option 3: Click on “Toggle Drawing Mode
Backward” or “Toggle Drawing Mode
Forward” in the Mode toolbar.
Measure a distance on the timeline
Press and hold down shift while left clicking
and drag the mouse cursor over the part of
the timeline to be measured.

Action Shortcut
View event payload information
Click View > Data Viewers > Properties to
open the data viewer, and then hover over
event.
Freeze information in the Data Viewers Press and hold down Shift.
FREQUENTLY ASKED QUESTIONS & TROUBLESHOOTING
Q: What is the difference between MXA, WPA, & GPUView?
A: MXA provides visualizations that are complimentary to those offered in WPA and GPUView. MXA
visualizations are designed to help you analyze timing and quality issues that are often found in
multimedia scenarios. MXA also supports loading non-ETW trace formats such as MP4 video files and
power traces in text format.
Q: How to freeze data inside data viewers?
A: Press and hold SHIFT to freeze the data displayed in data viewers.
RELEASE NOTES
Date Change Comments
5/23/2014 MXA Published Initial release of MXA published.
10/1/2015 MXA bug fix release Contains several dozen bug fixes since the initial release.
FEEDBACK
Please send feedback to [email protected]