Media Effects on Attitudes Towards the Criminal Justice System
29
East Tennessee State University Digital Commons @ East Tennessee State University Undergraduate Honors eses Student Works 5-2015 Media Effects on Aitudes Towards the Criminal Justice System Emily Werner Follow this and additional works at: hps://dc.etsu.edu/honors is Honors esis - Open Access is brought to you for free and open access by the Student Works at Digital Commons @ East Tennessee State University. It has been accepted for inclusion in Undergraduate Honors eses by an authorized administrator of Digital Commons @ East Tennessee State University. For more information, please contact [email protected]. Recommended Citation Werner, Emily, "Media Effects on Aitudes Towards the Criminal Justice System" (2015). Undergraduate Honors eses. Paper 299. hps://dc.etsu.edu/honors/299
Transcript of Media Effects on Attitudes Towards the Criminal Justice System

East Tennessee State UniversityDigital Commons @ East Tennessee State University
Undergraduate Honors Theses Student Works
5-2015
Media Effects on Attitudes Towards the CriminalJustice SystemEmily Werner
Follow this and additional works at: https://dc.etsu.edu/honors
This Honors Thesis - Open Access is brought to you for free and open access by the Student Works at Digital Commons @ East Tennessee StateUniversity. It has been accepted for inclusion in Undergraduate Honors Theses by an authorized administrator of Digital Commons @ East TennesseeState University. For more information, please contact [email protected].
Recommended CitationWerner, Emily, "Media Effects on Attitudes Towards the Criminal Justice System" (2015). Undergraduate Honors Theses. Paper 299.https://dc.etsu.edu/honors/299

1
Media Effects on Attitudes Towards the Criminal Justice System
Thesis submitted in partial fulfillment of Honor’s in Discipline East Tennessee State University
By
Emily Werner
_________________________________________ Bradley Edwards, Faculty Mentor
_________________________________________ Courtney Crittenden, Reader
__________________________________________ Scott Contreras-Koterbay, Reader
2
Abstract
This study investigated the effect of media on attitudes toward the criminal justice
system. A survey was administered to 167 undergraduate students at East Tennesse State
University in criminal justice and fine and performing arts classes. Respondents were
asked how much television they watch, what their primary news source was, and how
accurate crime-related television programs are. Multivariate analysis showed that age
and major affected attitudes more than media consumption.

3
Table of Contents
Abstract................................................................................................................................ 2 Chapter 1: Introduction........................................................................................................ 4 Description of Study................................................................................................ 4 Attitudes Towards Criminal Justice......................................................................... 4 Types of Media........................................................................................................ 6 Hypotheses............................................................................................................... 7 Chapter 2: Literature Review............................................................................................... 8 Media Effects on Viewers........................................................................................ 8 Attitudes Towards Criminal Justice System............................................................ 9 Race............................................................................................................ 10 Gender........................................................................................................ 10 Age............................................................................................................. 11 Major.......................................................................................................... 11 Experience with the Criminal Justice System............................................ 12 Chapter 3: Methodology.................................................................................................... 13 Data Collection...................................................................................................... 13 Outcome Measures................................................................................................. 13 Variables................................................................................................................ 14 Chapter 4: Results.............................................................................................................. 15 Univariate Statistics............................................................................................... 15 Bivariate Statistics..................................................................................................17 Correlations................................................................................................ 17 Chi Square.................................................................................................. 18 T Test......................................................................................................... 19 Multivariate Analysis............................................................................................. 20 Regression.................................................................................................. 20 Chapter 5: Conclusion........................................................................................................ 22 Discussion.............................................................................................................. 22 Limitations............................................................................................................. 22 Suggestions for Future Studies.............................................................................. 23 References.......................................................................................................................... 24 Appendix............................................................................................................................ 27

4
Chapter 1:Introduction
In this technological age, the media is constantly expanding its reach to
consumers. One area that has quickly grown in the past decade is television. People now
can watch live TV, DVR their shows, and watch them online or on DVD. The addition
of services such as Netflix and Hulu Plus have greatly added to the television library that
is immediately available to the public. With all of these additions, television is easily and
constantly consumed. Therefore it is very important to look at any effect television has
on the public, especially concerning the criminal justice system. The criminal justice
system is supposed to protect the public and give justice to criminals, but its mission
could be undermined if the public does not accurately understand it.
Description of Study
This study will measure the amount of television watched and the attitudes toward
the criminal justice system to see if any significant relationship exists. There have been
many studies that look at the correlation between television programs in connection to
violence, but not many on attitudes towards the criminal justice system. The sample
population is undergraduate students at East Tennessee State University. The study
focused on courses taught in the criminal justice as well as the fine and performing arts
departments in an attempt to uncover any differences in perceptions that might be linked
to a students’ academic major.
Attitudes Towards Criminal Justice
All criminal justice officials have been portrayed certain ways by the media.
These images have changed over the years, often very drastically. False portrayals of
these professions can be damaging to both the professionals and the people they are

5
supposed to be serving. Many have been portrayed both positively and negatively,
depending on what is happening in society at the time. These portrayals are particularly
influential for individuals who have little or no contact with the criminal justice system,
as they may easily rely on the media images to form their view of the criminal justice
system.
Lawyers are common in television and film, as they can and do generally appear
in any genre. In dramas, they are typically portrayed as attorneys willing to do anything
to win the case, even if it is illegal or allows a criminal to walk free. In comedies lawyers
are often greedy and take advantage of other characters. Lawyers used to be portrayed as
honest, moral individuals, but the rise of divorce and the verdict of the OJ Simpson trial
changed their depiction. Divorce allowed more and more people to come in contact with
lawyers, which allowed them to be seen as more everyday and less idealistic. The OJ
Simpson trial first caused people to see that lawyers can get off suspects that most people
would see as clearly guilty, and many trials since have proved the same point. The
commonality of lawyers in each genre makes them a prime candidate for false
stereotyping (Surette, 2015).
Police officers also have been portrayed several ways. They have been shown as
silly and incompetent, harsh and commanding, dirty cops, or an average citizen who rises
in the ranks honorably (Surette, 2015). Now, it seems that actual coverage of police
officers on the news is eclipsing the fictionalized versions. The few stories that are being
shown have the same effect; officers are now viewed either very negatively or very
positively, but only based on the few stories being shown. Individuals are more likely to
have actual contact with police officers, so their prior perception of them can shape how
6
the interaction occurs (Surette, 2015). This can lead to perpetuations of a certain
stereotype, which feeds into inaccurate views.
Correctional officials have been portrayed minimally, but are generally shown as
harsh and abusive (Surette, 2015). They aid prisoners in smuggling in contraband,
unjustly punish, and blackmail prisoners into doing work or favors for them. This is a
criminal justice profession in which most people will never have contact with, even more
so than all other officials. Television’s portrayal of correctional officers might have a
stronger effect given the fact that the public has less frequent contact with these
professionals.
All of these different portrayals are very important, as they can shape what the
public attitude toward the criminal justice system is. Inaccurate portrayals lead to
stereotyping and false perceptions of the world, which can be very dangerous.
Types of media
Television and film have become some of the most popular and far reaching
forms of media. They are where most of the false stereotypes about criminal justice
officials arise. Even though they are mostly fictional portrayals, people will assume they
are correct due to little experience with criminal justice professionals.
Print publications have been an important type of media for societies for
centuries. Although declining in popularity, they still provide a lot of information for
subscribers. Unfortunately, these magazines and newspapers often favor a political party,
which skews the information for readers (Covert & Washburn, 2007).
The internet has combined different types of media and made everything much
more accessible. Even though it is relatively new, it has made everything more

7
accessible much faster. This rapid spread of information has been pivotal in the spread of
events as they happen. Both fictional portrayals and actual news stories can be spread
around, in small clips that can be easily taken out of context. This combined with
political stances of shows or publications can scramble the truth and further contribute to
false stereotypes.
Hypotheses
The main purpose of this study is to determine if there is any relationship between
media consumption and attitudes towards the criminal justice system.
Hypothesis 1: Students who watch more television have a different perception of the
criminal justice system than students who do not watch television regularly
Hypothesis 2: When controlled for audience traits, differences in media effects will
impact attitudes toward criminal justice system.
Hypothesis 3: Differences in perceived reality of crime media will impact attitudes
toward the criminal justice system.
Hypothesis 4: Type of crime media will have significantly different effects on attitudes
toward the criminal justice system.

8
Chapter 2:Literature Review
Media Effects on Viewers
Most studies looking at the correlation between media and crime focus on the
cultivation theory. This theory, written and researched by George Gerbner and Larry
Gross (1976), lays the foundation for all media and crime studies. Gerbner and Gross
(1976) hypothesized that an increase in TV consumption would result in a distortion of
reality, as the “TV world” either exaggerates or understates different aspects of society.
Gerbner and Gross (1976) found ample support for this hypothesis. After surveying
adults, they found that heavy TV viewers were more likely to give TV world estimates as
real world estimates, representing the idea that TV programs can cultivate their own
realities for viewers. (Gerbner and Gross, 1976). This theory has been the foundation for
most studies that look at TV and effects on viewers.
Several studies have gone on to further expand upon the cultivation theory, but
have applied it to the criminal justice field. Carlson (1985) conducted a study on 619
sixth through twelfth grade students, as this is an important time in development, and the
addition of television could impact this development. Carlson (1985) found further
support for the cultivation theory, and found that heavy TV viewing can alter how the
criminal justice system is percieved. The study found serious misunderstandings about
the system and an increased fear of the world due to the crime portrayed on television
(Carlson, 1985). Appel (2008) also found that higher television consumption leads to a
greater fear of crime and mistrust of the world. Many studies have found that the more
crime related media an individual consumes, the more fearful of crime they are (e.g.
Dowler, 2003; Kort-Butler and Sittner Hartshorn, 2011)

9
Another effect of the media on the criminal justice system is support for justice
and preventative measures. Carlson (1985) found in his study that those who have a
heavy TV consumption thought that support for the criminal justice system was desirable,
but also found a mistrust of government officials and spending. Nabi and Sullivan (2001)
also found a correlation between high amount of television watched and taking protective
actions against crime.
The cultivation theory goes beyond a general amount of television viewed and
estimates of the real world. Watching too much television can cause an overestimation of
rates of crime both in reality and on television (Hetrosini and Tukachinsky, 2006).
Hetrosini and Tukachinsky (2006) asked participants to provide their average amount of
televsision watched daily and choose from three options the rates of crime portrayed on
television and in the real world. They found that participants fell into five distinct
categories, ranging from no cultivation to overcultivation. Those who had watched the
most television were most likely to over estimate the crime rates in the real world and in
the television world, while those in the medium category simply over estimated the rates
of crime in the real world. (Hetrosini and Tukachinsky, 2006).
Attitudes Towards Criminal Justice System
Attitudes towards the criminal justice system play an important role in society.
Confidence levels can change the support for the system and certain policies. The lower
the confidence levels, the more likely citizens will not respect the system (Indermaur and
Roberts, 2009). Respect for the system and public opinion are closely tied. Public
opinion is largely connected with pressure to change crime policies (Toch and Maguire,
2014), especially when there is a high fear of a certain crime (Dowler, 2003). Public

10
attitudes can shape important policies and laws, even if the public opinion is not an
accurate reflection of reality.
Race
Race has a large impact upon attitudes towards the criminal justice system,
particularly with white and black individuals. A 2012 poll showed that overall, white
citizens have more confidence in the criminal justice system than black citizens do
(Dowler, 2003; Sourcebook of Criminal Justice Statistics Online, 2012). Black citizens
also have an increased fear of being victimized (Sims and Johnston, 2004). The
combination of a lack of confidence and a fear of crime can lead to unrest and a complete
distrust of the system. Black citizens also have a greater support for early intervention
programs than incarceration or more punitive attitudes (Dowler, 2003; Hart Research
Associates, 2002; Sims and Johnston, 2004). White citizens are also more likely to have
a more punitive approach to crime than black citizens, who have a tougher approach to
the causes of crime, meaning that they would like to deter crime before it happens, as
opposed to punishing offenders after they have committed the crime (Hart Research
Associates, 2002). This difference shows how important race is in attitudes towards the
criminal justice system.
Gender
Several studies have explored the differences between genders concerning
attitudes toward the criminal justice system. Males are generally more confident in the
system than females (Sims and Johnston, 2004; Sourcebook of Criminal Justice Statistics
Online, 2012). Females also tend to have a greater fear of crime (Dowler, 2003; Kort-
Butler and Sittner Hartshorn, 2011). A lower level of confidence and a higher fear and

11
crime can lead to a mistrust and lack of respect for the criminal justice system. Females
are also more likely to support rehabilitation programs than incapacitation (Sims and
Johnston, 2004). Gender has an affect on how individuals view the criminal justice
system.
Age
There are differences in the attitudes towards the criminal justice system across
age ranges as well. In 2012, a survey showed that 40% of individuals surveyed who were
18 to 29 years old were very confident in the criminal justice system, while those 30 to 49
years old were overall the least confident in the criminal justice system (Sourcebook of
Criminal Justice Statistics Online, 2012). These differences can affect how policies could
change with each generation. The more age increases, the more conservative the view of
crime and punishment (Hart Research Associates, 2002; Sims and Johnston, 2004). Age
has an evident affect on attitudes towards criminal justice.
Major
An individual’s academic major in can also affect their attitudes towards the
criminal justice system. Little research has been done on the differences in attitudes
between majors, but the strongest affect is a major in criminal justice. Those who have
more classes that involve criminal justice issues have different viewpoints of aspects of
the criminal justice system, such as a more liberal view of punishments (Mandracchia et
al, 2013). It is unsurprising that taking classes that deal with criminal justice subjects
have an affect on how those students see the criminal justice system.

12
Experience With Criminal Justice System
Experience with the criminal justice system can have varying effects. Those who
have been victimized or have family that has been victimized or arrested are more likely
to support rehabilitation than the general public (Hart Research Associates, 2002;
Rosenberg and Callanan, 2011). This suggests that those that have had direct or almost
direct contact with crime are more likely to support measures that can stop crime before it
begins, instead of punishing the criminal after the crime.

13
Chapter 3: Methodology
Sample
The sample consisted of undergraduate students enrolled at East Tennessee State
University. A convenience sample was taken of Criminal justice and fine and performing
arts classes. Instructors were contacted via email and asked if a survey could be given to
their classes. The email stated the purpose of the survey and approximately how long the
survey would take to be completed. Eight professors were emailed, and six responded
that they would participate. A total of nine classes were surveyed, and 167 students
participated.
Data Collection
A self-administered survey was used to collect the data. The survey was two
pages long and contained twenty-one questions. The dependent variable, attitude toward
criminal justice system, and independent variables, exposure to the media and contact
with the criminal justice system, were measured through this survey. The control
variables included age, gender, race, and major. Age was measured at the interval level.
Gender, race, and major were categorical values. Race options included white, black,
Asian, Hispanic, and other. Major options included criminal justice, digital media, music,
theater, visual arts, and other.
Outcome Measures
The dependent variable, attitude toward the criminal justice system, was measured
in the survey through ten questions on a five item scale. Participants were asked how
much they agree or disagree (1=strongly agree, 2=agree, 3=neutral, 4=disagree,
5=strongly disagree) with a given statement. Measured statements included “the criminal

14
justice system effectively punishes offenders” and “my local police department does a
good job.” This scale was designed to examine several dimensions of the criminal justice
system, such as police and courts (see Appendix).
Variables
The independent variable was exposure to the media. As such, several media
related questions were included in the survey and include hours of TV per day, primary
news source, TV shows watched, and media exaggeration of crime. Hours of TV per day
were measured at a ratio level. Primary news source was categorical, and included
television, newspaper, radio, social interactions/words of mouth, Internet, and other. TV
shows were categorical, and included crime drama shows, crime reality shows, local
news, and national news. Media exaggeration was measured through two questions:
News program crime exaggeration and TV crime drama crime reality. They were both
categorical (see Appendix). News program exaggeration options included exaggerate
crime a lot, exaggerate crime a little, get it about right, and underestimate crime. TV
crime drama reality options included are very realistic, are somewhat realistic, are
somewhat unrealistic, and are very unrealistic.
Contact with the criminal justice system was also an independent variable. It was
measured through two questions at the ratio level. Participants were asked how much
contact they have had with the criminal justice system in the last twelve months, and how
much contact family and friends had with the criminal justice system in the last twelve
months.
15
Chapter 4: Results
Univariate Statistics
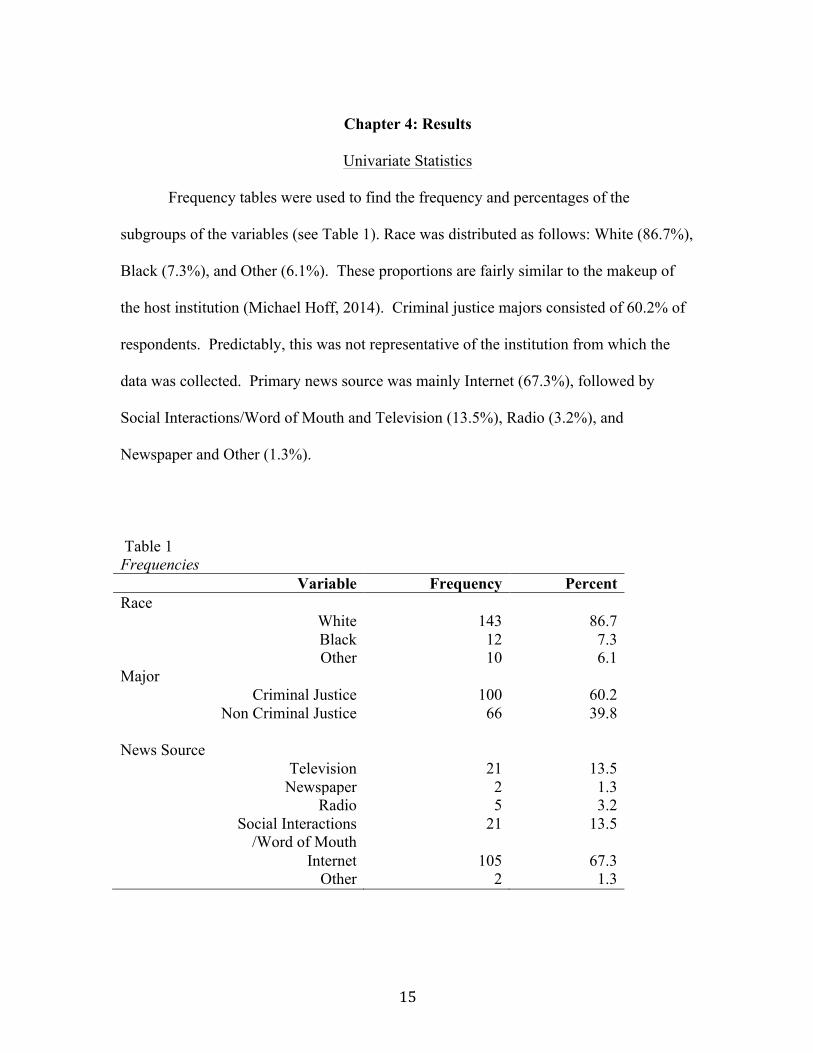
Frequency tables were used to find the frequency and percentages of the
subgroups of the variables (see Table 1). Race was distributed as follows: White (86.7%),
Black (7.3%), and Other (6.1%). These proportions are fairly similar to the makeup of
the host institution (Michael Hoff, 2014). Criminal justice majors consisted of 60.2% of
respondents. Predictably, this was not representative of the institution from which the
data was collected. Primary news source was mainly Internet (67.3%), followed by
Social Interactions/Word of Mouth and Television (13.5%), Radio (3.2%), and
Newspaper and Other (1.3%).
Table 1 Frequencies
Variable Frequency Percent Race
White 143 86.7 Black 12 7.3 Other 10 6.1
Major Criminal Justice 100 60.2
Non Criminal Justice 66 39.8
News Source
Television 21 13.5 Newspaper 2 1.3
Radio 5 3.2 Social Interactions
/Word of Mouth 21 13.5
Internet 105 67.3 Other 2 1.3

16
In order to establish some baseline measures for important variables within the
sample, frequencies were also computed for respondents’ age, television consumption,
and contact with the criminal justice system (see Table 2). The minimum age was 18,
and the maximum was 36, with a mean of 21.02. The average amount of TV watched per
day was 2.3 hours. The average direct contact with the criminal justice system in the last
twelve months was 1.93, while vicarious contact with criminal justice system was 2.51.
Table 2 Descriptive Statistics Variable Minimum Maximum Mean Standard
Deviation Mode Median
Age 18 36 21.02 2.50 20 21 Hours of TV Watched Per Day
0
8
2.30
1.62
2
2
Direct Contact with CJ System
0
25
1.93
3.29
0
1
Vicarious Contact with CJ System
0
30
2.51
3.56
0
2
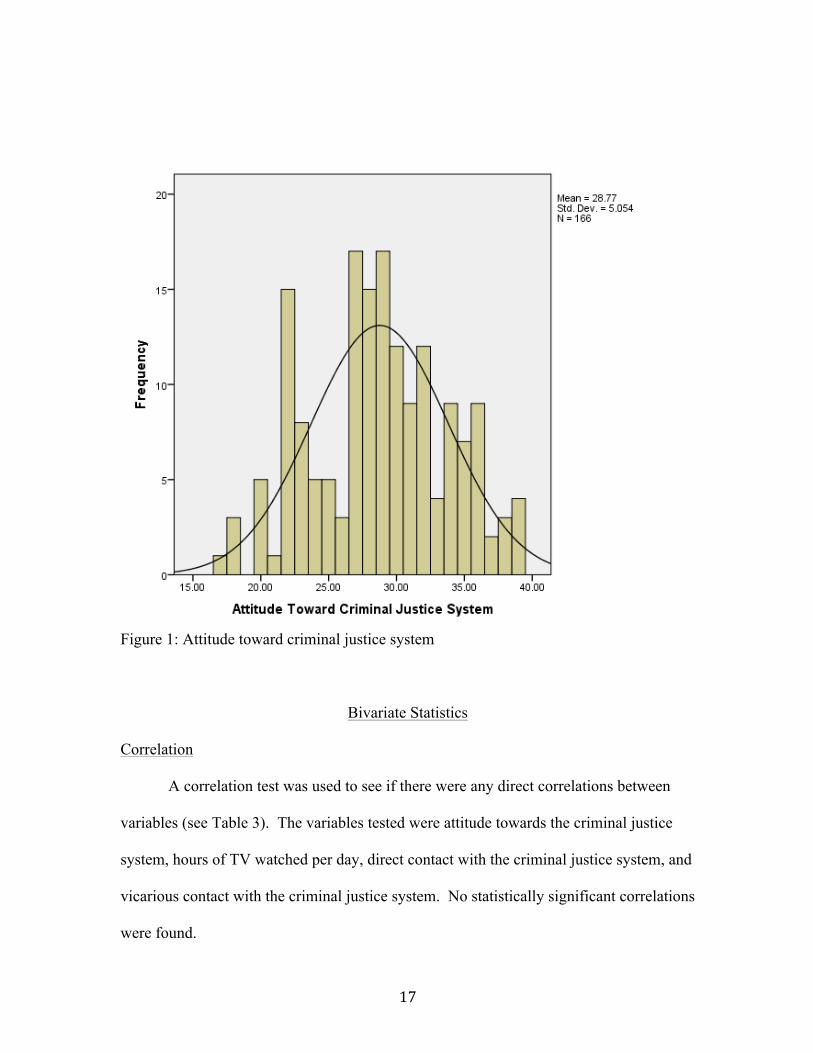
Scores for the attitude toward criminal justice scale ranged from 10 to 50, with
lower scores indicating a negative attitude toward the criminal justice system. The mean
was 28.77, indicating that the respondents had a moderate view of the criminal justice
system. The distribution of scores were normally distributed (see Figure 1).
17
Figure 1: Attitude toward criminal justice system
Bivariate Statistics Correlation
A correlation test was used to see if there were any direct correlations between
variables (see Table 3). The variables tested were attitude towards the criminal justice
system, hours of TV watched per day, direct contact with the criminal justice system, and
vicarious contact with the criminal justice system. No statistically significant correlations
were found.

18
Table 3: Correlations Attitude Toward
Criminal Justice System
Hours of TV Per Day
Direct Contact with Criminal Justice System
Attitude Towards Criminal Justice System
_
_
_
Hours of TV Per Day
.081
Direct Contact With Criminal Justice System
.103
.031
Vicarious Contact With Criminal Justice System
.154
-.062
.584
N = 167 Chi Square
The Chi Square test was used to see the dispersion between variables and attitude
towards the criminal justice system. The differences between primary news sources and
white and black individuals were tested. While no significant relationships between race
and the independent variables were found, the results indicated that there were some
minute differences. White individuals were more likely to have a positive attitude
(32.2%) then black individuals (18.2%). Those who watched TV were more likely to
have a positive attitude (47.6%), as were those who listen to radio as their primary news
source (100%).

19
Table 4 Crosstabs of attitudes toward criminal justice system and important independent variables
Attitude Toward Criminal Justice System Negative Moderate Positive
News Source
Television 3 (24.3%) 8 (38.1%) 10 (47.6%) Newspaper 0 0 2 (100%)
Radio 3 (60%) 1 (20%) 1 (20%) Social
Interaction/Word of Mouth
7 (33.3%)
9 (42.9%)
5 (23.8%)
Internet 27 (25.7%) 49 (46.7%) 29 (27.6%) Other 1 (50%) 1 (50%) 0
Race
White 36 (25.2%) 61 (42.7%) 46 (32.2%) Non White 7 (31.8%) 11 (50%) 4 (18.2%)
T Test
The T Test was used to show the differences in means between variables and their
significance (see Table 5). The most significant finding is the difference between
criminal justice and non-criminal justice majors. Criminal justice majors had statistically
higher means, indicating a more positive attitude of the criminal justice system (29.790),
than non-criminal justice majors (27.212). Although the others had no statistically
significant differences, the some variables did have a difference in means. White
respondents overall had a slightly higher score (28.979) than Non White respondents
(27.318). Respondents with direct contact with the criminal justice system overall had a
slightly lower score (28.495) than those with no direct contact (29.127).

20
Table 5 Attitude toward criminal justice t-tests
Mean Degrees of Freedom Significance Race 163 .453
White 28.979 Non White 27.318
News Programs 162 .302 Exaggerate 28.818
Not Exaggerate 28.095 Direct Contact with
Criminal Justice System
164 .388
Contact 28.495 No Contact 29.127
Major 164 .937 Criminal justice 29.790
Non Criminal Justice
27.212
Multivariate Analysis Regression
A regression model was used to find the significance of variables and attitude
toward the criminal justice system (see Table 6). Two variables, age and major, had
statistically significant impact on attitude toward the criminal justice system. Age was
found to have a .097 significance, which is significant on a .10 significance level. It was
found to have a negative correlation, so the older the respondent, the more negative the
attitude toward the criminal justice system. Being a criminal justice major was found to
have a significance of .002, which is significant on a .05 significance level. It had a
positive correlation, as criminal justice majors had a more positive attitude toward the
criminal justice system than non criminal justice majors.

21
Table 6 Regression Variable Beta Significance Age -.144 .097* Hours of TV Per Day -.003 .969 Direct Contact with CJ System
.026 .802
Vicarious Contact with CJ System
.096 .347
Watched Reality Crime TV Show
.003 .969
Watched Local News .014 .877 Watched National News .019 .834 White -.020 .875 Black -.082 .504 CJ Major .280 .002** Gender .092 .265 R2 .119 * p = <.10 ** p = <.05

22
Chapter 5: Conclusion
Discussion
Previous research has found a correlation between media consumption and fear of
crime or attitudes towards specific criminal justice professionals. However, not much
attention has been given to the effect on the criminal justice system as a whole. The
purpose of this study was to determine what effects, if any, television viewing has on
attitudes towards the criminal justice system. This research was directed by the following
hypotheses:
Hypothesis 1: Students who watch more television have a different perception of the
criminal justice system than students who do not watch television regularly. This
hypothesis was not supported.
Hypothesis 2: When controlled for audience traits, differences in media effects will
impact attitudes toward criminal justice system. This hypothesis was not supported.
Hypothesis 3: Differences in perceived reality of crime media will impact attitudes
toward the criminal justice system. This hypothesis was not supported.
Hypothesis 4: Type of crime media will have significantly different effects on attitudes
toward the criminal justice system. This hypothesis was not supported.
Limitations
There are several limitations to this study. First, the sample is both nonrandom
and very small, and taken only at one university in one part of the country. It also
focuses on students enrolled in criminal justice and fine and performing arts courses, so
these make the sample non-representative of college students as a whole. The sample

23
will also mainly consist of young college students, which is not representative of the
general population outside of college students.
Suggestions for Future Studies
Future studies could survey a bigger sample, which could give a more accurate
reflection of the population surveyed. Studies also could use a broader sample, and
survey individuals outside of college to show the attitudes of the general population. The
scale used had a low alpha level, which indicates that the survey was measuring more
than one dimension. A different scale could be used to be more comprehensive.
Questions could be asked to cover more aspects of the criminal justice system.

24
References Appel, Markus (2008). “Fictional Narratives Cultivate Just-World Beliefs” Journal of
Communication, 58, 62-83.
Battersby, Emily & Robinson, Wolfgang G. (2012). “Paradise Lost: Media In Injustice
and Injustice in Media” Journal of Sports and Entertainment Law, 22, 29-58.
Carlson, James M (1985). Prime Time Law Enforcement:Crime Show Viewing and
Attitudes Toward the Criminal Justice System. New York: Praeger.
Covert, T. J.A. & Wasburn, P.C. (2007). Measuring media bias: A content analysis of
Time and Newsweek coverage of domestic social issues, 1975-2000. Social
Science Quarterly, 88(3), 690-706
Dowler, K., Fleming, T., & Muzzatti, S. L. (2006). “Constructing Crime: Media, Crime,
and Popular Culture” (Canadian Hournal of Criminology and Criminal Justice,
48, 837-850.
Dowler, Kenneth (2003). “Media Consumption and Public Atittudes Toward Crime
and Justice: The Relationship Between Fear of Crime, Punitive Attitudes, and
Percieves Police Effectiveness” Journal of Criminal Justice and Popular Culture,
10, 109-126.
Edwards, Bradley (2007). Media: Effects on Attitudes Toward Police and Fear of
Criminal Victimization. (Unpublished Thesis) East Tennessee State University.
Gerbner, George & Gross, Larry (1976). “Living With Television: The Violence
Profile” Journal of Communication, 173-194.
Hart Research Associates (2002). Changing Public Attitudes Toward the Criminal
Justice System
25
Hetsroni, Amir & Tukachinsky, Riva H. (2006). “Television-World Estimates, Real
World Estimates, and Television Viewing: A New Scheme for Cultivation”
Journal of Communication, 56, 133-156.
Indermaur & Roberts (2009). “Confidence in the Criminal Justice System” Trends &
Issues in Crime and Criminal Justice, 387,
Kort-Butler & Sittner Hartshorn (2011). “Watching the Detectives:: Crime
Programming, Fear of Crime, and Attitudes about the Criminal Justice System”
The Sociological Quarterly, 52, 36-55.
Mandracchia, Jon T; Shaw, Lucas B; & Morgan, Robert D (2013). “What’s With the
Attitude?: Changing Attitudes About Criminal Justice Issues” Criminal Justice
Behovior, 40, 95-113.
Nabi, Robin L & Sullivan, John L. (2001). “Does Television Viewing Relate to
Engagement in Protective Action Against Crime?: A Cultivation Analysis From a
Theory of Reasoned Action Perspective” Communication Research, 28, 802-825.
Rosenberger, Jared S & Callanan, Valerie J (2011). “The Influence of Media on Penal
Attitudes” Criminal Justice Review, 36, 435-455.
Sims, Barbara & Johnston, Eric (2004). “Examining Public Opinion about Crime and
ustice: A Statewide Study” Criminal Justice Policy Review, 15, 270-293.
Sourcebook of Criminal Justice Statistics Online (2012). Reported Confidence in the
Criminal Justice System [Data File]. Retrieved from
http://www.albany.edu/sourcebook/pdf/t2112012.pdf
Surette, Ray (2010). Media, Crime, and Criminal Justice: Images, Realities, and
Policies. Belmont, CA: Cengage Learning.

26
Toch, Hans & Maguire, Kathleen (2014). “Public Opinion Regarding Crime, Criminal
Justices, and Related Topics: A Retrospect” Journal of Researc in Crime and
Delinquency, 51, 424-444.
Welsh, A., Fleming, T., & Dowler, K. (2011). “Constructing Crime and Justice on Film:
Meaning and Message in Cinema” Contemporary Justice Review: Issues in
Criminal, Social, and Restorative Justice, 14:4, 457-476.

27
Appendix Section 1
What is your age? What is your gender?
* Male * Female
Which best describes your race? * White * Black * Asian * Hispanic * Other (please specify) _________________________________
What is your current major? * Criminal Justice * Digital Media * Music * Theater * Visual Arts * Other (please specify) ________________________________
Approximately how many hours do you spend watching television on an average day? __________________Hours Which of the following is your primary news source?
* Television * Newspaper * Radio * Social Interactions/Word of Mouth * Internet * Other (please specify) ______________________________
Do you watch any of the following on a regular basis? (Check all that apply) * Crime Drama TV shows * Crime Reality TV shows * Local News * National News
Would you say that news programs: * Exaggerate crime a lot * Exaggerate crime a little * Get it about right * Underestimate crime
Would you say that TV crime dramas: * Are very realistic * Are somewhat realistic * Are somewhat unrealistic * Are very unrealistic

28
Approximately how many times in the last 12 months have you had direct contact with the Criminal Justice system? (Example: Police officers, lawyers, courts, etc.) ________________________ Approximately how many of your relatives or close friends have had direct contact with the Criminal Justice System in the past 12 months? (Example: Police officers, lawyers, courts, etc.) ________________________
Section 2 Indicate how strongly you agree or disagree with the following statements by circling the number that best represents your opinion
1=Strongly Agree 2=Agree 3=Neutral 4=Disagree 5=Strongly Disagree My local police department does a good job 1 2 3 4 5 I am comfortable in asking the police for assistance 1 2 3 4 5 Criminal sentences for drug related crimes are too harsh 1 2 3 4 5 The criminal justice system effectively punishes offenders 1 2 3 4 5 The criminal justice system respond to minorities fairly 1 2 3 4 5 Wrongful convictions are common 1 2 3 4 5 Criminal sentences for property crimes are fair 1 2 3 4 5 The police always have a good reason to stop someone 1 2 3 4 5 The criminal justice system effectively rehabilitates offenders 1 2 3 4 5 Criminal sentences for violent crimes are too lenient 1 2 3 4 5