Media Atlas China Snapshot
17
© 2010. Synovate Ltd. 1 Synovate Snapshot Report 2010 Media Atlas China
-
Upload
juan-grande -
Category
Documents
-
view
80 -
download
2
Transcript of Media Atlas China Snapshot

© 2010. Synovate Ltd. 1
Synovate
Snapshot Report
2010
Media Atlas China
Media Atlas China: Snapshot Report © 2010. Synovate Ltd. 2
Executive Summary
Media Atlas China is the first step to understanding China’s complex media ecosystem
and consumer behavior. A cost-effective syndicated study, its primary objective is
efficient, future-proof research that accurately measures consumer and media habits in
China like never before.
Media Atlas China contains:
• Media consumption (exposure and engagement)
• Product ownership and usage
• Brand Relationship (awareness, usage, consideration, preference)
• Lifestyle and leisure activity
• Demographic information
Research for Media Atlas China is conducted across 66 cities (tiers 1/2/3/4/5) and rural
areas, with respondents aged 15-64. The annual sample size is 68,000. Unlike typical
media surveys that rely solely on face-to-face interviews, Synovate utilises a combination
of computer-assisted telephone interviews (CATI) and face-to-face interviews to better
represent the market.
Media Atlas China: Snapshot Report © 2010. Synovate Ltd. 3
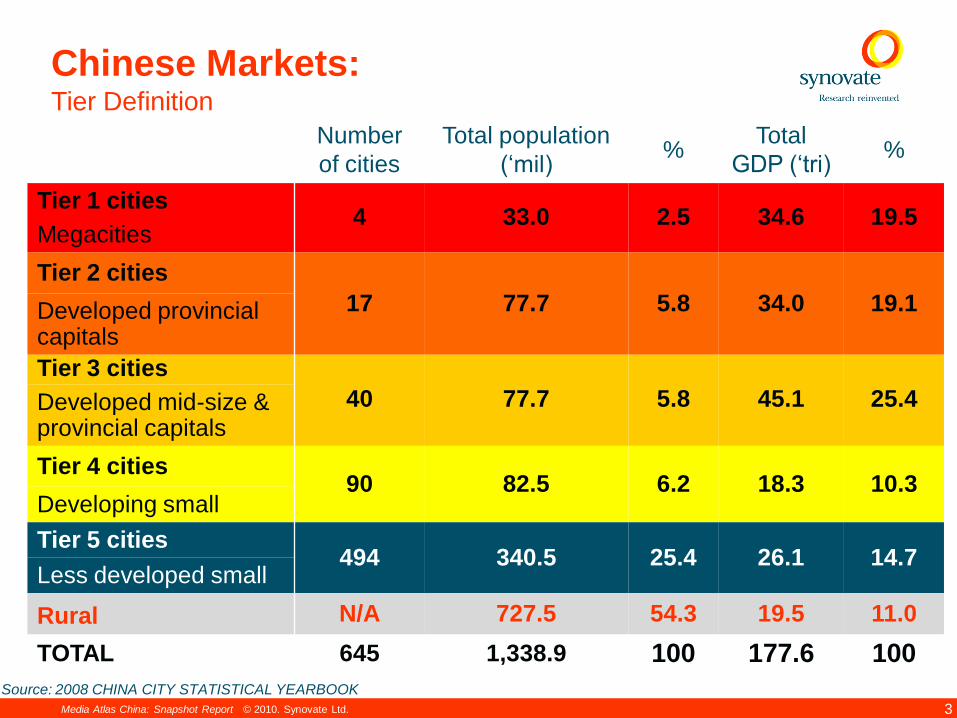
Number
of cities
Total population
(‘mil)%
Total
GDP (‘tri)%
Tier 1 cities4 33.0 2.5 34.6 19.5
Megacities
Tier 2 cities
17 77.7 5.8 34.0 19.1Developed provincial capitals
Tier 3 cities
40 77.7 5.8 45.1 25.4Developed mid-size & provincial capitals
Tier 4 cities90 82.5 6.2 18.3 10.3
Developing small
Tier 5 cities494 340.5 25.4 26.1 14.7
Less developed small
Rural N/A 727.5 54.3 19.5 11.0
TOTAL 645 1,338.9 100 177.6 100
Source: 2008 CHINA CITY STATISTICAL YEARBOOK
Chinese Markets:Tier Definition
Media Atlas China: Snapshot Report © 2010. Synovate Ltd. 4
4%
5%
5%
6%
11%
20%
21%
26%
26%
33%
35%
55%
49%
39%
38%
37%
37%
20%
27%
30%
30%
24%
17%
6%
Tier 1
Tier 2
Tier 3
Tier 4
Tier 5
Rural
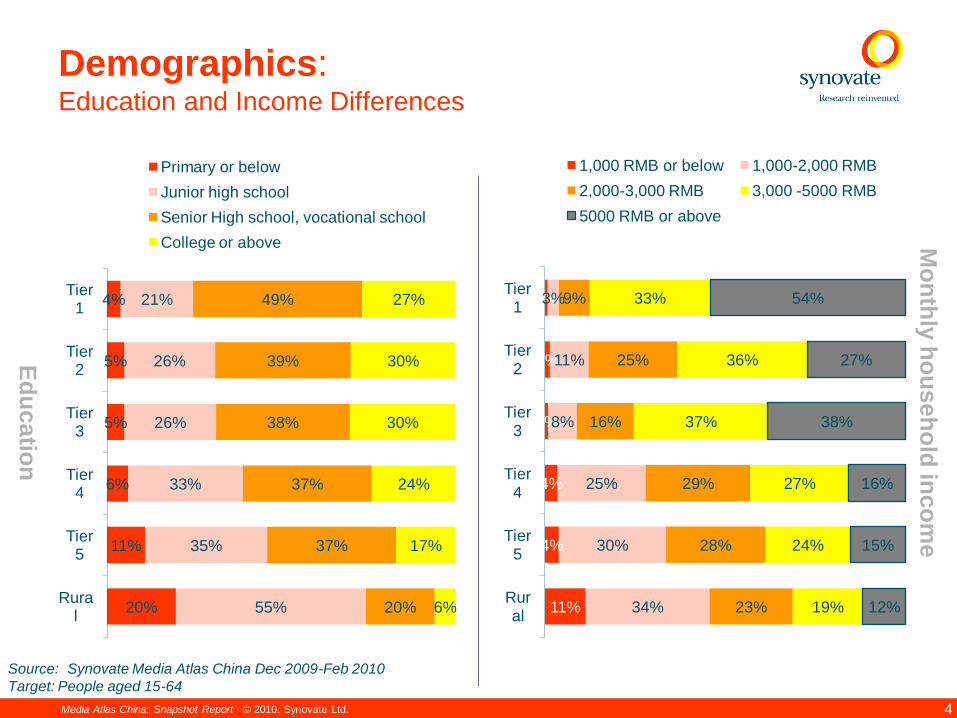
Primary or below
Junior high school
Senior High school, vocational school
College or above
Demographics:Education and Income Differences
Ed
uc
atio
n
Mo
nth
ly h
ou
se
ho
ld in
co
me
1%
1%
1%
4%
4%
11%
3%
11%
8%
25%
30%
34%
9%
25%
16%
29%
28%
23%
33%
36%
37%
27%
24%
19%
54%
27%
38%
16%
15%
12%
Tier1
Tier2
Tier3
Tier4
Tier5
Rural
1,000 RMB or below 1,000-2,000 RMB
2,000-3,000 RMB 3,000 -5000 RMB
5000 RMB or above
Source: Synovate Media Atlas China Dec 2009-Feb 2010
Target: People aged 15-64
Media Atlas China: Snapshot Report © 2010. Synovate Ltd. 5
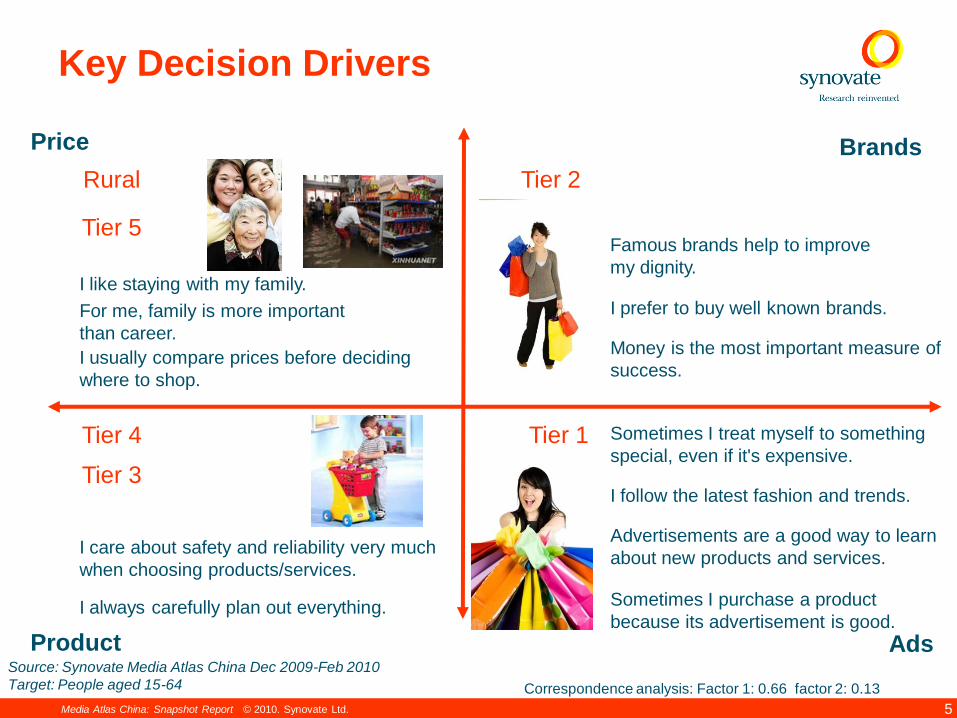
Key Decision Drivers
Famous brands help to improve
my dignity.
Tier 2
I prefer to buy well known brands.
Tier 1
Rural
Tier 5
Tier 4
Tier 3
I like staying with my family.
For me, family is more important
than career.
I usually compare prices before deciding
where to shop.
I care about safety and reliability very much
when choosing products/services.
I always carefully plan out everything. Sometimes I purchase a product
because its advertisement is good.
Advertisements are a good way to learn
about new products and services.
Sometimes I treat myself to something
special, even if it's expensive.
I follow the latest fashion and trends.
Money is the most important measure of
success.
Correspondence analysis: Factor 1: 0.66 factor 2: 0.13
Source: Synovate Media Atlas China Dec 2009-Feb 2010
Target: People aged 15-64
Ads
BrandsPrice
Product

Media Atlas China: Snapshot Report © 2010. Synovate Ltd. 6
Overall Consumption Patterns
Source: Synovate Media Atlas China Dec 2009-Feb 2010
Target: People aged 15-64
Past year: non-alcoholic beverages, snack foods, household toiletries
products, beauty products (eaten, drank or used).
Ownership: household electronics/electric appliances
Number of products consumed
Household
toiletries
(8 items)
Snack food
(6 items)
Non-alcoholic
beverages
(9 items)
Beauty products
(female)
(10 items)
Household
electronics/ electric
appliances
(13 items)
Tier 1 6.2 3.6 5.2 4.2 7.4
Tier 2 6 3.1 4.6 3.5 6.7
Tier 3 6 2.7 4.1 3.8 6.5
Tier 4 5.9 2.9 4.1 3.5 5.9
Tier 5 6 3 4.1 3.2 5.8
Rural 5.7 2.6 3 2.2 3.9
Media Atlas China: Snapshot Report © 2010. Synovate Ltd. 7
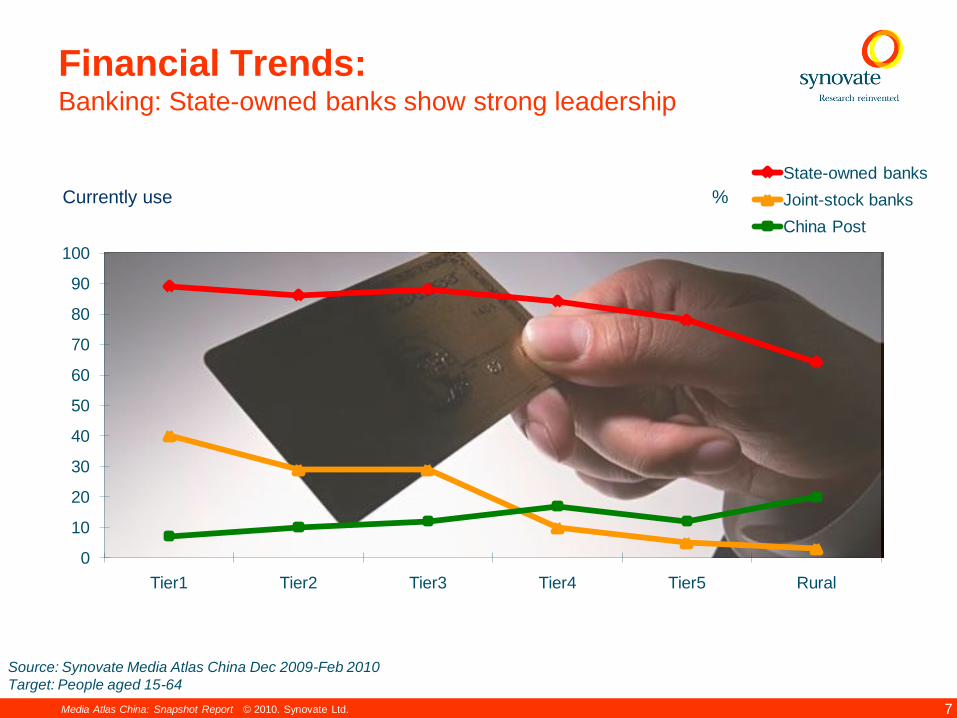
0
10
20
30
40
50
60
70
80
90
100
Tier1 Tier2 Tier3 Tier4 Tier5 Rural
State-owned banks
Joint-stock banks
China Post
%
Source: Synovate Media Atlas China Dec 2009-Feb 2010
Target: People aged 15-64
Currently use
Financial Trends:Banking: State-owned banks show strong leadership

Media Atlas China: Snapshot Report © 2010. Synovate Ltd. 8
14
5
10
5
10
14
7
21
6
23
4
26
Sedan Motorcycle
Tier1
Tier2
Tier3
Tier4
Tier5
Rural
%
Source: Synovate Media Atlas China Dec 2009-Feb 2010
Target: People aged 15-64
Product Ownership:Automotive

Media Atlas China: Snapshot Report © 2010. Synovate Ltd. 9
%
Source: Synovate Media Atlas China Dec 2009-Feb 2010
Target: People aged 15-64
27 3
5
106
5
11
66
9
7
22
28
26
35
5360
Sports shoes Digital cameras Mobile phones
Rural
Tier 5
Tier 4
Tier 3
Tier 2
Tier 1
Market share by Tier
Product Volume:Sheer size of rural areas creates high market share
Media Atlas China: Snapshot Report © 2010. Synovate Ltd. 10
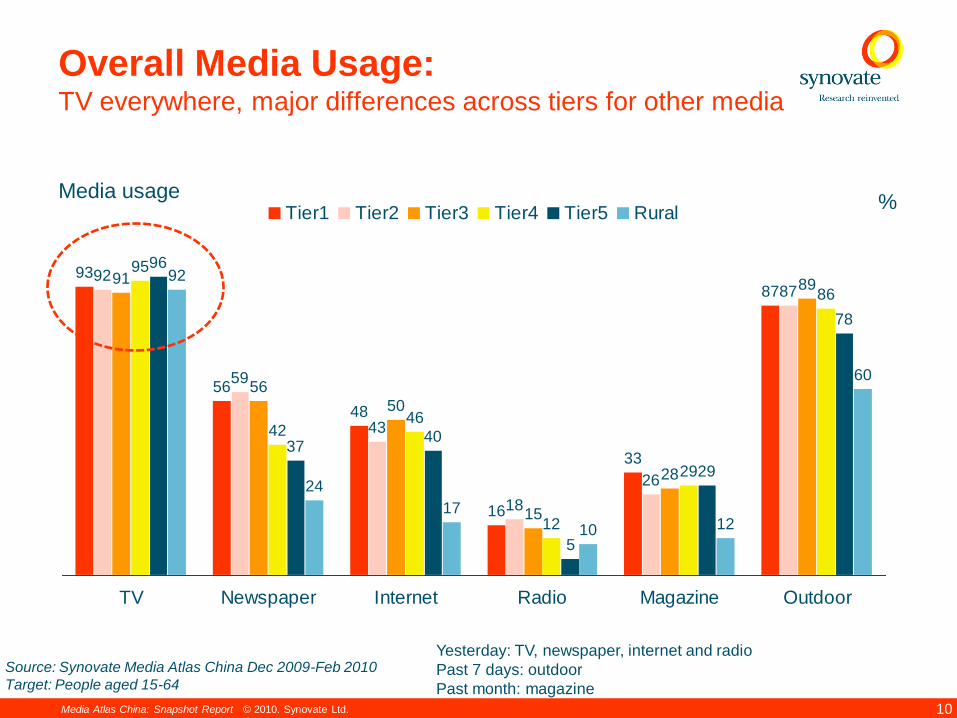
93
56
48
16
33
8792
59
43
18
26
8791
56
50
15
28
8995
4246
12
29
86
96
3740
5
29
78
92
24
17
10 12
60
TV Newspaper Internet Radio Magazine Outdoor
Tier1 Tier2 Tier3 Tier4 Tier5 RuralMedia usage
%
Overall Media Usage:TV everywhere, major differences across tiers for other media
Yesterday: TV, newspaper, internet and radio
Past 7 days: outdoor
Past month: magazine
Source: Synovate Media Atlas China Dec 2009-Feb 2010
Target: People aged 15-64
Media Atlas China: Snapshot Report © 2010. Synovate Ltd. 11
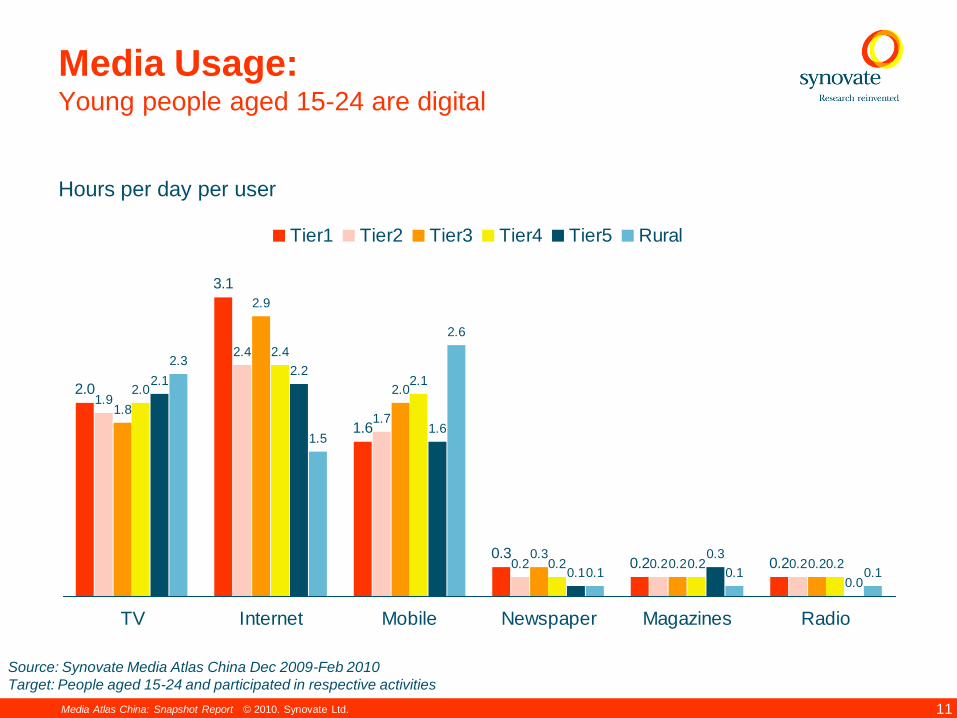
Hours per day per user
2.0
3.1
1.6
0.30.2 0.2
1.9
2.4
1.7
0.2 0.2 0.2
1.8
2.9
2.0
0.30.2 0.2
2.0
2.4
2.1
0.2 0.2 0.2
2.12.2
1.6
0.1
0.3
0.0
2.3
1.5
2.6
0.1 0.1 0.1
TV Internet Mobile Newspaper Magazines Radio
Tier1 Tier2 Tier3 Tier4 Tier5 Rural
Source: Synovate Media Atlas China Dec 2009-Feb 2010
Target: People aged 15-24 and participated in respective activities
Media Usage:Young people aged 15-24 are digital

Media Atlas China: Snapshot Report © 2010. Synovate Ltd. 12
59
34
18
8
6
5
4
4
2
Watching TV
%
Reading magazines
Eat/drink
On the phone
Send messenger
Read newspaper
Homework/office work
Other activities
Read magazine
Surf Internet
Listen to Radio
28
18
11
5
3
2
2
2
1
Surfing the net
Eat/drink
On the phone
Send messenger
Homework/office work
Watch TV
read newspaper
Listen to Radio
Other activities
Read magazine
19
11
7
6
3
3
2
2
2
Eat/drink
On the phone
Send messenger
Watch TV
Surf internet
Homework/office work
read newspaper
Listen to Radio
Other activities
Media EngagementPeople multi-task when consuming media…
Activities usually do while...
Source: Synovate Media Atlas China Dec 2009-Feb 2010
Target: People aged 15-64

© 2010. Synovate Ltd.
Media Atlas China

Media Atlas China: Snapshot Report © 2010. Synovate Ltd. 14
Media Atlas China:Overview
This is only a small sample of what’s available in the full Media Atlas China report.
Media Atlas China is perfect for Advertising and Media Agencies, Media Owners and
Advertisers who want to understand brand relationships, targeted product usage and
media exposure across China. It is the largest, most comprehensive syndicated media
study of its kind.
• Agencies will receive comprehensive information on all their major accounts and on
markets that are new to them.
• Advertisers will obtain facts about their current range of products and brands and will
learn about other markets that provide opportunities for expansion.
• Media owners will receive data to help demonstrate the advantages of advertising in a
particular newspaper, magazine or website based on coverage and audience
engagement.
To receive a sample standard table contact your Synovate account representative or
Doris Wong ([email protected]).

Media Atlas China: Snapshot Report © 2010. Synovate Ltd. 15
Media Atlas China:Contents of Standard Tables
• Headers:
Tier, sex, age, marital status, highest education, occupation, monthly household income,
personal monthly income, product user
• Questions
Have you used this product in the past year?
Penetration – number of users
If yes, how often?
Types of users - heavy, medium, light
Which brands did you see or hear of, use currently, consider to use, most prefer?
Brand awareness, brand share, intent to buy and loyalty
• Media
- Reach: Print, TV, Internet, Mobile, Radio, OOH (out of home), Cinema
- Engagement:
- Multi tasking activities
- Actions taken after seeing or hearing interesting articles in the media
- Life involvement of each type of Media
- Advertising attitude of each type of Media
- Sources of product and services information
To receive a sample standard table contact your Synovate account representative or
Doris Wong ([email protected]).

Media Atlas China: Snapshot Report © 2010. Synovate Ltd. 16
Ordering Information:
The full version of Media Atlas China contains even more in-depth data on product usage,
media consumption and demographics. Annual subscriptions updated quarterly start at
only $3000 USD. Benefits include:
• Unprecedented geographic coverage
• Current and reliable information, updated quarterly
• Real cross-media exposure
• Untapped market and media opportunities
Media Atlas China offers several subscription options across 8 categories, including:
• Food and Beverage
• Household and Personal Care Products
• Healthcare Products
• Electronic Appliances and Personal Products
• Shopping Retailers
• Sports Apparels
• Automotive
• Financial Services
Contact your Synovate account representative or Doris Wong
([email protected]) to begin your subscription to Media Atlas China today!

Media Atlas China: Snapshot Report © 2010. Synovate Ltd. 17
Doris Wong
Executive Director
+86 10 5963 2377
Contact Information
Media Atlas China