Mecklenburg County 2011 2012 2013 2014 2015 2016 2017 2018 2019 2020 Mecklenburg Population (Units...
39
Mecklenburg County Community Pulse Report 2017 Presented by: Strategic Planning & Evaluation Growth and Opportunity: A SWOT Analysis
Transcript of Mecklenburg County 2011 2012 2013 2014 2015 2016 2017 2018 2019 2020 Mecklenburg Population (Units...

Mecklenburg County Community Pulse Report 2017
Presented by: Strategic Planning & Evaluation
Growth and Opportunity: A SWOT Analysis

Mecklenburg County
How do we compare? Where do we excel? What are our challenges?
3
DemographicsResearch and Development
Wages and PovertyEducationTrainingGrowth
Housing and DevelopmentPopulationMigration

4
SStrengths
W Weaknesses
OOpportunities
T Threats
An overview on our community
Compilation of data and reports from:County Staff, The Brookings Metropolitan Policy Program, The Pew Research Center, Carolina Population Center at UNC and others

Strengths
5

Sources: US Census for historic data estimates, Applied Geographic Solutions (AGS) for projectionsNote: 2017 and 2019 data are calculated from series data.
923 945 968 992 1,012 1,034 1,052 1,077 1,093 1,118 1,125
2010 2011 2012 2013 2014 2015 2016 2017 2018 2019 2020
Mecklenburg Population(Units in Thousands)
People: Mecklenburg population continues to growProjections show approximately an additional 200K people from 2010 to 2020.
S
6

People: Mecklenburg is among the fastest growingBetween 2010 and 2015, Mecklenburg County was the eighth fastest growing large population county in the US. Projected 2020 population of 1.13 million.
Source: US Census, Population estimates April 1, 2010 and July 1, 2015, filtered for counties with 500K population or more.
Rank County 2010 Pop 2015 Pop Change % Change
1 Fort Bend County (Richmond), TX 584,832 716,087 131,255 22.4
2 Denton County (Denton), TX 662,615 780,612 117,997 17.8
3 Collin County (McKinney), TX 782,351 914,127 131,776 16.8
4 Travis County (Austin), TX 1,024,347 1,176,558 152,211 14.9
5 Denver County (Denver), CO 599,860 682,545 82,685 13.8
6 Wake County (Raleigh), NC 901,021 1,024,198 123,177 13.7
7 Lee County (Fort Myers), FL 618,754 701,982 83,228 13.5
8 Mecklenburg County (Charlotte), NC 919,666 1,034,070 114,404 12.4
9 Orange County (Orlando), FL 1,145,954 1,288,126 142,172 12.4
10 District of Columbia 601,767 672,228 70,461 11.7
11 Utah County (Provo), Utah 516,640 575,205 58,565 11.3
12 Gwinnett County (Lawrenceville), GA 805,324 895,823 90,499 11.2
13 Harris County (Houston), TX 4,093,076 4,538,028 444,952 10.9
14 Bexar County (San Antonio), TX 1,714,774 1,897,753 182,979 10.7
7
S

People: Migration is key driver of growthBetween 2010 and 2015, 68% of Charlotte metro’s growth could be attributed to migration, specifically domestic migration.
Sources: 2015 Population Estimates, U.S. Census Bureau; Rebecca Tippett, Carolina Demography, UNC 8
S
14% 54% 31%
Dallas
Houston
Phoenix
Oklahoma City
Seattle
Las Vegas
Denver
San Antonio
Raleigh
Nashville
Charlotte
Austin
Orlando
% International Migration % Domestic Migration % Natural Growth

Over 40% of county residents have at least a Bachelor’s degree – well above the state and national averages.
People: The local workforce is well-educated
Sources: U.S. Census Bureau, American Community Survey 1-Year Estimates; Brookings analysis of U.S. Census Bureau data
S
Percentage of population with bachelor’s
degree or higher, 2015
9
Comparison Counties (2015) % BA+ population
Arlington County, VA 73.2 (highest US)
Orange County, NC (Chapel Hill) 56.5 (highest NC)
Travis County, TX (Austin) 47.2
Denver County, CO 47.1
Dallas County, TX 30.1
Bexar County, TX (San Antonio) 26.5
30.6% 29.4%
43.3%50.1%
US NC MecklenburgCounty
Wake County

69.5% 71.8%
85.9%
73.8%
66.1%
89.6%
79.3%78.4%
87.1%
2007 2008 2009 2010 2011 2012 2013 2014 2015 2016
NC CMS Wake
Charlotte Mecklenburg Schools continues to see an increase in 4-year cohort graduation rates, surpassing the NC and Wake County rates since 2014.
Source: Public Schools of NC, Department of Public Instruction10
S
People: Local HS graduation rates are increasing

$126.2 billion
Metropolitan GDP per Capita
61st wealthiest metro in the world
$53,142
Metropolitan GDP
107th largest metro in the world
Definition: 10-county
metropolitan statistical area
2.4
million
11
The heart of a strong economic region
Economy: Strong, productive
Source: Brookings analysis of Moody’s Analytics data
S

Economy: Annual wages continue to riseThe most recent increase in average wages places Mecklenburg County above the national and state averages.
Source: Jobs EQ®, Q2 2016, official dates of recession from Bureau of Labor Statistics12
S
Recession fromDec. 2007 to June 2009

Economy: Cost of living remains lowMecklenburg County’s cost of living for goods and services is 2.1% lower than the U.S. average.
Sources: JobsEQ® Q2 2016; developed by Chmura Economics & Analytics based on goods and services.*Q3 2016 California Employment Development Department
13
S
Annual
Average Salary
Cost of Living
Index
(Base US)
US
Purchasing
Power
North Carolina $47,625 96.3 $49,455
Mecklenburg County $63,751 97.9 $65,102
USA $54,152 100.0 $54,152

Economy: Advanced industries rapidly adding jobsThe Charlotte metro area ranks 7th nationally among 100 largest metro areas in average growth of advanced industry jobs from 2013 to 2015.
Source: Brookings14
S
Industry
Number of jobs,
2015
Share of all advanced
industries jobs, 2015
Growth,
2013–2015
Management, Scientific, and Technical Consulting Services 17,735 16.7% +11.9%
Computer Systems Design and Related Services 12,565 11.8% +14.9%
Architectural, Engineering, and Related Services 9,503 8.9% +5.0%
Motor Vehicle Parts Manufacturing 8,358 7.9% +6.1%
Data Processing, Hosting, and Related Services 7,788 7.3% +5.8%
8.0%
6.0%
4.0%
2.0%
0.0%
- 2.0%
Charlotte-Concord-Gastonia, NC (6.7%)
Nashville, TN and San Francisco, CA (7.9%)
Atlanta, GA (4.5%)
Minneapolis-St. Paul, MN (2.4%)
New Haven, CT (-2.5%)
Raleigh, NC (7.0%)
Greensboro, NC (-0.5%)
Washington, DC (0.9%)

A beneficial cycle of economic growth <=> migrationThis cycle allows the region to grow by tapping into educated workers from outside the region, expanding in sectors that would not be possible without these workers
15
S
1. High demand for
educated workers
2. Drives in-migration
of more educated workers
3. Which further fuels
the local economy
4. Driving more demand for educated
workers

Strength in the right sectorsCurrently, this cycle is amplified by the fact that the highest growth sectors in the local economy are also some of the fastest-growing nationally.
16
S
“While Mecklenburg County’s economic performance is largely tied to the national economy, the County’s business sector mix is very closely aligned with sectors enjoying strongest growth nationally.”
Mecklenburg County Quarterly Economic Update, December 2016
1. High demand for
educated workers
2. Drives in-migration
of more educated workers
3. Which further fuels
the local economy
4. Driving more demand for educated
workers

SStrengths
WWeaknesses
OOpportunities
TThreats
Mecklenburg County’s strengths include its:
People
• rapid growth, driven by in-migration
• educated workforce
• high and increasing graduation rate
Economy
• growth sectors aligned to fast growing national sectors.
17

Weaknesses
18

The share of income spent on rent (27%) is trending upward in the Charlotte metro, nearing the U.S. average of 30%, which may impact Charlotte’s desirability. Strong in-migration fuels and sustains this trend.
Sources: Map: Carolina Demography, UNC, Rebecca Tippett; Graph: Zillow, 19
Housing Cost: Percent income spent on rent is rising
Rising share ofincome spenton rent
In-Migrants as share of population
W

Sources: Map: Carolina Demography, UNC, Rebecca Tippett20
Suburban counties capture larger share of married in-migrants, likely due to lower land costs and mortgage affordability (compared to rents).
Housing Cost: Advantage for bordering counties
Share of Married In-Migrant Households
W

In 2015, nearly 60% of Charlotte-Mecklenburg School (CMS) district’s high school graduates attending Central Piedmont Community College (CPCC) enrolled in at least one remedial course, an increase from the previous year.
Education Infrastructure: Higher need for remediation
Source: 2014-15 CMS High School Principals' Luncheon DataNote: Cannot report less than 10 students-FERPA rules
21
46%
6% 6%
41%41%
13%
6%
41%
Enrolled in 0 Enrolled in 1 Enrolled in 2 Enrolled in 3+
2014 2015
41%
59%
Percent of CMS HS graduates enrolled in at least
one remedial course at CPCC, 2015 (1,958 CMS students enrolled in 2015; 8,694 total CMS grads)
enrolled in at least1 remedial course
enrolled in 0 remedial courses
Percent of CMS graduates enrolled in remedial courses
at CPCC, 2014 and 2015
W

Number of universities in CWTS/Leiden
University Top 750 List, 2010-2013
4 Dallas
3
Atlanta2
San Antonio
1 Austin | Cleveland | Denver | Indianapolis Kansas City
| Minneapolis | Phoenix
0 Charlotte
22
Unlike its peer metros, Charlotte does not house a scientific research institution ranked in the top 750 in the world. This hampers local research & development and is reflected in lower rankings in broadband speed and broadband access.
Education Infrastructure: Higher education
Source: Brookings analysis of Centre for Science and Technology Studies (CWTS) and Leiden University data
W

UNC-Charlotte, the Charlotte metro’s most significant research asset, ranks 246 in Research & Development expenditures, well below peer cities, and below other North Carolina institutions.
Higher Education R&D Expenditures, Top Source by Metro, FY2013
Rank Institution Metro Area R&D expenditures (millions USD)
8 Duke University Durham $992,821
9 UNC Chapel Hill Raleigh $973,007
15 University of Minnesota Minneapolis $858,378
23 Georgia Institute of Technology Atlanta $730,488
31 University of Texas Austin $634,132
45 University of Texas Southwestern Medical Center Dallas $440,620
50 Case Western Reserve University Cleveland $425,788
51 NC State University Raleigh $417,468
52 University of Colorado Denver $409,443
53 Arizona State University Phoenix $405,154
70 Indiana University-Purdue University Indianapolis $332,760
108 Wake Forest University Winston-Salem $182,721
113 University of Texas Health Science Center San Antonio $175,983
236 University of Missouri Kansas City $28,829
246 University of North Carolina Charlotte $24,76423
R&D expenditures significantly trail peer metros
Source: NSF Higher Education Research and Development Survey data
W

SStrengths
WWeaknesses
OOpportunities
TThreats
In summary, some of Mecklenburg County’s weaknesses include:
Housing Costs• rising rental costs on track to
match national index• married in-migrants tending
toward suburban counties over Mecklenburg
Education Infrastructure• high remediation in spite of
high HS graduation rates• lack of high-ranking research
university, reflected in lower R&D
24

Opportunities
25

Source: Brookings analysis of U.S. Census Bureau data, Jobs EQ®, Aug 201626
The current US environment of low unemployment and reduced labor force participation means growing competition for workers. These pressures can drive up local wages and open opportunities for advancement if workers have skills in demand.
National Labor Trends: Increasing demandO

48.3% 47.4%44.9%
42.9% 42.7% 42.1% 41.7% 41.5%39.3%
37.4%35.4%
Share of job ads in STEM occupations, Greater Charlotte and peer regions, 2013
The Charlotte metro has high demand for STEM occupations, especially in middle-skill jobs, helping maintain attractiveness for local and in-migrant workers.
Local Demand: STEM skills
Source: Brookings analysis of Burning Glass data27
18
32
10
High School orLess
Some college orAssociate's degree
Bachelor's Degree
Median duration STEM jobs overall: 14 days
O
Days to fill STEM occupations by education,
Greater Charlotte, 2013

35%36% 36%
40%
39%
32%
34%
36%
38%
40%
42%
2006-07 2007-08 2008-09 2009-10 2010-11 2011-12 2012-13 2013-14 2014-15
MECKLENBURG FOURTH GRADE READING PROFICIENCY
Education: Developing the long-term pipelineProgress has been made in both early grades and high school, but there is much that can be done to strengthen local workers’ skill base.
O
Source: The Nation’s Report Card prepared by the National Assessment of Education (NAEP)

Source: NC Department of Public Instruction29
Progress has been made that can be built upon
Continue to close the gap in education and prepare students for the workforce
94.3%89.5%
54.6%
79.8%
94.6%
88%
2006 2007 2008 2009 2010 2011 2012 2013 2014 2015 2016
CMS 4-Year Cohort Graduation Rate by Ethnicity
Asian Black Hispanic White Other
O

SStrengths
WWeaknesses
OOpportunities
TThreats
In summary, some of Mecklenburg County’s opportunities include:
National labor trends• increased competition for
skilled workers
Local demand• high demand for STEM workers
Education• strengthening education
system to meet long-term needs.
30

Threats
31
32
T
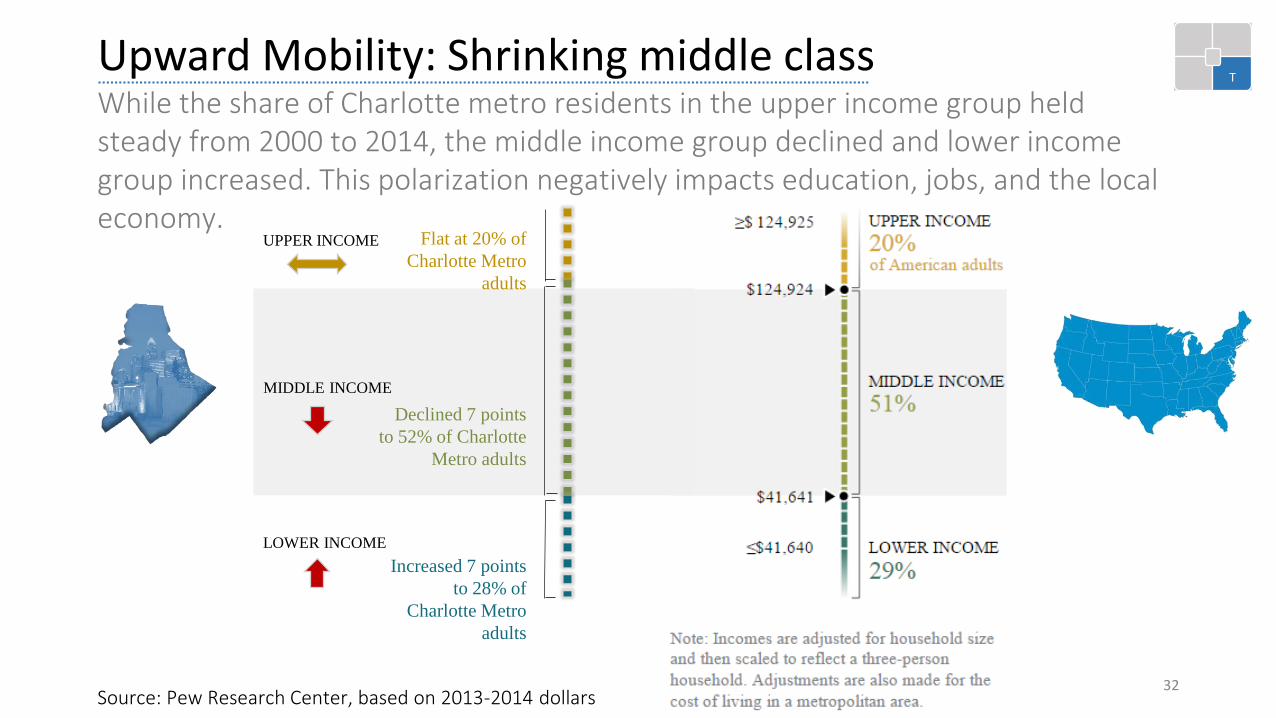
Source: Pew Research Center, based on 2013-2014 dollars
While the share of Charlotte metro residents in the upper income group held steady from 2000 to 2014, the middle income group declined and lower income group increased. This polarization negatively impacts education, jobs, and the local economy.
Upward Mobility: Shrinking middle class
UPPER INCOME
MIDDLE INCOME
LOWER INCOME
Flat at 20% of
Charlotte Metro
adults
Declined 7 points
to 52% of Charlotte
Metro adults
Increased 7 points
to 28% of
Charlotte Metro
adults

33
T
Source: MIT http://livingwage.mit.edu
Large gap between minimum wage and living wage affected by growing housing cost and need for more training and education in the job market
Wages required to support families
Hourly Wages 1 Adult1 Adult
1 Child
1 Adult
2 Children
Living Wage $10.91 $22.28 $26.65
Poverty Wage $5.00 $7.00 $10.00
Minimum Wage $7.25 $7.25 $7.25

Source: Brookings Metro Monitor (100 largest metros), US Census 2015 population estimates of Black or African American population34
T
African American wages declined significantly from 2009-2014. Much of this reflects employment shifts from middle-paying sales and office jobs to lower paying food service jobs during the period.
Minority Wages: Little to no recovery since recession
Metro Area
(% African-American)
African American wage
change 2009-2014 (%)
1 Akron, OH (11.9) -27.3
2 Las Vegas, NV (10.8) -22.2
3 Sacramento, CA (7.1) -22.1
4 Winston-Salem, NC (17.7) -21.2
5 New Haven, CT (12.8) -19.9
6 Harrisburg, PA (10.3) -19.6
7 Augusta, GA (35.6) -19.6
8 Columbus, OH (14.6) -18.6
9 Cincinnati, OH (12.2) -18.4
10 Raleigh, NC (20.2) -17.4
11 Nashville, TN (15.3) -16.8
12 Knoxville, TN (5.9) -16.8
13 Charlotte, NC (22.2) -15.2
Metro Area
(% African American)
African American wage
change 2009-2014 (%)
14 Greensboro, NC (26.3) -15.2
15 Birmingham, AL (28.6) -14.9
16 Detroit, MI (22.5) -14.8
17 San Jose, CA (2.5) -14.8
18 Boston, MA (7.8) -13.7
19 Los Angeles, CA (6.7) -13.3
20 Phoenix, AZ (5.2) -13.1
21 Cleveland, OH (20.0) -9.3
22 Jacksonville, FL (21.5) -7.5
23 Baltimore, MD (28.9) -7.5
24 Philadelphia, PA (20.8) -7.5
25 New York, NY (17.1) -4.3

35
T
Source: Brooking analysis of 2015 ACS microdata, November 2016
Growing inequality is a potential risk if business community becomes reliant on this influx. This becomes a long-term risk as long-distance migration is declining nationally, threatening this pipeline of workers.
Reliance on Educated In-migrants: Multiple risks
• Reliance on influx of trained workers reduces concern about training local populations
• Long-term decline in willingness to relocate for jobs is related to the aging of workforce, high home ownership rates, dual-income households.

In summary, some of the threats facing Mecklenburg County include:
Reduced upward mobility
• decreasing wages and a shrinking middle class
Minority wages slowly recovering
• African American wages impacted by structural changes to economy and recession effects
Reliance on educated in-migrants
• risk of increasing inequality
• declining long-distance migration36
SStrengths
WWeaknesses
OOpportunities
TThreats

Conclusion
37

The region ranks in the top twenty in overall growth.
Greater Charlotte’s economy has grown rapidly
38
S W
O T
But that growth has not always been inclusiveRanks in the bottom fifty in overall inclusion among the 100 largest US metros.
Challenge: Build on strengths, become more inclusiveBringing opportunity to both those who move here and those who are already here.
Mecklenburg County government: Focus on peopleOur focus on people puts us at the center of these challenges and makes us a champion of those who are already here, AND a force for keeping the area attractive and growing.

Strategic Planning & Evaluation Team Acknowledgements
39
S
Enterprise Management Analysts• John Chesser• Benjamin Chambers• Keyona Jones• Karli Bryant
County Economist• Michael Brandon Simmons

Mecklenburg County Community Pulse Report 2017
Presented by: Strategic Planning & Evaluation
Growth and Opportunity: A SWOT Analysis