MECHANIZATION OF LILY MICROBULB MULTIPLICATION OPERATIONS Ta-Te Lin and Ching-Lu Hsieh Department of...
45
MECHANIZATION OF LILY MICROBULB MECHANIZATION OF LILY MICROBULB MULTIPLICATION OPERATIONS MULTIPLICATION OPERATIONS Ta-Te Lin and Ching-Lu Hsieh Ta-Te Lin and Ching-Lu Hsieh Department of Agricultural Department of Agricultural Machinery Engineering, Machinery Engineering, National Taiwan University, National Taiwan University, Taipei, Taiwan, ROC Taipei, Taiwan, ROC
-
Upload
barnaby-palmer -
Category
Documents
-
view
218 -
download
4
Transcript of MECHANIZATION OF LILY MICROBULB MULTIPLICATION OPERATIONS Ta-Te Lin and Ching-Lu Hsieh Department of...

MECHANIZATION OF LILY MICROBULBMECHANIZATION OF LILY MICROBULBMULTIPLICATION OPERATIONSMULTIPLICATION OPERATIONS
Ta-Te Lin and Ching-Lu HsiehTa-Te Lin and Ching-Lu Hsieh
Department of Agricultural Machinery Engineering,Department of Agricultural Machinery Engineering,National Taiwan University,National Taiwan University,
Taipei, Taiwan, ROCTaipei, Taiwan, ROC

MECHANIZATION OF LILY MICROBULBMECHANIZATION OF LILY MICROBULBMULTIPLICATION OPERATIONSMULTIPLICATION OPERATIONS
Ta-Te Lin and Ching-Lu HsiehTa-Te Lin and Ching-Lu Hsieh
Department of Agricultural Machinery Engineering,Department of Agricultural Machinery Engineering,National Taiwan UniversityNational Taiwan University

INTRODUCTIONINTRODUCTION MODELINGMODELING PROCESS OPTIMIZATIONPROCESS OPTIMIZATION MECHANIZATION OF MULTIPLICATION MECHANIZATION OF MULTIPLICATION
PROCESSPROCESS CONCLUSIONSCONCLUSIONS

INTRODUCTIONINTRODUCTION
Lily microbulb tissue culture cycleLily microbulb tissue culture cycle Microbulb dissecting and transplantingMicrobulb dissecting and transplanting
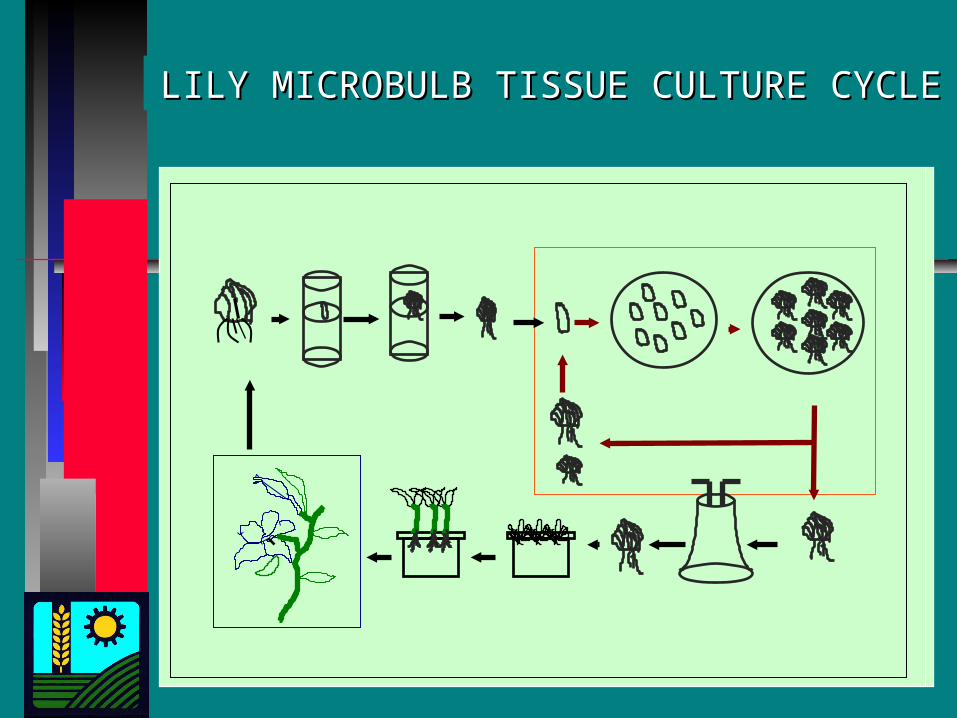
LILY MICROBULB TISSUE CULTURE CYCLELILY MICROBULB TISSUE CULTURE CYCLE
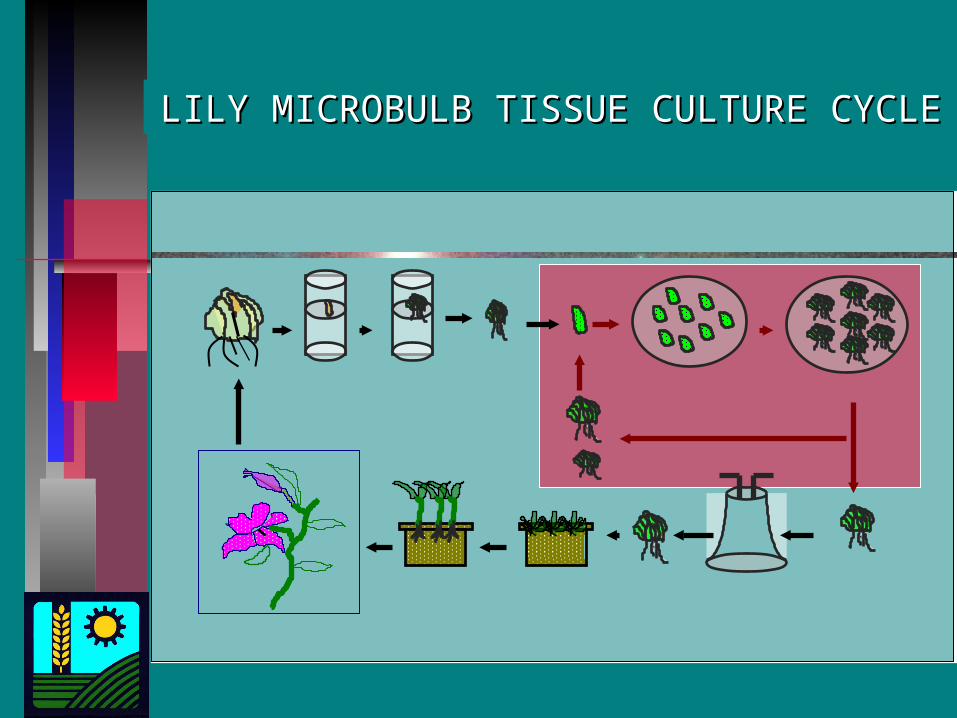
LILY MICROBULB TISSUE CULTURE CYCLELILY MICROBULB TISSUE CULTURE CYCLE

LILY MICROBULB IN CULTURE VESSELLILY MICROBULB IN CULTURE VESSEL

MICROBULB DISSECTING AND MICROBULB DISSECTING AND TRANSPLANTINGTRANSPLANTING
Vessel openingVessel opening Bulb grippingBulb gripping Root and leaf removalRoot and leaf removal Bulb gradingBulb grading Bulb scale separationBulb scale separation Scale transplantingScale transplanting Vessel sealingVessel sealing Vessel labelingVessel labeling
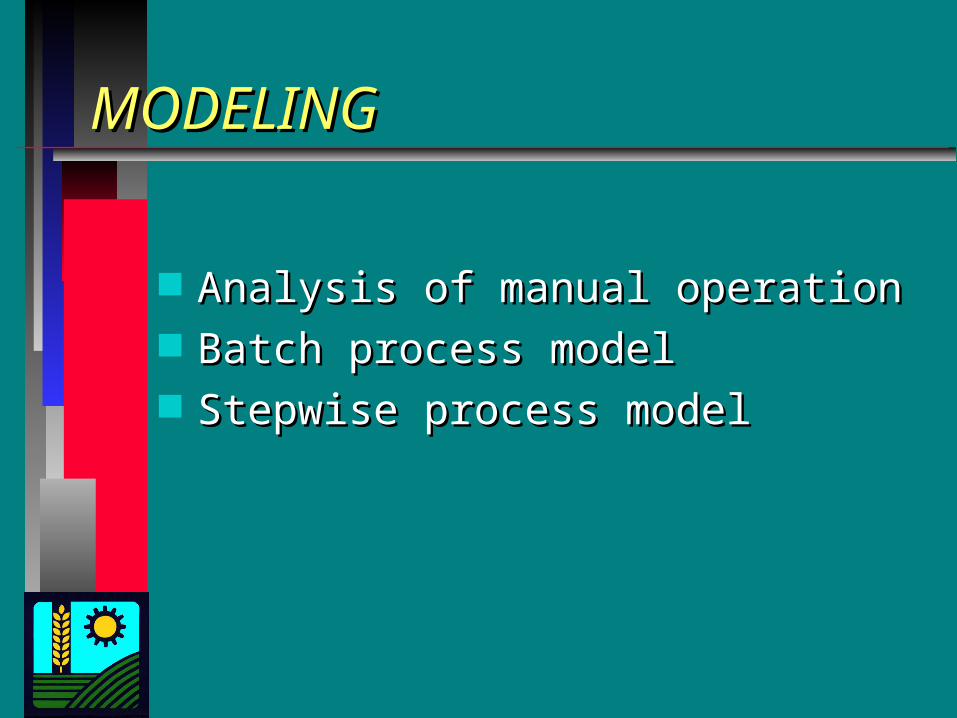
MODELINGMODELING
Analysis of manual operationAnalysis of manual operation Batch process modelBatch process model Stepwise process modelStepwise process model

ANALYSIS OF MANUAL OPERATIONANALYSIS OF MANUAL OPERATION
DCB
Take out lilybulbs1.60%
Scale separation26.50%
Other3.10%
Root and leafremoval plus
grading52.90%
Scaletranplanting
15.90%

ANALYSIS OF MANUAL OPERATIONANALYSIS OF MANUAL OPERATION
TSRI
Take out lilybulbs
14.31%
Scaletranplanting
11.51%Other
12.41%
Root and leafremoval plus
grading14.31%
Scale separation47.45%

ANALYSIS OF MANUAL OPERATIONANALYSIS OF MANUAL OPERATION
TSIPS
Root and leafremoval plus
grading21.60%
Scale separation43.30%
Other0.50%Scale
tranplanting21.60%
Take out lilybulbs
13.00%

FLOW CHART OF LILY MICROBULB FLOW CHART OF LILY MICROBULB MULTIPLICATION PROCESSMULTIPLICATION PROCESS
Generate random variates of entry vesselquantity for daily multiplication process
Process vessels individually
Generate random variates for multiplicationrate and single vessel processing time
Record number of finished vessels andprocessing time
All the entry vesselsprocessed ?
Yes
Report simulation results
Start
End
No

BATCH PROCESS MODELBATCH PROCESS MODEL

STEPWISE PROCESS MODELSTEPWISE PROCESS MODEL

0.00
0.05
0.10
0.15
0.20
0.25
7.0 8.5 10.0 11.5 13.0 14.5 16.0 17.5 19.0 20.5 22.0 23.5 25.0
Entry Vessel Quantity
Prob
abilit
y
Probability of measured entry vessel quantity Probability of measured entry vessel quantity with fitted lognormal density functionwith fitted lognormal density function

Probability of measured single vessel processing time Probability of measured single vessel processing time with fitted lognormal density functionwith fitted lognormal density function
0.00
0.05
0.10
0.15
0.20
0.25
0.30
13.0 17.2 21.4 25.6 29.8 34.0 38.2 42.4 46.6 50.8 55.0
Single Vessel Processing Time (min)
Prob
abilit
y

Probability of measured propagation rate Probability of measured propagation rate with fitted lognormal density functionwith fitted lognormal density function
0.00
0.05
0.10
0.15
0.20
0.25
1.8 2.3 2.8 3.3 3.8 4.3 4.8 5.3 5.8 6.3 6.8 7.3 7.8 8.3 8.8
Propagation Rate
Prob
abilit
y

Total processing time, as affected by entry vessel quantity under Total processing time, as affected by entry vessel quantity under various single vessel processing times (ST)various single vessel processing times (ST)
0
200
400
600
800
1000
1200
1400
-2 -1 0 1 2 3
Coded Entry Vessel Quantity
Proc
essin
g Ti
me (
min
)ST=-1
ST=0
ST=1
ST=2
ST=3
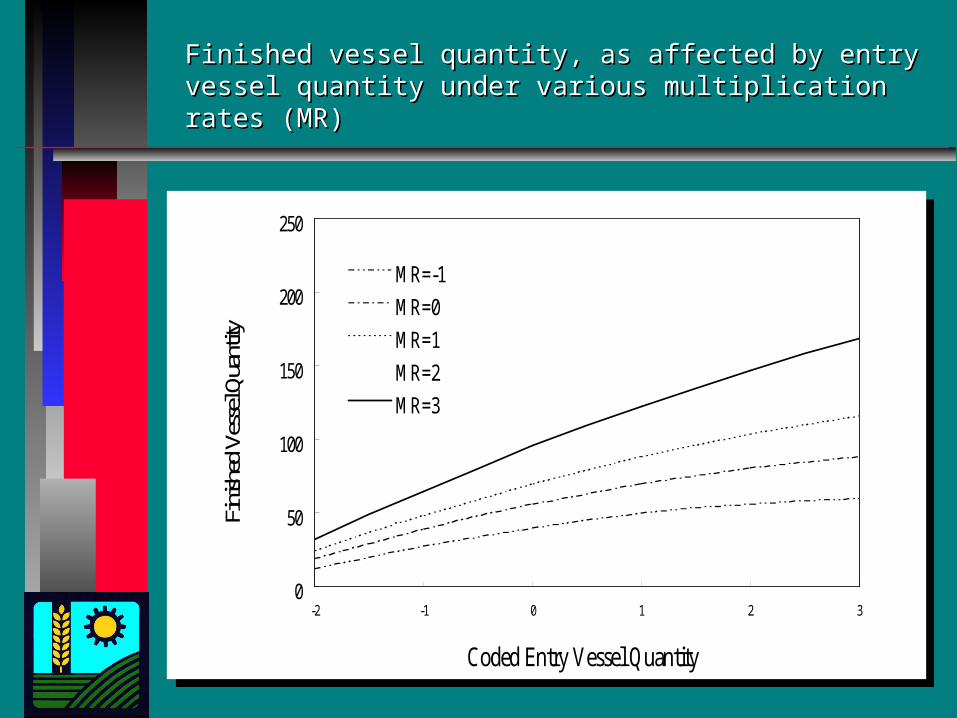
Finished vessel quantity, as affected by entry vessel quantity Finished vessel quantity, as affected by entry vessel quantity under various multiplication rates (MR)under various multiplication rates (MR)
0
50
100
150
200
250
-2 -1 0 1 2 3
Coded Entry Vessel Quantity
Fini
shed
Ves
sel Q
uant
ity
MR=-1
MR=0
MR=1
MR=2
MR=3

Contour plot of predicted finished vessel quantities (dotted lines) Contour plot of predicted finished vessel quantities (dotted lines) and total processing times (solid lines)and total processing times (solid lines)
-1 .00 -0 .80 -0 .60 -0 .40 -0 .20 0.00 0.20 0.40 0.60 0.80 1.00
Input V es sel
-1 .00
-0 .80
-0 .60
-0 .40
-0 .20
0.00
0.20
0.40
0.60
0.80
1.00
Sin
gle
Ves
sel P
roce
ssin
g T
ime
-1 .00 -0 .80 -0 .60 -0 .40 -0 .20 0.00 0.20 0.40 0.60 0.80 1.00-1.00
-0 .80
-0 .60
-0 .40
-0 .20
0.00
0.20
0.40
0.60
0.80
1.00
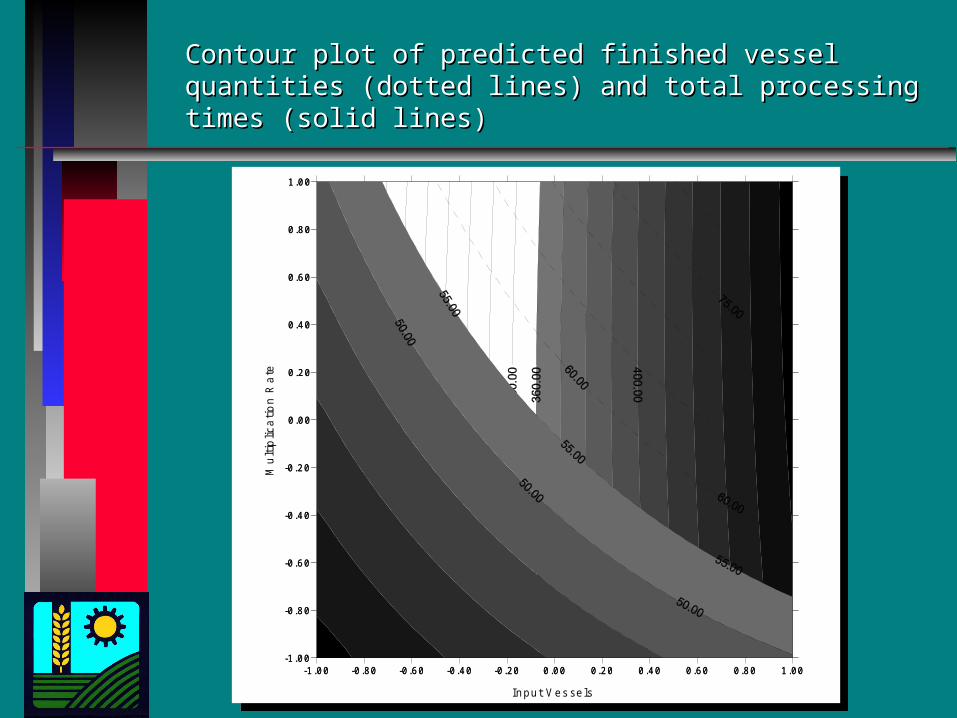
Contour plot of predicted finished vessel quantities (dotted lines) Contour plot of predicted finished vessel quantities (dotted lines) and total processing times (solid lines)and total processing times (solid lines)
-1 .00 -0.80 -0.60 -0.40 -0.20 0.00 0.20 0.40 0.60 0.80 1.00-1.00
-0.80
-0.60
-0.40
-0.20
0.00
0.20
0.40
0.60
0.80
1.00
-1.00 -0.80 -0.60 -0.40 -0.20 0.00 0.20 0.40 0.60 0.80 1.00
Input V es sels
-1 .00
-0.80
-0.60
-0.40
-0.20
0.00
0.20
0.40
0.60
0.80
1.00
Mul
tiplic
atio
n R
ate
PROCESS OPTIMIZATIONPROCESS OPTIMIZATION
Response surface method (RSM)Response surface method (RSM) Optimum analysisOptimum analysis
RESPONSE SURFACE METHODRESPONSE SURFACE METHOD
Experimental designExperimental design Parameter estimationParameter estimation Reliability testReliability test Response surface examinationResponse surface examination

EXPERIMENTAL DESIGNEXPERIMENTAL DESIGN
Dependent variablesDependent variables• Separation rateSeparation rate• Injury rateInjury rate
Independent variablesIndependent variables• Cutting positionCutting position• Spinning speedSpinning speed• Separation timeSeparation time
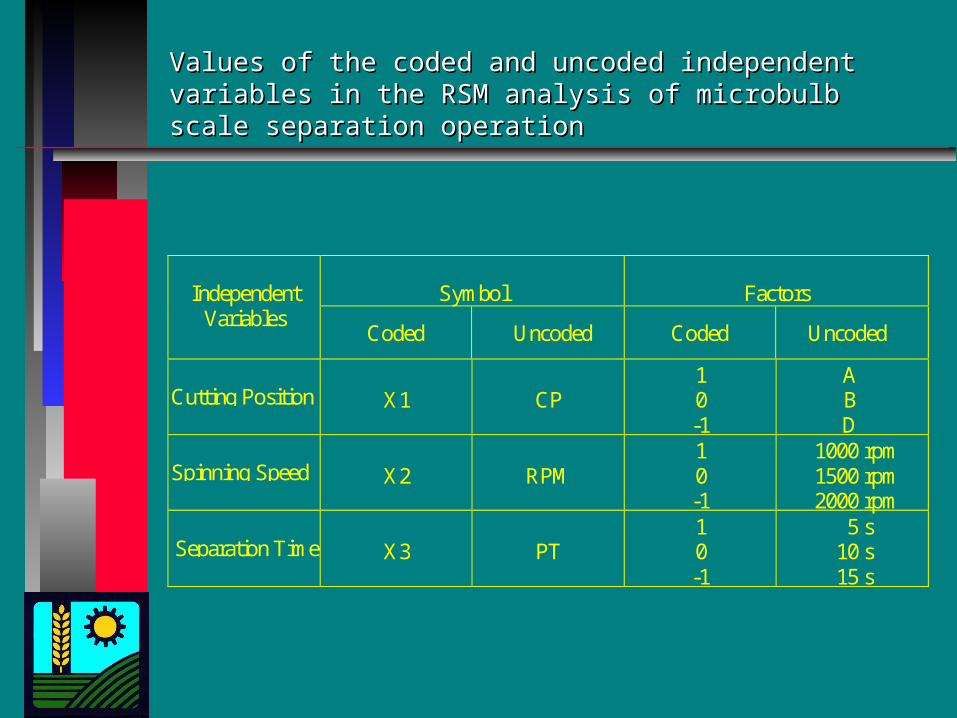
Symbol FactorsIndependentVariables
Coded Uncoded Coded Uncoded
Cutting Position X1 CP10-1
ABD
Spinning Speed X2 RPM10-1
1000 rpm1500 rpm2000 rpm
Separation Time X3 PT10-1
5 s10 s15 s
Values of the coded and uncoded independent variables in the Values of the coded and uncoded independent variables in the RSM analysis of microbulb scale separation operationRSM analysis of microbulb scale separation operation

Coded Variables Experimental Results
Operation No.Cutting
Position
(CP)
Spinning
Speed
(RPM)
Separation
Time
(PT)
Separation
Rate
(%)
Injury Rate
(%)1 1 1 0 32.0 12.52 1 -1 0 100.0 83.33 -1 1 0 17.0 7.14 -1 -1 0 10.0 79.65 1 0 1 71.1 21.46 1 0 -1 100.0 6.17 -1 0 1 32.8 11.58 -1 0 -1 92.3 33.39 0 1 1 15.2 0.010 0 1 -1 37.1 0.011 0 -1 1 84.0 29.012 0 -1 -1 100.0 45.213 0 0 0 40.0 57.514 0 0 0 45.2 35.015 0 0 0 50.6 30.6
Experimental conditions of the Box-Behnken experimental Experimental conditions of the Box-Behnken experimental design for RSM analysis and the experimental resultsdesign for RSM analysis and the experimental results

Coefficients ofRegression
Separation Rate (%) Injury Rate (%)
β k0 45.27 41.03
β k1 7.62 -0.9
β k2 -35.34 -26.94
β k3 -15.79 -2.71
β k11 15.98 2.06
β k22 1.00 2.28
β k33 12.80 -25.02
β k12 3.75 0.18
β k13 7.65 9.28
β k23 -1.48 3.80
Coefficients of the regressed 2nd order polynomial Coefficients of the regressed 2nd order polynomial equations for separation rate and injury rateequations for separation rate and injury rate
3
1
2
1
3
1
23
10
ijjikij
iiikii
iikikk xxxx
3
1
2
1
3
1
23
10
ijjikij
iiikii
iikikk xxxx

Predicted separation rate (solid line) and injury rate Predicted separation rate (solid line) and injury rate (dotted line) for microbulb of cutting position A(dotted line) for microbulb of cutting position A
-1 .00 -0 .80 -0 .60 -0 .40 -0 .20 0.00 0.20 0.40 0.60 0.80 1.00-1 .00
-0 .80
-0 .60
-0 .40
-0 .20
0.00
0.20
0.40
0.60
0.80
1.00
-1 .00 -0 .80 -0 .60 -0 .40 -0 .20 0.00 0.20 0.40 0.60 0.80 1.00
S p inn ing Sp ee d (co ded R PM )
-1 .00
-0 .80
-0 .60
-0 .40
-0 .20
0.00
0.20
0.40
0.60
0.80
1.00
Sep
arat
ionT
ime
(cod
ed s
)

Predicted separation rate (solid line) and injury rate Predicted separation rate (solid line) and injury rate (dotted line) for microbulb of cutting position B(dotted line) for microbulb of cutting position B
-1 .00 -0 .80 -0 .60 -0 .40 -0 .20 0.00 0.20 0.40 0.60 0.80 1.00-1 .00
-0 .80
-0 .60
-0 .40
-0 .20
0.00
0.20
0.40
0.60
0.80
1.00
-1 .00 -0 .80 -0 .60 -0 .40 -0 .20 0.00 0.20 0.40 0.60 0.80 1.00
R ev olu tio n (c od ed RP M )
-1 .00
-0 .80
-0 .60
-0 .40
-0 .20
0.00
0.20
0.40
0.60
0.80
1.00
Sep
arat
ion
Tim
e (c
oded
sec
)

Predicted separation rate (solid line) and injury rate Predicted separation rate (solid line) and injury rate (dotted line) for microbulb of cutting position D(dotted line) for microbulb of cutting position D
-1 .00 -0 .80 -0 .60 -0 .40 -0 .20 0.00 0.20 0.40 0.60 0.80 1.00-1 .00
-0 .80
-0 .60
-0 .40
-0 .20
0.00
0.20
0.40
0.60
0.80
1.00
-1 .00 -0 .80 -0 .60 -0 .40 -0 .20 0.00 0.20 0.40 0.60 0.80 1.00
R ev olu tio n (co ded R PM )
-1 .00
-0 .80
-0 .60
-0 .40
-0 .20
0.00
0.20
0.40
0.60
0.80
1.00
Sep
arat
ion
Tim
e (c
oded
sec
)

Separation Rate Injury Rate Propagation Rate
TreatmentMeasured
ValuePredicted
Value
RelativeDiscrepancy
(%)
MeasuredValue
PredictedValue
RelativeDiscrepancy
(%)
MeasuredValue
15A1500 92.6 4.2 89.8 3.1 26.222.7 10.6 147.2 3.51.210A1900 97.0 4.1 94.8 2.4 30.522.3 65.1 53.1 3.81.810A1100 40.311.7 44.2 8.8 22.528.0 22.2 1.4 2.51.115B1550 80.3 8.9 77.3 3.9 15.910.8 21.8 27.3 3.40.610B1900 94.4 6.0 74.2 27.2 23.619.7 64.0 63.2 3.50.210B1100 39.8 6.6 17.6 126.1 27.532.6 20.9 31.2 2.60.615D1350 66.319.9 78.7 15.7 15.623.8 21.9 28.9 3.91.910D1900 81.5 3.7 85.5 4.7 13.115.7 67.1 80.6 4.10.810D1100 39.7 9.2 23.0 72.6 14.613.8 23.8 38.3 2.50.3
Comparison between predicted and measured Comparison between predicted and measured separation rate, injury rate and propagation rate of separation rate, injury rate and propagation rate of the validation experimentthe validation experiment

MECHANIZATION OF MULTIPLICATION MECHANIZATION OF MULTIPLICATION PROCESSPROCESS
Scale separation Scale separation Scale transplantingScale transplanting Other mechanical componentsOther mechanical components

SCALE SEPARATIONSCALE SEPARATION

Separation rate of lily microbulb with cutting position Separation rate of lily microbulb with cutting position A as affected by separation time, spinning speedA as affected by separation time, spinning speed
510
1530
1,000
1,500
2,000
0.0
10.0
20.0
30.0
40.0
50.0
60.0
70.0
80.0
90.0
100.0
Sep
arat
ion
Rat
e (%
)
Separation Time (s)
Spinning Speed(rpm)

Separation rate of lily microbulb with cutting position Separation rate of lily microbulb with cutting position B as affected by separation time, spinning speedB as affected by separation time, spinning speed
510
1530
1,000
1,500
2,000
0.0
10.0
20.0
30.0
40.0
50.0
60.0
70.0
80.0
90.0
100.0
Sep
arat
ion
Rat
e (%
)
Separation Time (s)
Spinning Speed(rpm)

Separation rate of lily microbulb with cutting position Separation rate of lily microbulb with cutting position C as affected by separation time, spinning speedC as affected by separation time, spinning speed
510
1530
1,000
1,500
2,000
0.0
10.0
20.0
30.0
40.0
50.0
60.0
70.0
80.0
90.0
100.0
Sepa
ratio
n R
ate
(%)
Separation Time (s)
Spinning Speed(rpm)

Separation rate of lily microbulb with cutting position Separation rate of lily microbulb with cutting position D as affected by separation time, spinning speedD as affected by separation time, spinning speed
510
1530
1,000
1,500
2,000
0.0
10.0
20.0
30.0
40.0
50.0
60.0
70.0
80.0
90.0
100.0
Sepa
ratio
n R
ate
(%)
Separation Time (s)
Spinning Speed(rpm)

Injury rate of lily microbulb with cutting position A as Injury rate of lily microbulb with cutting position A as affected by separation time, spinning speedaffected by separation time, spinning speed
510
15
1,000
1,500
2,000
0
10
20
30
40
50
60
70
80
90
100In
jury
Rat
e (%
)
Separation Time (s)
Spinning Speed(rpm)

Injury rate of lily microbulb with cutting position B as Injury rate of lily microbulb with cutting position B as affected by separation time, spinning speedaffected by separation time, spinning speed
510
15
1,000
1,500
2,000
0
10
20
30
40
50
60
70
80
90
100In
jury
Rat
e (%
)
Separation Time (s)
Spinning Speed(rpm)

Injury rate of lily microbulb with cutting position C as Injury rate of lily microbulb with cutting position C as affected by separation time, spinning speedaffected by separation time, spinning speed
510
15
1,000
1,500
2,000
0
10
20
30
40
50
60
70
80
90
100In
jury
Rat
e (%
)
Separation Time (s)
Spinning Speed(rpm)
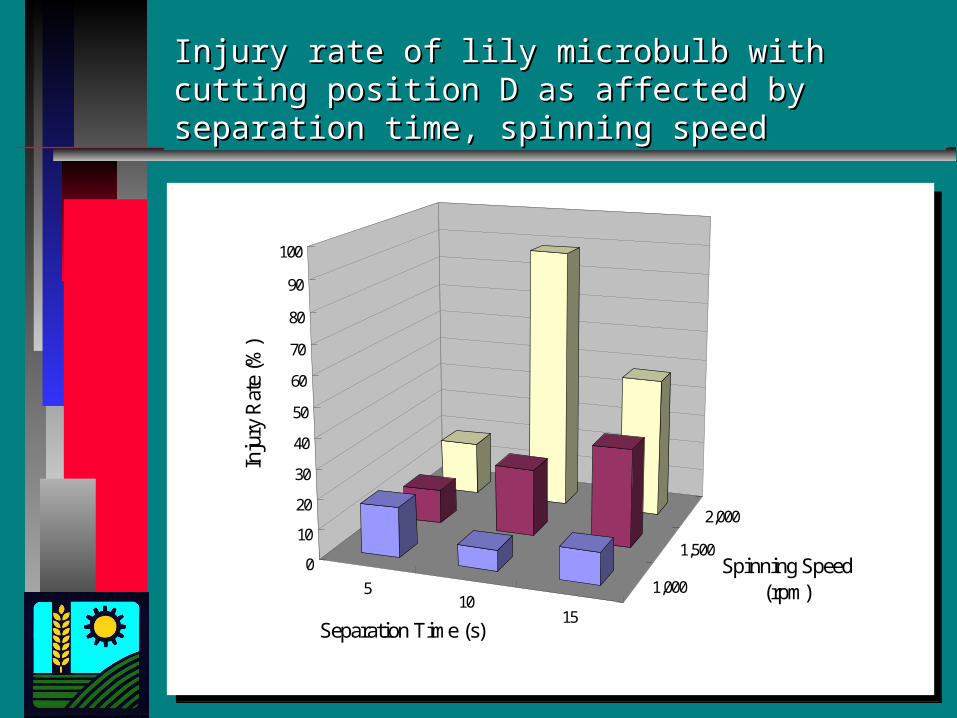
Injury rate of lily microbulb with cutting position D as Injury rate of lily microbulb with cutting position D as affected by separation time, spinning speedaffected by separation time, spinning speed
510
15
1,000
1,500
2,000
0
10
20
30
40
50
60
70
80
90
100In
jury
Rat
e (%
)
Separation Time (s)
Spinning Speed(rpm)

SCALE TRANSPLANTINGSCALE TRANSPLANTING
1. PLC control box. 2. Conveyer driving motor. 3. Control panel. 4. Vacuum pressure
gauge. 5. Supporting frame. 6. Vibrator. 7. Transplanting needles. 8. Tissue culture vessel.
9. Vibrating bulb scale tray. 10. Connecting tubes. 11. Chain conveyer.

CONCLUSIONSCONCLUSIONS The bulb scale separation and transplanting
operation was identified as the most laborious operation in the process.
A batch-type model and a stepwise model were constructed to study the influence of operation parameters.
At an optimum spinning speed and separation time, lily microbulb could be successfully separated into scales with acceptable injury rate.
A bulb scale separation and transplanting machine was developed and the process was optimized.

THANK YOUTHANK YOU
謝 謝 謝 謝