MECHANISTIC STUDY OF FISCHER TROPSCH SYNTHESIS FOR … · mechanistic study of fischer tropsch...
198
MECHANISTIC STUDY OF FISCHER TROPSCH SYNTHESIS FOR CLEAN FUEL PRODUCTION ZHUO MINGKUN (B. Eng. (Hons.), NUS) A THESIS SUBMITTED FOR THE DEGREE OF DOCTOR OF PHILOSOPHY DEPARTMENT OF CHEMICAL & BIOMOLECULAR ENGINEERING NATIONAL UNIVERSITY OF SINGAPORE 2013
Transcript of MECHANISTIC STUDY OF FISCHER TROPSCH SYNTHESIS FOR … · mechanistic study of fischer tropsch...
MECHANISTIC STUDY OF FISCHER TROPSCH
SYNTHESIS FOR CLEAN FUEL PRODUCTION
ZHUO MINGKUN
(B. Eng. (Hons.), NUS)
A THESIS SUBMITTED
FOR THE DEGREE OF DOCTOR OF PHILOSOPHY
DEPARTMENT OF CHEMICAL & BIOMOLECULAR
ENGINEERING
NATIONAL UNIVERSITY OF SINGAPORE
2013

Declaration
I hereby declare that this thesis is my original work and it has been written by
me in its entirety. I have duly acknowledged all the sources of information
which have been used in this thesis.
This thesis has also not been submitted for any degree in any university
previously.
____________________________
Zhuo Mingkun
07 January 2013
I
ACKNOWLEDGEMENTS
I would like to take this opportunity to extend my sincere appreciation to my
main supervisor, Assoc. Prof. Mark Saeys from NUS, for his patience, support,
insight and guidance throughout my PhD research. He has been providing
great ideas and technical knowledge which are invaluable to my research work.
I also wish to extend my gratitude to my co-supervisor, Dr. Armando Borgna
from ICES, for his supervision throughout my experimental studies in ICES.
Without his supervision and help, I would not be able to complete the
experimental works. I am also thankful to Dr. Chang Jie, Dr. Chen Luwei, Dr.
James Highfield, Mr. Poh Chee Kok and staffs in ICES who have helped me in
one way or another on the experimental studies.
To my seniors, Dr. Xu Jing and Dr. Tan Kong Fei who mentored me in the
usage of VASP and provided me with all the technical guidance, I thank you.
To Dr. Sun Wenjie, Gavin Chua Yong Ping, Fan Xuexiang, Ravi Kumar
Tiwari, Trinh Quang Thang, Cui Luchao, Novi Wijaya, Arghya Banerjee, G T
Kasun Kalhara Gunasooriya and Yi Rui who are my colleagues/lab mates, I
thank you for your help, support, camaraderie and encouragement throughout
my research work.
Finally, special thanks to my dear wife Koh Shu Hui, Regina, for being there
to support me as I pursue my doctorate degree. I am extremely grateful for her
love, patience and especially her understanding, which have enabled my
doctorate journey to be meaningful and successful.
II
TABLE OF CONTENTS
Acknowledgements ····································································· I
Table of contents ······································································· II
Summary ··············································································· VI
Symbols and abbreviations ························································ VIII
List of tables ············································································ X
List of figures ········································································ XIII
Publications ·········································································· XIX
Chapter 1 Introduction ·································································· 1
1.1 Scope and organization of the thesis ········································· 7
1.2 References ····································································· 10
Chapter 2 Literature Review of the Reaction Mechanisms and the Surface
Structure of Co-based Catalysts in FT Synthesis ································· 13
2.1 Introduction···································································· 13
2.2 Proposed mechanisms for the Fischer-Tropsch Synthesis ·············· 14
2.2.1 Carbide mechanism ···················································· 15
2.2.2 Hydrogen-assisted CO dissociation ·································· 18
2.2.3 CO insertion mechanism ·············································· 20
2.2.4 Other proposed mechanisms ·········································· 25
2.2.5 Kinetics of FT synthesis ··············································· 27
2.3 Catalyst surface structure under Fischer-Tropsch conditions ·········· 31
2.3.1 Terrace vs Stepped surface ············································ 31
2.3.2 CO Coverage on the surface of Co terrace ·························· 36
2.3.3 Surface reconstructions ················································ 38
2.4 Summary ······································································ 42
2.5 References ···································································· 44
III
Chapter 3 Computational and Experimental Methods ·························· 49
3.1 Computational methods ······················································ 49
3.1.1 Density Functional Theory (DFT) and Vienna Ab-Initio Simulation
Package (VASP) ································································ 49
3.1.2 Modeling with VASP in this thesis ···································· 51
3.2 Gibbs Free Energy and Phase Diagram ··································· 55
3.2.1 From DFT-PBE electronic energy to Gibbs free energy ··········· 55
3.2.2 Phase diagram ···························································· 58
3.2.3 CO over-binding correction factor ····································· 62
3.3 Kinetic Modeling ····························································· 63
3.4 Experimental methods ······················································· 67
3.4.1 Catalyst synthesis ························································ 67
3.4.2 Temperature Programmed Reduction (TPR) ························· 68
3.4.3 Reactor tests ······························································ 69
3.5 References ····································································· 72
Chapter 4 CO Surface Coverage and Stability of Intermediates on a Co
Catalyst ················································································· 74
4.1 Introduction ···································································· 74
4.2 Results and Discussion ······················································· 75
4.2.1 CO adsorption on a Co(0001) surface································· 75
4.2.2 Hydrogen adsorption on a ( 3 3 )R30º-CO Co(0001) surface
····················································································· 82
4.2.3 Effect of co-adsorbed CO on the stability of adsorbed CH and CH2
····················································································· 85
4.3 Conclusions ···································································· 87
4.4 References ····································································· 88
IV
Chapter 5 Density Functional Theory Study of the Hydrogen-Assisted CO
Dissociation and the CO Insertion Mechanism for Fischer-Tropsch Synthesis
over Co Catalysts ······································································ 89
5.1 Introduction ···································································· 89
5.2 Results and Discussion ······················································· 90
5.2.1 Effect of Hydrogenation on the C–O Dissociation Barrier ······· 91
5.2.2 Barriers for CO insertion into CHx species ························· 97
5.2.3 Effect of CHx coupling and hydrogenation on the C–O
dissociation barrier ···························································· 99
5.2.4 Barriers for CHCO, CH2CO and CH3CO hydrogenation ········ 102
5.2.5 Kinetic model for propagation via CO insertion ·················· 107
5.3 Conclusions ·································································· 112
5.4 References ···································································· 113
Chapter 6 Effect of CO coverage on the Kinetics of the CO Insertion
Mechanism and on the Carbon stability on Co Catalyst ························ 115
6.1 Introduction ··································································· 115
6.2 Results and Discussion ······················································ 117
6.2.1 Effect of CO coverage on the kinetics of the CO insertion
mechanism ···································································· 117
6.2.2 Effect of CO coverage on the stability of carbon ················· 131
6.3 Conclusions ··································································· 146
6.4 References ···································································· 147
Chapter 7 Initial Experimental Studies of Fischer-Tropsch Synthesis over Co
Catalysts. Effect of Boron Promotion and Co-feeding Mechanistic Studies
·························································································· 150
7.1 Introduction ··································································· 150
7.2 Results and Discussion ······················································ 151
7.2.1 Testing of the reactor system ········································ 151
V
7.2.2 FT synthesis with unpromoted and boron promoted Co catalyst at
493 K ··········································································· 153
7.2.3 Aldehyde co-feeding experiments ·································· 160
7.3 Conclusions ··································································· 166
7.4 References ···································································· 167
Chapter 8 General Conclusions ···················································· 168
Appendix A ··········································································A-1
A1.1 Sample calculations for conversions and products selectivites ·····A-1
A1.2 References ··································································A-7
VI
SUMMARY
Fischer-Tropsch (FT) synthesis converts syngas, a mixture of CO and H2, into
long-chain alkanes, alkenes, small amounts of oxygenates, and water. Despite
numerous scientific efforts to better understand the mechanism and the active
site requirements of this complex catalytic reaction, the detailed sequence of
C–O bond scission and C–C bond formation steps, as well as the nature of the
active sites, remains unclear. In this thesis, first principles Density Functional
Theory (DFT) calculations have been applied to understand the mechanism of
FT synthesis over Co catalysts and surface coverage of CO under FT
conditions. Under a realistic CO coverage, the mechanism was re-evaluated to
understand the influence of CO on the FT mechanism on Co catalysts.
Density functional theory calculations indicate that the CO coverage on
Co(0001) increases gradually until a ( 3 3 )R30º-CO configuration (1/3
ML) is formed. This structure is stable over a relatively wide temperature and
pressure range, until a phase transition to a ( 2 3 2 3 )R30º-7CO structure
occurs at high CO pressures. The 1/3 ML CO coverage reduces the H2 binding
enthalpy from –121 to –74 kJ/mol and reduces the hydrogen coverage to
below 0.3 ML.
Next, DFT calculations indicate that CO activation has a barrier of 220 kJ/mol
on Co(0001) terrace surface. Hydrogenation lowers the C–O dissociation
barrier to 90 kJ/mol for HCO and to 68 kJ/mol for H2CO. However, CO
VII
hydrogenation has a high energy barrier of 146 kJ/mol and is +117 kJ/mol
endothermic. An alternative propagation cycle starting with CO insertion into
surface RCH groups is proposed in this thesis. The barrier for this step is 74
kJ/mol on a Co terrace surface. The calculated CO turnover frequency (TOF)
for the proposed CO insertion mechanism is 30 times faster than the hydrogen
assisted CO activation but still significantly lower than the experimental
observed CO TOF of 0.02 s-1
. When a more realistic CO coverage is
considered, stability of intermediates is expected to decrease and CO TOF for
the propagation mechanism is expected to increase.
The stabilities of the reaction intermediates and reaction barriers in the CO
insertion mechanism were re-evaluated under a realistic 1/3 ML CO coverage.
The 1/3 ML CO coverage reduces the stability of the reaction intermediates by
10-30 kJ/mol. For the CO insertion mechanism, the reduced stabilities
decrease the overall surface barrier from 175 kJ/mol to 111 kJ/mol. This
reduced barrier increases the CO TOF to 0.02 s-1
, close to experimental values
and five orders of magnitude higher than the corresponding low coverage
value. Next, carbon adsorption on a Co(0001) terrace is studied with and
without the influence of CO on the surface. Under realistic CO coverage,
carbon formation on the surface becomes very unfavourable whereas stability
of subsurface carbon is improved. An attractive interaction is present between
subsurface carbon and CO on the surface, which leads to the improvement in
stability. The calculations show that it is important to consider a more realistic
intermediate coverage in the model to account of the possible repulsive and
attractive interactions.
VIII
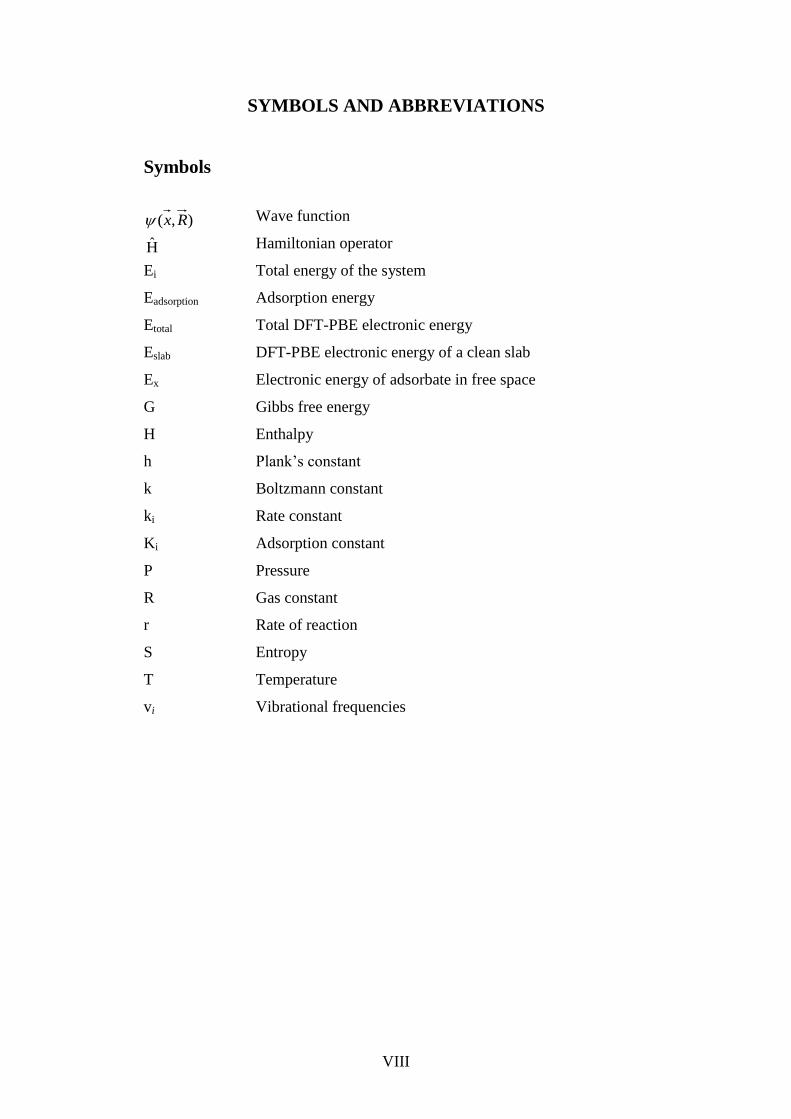
SYMBOLS AND ABBREVIATIONS
Symbols
),( Rx Wave function
H Hamiltonian operator
Ei Total energy of the system
Eadsorption Adsorption energy
Etotal Total DFT-PBE electronic energy
Eslab DFT-PBE electronic energy of a clean slab
Ex Electronic energy of adsorbate in free space
G Gibbs free energy
H Enthalpy
h Plank’s constant
k Boltzmann constant
ki Rate constant
Ki Adsorption constant
P Pressure
R Gas constant
r Rate of reaction
S Entropy
T Temperature
vi Vibrational frequencies
IX
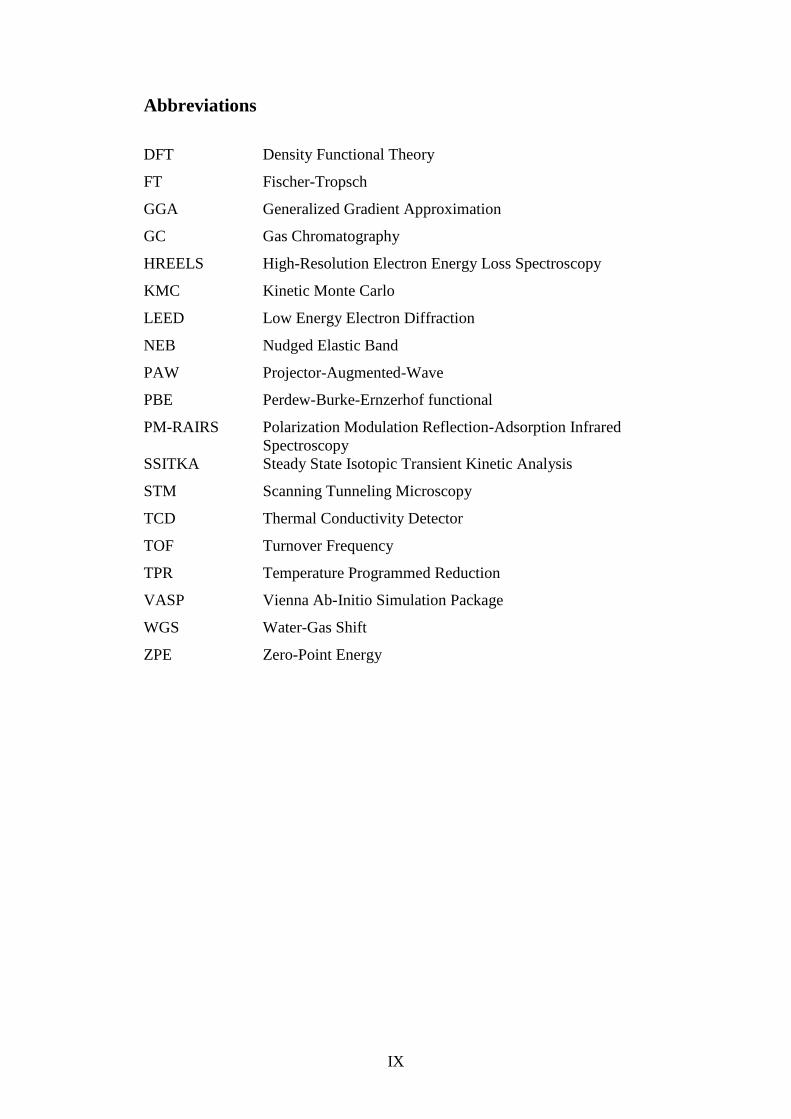
Abbreviations
DFT Density Functional Theory
FT Fischer-Tropsch
GGA Generalized Gradient Approximation
GC Gas Chromatography
HREELS High-Resolution Electron Energy Loss Spectroscopy
KMC Kinetic Monte Carlo
LEED Low Energy Electron Diffraction
NEB Nudged Elastic Band
PAW Projector-Augmented-Wave
PBE Perdew-Burke-Ernzerhof functional
PM-RAIRS Polarization Modulation Reflection-Adsorption Infrared
Spectroscopy
SSITKA Steady State Isotopic Transient Kinetic Analysis
STM Scanning Tunneling Microscopy
TCD Thermal Conductivity Detector
TOF Turnover Frequency
TPR Temperature Programmed Reduction
VASP Vienna Ab-Initio Simulation Package
WGS Water-Gas Shift
ZPE Zero-Point Energy
X
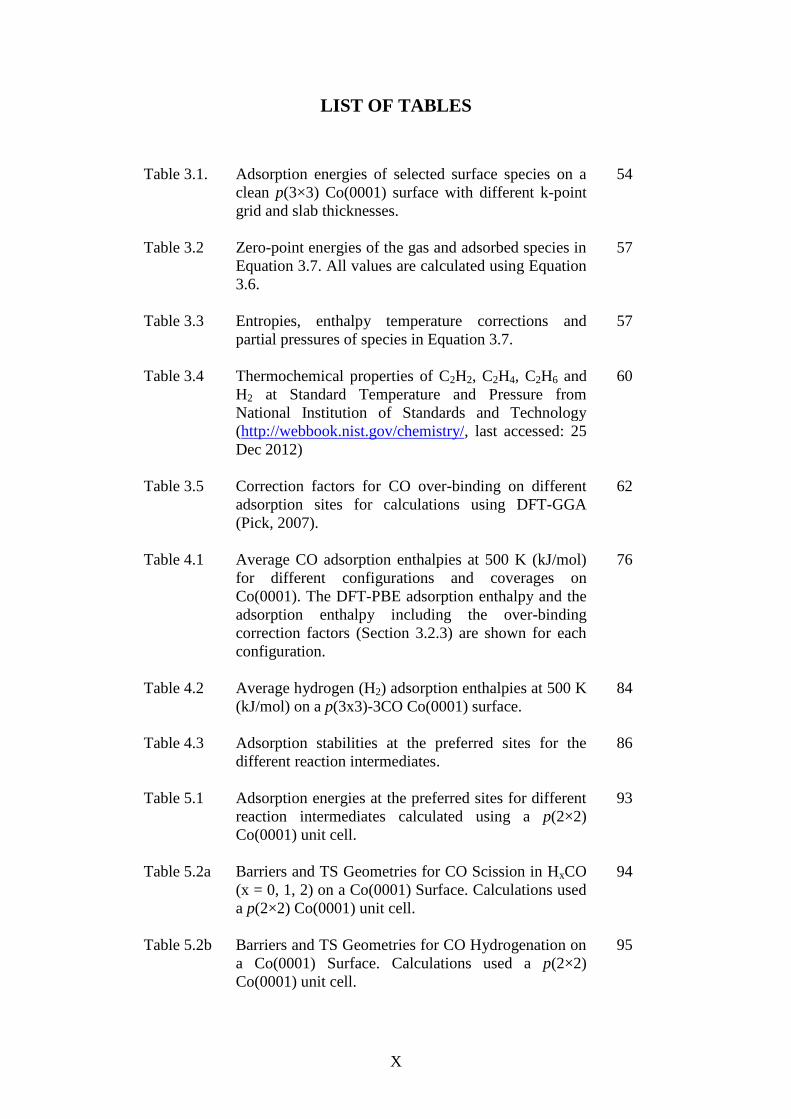
LIST OF TABLES
Table 3.1. Adsorption energies of selected surface species on a
clean p(3×3) Co(0001) surface with different k-point
grid and slab thicknesses.
54
Table 3.2 Zero-point energies of the gas and adsorbed species in
Equation 3.7. All values are calculated using Equation
3.6.
57
Table 3.3 Entropies, enthalpy temperature corrections and
partial pressures of species in Equation 3.7.
57
Table 3.4 Thermochemical properties of C2H2, C2H4, C2H6 and
H2 at Standard Temperature and Pressure from
National Institution of Standards and Technology
(http://webbook.nist.gov/chemistry/, last accessed: 25
Dec 2012)
60
Table 3.5 Correction factors for CO over-binding on different
adsorption sites for calculations using DFT-GGA
(Pick, 2007).
62
Table 4.1 Average CO adsorption enthalpies at 500 K (kJ/mol)
for different configurations and coverages on
Co(0001). The DFT-PBE adsorption enthalpy and the
adsorption enthalpy including the over-binding
correction factors (Section 3.2.3) are shown for each
configuration.
76
Table 4.2 Average hydrogen (H2) adsorption enthalpies at 500 K
(kJ/mol) on a p(3x3)-3CO Co(0001) surface.
84
Table 4.3 Adsorption stabilities at the preferred sites for the
different reaction intermediates.
86
Table 5.1 Adsorption energies at the preferred sites for different
reaction intermediates calculated using a p(2×2)
Co(0001) unit cell.
93
Table 5.2a Barriers and TS Geometries for CO Scission in HxCO
(x = 0, 1, 2) on a Co(0001) Surface. Calculations used
a p(2×2) Co(0001) unit cell.
94
Table 5.2b Barriers and TS Geometries for CO Hydrogenation on
a Co(0001) Surface. Calculations used a p(2×2)
Co(0001) unit cell.
95
XI
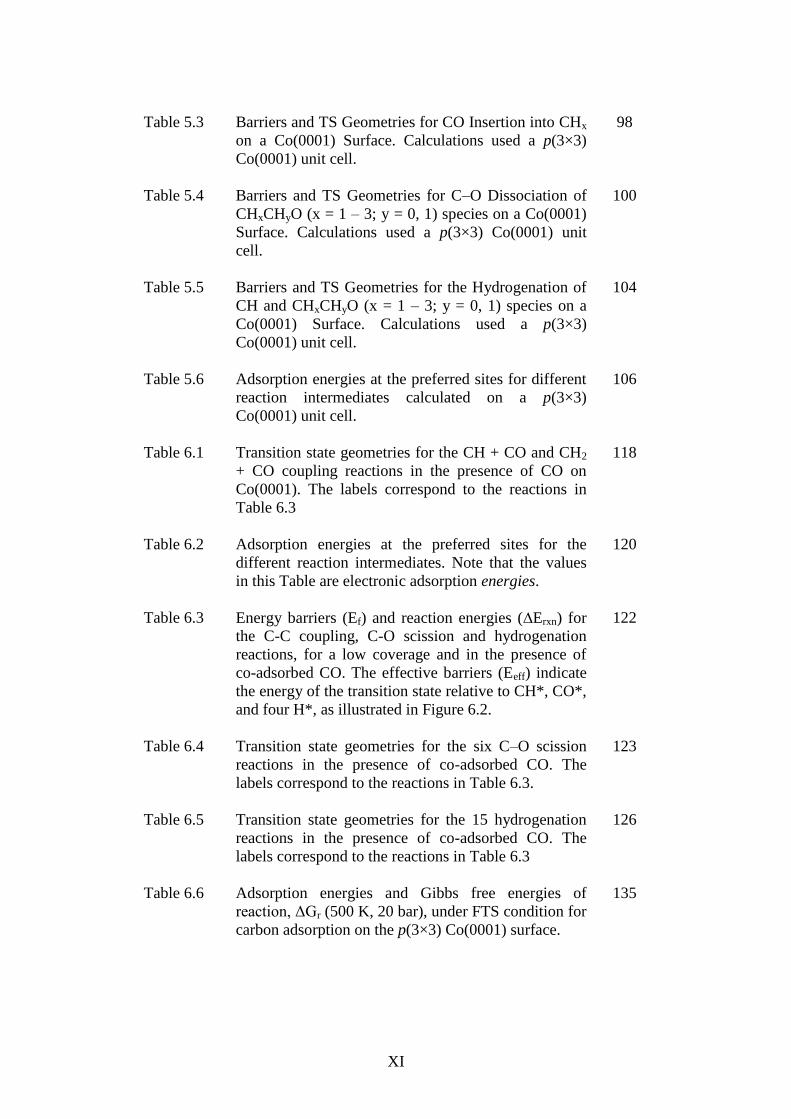
Table 5.3 Barriers and TS Geometries for CO Insertion into CHx
on a Co(0001) Surface. Calculations used a p(3×3)
Co(0001) unit cell.
98
Table 5.4 Barriers and TS Geometries for C–O Dissociation of
CHxCHyO (x = 1 – 3; y = 0, 1) species on a Co(0001)
Surface. Calculations used a p(3×3) Co(0001) unit
cell.
100
Table 5.5 Barriers and TS Geometries for the Hydrogenation of
CH and CHxCHyO (x = 1 – 3; y = 0, 1) species on a
Co(0001) Surface. Calculations used a p(3×3)
Co(0001) unit cell.
104
Table 5.6 Adsorption energies at the preferred sites for different
reaction intermediates calculated on a p(3×3)
Co(0001) unit cell.
106
Table 6.1 Transition state geometries for the CH + CO and CH2
+ CO coupling reactions in the presence of CO on
Co(0001). The labels correspond to the reactions in
Table 6.3
118
Table 6.2 Adsorption energies at the preferred sites for the
different reaction intermediates. Note that the values
in this Table are electronic adsorption energies.
120
Table 6.3 Energy barriers (Ef) and reaction energies (∆Erxn) for
the C-C coupling, C-O scission and hydrogenation
reactions, for a low coverage and in the presence of
co-adsorbed CO. The effective barriers (Eeff) indicate
the energy of the transition state relative to CH*, CO*,
and four H*, as illustrated in Figure 6.2.
122
Table 6.4 Transition state geometries for the six C–O scission
reactions in the presence of co-adsorbed CO. The
labels correspond to the reactions in Table 6.3.
123
Table 6.5 Transition state geometries for the 15 hydrogenation
reactions in the presence of co-adsorbed CO. The
labels correspond to the reactions in Table 6.3
126
Table 6.6 Adsorption energies and Gibbs free energies of
reaction, ΔGr (500 K, 20 bar), under FTS condition for
carbon adsorption on the p(3×3) Co(0001) surface.
135
XII
Table 6.7 Adsorption energies and Gibbs free energies of
reaction, ΔGr (500 K, 20 bar), under FTS condition for
hydrogen adsorption on the p(3×3) Co(0001) surface.
138
Table 6.8 DFT-PBE CO adsorption energy on positions TOP
sites of the Co surface with 1 to 3 carbons in present
in the first subsurface octahedral site.
140
Table 6.9 Charges € on Co atoms, subsurface carbon and CO on
the Co(0001) surface.
141
Table 6.10 Center of electron density of Co d-orbital electrons
and carbon of adsorb CO p-orbital electrons.
142
Table 7.1 Detailed comparison of experimental conditions and
results between Tan et al. (2011; PhD thesis) and this
thesis for FT synthesis using 1.0 g of 20 wt% Co/γ-
Al2O3 catalysts, promoted with boron. (H2:CO = 2, 20
bar; W/F 7.5 gcat h/mol)
155
Table 7.2 List of unknown products formed during
propionaldehyde co-feeding and hydrogenation
experiments. Carbon number of the products is
identified by comparing against known FT products
distribution.
163
Table A1.1 Normalized inlet flow rates and concentrations for H2,
CO and Ar.
A-2
Table A1.2 Peak areas for the components detected by the TCD
and concentration (v/v) of each component calculated
with the calibration charts in Figure 3.5.
A-3
Table A1.3 Peak areas for the products detected by the FID, the
weight percent, mole percent and carbon balance.
A-5

XIII
LIST OF FIGURES
Figure 1.1 Image of a step-edge. The darker atoms show the
location of a B5 site.
5
Figure 1.2 (a) STM image of a clean Co(0001) single crystal
before exposure to syngas and (b) after 1 hour
exposure to syngas at reaction conditions,
(Wilson and de Groot, 1995).
6
Figure 1.3 A tree diagram summarizing the original scope of study
for this thesis. Highlighted boxes (in grey) indicate
studies that have been conducted and presented in this
thesis.
9
Figure 2.1 Carbide mechanism for the Fischer – Tropsch
Synthesis.
15
Figure 2.2 Product distribution of isotopically labeled propene
molecules produced in a series of experiments where
mixtures of 90% 13
CO + 10% 12
CO, and CH2N2 was
passed over Co catalyst at 523 K and 1 bar. (○)
Experimentally observed distribution is represented by
the dotted lines; (Δ) Distribution predicted by the
carbide mechanism; (◊) Distribution predicted by the
CO insertion mechanism; (□) Distribution predicted by
the enol mechanism. An increasing amount of CH2N2
was used in experiments a – d. (Brady and Pettit, 1981)
16
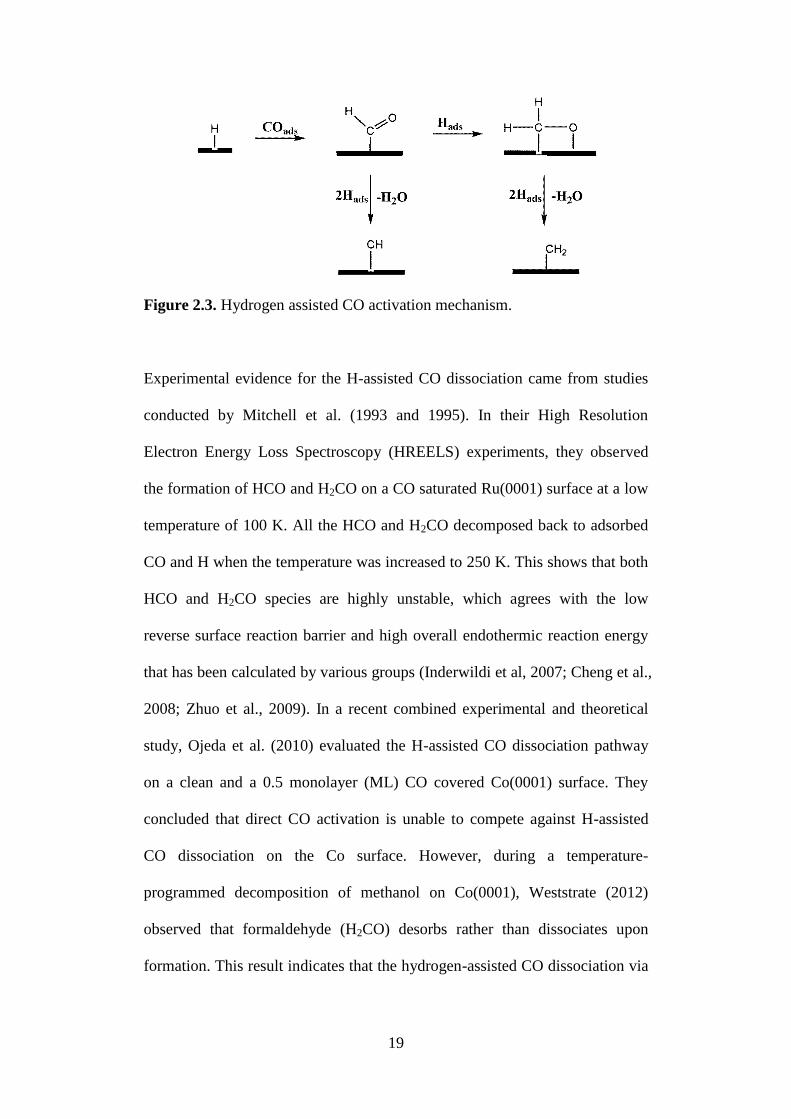
Figure 2.3 Hydrogen assisted CO activation mechanism. 19
Figure 2.4 CO insertion mechanism by Pichler and Schulz (1970)
and Schulz and Zein El Deen (1977).
21
Figure 2.5 Alternative CO insertion mechanism (Masters, 1979). 22
Figure 2.6 Proposed propagation cycle via CO insertion by Zhuo
et al. (2009), Chapters 5 and 6.
23
Figure 2.7 Outlet flows (molecules/s) during the build-up
experiment. Conditions: T = 503 K, ptot = patm, total
volumetric flow rate Dtot = 40 cm3/min and H2/CO = 3.
The inserts provides a zoom into the early stages of
build-up and allows identification of delay times.
(Schweicher et al., 2012)
25
Figure 2.8 The enol mechanism proposed by Storch et al. (1951). 26
XIV
Figure 2.9 Proposed mechanism by Frennet et al. (2005).
27
Figure 2.10 Rate of CO conversion to hydrocarbons (extrapolated
to zero CO conversion) at 0.25-1.20 MPa CO (•, 1.20
MPa H2) and 0.40-1.00 MPa H2 (○, 0.40 MPa CO) at
508 K on Fe-Zn-Cu-K catalyst. (Ojeda et al., 2010)
30
Figure 2.11 Turnover frequency (TOF) as a function of cobalt
particle size. (■) – H2/CO = 2, 1 bar and 393 K; (▲) –
35 bar and 383 K ; (○) – H2/CO = 10, 1.85 bar and 373
K. ( den Breejen et al., 2009)
34
Figure 2.12 Spectra of O1s and C1s after heating ethanol-saturated
surface to different temperatures, as indicated.
Reference spectra of O1s and C1s are shown in orange.
The image in the middle shows the results of a
temperature-programmed X-ray photoelectron
spectroscopy (TP-XPS) experiment. The breaking of
the C–O bond of the ethoxy moiety into atomic oxygen
(529.26 eV) and acetylene (283.3 eV) occurs around
350 K. (Weststrate et al., 2010)
35
Figure 2.13 Configurations of CO adsorption on Co(0001) surface.
a) ( 3 3 )R30º-CO structure, θ = 1/3 ML; b)
( 2 3 2 3 )R30º-7CO, θ = 7/12 ML. Colour map:
Large blue atoms represent the surface of hcp
Co(0001); Grey atoms represent carbon; Red atoms
represent oxygen.
38
Figure 2.14 FCC–Co(100) surface at a C coverage of 0.5 ML
(Left). Clock reconstructed FCC–Co(100) surface at a
C coverage of 0.5 ML (Right). (Ciobîcă et al., 2008).
39
Figure 2.15 Scanning Tunneling Microscopy (STM) images. a)
Image of a larger area showing the edge of a
( 3 3 )R30o island and a (1×1) periodicity between
islands. b) A 2D Fourier transform of image (a) that
shows both ( 3 3 )R30o and (1×1) structures.
(Weststrate et al., 2012)
41
XV
Figure 3.1 a) Model of a p(2×2) unit cell showing all available
adsorption sites on the surface. (×) – Top; (–) – Bridge;
(∆) – Fcc; (○) – Hcp. b) Model of a p(3×3) unit cell. c)
A 3 layers p(3×3) model slab in the z – direction with
inter-slab spacing of 10 Å. The top two layers are
relaxed while the bottom layer is constrained to the
bulk positions. d) Optimization of lattice constant for
bulk hcp Co.
52
Figure 3.2 Phase diagram for acetylene, ethylene and ethane
plotted with respect to temperature and hydrogen
pressure. (■) High temperature of 1667 K, and high
hydrogen partial pressure of 100 bar where ethylene is
dominant.
61
Figure 3.3 A semi-automated parallel micro fixed-bed reactor
system (Newton & Stokes, Singapore) and a simplified
process flow diagram that describes the operation of
the reactor system.
70
Figure 4.1 Average (▲) and differential (■) CO adsorption
enthalpy as a function of the CO coverage (θCO) on
Co(0001) for the structures shown in Table 1. The
differential adsorption enthalpy is defined as the
adsorption enthalpy for each additional CO molecule in
a p(3x3) unit cell for coverages up to 1/3 ML, and as
the adsorption enthalpy for the CO molecules added to
a surface with 1/3 ML CO for coverages above 1/3ML.
TΔSadsorption represents the Gibbs free energy loss
resulting from the CO adsorption entropy at 500 K.
77
XVI
Figure 4.2 Stability diagram for CO adsorption on Co(0001). The
CO adsorption enthalpies are summarized in Figure 1,
while the structures are shown in Table 1. Three
regions can be identified: below the ΔGads=0 line, the
equilibrium CO coverage is below 1/3 ML; above the
ΔGads=0 line, the ( 3 3 )R30º-CO phase is stable
and adsorption of additional CO molecules beyond 1/3
ML is unfavorable; above the solid line, a phase
transition to a ( 2 3 2 3 )R30º-7CO configuration is
predicted. The dotted line indicates the conditions
where it is favorable to form a metastable p(3x3)-5CO
configuration starting from the ( 3 3 )R30º-CO
configuration. (▼) Experimental conditions (7×10⁻⁹
mbar and 300 K) where a ( 3 3 )R30º-CO was
observed by Bridge et al. (1977). (∆) Experimental
conditions (below 1 mbar and at 300 K) where a
( 3 3 )R30º-CO was observed by Beitel et al.
(1996). (▲) Experimental conditions (100 mbar and
490 K) where a ( 3 3 )R30º-CO structure was
observed by Beitel et al. (1997). (●) Experimental
conditions (100 mbar and 300 K) where a
( 2 3 2 3 )R30º-7CO structure was observed by
Beitel et al. (1997). (■) Typical FT synthesis conditions
(6 bar and 500 K).
78
Figure 4.3 Average (▲) and differential (■) hydrogen (H2)
adsorption enthalpy in the presence of 1/3 ML CO, as a
function of the hydrogen coverage (θH). The
differential adsorption enthalpy is the adsorption
enthalpy for each additional H atom in the p(3x3)-3CO
unit cell. The insert illustrates how the hydrogen
coverage changes as a function of the average
adsorption enthalpy. The indicated 0.3 ML coverage
and the average adsorption enthalpy of −54 kJ/mol
correspond to typical FT conditions, i.e., a H2 partial
pressure of 9 bar.
85
Figure 5.1 Energy profile for the hydrogen-assisted CO activation
mechanism on a Co(0001) terrace surface.
96
Figure 5.2 Energy profile for RCH2C–O pathway via CO insertion
into RCH species.
107
XVII
Figure 5.3 Proposed propagation cycle for the CO Insertion
mechanism. The full arrow indicated the dominant
reaction path, and the dotted arrows indicate the minor
reaction path. R represents hydrogen or an alkyl group.
109
Figure 6.1 Possible propagation reaction paths for the CO
insertion mechanism. The reaction starts by C-C
coupling (“+CO*”), followed by hydrogenation
(“+H*”) and C–O scission steps (“–O*”). The full
arrows indicate the dominant reaction path and the
dotted arrows the minor reaction paths. R represents
hydrogen or an alkyl group. Activation barriers and
reaction energies for all steps are given in Table 6.3.
118
Figure 6.2 Electronic energy profile for the RCCH-O pathway (a)
and for the dominant RCH2C-O pathway (b), as
illustrated in Figure 4. The reaction energy for the
overall propagation cycle, CH* + CO(g) + 2 H2(g)
CH3C* + H2O(g), is ‒229 kJ/mol, corresponding with
a reaction enthalpy of ‒ 180 kJ/mol. The inserts
illustrate selected transition states. Additional transition
state geometries can be found in Table 6.5.
125
Figure 6.3 Gibbs free energies for selected transition states along
the RCH2C–O reaction path, relative to CH* in the
presence of co-adsorbed CO, CO* at a coverage of 1/3
ML, and gas phase H2 at 9 bar. The free energy
diagram shows that C–O scission is preferred over
hydrogenation for RCH2C–O, while hydrogenation is
preferred over C–O scission for RCHC–O. The
RCHCO hydrogenation transition state has the highest
free energy along the dominant CO insertion reaction
path and is likely rate-limiting.
130
Figure 6.4 (a) Carbon adsorption on a clean Co(0001) surface
forming a (√3 × √3)R30o configuration with a coverage
of 1/3 ML; (b) Carbon adsorption in the first sub-
surface layer of a clean Co(0001) surface with a
coverage of 1/3 ML; (c) Carbon adsorption on a 1/3
ML CO covered Co(0001) surface; (d) Carbon
adsorption in the first sub-surface layer of a 1/3 ML
CO covered Co(0001) surface. Colour map – Co atoms
– light grey; Carbon atoms – Dark grey; Oxygen atoms
– Black
136
Figure 7.1 Plot of the CO conversion and products selectivity for
FT synthesis with a 0.05 wt% Pt promoted 20 wt%
Co/γ-Al2O3 catalyst at 493 K and 20 bars for a period
of 48 hours.
152
XVIII
Figure 7.2 Anderson-Schultz-Flory (ASF) product distribution for
FT synthesis with a 0.05 wt% Pt promoted 20 wt%
Co/γ-Al2O3 catalyst at 48hrs. (Conditions: 493 K, 20
bar)
153
Figure 7.3 Effect of boron promotion on CO conversion as a
function of time on stream for a 20 wt% Co/γ-Al2O3 FT
catalyst. A) Reaction conditions: 513 K and 20 bar,
H2/CO ratio of 2.0. (Tan et al., 2011). B) Reaction
conditions: 493 K and 20 bar, H2/CO ratio of 2.0. (This
thesis)
154
Figure 7.4 Anderson-Schultz-Flory (ASF) product distribution for
FT synthesis with a 20 wt% Co/γ-Al2O3 catalyst at
24hrs. (Conditions: 493 K, 20 bar)
156
Figure 7.5 Temperature-programmed reduction (TPR) profiles of
20 wt% Co/γ-Al2O3 catalysts.
159
Figure 7.6 Possible outcomes of the aldehyde that has been co-fed
during FT synthesis.
161
Figure A1.1 Calibration charts for CO, H2, Ar and CH4 for the
TCD.
A-1
Figure A1.2 An illustration of the material balance to calculate
outlet flow rates of reactants and products based GC
TCD results. Argon is the internal standard.
A-2
XIX
PUBLICATIONS
1. Mingkun Zhuo, Kong Fei Tan, Armando Borgna, Mark Saeys,
“Density Functional Theory Study of the CO Insertion Mechanism for
Fischer-Tropsch Synthesis over Co Catalysts”, Journal of Physical
Chemistry C, 113 (2009), 8357.
2. Mingkun Zhuo, Armando Borgna, Mark Saeys, “Effect of the CO
coverage on the Fischer-Tropsch mechanism on cobalt catalysts”,
Journal of Catalysis, 297 (2013), 217.
1
CHAPTER 1
INTRODUCTION
“Peak oil is now.” – German Energy Watch Group (2008)
Peak oil refers to the point in time when crude oil extraction rate reaches its
maximum rate, after which a decline and complete depletion is inevitable. As
the demand for energy continues to grow, we are entering, if we are not
already in, the peak oil era (Schindler and Zittel, 2008). At the same time, the
race to search for a sustainable alternative fuel has also begun. This has
sparked a renewed interest in Fischer–Tropsch (FT) synthesis (de Klerk, 2011)
which is the conversion of synthesis gas (syngas), a mixture of carbon
monoxide (CO) and hydrogen gas (H2), to long-chain alkanes, alkenes, small
amounts of oxygenates and water (Fischer and Tropsch, 1923; Dry, 1996;
Davis et al., 2007). The process was discovered by German scientists Franz
Fischer and Hans Tropsch in the 1920s. Feedstock for FT synthesis can be
derived from the gasification of coal or biomass and from partial oxidation of
natural gas. Both coal and natural gas are present in abundance while biomass
is a renewable source. Hence, FT synthesis is a very promising option to
produce synthetic fuels. Despite the long history, the process has not yet been

2
widely applied industrially, probably due to the high capital cost and the
significant technological know-how required.
Historically, Germany was the first to begin large-scale production of liquid
fuels from their coal reserves in the 1930s. It became their major source of
fuel supply for the army during World War II. However, these plants
eventually ceased operation after the war because they were unable to compete
with the crude oil price in the open market (Anderson, 1984). As new oil
reserves were being discovered, the price of crude oil continued to remain low
(less than $30/barrel). Therefore, running a FT plant was not an economically
viable option (Patzlaff et al., 1999). This is the main reason why
commercializing FT has not been popular.
South-Africa wanted energy independence and possesses large coal reserves
that are more suitable for FT synthesis than for coal liquefaction. Therefore,
South-Africa decided to construct their first FT plant, operated by the South
Africa Oil and Gas Corporation (SASOL) since 1951 (Steynberg and Dry,
2004; Davis and Occelli, 2007). Despite the fact that huge crude oil reserves
were discovered in the Middle East prior to the completion of the plant, the
plant eventually came on-stream in 1955 but without much economic success.
Nonetheless, FT research remained active in South Africa. The energy crisis in
the 1970s and government policies prompted SASOL to build two more FT
plants which came on-stream in the 1980s. Currently, SASOL is the leading
company in running commercial FT plants. In the recent decades, more FT
plants were built. In 1992, a new FT plant was built in South Africa by
3
Mossgas and in 1993 Shell built a FT plant in Bintulu, Malaysia (Steynberg
and Dry, 2004). One of the latest FT plants that came on-stream in 2011 was
built in Ras Laffan, Qatar. As the crude oil price is currently above $100 per
barrel (OPEC, 2012), the outlook for running commercial FT synthesis is
certainly more promising. New FT plants are under construction in Nigeria
and China.
The positive developments in industrial FT synthesis and the revived interest
have driven scientific efforts to better understand this seemingly simple but in
fact a very complex catalytic reaction. There are two longstanding issues that
have yet been fully understood and resolved. They are: (1) the mechanism of
FT synthesis and; (2) the nature of the active sites for the reaction. These two
challenges are, of course, related to one another. The product distribution is
moreover sensitive to the nature of the catalyst. A number of Group VIII
transition metals have known activity for FT. Iron (Fe) and cobalt (Co) based
catalysts are the popular choices for industrial applications (Steynberg and Dry,
2004). Fe-based catalysts are less expensive but Co-based catalysts have better
activity, lower water-gas shift (WGS) activity and produce more paraffins
(Iglesia, 1997; Davis, 2007). Both nickel (Ni) and ruthenium (Ru) also have
good activity. However, Ni has a high selectivity towards methane while Ru is
relatively low in abundance for large-scale applications even though it has
superior activity and selectivity towards long chain hydrocarbons. (Steynberg
and Dry, 2004; Khodakov et al., 2007). The varying activities and selectivities
suggest that there may be different mechanisms and different types of active
sites on different catalysts.
4
Popular general mechanisms are the carbide mechanism (Fischer and Tropsch,
1926), the CO insertion mechanism (Pichler and Schulz, 1970) and the enol
mechanism (Storch et al., 1951). In the carbide mechanism, CO first
dissociates into surface carbon and oxygen. The surface carbon then
hydrogenates to form surface CHx species which then couple to form long-
chain hydrocarbons. Unlike the carbide mechanism, chain growth in the CO
insertion mechanism takes place via the insertion of surface CO into RCHx
groups before C–O scission. Finally, in the enol mechanism, surface hydroxyl
methylene species (HCOH) couple via a condensation reaction involving the
removal of a water molecule to form longer chains.
In the recent decades, the advancement in computational chemistry provided
an alternative way to evaluate proposed mechanisms as well as the active sites
on different model surfaces. Development of Density Functional Theory (DFT)
(Hohenberg and Kohn, 1965; Kohn and Sham, 1965) as well as efficient
methods and implementations, enables surface reactions to be studied on
model catalyst surfaces (Ge and Neurock, 2006; Cheng et al., 2008; Shetty et
al.; 2009; Inderwildi et al.; 2007) with a good degree of accuracy and
efficiency. A successful application of molecular modeling to gain
understanding of the active sites is the case of ammonia synthesis (Dahl et al.,
1999; Honkala et al., 2005). From calculations and experiments, they found
that N2 dissociation is preferred on step sites of Ru(0001) surface. This implies
that smaller Ru particles are required for a high ammonia productivity, which
they observed experimentally. CO dissociation, a key step in the carbide
mechanism, was found to be highly unfavourable on Co(0001) terraces (Ge
5
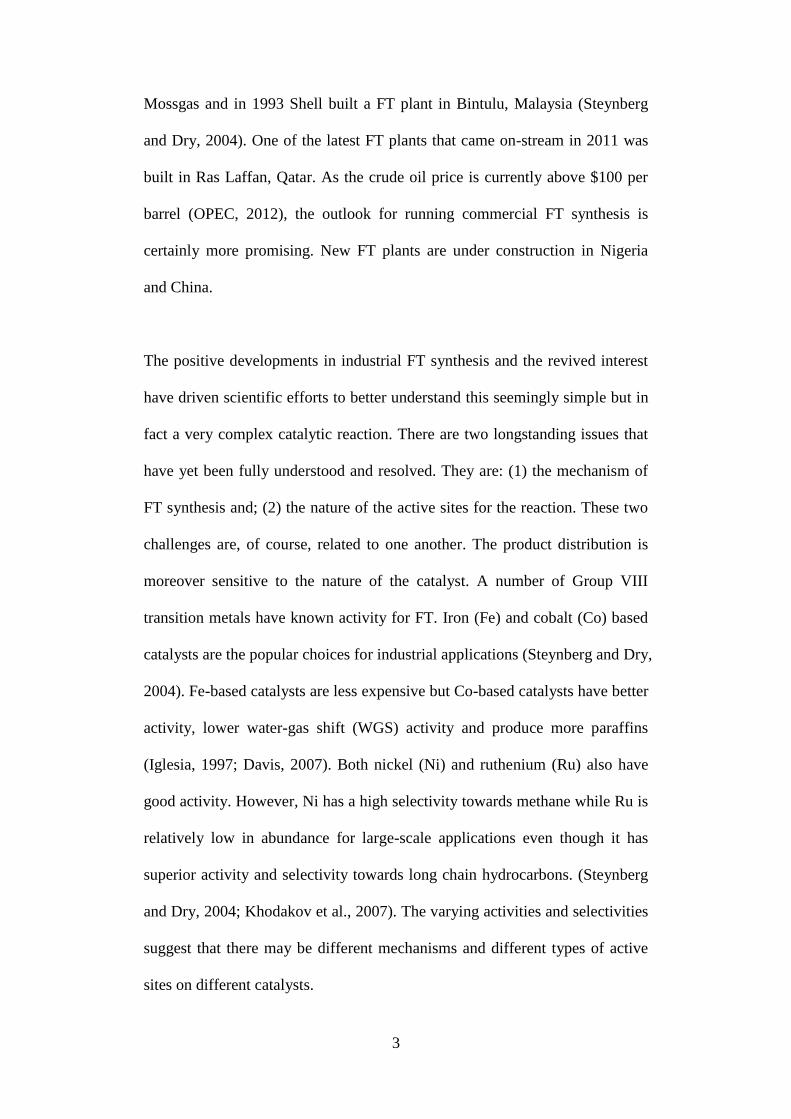
and Neurock, 2006). However, special active sites known as B5 sites (Figure
1.1) have been found to lower the CO dissociation barrier (Ge and Neurock,
2006; Shetty at al., 2008) to about 100 kJ/mol, a value which might be able to
account for the CO turnover frequency (TOF) observed in experiments
(Riberio et al., 1997). Such sites are believed to be present in FT catalyst
particles of size above 2 nm, typically along step edges of a terrace surface
(Figure 1.1). However, it has also been demonstrated experimentally that the
TOF of CO does not change for Co particle sizes greater than 6 nm (Bezemer
et al., 2006; den Breejen et al., 2009), suggesting that the kinetically relevant
steps occur at the terraces of the catalyst particles, rather than the B5 sites.
Figure 1.1. Image of a step-edge. The darker atoms show the location of a B5
site.
Numerous experimental studies (e.g. Brady and Pettit, 1980; 1981; Blyholder
and Emmett, 1959; 1960; Kummer and Emmett, 1953; Raje and Davis, 1996)
have been carried out to provide support for the various proposed mechanisms.
Similarly, a considerable amount of scientific efforts have been invested to
6
better understand the active sites and nature of the surface structure of the
catalyst under FT conditions. Surface science experiments with model single
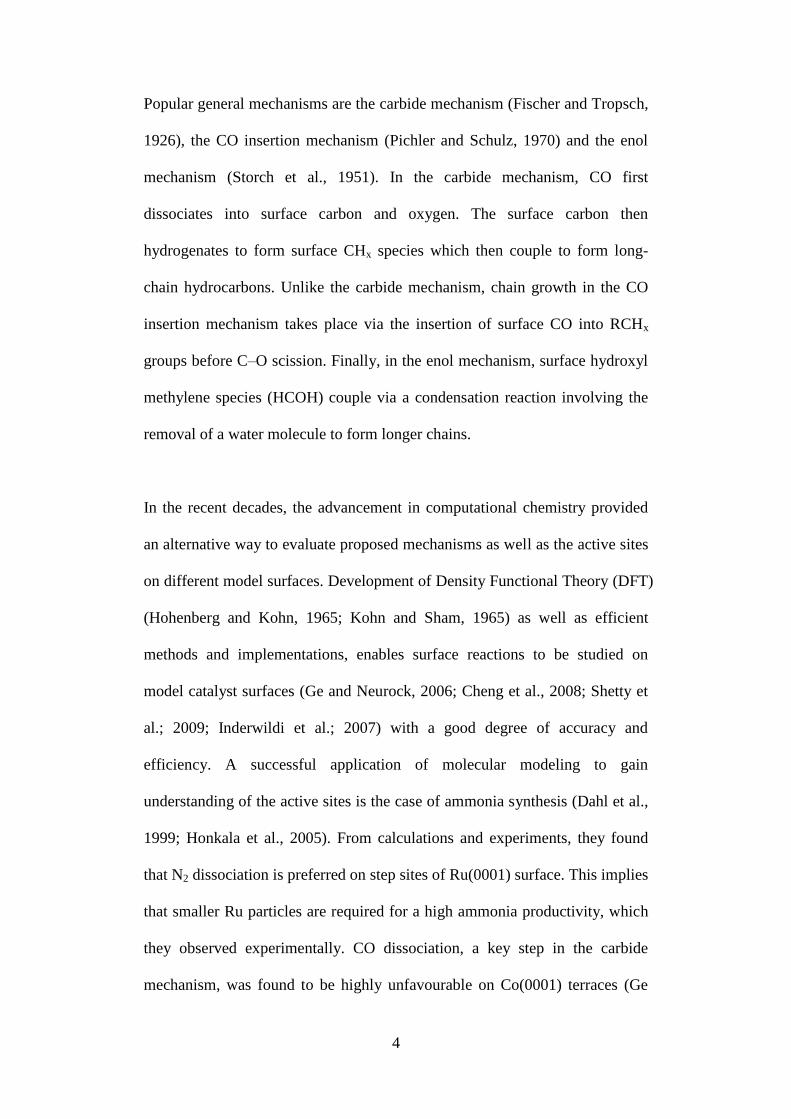
crystals are typical tools to understand this aspect of the reaction. One of the
most significant pieces of work was by Wilson and de Groot (1995). They
looked at the surface of clean Co(0001) single crystals before and after
treatment with syngas under FT conditions (523 K, 4 bar), using Scanning
Tunneling Microscopy (STM). A massive surface reconstruction was observed
(Figure 1.2).
Figure 1.2. (a) STM image of a clean Co(0001) single crystal before exposure
to syngas and (b) after 1 hour exposure to syngas at reaction conditions,
(Wilson and de Groot, 1995).
7
Beitel et al. (1996; 1997) studied the adsorption configurations of CO and H2
on Co(0001) single crystals at pressures below 300 mbar using Polarization
Modulation Reflection-Absorption Infrared Spectroscopy (PM-RAIRS).
Various well-defined CO adsorption configurations were observed. Despite
the numerous experimental and computational studies, the complicated
network of reactions as well as nature of active sites on the catalyst under FT
conditions remains unclear.
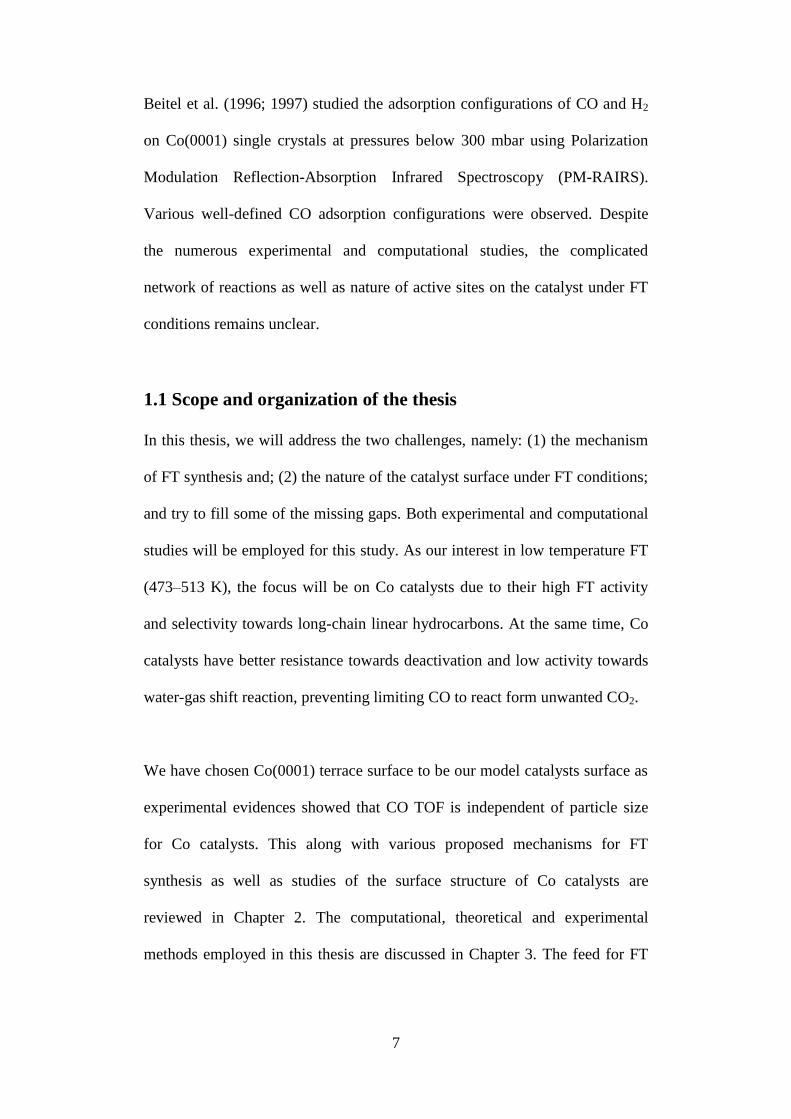
1.1 Scope and organization of the thesis
In this thesis, we will address the two challenges, namely: (1) the mechanism
of FT synthesis and; (2) the nature of the catalyst surface under FT conditions;
and try to fill some of the missing gaps. Both experimental and computational
studies will be employed for this study. As our interest in low temperature FT
(473–513 K), the focus will be on Co catalysts due to their high FT activity
and selectivity towards long-chain linear hydrocarbons. At the same time, Co
catalysts have better resistance towards deactivation and low activity towards
water-gas shift reaction, preventing limiting CO to react form unwanted CO2.
We have chosen Co(0001) terrace surface to be our model catalysts surface as
experimental evidences showed that CO TOF is independent of particle size
for Co catalysts. This along with various proposed mechanisms for FT
synthesis as well as studies of the surface structure of Co catalysts are
reviewed in Chapter 2. The computational, theoretical and experimental
methods employed in this thesis are discussed in Chapter 3. The feed for FT
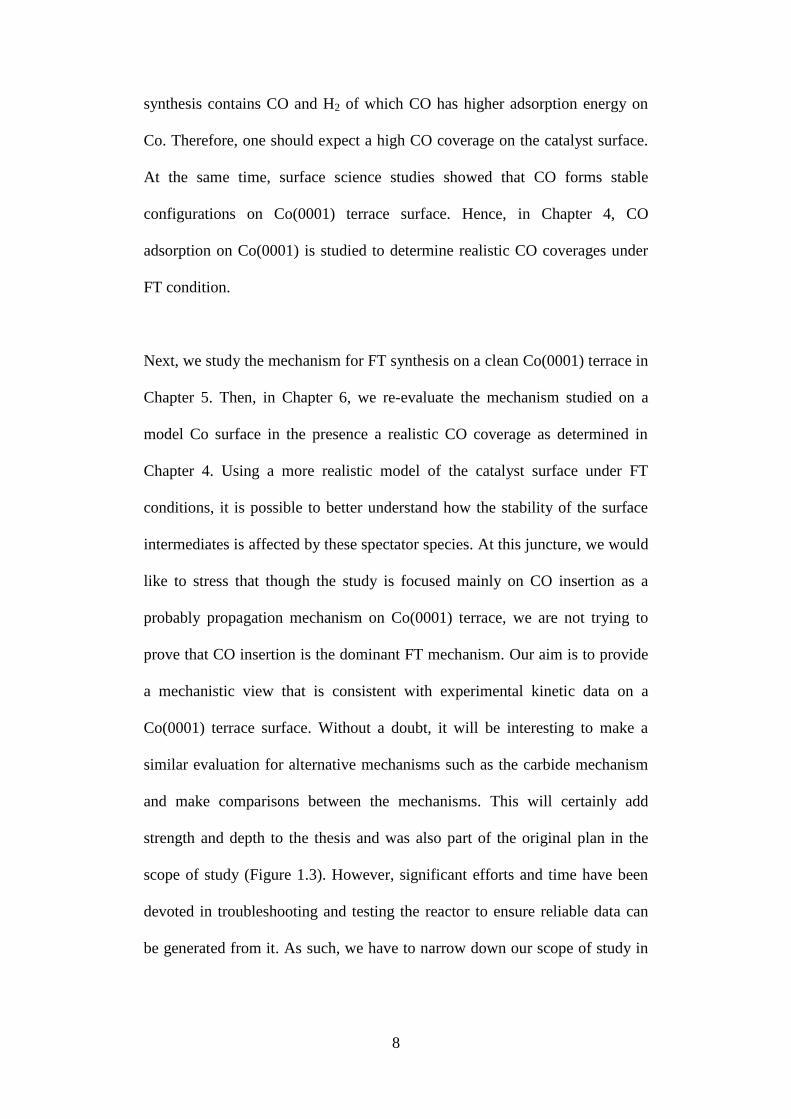
8
synthesis contains CO and H2 of which CO has higher adsorption energy on
Co. Therefore, one should expect a high CO coverage on the catalyst surface.
At the same time, surface science studies showed that CO forms stable
configurations on Co(0001) terrace surface. Hence, in Chapter 4, CO
adsorption on Co(0001) is studied to determine realistic CO coverages under
FT condition.
Next, we study the mechanism for FT synthesis on a clean Co(0001) terrace in
Chapter 5. Then, in Chapter 6, we re-evaluate the mechanism studied on a
model Co surface in the presence a realistic CO coverage as determined in
Chapter 4. Using a more realistic model of the catalyst surface under FT
conditions, it is possible to better understand how the stability of the surface
intermediates is affected by these spectator species. At this juncture, we would
like to stress that though the study is focused mainly on CO insertion as a
probably propagation mechanism on Co(0001) terrace, we are not trying to
prove that CO insertion is the dominant FT mechanism. Our aim is to provide
a mechanistic view that is consistent with experimental kinetic data on a
Co(0001) terrace surface. Without a doubt, it will be interesting to make a
similar evaluation for alternative mechanisms such as the carbide mechanism
and make comparisons between the mechanisms. This will certainly add
strength and depth to the thesis and was also part of the original plan in the
scope of study (Figure 1.3). However, significant efforts and time have been
devoted in troubleshooting and testing the reactor to ensure reliable data can
be generated from it. As such, we have to narrow down our scope of study in

9
this thesis. For similar reasons, we did not look into the reactions involved in
initiation and termination of FT synthesis as well.
For the rest of Chapter 6, carbon stability on the surface and the sub-surface
sites is evaluated for clean and CO covered models. In Chapter 7, we discuss
the results from the testing of a parallel micro reactor that was set up for
catalysts testing. Then results for FT synthesis of Co catalysts at 493 K, with
and without boron promotion, will be discussed and compared against earlier
work. Next, initial efforts for aldehyde co-feeding experiments to provide
mechanistic insights are discussed. Finally, the main findings and conclusions
of this work are summarized in Chapter 8.
Figure 1.3. A tree diagram summarizing the original scope of study for this
thesis. Highlighted boxes (in grey) indicate studies that have been conducted
and presented in this thesis.
10
1.2 References
Anderson, R.B., “The Fischer-Tropsch Synthesis” Academic Press, New York,
1984, p. 2.
Brady, R.; Pettit, R., J. Am. Chem. Soc. 1980, 102, 6181.
Brady, R.; Pettit, R., J. Am. Chem. Soc. 1981, 103, 1287.
Blyholder, G.; Emmett, P. H.; J. Phys Chem. 1959, 63, 962.
Blyholder, G.; Emmett, P. H.; J. Phys Chem. 1960, 64, 470.
Beitel, G. A.; Laskov, A.; Oosterbeek, H.; Kuipers, E. W. J. Phys. Chem. 1996,
100, 12494.
Beitel, G. A.; de Groot, C. P. M.; Oosterbeek, H.; Wilson, J. H. J. Phys. Chem.
B 1997, 101, 4035.
Bezemer, G. L.; Bitter, J. H.; Kuipers, H. P. C. E.; Oosterbeek, H.; Holewijin,
J. E.; Xu, X.; Kaptejin, F.; van Dillen, A. J.; de Jong, K. P. J. Am. Chem. Soc.
2006, 128, 3956.
Cheng, J.; Hu, P.; Ellis, P.; French, S.; Kelly, G.; Lok, C. M., J. Cat. 2008,
257, 221 Cheng, J.; Hu, P.; Ellis, P.; French, S.; Kelly, G.; Lok, C. M., J. Phys
Chem. C. 2008, 112, 9464.
Dry, M. E., Appl. Catal. A 1996, 138, 319.
Davis, B. H.; Occelli, M. L., “Fischer-Tropsch Synthesis, Catalysts and
Catalysis” Elsevier B. V., 2007, p. 1.
de Klerk, A., “Fischer-Tropsch Refining” Wiley-VCH, 2011, p. 117.
Davis, B. H. Ind. Eng. Chem. Res. 2007, 46, 8938.
Dahl, S.; Logadottir, A.; Egeberg, R. C.; Larsen, J. H.; Chorckendorff, I.;
Christensen, C. H.; Nørskov, J. K. Phys. Rev. Lett. 1999, 83, 1814.
11
den Breejen, J. P.; Radstake, P. B.; Bezemer, G. L.; Bitter, J. H.; Frøseth, V.;
Holmen, A.; de Jong, K. P. J. Am. Chem. Soc. 2009, 131, 7197.
Fischer, F.; Tropsch, H., Brennstoff-Chem. 1923, 4, 276.
Fischer, F.; Tropsch, H., Brennstoff-Chem. 1926, 7, 97.
Ge, Q. F.; Neurock, M., J. Phys. Chem. B 2006, 110, 15368.
Hohenberg, H.; Kohn, W., Phys. Rev. B 1965, 136, 864.
Honkala, K.; Hellman, A.; Remediakis, I. N.; Logadottir, A.; Carlsson, A.;
Dahl, S.; Christensen, C. H.; Nørskov, J. K. Science 2005, 307, 555.
Iglesia, E. Appl. Catal. A 1997, 161, 59.
Inderwildi, O. R.; Jenkins, S. J.; King, D. A., J. Phys. Chem. C Lett., 2007,
112, 5.
Khodakov, A. Y.; Chu, W.; Fongarland, P., Chem. Rev. 2007, 107, 1692.
Kummer, J.K.; Emmett, P.H., J. Am. Chem. Soc., 1953, 75, 5177.
Kohn, W.; Sham, L.J., Phys. Rev. A, 1965, 140, 1133.
Patzlaff, J.; Liu, Y.; Graffmann, C.; Gaube, J. Appl. Catal. A, 1999, 186, 109.
Pichler, H.; Schulz, H., Chem. Ing. Tech. 1970, 42, 1162.
Raje, A.; Davis, B. H. Catalysis (J. J. Spivey, ed), The Royal. Soc. Chem.,
Cambridge, 1996, 12 , 52.
Riberio, F. H.; Schach von Wittenau, A. E.; Bartholonew, C. H.; Somorjai, G.
A., Catal. Rev. Sci. Eng. 1997, 39, 49.
Schindler, J.; Zittel, W. “Crude oil – The Supply Outlook” Energy watch
group, 2008, p. 12.
Steynberg, A.; Dry, M. E. Stud. in Surf. Sci. and Catal. 2004, 152, 1.
Storch, H. H.; Golumbic, N.; Anderson, R.B., “The Fischer-Tropsch and
Related Syntheses” John Wiley and Sons, Inc., New York, 1951.
12
Shetty, S.; Jansen, A. P. J.; van Santen, R. A., J. Am. Chem. Soc. 2009, 131,
12874.
Shetty, S.; Jansen, A. P. J.; van Santen, R. A., J. Phys. Chem. C 2008, 112,
14027.
Wilson, J.; de Groot, C. J. Phys. Chem. 1995, 99, 7860.
13
CHAPTER 2
LITERATURE REVIEW OF THE REACTION
MECHANISMS AND THE SURFACE STRUCTURE
OF Co-BASED CATALYSTS IN FT SYNTHESIS
2.1 Introduction
Fischer-Tropsch synthesis converts CO and H2, both simple molecules, to
products ranging from long-chain alkanes and alkenes, to small amounts of
oxygenates and water (Fischer and Tropsch, 1923; Storch et al., 1951; Dry,
1996; Davis and Occelli, 2007). The complexity of surface reactions taking
place during the reaction can be imagined. Hence, various mechanisms have
been proposed for the conversion of CO and H2, in order to account for the
formation of different types of products. Two main categories of mechanisms
that have been proposed are the carbide mechanism (Fischer and Tropsch,
1926) and the CO insertion mechanism (Pichler and Schulz, 1970; Schulz and
Zein El Deen, 1977). In this chapter, a more in-depth discussion of these two
mechanisms will be presented. Some of the more significant experimental and
computational studies involving the two mechanisms will be highlighted and
discussed. A few less cited mechanisms will also be briefly discussed.
Following the discussion, the focus will be on the surface science studies and

14
theoretical model studies that have been done to improve the understanding of
the nature of active sites and surface structure under FT reaction conditions.
At the end of the literature review, the main implications are summarized,
leading to the proposed work for this thesis.
2.2 Proposed mechanisms for the Fischer-Tropsch Synthesis
The proposed FT mechanisms normally consist of a sequence of C−O bond
scission and C−C bond formation steps. Each of the FT mechanisms
comprises of initiation, propagation and termination steps. For example, in the
carbide mechanism, direct C=O dissociation takes place to form surface C and
O species. The surface C species then hydrogenates to form surface CHx (x =
0 – 3) species, the monomers for chain growth, during initiation. During
propagation, C−C coupling between CHx species takes place to form longer
chains. In the case of the CO insertion mechanism, CO is the monomer which
couples with surface RCHx (x = 0 – 3) species to form longer chains and C−O
bond scission occurs after C−C coupling. Numerous scientific efforts have
aimed to understand the mechanism of this complex catalytic reaction.
However, the detailed sequence of C−O bond scission and C−C bond
formation steps remains unclear. One of the reasons is that FT synthesis is
performed at a relatively low temperature of 500 K and at a high pressure of
20 bar. This makes mechanistic studies of the catalyst under working
conditions challenging.
15
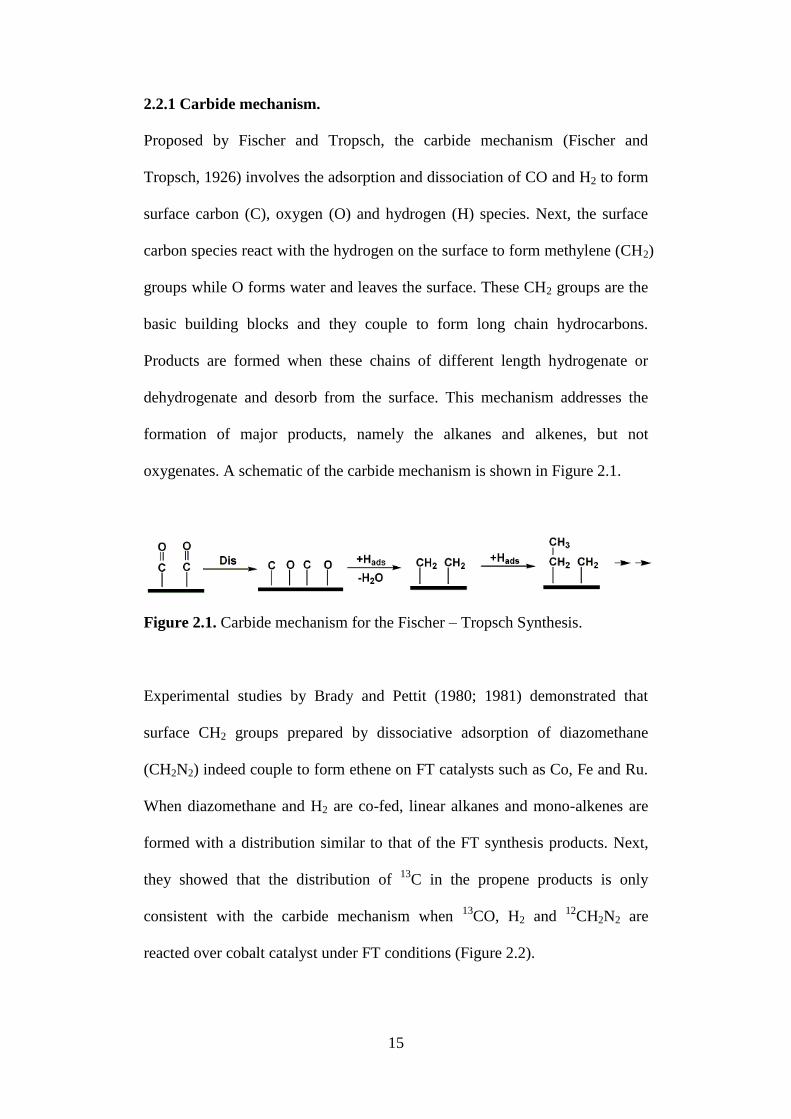
2.2.1 Carbide mechanism.
Proposed by Fischer and Tropsch, the carbide mechanism (Fischer and
Tropsch, 1926) involves the adsorption and dissociation of CO and H2 to form
surface carbon (C), oxygen (O) and hydrogen (H) species. Next, the surface
carbon species react with the hydrogen on the surface to form methylene (CH2)
groups while O forms water and leaves the surface. These CH2 groups are the
basic building blocks and they couple to form long chain hydrocarbons.
Products are formed when these chains of different length hydrogenate or
dehydrogenate and desorb from the surface. This mechanism addresses the
formation of major products, namely the alkanes and alkenes, but not
oxygenates. A schematic of the carbide mechanism is shown in Figure 2.1.
Figure 2.1. Carbide mechanism for the Fischer – Tropsch Synthesis.
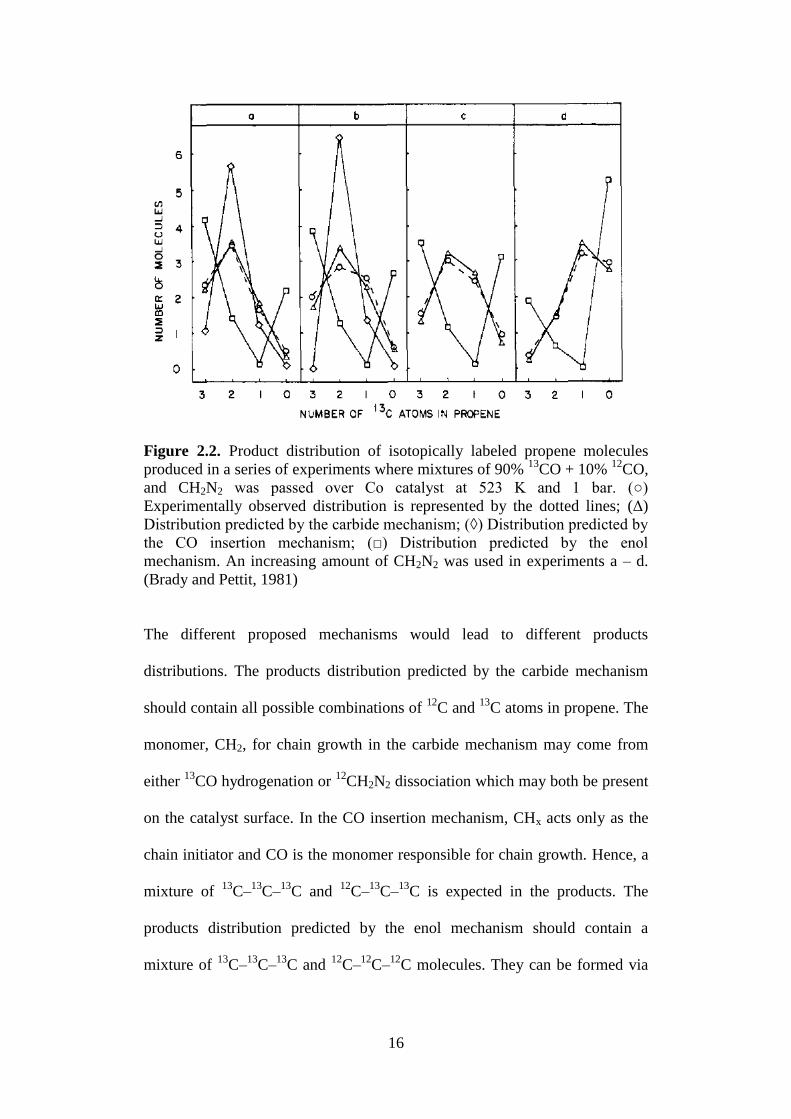
Experimental studies by Brady and Pettit (1980; 1981) demonstrated that
surface CH2 groups prepared by dissociative adsorption of diazomethane
(CH2N2) indeed couple to form ethene on FT catalysts such as Co, Fe and Ru.
When diazomethane and H2 are co-fed, linear alkanes and mono-alkenes are
formed with a distribution similar to that of the FT synthesis products. Next,
they showed that the distribution of 13
C in the propene products is only
consistent with the carbide mechanism when 13
CO, H2 and 12
CH2N2 are
reacted over cobalt catalyst under FT conditions (Figure 2.2).
16
Figure 2.2. Product distribution of isotopically labeled propene molecules
produced in a series of experiments where mixtures of 90% 13
CO + 10% 12
CO,
and CH2N2 was passed over Co catalyst at 523 K and 1 bar. (○)
Experimentally observed distribution is represented by the dotted lines; (Δ)
Distribution predicted by the carbide mechanism; (◊) Distribution predicted by
the CO insertion mechanism; (□) Distribution predicted by the enol
mechanism. An increasing amount of CH2N2 was used in experiments a – d.
(Brady and Pettit, 1981)
The different proposed mechanisms would lead to different products
distributions. The products distribution predicted by the carbide mechanism
should contain all possible combinations of 12
C and 13
C atoms in propene. The
monomer, CH2, for chain growth in the carbide mechanism may come from
either 13
CO hydrogenation or 12
CH2N2 dissociation which may both be present
on the catalyst surface. In the CO insertion mechanism, CHx acts only as the
chain initiator and CO is the monomer responsible for chain growth. Hence, a
mixture of 13
C–13
C–13
C and 12
C–13
C–13
C is expected in the products. The
products distribution predicted by the enol mechanism should contain a
mixture of 13
C–13
C–13
C and 12
C–12
C–12
C molecules. They can be formed via
17
direct coupling of 12
CH2 from dissociation of 12
CH2N2 or by coupling of
H13
COH generated from hydrogenation of 13
CO.
However, earlier 14
C-labeled experiments by Emmett and his co-workers
(1948) indicated that surface carbide species play only a minor role in product
formation. In the experiment, the catalyst surface was dosed with radioactive
14C before H2 and
12CO were introduced. The initial hydrocarbon products
formed exhibited very low radioactivity. This led Emmett and his co-workers
to conclude that most of the product formed in FT came from other surface
reactions than by the reduction of surface carbide.
Theoretical studies of the C–C coupling steps indicate that RCH2 + C and
RCH + CH2 are the most likely chain growth reactions with calculated barriers
of 138 and 137 kJ/mol, respectively (Cheng et al., 2008). However, a high
surface coverage of C or CH2 groups is required to ensure a fast chain growth
relative to chain termination with surface hydrogen (Zhuo et al., 2009), and
therefore, a sufficiently fast CO dissociation rate is required. Ge and Neurock
(2006) calculated CO dissociation barrier of 218 kJ/mol on a Co(0001) surface
and 195 kJ/mol on a stepped Co(11 2 0) surface while Gong et al. (2005)
calculated a hydrogenation barrier for C to CH of 82 kJ/mol and for CH to
CH2 of 64 kJ/mol on a Co(0001) surface. Hence, the CO dissociation rate
might not be sufficiently fast to obtain a high surface C or CH2 coverage.
Alternatively, significantly lower barriers for CO dissociation have been
calculated on corrugated and stepped Co surfaces. (Ge and Neurock, 2006;
18
Shetty and van Santen, 2010) The strong structure sensitivity of the CO
dissociation steps on Co(1010) and Ru(11 2 1) surfaces was analyzed in detail
by Shetty and van Santen (Shetty and van Santen, 2010; 2011; Shetty et al.,
2009). The calculated activation barriers on Ru decrease to 65 kJ/mol (Shetty
and van Santen, 2010) and to 123 (Ge and Neurock, 2006) and 68 kJ/mol at
B5 step and kink sites of Co, respectively. These barriers are low enough for
direct CO dissociation to be fast at those sites under FT conditions. Alternative
CO activation mechanisms have also been proposed, as discussed next.
2.2.2 Hydrogen-assisted CO dissociation.
Hydrogen-assisted CO dissociation was originally proposed by Pichler and
Schulz (1970) as the initiation step for the CO insertion mechanism (Figure
2.3). This mechanism provides an alternative route to break the C–O bond and
produce surface methylene groups. It involves the stepwise hydrogenation of
CO to HCO and H2CO or HCOH species. DFT calculations by Inderwildi et al.
(2007), Cheng et al. (2008) and Zhuo et al. (2009) indicate that hydrogen-
assisted CO dissociation is faster than direct CO dissociation on a Co(0001)
terrace. In this mechanism, CO is hydrogenated to HCO and H2CO. This
weakens the C–O bond and a low barrier of 68 kJ/mol (Zhuo et al., 2009) was
calculated for the dissociation of H2CO to CH2 + O. Similarly, favourable
barriers of 82 (Inderwildi et al, 2007) and 92 kJ/mol (Cheng et al., 2008) were
reported. However, the CO hydrogenation barrier is sizable at 146 kJ/mol, and
the first step is significantly endothermic at +117 kJ/mol (Zhuo et al. 2009),
indicating that the formyl intermediate (HCO) is rather unstable.
19
Figure 2.3. Hydrogen assisted CO activation mechanism.
Experimental evidence for the H-assisted CO dissociation came from studies
conducted by Mitchell et al. (1993 and 1995). In their High Resolution
Electron Energy Loss Spectroscopy (HREELS) experiments, they observed
the formation of HCO and H2CO on a CO saturated Ru(0001) surface at a low
temperature of 100 K. All the HCO and H2CO decomposed back to adsorbed
CO and H when the temperature was increased to 250 K. This shows that both
HCO and H2CO species are highly unstable, which agrees with the low
reverse surface reaction barrier and high overall endothermic reaction energy
that has been calculated by various groups (Inderwildi et al, 2007; Cheng et al.,
2008; Zhuo et al., 2009). In a recent combined experimental and theoretical
study, Ojeda et al. (2010) evaluated the H-assisted CO dissociation pathway
on a clean and a 0.5 monolayer (ML) CO covered Co(0001) surface. They
concluded that direct CO activation is unable to compete against H-assisted
CO dissociation on the Co surface. However, during a temperature-
programmed decomposition of methanol on Co(0001), Weststrate (2012)
observed that formaldehyde (H2CO) desorbs rather than dissociates upon
formation. This result indicates that the hydrogen-assisted CO dissociation via
20
H2CO is unlikely on a Co terrace but HCO and HCOH dissociation may be
possible routes.
2.2.3 CO insertion mechanism.
As an alternative to the carbide mechanism, Pichler and Schulz (1970) and
Schulz and Zein El Deen (1977) proposed the CO insertion mechanism
(Figure 2.4) to account for the range of products formed during FT synthesis.
In this mechanism, chain growth occurs by CO coupling to an RCH2 group,
rather than CH2 coupling. Hence, this mechanism does not require a high
surface concentration of CH2 groups to ensure a fast chain growth relative to
chain termination. The propagation step then proceeds with RCH2CO
undergoing a series of hydrogenation, C–O bond breaking and CO insertion
steps to form longer hydrocarbon chains. Termination takes place at any point
during propagation after the C–O bond breaking step to form alkanes and
alkenes which are the main products of FT. Small amounts of oxygenate may
be formed if termination occurs before the C–O bond breaking step.
Termination can also occur via the carbide mechanism where RCH or RC
surface intermediates couple to each other. An illustration of the mechanism is
shown in Figure 2.4.
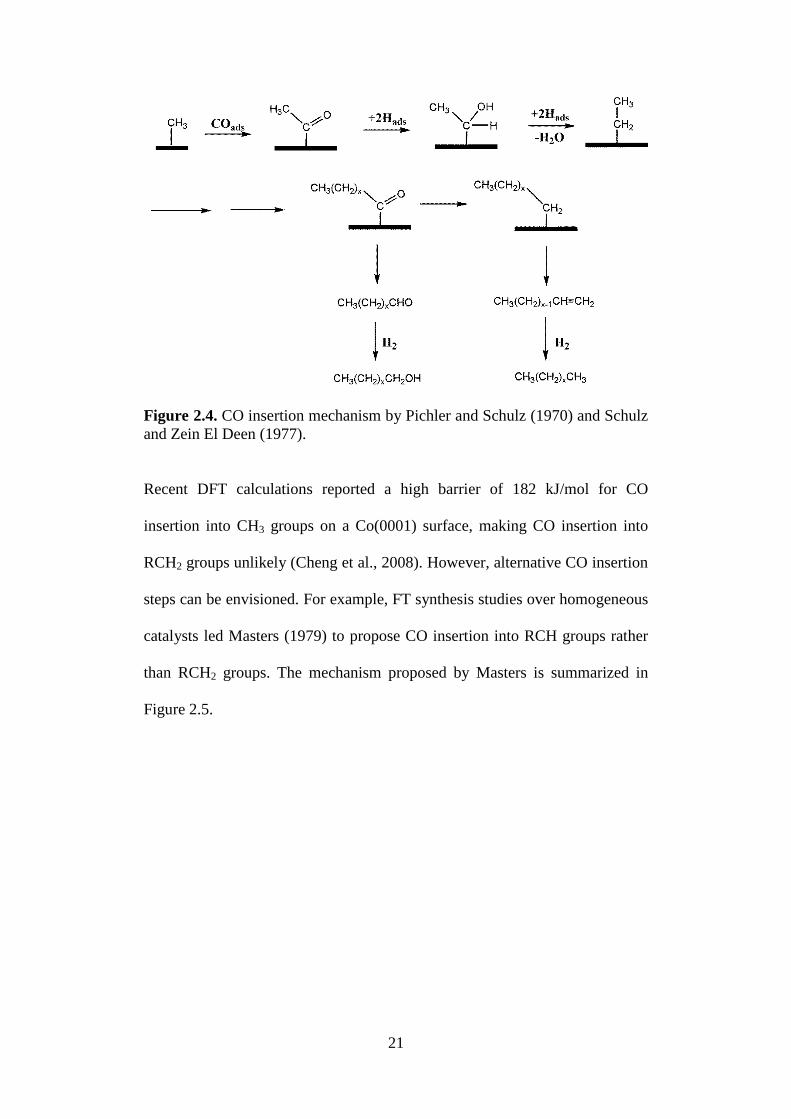
21
Figure 2.4. CO insertion mechanism by Pichler and Schulz (1970) and Schulz
and Zein El Deen (1977).
Recent DFT calculations reported a high barrier of 182 kJ/mol for CO
insertion into CH3 groups on a Co(0001) surface, making CO insertion into
RCH2 groups unlikely (Cheng et al., 2008). However, alternative CO insertion
steps can be envisioned. For example, FT synthesis studies over homogeneous
catalysts led Masters (1979) to propose CO insertion into RCH groups rather
than RCH2 groups. The mechanism proposed by Masters is summarized in
Figure 2.5.

22
Figure 2.5. Alternative CO insertion mechanism (Masters, 1979).
Density functional theory calculations indeed show that CH2 + CO coupling
has a favourable barrier of 80 kJ/mol (Zhuo et al., 2009; Chapters 5 and 6) on
Co(0001) terraces. The CH2CO formed then undergoes two successive
hydrogenation reactions to form CH3CHO, an aldehyde, which has a low C–O
dissociation barrier of 50 kJ/mol. The RCH species can then undergo coupling
reaction with CO again and a propagation cycles via CO insertion has been
proposed (Figure 2.6).
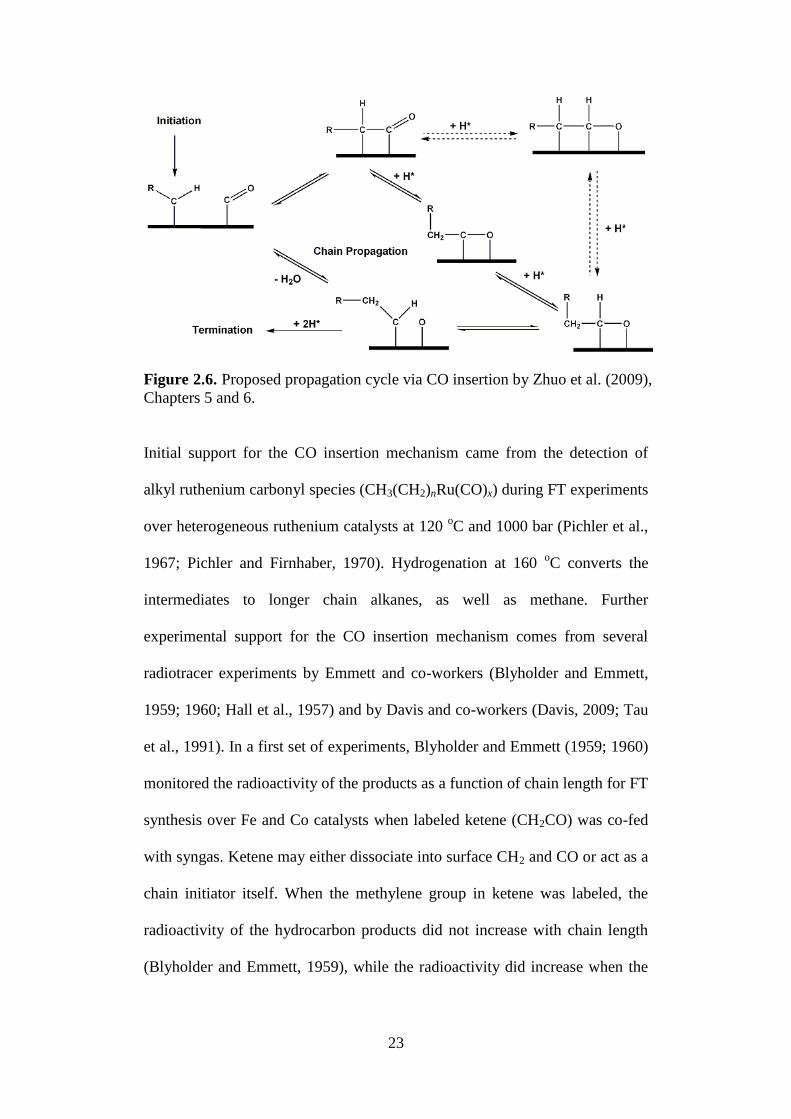
23
Figure 2.6. Proposed propagation cycle via CO insertion by Zhuo et al. (2009),
Chapters 5 and 6.
Initial support for the CO insertion mechanism came from the detection of
alkyl ruthenium carbonyl species (CH3(CH2)nRu(CO)x) during FT experiments
over heterogeneous ruthenium catalysts at 120 oC and 1000 bar (Pichler et al.,
1967; Pichler and Firnhaber, 1970). Hydrogenation at 160 oC converts the
intermediates to longer chain alkanes, as well as methane. Further
experimental support for the CO insertion mechanism comes from several
radiotracer experiments by Emmett and co-workers (Blyholder and Emmett,
1959; 1960; Hall et al., 1957) and by Davis and co-workers (Davis, 2009; Tau
et al., 1991). In a first set of experiments, Blyholder and Emmett (1959; 1960)
monitored the radioactivity of the products as a function of chain length for FT
synthesis over Fe and Co catalysts when labeled ketene (CH2CO) was co-fed
with syngas. Ketene may either dissociate into surface CH2 and CO or act as a
chain initiator itself. When the methylene group in ketene was labeled, the
radioactivity of the hydrocarbon products did not increase with chain length
(Blyholder and Emmett, 1959), while the radioactivity did increase when the
24
carbonyl group was labeled (Blyholder and Emmett, 1960). The results
indicate that CH2 rather than ketene itself acts as a chain initiator while CO
may be involved in the chain growth. Next, using infrared spectroscopy,
Blyholder et al. (1976) detected surface carboxylate species when CO, C2H4
and H2 were reacted over Fe and Co catalyst at 373 K and proposed that the
carboxylate intermediates were formed by CO insertion into ethene.
To further demonstrate that separate chemical species are involved in chain
initiation and chain propagation, Davis (2009) added labeled 14
CO2 to syngas.
The radioactivity of the C1–C9 hydrocarbon products did not increase linearly
with the chain length, and shorter chains were found to display a higher
radioactivity. It was therefore argued that surface intermediates involved in the
conversion of 14
CO2 through water–gas shift (WGS) reaction may be
responsible for initiating FT synthesis, while propagation involves addition of
CO or CO-derived surface species to the growing chain. Kokes et al. (1960)
and Tau et al. (1991) demonstrated that 14
C– labeled ethanol serves as a chain
initiator and not as a chain propagator during FT synthesis over iron catalysts.
Next, in an attempt to reconcile the carbide mechanism and the CO insertion
mechanism, Gaube and Klein (2008) proposed a mechanism involving both
mechanisms. On the basis of their new interpretations of earlier experimental
work, they proposed that both carbide and CO insertion mechanisms play an
important role in FT synthesis. More recently, Schweicher et al. (2012) studied
CO hydrogenation over Co/MgO model catalysts with chemical transient
kinetics (CTK) and observed that chain growth takes place only in the
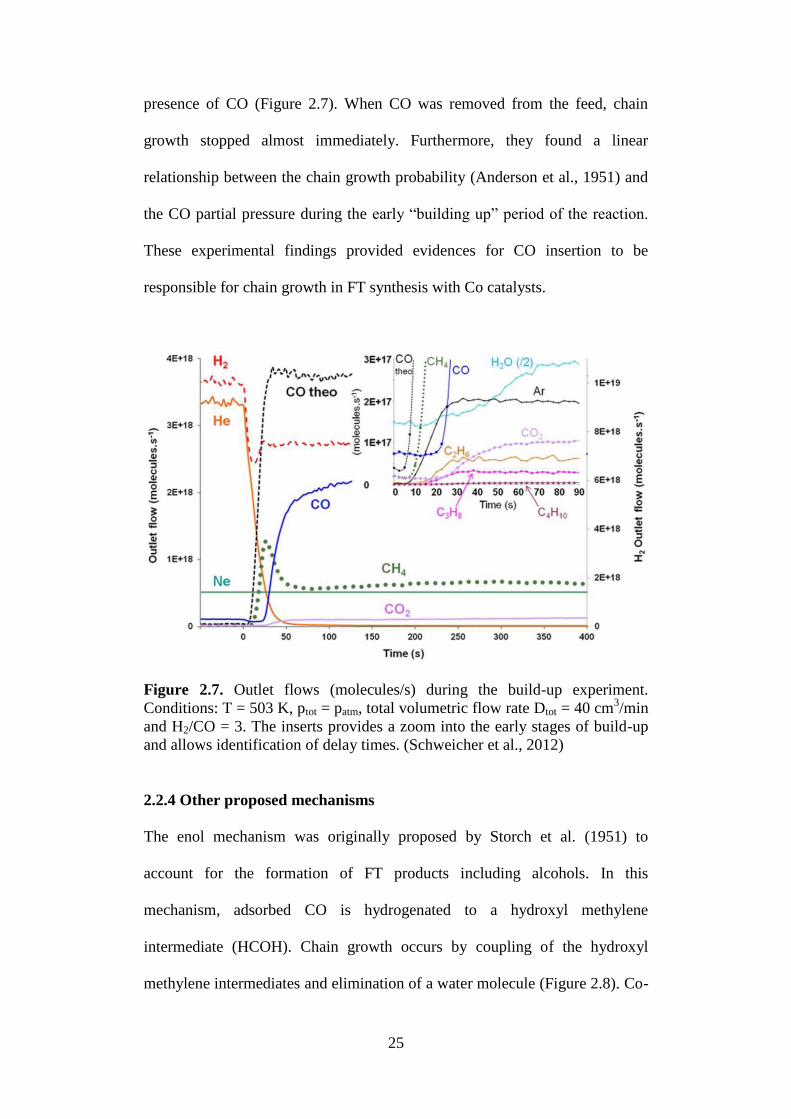
25
presence of CO (Figure 2.7). When CO was removed from the feed, chain
growth stopped almost immediately. Furthermore, they found a linear
relationship between the chain growth probability (Anderson et al., 1951) and
the CO partial pressure during the early “building up” period of the reaction.
These experimental findings provided evidences for CO insertion to be
responsible for chain growth in FT synthesis with Co catalysts.
Figure 2.7. Outlet flows (molecules/s) during the build-up experiment.
Conditions: T = 503 K, ptot = patm, total volumetric flow rate Dtot = 40 cm3/min
and H2/CO = 3. The inserts provides a zoom into the early stages of build-up
and allows identification of delay times. (Schweicher et al., 2012)
2.2.4 Other proposed mechanisms
The enol mechanism was originally proposed by Storch et al. (1951) to
account for the formation of FT products including alcohols. In this
mechanism, adsorbed CO is hydrogenated to a hydroxyl methylene
intermediate (HCOH). Chain growth occurs by coupling of the hydroxyl
methylene intermediates and elimination of a water molecule (Figure 2.8). Co-
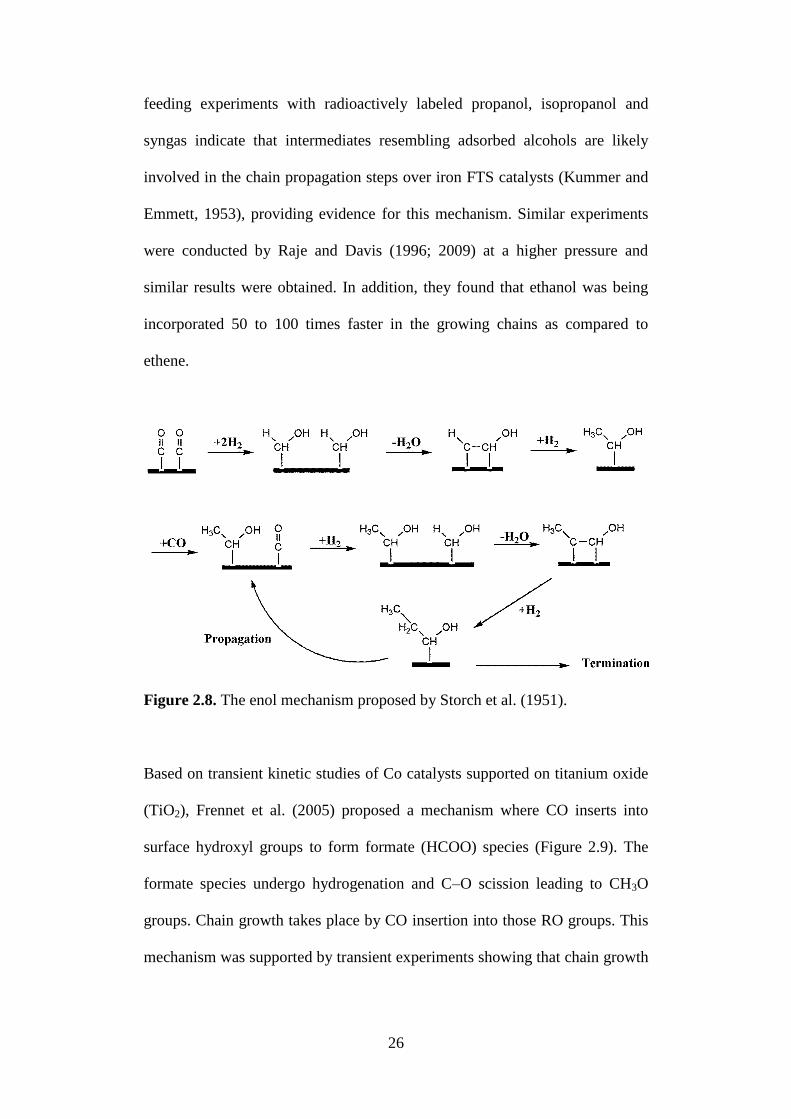
26
feeding experiments with radioactively labeled propanol, isopropanol and
syngas indicate that intermediates resembling adsorbed alcohols are likely
involved in the chain propagation steps over iron FTS catalysts (Kummer and
Emmett, 1953), providing evidence for this mechanism. Similar experiments
were conducted by Raje and Davis (1996; 2009) at a higher pressure and
similar results were obtained. In addition, they found that ethanol was being
incorporated 50 to 100 times faster in the growing chains as compared to
ethene.
Figure 2.8. The enol mechanism proposed by Storch et al. (1951).
Based on transient kinetic studies of Co catalysts supported on titanium oxide
(TiO2), Frennet et al. (2005) proposed a mechanism where CO inserts into
surface hydroxyl groups to form formate (HCOO) species (Figure 2.9). The
formate species undergo hydrogenation and C–O scission leading to CH3O
groups. Chain growth takes place by CO insertion into those RO groups. This
mechanism was supported by transient experiments showing that chain growth

27
stops immediately when CO is replaced with He in the feed. These
experiments indicate that CO is directly involved in chain growth, rather than
monomers present on the catalyst surface. Recent isotopic transient analysis
by the same group however indicates that RCOO species may not be the main
reaction intermediates in the formation of C2+ products (Schweicher et al.,
2008).
Figure 2.9. Proposed mechanism by Frennet et al. (2005).
2.2.5 Kinetics of FT synthesis
In the earlier discussions, we discussed the various proposed mechanisms for
FT synthesis, an on-going topic of debate. The surface reactions can be far
more complex and coupled with the large number of possible products, it is a
challenge to describe the reaction kinetics during FT synthesis. In many
literatures (e.g. Vannice,1975), empirical power-law kinetics (Equation 2.1)
for CO and H2 conversion rates was found to fit the measure kinetic data well
on supported Co catalysts. A general form of the power-law rate expression is
shown below:
28
bH
aCOCO
2
PkPr (2.1)
These studies fit experimental kinetic data to the rate equation and assumed a
simple polymerization reaction that follows an Anderson-Schulz-Flory (ASF)
(Flory, 1936; Herington, 1946; Friedel and Anderson, 1950; Henrici-Olive and
Olive, 1976) product distribution without aiming to understand the reaction
mechanisms. As FT synthesis is a catalyzed reaction, the Langmuir-
Hinshelwood-Hougen-Watson (LHHW) type rate equations (Equation 2.2) can
be derived if we consider different rate limiting steps for different proposed
mechanisms for FT synthesis. A bimolecular surface reaction is usually
assumed as the rate-determining step. The general form of the rate expression
is shown below:
2d
H
cCOi
bH
aCO
COi
2
i
2
PPK1
PkPr
(2.2)
where k is the measured kinetic rate constant; a and b are the reaction orders;
Ki is adsorption constant for the ith
term; ci and di describe the dependence of
surface coverage of ith
adsorption term on its reactant partial pressure.
Assuming CH2 is the monomer for FT products formation, Wojciechowski
and Sarup (Wojciechowski, 1988; Sarup and Wojciechowski, 1989) developed
six rate expressions of the form similar to Equation 2.2 based on carbide and
enol mechanisms. All the rate expressions were developed by assuming a
surface reaction involving adsorbed hydrogen and carbon intermediate as the
rate determining step. They tested their kinetic models with their experimental
data and narrow down the six equations to only two. However, these two
models did not fit very well with their experimental data. Due to the low
29
water-gas-shift activity on Co catalysts, the proposed overall rate expressions
for FT synthesis do not contain terms involving H2O and CO2.
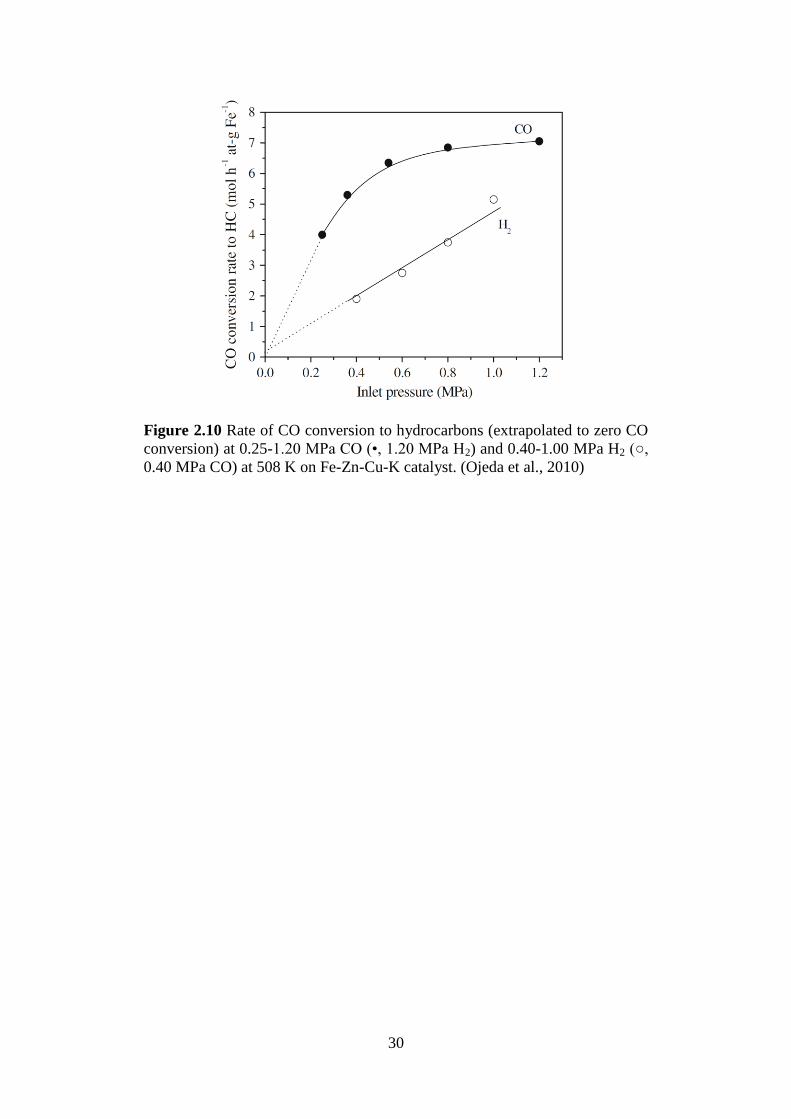
Despite the different proposed rate equations, measured reaction order with
respect to CO partial pressure is usually close-to-zero and near the order of
one with respect to H2 in various studies (Davis and Occelli, 2007). In a recent
combine experimental and theoretical study, Ojeda et al. (2010) studied the
kinetics of FT synthesis over a Fe-based catalyst. By varying the inlet partial
pressure of CO and H2, they show that the rate of CO conversion to CH* is
extrapolated to zero order for CO and first order for H2 (Figure 2.10). A close-
to-zero order with respect to CO would imply that the surface is saturated with
adsorbed CO molecules and it is the most abundant reaction intermediate
(MARI) is adsorbed CO. The order of one with respect to H2 implies that the
rate determining step may involve the hydrogenation reaction. The
experimental results were compared with calculated surface reaction barriers
on both Fe and Co in order to deduce a proposed reaction scheme that is
consistent with the experimental observations. Ojeda et al. (2010) conclude
that hydrogen-assisted CO activation is the dominant route on a Co and is
consistent with experimental data reported in literature. The catalyst model
that they have used in their theoretical study are clean and CO covered
Co(0001) terrace surface. The topic on the catalyst surface under FT
conditions is another topic of debate which we will discuss in the next few
sections.
30
Figure 2.10 Rate of CO conversion to hydrocarbons (extrapolated to zero CO
conversion) at 0.25-1.20 MPa CO (•, 1.20 MPa H2) and 0.40-1.00 MPa H2 (○,
0.40 MPa CO) at 508 K on Fe-Zn-Cu-K catalyst. (Ojeda et al., 2010)
31
2.3 Catalyst surface structure under Fischer-Tropsch
conditions.
Another key aspect of FT research focuses on the structure of the catalyst
surface under FT conditions. As FT synthesis is performed at slightly elevated
temperature and high CO pressure, it is often difficult to reconcile the results
obtained from surface science studies and reactions with the structure of the
catalyst under FT conditions. Various theoretical studies have been done on
different model surfaces to understand the activity for the different available
sites on the surfaces. We will discuss these theoretical and experimental
results in the following sections.
2.3.1 Terrace vs. Stepped surface.
Theoretical studies of adsorption and reaction of surface intermediates on
different model surfaces help researchers understand the activity at various
sites possibly present on these surfaces. These studies usually compare the
barriers of key surface reactions in the proposed mechanisms, to determine the
activity of sites present on different surfaces. Since FT products are mainly
alkanes and alkenes, a low C=O/C–O bond scission barrier became an
important criterion to determine the activity of a site. The study of C=O/C–O
bond scission have been done by various groups (Ge and Neurock, 2006;
Cheng et al., 2008; Inderwildi et al., 2007) on the more stable terrace surface.
Direct CO dissociation on Co(0001) terrace surface was found to be
kinetically challenging, with a calculated barrier of 218 kJ/mol (Ge and
Neurock, 2006). However, alternative CO activation mechanisms such as the
32
hydrogen-assisted CO activation have been proposed. As discussed in Section
2.2.2, hydrogenation of CO lowers the C–O bond scission barrier but the
hydrogenation step is still significantly endothermic. This limits the surface
concentration of HCO and H2CO species, and leads to an effective surface
activation barrier of about 200 kJ/mol for C–O dissociation via this
mechanism (Zhuo et al., 2009; Chapter 5).
Alternatively, step and corrugated surfaces are modeled to simulate defect
sites possibly present on the catalyst surface (Figure 1.2). Defect sites such as
the B5 site are proposed to be the active sites on the catalysts surface. The B5
site was proposed by van Hardeveld and van Montfoort (1966). This site is
created by 5 metal atoms at the surface that is located at the step edge (Figure
1.1). Theoretically, on model stepped and corrugated )2110(Co and )4211(Co
surfaces, Ge and Neurock (2006) showed that a direct route for CO activation
with respect to gas phase CO is possible. CO activation on the two surfaces
was found to have lower barriers of 123 and 89 kJ/mol, respectively, with
respect to adsorbed CO. Earlier, Ciobîcă and van Santen (2003) did a similar
study on flat and stepped Ru(0001) surfaces. They found that CO at a
coverage of 1/9 ML dissociates with a barrier of 216 kJ/mol on the flat
Ru(0001) surface while a barrier of 89 kJ/mol was computed for CO
dissociation on a Ru(0001) step edge model. Next, the same group studied CO
dissociation on a corrugated Ru(1121) surface (Shetty et al., 2009) and open
stepped surfaces of )0110(Co and )0110(Ru . Low dissociation barriers of 47
and 68 kJ/mol were computed on )0110(Co and )0110(Ru surface, respectively.
33
The results led them to conclude that such active sites are required for CO
activation in the carbide mechanism.
Experimentally, the B5 site proposed by van Hardeveld and van Montfoort
(1966) was verified many years later by Zambelli et al. (1996) in their surface
science study of NO dissociation over Ru(0001) surface. By using STM,
Zambelli et al. (1996) were able to study the distribution of nitrogen atoms
after NO dissociation over Ru(0001) surface. A significant amount of N atoms
were located at the step of two adjacent terrace surfaces. This provided the
indication that the step sites are the “active sites” responsible the reaction.
Computational studies by Dahl et al. (1999) on the dissociation of N2 at the
surface step edge of Ru(0001) lent further support to the importance of this
“special” reaction site. Honkala et al. (2005) then calculated that the density of
the active sites (B5 sites) is the highest for Ru particles with average size of
2.9 nm. With this, Honkala et al. obtained a calculated result for N2 TOF that
differs from measured values by a factor of 3 to 20 at different conditions. The
effect of Co particle size in FT catalysis has been studied by different groups
with different techniques and catalysis synthesis methods (Bezemer et al. 2006;
den Breejen et al., 2009; Herranz et al. 2009; Prieto et al., 2009). The
experiments show that the CO TOF is independent of particle size for Co
particles ranging from 6-10 nm to 100 nm, suggesting that the kinetically
relevant steps in FT synthesis occur on Co terraces (Figure 2.10).
34
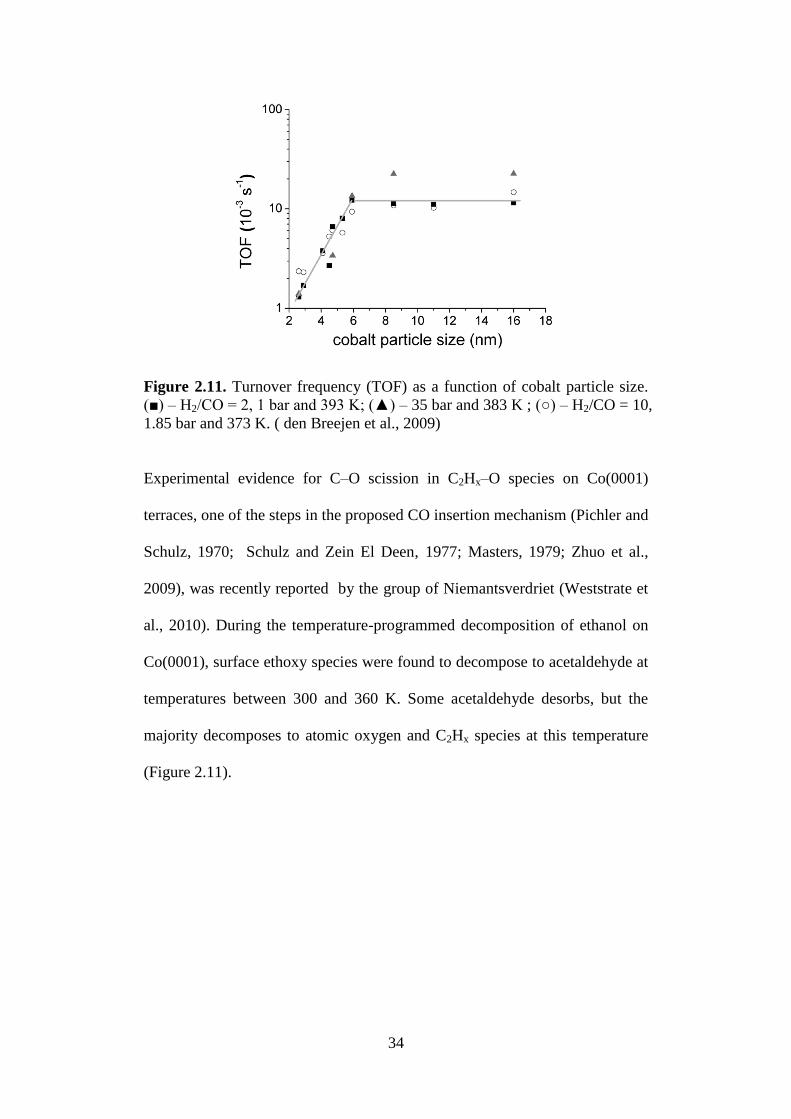
Figure 2.11. Turnover frequency (TOF) as a function of cobalt particle size.
(■) – H2/CO = 2, 1 bar and 393 K; (▲) – 35 bar and 383 K ; (○) – H2/CO = 10,
1.85 bar and 373 K. ( den Breejen et al., 2009)
Experimental evidence for C–O scission in C2Hx–O species on Co(0001)
terraces, one of the steps in the proposed CO insertion mechanism (Pichler and
Schulz, 1970; Schulz and Zein El Deen, 1977; Masters, 1979; Zhuo et al.,
2009), was recently reported by the group of Niemantsverdriet (Weststrate et
al., 2010). During the temperature-programmed decomposition of ethanol on
Co(0001), surface ethoxy species were found to decompose to acetaldehyde at
temperatures between 300 and 360 K. Some acetaldehyde desorbs, but the
majority decomposes to atomic oxygen and C2Hx species at this temperature
(Figure 2.11).
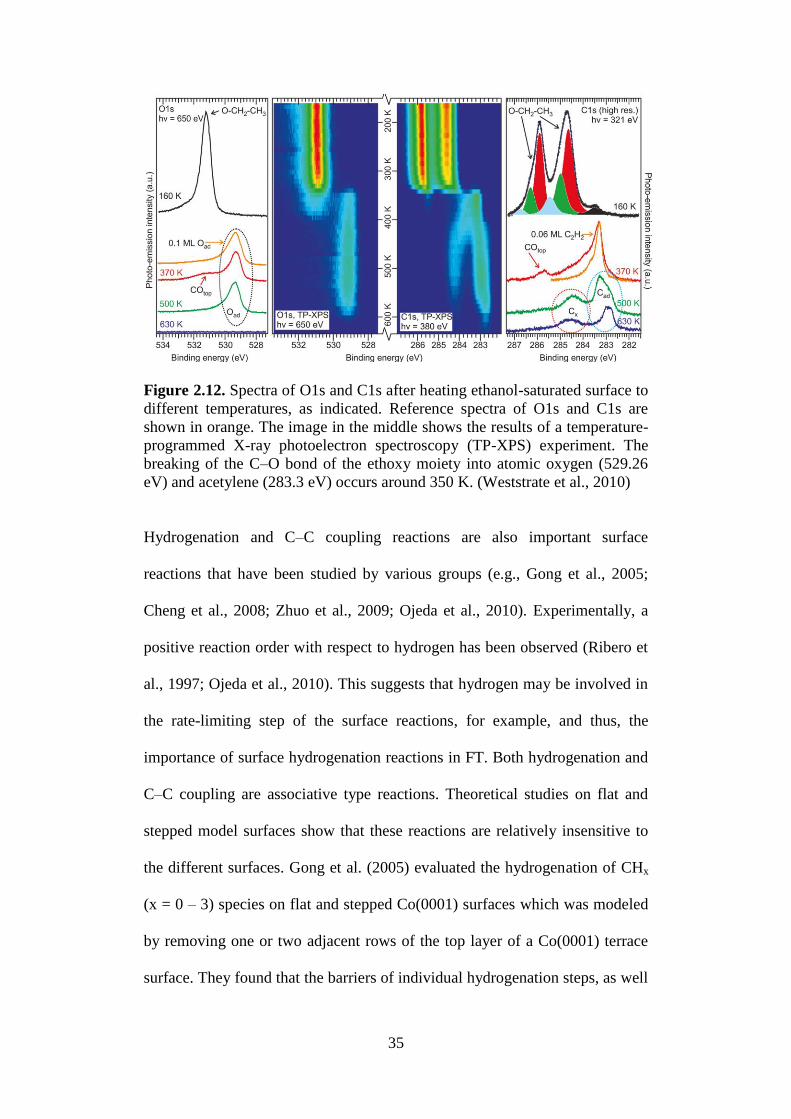
35
Figure 2.12. Spectra of O1s and C1s after heating ethanol-saturated surface to
different temperatures, as indicated. Reference spectra of O1s and C1s are
shown in orange. The image in the middle shows the results of a temperature-
programmed X-ray photoelectron spectroscopy (TP-XPS) experiment. The
breaking of the C–O bond of the ethoxy moiety into atomic oxygen (529.26
eV) and acetylene (283.3 eV) occurs around 350 K. (Weststrate et al., 2010)
Hydrogenation and C–C coupling reactions are also important surface
reactions that have been studied by various groups (e.g., Gong et al., 2005;
Cheng et al., 2008; Zhuo et al., 2009; Ojeda et al., 2010). Experimentally, a
positive reaction order with respect to hydrogen has been observed (Ribero et
al., 1997; Ojeda et al., 2010). This suggests that hydrogen may be involved in
the rate-limiting step of the surface reactions, for example, and thus, the
importance of surface hydrogenation reactions in FT. Both hydrogenation and
C–C coupling are associative type reactions. Theoretical studies on flat and
stepped model surfaces show that these reactions are relatively insensitive to
the different surfaces. Gong et al. (2005) evaluated the hydrogenation of CHx
(x = 0 – 3) species on flat and stepped Co(0001) surfaces which was modeled
by removing one or two adjacent rows of the top layer of a Co(0001) terrace
surface. They found that the barriers of individual hydrogenation steps, as well
36
as the overall energy barrier to hydrogenate atomic carbon to methane on both
surfaces are similar.
Next, Cheng et al. (2008) calculated the barriers for the coupling of CHx–CHy
(x, y = 0 – 3) on flat and stepped Co(0001) surfaces. Their results suggest that
terrace surface is preferred over step as most of the coupling barriers are lower
on the terrace. However, they argued that since the intermediates of the
coupling reactions are more stable at the step, reactions on the stepped surface
should start at a lower energy reference point. As a result, the barriers for most
of the coupling reactions on the terrace surface appear higher on the energy
diagram. Therefore, they concluded that the step sites are still the kinetically
preferred surface. The same group also studied the formation of oxygenates on
both flat and stepped Co(0001) surfaces (Cheng et al., 2008). The barriers did
not show a general consensus that step site is preferred as well. For example,
CO hydrogenation to CHO is preferred on the step whereas the subsequent
hydrogenations to CH2O and CHOH are more favourable on the terrace and
CH3 + CO coupling has similar barriers on both surfaces. The results by
Cheng et al. (2008) seem to be in good agreement with the earlier proposed
rules with respect to where a reaction may occur on a catalyst surface by Liu
and Hu (2003). They suggest that step sites are generally preferred for
dissociation reactions but this is not always the case for association reactions.
2.3.2 CO Coverage on the surface of Co terrace.
The feed gas of FT contains CO and H2, of which CO adsorption is stronger
than H on the surface a FT catalyst and hence a high surface CO coverage is
37
expected (van der Laan and Beenackers, 1999). This is supported by the
Steady State Isotopic Transient Kinetic Analysis (SSITKA) studies by den
Breejen et al. (2009) where a high CO coverage of about 0.5 ML under FT
conditions was reported. At the same time, the coverage of surface H*, CHx*
and OHx* species were found to be about 0.1 ML in the presence of CO.
The adsorption of CO on Co(0001) surfaces has been studied in detail by
several groups (Bridge et al., 1977; Papp, 1983; Beitel et al., 1996; 1997).
Low energy electron diffraction (LEED) shows that CO forms a
( 3 3 )R30º-CO structure (Figure 2.12a) with CO at top sites, both at 100
K and for an exposure of 1.2 L (Papp, 1983), and at 300 K and for a CO
pressure of 7×10⁻⁹
mbar (Bridge et al., 1977). When the CO exposure is
increased to 2.2 L at 100 K, CO forms a ( 2 3 2 3 )R30º-7CO structure
(Figure 2.12b) with CO at top and bridge sites, corresponding to a 7/12
monolayer (ML) coverage (Papp, 1983). It was also noted by Papp that the
transition between a ( 3 3 )R30º-CO structure and a ( 2 3 2 3 )R30º-
7CO structure is discontinuous. Subsequently, an increase of the CO pressure
up to 2×10⁻⁶
mbar at 286 K resulted in a ( 7 / 3 7 / 3 )R10.9º-3CO structure
which was only stable for a few seconds. Upon reducing the CO pressure, the
( 3 3 )R30º-CO structure is restored. Using polarization modulation
reflection-absorption infrared spectroscopy (PM-RAIRS), Beitel et al. (1996)
showed that CO forms a ( 3 3 )R30º-CO structure for CO pressures up to 1
mbar at 300 K. Between 1 and 300 mbar, a ( 2 3 2 3 )R30º-7CO
configuration is observed, consistent with the LEED data. When the
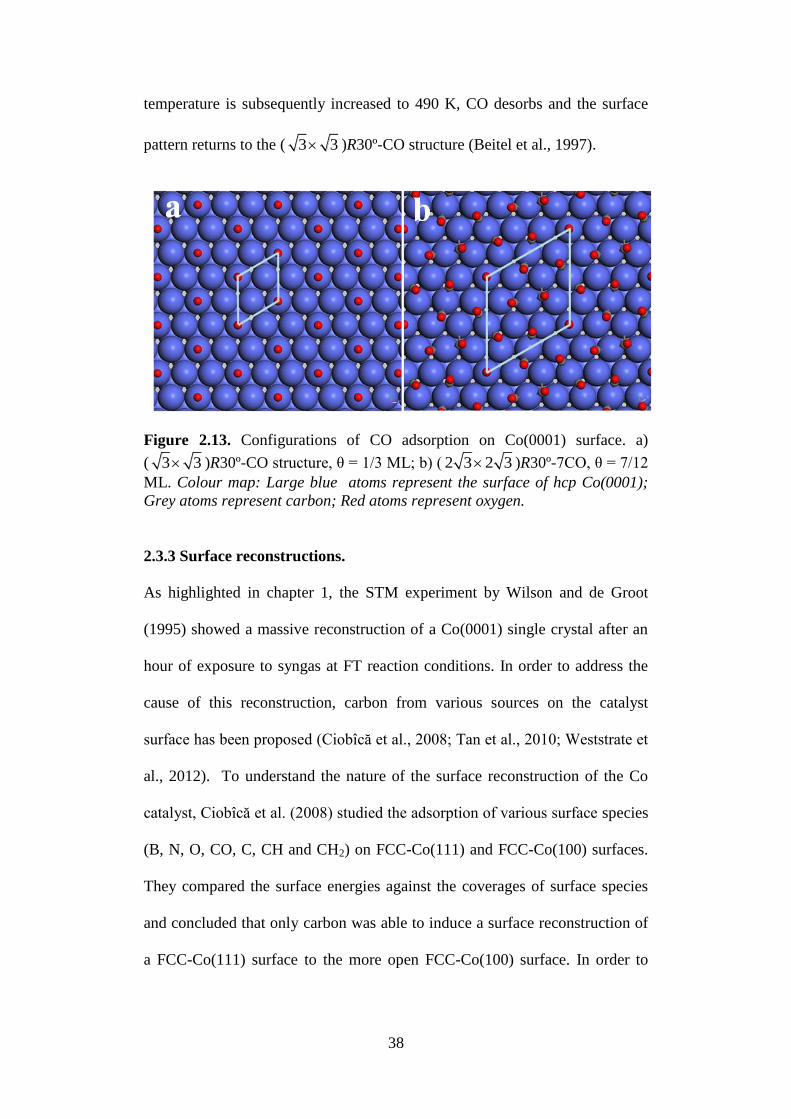
38
temperature is subsequently increased to 490 K, CO desorbs and the surface
pattern returns to the ( 3 3 )R30º-CO structure (Beitel et al., 1997).
Figure 2.13. Configurations of CO adsorption on Co(0001) surface. a)
( 3 3 )R30º-CO structure, θ = 1/3 ML; b) ( 2 3 2 3 )R30º-7CO, θ = 7/12
ML. Colour map: Large blue atoms represent the surface of hcp Co(0001);
Grey atoms represent carbon; Red atoms represent oxygen.
2.3.3 Surface reconstructions.
As highlighted in chapter 1, the STM experiment by Wilson and de Groot
(1995) showed a massive reconstruction of a Co(0001) single crystal after an
hour of exposure to syngas at FT reaction conditions. In order to address the
cause of this reconstruction, carbon from various sources on the catalyst
surface has been proposed (Ciobîcă et al., 2008; Tan et al., 2010; Weststrate et
al., 2012). To understand the nature of the surface reconstruction of the Co
catalyst, Ciobîcă et al. (2008) studied the adsorption of various surface species
(B, N, O, CO, C, CH and CH2) on FCC-Co(111) and FCC-Co(100) surfaces.
They compared the surface energies against the coverages of surface species
and concluded that only carbon was able to induce a surface reconstruction of
a FCC-Co(111) surface to the more open FCC-Co(100) surface. In order to

39
justify this conclusion, they further calculated and compared the surface
energies of a reconstructed slab with the unconstructed one at 50% carbon
coverage. The unchanged Co(111) surface is 56 kJ/mol less stable than the
reconstructed Co(100) surface at 50% carbon coverage. Furthermore, from the
FCC-Co(100) surface, carbon is able to induce a further clock reconstruction
(Figure 2.13) similar to the case of Ni(100) (Kirsch and Harris, 2003) with a
very low barrier of 1 kJ/mol, suggesting the likelihood of forming such a
surface from FCC-Co(100) without kinetic hindrance.
Figure 2.14. FCC–Co(100) surface at a C coverage of 0.5 ML (Left). Clock
reconstructed FCC–Co(100) surface at a C coverage of 0.5 ML (Right).
(Ciobîcă et al., 2008).
In order to explain how carbon deposition is able to deactivate Co catalysts in
FT synthesis, Tan et al. (2010) studied the stability of various carbon species
(surface, subsurface, graphene, CH and CH2) on a stepped FCC-Co surface.
Their DFT calculations show that extended graphene islands that grow out
from the step sites are the most stable carbon species present. The second most
stable carbon species Tan et al. found is a p4g surface carbide where the
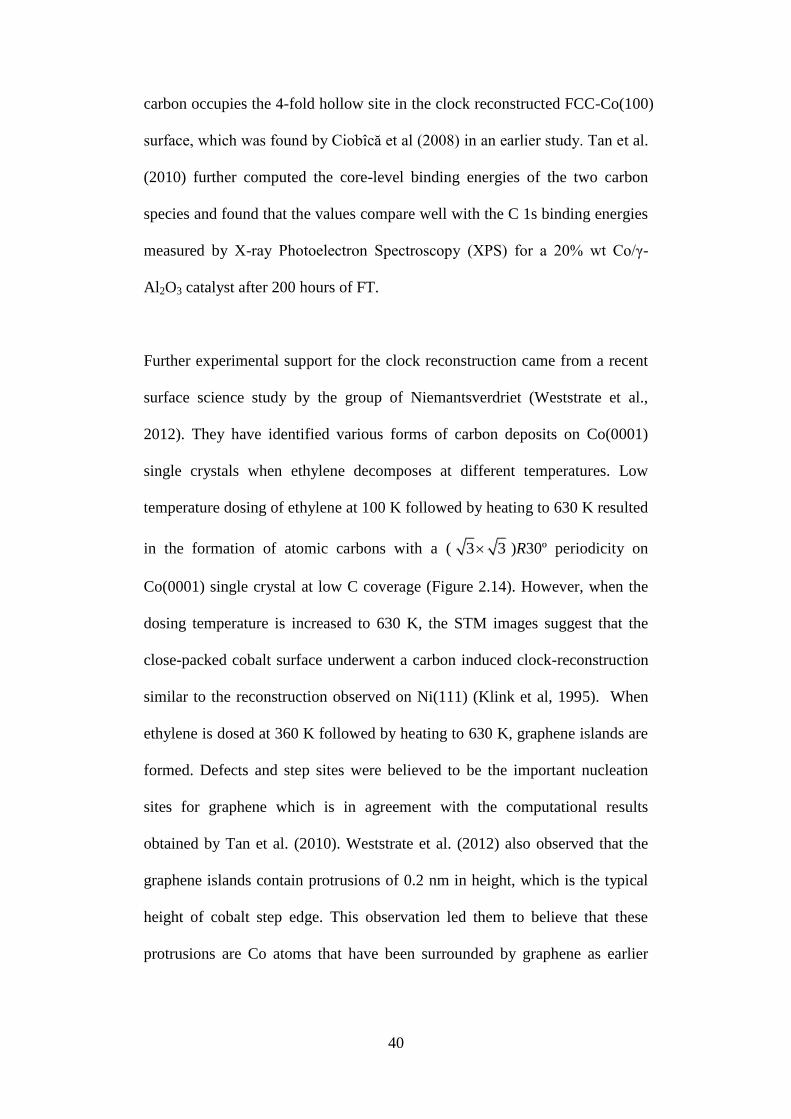
40
carbon occupies the 4-fold hollow site in the clock reconstructed FCC-Co(100)
surface, which was found by Ciobîcă et al (2008) in an earlier study. Tan et al.
(2010) further computed the core-level binding energies of the two carbon
species and found that the values compare well with the C 1s binding energies
measured by X-ray Photoelectron Spectroscopy (XPS) for a 20% wt Co/γ-
Al2O3 catalyst after 200 hours of FT.
Further experimental support for the clock reconstruction came from a recent
surface science study by the group of Niemantsverdriet (Weststrate et al.,
2012). They have identified various forms of carbon deposits on Co(0001)
single crystals when ethylene decomposes at different temperatures. Low
temperature dosing of ethylene at 100 K followed by heating to 630 K resulted
in the formation of atomic carbons with a ( 3 3 )R30º periodicity on
Co(0001) single crystal at low C coverage (Figure 2.14). However, when the
dosing temperature is increased to 630 K, the STM images suggest that the
close-packed cobalt surface underwent a carbon induced clock-reconstruction
similar to the reconstruction observed on Ni(111) (Klink et al, 1995). When
ethylene is dosed at 360 K followed by heating to 630 K, graphene islands are
formed. Defects and step sites were believed to be the important nucleation
sites for graphene which is in agreement with the computational results
obtained by Tan et al. (2010). Weststrate et al. (2012) also observed that the
graphene islands contain protrusions of 0.2 nm in height, which is the typical
height of cobalt step edge. This observation led them to believe that these
protrusions are Co atoms that have been surrounded by graphene as earlier

41
STM evidence shows that it is possible for metal atoms at step edge to diffuse
around on the terrace (Pai et al., 1995; Giesen and Icking-Konert, 1998; Yagi-
Watanabe et al., 2002).
Figure 2.15. Scanning Tunneling Microscopy (STM) images. a) Image of a
larger area showing the edge of a ( 3 3 )R30o island and a (1×1)
periodicity between islands. b) A 2D Fourier transform of image (a) that
shows both ( 3 3 )R30o and (1×1) structures. (Weststrate et al., 2012)

42
2.4 Summary
Despite numerous computational and experimental efforts to elucidate the
mechanism of FT synthesis, a consistent mechanistic picture remains elusive.
In the carbide mechanism, CO dissociation needs to be sufficiently fast to
generate a high surface coverage of CHx species for chain growth. However,
CO dissociation is likely to be slow on the terrace surface of Co. Density
functional theory calculations show that special step or B5 sites are able to
provide a low dissociation barrier. However, their direct relevance as the
“active” site for FT catalyst has not been proven.
In the CO insertion mechanism, a high energy barrier for CH3 + CO coupling
on Co terraces has been calculated. However, alternative CO insertion steps
via CH and CH2 provide feasible coupling pathways with lower barriers.
Furthermore, experimental studies by Weststrate et al. (2010) provided
evidence for the C–O scission of C2Hx–O over Co(0001) terrace. Possible
C2HxO intermediates can be formed by hydrogenating CH2CO, the resultant
intermediate from CO insertion into CH2. Hence, there is a need to further
investigate other possible surface reactions that may provide a viable route to
reasonably low C–O scission and C–C coupling barriers.
The structure of the catalyst surface is strongly related to the mechanism.
Therefore, to answer the mechanistic question, there is a need to also look into
the surface structure of the catalyst under FT conditions. Step or B5 sites may
be one of the important active sites on FT catalysts; however, surface reactions
43
of FT consist of both dissociative and associative types. The two may have
different sensitivity to surface structure highlighted by Liu and Hu (2003). At
the same time, the nature of the reconstruction observed by Wilson and de
Groot (1995) is still unknown. Nonetheless, surface science experiments do
provide evidences that CO forms stable surface structures on a Co terrace
surface and the presence of CO will affect the stability of surface
intermediates due to lateral interactions.
In conclusion, no single proposed mechanism to date is able to fully describe
the experimental observations and results obtained for FT synthesis. It could
be that more than a single mechanism is taking place at the same time. Hence,
to bridge the gap, more work needs to be done to further understand the
reactions taking place on the surface. In addition, understanding the surface
structure and condition of a catalyst under FT condition is an area that is
difficult and not very well studied. Therefore, there is a need to gain better
insight in this area in order to provide surface models closer to reaction
conditions to study the surface reactions.
44
2.5 References
Anderson, R. B.; Friedel, R. A.; Storch. H. H. J. Chem. Phys. 1951, 19, 313.
Brady, R.; Pettit, R. J. Am. Chem. Soc. 1980, 102, 6181.
Brady, R.; Pettit, R. J. Am. Chem. Soc. 1981, 103, 1287.
Blyholder, G.; Emmett, P. H. J. Phys Chem. 1959, 63, 962.
Blyholder, G.; Emmett, P. H. J. Phys Chem. 1960, 64, 470.
Blyholder, G.; Shihabi, D.; Wyatt, W. V.; Bartlett, R. J. Catal. 1976, 43, 122.
Bengaard, H. S.; Nørskov, J. K.; Sehested, J.; Clausen, B. S.; Nielsen, L. P.;
Molenbroek, A. M.; Rostrup-Nielsen, J. R. J. Catal. 2002, 209, 365.
Besenbacher, F.; Chorkendorff, I.; Clausen, B. S.; Hammer, B.; Molenbroek,
A.; Nørskov, J. K.; Stengaard, I. Science 1998, 279, 1913.
Bezemer, G. L.; Bitter, J. H.; Kuipers, H. P. C. E.; Oosterbeek, H.; Holewijin,
J. E.; Xu, X.; Kaptejin, F.; van Dillen, A. J.; de Jong, K. P. J. Am. Chem. Soc.
2006, 128, 3956.
Bridge, M. E.; Comrie, C. M.; Lambert, R. M. Surf. Sci. 1977, 67, 393.
Beitel, G. A.; Laskov, A.; Oosterbeek, H.; Kuipers, E. W. J. Phys. Chem. 1996,
100, 12494.
Beitel, G. A.; de Groot, C. P. M.; Oosterbeek, H.; Wilson, J .H. J. Phys. Chem.
B 1997, 101, 4035.
Cheng, J.; Hu, P.; Ellis, P.; French, S.; Kelly, G.; Lok, C. M. J. Cat. 2008,
257, 221.
Cheng, J.; Hu, P.; Ellis, P.; French, S.; Kelly, G.; Lok, C. M. J. Phys Chem. C.
2008, 112, 9464.
45
Cheng, J.; Gong, X.-Q.; Hu, P.; Martin Lok, C.; Ellis, P.; French, S. J. Catal.
2008, 254, 285.
Cheng, J.; Hu, P.; Ellis, P.; French, S.; Kelly, G.; Martin Lok, C. J. Phys.
Chem. C 2008, 112, 6082.
Ciobîcă, I. M.; van Santen, R. A. J. Phys. Chem. B 2003, 107, 3808.
Ciobîcă, I. M.; van Santen, R. A.; van Berge, P. J.; van de Loosdrecht, J. Surf.
Sci. 2008, 602, 17.
Dry, M. E. App. Cat. A: Gen. 1996, 138, 319.
Davis, B. H. Catal. Tod. 2009, 141, 25.
Davis, B.H.; Occelli, M.L. “Fischer-Tropsch Synthesis Catalysts and Catalysis”
Elsevier B.V., 2007; p. 1; 309
Dahl, S.; Logadottir, A.; Egeberg, R. C.; Larsen, J. H.; Chorckendorff, I.;
Christensen, C. H.; Nørskov, J. K. Phys. Rev. Lett. 1999, 83, 1814.
den Breejen, J. P.; Radstake, P. B.; Bezemer, G. L.; Bitter, J. H.; Frøseth, V.;
Holmen, A.; de Jong, K. P. J. Am. Chem. Soc. 2009, 131, 7197.
Fischer, F.; Tropsch, H. Brennstoff-Chem. 1926, 7, 97.
Fischer, F.; Tropsch, H. Brennstoff-Chem. 1923, 4, 276.
Flory, J.P. J. Am. Chem. Soc.1936, 58, 1877.
Friedel, R.A.; Anderson, R.B. J. Am. Chem. Soc. 1950, 72, 1212.
Frennet, A.; Visart de Bocarmé, T., Bastin, J.-M., Kruse, N., J. Phys. Chem. B,
2005 109, 2350.
Ge, Q. F.; Neurock, M., J. Phys. Chem. B 2006, 110, 15368.
Gong, X.-Q.; Raval, R.; Hu, P., J. Chem. Phys. 2005, 122, 024711.
Gaube, J.; Klein, H.-F. J. Mol. Catal. A: Chem. 2008, 283, 60.
Giesen, M.; Icking-Konert, G. S. Surf. Sci. 1998, 412-413, 645.
46
Henrici-Olive, G.; Olive, S. Angew. Chem.1976, 88, 144.
Honkala, K.; Hellman, A.; Remediakis, I. N.; Logadottir, A.; Carlsson, A.;
Dahl, S.; Christensen, C. H.; Nørskov, J. K. Science 2005, 307, 555.
Inderwildi, O. R.; Jenkins, S. J.; King, D. A., J. Phys. Chem. C Lett., 2007,
112, 5.
Khodakov, A. Y.; Chu, W.; Fongarland, P., Chem. Rev. 2007, 107, 1692.
Kumer, J. T.; Dewitt, T. W.; Emmett, P. H., J. Am. Chem. Soc. 1948, 70, 3632.
Kokes, R. J.; Hall, W. K.; Emmett, P. H., J. Am. Chem. Soc. 1957, 79, 2898.
Kummer, J.K.; Emmett, P.H., J. Am. Chem. Soc., 1953, 75, 5177.
Kisrch, J. E.; Harris, S. Surf. Sci. 2003, 522, 125.
Klink, C.; Stensgaard, I.; Besenbacher, F.; Lægsgaard, E. Surf. Sci. 1995, 342,
250.
Liu, Z.-P.; Hu, P. J. Am. Chem. Soc. 2003, 30, 27.
Masters, C. Adv. Organomet. Chem. 1979, 17, 61.
Mitchell, W. J.; Xie, J.; Wang, Y.; Weinberg, W. H., J. Elect. Spectro. Re.
Pheno. 1993, 64, 427.
Mitchell, W. J.; Xie. J.; Jachimowski, T. A.; Weinber, W. H., J. Am. Chem.
Soc. 1995, 117, 2606.
Ojeda, M.; Nabar, R.; Nilekar, A. U.; Ishikawa, A.; Mavrikakis, M.; Iglesia, E.,
J. Catal. 2010, 272, 287.
Pichler, H.; Schulz, H., Chem. Ing. Tech. 1970, 42, 1162.
Pichler, H.; Firnhaber, B; Brennst. Chem. 1970, 44, 12.
Pichler, H.; Meizer zu Köcker, H.; Gabler, W.; Gärtner, R.; Kioussis, D.;
Brennst. Chem. 1967, 48, 266.
47
Pai, W. W.; Bartelt, N. C.; Peng, M. R.; Reutt-Robey, J. E. Surf. Sci. 1995,
330, 679.
Papp, H. Surf. Sci. 1983, 129, 205.
Raje, A.; Davis, B. H. Catalysis (J. J. Spivey, ed), The Royal. Soc. Chem.,
Cambridge, 1996, 12 , 52.
Storch, H. H.; Golumbic, N.; Anderson, R.B., “The Fischer-Tropsch and
Related Syntheses” John Wiley and Sons, Inc., New York, 1951.
Sarup, B.; Wojciechowski, B. W. Can. J. Chem. Eng. 1989, 67, 62.
Shetty, S.; van Santen, R. A., Phys. Chem. Chem. Phys. 2010, 12, 6330.
Shetty, S.; van Santen, R. A., Catal. Tod. 2011, 171, 168.
Shetty, S.; Jansen, A. P. J.; van Santen, R. A., J. Am. Chem. Soc. 2009, 131,
12874.
Schulz, H.; Zein El Deen, A., Fuel Process. Tech. 1977, 1, 45
Schweicher, J.; Bundhoo, A.; Frennet, A.; Kruse, N.; Daly, H.; Meunier, F. C.,
14th
International Congress of Catalysis, Seoul, Korea, 2008
Schweicher, J.; Bundhoo, A.; Kruse, N. J. Am. Chem. Soc. 2012, 134, 16135.
Tau, L.-M.; Dobbagh, H. A.; Davis, B. H. Energy & Fuels 1991, 5, 174.
Tan, K. F.; Xu, J.; Chang, J.; Borgna, A.; Saeys, M. J. Catal. 2010, 274, 121.
van Hardeveld, R.; van Montfoort, A., Surf. Sci. 1966, 4, 396.
van der Laan, G. P.; Beenackers, A. A. C. M. Catal. Rev. Sci. Eng. 1999, 41,
255.
Vannice. M. A. J. Catal. 1975, 37, 449.
Wilson, J.; de Groot, C., J. Phys. Chem. 1995, 99, 7860.
Weststrate, C.J.; Gericke, H.J.; Verhoeven, M.W.G.M.; Ciobîcă, I.M.; Saib,
A.M.; Niemantsverdriet, J.W. J. Phys. Chem. Lett. 2010, 1, 1767.
48
Weststrate, C. J.; Kizilkaya, A. C.; Rossen, E. T. R.; Verhoeven, M. W. G. M.;
Ciobîcă, I M.; Saib, A. M.; Niemantsverdriet, J. W. J. Phys. Chem. C 2012,
116, 11575.
Weststrate, C. J. Personal Communications, 2012.
Wojciechowski, B. W. Catal. Rev. Sci. Eng. 1988, 30, 629.
Yagi-Watanabe, K.; Suzuki, D.; Fukutani, H. Surf. Sci. 2002, 518, 155.
Zambelli, T.; Winterlin, J.; Trost, J.; Ertl, G. Science, 1996, 273, 1688.
Zhuo, M.; Tan, K. F.; Borgna, A.; Saeys, M., J. Phys. Chem. C 2009, 113,
8357.

49
CHAPTER 3
COMPUTATIONAL AND EXPERIMENTAL
METHODS
3.1 Computational methods
3.1.1 Density Functional Theory (DFT) and Vienna Ab-Initio Simulation
Package (VASP)
One of the most challenging goals in quantum chemical approaches is to find
the solution (or approximate) to the time-independent, non-relativistic
Schrödinger equation (Schrödinger, 1926) (Equation 3.1).
M21N21iiM21N21i R,...,R,R,x,...,x,xR,...,R,R,x,...,x,xˆ (3.1)
where Ĥ is the Hamiltonian operator for molecular system consisting of M
nuclei and N electrons, Ψi is the wave function and E is the total energy of the
system. The wave function is a function of 3M + 4N variables (M nuclei, spin
of N electrons and their positions) and contains all the information about the
state of the system. The Hamiltonian operator accounts for both the kinetic
and potential energies of the system. As solving for the exact solution of a
system with more than 2 electrons is not possible, various theories and
approximations have been developed to make the equation quantitatively
50
solvable. One of these is the density functional theory (DFT). A brief
discussion on DFT is presented next while more detailed discussions can be
found in Koch and Holthausen (2001).
Density functional theory was put forward by Hohenberg and Kohn (1965)
and Kohn and Sham (1965). Their theory replaces the many body electronic
wave function with the electron density as the basic quantity. Density
Functional Theory reformulates the Schrödinger equation by replacing the 4N
dimensional electronic wave function with a three dimensional electron
density. The effect of this is a simplification of quantum chemical calculation
as the electron density is only a function of 3 variables as opposed to an N-
electron wave function which is a function of 4N variables. The electronic
energies obtained from DFT are comparable to the experimental values (Kohn,
1999).
Many computational programs were developed based on DFT and the Vienna
Ab-Initio Simulation Package (VASP) is one of them. Developed by Kresse
and Hafner (1993), the software performs self-consistent periodic DFT
calculations. It solves the Kohn-sham equations of local density or spin-
density functional theory iteratively within plane wave basis sets. The ultrasoft
pseudopotentials (US-PP) (Vanderbilt, 1990; Kresse and Hafner, 1994) and
the projector-augmented-wave (PAW) (Blöchl, 1994) method are used to
describe the interactions between electrons and ions. Electronic ground-state
energy can be determined by iterative matrix-diagonalisation schemes such as
blocked Davidson scheme (Davidson, 1983) and residual minimization
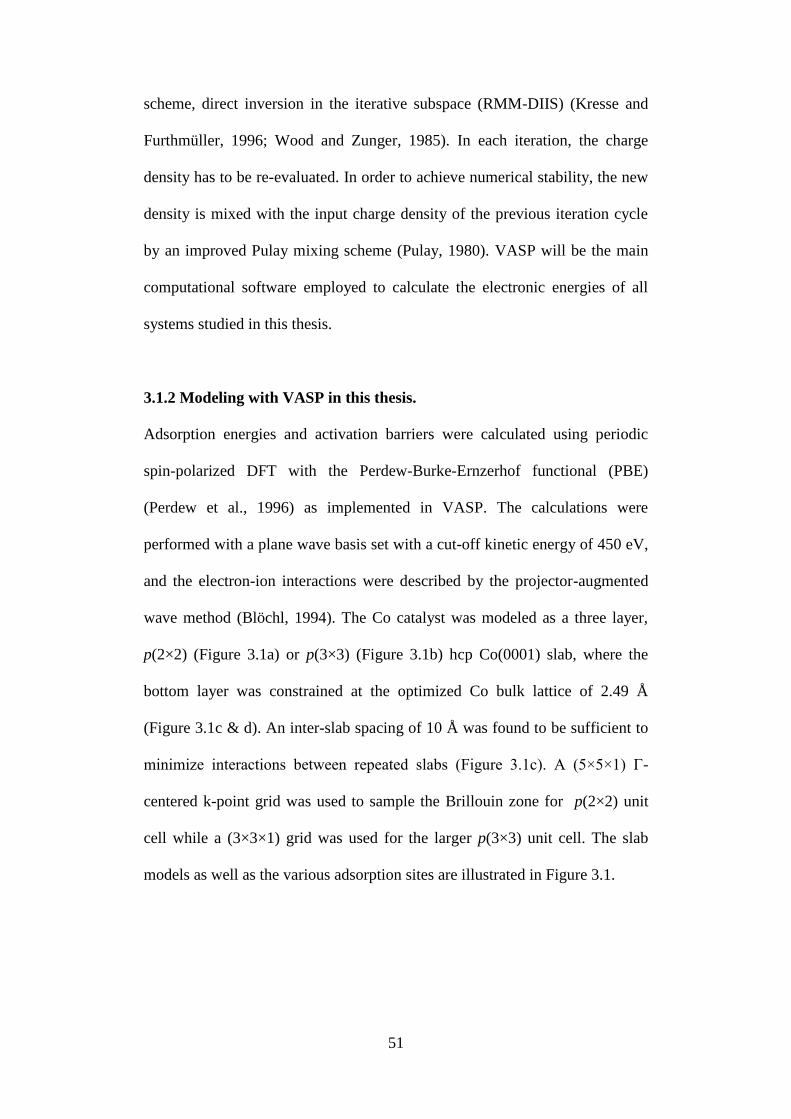
51
scheme, direct inversion in the iterative subspace (RMM-DIIS) (Kresse and
Furthmüller, 1996; Wood and Zunger, 1985). In each iteration, the charge
density has to be re-evaluated. In order to achieve numerical stability, the new
density is mixed with the input charge density of the previous iteration cycle
by an improved Pulay mixing scheme (Pulay, 1980). VASP will be the main
computational software employed to calculate the electronic energies of all
systems studied in this thesis.
3.1.2 Modeling with VASP in this thesis.
Adsorption energies and activation barriers were calculated using periodic
spin-polarized DFT with the Perdew-Burke-Ernzerhof functional (PBE)
(Perdew et al., 1996) as implemented in VASP. The calculations were
performed with a plane wave basis set with a cut-off kinetic energy of 450 eV,
and the electron-ion interactions were described by the projector-augmented
wave method (Blöchl, 1994). The Co catalyst was modeled as a three layer,
p(2×2) (Figure 3.1a) or p(3×3) (Figure 3.1b) hcp Co(0001) slab, where the
bottom layer was constrained at the optimized Co bulk lattice of 2.49 Å
(Figure 3.1c & d). An inter-slab spacing of 10 Å was found to be sufficient to
minimize interactions between repeated slabs (Figure 3.1c). A (5×5×1) Γ-
centered k-point grid was used to sample the Brillouin zone for p(2×2) unit
cell while a (3×3×1) grid was used for the larger p(3×3) unit cell. The slab
models as well as the various adsorption sites are illustrated in Figure 3.1.

52
Figure 3.1 a) Model of a p(2×2) unit cell showing all available adsorption
sites on the surface. (×) – Top; (–) – Bridge; (∆) – Fcc; (○) – Hcp. b) Model of
a p(3×3) unit cell. c) A 3 layers p(3×3) model slab in the z – direction with
inter-slab spacing of 10 Å. The top two layers are relaxed while the bottom
layer is constrained to the bulk positions. d) Optimization of lattice constant
for bulk hcp Co.
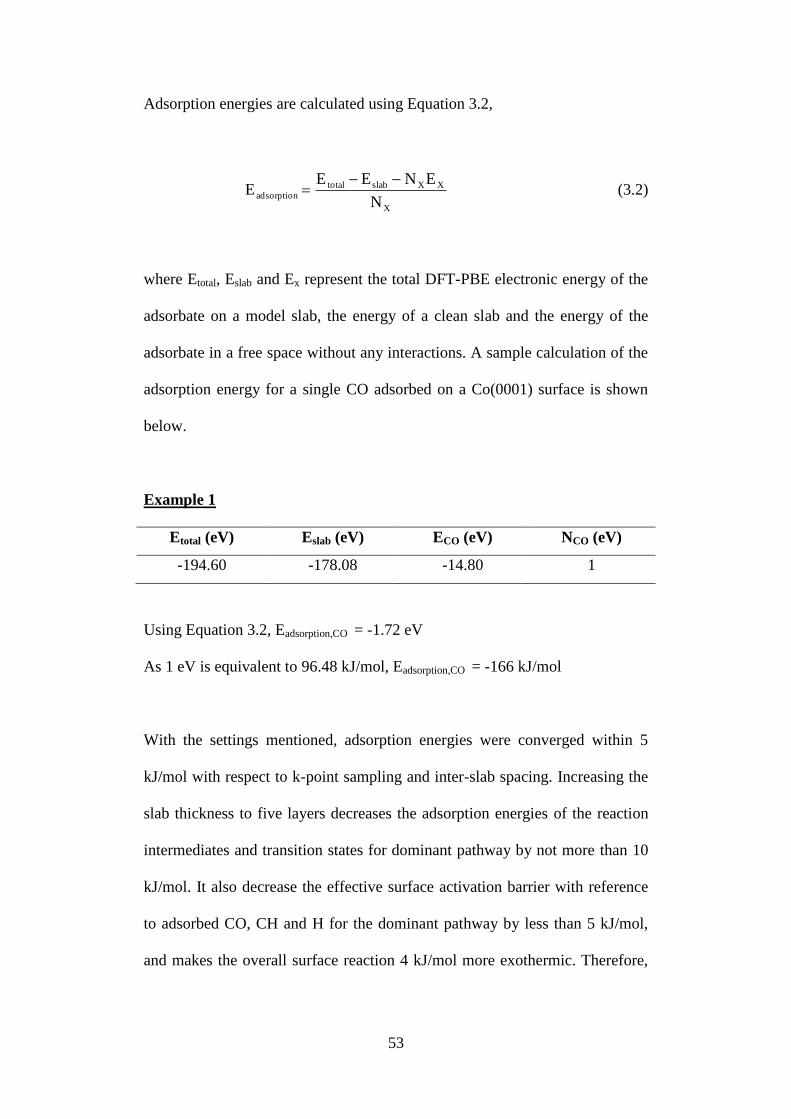
53
Adsorption energies are calculated using Equation 3.2,
X
XXslabtotal
adsorptionN
ENEEE
(3.2)
where Etotal, Eslab and Ex represent the total DFT-PBE electronic energy of the
adsorbate on a model slab, the energy of a clean slab and the energy of the
adsorbate in a free space without any interactions. A sample calculation of the
adsorption energy for a single CO adsorbed on a Co(0001) surface is shown
below.
Example 1
Etotal (eV) Eslab (eV) ECO (eV) NCO (eV)
-194.60 -178.08 -14.80 1
Using Equation 3.2, Eadsorption,CO = -1.72 eV
As 1 eV is equivalent to 96.48 kJ/mol, Eadsorption,CO = -166 kJ/mol
With the settings mentioned, adsorption energies were converged within 5
kJ/mol with respect to k-point sampling and inter-slab spacing. Increasing the
slab thickness to five layers decreases the adsorption energies of the reaction
intermediates and transition states for dominant pathway by not more than 10
kJ/mol. It also decrease the effective surface activation barrier with reference
to adsorbed CO, CH and H for the dominant pathway by less than 5 kJ/mol,
and makes the overall surface reaction 4 kJ/mol more exothermic. Therefore,
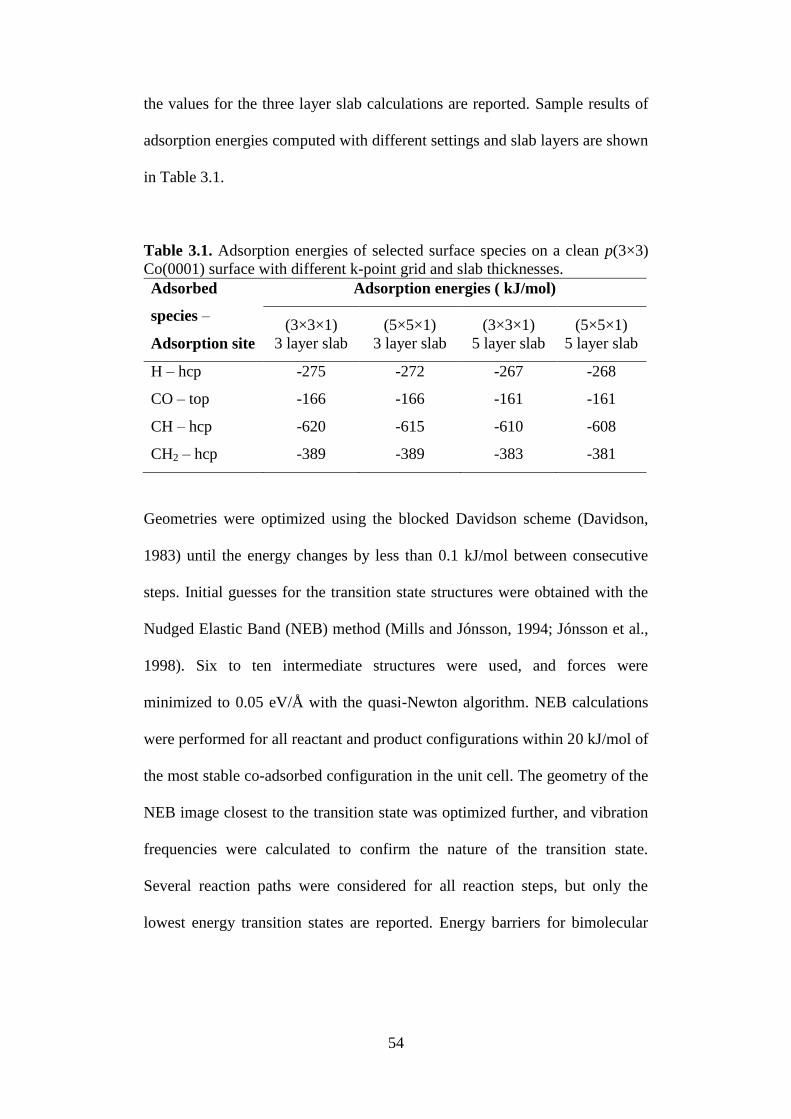
54
the values for the three layer slab calculations are reported. Sample results of
adsorption energies computed with different settings and slab layers are shown
in Table 3.1.
Table 3.1. Adsorption energies of selected surface species on a clean p(3×3)
Co(0001) surface with different k-point grid and slab thicknesses.
Adsorbed
species –
Adsorption site
Adsorption energies ( kJ/mol)
(3×3×1)
3 layer slab
(5×5×1)
3 layer slab
(3×3×1)
5 layer slab
(5×5×1)
5 layer slab
H – hcp -275 -272 -267 -268
CO – top -166 -166 -161 -161
CH – hcp -620 -615 -610 -608
CH2 – hcp -389 -389 -383 -381
Geometries were optimized using the blocked Davidson scheme (Davidson,
1983) until the energy changes by less than 0.1 kJ/mol between consecutive
steps. Initial guesses for the transition state structures were obtained with the
Nudged Elastic Band (NEB) method (Mills and Jónsson, 1994; Jónsson et al.,
1998). Six to ten intermediate structures were used, and forces were
minimized to 0.05 eV/Å with the quasi-Newton algorithm. NEB calculations
were performed for all reactant and product configurations within 20 kJ/mol of
the most stable co-adsorbed configuration in the unit cell. The geometry of the
NEB image closest to the transition state was optimized further, and vibration
frequencies were calculated to confirm the nature of the transition state.
Several reaction paths were considered for all reaction steps, but only the
lowest energy transition states are reported. Energy barriers for bimolecular
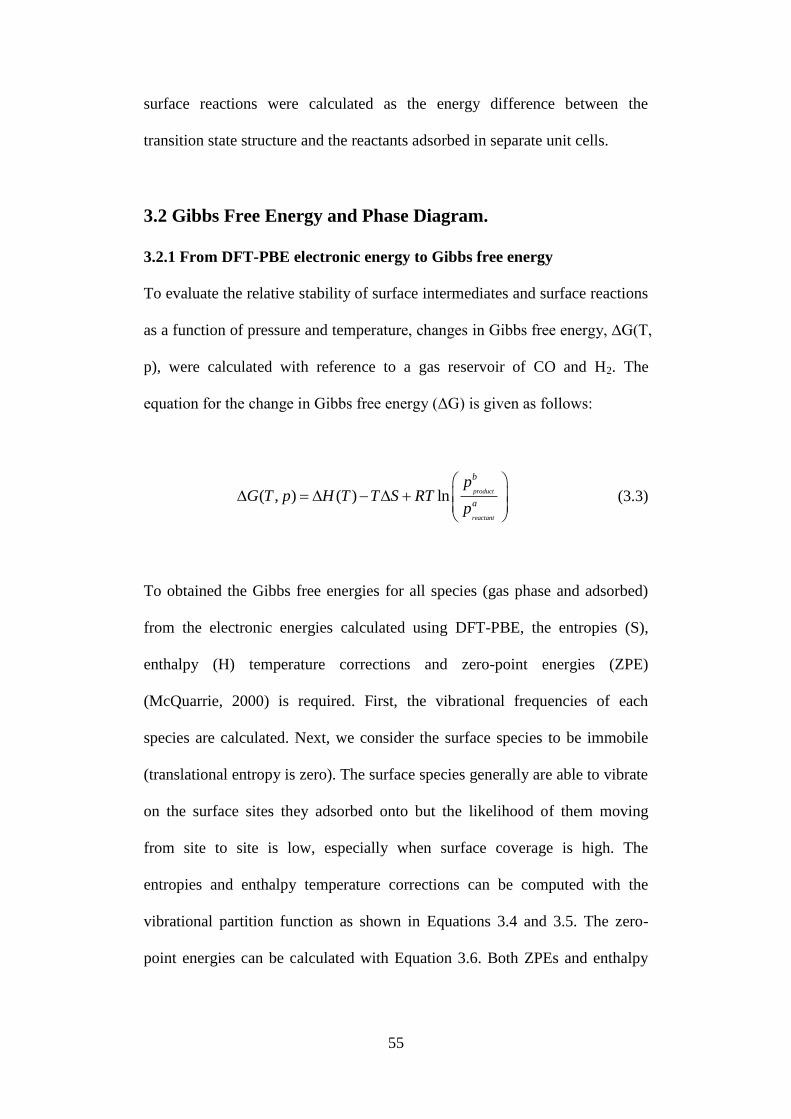
55
surface reactions were calculated as the energy difference between the
transition state structure and the reactants adsorbed in separate unit cells.
3.2 Gibbs Free Energy and Phase Diagram.
3.2.1 From DFT-PBE electronic energy to Gibbs free energy
To evaluate the relative stability of surface intermediates and surface reactions
as a function of pressure and temperature, changes in Gibbs free energy, ∆G(T,
p), were calculated with reference to a gas reservoir of CO and H2. The
equation for the change in Gibbs free energy (ΔG) is given as follows:
( , ) ( ) lnproduct
reactant
b
a
pG T p H T T S RT
p
(3.3)
To obtained the Gibbs free energies for all species (gas phase and adsorbed)
from the electronic energies calculated using DFT-PBE, the entropies (S),
enthalpy (H) temperature corrections and zero-point energies (ZPE)
(McQuarrie, 2000) is required. First, the vibrational frequencies of each
species are calculated. Next, we consider the surface species to be immobile
(translational entropy is zero). The surface species generally are able to vibrate
on the surface sites they adsorbed onto but the likelihood of them moving
from site to site is low, especially when surface coverage is high. The
entropies and enthalpy temperature corrections can be computed with the
vibrational partition function as shown in Equations 3.4 and 3.5. The zero-
point energies can be calculated with Equation 3.6. Both ZPEs and enthalpy

56
temperature corrections are added to the electronic energies to obtain the H(T)
of each species.
ikT/hv
kT/hv
i
i
kT/hv
vibi
i
i
e1
e
kT
hvRe1lnRS (3.4)
ikT/hv
kT/hv
ivib
i
i
e1
e
kT
hvRT0HTH (3.5)
n
1i
ihv2
1ZPE (3.6)
where R = 8.314 J/mol.K is the gas constant; h = 6.626 × 10⁻³⁴
J.s is Planck’s
constant; k = 1.381 × 10⁻²³
J/K is the Boltzmann constant; vi = vibrational
frequencies in s-1
of adsorbed species; T is 500 K, a typical FT operation
temperature.
As an example to illustrate how Gibbs free energies under FT conditions,
∆G(500 K, 20 bar), are calculated, the stability of surface CH2* species with
respected to gas reservoir of CO, H2 and H2O is evaluated with Equation 3.7.
Example 2
Formation of CH2 on model p(3×3) Co(0001) slab surface,
)g(OH*CH*)g(H2)g(CO 222
(3.7)
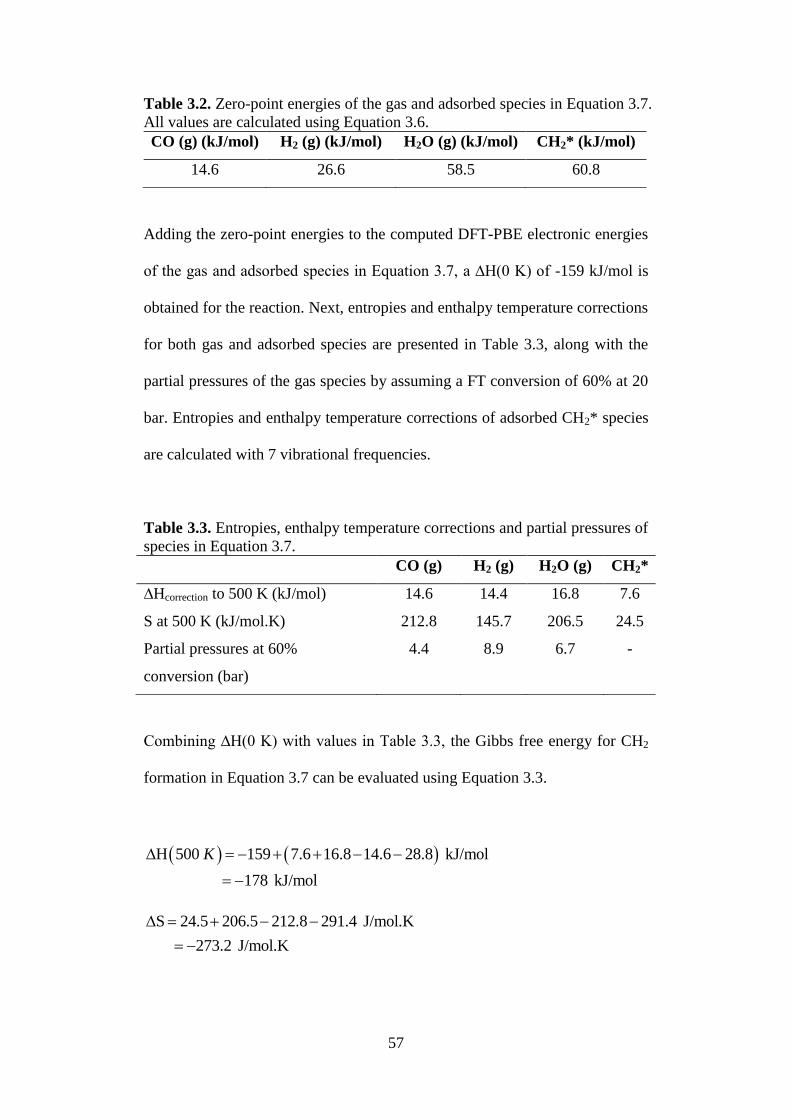
57
Table 3.2. Zero-point energies of the gas and adsorbed species in Equation 3.7.
All values are calculated using Equation 3.6.
CO (g) (kJ/mol) H2 (g) (kJ/mol) H2O (g) (kJ/mol) CH2* (kJ/mol)
14.6 26.6 58.5 60.8
Adding the zero-point energies to the computed DFT-PBE electronic energies
of the gas and adsorbed species in Equation 3.7, a ∆H(0 K) of -159 kJ/mol is
obtained for the reaction. Next, entropies and enthalpy temperature corrections
for both gas and adsorbed species are presented in Table 3.3, along with the
partial pressures of the gas species by assuming a FT conversion of 60% at 20
bar. Entropies and enthalpy temperature corrections of adsorbed CH2* species
are calculated with 7 vibrational frequencies.
Table 3.3. Entropies, enthalpy temperature corrections and partial pressures of
species in Equation 3.7.
CO (g) H2 (g) H2O (g) CH2*
∆Hcorrection to 500 K (kJ/mol) 14.6 14.4 16.8 7.6
S at 500 K (kJ/mol.K) 212.8 145.7 206.5 24.5
Partial pressures at 60%
conversion (bar)
4.4 8.9 6.7 -
Combining ∆H(0 K) with values in Table 3.3, the Gibbs free energy for
CH2
formation in Equation 3.7 can be evaluated using Equation 3.3.
H 500 159 7.6 16.8 14.6 28.8 kJ/mol
178 kJ/mol
K
S 24.5 206.5 212.8 291.4 J/mol.K
273.2 J/mol.K

58
2
500 500 6.7G 500 , 20 178 273.2 8.314 ln
1000 1000 4.4 8.9
58 kJ/mol
K bar
The example above illustrates the method to connect the electronic energy
calculated with DFT-PBE to Gibbs free energies, so that temperature and
pressure can be taken into account. In a similar manner, Gibbs free energies
for any surface or gas species or even transition state can be calculated. Gibbs
free energies can also be used to perform calculations to derive phase
diagrams. This is discussed in the next section.
3.2.2 Phase diagram
A hypothetical reaction between two species, A and B, is shown in Equation
3.8.
ABBA (3.8)
A negative Gibbs free energy for the above reversible reaction means that
formation of products is favourable at the given conditions and its magnitude
tells us how far the reaction is from equilibrium at that moment. At any given
temperature and pressure, the change in Gibbs free energy of a reaction is zero
(∆G=0) at equilibrium. A slight change in the conditions at equilibrium could
shift the reaction towards the products or reactants. Graphically, the
equilibrium line where the Gibbs free energy is zero represents the boundary
that separates the conditions where reactants or products are dominant. For
59
reactions that are related, for example the hydrogenation of acetylene (C2H2)
to ethylene (C2H4) and ethane (C2H6), more than one equilibrium lines can be
plotted on the same diagram and a stability diagram can be developed. At any
given condition, we can identify whether acetylene, ethylene or ethane is
dominant from the diagram. This will be illustrated in the next example for the
gas phase hydrogenation of acetylene to ethylene and ethane.
Example 3
Hydrogenation of acetylene to ethylene and ethane:
)g(HC)g(H)g(HCH 42222 (3.9)
)g(HC)g(H2)g(HCH 62222 (3.10)
)g(HC)g(H)g(HCH 62242 (3.11)
Perceiving the equilibrium conditions (∆G=0) for each of the reaction
described above, Equation 3.3 for the reaction in Equation 3.9 is reduced to:
2 4
2 2 2
C H
1
C H H
p0 = ΔH(T) TΔS RTln
p p
(3.12)
Similar expressions can be written for Equations 3.10 and 3.11. At equilibrium,
the partial pressure of acetylene and ethylene is assumed to be the same.
Therefore, the above equation can be re-written as:
2HRTln p H(T) T S (3.13)
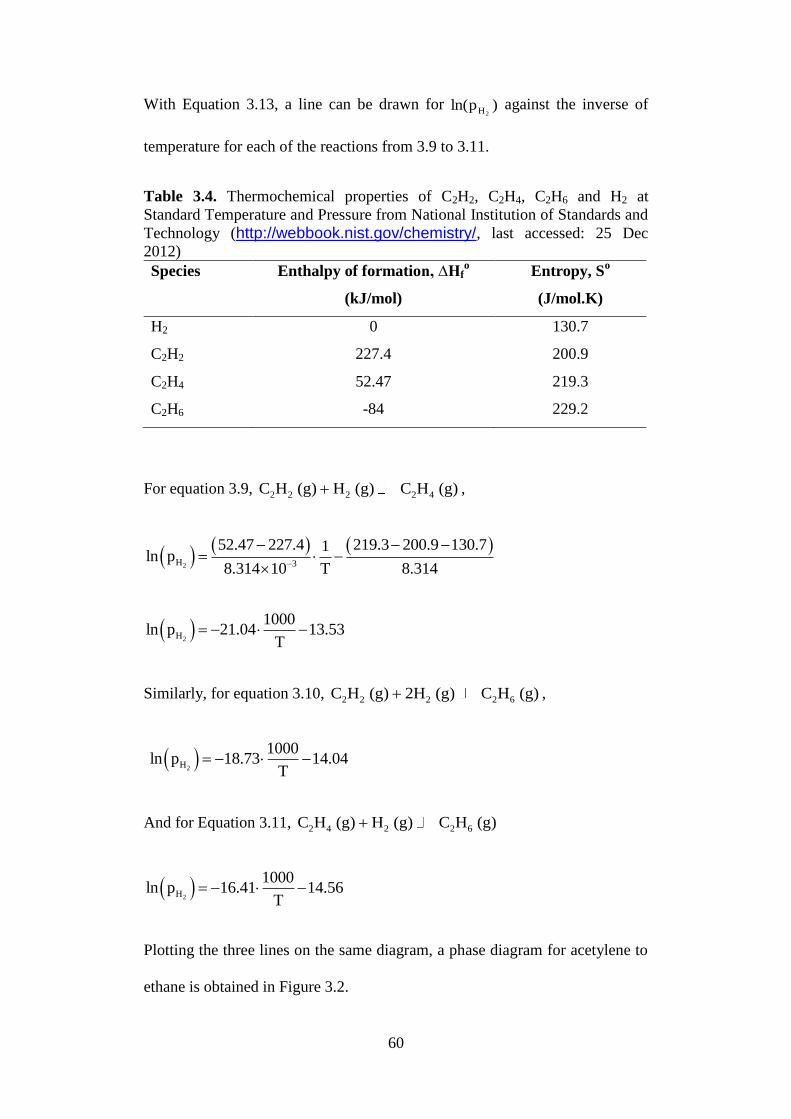
60
With Equation 3.13, a line can be drawn for )pln(2H
against the inverse of
temperature for each of the reactions from 3.9 to 3.11.
Table 3.4. Thermochemical properties of C2H2, C2H4, C2H6 and H2 at
Standard Temperature and Pressure from National Institution of Standards and
Technology (http://webbook.nist.gov/chemistry/, last accessed: 25 Dec
2012)
Species Enthalpy of formation, ∆Hfo
(kJ/mol)
Entropy, So
(J/mol.K)
H2 0 130.7
C2H2 227.4 200.9
C2H4 52.47 219.3
C2H6 -84 229.2
For equation 3.9, 2 2 2 2 4C H (g) H (g) C H (g) ,
2H 3
52.47 227.4 219.3 200.9 130.71ln p
8.314 10 T 8.314
2H
1000ln p 21.04 13.53
T
Similarly, for equation 3.10, 2 2 2 2 6C H (g) 2H (g) C H (g) ,
2H
1000ln p 18.73 14.04
T
And for Equation 3.11, 2 4 2 2 6C H (g) H (g) C H (g)
2H
1000ln p 16.41 14.56
T
Plotting the three lines on the same diagram, a phase diagram for acetylene to
ethane is obtained in Figure 3.2.
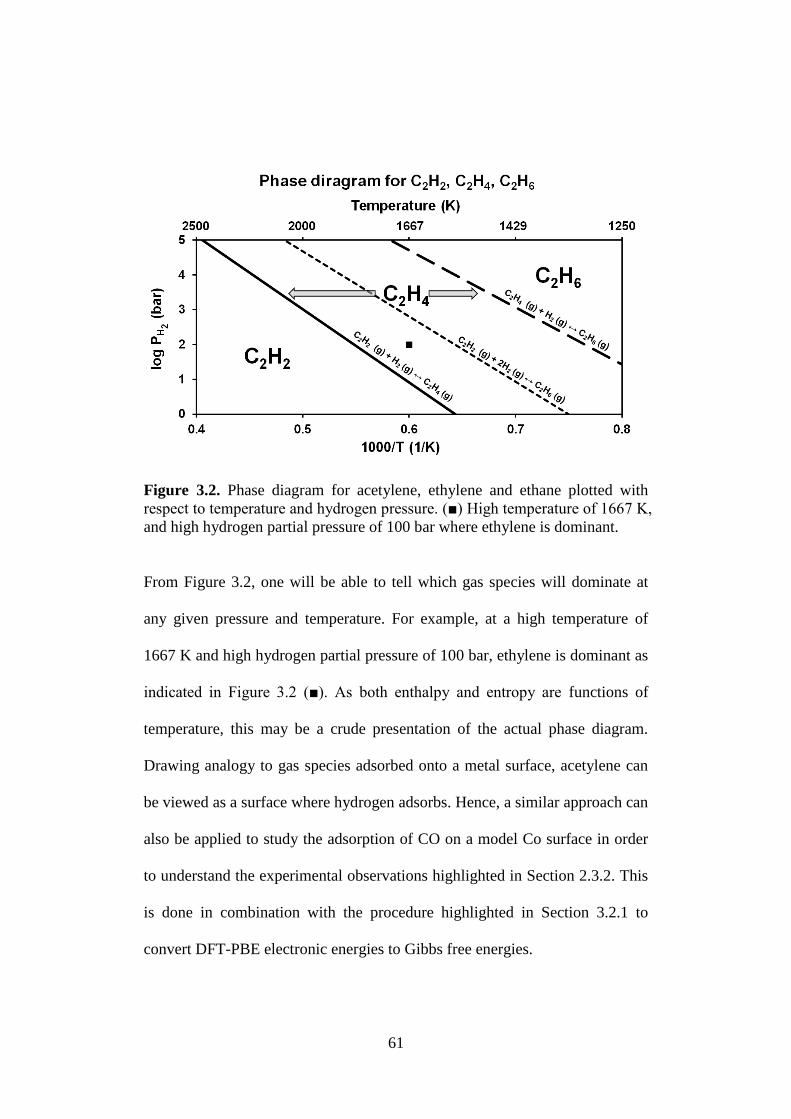
61
Figure 3.2. Phase diagram for acetylene, ethylene and ethane plotted with
respect to temperature and hydrogen pressure. (■) High temperature of 1667 K,
and high hydrogen partial pressure of 100 bar where ethylene is dominant.
From Figure 3.2, one will be able to tell which gas species will dominate at
any given pressure and temperature. For example, at a high temperature of
1667 K and high hydrogen partial pressure of 100 bar, ethylene is dominant as
indicated in Figure 3.2 (■). As both enthalpy and entropy are functions of
temperature, this may be a crude presentation of the actual phase diagram.
Drawing analogy to gas species adsorbed onto a metal surface, acetylene can
be viewed as a surface where hydrogen adsorbs. Hence, a similar approach can
also be applied to study the adsorption of CO on a model Co surface in order
to understand the experimental observations highlighted in Section 2.3.2. This
is done in combination with the procedure highlighted in Section 3.2.1 to
convert DFT-PBE electronic energies to Gibbs free energies.

62
3.2.3 CO over-binding correction factor
Many studies have shown that DFT–GGA calculations overestimate the CO
binding energy on transition metal surfaces, and that the magnitude of this
overestimation depends on the adsorption site (e.g., Feibelman et al., 2001).
Since the stability diagram for adsorbed CO depends strongly on the
calculated adsorption enthalpies, we have used the site-dependent correction
factors determined by Pick (2007) (Equation 3.14) following the general
procedure developed by Mason et al. (2004), to improve the binding
enthalpies. Using calculated vibration frequencies at different CO adsorption
sites, correction factors for the different adsorption sites are listed in Table 3.5.
,CO correctionE A B v (3.14)
where A = 1.996 eV and B = 0.0008 eV/cm-1
and v is the calculated CO
stretching frequency.
Table 3.5. Correction factors for CO over-binding on different adsorption sites
for calculations using DFT-GGA (Pick, 2007).
Adsorption site Correction factor
(kJ/mol)
Frequency (cm-1
)
Top +37 2017
Bridge +51 1841
Fcc +55 1783
Hcp +57 1770
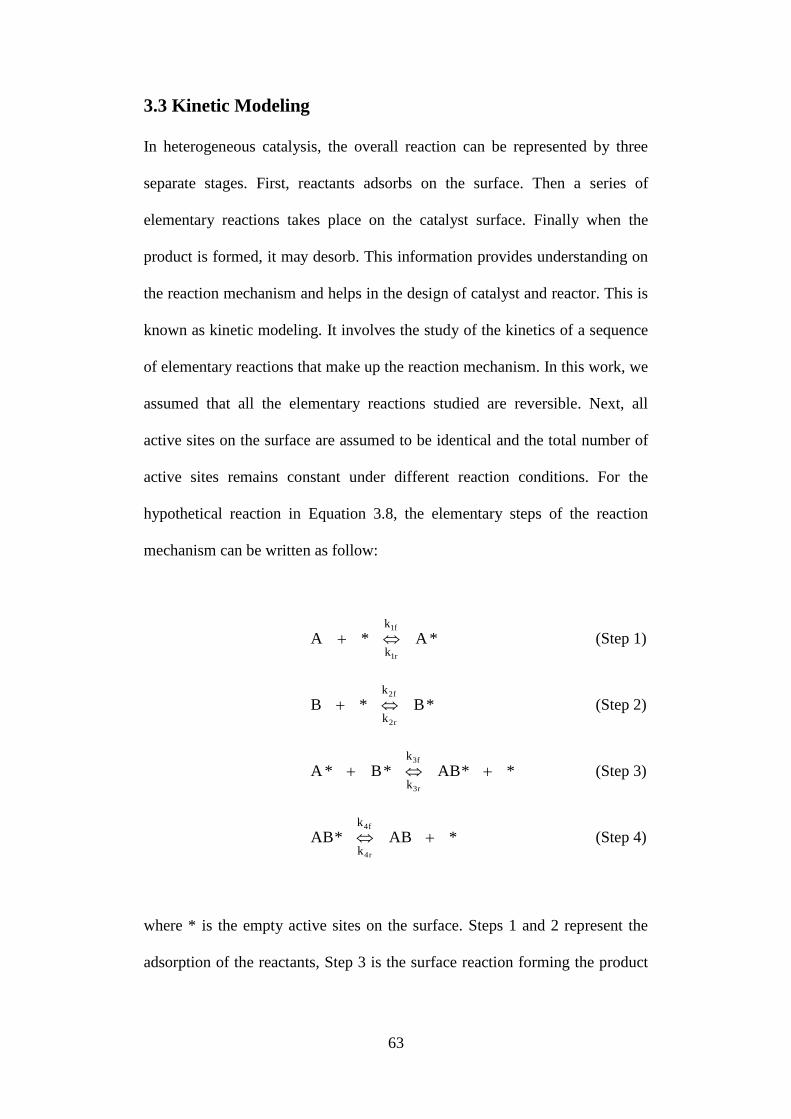
63
3.3 Kinetic Modeling
In heterogeneous catalysis, the overall reaction can be represented by three
separate stages. First, reactants adsorbs on the surface. Then a series of
elementary reactions takes place on the catalyst surface. Finally when the
product is formed, it may desorb. This information provides understanding on
the reaction mechanism and helps in the design of catalyst and reactor. This is
known as kinetic modeling. It involves the study of the kinetics of a sequence
of elementary reactions that make up the reaction mechanism. In this work, we
assumed that all the elementary reactions studied are reversible. Next, all
active sites on the surface are assumed to be identical and the total number of
active sites remains constant under different reaction conditions. For the
hypothetical reaction in Equation 3.8, the elementary steps of the reaction
mechanism can be written as follow:
*A*Af1
r1
k
k (Step 1)
*B*Bf2
r2
k
k (Step 2)
**AB*B*Af3
r3
k
k (Step 3)
*AB*ABf4
r4
k
k (Step 4)
where * is the empty active sites on the surface. Steps 1 and 2 represent the
adsorption of the reactants, Step 3 is the surface reaction forming the product
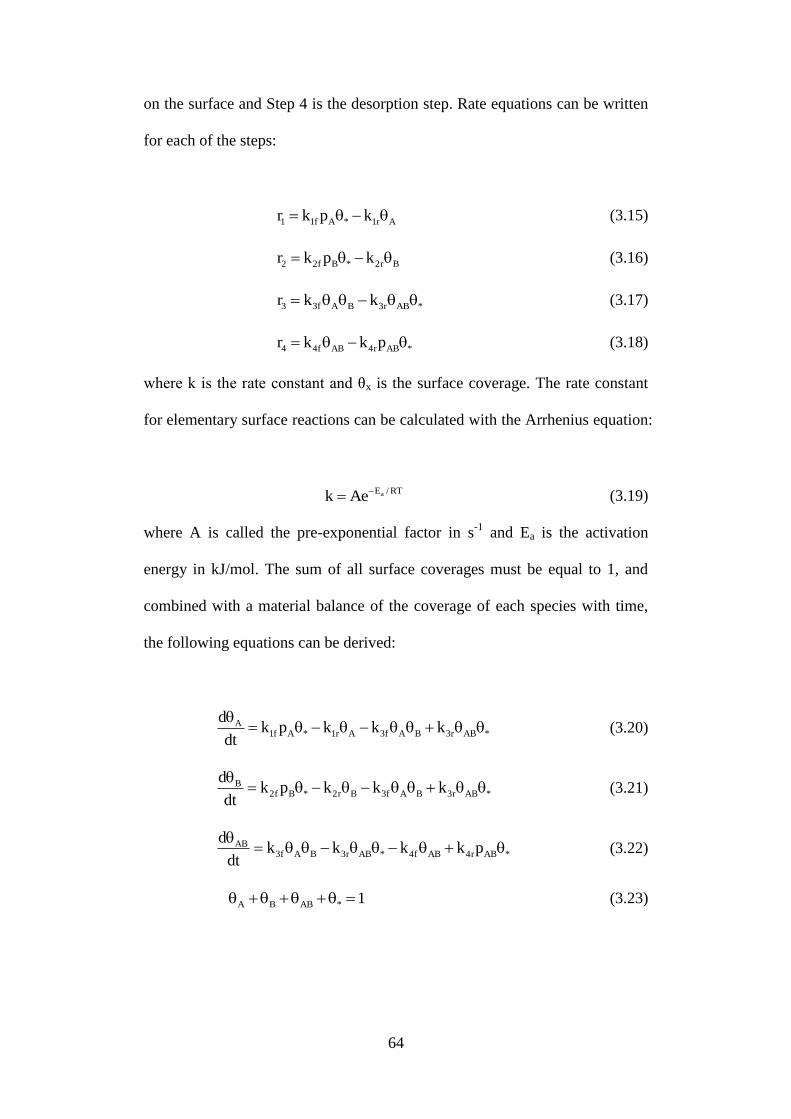
64
on the surface and Step 4 is the desorption step. Rate equations can be written
for each of the steps:
1 1f A * 1r Ar k p k
(3.15)
2 2f B * 2r Br k p k (3.16)
3 3f A B 3r AB *r k k (3.17)
4 4f AB 4r AB *r k k p (3.18)
where k is the rate constant and θx is the surface coverage. The rate constant
for elementary surface reactions can be calculated with the Arrhenius equation:
aE / RTk Ae
(3.19)
where A is called the pre-exponential factor in s-1
and Ea is the activation
energy in kJ/mol. The sum of all surface coverages must be equal to 1, and
combined with a material balance of the coverage of each species with time,
the following equations can be derived:
A1f A * 1r A 3f A B 3r AB *
dk p k k k
dt
(3.20)
B2f B * 2r B 3f A B 3r AB *
dk p k k k
dt
(3.21)
AB3f A B 3r AB * 4f AB 4r AB *
dk k k k p
dt
(3.22)
A B AB * 1 (3.23)
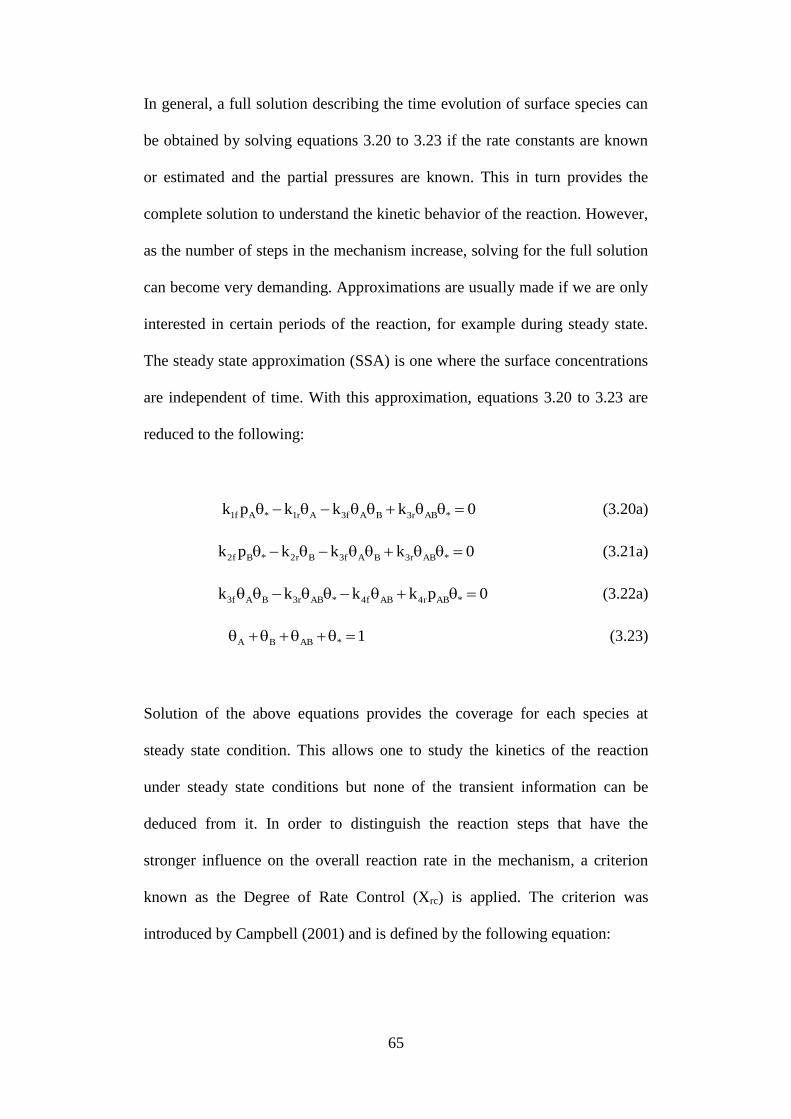
65
In general, a full solution describing the time evolution of surface species can
be obtained by solving equations 3.20 to 3.23 if the rate constants are known
or estimated and the partial pressures are known. This in turn provides the
complete solution to understand the kinetic behavior of the reaction. However,
as the number of steps in the mechanism increase, solving for the full solution
can become very demanding. Approximations are usually made if we are only
interested in certain periods of the reaction, for example during steady state.
The steady state approximation (SSA) is one where the surface concentrations
are independent of time. With this approximation, equations 3.20 to 3.23 are
reduced to the following:
1f A * 1r A 3f A B 3r AB *k p k k k 0 (3.20a)
2f B * 2r B 3f A B 3r AB *k p k k k 0 (3.21a)
3f A B 3r AB * 4f AB 4r AB *k k k k p 0 (3.22a)
A B AB * 1 (3.23)
Solution of the above equations provides the coverage for each species at
steady state condition. This allows one to study the kinetics of the reaction
under steady state conditions but none of the transient information can be
deduced from it. In order to distinguish the reaction steps that have the
stronger influence on the overall reaction rate in the mechanism, a criterion
known as the Degree of Rate Control (Xrc) is applied. The criterion was
introduced by Campbell (2001) and is defined by the following equation:

66
i
ii,rc
k
R
R
kX
(3.24)
where ki is the rate constant of a step i in the mechanism and R is the overall
rate of the reaction. Campbell’s method works by increasing both the forward
and reverse rate coefficient of a step in the mechanism by 1% while the
remaining steps are kept unchanged, so that the equilibrium is not affected.
Then the change in the overall TOF is computed. The percentage increase in
overall rate due to the 1% increment in rate constant for the particular step is
the degree of rate control for that step. The degree of rate control for each step
(Xrc,i) takes the value of between 0 and 1 and the sum of all degrees of rate
control must be unity. More than one step can take a positive value for Xrc,i
and hence, there can be more than one rate-controlling steps. Reaction steps
that have a larger Xrc value will have a bigger influence on the overall rate of
the reaction (i.e. more rate-controlling). Campbell suggests that a reaction step
can be considered rate-determining if Xrc takes a value that is greater or equals
to 0.95. However, a step can be assumed to be near rate-determining if its Xrc
is greater than 0.6.
67
3.4 Experimental methods
In this section, we discuss the steps and the procedures for catalyst synthesis,
characterizing and testing.
3.4.1 Catalyst synthesis
Cobalt-based catalysts supported on γ-Al2O3 are synthesized using the method
of slurry impregnation (van de Loosdrecht et al., 2003). The support, γ-Al2O3,
is impregnation with Co nitrate ((Co(NO3)2.6 H2O, Sigma-Aldrich, 98 %)
dissolved in de-ionized water to produce a Co loading of 10 wt%. The
support has a specific surface area of 315 m2/g, specific pore volume of 0.41
cm3/g and an average pore diameter of 5.2 nm as measured by BET. The
resultant mixture is attached to a rotary evaporator (Buchi R-205) and rotates
at a rate of 100 rpm at room temperature with a temperature bath control
(Buchi B-490) for 2 hours at 800 mbar. Subsequently, the temperature is
increased to 353 K and pressure reduced to 100 mbar to evaporate excess
moisture. After about 3 hours, when a semi-dried mixture is achieved, it is
transferred to an oven to dry overnight at 373 K. Small amounts (0.1 wt%) of
platinum (Pt(NH3)4(NO3)2, Sigma-Aldrich, 99 %) were introduced during the
slurry impregnation step to improve the reducibility of the Co catalyst.
Dried samples were retrieved from the oven and transferred to large crucibles
for calcination in a stationary furnace (Carbolite RWF 1200). The bed height
of samples in the crucibles was kept below 0.5 cm to ensure uniform heat
transfer. The samples were heated in air at a rate 1 K/min till 393 K. After
68
which the temperature is maintained for 1 hour to remove remaining moisture.
Next, the temperature was increased to 673 K at a rate of 1 K/min and kept at
673 K for 2 hours of calcination. This temperature ensures a complete
decomposition of the cobalt nitrate precursors to cobalt oxide. To produce
boron promoted Co/γ-Al2O3 catalysts, a second slurry impregnation step using
aqueous boric acid (H3BO3, Sigma-Aldrich, 99 %) was carried out to produce
the boron required loading (e.g., 0.5 wt%). The samples are then calcined
following the procedure we have just discussed.
3.4.2 Temperature Programmed Reduction (TPR)
Temperature programmed reduction (TPR) (TPDRO 1100 Catalyst analyzer
system, Thermo Electron Corporation) is performed to study the reducibility
of the Co/γ-Al2O3 catalysts. Approximately 0.05 g of the calcined catalyst was
loaded into the sample holder. During the pre-treatment of the sample, the
sample was dried at 393 K for 1 hour to remove any adsorbed moisture before
the temperature is raised to 673 K for another 1 hour. This is done to ensure a
complete decomposition of the Co nitrate precursors after which the sample is
cooled to 298 K. The TPR profile was recorded at 50 Nml/min with a feed gas
of 5% H2/Ar and temperature of up to 850 ºC at a rate of 10 ºC/min.
69
3.4.3 Reactor tests
To test the activity, selectivity and deactivation of the Co catalysts, a parallel
micro fixed bed reactor setup was used. A picture of the setup and a simple
process flow diagram is shown in Figure 3.3. The reactor is a 0.5 m stainless
steel tube with an internal diameter of 1 cm. It is equipped with a single zone
heater and a “K” type thermocouple was place inside a thermo-well to
measure the temperature of the catalyst bed. The flow rates of CO and H2 is
regulated by Brooks SLA5850S thermal mass flow controllers. The pressure
of the reactor was controlled manually with a Swagelok KPB series back
pressure regulator. After the reactor, two traps were installed to capture
condensed wax in the products. The hot trap temperature is set at 373 K and
the cold trap is maintained at room temperature. The lighter products that pass
through the traps were analyzed online with an Agilent 7890 GC that is
equipped with Thermal Conductivity Detector (TCD) and Flame Ionization
Detector (FID). Sample of the wax collected from the traps were analyzed
offline with a high temperature Shimadzu GC 2010 in order to determine the
yields of C14+ hydrocarbons.
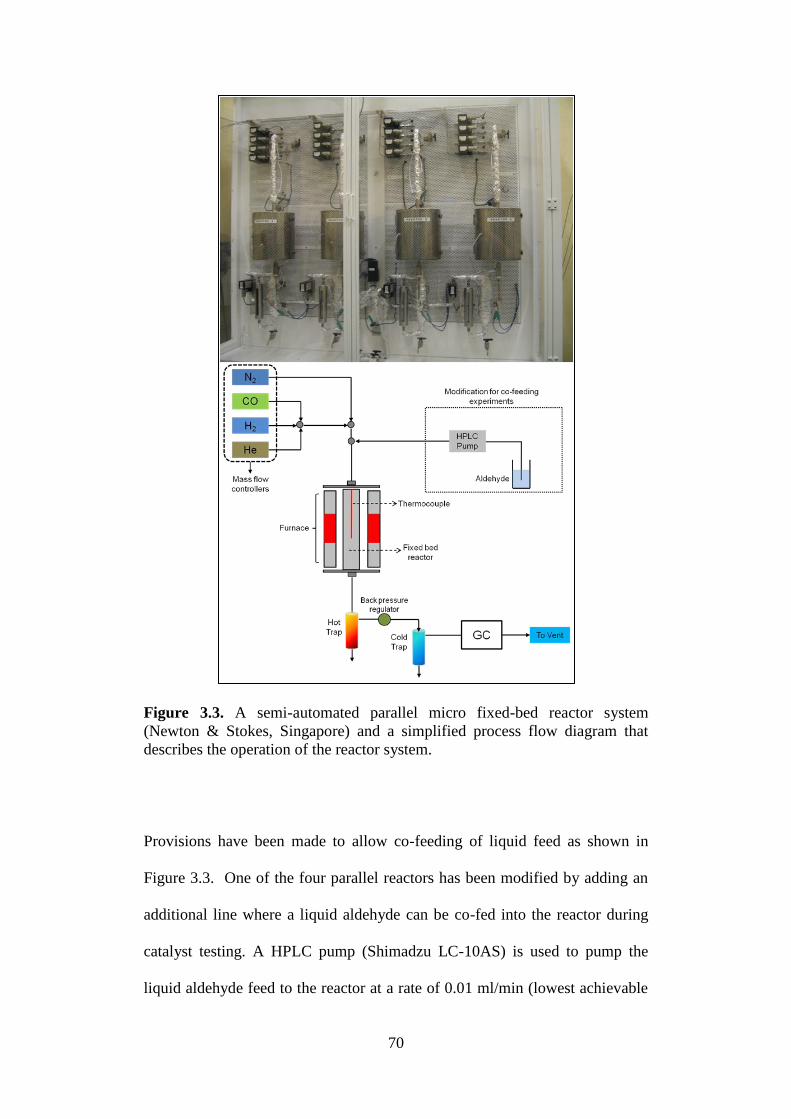
70
Figure 3.3. A semi-automated parallel micro fixed-bed reactor system
(Newton & Stokes, Singapore) and a simplified process flow diagram that
describes the operation of the reactor system.
Provisions have been made to allow co-feeding of liquid feed as shown in
Figure 3.3. One of the four parallel reactors has been modified by adding an
additional line where a liquid aldehyde can be co-fed into the reactor during
catalyst testing. A HPLC pump (Shimadzu LC-10AS) is used to pump the
liquid aldehyde feed to the reactor at a rate of 0.01 ml/min (lowest achievable
71
rate on the pump). Preheating in the section before the reactor has been set at
393 K to ensure the aldehyde vaporizes before entering the reactor.
About 1 g of the catalyst with a particle size of 210 to 300 μm is used during
catalyst testing. To avoid temperature gradients, the catalyst was diluted with
about 3 g of silicon carbide (SiC) (1:2 v/v) of the same particle size range.
During the reaction, the thermocouple was moved inside the thermo-well to
ensure the temperature gradient over the catalyst bed is kept below 1 K. The
catalyst was reduced in-situ for 12 hours under H2 flow of 50 Nml/min at 723
K after which the reactor was cooled to 393 K. Then CO and H2 gas were
introduced at a molar ratio of 1:2 to give a W/Ftotal of 7.5 gcat h/mol. The
reactor was brought to a pressure of 20 bar before the temperature was raised
to 493 K at a rate of 1 K/min. A typical test duration for the catalyst was 48
hours after which the temperature was brought to 393 K under syngas flow.
Then the catalyst was removed from the reactor and separated from the SiC
using a magnet for characterization. With the results obtained from the GC
analysis, we are able to calculate the CO conversion and the product
selectivity. This is illustrated in the example found in Appendix A.
72
3.5 References
Blöchl, P. E. Phys. Rev. B 1994, 50, 17953.
Campbell, C. T. J. Catal. 2001, 204, 520.
CCCBDB Computational Chemistry Comparison and Benchmark Database.
N.p., n.d. Web. http://cccbdb.nist.gov/, Last accessed: 20 Sep 2012.
Davidson, E.R., In Diercksen, G.H.F., and Wilson, S., eds., “Methods in
Computational molecular Physics”, vol. 113 of NATO Advanced Study
Institute, Series C: Mathematical and Physical Science, Plenum, New York,
1983 p. 95.
Feibelman, P. J.; Hammer, B.; Nørskov, J. K.; Wagner, F.; Scheffler, M.;
Stumpf, R.; Watwe, R.; Dumesic, J. J. Phys. Chem. B 2001, 105, 4018.
Herington, E.F.G. Chem. Ind.1946, 346.
Hohenberg, H.; Kohn, W. Phys. Rev. 1965, 136B, 864.
Jόnsson, H.; Mills, G.; Jacobsen, K.W. in: B.J. Berne, G. Ciccotti, D.F. Coker
(Eds), “Classical and Quantum Dynamics in Condensed Phase Simulations”
World Scientific, Singapore, 1998, p. 385.
Koch, W.; Holthausen, M. C. “A Chemist’s Guide to Density Functional
Theory” Wiley-VCH, 2001, p.3.
Kohn, W.; Sham, L.J. Phys. Rev. 1965, 140A, 1133.
Kohn, W. Rev. Mod. Phys. 1999, 71, 1253.
Kresse, G.; Hafner, J. Phys. Rev. B 1993, 47, 558.
Kresse, G.; Hafner, J. Phys. Rev. B 1993, 48, 13115.
Kresse, G.; Hafner, J. J. Phys. Condens. Matter 1994, 6, 8245.
Kresse, G., and Furthmüller, J. Phys. Rev. B 1996, 54, 11169.
73
Kresse, G., and Furthmüller, J. Comput. Mater. Sci. 1996, 6, 15.
Mills, G.; Jόnsson, H. Phys. Rev. Lett. 1994, 72, 1124.
McQuarrie, D. A. “Statistical Mechanics” University Science Books, 2000, p.
91.
Mason, S. E.; Grinberg, I.; Rappe, A. M. Phys. Rev. B 2004, 69, 161401.
NIST Chemistry WebBook. Web. http://webbook.nist.gov/chemistry/, Last
accessed: 25 Dec 2012.
Perdew, J. P.; Burke, K.; Ernzerhof, M. Phys. Rev. Lett. 1996, 77, 3865
Pick, Š. Surf. Sci. 2007, 601, 5571.
Pulay, P. Chem. Phys. Lett. 1980, 73, 393.
Schrödinger, E. Phys. Rev. 1926, 28, 1049.
Teter, M.P., Payne, M.C., and Allan, D.C. Phys. Rev. B. 1989, 40, 12255.
Vanderbilt, D. Phys. Rev. B. 1990, 41, 7892.
van de Loosdrecht, J.; Barradas, S.; Caricato, E. A.; Ngwenya, N. G.;
Nkwanyana, P. S.; Rawat, M. A. S.; Sigwebela, B. H.; van Berge, P. J.;
Visagie, J. L. Top. Catal. 2003, 26, 121.
74
CHAPTER 4
CO SURFACE COVERAGE AND STABILITY OF
INTERMEDIATES ON A Co CATALYST
4.1 Introduction
Surface science studies discussed in Chapter 2 provided evidences that CO
forms stable surface adsorption configurations on the Co surface, and a high
CO coverage is expected during FT synthesis. The high CO coverage is also
expected to affect the reaction energies and the stability of the intermediates,
but few DFT studies on FT synthesis have accounted for this coverage effect.
Hence, in this chapter, we study the adsorption of CO at different coverages
on a model p(3×3) Co(0001) surface, and use Gibbs free energy calculations
to determine the equilibrium CO coverage on Co(0001) under FT conditions.
The possible stable adsorption configurations of CO on Co(0001) terrace
surface models will first be evaluated. Next, we apply the procedure discussed
in Section 3.2 to develop the (pCO,T) stability diagram of CO on Co(0001).
From the stability diagram, we are able to determine the stable coverage of CO
under FT conditions. Next, we study the effect of a realistic CO coverage on
the stability of adsorbed hydrogen and of the possible reaction intermediates in
the proposed mechanisms.
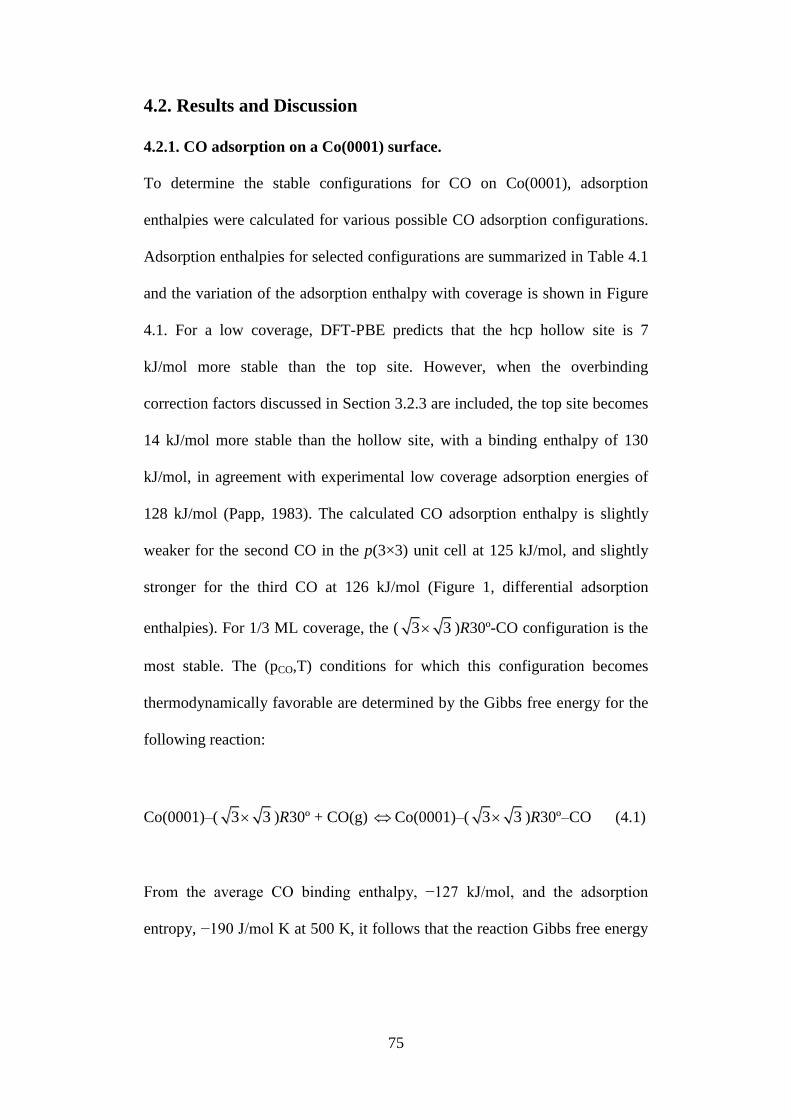
75
4.2. Results and Discussion
4.2.1. CO adsorption on a Co(0001) surface.
To determine the stable configurations for CO on Co(0001), adsorption
enthalpies were calculated for various possible CO adsorption configurations.
Adsorption enthalpies for selected configurations are summarized in Table 4.1
and the variation of the adsorption enthalpy with coverage is shown in Figure
4.1. For a low coverage, DFT-PBE predicts that the hcp hollow site is 7
kJ/mol more stable than the top site. However, when the overbinding
correction factors discussed in Section 3.2.3 are included, the top site becomes
14 kJ/mol more stable than the hollow site, with a binding enthalpy of 130
kJ/mol, in agreement with experimental low coverage adsorption energies of
128 kJ/mol (Papp, 1983). The calculated CO adsorption enthalpy is slightly
weaker for the second CO in the p(3×3) unit cell at 125 kJ/mol, and slightly
stronger for the third CO at 126 kJ/mol (Figure 1, differential adsorption
enthalpies). For 1/3 ML coverage, the ( 3 3 )R30º-CO configuration is the
most stable. The (pCO,T) conditions for which this configuration becomes
thermodynamically favorable are determined by the Gibbs free energy for the
following reaction:
Co(0001)–( 3 3 )R30º + CO(g) Co(0001)–( 3 3 )R30º–CO (4.1)
From the average CO binding enthalpy, −127 kJ/mol, and the adsorption
entropy, −190 J/mol K at 500 K, it follows that the reaction Gibbs free energy
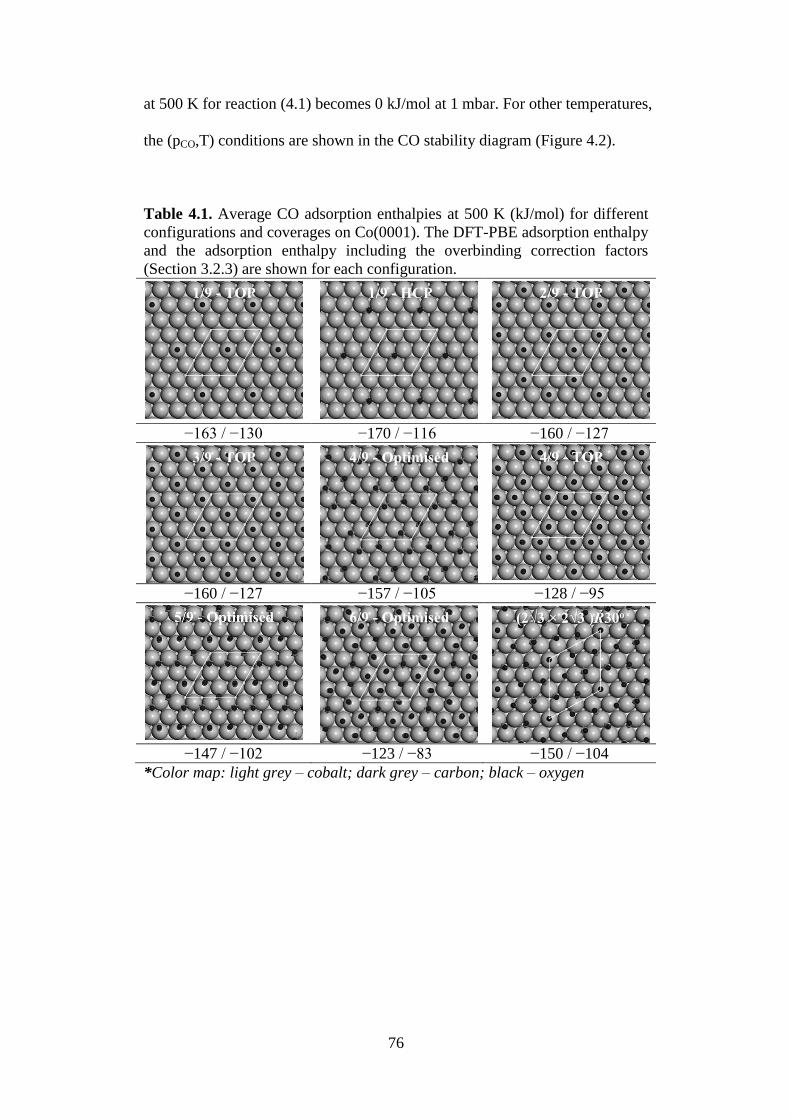
76
at 500 K for reaction (4.1) becomes 0 kJ/mol at 1 mbar. For other temperatures,
the (pCO,T) conditions are shown in the CO stability diagram (Figure 4.2).
Table 4.1. Average CO adsorption enthalpies at 500 K (kJ/mol) for different
configurations and coverages on Co(0001). The DFT-PBE adsorption enthalpy
and the adsorption enthalpy including the overbinding correction factors
(Section 3.2.3) are shown for each configuration.
−163 / −130 −170 / −116 −160 / −127
−160 / −127 −157 / −105 −128 / −95
−147 / −102 −123 / −83 −150 / −104
*Color map: light grey – cobalt; dark grey – carbon; black – oxygen
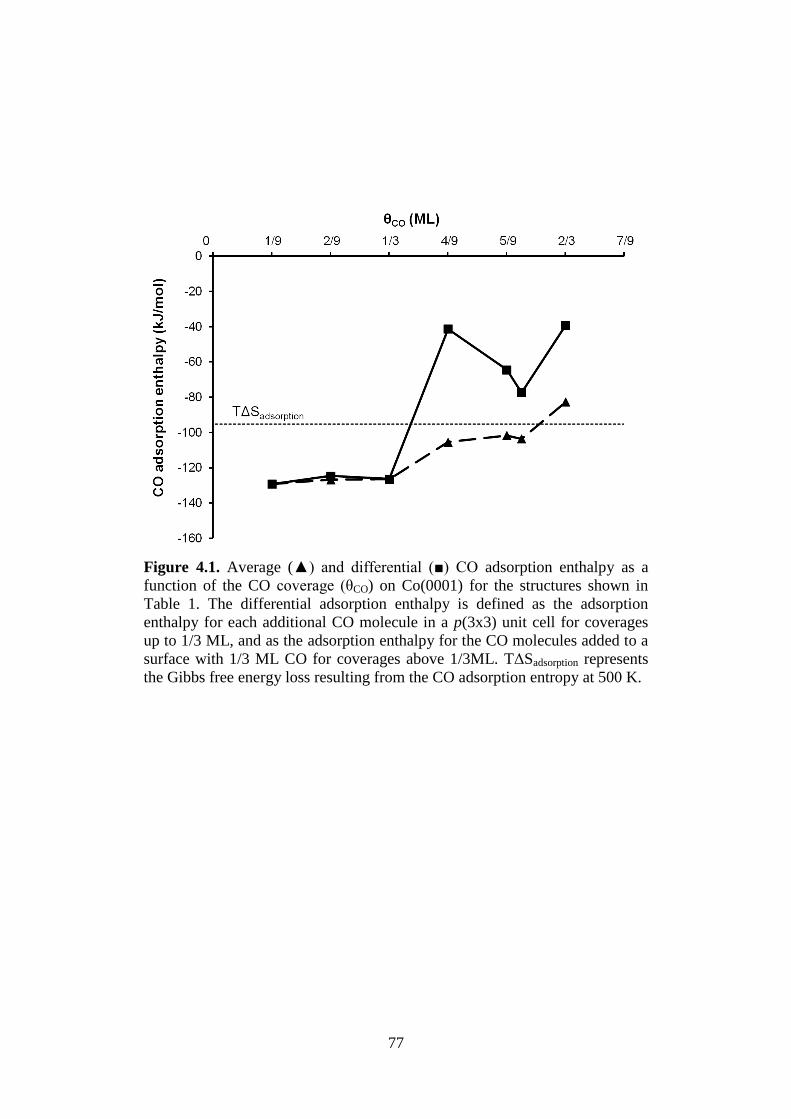
77
Figure 4.1. Average (▲) and differential (■) CO adsorption enthalpy as a
function of the CO coverage (θCO) on Co(0001) for the structures shown in
Table 1. The differential adsorption enthalpy is defined as the adsorption
enthalpy for each additional CO molecule in a p(3x3) unit cell for coverages
up to 1/3 ML, and as the adsorption enthalpy for the CO molecules added to a
surface with 1/3 ML CO for coverages above 1/3ML. TΔSadsorption represents
the Gibbs free energy loss resulting from the CO adsorption entropy at 500 K.
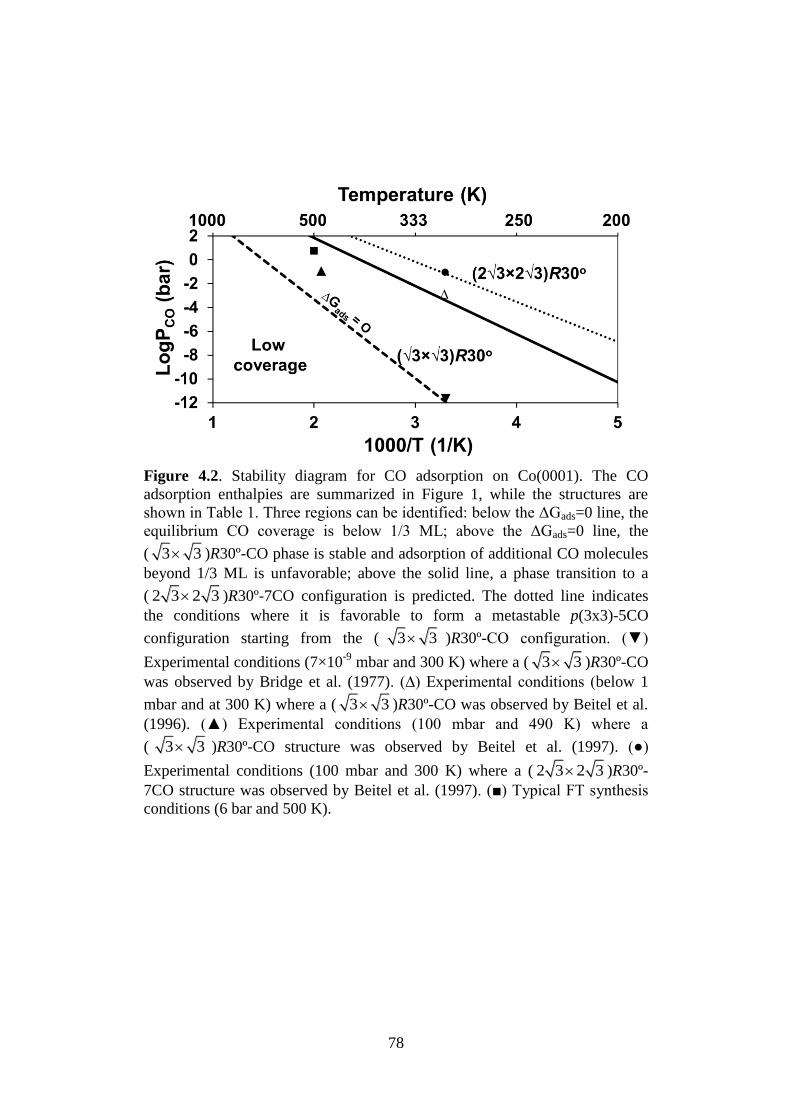
78
Figure 4.2. Stability diagram for CO adsorption on Co(0001). The CO
adsorption enthalpies are summarized in Figure 1, while the structures are
shown in Table 1. Three regions can be identified: below the ΔGads=0 line, the
equilibrium CO coverage is below 1/3 ML; above the ΔGads=0 line, the
( 3 3 )R30º-CO phase is stable and adsorption of additional CO molecules
beyond 1/3 ML is unfavorable; above the solid line, a phase transition to a
( 2 3 2 3 )R30º-7CO configuration is predicted. The dotted line indicates
the conditions where it is favorable to form a metastable p(3x3)-5CO
configuration starting from the ( 3 3 )R30º-CO configuration. (▼)
Experimental conditions (7×10⁻⁹
mbar and 300 K) where a ( 3 3 )R30º-CO
was observed by Bridge et al. (1977). (∆) Experimental conditions (below 1
mbar and at 300 K) where a ( 3 3 )R30º-CO was observed by Beitel et al.
(1996). (▲) Experimental conditions (100 mbar and 490 K) where a
( 3 3 )R30º-CO structure was observed by Beitel et al. (1997). (●)
Experimental conditions (100 mbar and 300 K) where a ( 2 3 2 3 )R30º-
7CO structure was observed by Beitel et al. (1997). (■) Typical FT synthesis
conditions (6 bar and 500 K).
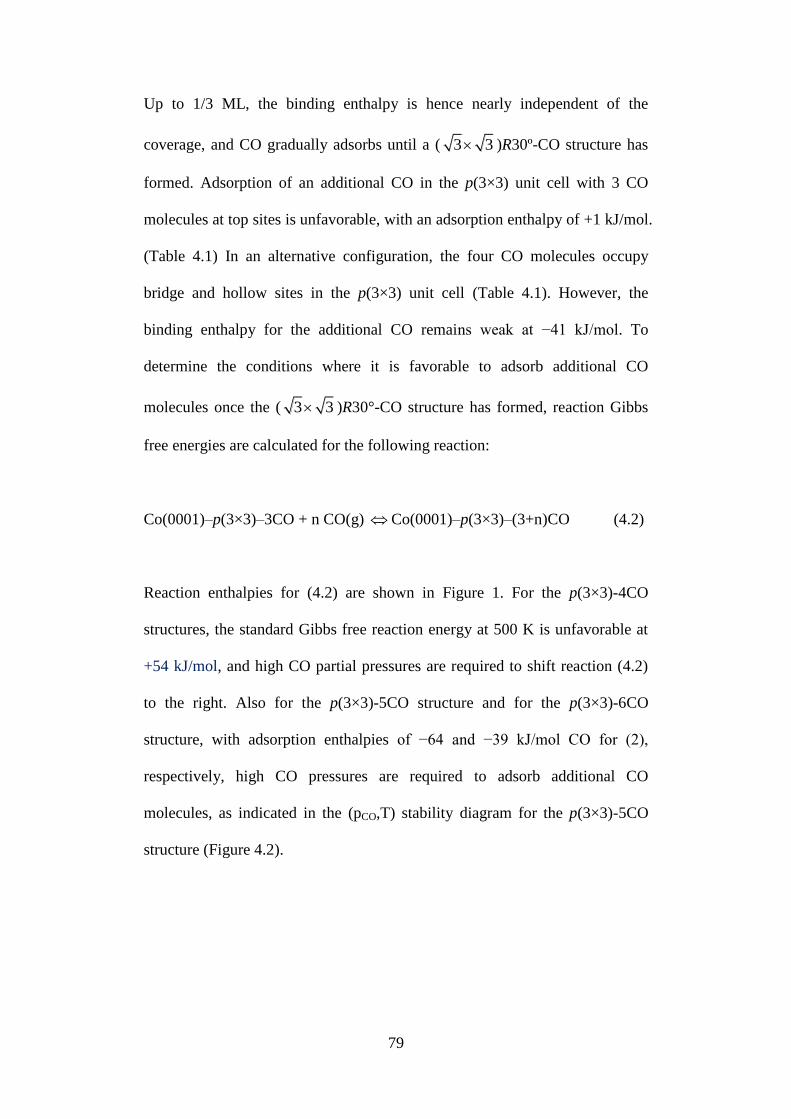
79
Up to 1/3 ML, the binding enthalpy is hence nearly independent of the
coverage, and CO gradually adsorbs until a ( 3 3 )R30º-CO structure has
formed. Adsorption of an additional CO in the p(3×3) unit cell with 3 CO
molecules at top sites is unfavorable, with an adsorption enthalpy of +1 kJ/mol.
(Table 4.1) In an alternative configuration, the four CO molecules occupy
bridge and hollow sites in the p(3×3) unit cell (Table 4.1). However, the
binding enthalpy for the additional CO remains weak at −41 kJ/mol. To
determine the conditions where it is favorable to adsorb additional CO
molecules once the ( 3 3 )R30°-CO structure has formed, reaction Gibbs
free energies are calculated for the following reaction:
Co(0001)–p(3×3)–3CO + n CO(g) Co(0001)–p(3×3)–(3+n)CO (4.2)
Reaction enthalpies for (4.2) are shown in Figure 1. For the p(3×3)-4CO
structures, the standard Gibbs free reaction energy at 500 K is unfavorable at
+54 kJ/mol, and high CO partial pressures are required to shift reaction (4.2)
to the right. Also for the p(3×3)-5CO structure and for the p(3×3)-6CO
structure, with adsorption enthalpies of −64 and −39 kJ/mol CO for (2),
respectively, high CO pressures are required to adsorb additional CO
molecules, as indicated in the (pCO,T) stability diagram for the p(3×3)-5CO
structure (Figure 4.2).
80
LEED and PM-RAIRS experiments show that CO forms a ( 2 3 2 3 )R30º-
7CO structure at sufficiently high CO partial pressures (Papp, 1983; Beitel et
al., 1996; 1997). We therefore evaluated the stability of this structure with a
7/12 ML coverage. In this structure, 6 CO molecules occupy bridge sites and 1
CO molecule occupies a top site (Table 4.1). The CO molecules at the bridge
sites tilt slightly by about 12º. Interestingly, the average adsorption enthalpy of
−104 kJ/mol is stronger than for both a lower 5/9 ML and a higher 6/9 ML
coverage, and the average adsorption enthalpy is hence not a monotonous
function of the CO coverage (Figure 4.1). Using the calculated adsorption
enthalpy, the (pCO,T) conditions for which the ( 3 3 )R30º-CO structure
converts to the ( 2 3 2 3 )R30º-7CO structure are found from reaction (4.3).
Note that the ( 3 3 )R30º-CO
structure is equivalent to the
( 2 3 2 3 )R30º-4CO structure.
Co(0001)–( 2 3 2 3 )R30º–4CO + 3 CO(g)
Co(0001)–( 2 3 2 3 )R30º–7CO (4.3)
The (pCO,T) conditions are shown in Figure 4.2, and occur at a lower pCO and
higher temperature than calculated for the transition to the structure with a
lower coverage of 5/9 ML. This boundary hence represents a phase transition
from the ( 3 3 )R30º-CO structure to the ( 2 3 2 3 )R30º-7CO structure,
and is associated with a sudden change in the CO adsorption enthalpy.
81
The (pCO,T) stability diagram in Figure 4.2 suggests that there are three
regimes. At low pressures and high temperatures the CO coverage is low. The
CO coverage builds up gradually following a single-site Langmuir isotherm
with nearly constant adsorption enthalpy until a ( 3 3 )R30º-CO structure
is formed for CO pressures above 1 mbar at 500 K. Adsorption of additional
CO molecules is unfavorable, until the CO pressure reaches 100 bar, where a
phase transition to the ( 2 3 2 3 )R30º-7CO configuration is predicted. The
stability line for the lower 5/9 ML coverage lies above the phase transition line
and the 5/9 ML coverage is hence metastable. Note that the boundaries are
quite sensitive to the calculated CO adsorption enthalpies and entropies.
Indeed, a 5 kJ/mol stronger CO adsorption enthalpy or a 10 J/mol K change in
the adsorption entropy at 500 K shifts the boundary for the ( 2 3 2 3 )R30º-
7CO configuration by 30 K.
The first principle-based stability diagram can be compared with experimental
data. Four experimental data points are shown in Figure 4.2. Using PM-
RAIRS, Beitel et al. (1996) observed a ( 3 3 )R30º structure with CO at
the top sites for pressures up to 1 mbar and at room temperature. These
conditions indeed fall on the phase transition line of the ( 3 3 )R30o-CO
structure (Δ, Figure 2). When the CO pressure was increased to 300 mbar, a
( 2 3 2 3 )R30o structure was observed (Beitel et al., 1996). These
conditions fall within the ( 2 3 2 3 )R30o-7CO region of the stability
diagram (•). When the temperature was subsequently increased, the
82
( 2 3 2 3 )R30o structure transformed back to the ( 3 3 )R30º structure
above 490 K (Beitel et al., 1997). This transition is also consistent with the
stability diagram (▲). The stability diagram hence allows to determine the
dominant surface structure for different (pCO,T) conditions. For temperatures
and CO pressures during FT synthesis, the ( 3 3 )R30º-CO structure is
found to be the most stable (■, Figure 4.2), though the reaction conditions are
fairly close to the 7/12 ML region. The stability diagram is consistent with the
observed close-to-zero CO reaction order (Ojeda et al., 2010; Ribeiro et al.,
1997). As discussed, once the ( 3 3 )R30º-CO structure has formed,
adsorption of additional CO molecules is unfavorable, and the surface is
saturated with CO. Indeed, to adsorb additional CO molecules, the pressure
needs to increase to above 100 bar to reach the ( 2 3 2 3 )R30º-7CO
stability region. In the subsequent sections of this chapter and Chapter 6, we
will therefore use the p(3×3)-3CO structure as the representative surface
structure under FT conditions, and evaluate the effect of a 1/3 ML coverage on
the stability of the reactants, intermediates and transition states for the CO
insertion mechanism. It should however be noted that the surface structure is
likely more complex under FT conditions, and the presence of reaction
intermediates might affect the stability diagram for adsorbed CO.
4.2.2. Hydrogen adsorption on a ( 3 3 )R30º-CO Co(0001) surface.
The second reactant in FT synthesis is hydrogen. The FT rate is close to first
order in the hydrogen partial pressure (Ojeda et al., 2010; Ribeiro et al., 1997)
and hydrogen adsorption is hence kinetically relevant. Hydrogen adsorbs
83
rather strongly on Co(0001) with an adsorption enthalpy of −121 kJ/mol at the
hcp hollow sites and of −116 kJ/mol at the fcc hollow sites. The adsorption
enthalpy decreases only slightly to −104 kJ/mol up to 5/9 ML. Similar
adsorption energies have been reported by others (Inderwildi et al., 2007;
Ojeda et al., 2010; Cheng et al., 2008). By combining the adsorption enthalpy
with the calculated H2 adsorption entropy of −132 J/mol K, a hydrogen
coverage of about 0.9 ML is obtained at 500 K and for a H2 pressure of 9 bar.
This high coverage likely cannot coexist with the 1/3 ML CO coverage
determined in the previous section.
Next, gradual hydrogen adsorption was evaluated on the p(3×3)-3CO surface
(Table 4.2). The hydrogen adsorption enthalpy of −74 kJ/mol on the hcp
hollow site of a CO-covered Co(0001) surface is 47 kJ/mol weaker than the
adsorption enthalpy on a clean Co(0001) surface due to repulsive lateral
interactions with neighboring CO molecules. Similarly, the adsorption
enthalpy at the fcc hollow sites also decreases significantly to −64 kJ/mol.
The structures in Table 2 show that CO tilts away from the hydrogen atom by
about 12º. Similar repulsive interactions between hydrogen and CO have been
reported for other closed-packed surfaces, resulting in segregation and the
formation of separate CO and H islands at low temperatures (Williams et al.,
1980; Hoge et al., 1988). However, at higher temperatures, CO and H form
mixed configurations (Beitel et al., 1997; Williams et al., 1980). The second
and third hydrogen preferentially adsorb along the CO diagonal of the p(3×3)-
3CO structure, but the average binding enthalpy gradually weakens to –64
kJ/mol and –56 kJ/mol, respectively (Figure 4.3). The hydrogen binding
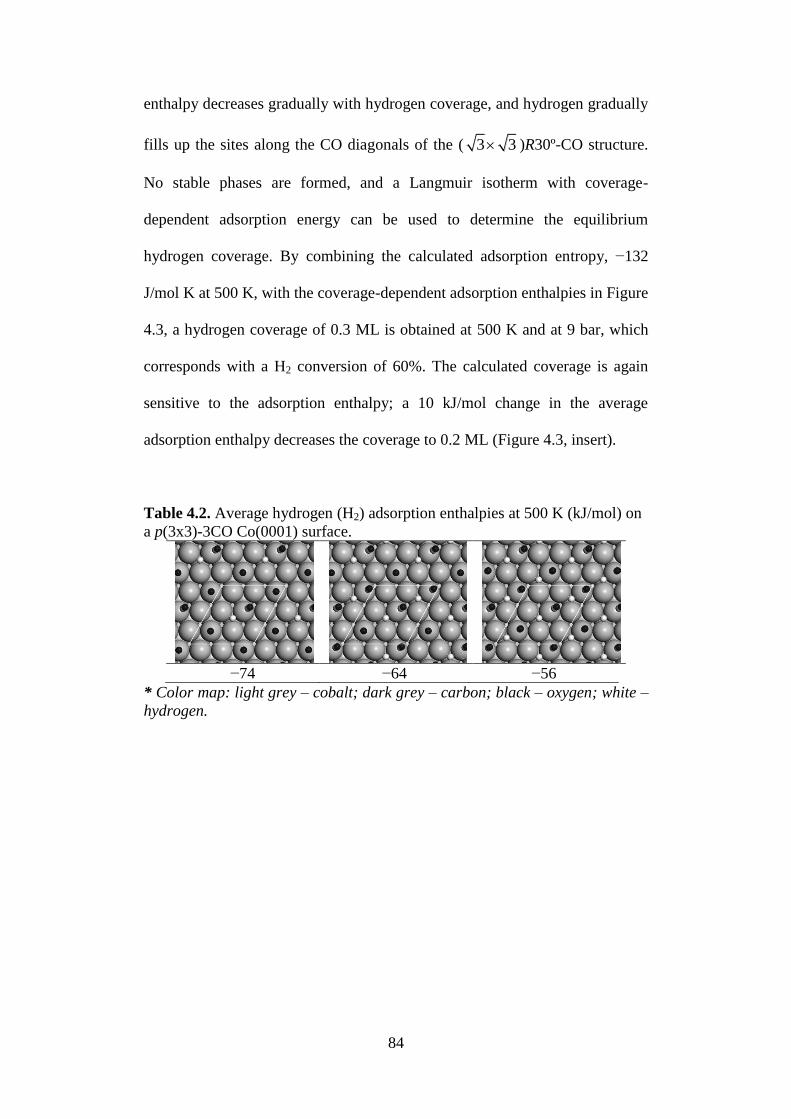
84
enthalpy decreases gradually with hydrogen coverage, and hydrogen gradually
fills up the sites along the CO diagonals of the ( 3 3 )R30º-CO structure.
No stable phases are formed, and a Langmuir isotherm with coverage-
dependent adsorption energy can be used to determine the equilibrium
hydrogen coverage. By combining the calculated adsorption entropy, −132
J/mol K at 500 K, with the coverage-dependent adsorption enthalpies in Figure
4.3, a hydrogen coverage of 0.3 ML is obtained at 500 K and at 9 bar, which
corresponds with a H2 conversion of 60%. The calculated coverage is again
sensitive to the adsorption enthalpy; a 10 kJ/mol change in the average
adsorption enthalpy decreases the coverage to 0.2 ML (Figure 4.3, insert).
Table 4.2. Average hydrogen (H2) adsorption enthalpies at 500 K (kJ/mol) on
a p(3x3)-3CO Co(0001) surface.
−74 −64 −56
* Color map: light grey – cobalt; dark grey – carbon; black – oxygen; white –
hydrogen.
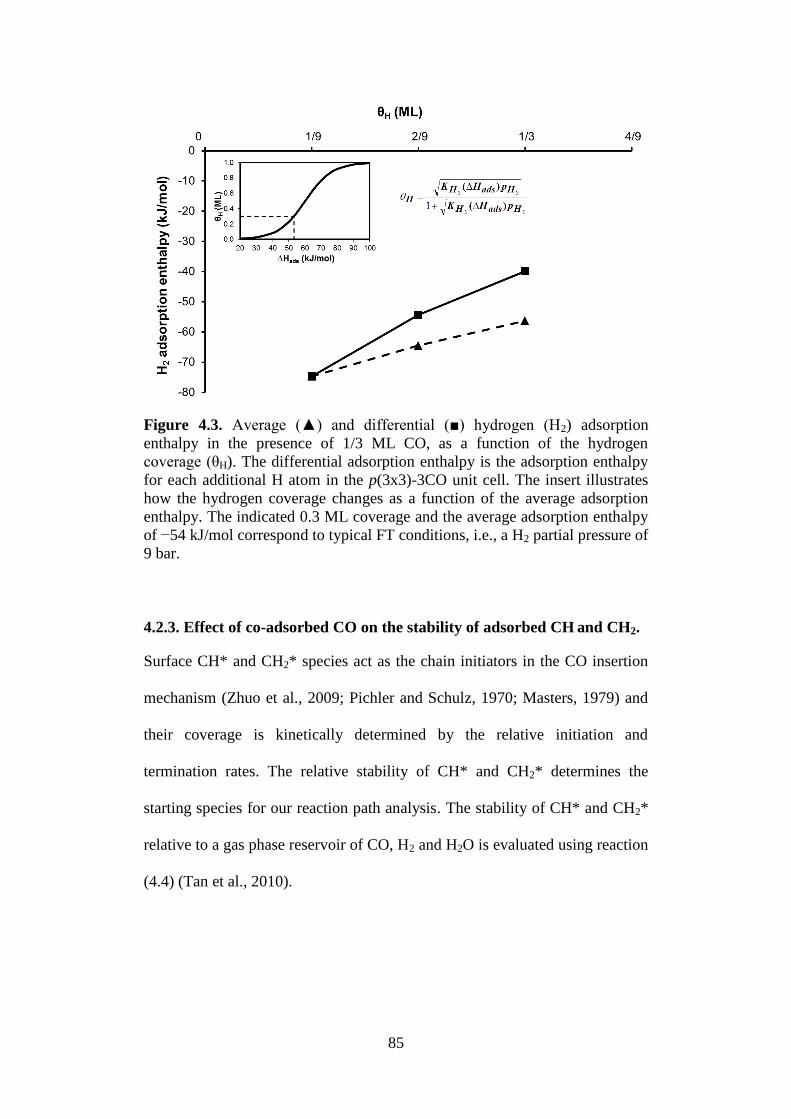
85
Figure 4.3. Average (▲) and differential (■) hydrogen (H2) adsorption
enthalpy in the presence of 1/3 ML CO, as a function of the hydrogen
coverage (θH). The differential adsorption enthalpy is the adsorption enthalpy
for each additional H atom in the p(3x3)-3CO unit cell. The insert illustrates
how the hydrogen coverage changes as a function of the average adsorption
enthalpy. The indicated 0.3 ML coverage and the average adsorption enthalpy
of −54 kJ/mol correspond to typical FT conditions, i.e., a H2 partial pressure of
9 bar.
4.2.3. Effect of co-adsorbed CO on the stability of adsorbed CH and CH2.
Surface CH* and CH2* species act as the chain initiators in the CO insertion
mechanism (Zhuo et al., 2009; Pichler and Schulz, 1970; Masters, 1979) and
their coverage is kinetically determined by the relative initiation and
termination rates. The relative stability of CH* and CH2* determines the
starting species for our reaction path analysis. The stability of CH* and CH2*
relative to a gas phase reservoir of CO, H2 and H2O is evaluated using reaction
(4.4) (Tan et al., 2010).
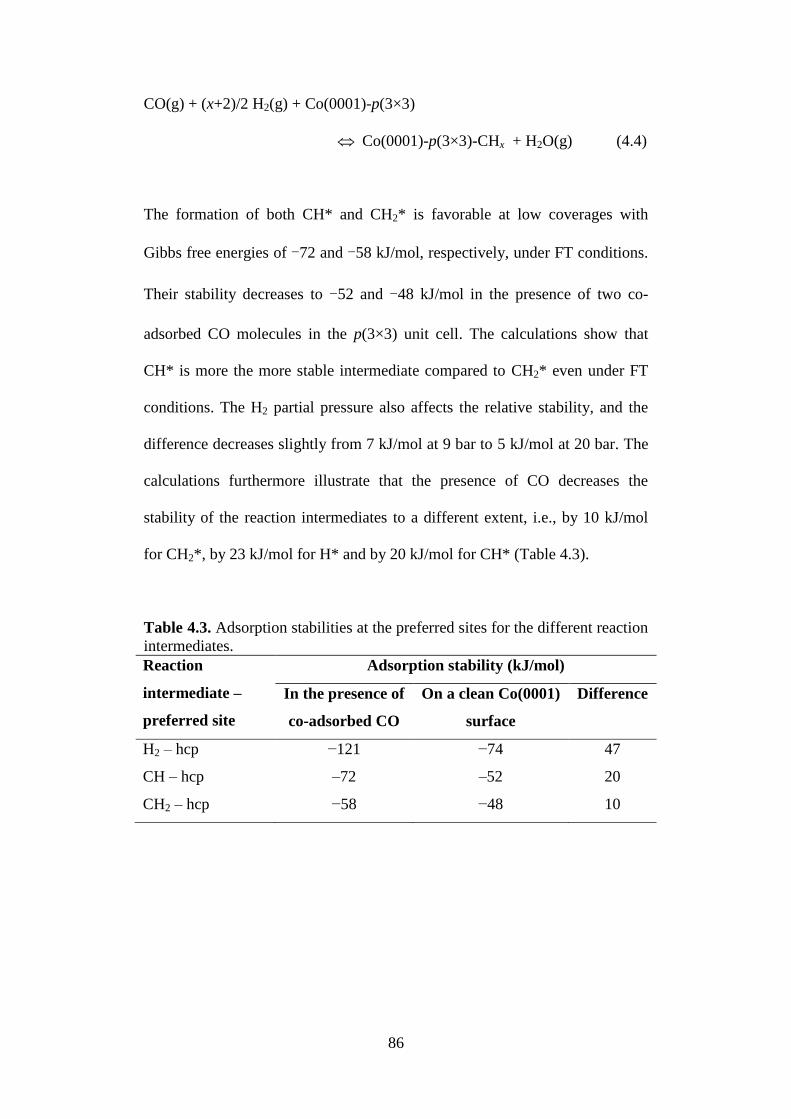
86
CO(g) + (x+2)/2 H2(g) + Co(0001)-p(3×3)
Co(0001)-p(3×3)-CHx + H2O(g) (4.4)
The formation of both CH* and CH2* is favorable at low coverages with
Gibbs free energies of ‒72 and ‒58 kJ/mol, respectively, under FT conditions.
Their stability decreases to ‒52 and ‒48 kJ/mol in the presence of two co-
adsorbed CO molecules in the p(3×3) unit cell. The calculations show that
CH* is more the more stable intermediate compared to CH2* even under FT
conditions. The H2 partial pressure also affects the relative stability, and the
difference decreases slightly from 7 kJ/mol at 9 bar to 5 kJ/mol at 20 bar. The
calculations furthermore illustrate that the presence of CO decreases the
stability of the reaction intermediates to a different extent, i.e., by 10 kJ/mol
for CH2*, by 23 kJ/mol for H* and by 20 kJ/mol for CH* (Table 4.3).
Table 4.3. Adsorption stabilities at the preferred sites for the different reaction
intermediates.
Reaction
intermediate –
preferred site
Adsorption stability (kJ/mol)
In the presence of
co-adsorbed CO
On a clean Co(0001)
surface
Difference
H2 – hcp −121 −74 47
CH – hcp –72 –52 20
CH2 – hcp −58 −48 10
87
4.3 Conclusions
The stability diagram for CO on Co(0001) was determined. In agreement with
surface science experiments, two stable phases were found: a ( 3 3 )R30o-
CO structure and a ( 2 3 2 3 )R30o-7CO structure. Under FT conditions, the
stable CO coverage is 1/3 ML. Adsorption of additional CO molecules is
unfavourable once the ( 3 3 )R30o-CO structure has formed, consistent
with a rate that is close-to-zero order in CO partial pressure. The presence of
1/3 ML CO reduces the adsorption energies of reactants, intermediates and
transition states and decreases the equilibrium hydrogen coverage from 0.9 to
0.3 ML.
88
4.4 References
Bridge, M.E.; Comrie, C.M.; Lambert, R.M. Surf. Sci. 1977, 67, 393.
Beitel, G.A.; Laskov, A.; Oosterbeek, H.; Kuipers, E.W. J. Phys. Chem. E.W.,
100, 12494.
Beitel, G.A. ; de Groot, C.P.M.; Oosterbeek, H.; Wilson, J.H. J. Phys. Chem.
B 1997, 101, 4035.
Cheng, J.; Hu, P.; Ellis, P.; French, S.; Kelly, G.; Lok, C.M. J. Catal. 2008,
257, 221.
Hoge, D.; Tüshaus, M.; Bradshaw, A.M. Surf. Sci. 1988, 207, 935.
Inderwildi, O. R.; Jenkins, S. J.; King, D. A. J. Phys. Chem. C 2007, 112, 5.
Ojeda, M. ; Nabar, R.; Milekar, A.U.; Ishikawa, A.; Mavrikakis, M.; Iglesia, E.
J. Catal. 2010, 272, 287.
Masters, C. Adv. Organomet. Chem. 1979, 17, 61.
Papp, H. Surf. Sci. 1983, 129, 205.
Pichler, H.; Schulz, H. Chem.-Ing.-Tech. 1970, 42, 1162.
Ribeiro, F.H.; Schach von Wittenau, A.E.; Bartholomew, C.H.; Somorjai, G.A.
Catal. Rev. Sci. Eng. 1997, 39, 49.
Tan, K.F.; Xu, J.; Chang, J.; Borgna, A.; Saeys, M. J. Catal. 2010, 274, 121.
Williams, E.D.; Thiel, P.A.; Weinberg, W.H.; Yates, J.T. J. Phys. Chem. 1980,
72, 3496.
Zhuo, M.; Tan, K. F.; Borgna, A.; Saeys, M. J. Phys. Chem. C 2009, 113,
8357.
89
CHAPTER 5
DENSITY FUNCTIONAL THEORY STUDY OF THE
HYDROGEN-ASSISTED CO DISSOCIATION AND
THE CO INSERTION MECHANISM FOR
FISCHER-TROPSCH SYNTHESIS OVER Co
CATALYSTS
5.1 Introduction
The proposed FT synthesis mechanisms discussed in Chapter 2 differ by the
steps involved in C–O bond scission. In the carbide mechanism (Fischer and
Tropsch, 1926), C–O dissociation occurs immediately after CO adsorption. In
the CO insertion mechanism (Pichler and Schulz, 1970; Schulz and Zein El
Deen, 1977; Masters, 1979) and in the hydrogen assisted CO activation
mechanism, C–O bond scission takes place after CO coupling with RCH and
RCH2, or after hydrogenation. However, reported barriers for CH3–CO
coupling (Cheng et al., 2008) and CO hydrogenation (Inderwildi et al, 2007)
are fairly high. Therefore, in this chapter, we will further explore the kinetics
for CO coupling with H, CH, CH2 and CH3 intermediates. Calculations
indicate that the barrier for CO coupling with RCH groups is particularly low.
Next, we consider C–O dissociation for different intermediates such as CO,
90
HCO, RCO and RCHO. Finally, we consider the hydrogenation steps that
connect the different intermediates and propose a propagation cycle. The CO
turnover frequency (TOF) for the proposed CO insertion propagation cycle is
1 to 2 orders of magnitude faster than for hydrogen-assisted CO activation.
5.2 Results and Discussion
C–O bond scission is a key step in the FT mechanism. In the next sections, the
effect of hydrogenation and CHx coupling on the C–O dissociation barrier will
be evaluated. First, we study hydrogenation of adsorbed CO, followed by the
C–O dissociation of the resultant HCO and H2CO intermediates using a
smaller p(2×2) Co(0001) unit cell. Next, barriers for CHx + CO coupling are
reported for calculations performed using a larger p(3×3) Co(0001) unit cell.
As some of the C2 intermediates adsorb via multiple adsorption sites on the
surface, a larger unit cell is required to avoid interactions between unit cells.
Hence, a larger p(3×3) unit cell is used in calculations involving C2
intermediates. Following this, the C–O dissociation barriers for various
CHxCHyO species are also calculated. To complete the propagation cycle for
the CO insertion mechanism, the hydrogenation barriers between reactions
intermediates are calculated. Finally, we discuss the results of a kinetic study
on the reactions we have studied in this Chapter and the CO turnover
frequency (TOF) is evaluated.

91
5.2.1 Effect of Hydrogenation on the C–O Dissociation Barrier
First, we consider the adsorption and direct dissociation of CO in a p(2×2)
Co(0001) unit cell. Without the correction factors for CO over-binding
(Chapter 3, Table 3.5), our calculations predict that CO adsorbs preferentially
at the hcp hollow site with an adsorption energy of -175 kJ/mol at 0.25 ML
coverage (Table 5.1). This is consistent with our results in Chapter 4 for CO
adsorption at 1/9 ML coverage and with earlier DFT studies (Ge and Neurock,
2006; Klinke et al., 1998; Gong et al., 2004). Adsorption at the top site is
calculated to be 2 kJ/mol less favourable at 0.25 ML CO coverage.
Experimentally, CO is reported to adsorb at the top sites for a (√3×√3)R30o
structure on Co(0001) (Bridge et al., 1977; Papp, 1983). DFT-PBE over-
estimates the stability of the CO 2π* orbital and, as a consequence, over-
estimates electron back-donation and the adsorption energy at the hollow site
on several transition metals (Feibelman et al, 2001; Pick, 2007). A singlet–
triplet excitation energy correction scheme can be used to correct for the over-
estimation (Mason et al, 2004), and at a coverage of 1/3 ML, this correction
reduces the adsorption energy on the hcp site by 57 kJ/mol and increases the
preference for the top site to 20 kJ/mol (Pick, 2007). Without applying the
corrections for CO adsorption, electronic energies from DFT-PBE indicate an
energy barrier of 220 kJ/mol for CO dissociation on a p(2×2) unit cell. The
reactant and transition state (TS) structures are shown in Table 5.2a. The
calculated barrier and the transition state C···O bond length, 1.84 Å, are
similar to the values reported by Ge and Neurock (2006).

92
As initially suggested by Schulz and co-workers (Pichler and Schulz, 1970;
Schulz and Zein El Deen, 1977) and recently confirmed by DFT calculations
(Inderwildi et al, 2007; Cheng et al., 2008; Zhuo et al, 2009), hydrogenation of
adsorbed CO significantly lowers the C–O dissociation barrier. Indeed, our
calculations predict a barrier of 90 kJ/mol for dissociation of HCO into CH
and O, and a barrier of 68 kJ/mol for the dissociation of H2CO into CH2 and O
(Table 5.2a). The lower barriers can be attributed to weakening of the C–O
bond by hydrogenation and to the tilting of the O atom toward the surface
(Table 5.2a). Indeed, the C–O bond tilts from 0o relative to surface normal for
CO, to 64o for HCO, and 74
o for H2CO. Dissociation of HCO and H2CO is
highly exothermic at –97 and –83 kJ/mol, respectively. The C···O bond
lengths for the HCO and H2CO transition states were 1.67 and 1.92 Å,
respectively. Our HCO dissociation barrier is similar to the value reported by
Inderwildi et al. (2007), while our H2CO dissociation barrier is lower than the
barrier reported by Inderwildi et al. (2007) and Cheng et al. (2008) but
consistent with our barrier for CH3CHO dissociation.

93
Table 5.1. Adsorption energies at the preferred sites for different reaction
intermediates calculated using a p(2×2) Co(0001) unit cell.
Species – adsorption sites Adsorption energy(kJ/mol)
H – hcp -280
C – hcp -668
O – hcp -576
CO – hcp -175
CH – hcp -623
CH2 – hcp -396
CH3 – hcp -201
HCO – hcp -214
H2CO – hcp -87
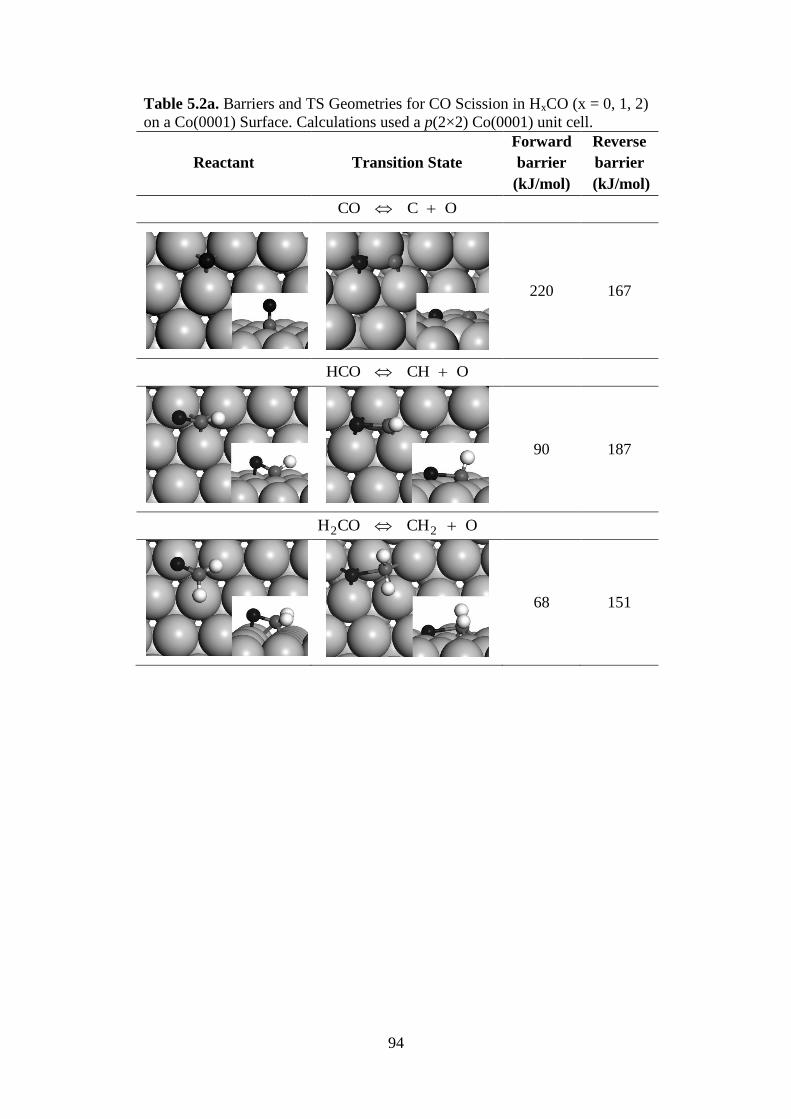
94
Table 5.2a. Barriers and TS Geometries for CO Scission in HxCO (x = 0, 1, 2)
on a Co(0001) Surface. Calculations used a p(2×2) Co(0001) unit cell.
Reactant Transition State
Forward
barrier
(kJ/mol)
Reverse
barrier
(kJ/mol)
OCCO
220 167
OCHHCO
90 187
OCHCOH 22
68 151
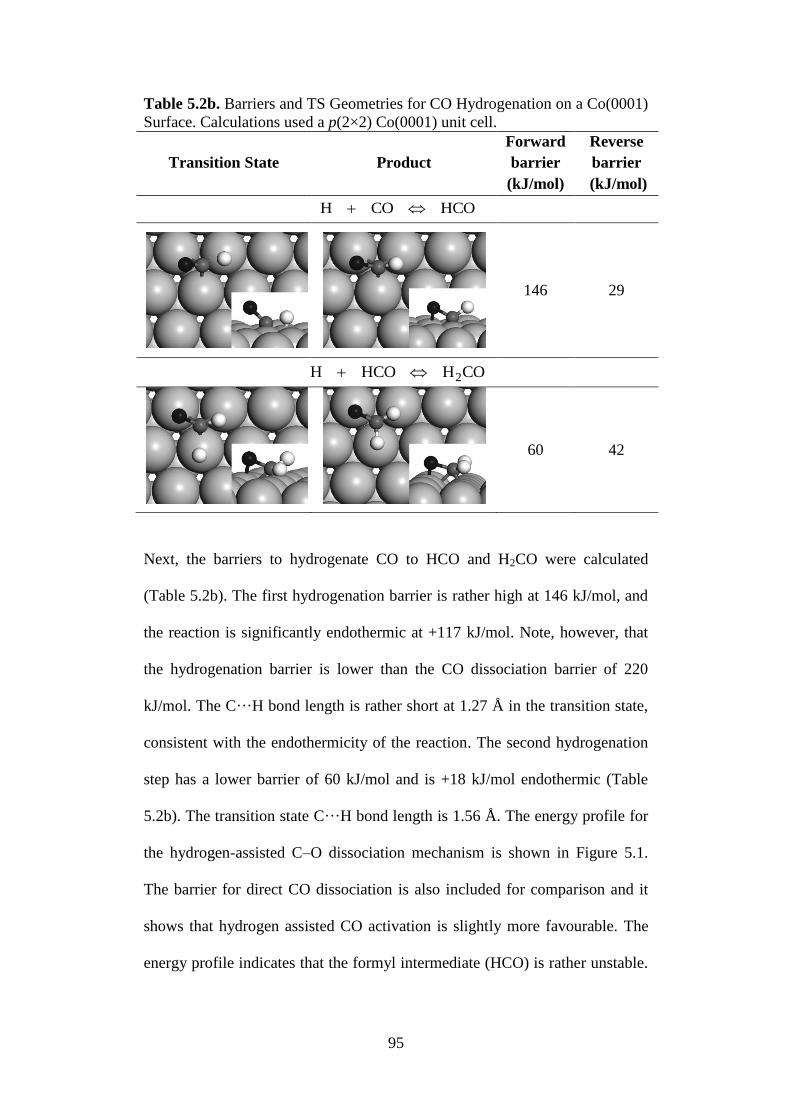
95
Table 5.2b. Barriers and TS Geometries for CO Hydrogenation on a Co(0001)
Surface. Calculations used a p(2×2) Co(0001) unit cell.
Transition State Product
Forward
barrier
(kJ/mol)
Reverse
barrier
(kJ/mol)
HCOCOH
146 29
COHHCOH 2
60 42
Next, the barriers to hydrogenate CO to HCO and H2CO were calculated
(Table 5.2b). The first hydrogenation barrier is rather high at 146 kJ/mol, and
the reaction is significantly endothermic at +117 kJ/mol. Note, however, that
the hydrogenation barrier is lower than the CO dissociation barrier of 220
kJ/mol. The C···H bond length is rather short at 1.27 Å in the transition state,
consistent with the endothermicity of the reaction. The second hydrogenation
step has a lower barrier of 60 kJ/mol and is +18 kJ/mol endothermic (Table
5.2b). The transition state C···H bond length is 1.56 Å. The energy profile for
the hydrogen-assisted C–O dissociation mechanism is shown in Figure 5.1.
The barrier for direct CO dissociation is also included for comparison and it
shows that hydrogen assisted CO activation is slightly more favourable. The
energy profile indicates that the formyl intermediate (HCO) is rather unstable.
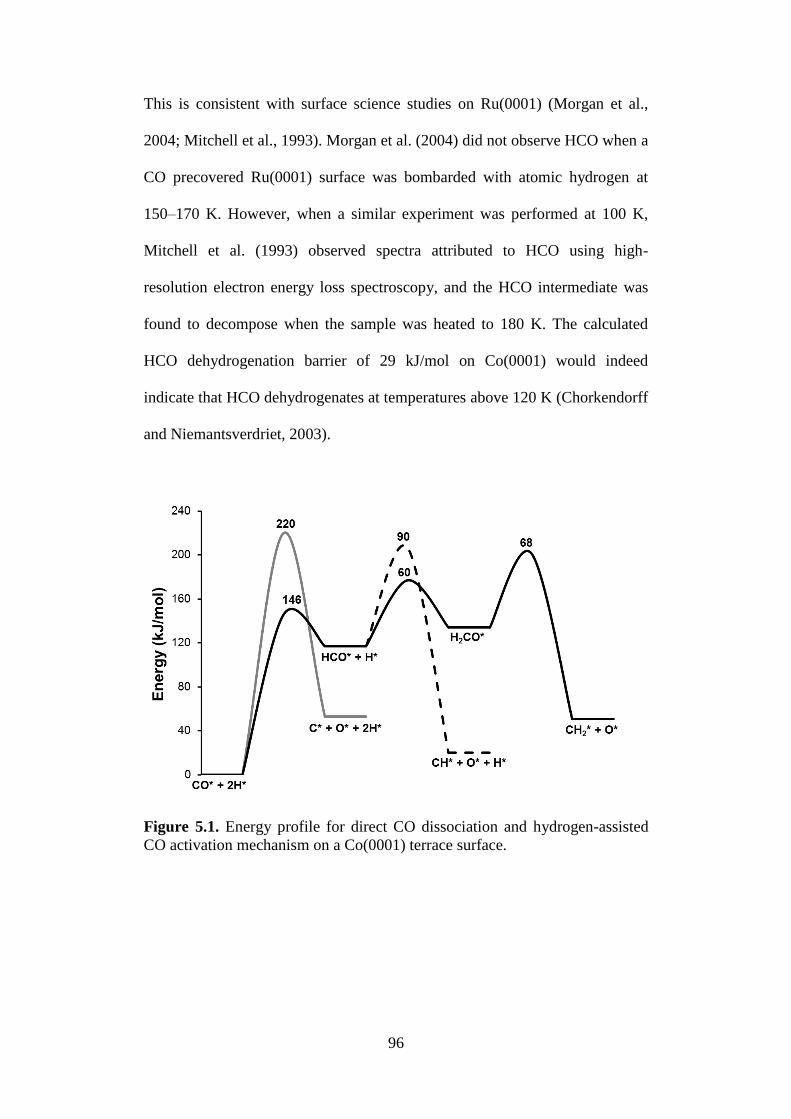
96
This is consistent with surface science studies on Ru(0001) (Morgan et al.,
2004; Mitchell et al., 1993). Morgan et al. (2004) did not observe HCO when a
CO precovered Ru(0001) surface was bombarded with atomic hydrogen at
150–170 K. However, when a similar experiment was performed at 100 K,
Mitchell et al. (1993) observed spectra attributed to HCO using high-
resolution electron energy loss spectroscopy, and the HCO intermediate was
found to decompose when the sample was heated to 180 K. The calculated
HCO dehydrogenation barrier of 29 kJ/mol on Co(0001) would indeed
indicate that HCO dehydrogenates at temperatures above 120 K (Chorkendorff
and Niemantsverdriet, 2003).
Figure 5.1. Energy profile for direct CO dissociation and hydrogen-assisted
CO activation mechanism on a Co(0001) terrace surface.
97
5.2.2 Barriers for CO insertion into CHx species
In the previous section, it was shown that hydrogenation lowers the C–O
dissociation barrier. However, the first hydrogenation step was calculated to
be kinetically slow and strongly endothermic. Next, we evaluate whether CH,
CH2, or CH3 coupling, possibly followed by hydrogenation, also lowers the C–
O dissociation barrier. The proposed mechanism bears similarity with the CO
insertion mechanism (Pichler and Schulz, 1970; Schulz and Zein El Deen,
1977; Masters, 1979) discussed in Chapter 2. The calculated CO insertion
barriers and the corresponding transition states are presented in Table 5.3. The
barrier for CH3 + CO coupling, 180 kJ/mol, is even higher than the first CO
hydrogenation barrier, 146 kJ/mol, and the reaction is +67 kJ/mol endothermic.
Our barrier is similar to the value reported by Cheng et al. (2008). The high
barrier can be attributed to the strong and directional CH3 – surface bonds that
needs to be broken to form the CH3–CO bond. Due to the high barrier, RCH2
+ CO coupling as proposed in the original CO insertion mechanism (Pichler
and Schulz, 1970; Schulz and Zein El Deen, 1977) seems unlikely, a
conclusion also supported by Cheng et al. (2008). However, the calculated CO
insertion barriers for CH2 and CH are significantly lower, at 74 and 96 kJ/mol,
respectively. The transition state C···C bond lengths of 1.76 and 1.71 Å are
similar to the bond length for CH3–CO coupling, 1.81 Å. The relative barriers
follow a trend similar to the barriers for CH3, CH2, and CH coupling to CH
(Cheng et al., 2008). Therefore, our calculations indicate that CO insertion
into RCH is kinetically possible, though the reaction is +60 kJ/mol
endothermic.

98
Table 5.3. Barriers and TS Geometries for CO Insertion into CHx on a
Co(0001) Surface. Calculations used a p(3×3) Co(0001) unit cell.
Transition State Product
Forward
barrier
(kJ/mol)
Reverse
barrier
(kJ/mol)
COCHCOCH 33
180 113
COCHCOCH 22
74 14
CHCOCOCH
96 45
99
5.2.3 Effect of CHx coupling and hydrogenation on the C–O dissociation
barrier.
Activation barriers and transition state geometries for C–O dissociation in
CHCO, CH2CO, CH3CO, CHCHO, CH2CHO and CH3CHO are given in Table
5.4. The transition state structure for CH3CO dissociation to CH3C + O is
comparable to the structure for HCO dissociation, and has a C···O bond length
of 1.79 Å. The CH3CO dissociation barrier, 72 kJ/mol, is slightly lower than
the barrier for HCO, 90 kJ/mol, and both reactions are very exothermic. The
C–O dissociation barrier for CH2CO is slightly higher at 95 kJ/mol, and this
reaction is kinetically possible as well. A similar energy barrier and transition
state was also found by Inderwildi et al. (2009). However, a high barrier 180
kJ/mol has been obtained for CHC–O dissociation. To reach the transition
state, the CHCO has to rotate from its most stable adsorption configuration
such that the O is tilted to interact with the catalyst surface, resulting in a high
barrier.
Since hydrogenation of HCO was found to further lower the C–O dissociation
barrier (Table 5.2), the effect of hydrogenation was also considered for CHCO,
CH2CO and CH3CO. Hydrogenation again lowers the C–O dissociation barrier,
from 72 kJ/mol for CH3CO to 61 kJ/mol for CH3CHO, though the reaction
becomes less exothermic at –48 kJ/mol. Though the barrier is similar to the
barrier for H2CO dissociation, 68 kJ/mol, the effect of hydrogenation is less
pronounced for CH3CO than for HCO, and reduces the dissociation barrier by
only 11 kJ/mol as compared to 22 kJ/mol for HCO. The transition state
structure and the C···O bond length of 1.93 Å are similar to H2CO. A
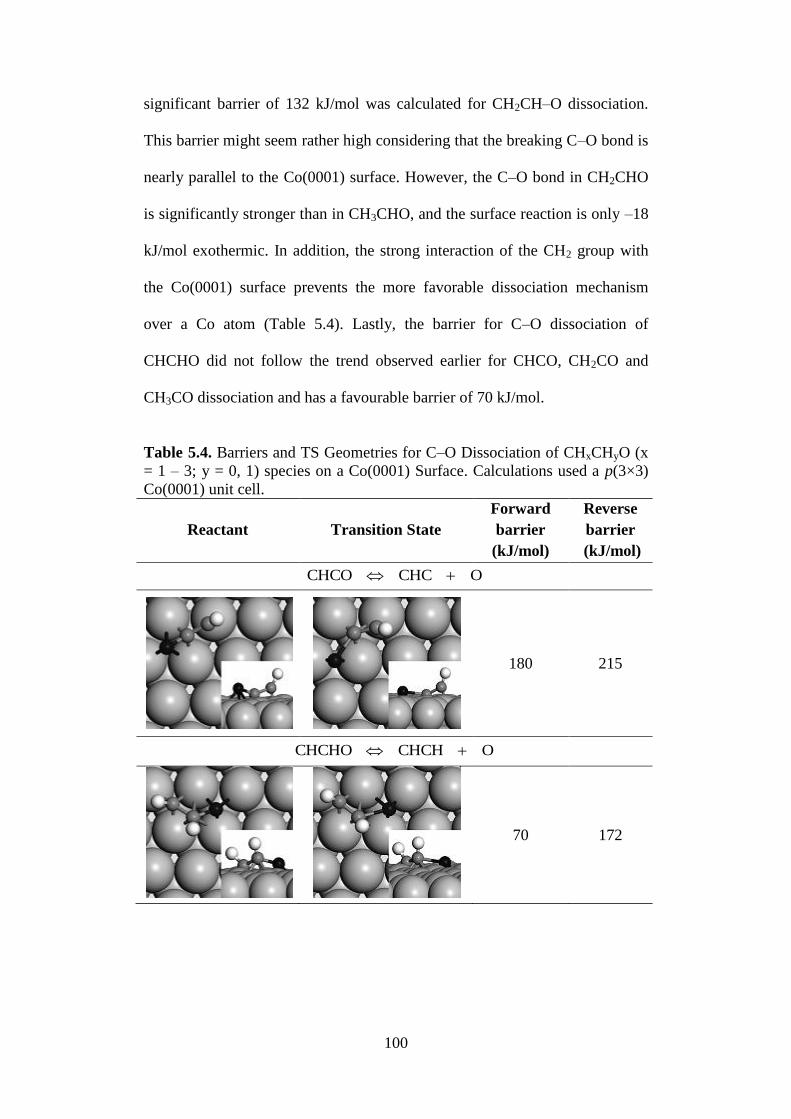
100
significant barrier of 132 kJ/mol was calculated for CH2CH–O dissociation.
This barrier might seem rather high considering that the breaking C–O bond is
nearly parallel to the Co(0001) surface. However, the C–O bond in CH2CHO
is significantly stronger than in CH3CHO, and the surface reaction is only –18
kJ/mol exothermic. In addition, the strong interaction of the CH2 group with
the Co(0001) surface prevents the more favorable dissociation mechanism
over a Co atom (Table 5.4). Lastly, the barrier for C–O dissociation of
CHCHO did not follow the trend observed earlier for CHCO, CH2CO and
CH3CO dissociation and has a favourable barrier of 70 kJ/mol.
Table 5.4. Barriers and TS Geometries for C–O Dissociation of CHxCHyO (x
= 1 – 3; y = 0, 1) species on a Co(0001) Surface. Calculations used a p(3×3)
Co(0001) unit cell.
Reactant Transition State
Forward
barrier
(kJ/mol)
Reverse
barrier
(kJ/mol)
OCHCCHCO
180 215
OCHCHCHCHO
70 172
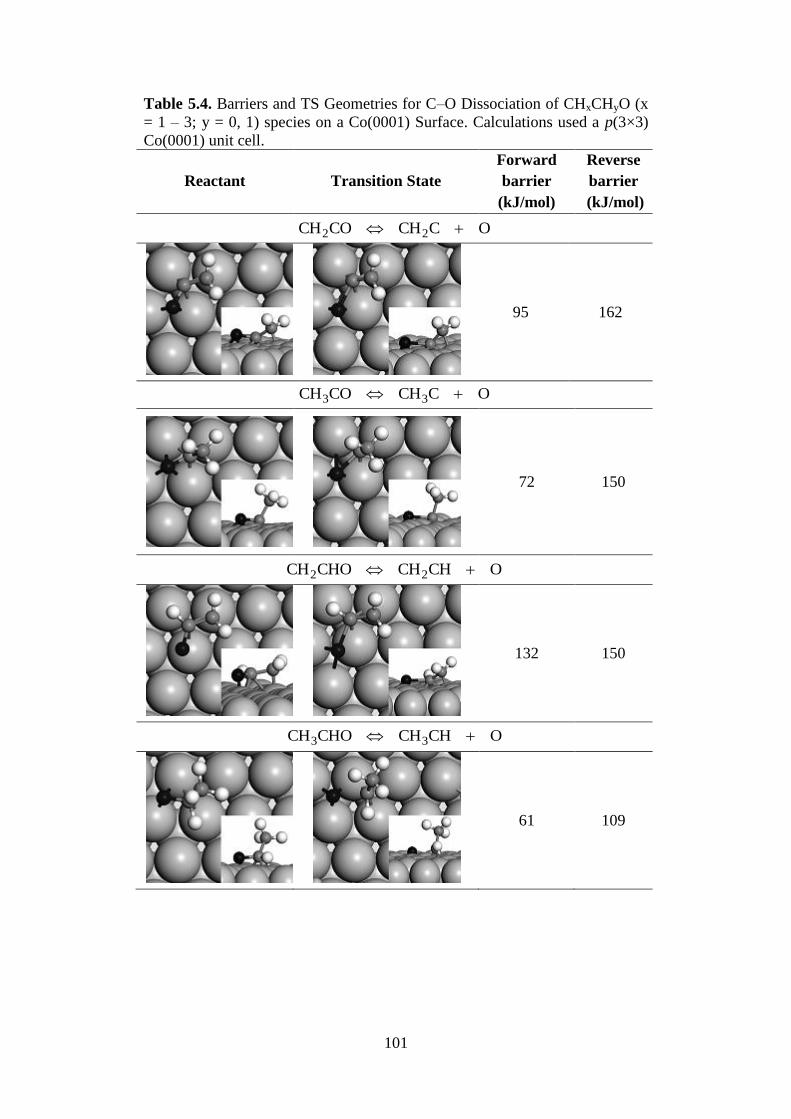
101
Table 5.4. Barriers and TS Geometries for C–O Dissociation of CHxCHyO (x
= 1 – 3; y = 0, 1) species on a Co(0001) Surface. Calculations used a p(3×3)
Co(0001) unit cell.
Reactant Transition State
Forward
barrier
(kJ/mol)
Reverse
barrier
(kJ/mol)
OCCHCOCH 22
95 162
OCCHCOCH 33
72 150
OCHCHCHOCH 22
132 150
OCHCHCHOCH 33
61 109

102
5.2.4 Barriers for CHCO, CH2CO and CH3CO hydrogenation.
The results in the previous section suggest that C–O dissociation occurs most
likely in CH3CHO, or possibly in CH3CO and CHCHO. However, CO
insertion is most favorable for CH2, forming CH2CO. At the same time, in
Chapter 4, we determined that CH is the more stable intermediate as compared
to CH2. Therefore, in this section, we consider the hydrogenation steps that
convert CH to CH2, CHCO to CHCHO and CH2CO, and CH2CO to CH3CO
and CH3CHO. Transition state geometries and activation barriers are presented
in Table 5.5. A low barrier of 61 kJ/mol is calculated for the hydrogenation of
CH to CH2 and the reaction is +40 kJ/mol endothermic. Our result compares
well with earlier calculations by Gong et al. (2005). Next, hydrogenation of
CHCO to CHCHO is calculated to have a high barrier of 139 kJ/mol and to be
+42 kJ/mol endothermic. The high hydrogenation barrier limits the possibility
of C–O dissociation via CHCHO. The hydrogenation of CHCO to CH2CO is
also somewhat high at 105 kJ/mol and +49 kJ/mol endothermic. Hence, it
seems more likely for CH to hydrogenate to CH2 followed by coupling to form
CH2CO.
A low barrier of 61 kJ/mol is calculated for the hydrogenation of CH3CO to
CH3CHO, with a transition state C···H bond length of 1.69 Å. The transition
state is rather similar to the transition state for HCO hydrogenation (Table
5.2b), though the O atom interacts more strongly with the Co(0001) surface
for CH3CO. Next, hydrogenation of CH2CO to CH3CO and to CH2CHO were
evaluated. Hydrogenation of CH2CO to CH3CO is a step in the CO insertion
mechanism proposed by Masters (1979) (Figure 2.5). A 75 kJ/mol barrier was
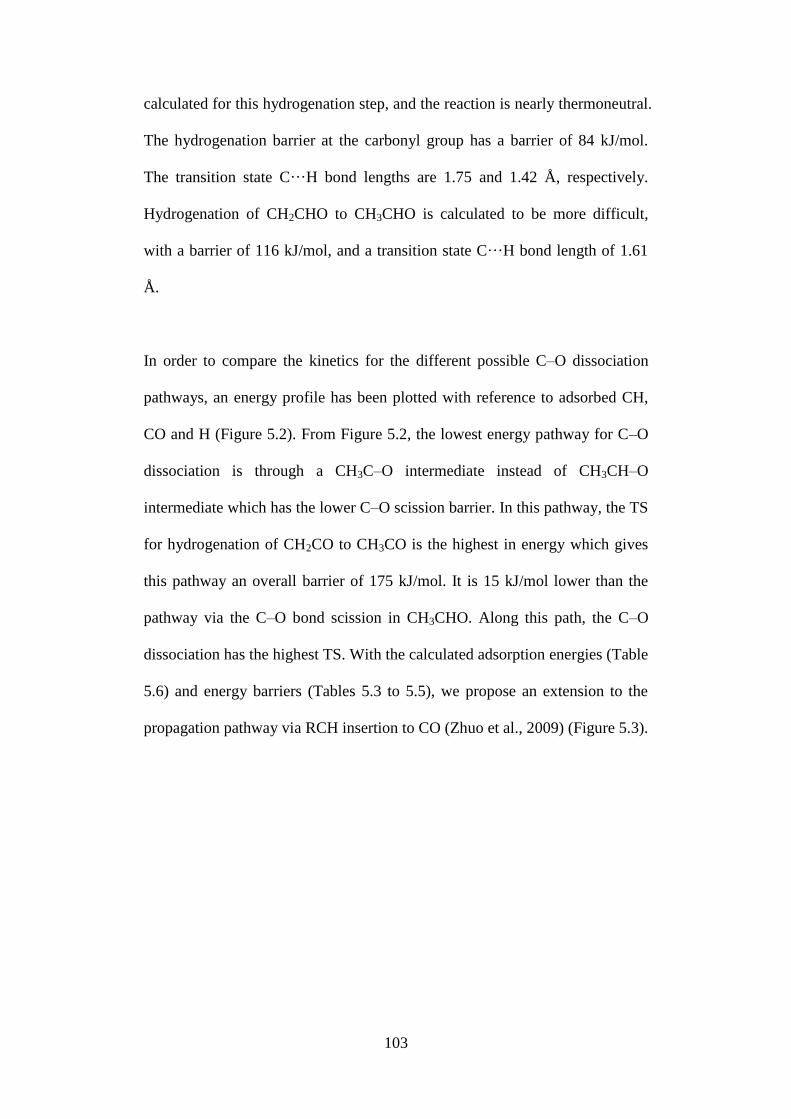
103
calculated for this hydrogenation step, and the reaction is nearly thermoneutral.
The hydrogenation barrier at the carbonyl group has a barrier of 84 kJ/mol.
The transition state C···H bond lengths are 1.75 and 1.42 Å, respectively.
Hydrogenation of CH2CHO to CH3CHO is calculated to be more difficult,
with a barrier of 116 kJ/mol, and a transition state C···H bond length of 1.61
Å.
In order to compare the kinetics for the different possible C–O dissociation
pathways, an energy profile has been plotted with reference to adsorbed CH,
CO and H (Figure 5.2). From Figure 5.2, the lowest energy pathway for C–O
dissociation is through a CH3C–O intermediate instead of CH3CH–O
intermediate which has the lower C–O scission barrier. In this pathway, the TS
for hydrogenation of CH2CO to CH3CO is the highest in energy which gives
this pathway an overall barrier of 175 kJ/mol. It is 15 kJ/mol lower than the
pathway via the C–O bond scission in CH3CHO. Along this path, the C–O
dissociation has the highest TS. With the calculated adsorption energies (Table
5.6) and energy barriers (Tables 5.3 to 5.5), we propose an extension to the
propagation pathway via RCH insertion to CO (Zhuo et al., 2009) (Figure 5.3).
104
Table 5.5. Barriers and TS Geometries for the Hydrogenation of CH and
CHxCHyO (x = 1 – 3; y = 0, 1) species on a Co(0001) Surface. Calculations
used a p(3×3) Co(0001) unit cell.
Transition State Product
Forward
barrier
(kJ/mol)
Reverse
barrier
(kJ/mol)
2CHHCH
61 21
CHCHOHCHCO
139 97
COCHHCHCO 2
105 56
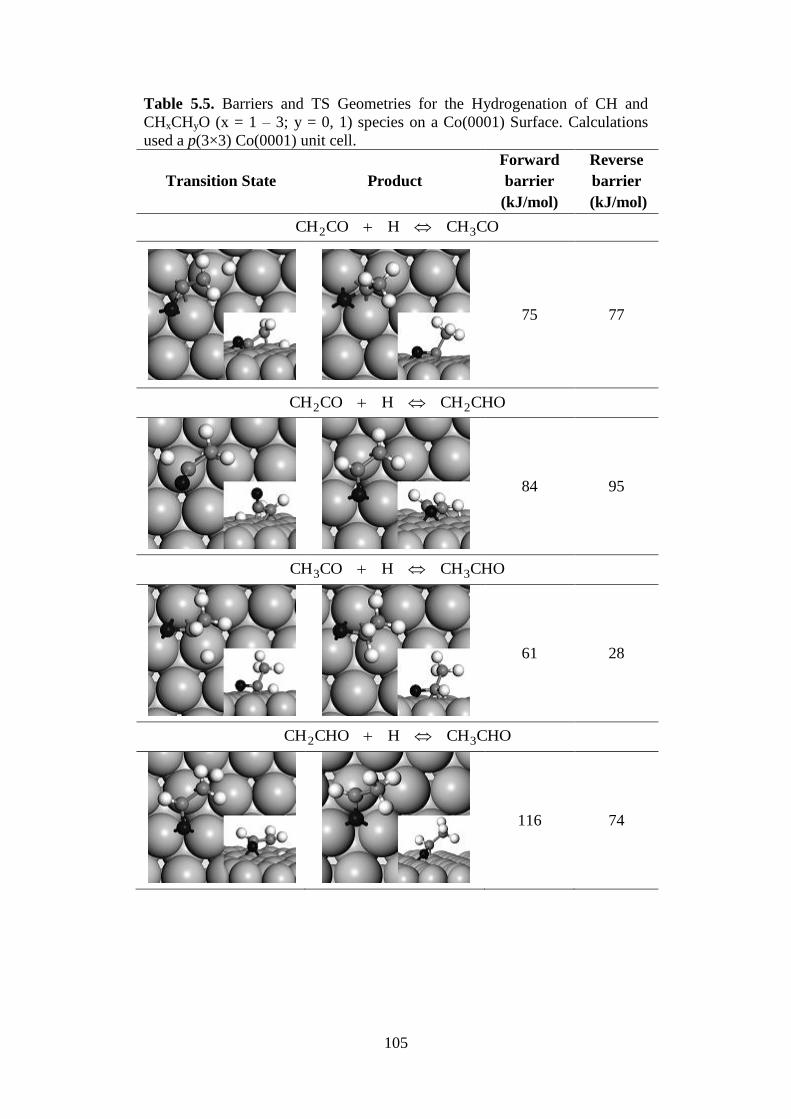
105
Table 5.5. Barriers and TS Geometries for the Hydrogenation of CH and
CHxCHyO (x = 1 – 3; y = 0, 1) species on a Co(0001) Surface. Calculations
used a p(3×3) Co(0001) unit cell.
Transition State Product
Forward
barrier
(kJ/mol)
Reverse
barrier
(kJ/mol)
COCHHCOCH 32
75 77
CHOCHHCOCH 22
84 95
CHOCHHCOCH 33
61 28
CHOCHHCHOCH 32
116 74
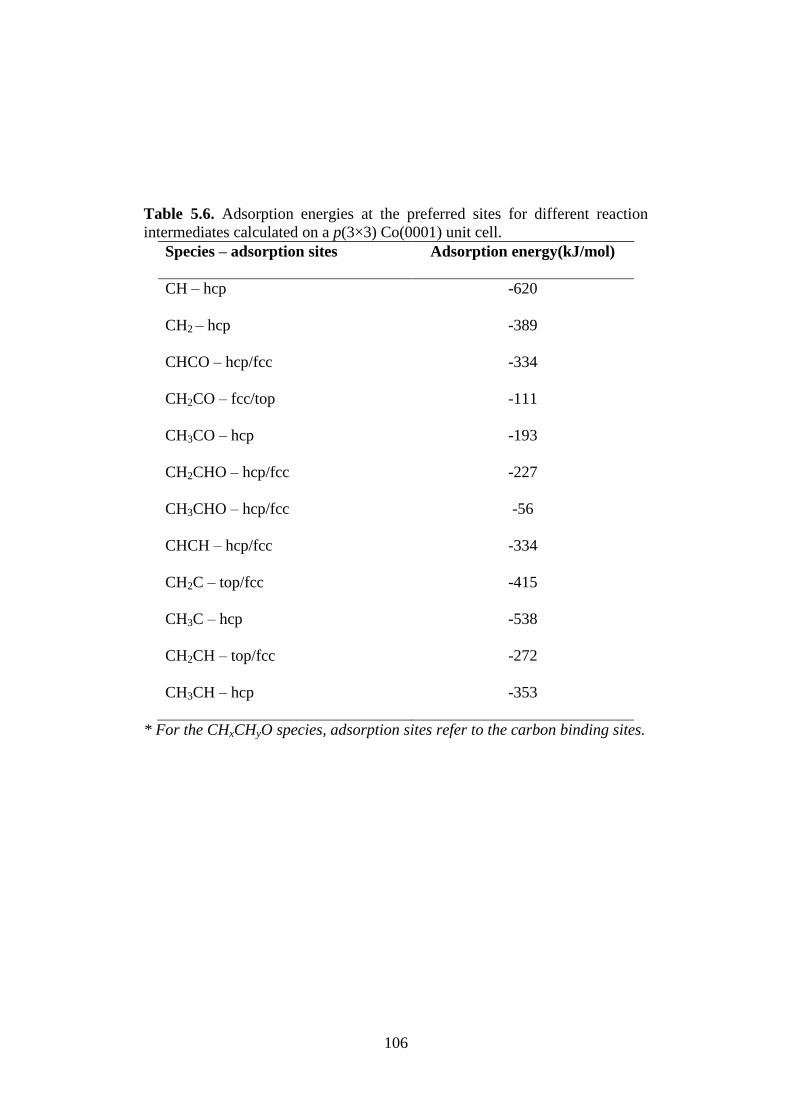
106
Table 5.6. Adsorption energies at the preferred sites for different reaction
intermediates calculated on a p(3×3) Co(0001) unit cell.
Species – adsorption sites Adsorption energy(kJ/mol)
CH – hcp -620
CH2 – hcp -389
CHCO – hcp/fcc -334
CH2CO – fcc/top -111
CH3CO – hcp -193
CH2CHO – hcp/fcc -227
CH3CHO – hcp/fcc -56
CHCH – hcp/fcc -334
CH2C – top/fcc -415
CH3C – hcp -538
CH2CH – top/fcc -272
CH3CH – hcp -353
* For the CHxCHyO species, adsorption sites refer to the carbon binding sites.

107
Figure 5.2. Energy profile for RCH2C–O pathway via CO insertion into RCH
species.
5.2.5 Kinetic model for propagation via CO insertion.
Based on the calculations reported in Tables 5.3, 5.4, and 5.5, a propagation
mechanism is proposed in Figure 5.3. The corresponding energy profiles are
shown in Figure 5.2. First, CH formed in initiation steps hydrogenates to CH2
before coupling with CO. The barrier for the coupling reaction is fairly low at
74 kJ/mol as compared to the barrier of 137 kJ/mol for RCH + CH2 coupling
at step sites (Cheng et al., 2008), the propagation step in the classical carbide
mechanism. Also, in comparison with the CO hydrogenation barrier of 146
kJ/mol, the RCH + CO coupling barrier is lower. However, the RCHCO
intermediate is rather unstable on the Co(0001) surface and would be difficult
to detect spectroscopically during FTS. The desorption energy of about 111
kJ/mol (Table 5.6) also makes it unlikely to detect significant amounts of
RCHCO in the gas phase.

108
RCHCO is proposed to undergo a hydrogenation to form RCH2CO or 2
consecutive hydrogenation steps to form RCH2CHO. Both species have
favourable C–O dissociation barriers. The feasibility of C–O scission starting
from an adsorbed CH3CHO reaction intermediate was confirmed in recent
experiments (Weststrate et al., 2010). During a temperature-programmed
reaction study, ethanol dissociated to surface ethoxy species and further to
CH3CHO on Co(0001) between 300 and 360 K. Some of the CH3CHO
desorbed and was detected, but the majority decomposed into atomic oxygen
and C2Hx species in the same temperature range. This temperature range
corresponds with barriers of 70 to 85 kJ/mol (Redhead, 1962), consistent with
the calculated low coverage C–O scission barriers (Table 5.4). The
experimental observations indicate that at a low coverage, the C–O scission of
aldehyde is possible as the barrier of 61 kJ/mol is comparable with the
desorption energy of 56 kJ/mol (Table 5.6) However, our calculations show
that the hydrogenation of RCH2CO (Table 5.5) has a low reverse barrier of 28
kJ/mol, indicating that acetaldehyde is likely to undergo dehydrogenation into
CH3CO species before C–O scission takes place. Furthermore, the overall
barrier for the pathway via RCH2C–O scission is 15 kJ/mol lower, indicating
that this should be the preferred pathway for C–O bond scission.
The proposed propagation mechanism does not explicitly address the initiation
and termination steps. Termination can occur at different positions along the
propagation cycle. One should also note that chain lengthening will occur
when the rate of propagation is much faster than methane formation.
Hydrogenation or dehydrogenation of the RC intermediates seems most likely,

109
with a calculated barrier of 73 kJ/mol (Figure 5.2). This value is similar to the
reported hydrogenation barrier of 83 kJ/mol for CH3C by Cheng et al. (2008).
Formation of the first CH group, the initiation step, could occur via hydrogen
assisted C–O activation, or might take place at special step or defect sites
where the CO dissociation barrier is calculated to be low (Ge and Neurock,
2006; Shetty et al., 2009).
Figure 5.3. Proposed propagation cycle for the CO Insertion mechanism. The
full arrow indicated the dominant reaction path, and the dotted arrows indicate
the minor reaction path. R represents hydrogen or an alkyl group.
Next, the steady-state CO TOF for the proposed propagation cycle (Figures
5.2 and 5.3) is compared with the steady-state TOF for the hydrogen assisted
CO activation mechanism (Figure 5.1). Typical pre-exponential factors
(Chorkendorff and Niemantsverdriet, 2003) of 1013
s-1
were combined with the
calculated activation energies and the equilibrium coverage of 0.3 monolayer
(ML) for both CO* and H* reported in Chapter 4 as we assumed CO and H2
110
adsorption to be in quasi-equilibrium. To avoid assumptions about the relative
rates of initiation and termination, the total surface RC concentration was
taken as a parameter. Experimentally, CHx coverages of about 0.1 ML have
been observed (den Breejen et al., 2009). Note that the calculated adsorption
energies correspond to low coverages, and are expected to decrease at higher
coverages. Since the number of adsorbed species decreases in the propagation
cycle, lower binding energies would make the reactions less endothermic, and
hence increase the TOF (Saeys et al., 2005).
With these kinetic parameters, an upper limit of 5.6×10⁻⁴
s-1
is calculated for
the TOF at 500 K for the hydrogen-assisted CO activation mechanism, by
combining the CO hydrogenation rate coefficient, 5.6×10⁻³
s-1
, with
equilibrium CO and H coverages of 0.3 ML for both species. However, the
first hydrogenation step is highly endothermic and accounting for the
reversibility of all the steps reduces the steady-state TOF to 9.9×10⁻⁹
s-1
. This
TOF is still higher than the calculated TOF for CO dissociation, 3.5×10⁻¹¹
s-1
,
for the same reaction conditions. The total CO TOF for the propagation
mechanism depends on the total RC surface coverage, as can be expected from
the mechanism. For a total RC coverage of 0.1 ML, the CO TOF of 3×10⁻⁷
s-1
is about 30 times faster than the TOF for hydrogen assisted CO activation.
Though the calculated TOF is significantly lower than the experimental value
of 0.02 s-1
(Ribeiro et al., 1997), the calculated TOF can be expected to
increase when the coverage dependence of the binding energies is considered.
Before we perform the DFT calculations to understand the effects of coverage
on the adsorption energies, reaction energies and energy barriers (Chapter 6),
111
we would like to understand how this will affect the CO TOF. Therefore, we
arbitrarily reduce the adsorption energies of all species. Indeed, decreasing all
adsorption energies, including the transition states, by 10 kJ/mol, and hence
keeping the barriers for the unimolecular reactions constant (Saeys et al.,
2005), increases the CO TOF by a factor 200. Decreasing the adsorption
energies by about 20 kJ/mol leads to a CO TOF of 0.02 s-1
for the propagation
mechanism. Such a decrease is not unreasonable, and a 40 to 50 kJ/mol
decrease is observed experimentally for the H2 chemisorption energy on
Pt(111) (Podkolzin et al., 2005).
The simulation further indicates that C–O scission via RCHCO species is the
dominant pathway (full line in Figure 5.2 and 5.3). To identify possible rate
limiting steps in the propagation mechanism, Campbell’s degree of rate
control (2001) was computed. For the propagation mechanism, the
hydrogenation of RCHCO to RCH2CO was found to be the rate-determining
step with a degree of rate control of 0.77. This is not surprising since the
corresponding transition state is the highest point along the reaction path. The
degree of rate control for the C–O dissociation of RCH2CO has a degree of
rate control of 0.23. For the hydrogen assisted CO activation mechanism,
dissociation of H2CO is indicated to be rate-controlling, with a degree of rate
control of 0.78. In addition, the rate of HCO dissociation is found to be weakly
rate controlling, with a degree of control of 0.22.
112
5.3. Conclusions
A propagation cycle starting with CO insertion into surface RCH groups is
proposed as a possible mechanism for FT synthesis over Co catalysts. Kinetic
model based on low coverage DFT energies on a model Co(0001) surface
indicate that the CO TOF for the proposed propagation mechanism is one to
two orders of magnitude faster than for hydrogen assisted CO activation and
four orders of magnitude faster than for direct CO activation.
C–O bond scission is a key step in the FT mechanism. Direct CO activation
has a barrier of 220 kJ/mol on Co(0001), and is kinetically difficult.
Hydrogenation can weaken the C-O bond and lower the dissociation barrier to
90 kJ/mol for HC–O, and 68 kJ/mol for H2C–O. However, CO hydrogenation
is slow with a barrier of 146 kJ/mol and a reaction energy of +117 kJ/mol. CO
coupling with surface RCH groups has a barrier of 74 kJ/mol, and is faster
than CO hydrogenation, even at a low RC coverage. In the proposed
propagation cycle, CO insertion is followed by a hydrogenation step with
barrier of 75 kJ/mol to form a surface RCH2CO species. C–O bond scission in
RCH2CO to form R’C has a barrier of 72 kJ/mol and is –78 kJ/mol exothermic.
The calculated CO TOF for the propagation cycle, about 3×10⁻⁷
s-1
, is
significantly lower than the experimental value, but increases rapidly with
decreasing adsorption energies. More detailed kinetic studies, taking into
account the effect of coverage on the adsorption energies, are likely to
improve the agreement with the experimental data and this is discussed in the
next chapter.

113
5.4 References
Bridge, M. E.; Comrie, C. M.; Lambert, R. M. Surf. Sci. 1977, 67, 393.
Cheng, J.; Hu, P.; Ellis, P.; French, S.; Kelly, G.; Lok, C. M., J. Phys Chem. C.
2008, 112, 9464.
Cheng, J.; Gong, X.-Q.; Hu, P.; Lok, C. M.; Ellis, P.; French, S. J. Catal. 2008,
254, 285.
Cheng, J.; Hu, P.; Ellis, P.; French, S.; Kelly, G.; Lok, C. M. J. Catal. 2008,
257, 221.
Chorkendorff, I.; Niemantsverdriet, J. W. “Concepts of Modern Catalysis and
Kinetics” Wiley: New York, 2003, p. 276.
Campbell, C. T. J. Catal. 2001, 204, 520.
Dry, M. E. Appl. Catal. A 1996, 138, 319.
den Breejen, J. P.; Radstake, P. B.; Bezemer, G. L.; Bitter, J. H.; Frøseth, V.;
Holmen, A.; de Jong, K. P. J. Am. Chem. Soc. 2009, 131, 7197.
Fischer, F.; Tropsch, H., Brennstoff-Chem. 1926, 7, 97.
Feibelman, P. J.; Hammer, B.; Nørskov, J. K.; Wagner, F.; Scheffler, M.;
Stumpf, R.; Watwe, R.; Dumesic, J. J. Phys. Chem. B 2001, 105, 4018.
Ge, Q. F.; Neurock, M., J. Phys. Chem. B 2006, 110, 15368.
Gong, X. Q.; Raval, R.; Hu, P. Surf. Sci. 2004, 562, 247.
Gong, X.-Q.; Raval, R.; Hu, P. J. Chem. Phys. 2005, 122, 024711.
Inderwildi, O. R.; Jenkins, S. J.; King, D. A., J. Phys. Chem. C Lett., 2007,
112, 5.
Inderwildi, O. R.; King, D. A.; Jenkins, S. J. Phys. Chem. Chem. Phys. 2009,
11, 11110.
114
Klinke, D. J.; Wilkie, S.; Broadbelt, L. J. J. Catal. 1998, 178, 540.
Masters, C. Adv. Organomet. Chem. 1979, 17, 61.
Mason, S. E.; Grinberg, I.; Rappe, A. M. Phys. Rev. B 2004, 69, 161401.
Morgan, G. A., Jr.; Sorescu, D. C.; Zubkov, T.; Yates, J. T., Jr. J. Phys. Chem.
B 2004, 108, 3614.
Mitchell, W. J.; Xie, J.; Wang, Y.; Weinberg, W. H., J. Elect. Spectro. Re.
Pheno. 1993, 64, 427.
Papp, H. Surf. Sci. 1983, 129, 205.
Redhead, P. A. Vacuum 1962, 12, 203.
Pick, Š. Surf. Sci. 2007, 601, 5571.
Pichler, H.; Schulz, H., Chem. Ing. Tech. 1970, 42, 1162.
Podkolzin, S. G.; Watwe, R. M.; Yan, Q.; de Pablo, J. J.; Dumesic, J. A. J.
Phys. Chem. B 2001, 105, 8550.
Ribeiro, F. H.; Schach von Wittenau, A. E.; Bartholomew, C. H.; Somorjai, G.
A. Catal. Rev. Sci. Eng. 1997, 39, 49.
Schulz, H.; Zein El Deen, A., Fuel Process. Tech. 1977, 1, 45.
Shetty, S.; Jansen, A. P. J.; van Santen, R. A., J. Am. Chem. Soc. 2009, 131,
12874.
Saeys, M.; Reyniers, M.-F.; Thybaut, J. W.; Neurock, M.; Marin, G. B. J.
Catal. 2005, 236, 129.
Weststrate, C.J.; Gericke, H.J.; Verhoeven, M.W.G.M.; Ciobîcă, I.M.; Saib,
A.M.; Niemantsverdriet, J.W. J. Phys. Chem. Lett. 2010, 1, 1767.
115
CHAPTER 6
EFFECT OF CO COVERAGE ON THE KINETICS
OF THE CO INSERTION MECHANISM AND ON
THE CARBON STABILITY ON Co CATALYSTS
6.1 Introduction
In Chapter 4, we discussed and illustrated that the coverage of CO on the
surface of the Co catalyst is high under FT conditions. Hence, in this Chapter,
we shall analyze how the CO insertion mechanism studied in Chapter 5 is
affected by a realistic CO coverage. Although the high CO coverage during
FT synthesis is expected to affect the calculated energy profile, few DFT
studies have accounted for coverage effects. Recently, Ojeda et al. (2010)
reported calculations for hydrogen-assisted CO activation for a CO coverage
of 0.5 ML and found that the binding energies of the surface species decrease
by more than 20 kJ/mol. When surface species are in closer proximity at
higher coverage, lateral interactions become important. These lateral
interactions, both attractive and repulsive, are discussed in detail by van
Santen and Neurock (2006). Coverage effects can be important, and can be
included in DFT calculations. For example, Getman et al. (2009) reported that
the rate of O2 dissociation on Pt(111) reduces dramatically when the oxygen
116
coverage increase to 0.5 ML, while the rate of NO2 dissociation remains
relatively unaffected. Shan et al. (2009) calculated the effect of CO coverage
on the oxygen dissociation barrier on Pt(111). They found that increasing the
CO coverage reduces the binding energy of O2 on the surface and changes the
dissociation enthalpy from exothermic to endothermic. Scheijen et al. (2009)
studied the effect of CO coverage on the CO dissociation barrier for various
body-centered cubic (bcc) transition metals and alloy at 0.25 and 0.5 ML CO
coverages. Their results show that the dissociation of CO becomes less
exothermic at higher CO coverage though the adsorption energy of CO is
relatively independent of coverage in their study. The most detailed approach
to account for coverage effects is by kinetic Monte Carlo simulations. For
example, Mei et al. (2006) found that lateral interactions between adsorbates
need to be included to accurately model the kinetics, the reaction orders, and
the selectivity of acetylene hydrogenation on Pd(111).
To further illustrate the importance of accounting for coverage effects in the
calculations, we will study the stability of carbon with and without the
influence of CO on the surface. As discussed in Chapter 2, DFT studies
involving carbon indicate that it may be responsible for the reconstruction of
the catalyst surface. At the same time, it is also a possible deactivating agent
for the catalyst in FT synthesis. Hence, it will be interesting to see how a more
realistic surface model will change the stability of carbon.
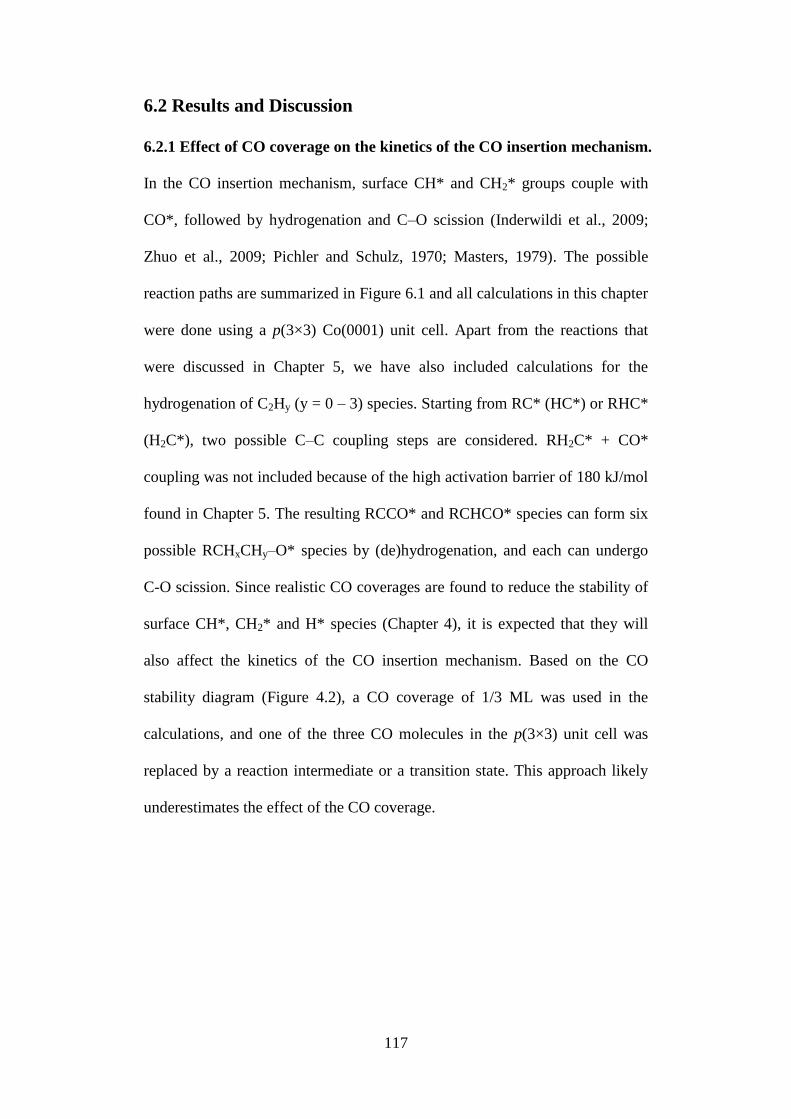
117
6.2 Results and Discussion
6.2.1 Effect of CO coverage on the kinetics of the CO insertion mechanism.
In the CO insertion mechanism, surface CH* and CH2* groups couple with
CO*, followed by hydrogenation and C–O scission (Inderwildi et al., 2009;
Zhuo et al., 2009; Pichler and Schulz, 1970; Masters, 1979). The possible
reaction paths are summarized in Figure 6.1 and all calculations in this chapter
were done using a p(3×3) Co(0001) unit cell. Apart from the reactions that
were discussed in Chapter 5, we have also included calculations for the
hydrogenation of C2Hy (y = 0 – 3) species. Starting from RC* (HC*) or RHC*
(H2C*), two possible C–C coupling steps are considered. RH2C* + CO*
coupling was not included because of the high activation barrier of 180 kJ/mol
found in Chapter 5. The resulting RCCO* and RCHCO* species can form six
possible RCHxCHy–O* species by (de)hydrogenation, and each can undergo
C-O scission. Since realistic CO coverages are found to reduce the stability of
surface CH*, CH2* and H* species (Chapter 4), it is expected that they will
also affect the kinetics of the CO insertion mechanism. Based on the CO
stability diagram (Figure 4.2), a CO coverage of 1/3 ML was used in the
calculations, and one of the three CO molecules in the p(3×3) unit cell was
replaced by a reaction intermediate or a transition state. This approach likely
underestimates the effect of the CO coverage.
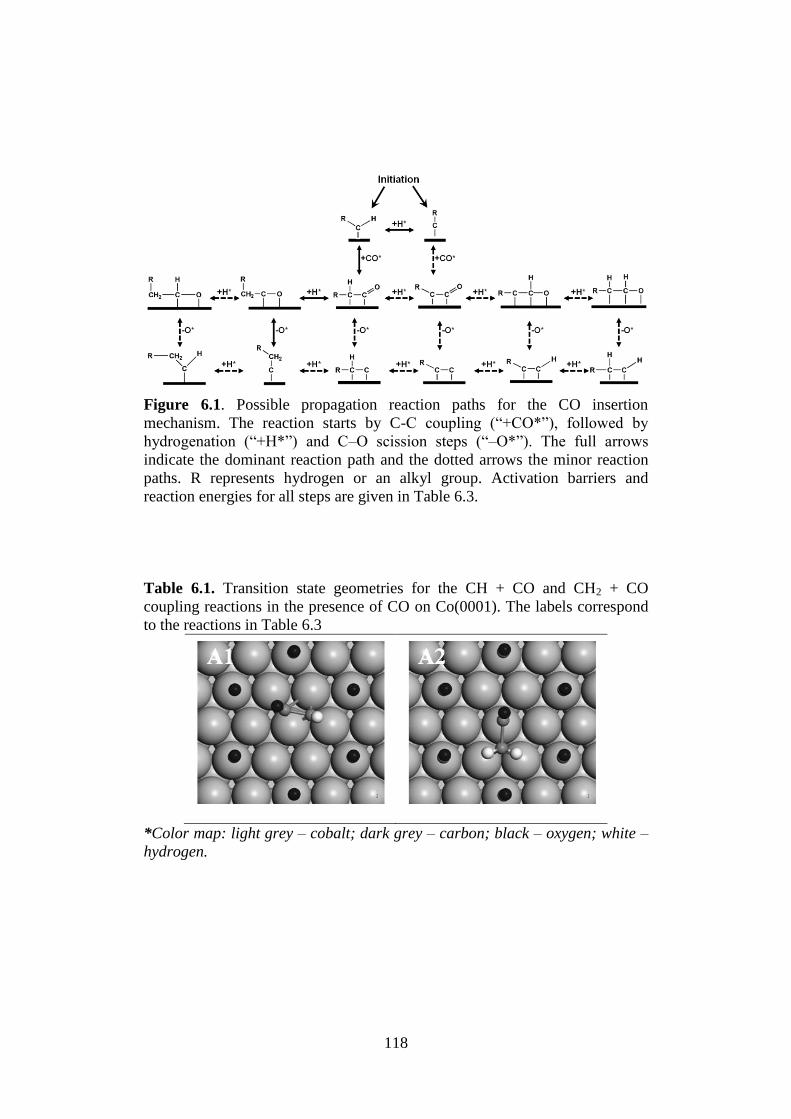
118
Figure 6.1. Possible propagation reaction paths for the CO insertion
mechanism. The reaction starts by C-C coupling (“+CO*”), followed by
hydrogenation (“+H*”) and C–O scission steps (“–O*”). The full arrows
indicate the dominant reaction path and the dotted arrows the minor reaction
paths. R represents hydrogen or an alkyl group. Activation barriers and
reaction energies for all steps are given in Table 6.3.
Table 6.1. Transition state geometries for the CH + CO and CH2 + CO
coupling reactions in the presence of CO on Co(0001). The labels correspond
to the reactions in Table 6.3
*Color map: light grey – cobalt; dark grey – carbon; black – oxygen; white –
hydrogen.
119
The effect of coverage on the two C–C coupling reactions is discussed first.
The forward activation barriers (Ef) and the reaction energies (ΔErxn) for both
the clean p(3x3) surface and in the presence of co-adsorbed CO are
summarized in Table 6.2. The optimized transition state geometries are shown
in Table 6.1. As reported in Chapter 5, CH2 + CO coupling has a low barrier
of 74 kJ/mol, but is rather endothermic by +60 kJ/mol (Zhuo et al., 2009). CH
+ CO coupling has a higher barrier of 96 kJ/mol, but is less endothermic. The
endothermic nature of the C–C coupling step was identified as a concern for
the CO insertion mechanism (Weststrate et al., 2010). The presence of co-
adsorbed CO destabilizes the reaction intermediates and hence reduces both
activation barriers. The higher coverage also makes CH2 + CO coupling less
endothermic by 18 kJ/mol, but has a limited effect on the reaction energy for
CH + CO coupling. This can be attributed to the relatively large change in the
CHCO binding energy, 33 kJ/mol (Table 6.2).

120
Table 6.2. Adsorption energies at the preferred sites for the different reaction
intermediates. Note that the values in this Table are electronic adsorption
energies.
Reaction
intermediate –
preferred site
Adsorption energy (kJ/mol)
In the presence of
co-adsorbed CO
On a clean
Co(0001) surface
Difference
H – hcp −252 −275 23
H – fcc −247 −273 26
O – hcp −552 −568 16
CO – top −162 −166 4
CH – hcp – 600 – 620 20
CH2 – hcp −379 −389 10
CHC – hcp/fcc – 507 – 535 28
CH2C – top/fcc −387 −415 28
CH3C – hcp – 527 – 538 11
CHCH – hcp/fcc – 242 – 263 21
CH2CH – top/fcc – 259 – 272 13
CHCO – hcp/fcc – 301 – 334 33
CH2CO – hcp/top −95 −111 16
CH3CO – hcp −188 −193 5
CH3CH – hcp −335 −353 18
CHCHO – fcc/top – 394 – 414 20
CH2CHO – hcp/fcc −210 −227 17
CH3CHO – hcp/fcc −40 −56 16
Average 18
* For the CHxCHyO species, adsorption sites refer to the carbon binding sites.
121
In Chapter 5, we studied the C–O scission of six possible CHxCHy–O* species
that can be formed by C–C coupling and hydrogenation. Next, we will re-
evaluate these C–O scission steps in the presence of absorbed CO*. The
barriers and reaction energies are reported in Table 6.3 and the transition state
geometries are illustrated in Table 6.4. All the C–O scission paths are
thermodynamically favorable. Since the presence of adsorbed CO* reduces the
adsorption energies, the C–O scission reactions become less favorable at
higher coverage, but remain exothermic. The change in the reaction energy
ranges from 12 to 28 kJ/mol. On the clean surface, four C–O scission paths
have barriers below 100 kJ/mol. The calculated barriers can be compared with
overall activation energies of around 100 kJ/mol that have been reported for
FT synthesis (Herranz et al., 2009; Ojeda et al., 2010; Riberio et al., 1997).
Consistent with the reduced reaction energies, the activation barriers increase
by 6 to 35 kJ/mol in the presence of co-adsorbed CO. Changes in the transition
state geometries are however small and generally less than 0.1 Å for the C–O
bond length. Note that the increase in the activation barriers does not
necessarily correspond with slower overall kinetics. Indeed, to evaluate the
effect of the CO coverage on the kinetics, it is important to consider the
complete pathway, rather than the activation barriers for individual steps.
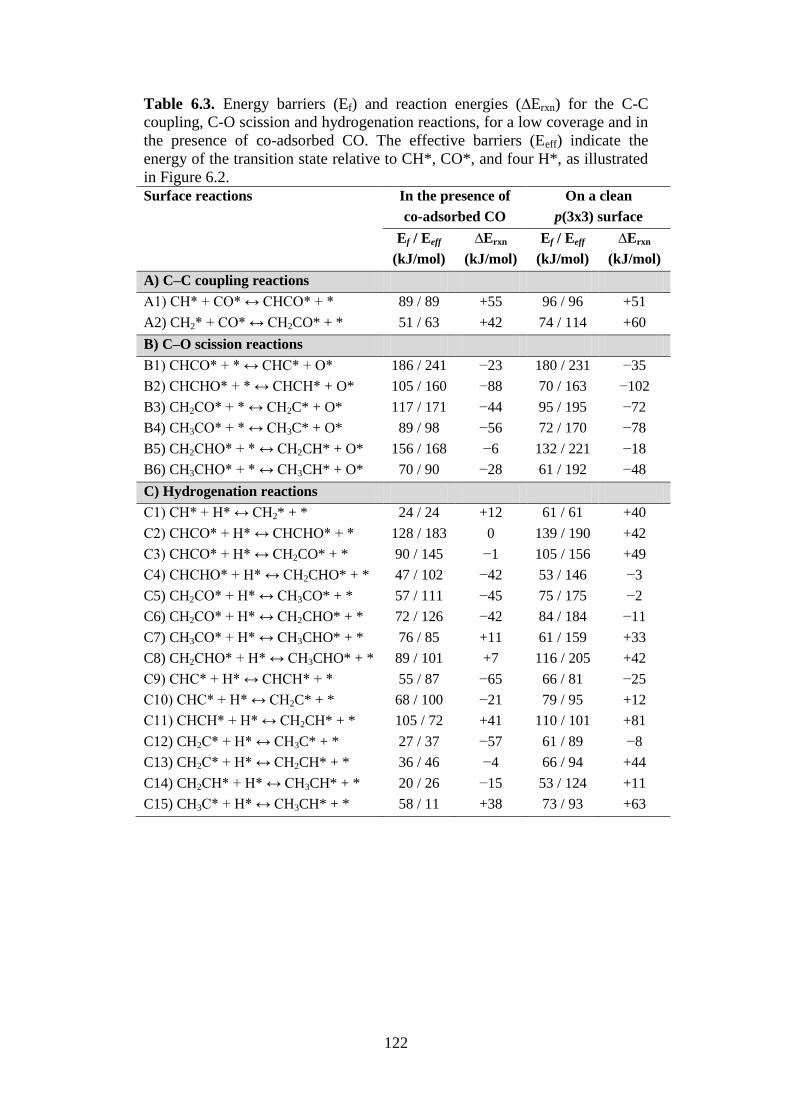
122
Table 6.3. Energy barriers (Ef) and reaction energies (∆Erxn) for the C-C
coupling, C-O scission and hydrogenation reactions, for a low coverage and in
the presence of co-adsorbed CO. The effective barriers (Eeff) indicate the
energy of the transition state relative to CH*, CO*, and four H*, as illustrated
in Figure 6.2.
Surface reactions In the presence of
co-adsorbed CO
On a clean
p(3x3) surface
Ef / Eeff
(kJ/mol)
∆Erxn
(kJ/mol)
Ef / Eeff
(kJ/mol)
∆Erxn
(kJ/mol)
A) C–C coupling reactions
A1) CH* + CO* ↔ CHCO* + * 89 / 89 +55 96 / 96 +51
A2) CH2* + CO* ↔ CH2CO* + * 51 / 63 +42 74 / 114 +60
B) C–O scission reactions
B1) CHCO* + * ↔ CHC* + O* 186 / 241 −23 180 / 231 −35
B2) CHCHO* + * ↔ CHCH* + O* 105 / 160 −88 70 / 163 −102
B3) CH2CO* + * ↔ CH2C* + O* 117 / 171 −44 95 / 195 −72
B4) CH3CO* + * ↔ CH3C* + O* 89 / 98 −56 72 / 170 −78
B5) CH2CHO* + * ↔ CH2CH* + O* 156 / 168 −6 132 / 221 −18
B6) CH3CHO* + * ↔ CH3CH* + O* 70 / 90 −28 61 / 192 −48
C) Hydrogenation reactions
C1) CH* + H* ↔ CH2* + * 24 / 24 +12 61 / 61 +40
C2) CHCO* + H* ↔ CHCHO* + * 128 / 183 0 139 / 190 +42
C3) CHCO* + H* ↔ CH2CO* + * 90 / 145 −1 105 / 156 +49
C4) CHCHO* + H* ↔ CH2CHO* + * 47 / 102 −42 53 / 146 −3
C5) CH2CO* + H* ↔ CH3CO* + * 57 / 111 −45 75 / 175 −2
C6) CH2CO* + H* ↔ CH2CHO* + * 72 / 126 −42 84 / 184 −11
C7) CH3CO* + H* ↔ CH3CHO* + * 76 / 85 +11 61 / 159 +33
C8) CH2CHO* + H* ↔ CH3CHO* + * 89 / 101 +7 116 / 205 +42
C9) CHC* + H* ↔ CHCH* + * 55 / 87 −65 66 / 81 −25
C10) CHC* + H* ↔ CH2C* + * 68 / 100 −21 79 / 95 +12
C11) CHCH* + H* ↔ CH2CH* + * 105 / 72 +41 110 / 101 +81
C12) CH2C* + H* ↔ CH3C* + * 27 / 37 −57 61 / 89 −8
C13) CH2C* + H* ↔ CH2CH* + * 36 / 46 −4 66 / 94 +44
C14) CH2CH* + H* ↔ CH3CH* + * 20 / 26 −15 53 / 124 +11
C15) CH3C* + H* ↔ CH3CH* + * 58 / 11 +38 73 / 93 +63
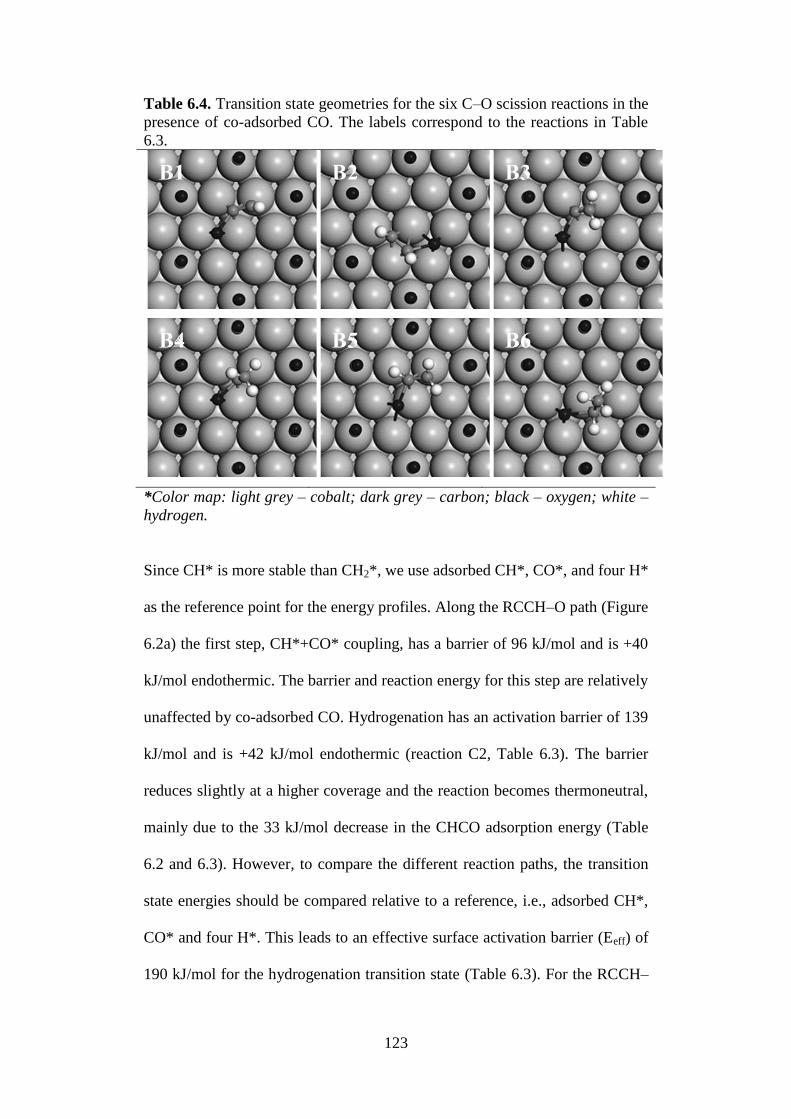
123
Table 6.4. Transition state geometries for the six C–O scission reactions in the
presence of co-adsorbed CO. The labels correspond to the reactions in Table
6.3.
*Color map: light grey – cobalt; dark grey – carbon; black – oxygen; white –
hydrogen.
Since CH* is more stable than CH2*, we use adsorbed CH*, CO*, and four H*
as the reference point for the energy profiles. Along the RCCH–O path (Figure
6.2a) the first step, CH*+CO* coupling, has a barrier of 96 kJ/mol and is +40
kJ/mol endothermic. The barrier and reaction energy for this step are relatively
unaffected by co-adsorbed CO. Hydrogenation has an activation barrier of 139
kJ/mol and is +42 kJ/mol endothermic (reaction C2, Table 6.3). The barrier
reduces slightly at a higher coverage and the reaction becomes thermoneutral,
mainly due to the 33 kJ/mol decrease in the CHCO adsorption energy (Table
6.2 and 6.3). However, to compare the different reaction paths, the transition
state energies should be compared relative to a reference, i.e., adsorbed CH*,
CO* and four H*. This leads to an effective surface activation barrier (Eeff) of
190 kJ/mol for the hydrogenation transition state (Table 6.3). For the RCCH–
124
O path, C-O scission has a barrier of 70 kJ/mol, and the effective barrier for
this step is lower than for the hydrogenation step. Note that the highest
effective barrier along this path, 183 kJ/mol in the presence of co-adsorbed
CO, is too high to reproduce the experimental reaction rates. There are
however several alternative CO insertion pathways (Figure 6.1). Next, we
consider a pathway via RHC* and RCH2C–O scission (Figure 6.2b). The first
step, hydrogenation of CH* to CH2* has a barrier of 61 kJ/mol and is 40
kJ/mol endothermic. Co-adsorption of CO reduces both the barrier and the
endothermicity for this step. The next step, C–C coupling, is again feasible
with a barrier of 74 kJ/mol. The effective barrier for this step is 114 kJ/mol
(Table 6.3). The presence of CO has a large effect on both the barrier and the
effective barrier for this step. While the barrier decreases by 23 kJ/mol, the
effective barrier decreases by 51 kJ/mol to 63 kJ/mol. The next step,
hydrogenation of CH2CO to CH3CO is again facilitated by the presence of co-
adsorbed CO, and the effective barrier decreases from 175 to 111 kJ/mol,
while the hydrogenation step becomes exothermic. The final step, C–O
scission has a barrier of 72 kJ/mol on the clean surface and 89 kJ/mol in the
presence of co-adsorbed CO. The effective barrier for this step reduces from
170 to 98 kJ/mol in the presence of co-adsorbed CO. The highest point along
this pathway is therefore the hydrogenation transition state, and this step is
likely rate-limiting. However, the difference with the C-O scission transition
state is small.

125
Figure 6.2. Electronic energy profile for the RCCH-O pathway (a) and for the
dominant RCH2C-O pathway (b), as illustrated in Figure 4. The reaction
energy for the overall propagation cycle, CH* + CO(g) + 2 H2(g) CH3C* +
H2O(g), is ‒229 kJ/mol, corresponding with a reaction enthalpy of ‒180
kJ/mol. The inserts illustrate selected transition states. Additional transition
state geometries can be found in Table 6.5.
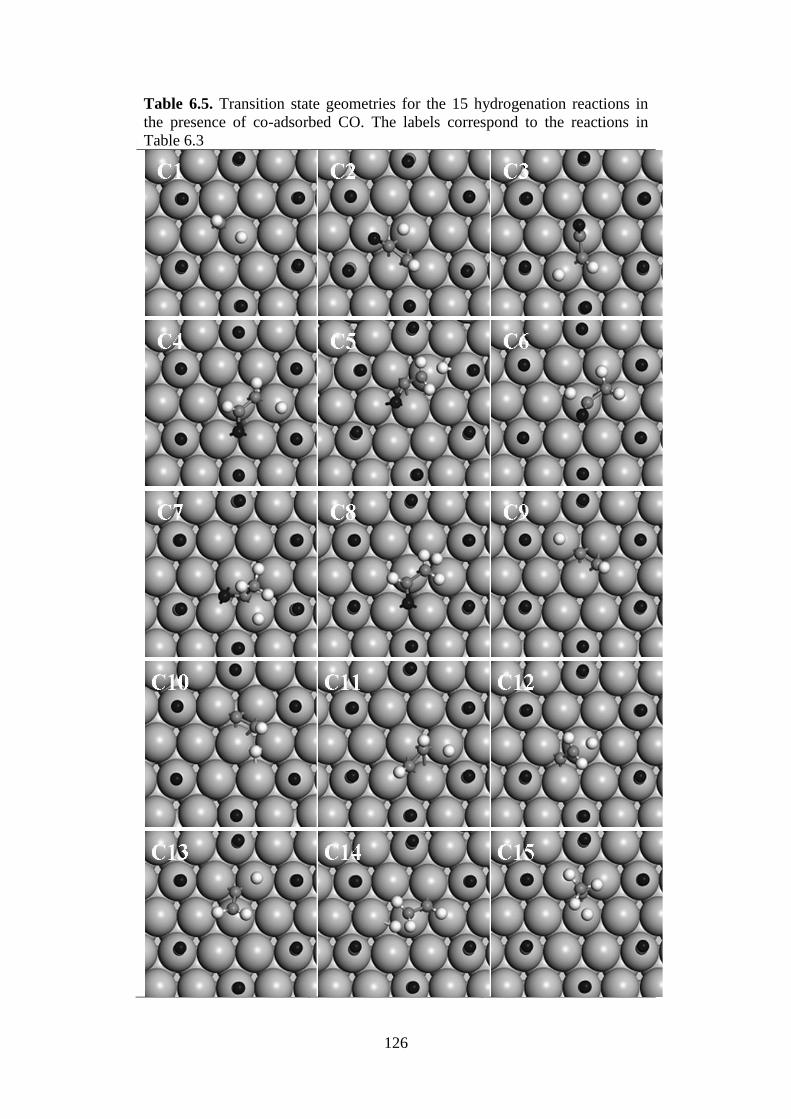
126
Table 6.5. Transition state geometries for the 15 hydrogenation reactions in
the presence of co-adsorbed CO. The labels correspond to the reactions in
Table 6.3
127
Alternatively, the CH3CO intermediate can undergo hydrogenation to
CH3CHO, followed by C–O scission (Figure 6.2b). In Chapter 5, we
determined that the C–O scission barrier for aldehydes is only 61 kJ/mol on
Co(0001). This barrier increases slightly to 70 kJ/mol at a higher CO coverage
(Table 6.3). The highest point along this reaction pathway is also the CH2CO
hydrogenation transition state with an effective barrier of 111 kJ/mol. As
determined in Chapter 5, this was not the dominant reaction pathway for the
proposed propagation mechanism (Figure 5.3) in the absence of adsorb CO*.
Though not dominant, C–O scission of CH3CHO is still possible at a low
coverage since the barrier is comparable with the adsorption energy of 56
kJ/mol (Table 6.2). However, at a higher coverage, desorption becomes easier
than C–O scission and the RCH2CHO pathway is expected to lead to
oxygenates. The selectivity towards oxygenates is however determined earlier
along this reaction path by the relative rate of CH3CO hydrogenation and
CH3C–O scission (Figure 6.2b). Since hydrogenation is a bimolecular reaction,
the hydrogen coverage strongly influences the selectivity. As discussed in
Section 4.2.2, the hydrogen coverage is determined by the adsorption Gibbs
free energy. Hence, the Gibbs free energy of both transition states relative to
CH*, CO* and gas phase H2 is calculated to compare the pathways. Figure 6.3
shows that the free energy for the C–O scission transition state is lower than
for the hydrogenation transition state and C–O scission is hence preferred over
CH3CO hydrogenation.
Finally, the first principle data can be used to calculate the steady-state CO
TOF for the propagation cycle on CO-covered terraces following a similar

128
approach we have discussed in Chapter 5. The material balances for all surface
species are written and using the calculated activation barriers and pre-
exponential factors of 1013
s−1
, steady-state coverages for all intermediate
species and CO TOF can be obtained (Chapter 5; Zhuo et al., 2009;
Chorkendorff and Niemantsverdriet, 2003). The surface concentration of RC*
groups depends on the relative initiation and termination rate in the CO
insertion mechanism, and is a parameter in the kinetic model. Different
initiation mechanisms can be envisioned (Ge and Neurock, 2006; Inderwildi et
al., 2007; Cheng et al., 2008; Zhuo et al., 2009). Using SSITKA, CHx
coverages of 0.1 ML have been determined under FT conditions (den Breejen
et al, 2009). In Chapter 5, a CO TOF of 3×10⁻⁷
s−1
has been calculated at 500
K for the CO insertion mechanism with a RC* coverage of 0.1 ML, and the
equilibrium H* and CO* coverage determined in Chapter 4. This rate is five
orders of magnitude lower than experimental values (Ojeda et al., 2010;
Riberio et al., 1997). The dominant pathway proceeds via the RCH2C–O
reaction intermediate, and the slow step is the hydrogenation of RCHCO.
However, when the barriers and reaction energies determined for a higher 1/3
ML CO coverage are used, the CO TOF increases by 5 orders of magnitude to
0.02 s−1
, and becomes close to typical experimental values. For low coverage
conditions in Chapter 5, the RCHCO hydrogenation step has a degree of rate
control (Campbell, 2001) of 0.77, while the RCH2C–O scission step has a
degree of rate control of 0.23. For a realistic CO coverage, the degree of rate
control for the RCHCO hydrogenation step increases to 0.99.
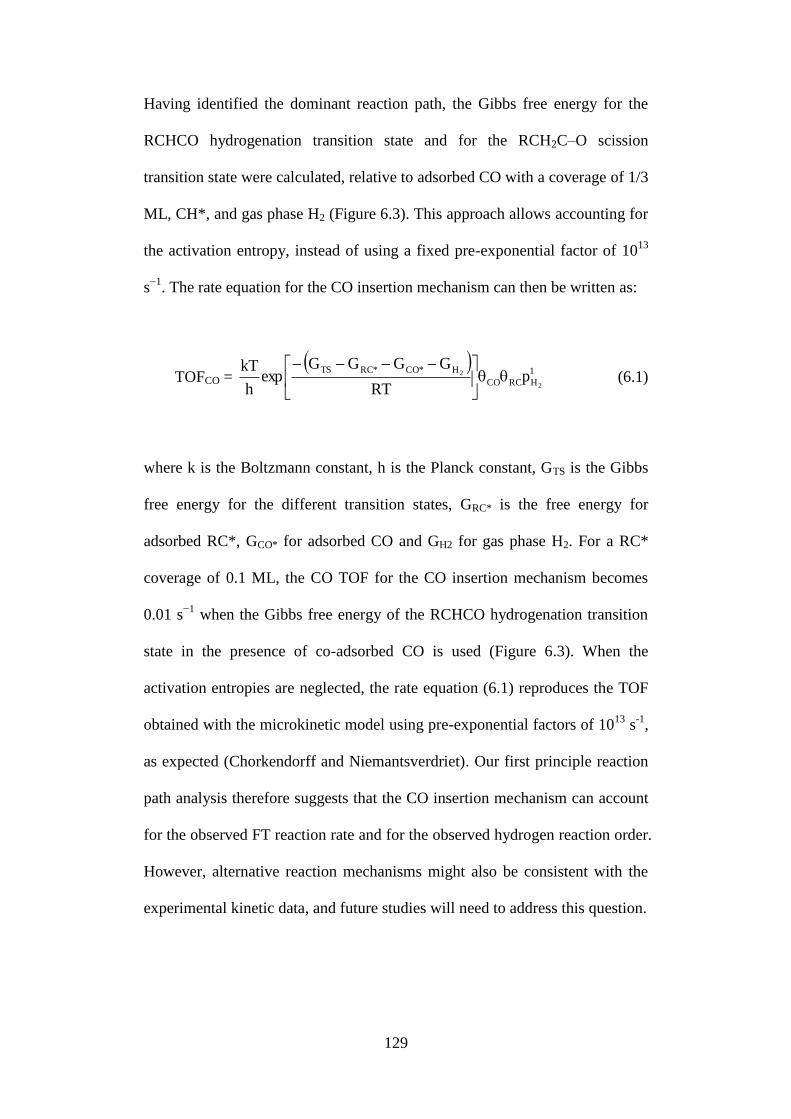
129
Having identified the dominant reaction path, the Gibbs free energy for the
RCHCO hydrogenation transition state and for the RCH2C–O scission
transition state were calculated, relative to adsorbed CO with a coverage of 1/3
ML, CH*, and gas phase H2 (Figure 6.3). This approach allows accounting for
the activation entropy, instead of using a fixed pre-exponential factor of 1013
s−1
. The rate equation for the CO insertion mechanism can then be written as:
TOFCO =
1
HRCCO
H*CO*RCTS
2
2 pRT
GGGGexp
h
kT
(6.1)
where k is the Boltzmann constant, h is the Planck constant, GTS is the Gibbs
free energy for the different transition states, GRC* is the free energy for
adsorbed RC*, GCO* for adsorbed CO and GH2 for gas phase H2. For a RC*
coverage of 0.1 ML, the CO TOF for the CO insertion mechanism becomes
0.01 s−1
when the Gibbs free energy of the RCHCO hydrogenation transition
state in the presence of co-adsorbed CO is used (Figure 6.3). When the
activation entropies are neglected, the rate equation (6.1) reproduces the TOF
obtained with the microkinetic model using pre-exponential factors of 1013
s-1
,
as expected (Chorkendorff and Niemantsverdriet). Our first principle reaction
path analysis therefore suggests that the CO insertion mechanism can account
for the observed FT reaction rate and for the observed hydrogen reaction order.
However, alternative reaction mechanisms might also be consistent with the
experimental kinetic data, and future studies will need to address this question.
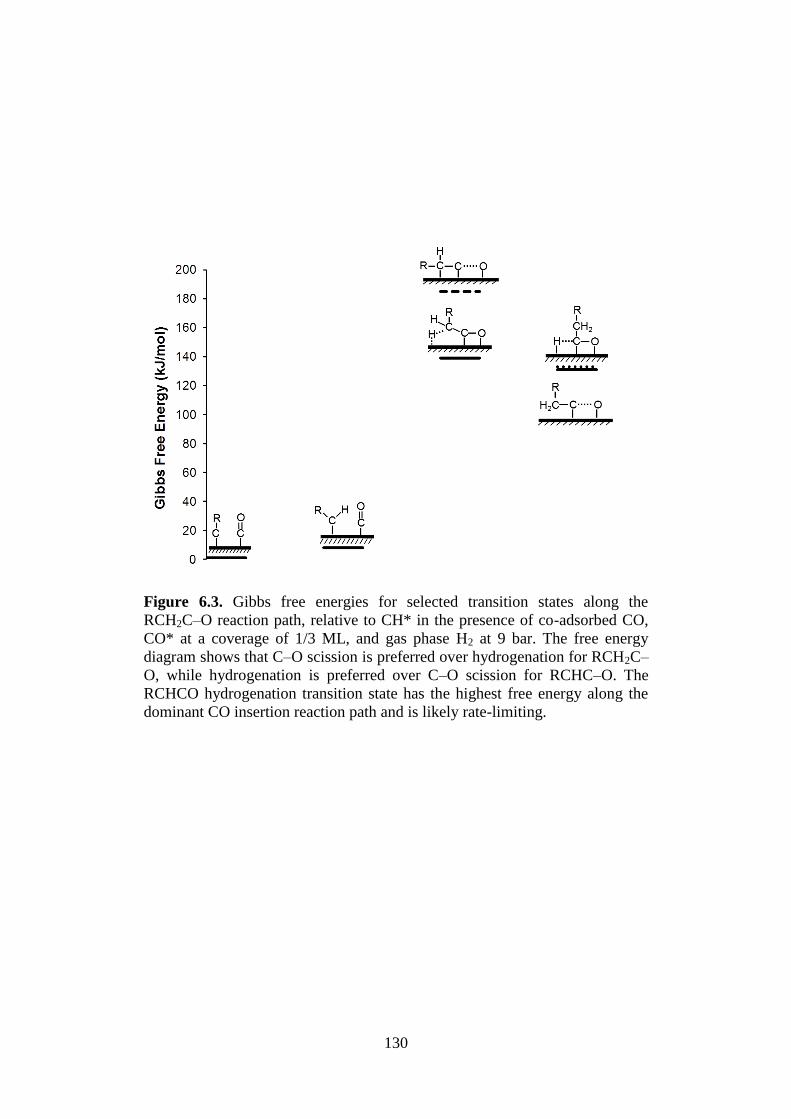
130
Figure 6.3. Gibbs free energies for selected transition states along the
RCH2C–O reaction path, relative to CH* in the presence of co-adsorbed CO,
CO* at a coverage of 1/3 ML, and gas phase H2 at 9 bar. The free energy
diagram shows that C–O scission is preferred over hydrogenation for RCH2C–
O, while hydrogenation is preferred over C–O scission for RCHC–O. The
RCHCO hydrogenation transition state has the highest free energy along the
dominant CO insertion reaction path and is likely rate-limiting.
131
6.2.2 Effect of CO coverage on the stability of carbon.
Different forms of carbon are present in a number of reaction systems
involving hydrocarbons such as steaming reforming (Rostrup-Nielsen, 1984)
and Fischer Tropsch (FT) synthesis (Fischer and Tropsch, 1923). Although
carbon is a simple reaction intermediate, the drive to understand how this
simple intermediate and its derivatives evolve in a reaction system is high.
One of the main reasons is that carbon can be detrimental to the catalyst if it is
not consumed fast enough during reaction. Therefore, an area of research
focuses on finding promoters that hinder the growth of these resilient carbon
species. Some of the successful examples include potassium (Bengaard et al.,
2002), gold (Besenbacher et al., 1998) and boron (Xu and Saeys, 2006; Xue et
al., 2009) promotion on Ni catalyst in steam reforming and boron promotion
on Co catalyst (Tan et al., 2011) in FT synthesis. To better understand the
nature of carbon in different reaction systems, another area thus focuses on the
understanding of the stability and formation of various forms of carbon on the
catalyst. This is usually done from a theoretical point of view using
computation models.
A few recent computation studies were done to provide a qualitative
understanding of carbon on metal surfaces (Xu and Saeys, 2008; Sautet and
Cinquini, 2010; van Helden and Ciobîcă, 2011; Tan et al., 2010). Xu and
Saeys (2008) looked at the stability of carbon on Ni catalysts. They found that
carbon diffusion to the octahedral sites of the first subsurface layer is
favourable up to 75% occupancy. The barrier for diffusion also becomes more
favourable when the surface is covered with some carbon. Sautet and Cinquini
132
(2010) studied the stability of carbon in the subsurface with respect to clean
closed packed surfaces of various Group 8 to 11 metals. Taking the reservoir
of various carbon sources, they show that both surface and subsurface carbon
are stable on Fe and Co up to 1/3 ML coverage. Helden and Ciobîcă (2011)
looked at the adsorption energies of carbon at various coverage on the surfaces
and in the first sub-surface layers of fcc-Co(111) and fcc-Co(100). Their
calculations suggest that carbon diffusion to the subsurface is favourable when
coverage of surface carbon is high, similar to the conclusions drawn by Xu
and Saeys (2008). Tan et al. (2010) studied the stability and formation of
various forms of carbon on a stepped Co(111) model surface. Their
calculations indicate that extended graphene islands and p4g surface carbide
are two very stable forms of carbon on the catalyst surface. The p4g surface
carbide has also been found to form on terrace surface of Co catalyst by
Ciobîcă and van Santen (2003) in an earlier study. A recent surface science
study by Weststrate et al (2012) has also suggested the presence of both
carbon species on a Co(0001) single crystal.
The studies we have just discussed focus mainly on carbon adsorption in an
environment where interactions with other possible reaction intermediates
besides carbon have been neglected. In Chapter 4, we determined that under
FT condition a Co(0001) surface is possibly covered with CO at a coverage of
1/3 ML. Then, in Section 6.2.1 (Zhuo et al, 2012), we found that it is
important to include the possible surface “spectator” species. Under the
influence of surface CO, the binding energies of all surface species evaluated
decreased by between 10-30 kJ/mol as compared to a clean Co(0001) surface.
133
This resulted in an overall decrease in the reaction energy barrier and reaction
enthalpy from endothermic to exothermic for the CO insertion mechanism. At
the same time, CO turnover frequency for the CO insertion mechanism (Zhuo
et al., 2009; 2012; Chapter 5 and 6) under a realistic CO coverage is similar to
the experimental value. Hence, in this section, we would like to further
evaluate the effect of a realistic CO coverage on the stability of surface and
subsurface carbon. First, we study the adsorption and stability of atomic
carbon on the surface and in the subsurface of a clean Co(0001) surface model.
Next, we perform a similar computation on a Co(0001) surface that is
coverage by 1/3 ML CO. We found that under a more realistic CO coverage,
carbon in the first subsurface layer is more stable by more than 10 kJ/mol even
at higher carbon concentration as compared to a clean Co surface. Some form
of attractive interaction between the CO on the surface and C in the subsurface
resulted in this improvement in stability.
All electronic adsorption energies are computed using period spin polarized
Density Functional Theory (DFT) with the Perdew–Burke–Ernzerhof
functional (DFT–PBE) (Perdew et al., 1996) as implemented in the Vienna Ab
Initio Simulation Package (VASP) (Kresse and Hafner, 1993). The catalyst
terrace surface of Co(0001) is modeled with a 5 layers p(3×3) unit cell, with
the top three layers and the adsorbates fully relaxed. An inter-slab spacing of
10 Å was found to be sufficient to minimize interactions between repeated
slabs. A (3×3×1) Г-centered k-point grid was used to sample the Brillouin
zone for the p(3×3) unit cell. To evaluate the stability of carbon under realistic
134
conditions, reaction free energies, ∆Grxn (500 K, 20 bar) with reference to a
reservoir of CO, H2 and H2O were calculated for the following reaction:
CO (g) + H2 (g) + x-C-slab (x+1)-C-slab + H2O (g) (6.2)
First, we evaluate the adsorption of carbon on the surface of a clean p(3×3)
unit cell. The preferred adsorption site is found to be the hcp hollow site with a
∆Grxn of -21.4 kJ/mol (Table 6.6). The next preferred adsorption site is on the
fcc hollow site and it is only marginally stable to adsorb on the fcc hollow
(Table 6.6). Similar site preference and adsorption energies have been found
by others (van Helden and Ciobîcă, 2011; Tan et al., 2010). The formation of a
second surface carbon is still favourable at -8.1 kJ/mol but when a third carbon
is added to the surface with two carbons, it becomes unfavourable, with a
∆Grxn of +10.2 kJ/mol (Figure 6.4a). This is in agreement with the
experimental observations by Weststrate et al. (2012) where atomic carbon
forms ( 3 3 )R30o structure on the surface. However, the structure is not
stable enough to form long range ordered adsorption configurations similar to
CO (Zhuo et al., 2012; Bride et al., 1977). This is because the increase in
number of carbon on the surface which increases the repulsion interaction (van
Santen and Neurock) between surface species. On a Co surface covered with
1/3 ML of CO, when a carbon adsorbs onto hcp site, the CO from the
neighbouring top site moves to the next neighbouring hcp site due to the
repulsion (Figure 6.4b). This greatly destabilizes the adsorption of carbon. The
∆Grxn of this carbon with respect to CO in a ( 3 3 )R30o adsorption
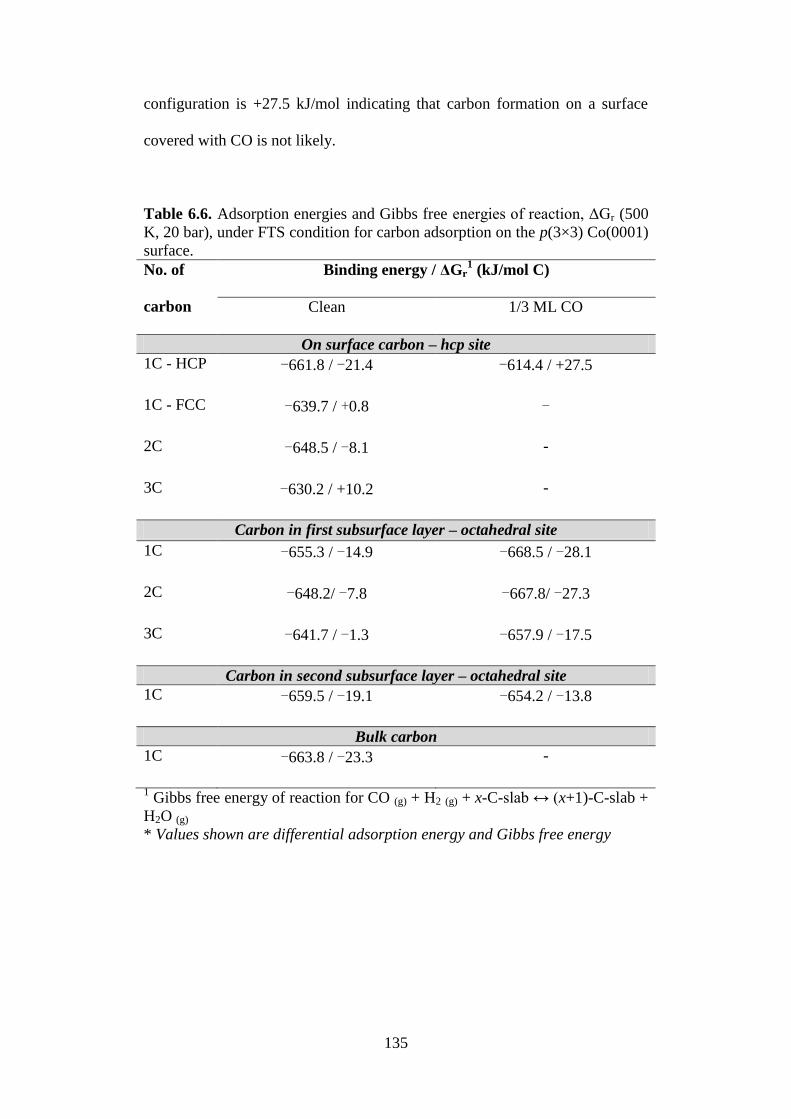
135
configuration is +27.5 kJ/mol indicating that carbon formation on a surface
covered with CO is not likely.
Table 6.6. Adsorption energies and Gibbs free energies of reaction, ΔGr (500
K, 20 bar), under FTS condition for carbon adsorption on the p(3×3) Co(0001)
surface.
No. of
carbon
Binding energy / ΔGr1 (kJ/mol C)
Clean 1/3 ML CO
On surface carbon – hcp site
1C - HCP ‒661.8 / ‒21.4 ‒614.4 / +27.5
1C - FCC ‒639.7 / +0.8 -
2C ‒648.5 / ‒8.1 -
3C ‒630.2 / +10.2 -
Carbon in first subsurface layer – octahedral site
1C ‒655.3 / ‒14.9 ‒668.5 / ‒28.1
2C ‒648.2/ ‒7.8 ‒667.8/ ‒27.3
3C ‒641.7 / ‒1.3 ‒657.9 / ‒17.5
Carbon in second subsurface layer – octahedral site 1C ‒659.5 / ‒19.1 ‒654.2 / ‒13.8
Bulk carbon 1C ‒663.8 / ‒23.3 -
1 Gibbs free energy of reaction for CO (g) + H2 (g) + x-C-slab ↔ (x+1)-C-slab +
H2O (g)
* Values shown are differential adsorption energy and Gibbs free energy

136
Figure 6.4. (a) Carbon adsorption on a clean Co(0001) surface forming a (√3
× √3)R30o configuration with a coverage of 1/3 ML; (b) Carbon adsorption in
the first sub-surface layer of a clean Co(0001) surface with a coverage of 1/3
ML; (c) Carbon adsorption on a 1/3 ML CO covered Co(0001) surface; (d)
Carbon adsorption in the first sub-surface layer of a 1/3 ML CO covered
Co(0001) surface. Colour map – Co atoms – light grey; Carbon atoms – Dark
grey; Oxygen atoms – Black
Next, we look at the stability of sub-surface carbon (Table 6.6). The first sub-
surface is defined as the space between the first and second Co layers of the
model catalyst slab. Carbon prefers the octahedral site in this first subsurface
layer and has a ∆Grxn of -14.9 kJ/mol. The adsorption energy (Table 6.6) is in
good agreement with earlier studies (van helden and Ciobîcă, 2011; Tan et al.,
2010). The results indicate that there is no energy gained for carbon to diffuse
into the subsurface at low coverage, which is also a conclusion drawn by van
Helden and Ciobîcă (2011). When a second and third carbon is added to the
first subsurface layer of our model slab, the stability of each subsequent
carbon added decrease almost linearly to -7.8 and -1.3 kJ/mol, respectively
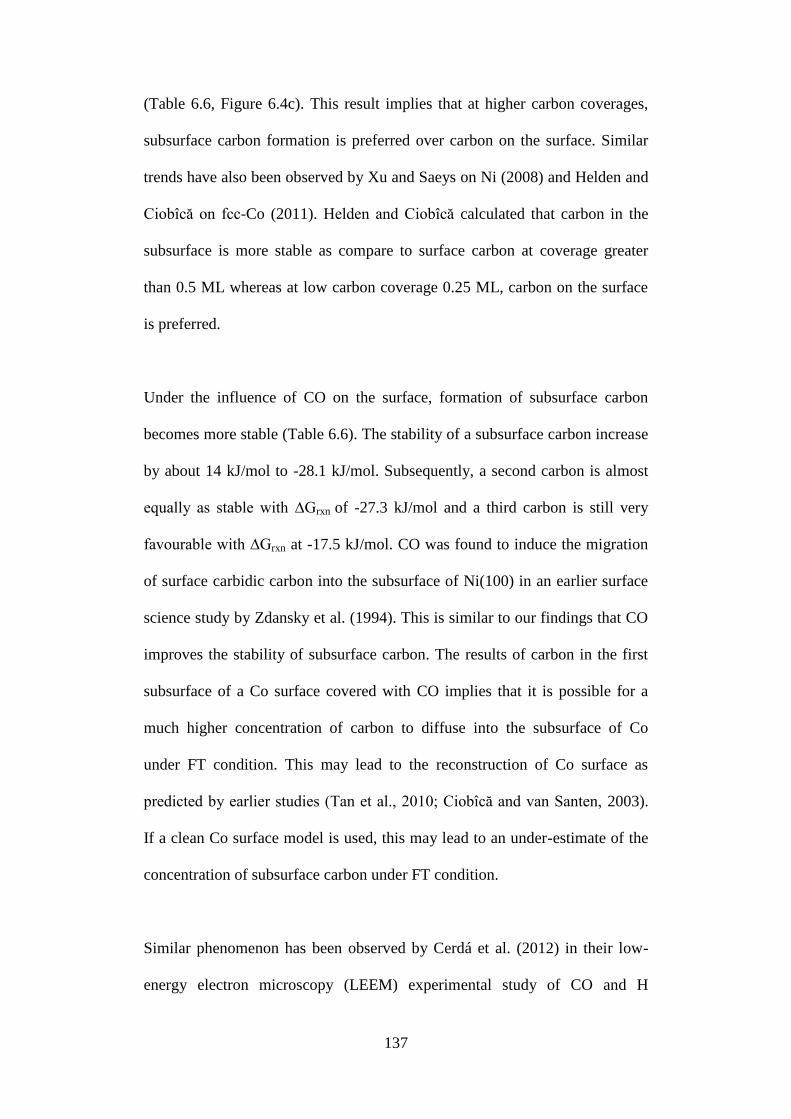
137
(Table 6.6, Figure 6.4c). This result implies that at higher carbon coverages,
subsurface carbon formation is preferred over carbon on the surface. Similar
trends have also been observed by Xu and Saeys on Ni (2008) and Helden and
Ciobîcă on fcc-Co (2011). Helden and Ciobîcă calculated that carbon in the
subsurface is more stable as compare to surface carbon at coverage greater
than 0.5 ML whereas at low carbon coverage 0.25 ML, carbon on the surface
is preferred.
Under the influence of CO on the surface, formation of subsurface carbon
becomes more stable (Table 6.6). The stability of a subsurface carbon increase
by about 14 kJ/mol to -28.1 kJ/mol. Subsequently, a second carbon is almost
equally as stable with ∆Grxn of -27.3 kJ/mol and a third carbon is still very
favourable with ∆Grxn at -17.5 kJ/mol. CO was found to induce the migration
of surface carbidic carbon into the subsurface of Ni(100) in an earlier surface
science study by Zdansky et al. (1994). This is similar to our findings that CO
improves the stability of subsurface carbon. The results of carbon in the first
subsurface of a Co surface covered with CO implies that it is possible for a
much higher concentration of carbon to diffuse into the subsurface of Co
under FT condition. This may lead to the reconstruction of Co surface as
predicted by earlier studies (Tan et al., 2010; Ciobîcă and van Santen, 2003).
If a clean Co surface model is used, this may lead to an under-estimate of the
concentration of subsurface carbon under FT condition.
Similar phenomenon has been observed by Cerdá et al. (2012) in their low-
energy electron microscopy (LEEM) experimental study of CO and H
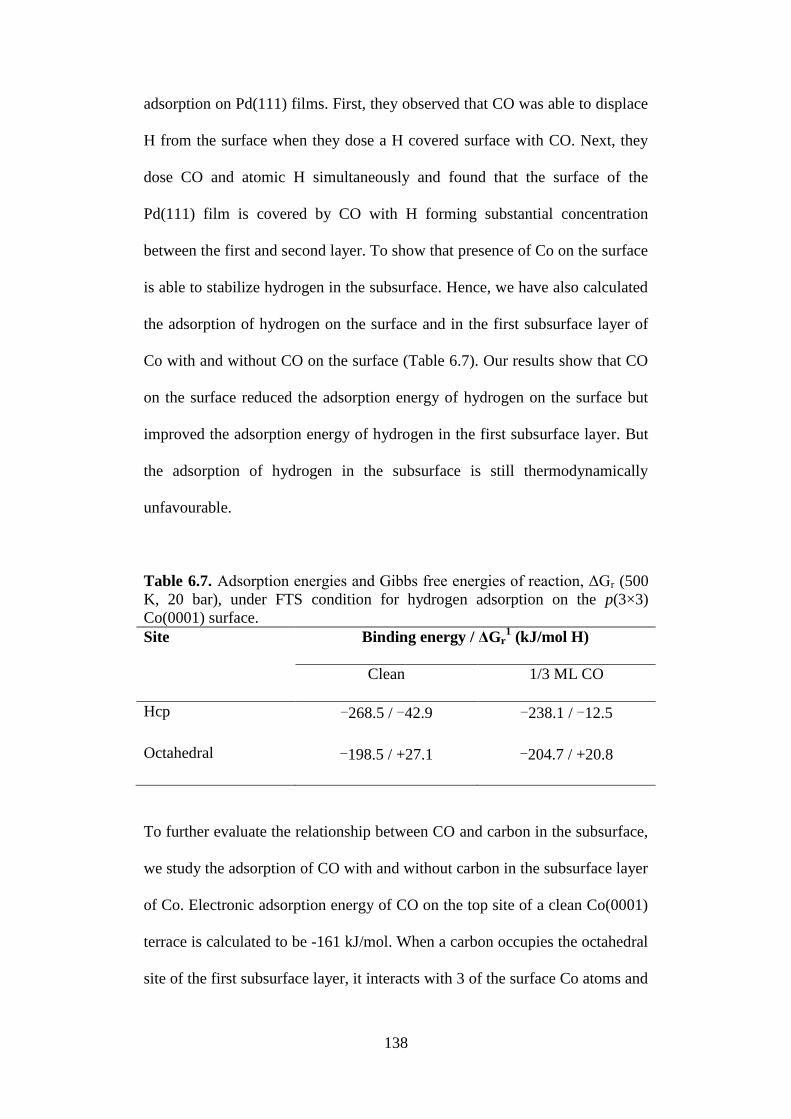
138
adsorption on Pd(111) films. First, they observed that CO was able to displace
H from the surface when they dose a H covered surface with CO. Next, they
dose CO and atomic H simultaneously and found that the surface of the
Pd(111) film is covered by CO with H forming substantial concentration
between the first and second layer. To show that presence of Co on the surface
is able to stabilize hydrogen in the subsurface. Hence, we have also calculated
the adsorption of hydrogen on the surface and in the first subsurface layer of
Co with and without CO on the surface (Table 6.7). Our results show that CO
on the surface reduced the adsorption energy of hydrogen on the surface but
improved the adsorption energy of hydrogen in the first subsurface layer. But
the adsorption of hydrogen in the subsurface is still thermodynamically
unfavourable.
Table 6.7. Adsorption energies and Gibbs free energies of reaction, ΔGr (500
K, 20 bar), under FTS condition for hydrogen adsorption on the p(3×3)
Co(0001) surface.
Site Binding energy / ΔGr1 (kJ/mol H)
Clean 1/3 ML CO
Hcp ‒268.5 / ‒42.9 ‒238.1 / ‒12.5
Octahedral ‒198.5 / +27.1 ‒204.7 / +20.8
To further evaluate the relationship between CO and carbon in the subsurface,
we study the adsorption of CO with and without carbon in the subsurface layer
of Co. Electronic adsorption energy of CO on the top site of a clean Co(0001)
terrace is calculated to be -161 kJ/mol. When a carbon occupies the octahedral
site of the first subsurface layer, it interacts with 3 of the surface Co atoms and
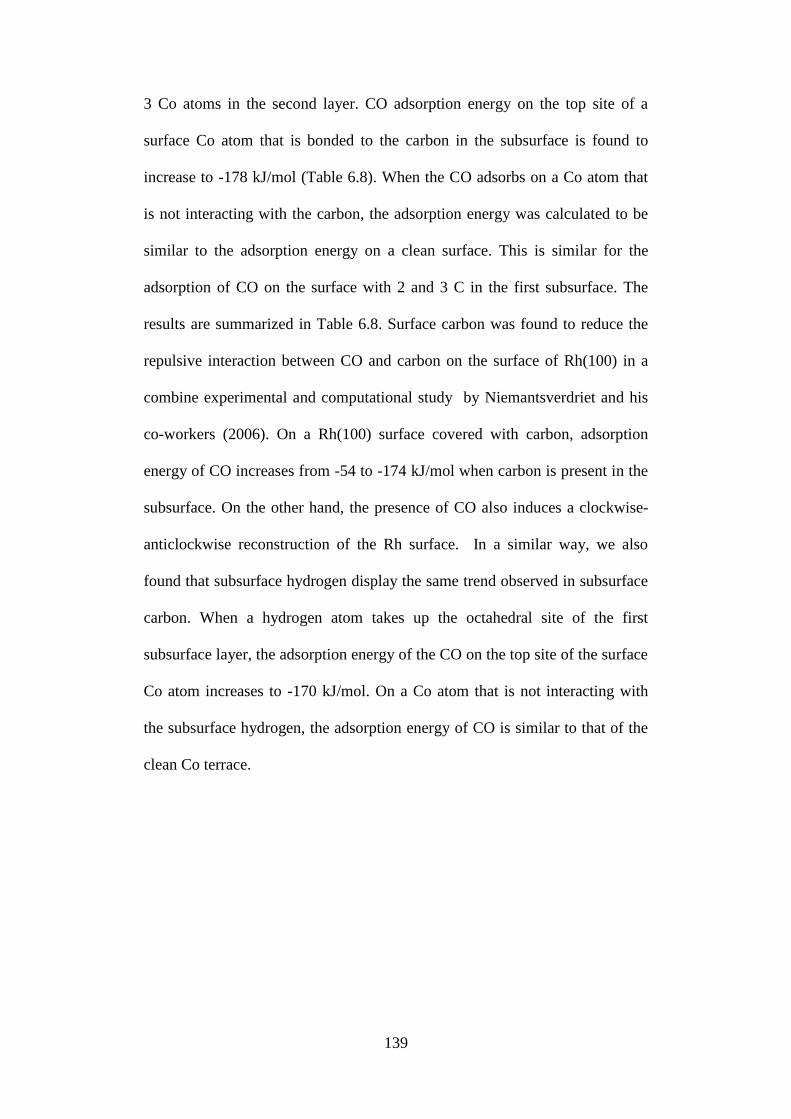
139
3 Co atoms in the second layer. CO adsorption energy on the top site of a
surface Co atom that is bonded to the carbon in the subsurface is found to
increase to -178 kJ/mol (Table 6.8). When the CO adsorbs on a Co atom that
is not interacting with the carbon, the adsorption energy was calculated to be
similar to the adsorption energy on a clean surface. This is similar for the
adsorption of CO on the surface with 2 and 3 C in the first subsurface. The
results are summarized in Table 6.8. Surface carbon was found to reduce the
repulsive interaction between CO and carbon on the surface of Rh(100) in a
combine experimental and computational study by Niemantsverdriet and his
co-workers (2006). On a Rh(100) surface covered with carbon, adsorption
energy of CO increases from -54 to -174 kJ/mol when carbon is present in the
subsurface. On the other hand, the presence of CO also induces a clockwise-
anticlockwise reconstruction of the Rh surface. In a similar way, we also
found that subsurface hydrogen display the same trend observed in subsurface
carbon. When a hydrogen atom takes up the octahedral site of the first
subsurface layer, the adsorption energy of the CO on the top site of the surface
Co atom increases to -170 kJ/mol. On a Co atom that is not interacting with
the subsurface hydrogen, the adsorption energy of CO is similar to that of the
clean Co terrace.
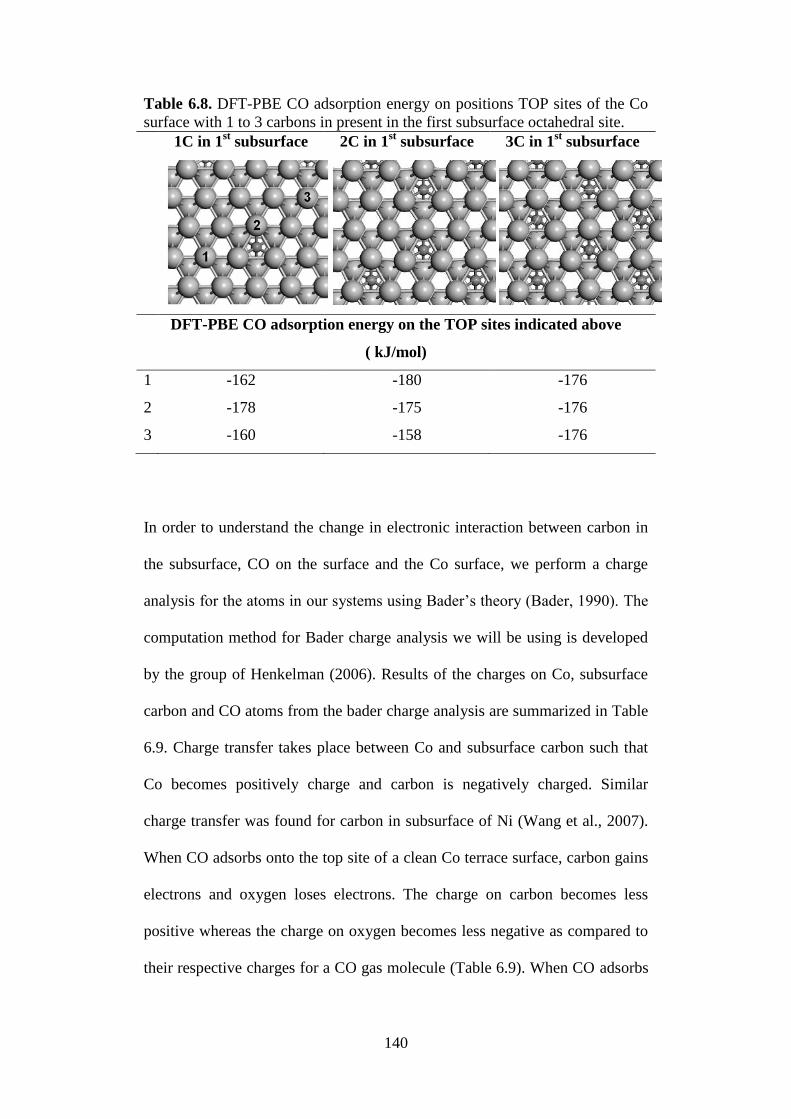
140
Table 6.8. DFT-PBE CO adsorption energy on positions TOP sites of the Co
surface with 1 to 3 carbons in present in the first subsurface octahedral site.
1C in 1st subsurface 2C in 1
st subsurface 3C in 1
st subsurface
DFT-PBE CO adsorption energy on the TOP sites indicated above
( kJ/mol)
1 -162 -180 -176
2 -178 -175 -176
3 -160 -158 -176
In order to understand the change in electronic interaction between carbon in
the subsurface, CO on the surface and the Co surface, we perform a charge
analysis for the atoms in our systems using Bader’s theory (Bader, 1990). The
computation method for Bader charge analysis we will be using is developed
by the group of Henkelman (2006). Results of the charges on Co, subsurface
carbon and CO atoms from the bader charge analysis are summarized in Table
6.9. Charge transfer takes place between Co and subsurface carbon such that
Co becomes positively charge and carbon is negatively charged. Similar
charge transfer was found for carbon in subsurface of Ni (Wang et al., 2007).
When CO adsorbs onto the top site of a clean Co terrace surface, carbon gains
electrons and oxygen loses electrons. The charge on carbon becomes less
positive whereas the charge on oxygen becomes less negative as compared to
their respective charges for a CO gas molecule (Table 6.9). When CO adsorbs
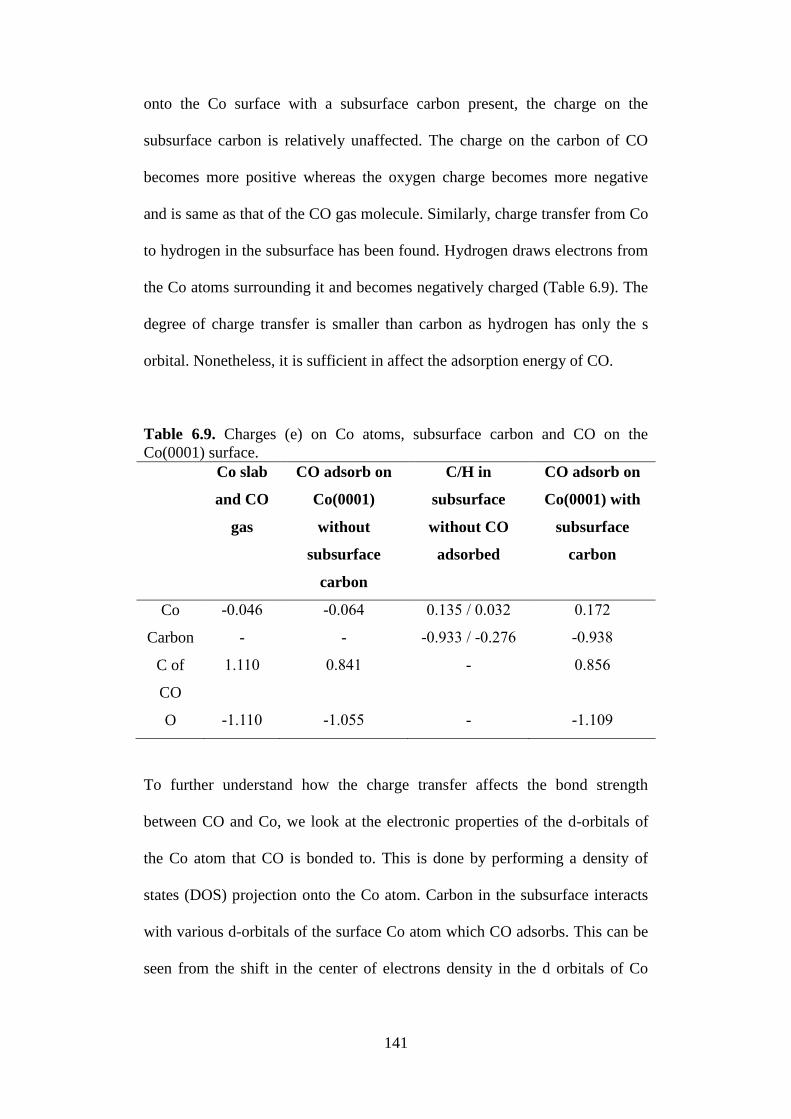
141
onto the Co surface with a subsurface carbon present, the charge on the
subsurface carbon is relatively unaffected. The charge on the carbon of CO
becomes more positive whereas the oxygen charge becomes more negative
and is same as that of the CO gas molecule. Similarly, charge transfer from Co
to hydrogen in the subsurface has been found. Hydrogen draws electrons from
the Co atoms surrounding it and becomes negatively charged (Table 6.9). The
degree of charge transfer is smaller than carbon as hydrogen has only the s
orbital. Nonetheless, it is sufficient in affect the adsorption energy of CO.
Table 6.9. Charges (e) on Co atoms, subsurface carbon and CO on the
Co(0001) surface.
Co slab
and CO
gas
CO adsorb on
Co(0001)
without
subsurface
carbon
C/H in
subsurface
without CO
adsorbed
CO adsorb on
Co(0001) with
subsurface
carbon
Co -0.046 -0.064 0.135 / 0.032 0.172
Carbon - - -0.933 / -0.276 -0.938
C of
CO
1.110 0.841 - 0.856
O -1.110 -1.055 - -1.109
To further understand how the charge transfer affects the bond strength
between CO and Co, we look at the electronic properties of the d-orbitals of
the Co atom that CO is bonded to. This is done by performing a density of
states (DOS) projection onto the Co atom. Carbon in the subsurface interacts
with various d-orbitals of the surface Co atom which CO adsorbs. This can be
seen from the shift in the center of electrons density in the d orbitals of Co
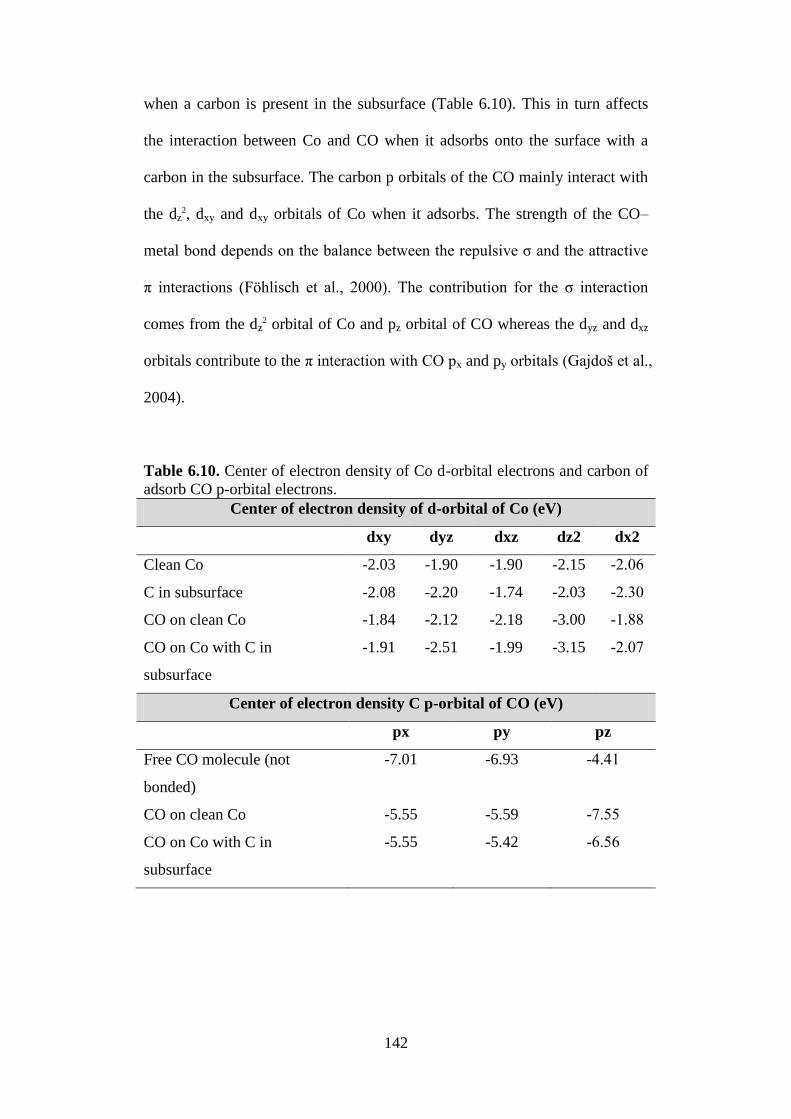
142
when a carbon is present in the subsurface (Table 6.10). This in turn affects
the interaction between Co and CO when it adsorbs onto the surface with a
carbon in the subsurface. The carbon p orbitals of the CO mainly interact with
the dz2, dxy and dxy orbitals of Co when it adsorbs. The strength of the CO–
metal bond depends on the balance between the repulsive σ and the attractive
π interactions (Föhlisch et al., 2000). The contribution for the σ interaction
comes from the dz2 orbital of Co and pz orbital of CO whereas the dyz and dxz
orbitals contribute to the π interaction with CO px and py orbitals (Gajdoš et al.,
2004).
Table 6.10. Center of electron density of Co d-orbital electrons and carbon of
adsorb CO p-orbital electrons.
Center of electron density of d-orbital of Co (eV)
dxy dyz dxz dz2 dx2
Clean Co -2.03 -1.90 -1.90 -2.15 -2.06
C in subsurface -2.08 -2.20 -1.74 -2.03 -2.30
CO on clean Co -1.84 -2.12 -2.18 -3.00 -1.88
CO on Co with C in
subsurface
-1.91 -2.51 -1.99 -3.15 -2.07
Center of electron density C p-orbital of CO (eV)
px py pz
Free CO molecule (not
bonded)
-7.01 -6.93 -4.41
CO on clean Co -5.55 -5.59 -7.55
CO on Co with C in
subsurface
-5.55 -5.42 -6.56

143
The center of the d-electrons density in the dz2 orbital of surface Co atom shifts
closer to the Fermi level by 0.12 eV as a result of carbon occupying the
octahedral site of the first subsurface layer (Table 6.10). The d-electrons
density in the dxy orbital also shifts closer by 0.16 eV whereas the center of the
d-electrons density in dyz orbital shifts away from the Fermi level by 0.3 eV
(Table 6.10). The net effect of the shifts in dxz and dyz orbitals results in the
weakening of the attractive π interaction between Co and CO. This increases
the C=O bond strength as the vibrational frequency of C=O bond increase
from 1973 cm-1
on a clean Co terrace to 1988 cm-1
on a Co terrace with a
subsurface carbon. The C=O bond length also decreases from 1.167 Å to
1.165 Å. As the dz2 orbital shifts closer to the Fermi level, the resultant 5σ–dz
2
bonding and anti-bonding of the CO–Co bond will also shift up. The shifting
of the 5σ–dz2 anti-bonding further above the Fermi reduces the repulsive
interaction. To confirm this, we found that the carbon pz orbital of CO shifts
up when it adsorbs onto Co surface with a subsurface carbon as compared to a
Co surface without subsurface carbon. This reduction in repulsive σ
interaction most likely over-writes the weakening in the attractive π interaction.
Indeed, there is only a slight shift in the carbon py orbital of CO upwards
whereas the px orbital remains unaffected (Table 6.10). Therefore, CO
adsorption increases when a carbon occupies the subsurface of the Co terrace
surface.
This is the same for hydrogen in the subsurface. Hydrogen causes the center of
the d-electrons density in the dz2 orbital of Co to shift closer to the Fermi level
by 0.11 eV and the dxz to shift closer by 0.06 eV. The center of the d-electrons
144
density of the dyz remains unchanged, similar to a clean Co terrace. This
results in a reduction in repulsive σ interaction as well as increase in attractive
π interaction between CO and Co. Therefore, the adsorption energy of CO
increases. Hence, there is an attractive interaction between CO and subsurface
carbon or hydrogen that improves the stability of subsurface carbon when the
surface is covered with CO.
Next, we further find out how the different surface models predict the
possibility of carbon diffusion into the bulk. Some experimental evidences (for
example Agrawal et al., 1981) do indicate that carbon may form bulk carbide
in cobalt but the probability of formation is still very low as indicated by
Tsakoumis et al. (2010). To lend further support to this, the group of Davis
(2011) studied the hydrogenation of CO over cobalt carbide. Their results
suggest that Co2C tend to form metallic Co under FT condition to produce
hydrocarbons. Hence, to further explore the possibility of carbon diffusion into
the bulk, we looked at the adsorption of carbon in the second sub-surface layer
of our catalyst models. Without the influence of surface CO, it is
thermodynamically favourable for a carbon to take up the octahedral position
in the second subsurface layer and the ∆Grxn is -19.1 kJ/mol (Table 6.6). When
the surface is covered with CO at a coverage of 1/3 ML CO, the stability of
the carbon in the second subsurface layer decrease slightly to -13.8 kJ/mol.
Though it is still favourable, there is no significant energy gain for carbon to
diffuse from the first subsurface into the second subsurface under the
influence of CO on the surface. However, if the surface is not covered with
CO, it is possible for a single carbon atom to penetrate further into the second
145
subsurface layer. To further understand the likelihood of carbon to diffuse into
the bulk, we placed a single carbon atom in a 3×3×6 hcp-Co supercell without
vacuum space to simulate a bulk carbon at low concentration. The ∆Grxn for
the carbon in the bulk model is calculated to be -23.3 kJ/mol (Table 6.6).
Based on the results calculated, a clean Co model will predict a higher
probability for carbon to diffuse into the bulk as compared to a Co surface that
is covered with CO. Again, we can see that one may make an error in
predicting the behavior of carbon as it takes up an adsorption site that is
further into the cobalt catalyst if a clean Co surface model is applied for the
study.
146
6.3 Conclusions
The effect of a realistic CO coverage on the kinetics of the CO insertion
mechanism for FT synthesis was evaluated in Section 6.2.1. The presence of
1/3 ML CO reduces the adsorption energies of reactants, intermediates and
transition states. Since the FT mechanism involves bimolecular surface
reactions, the reduced stabilities increase the rate for the CO insertion
mechanism. DFT calculations show that the calculated CO turnover frequency
for the CO insertion mechanism on Co terraces reproduces experimental rates
when the high CO coverage is taken into account. In the dominant mechanism,
RC* groups hydrogenate to RCH*, undergo C–C coupling and hydrogenation
to RCH2CO, followed by C–O scission. The mechanism furthermore suggests
that the oxygenate selectivity is determined by the relative rate of RCH2C-O
scission and hydrogenation. Because of the relatively low hydrogen coverage,
C–O scission is faster than hydrogenation.
We have also presented an analysis of carbon stability under the influence of
CO on the surface. Our results suggest that it is important to study the stability
of carbon with a more realistic surface model. An attractive interaction is
present between CO on the surface and carbon in the subsurface. Under the
influence of CO on the surface, carbon shows higher stability in the first
subsurface layer. This indicates that a higher carbon concentration in the
subsurface is possible. Similarly, the presence of carbon in the subsurface also
increases the adsorption energy of CO on the surface. We have shown that by
considering the interactions between CO and carbon, different conclusions on
the behavior of carbon can be drawn.

147
6.3 References
Cheng, J.; Hu, P.; Ellis, P.; French, S.; Kelly, G.; Lok, C. M. J. Phys. Chem. C.
2008, 112, 9464.
Chorkendorff, I.; Niemantsverdriet, J. W. “Concepts of Modern Catalysis and
Kinetics” Wiley: New York, 2003, p. 276.
den Breejen, J. P.; Radstake, P. B.; Bezemer, G. L.; Bitter, G. L.; Frøseth, V.;
Holmen, A.; de Jong, K. P. J. Am. Chem. Soc. 2009, 131, 7197.
Getman, R.B.; Schneider, W.F.; Smeltz, A.D.; Delgass, W.N.; Ribeiro, F.H.
Phys. Rev. Lett. 2009, 102. 076101.
Ge, Q.-F.; Neurock, M. J. Phys. Chem. B. 2006, 110, 15368.
Herranz, T.; Deng, X.; Cabot, A.; Guo, J.; Salmeron, M. J. Phys. Chem. B
2009, 113, 10721.
Inderwildi, O. R.; King, D. A.; Jenkins, S. J. Phys. Chem. Chem. Phys. 2009,
11, 11110.
Inderwildi, O. R.; Jenkins, S. J.; King, D. A. J. Phys. Chem. C 2007, 112, 5.
Masters, C. Adv. Organomet. Chem. 1979, 17, 61.
Mei, D.; Sheth, P.A.; Neurock, M.; Smith, C.M. J. Catal. 2006, 242, 1.
Ojeda, M.; Nabar, R.; Milekar, A. U.; Ishikawa, A.; Mavrikakis, M.; Iglesia, E.
J. Catal. 2010, 272, 287.
Pichler, H.; Schulz, H. Chem.-Ing.-Tech. 1970, 42, 1162.
Riberio, F. H.; Schach von Wittenau, A. E.; Bartholomew, C. H.; Somorjai, G.
A. Catal. Rev. Sci. Eng. 1997, 39, 49
Shan, B.; Kapur, N.; Hyun, J.; Wang, L.; Nicholas, J.B.; Cho, K. J. Phys.
Chem. C 2009 113, 710.
148
Scheijen, F.J.E.; Ferré, D.C.; Niemantsverdriet, J.W. J. Phys. Chem. C 2009,
113, 11041.
Weststrate, C. J.; Gericke, H. J.; Verhoeven, M. W. G. M.; Ciobîcă, I. M.; Saib,
A. M.; Niemantsverdriet, J. W. J. Phys. Chem. Lett. 2010, 1, 1767.
Zhuo, M.; Tan, K. F.; Borgna, A.; Saeys, M. J. Phys. Chem. C 2009, 113,
8357.
Perdew, J. P.; Burke, K.; Ernzerhof, M. Phys. Rev. Lett. 1996, 77, 3865.
Kresse, G; Hafner, J. Phys. Rev. B 1993, 48, 13115.
Kresse, G; Hafner, J. Phys. Rev. B 1993, 47, 558.
Bridge, M. E.; Comrie, C. M.; Lambert, R. M. Surf. Sci. 1977, 63, 393.
van Santen, R. A.; Neurock, M. Molecular Heterogeneous Catalysis, Wiley-
VCH, 2006, p. 143.
Zdansky, E. O. F.; Nilsson, A.; Mårtensson, N. Surf. Sci. Lett. 1994, 310, L583.
Cerdá, J. I.; Santos, B.; Herranz,; Puerta, J. M.; de la Figuera, J.; McCarty. K.
F. J. phys. Chem. Lett. 2012, 3, 87.
Nieskens, D. L. S.; Jansen, M. M. M.; van Bavel, A. P.; Curulla-Ferré,
Niemantsverdriet, J. W. Phys. Chem. Chem. Phys. 2006, 8, 624.
Bader, R. F. W. Atoms in Molecules – A Quantum Theory, Oxford University
Press, Oxford, 1990.
Henkelman, G.; Arnaldsson, A.; Jónsson, H. Comput. Mater. Sci. 2006, 36,
254.
Wang, S.-G.; Liao, X.-Y.; Cao, D.-B.; Li, W.-Y.; Wang, J.; Jiao, H. J. Phys.
Chem. C. 2007, 111, 10894.
Föhlisch, A.; Nyberg, M.; Hasselström, J.; Karis, O.; Pettersson, L. G. M.;
Nilsson, A. Phys. Rev. Lett. 2000, 85, 3309.
149
Gajdoš, M.; Eichler, A.; Hafner, J. J. Phys. Condens. Matter 2004, 16, 1141.
Agrawal, P. K.; Katzer, J. R.; Monogue, W. H. J. Catal. 1981, 69, 312.
Tsakoumis, N. E.; Rønning, M.; Borg, Ø.; Rytter, E.; Holmen, A. Catal.
Today 2010, 154, 162.
Mohandas, J. C.; Gnanamani, M. K.; Jacobs, G.; Ma, W.; Ji, Y.; Khalid, S.;
Davis, B. H. ACS Catal. 2011, 1, 1581.
150
CHAPTER 7
INITIAL EXPERIMENTAL STUDIES OF FISCHER-
TROPSCH SYNTHESIS OVER Co CATALYSTS.
EFFECT OF BORON PROMOTION AND CO-
FEEDING MECHANISTIC STUDIES
7.1 Introduction
In this Chapter, we discuss initial experimental results from the parallel micro
fixed bed reactor (Figure 3.5) that has been set-up for catalysts testing. As a
baseline case, an unpromoted 20 wt% Co/γ-Al2O3 catalyst was tested for 48
hours. Next, the effect of boron promotion on Co catalyst is tested in this new
reactor system. For this experiment, the catalyst was tested for 120 hours to
further show that the reactor is able to provide stable data for longer periods of
FT synthesis. Finally, we will be discussing initial findings from an aldehyde
co-feeding experiment. One of the four parallel reactors was modified as
discussed in Section 3.4.3 to allow co-feeding of a liquid aldehyde with syngas
during FT synthesis. Through this experiment, we expect to obtain evidence to
support the proposed CO insertion mechanism discussed in earlier chapters.
This experiment also illustrates how to use the reactor system for mechanistic
studies. The catalysts used for the reactor testing and the co-feeding

151
experiments were synthesized based on the procedure discussed in Section
3.4.1.
7.2 Results and Discussion
7.2.1 Testing of the reactor system
A benchmark experiment was carried out to test the reactor system. All the
four parallel reactors have been tested and only the result from one of the
reactor tests is shown. For the reactor test, a 20 wt% Co/γ-Al2O3 catalyst
promoted with 0.05 wt% Pt was used. Pt was added in small amounts to
improve the reducibility of the catalyst (e.g., Tan et al., 2010). The reactor
with an internal diameter of 1 cm is loaded with 1.0 g of catalyst with a
particle size range of 210 to 300 μm. The catalyst was diluted with
approximately 3 g of SiC (1:2 v/v) with the same particle size range. The
catalyst was reduced in-situ for 12 hours under H2 (50 Nml/min) at 673 K and
atmospheric pressure. Then it was allowed to cool to 393 K prior to FT
synthesis. Next, syngas with a H2:CO ratio of 2 was introduced at a W/F 7.5
gcat h/mol and the reactor was brought to the reaction conditions of 493 K and
20 bar at a heating rate of 1 K/min. After 48 hours of FT synthesis, the reactor
temperature was reduced to 393 K while maintaining the flow of syngas. The
CO conversion and product selectivity for 48 hours of FT synthesis are shown
in Figure 7.1.
The CO conversion at the reaction conditions reached a maximum of about 40%
and gradually decreased to about 37% at the end of 48 hours. Methane (CH4)
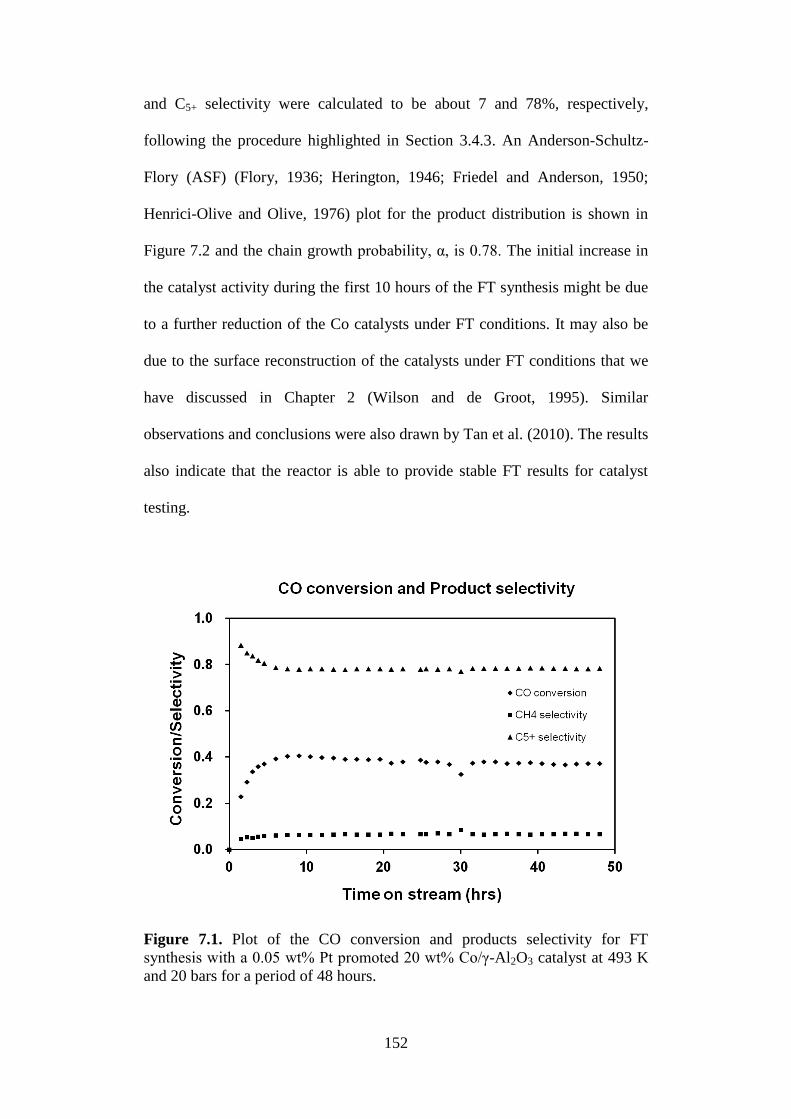
152
and C5+ selectivity were calculated to be about 7 and 78%, respectively,
following the procedure highlighted in Section 3.4.3. An Anderson-Schultz-
Flory (ASF) (Flory, 1936; Herington, 1946; Friedel and Anderson, 1950;
Henrici-Olive and Olive, 1976) plot for the product distribution is shown in
Figure 7.2 and the chain growth probability, α, is 0.78. The initial increase in
the catalyst activity during the first 10 hours of the FT synthesis might be due
to a further reduction of the Co catalysts under FT conditions. It may also be
due to the surface reconstruction of the catalysts under FT conditions that we
have discussed in Chapter 2 (Wilson and de Groot, 1995). Similar
observations and conclusions were also drawn by Tan et al. (2010). The results
also indicate that the reactor is able to provide stable FT results for catalyst
testing.
Figure 7.1. Plot of the CO conversion and products selectivity for FT
synthesis with a 0.05 wt% Pt promoted 20 wt% Co/γ-Al2O3 catalyst at 493 K
and 20 bars for a period of 48 hours.
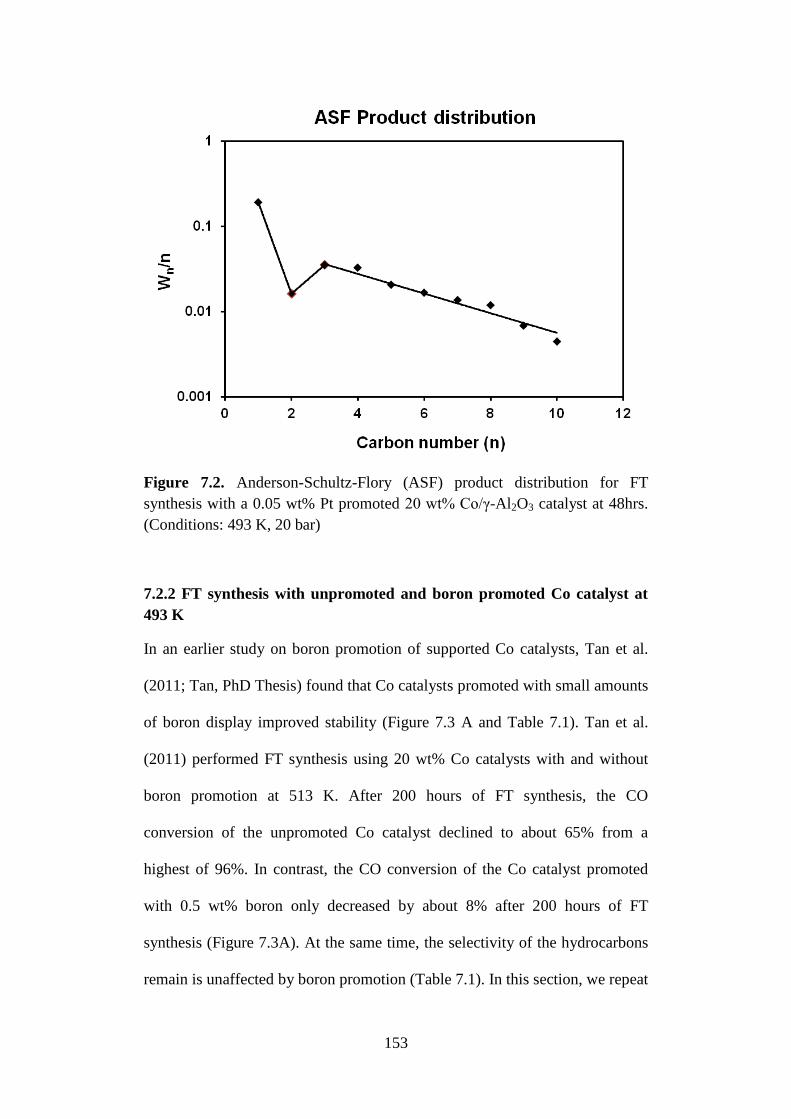
153
Figure 7.2. Anderson-Schultz-Flory (ASF) product distribution for FT
synthesis with a 0.05 wt% Pt promoted 20 wt% Co/γ-Al2O3 catalyst at 48hrs.
(Conditions: 493 K, 20 bar)
7.2.2 FT synthesis with unpromoted and boron promoted Co catalyst at
493 K
In an earlier study on boron promotion of supported Co catalysts, Tan et al.
(2011; Tan, PhD Thesis) found that Co catalysts promoted with small amounts
of boron display improved stability (Figure 7.3 A and Table 7.1). Tan et al.
(2011) performed FT synthesis using 20 wt% Co catalysts with and without
boron promotion at 513 K. After 200 hours of FT synthesis, the CO
conversion of the unpromoted Co catalyst declined to about 65% from a
highest of 96%. In contrast, the CO conversion of the Co catalyst promoted
with 0.5 wt% boron only decreased by about 8% after 200 hours of FT
synthesis (Figure 7.3A). At the same time, the selectivity of the hydrocarbons
remain is unaffected by boron promotion (Table 7.1). In this section, we repeat
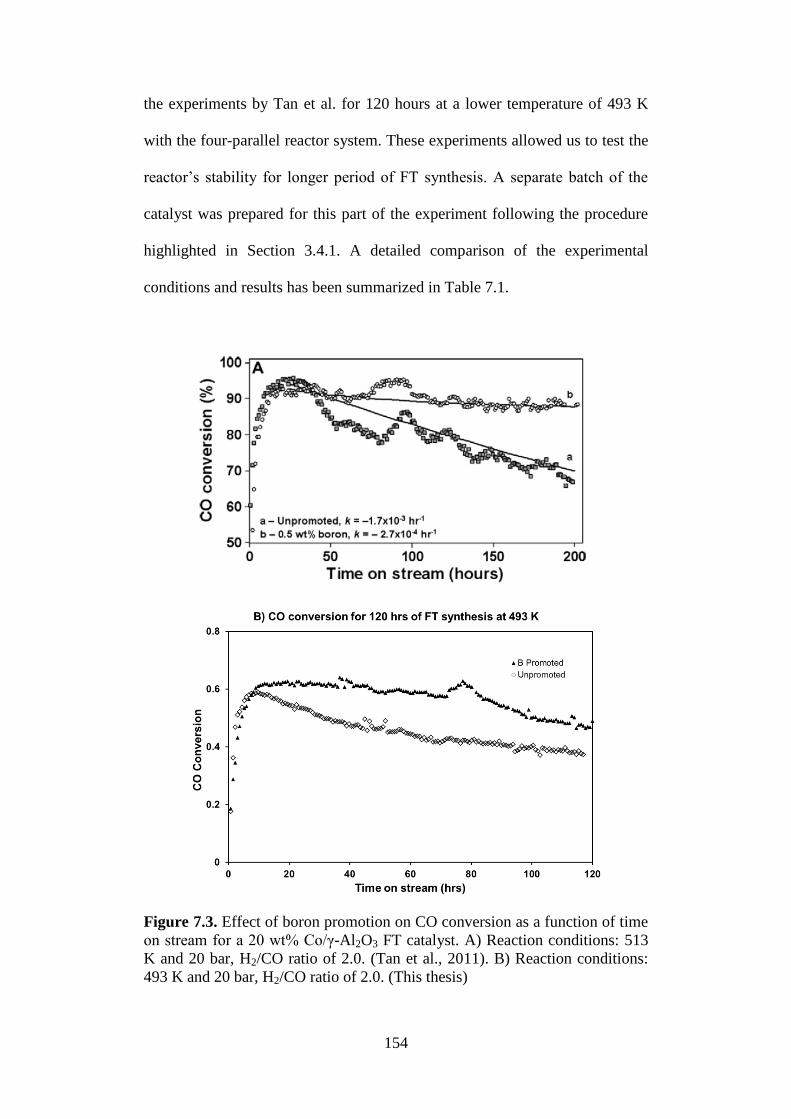
154
the experiments by Tan et al. for 120 hours at a lower temperature of 493 K
with the four-parallel reactor system. These experiments allowed us to test the
reactor’s stability for longer period of FT synthesis. A separate batch of the
catalyst was prepared for this part of the experiment following the procedure
highlighted in Section 3.4.1. A detailed comparison of the experimental
conditions and results has been summarized in Table 7.1.
Figure 7.3. Effect of boron promotion on CO conversion as a function of time
on stream for a 20 wt% Co/γ-Al2O3 FT catalyst. A) Reaction conditions: 513
K and 20 bar, H2/CO ratio of 2.0. (Tan et al., 2011). B) Reaction conditions:
493 K and 20 bar, H2/CO ratio of 2.0. (This thesis)
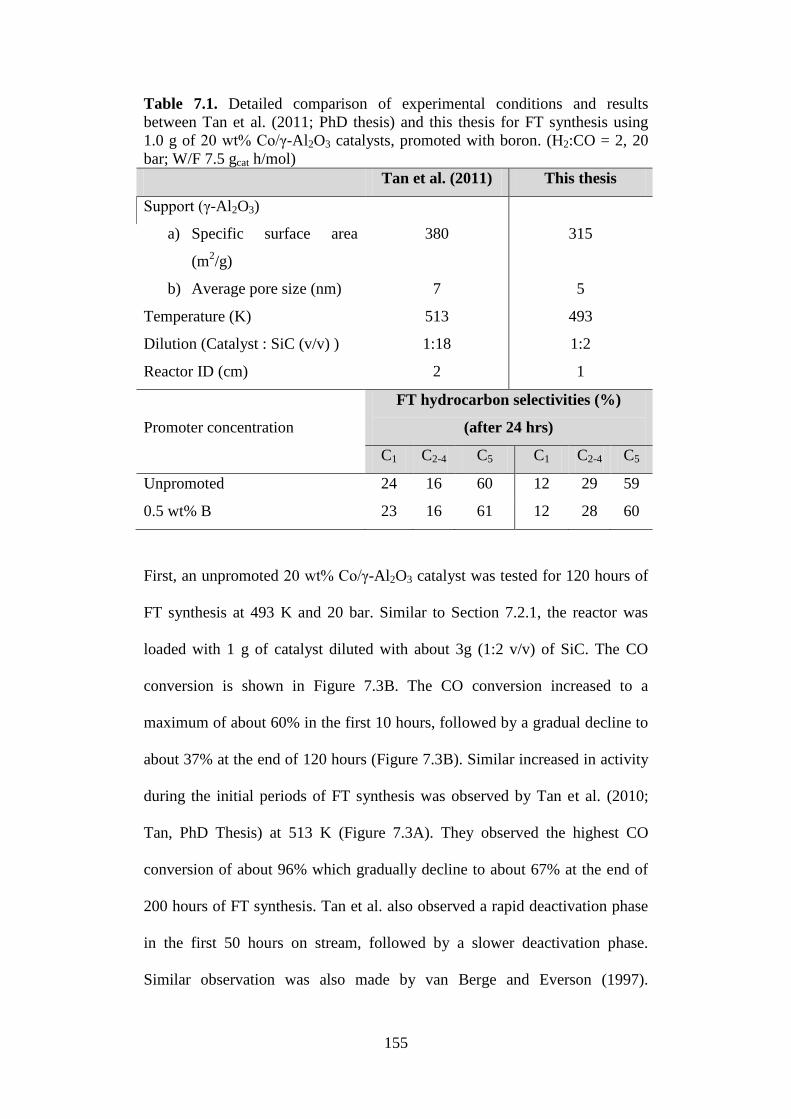
155
Table 7.1. Detailed comparison of experimental conditions and results
between Tan et al. (2011; PhD thesis) and this thesis for FT synthesis using
1.0 g of 20 wt% Co/γ-Al2O3 catalysts, promoted with boron. (H2:CO = 2, 20
bar; W/F 7.5 gcat h/mol)
Tan et al. (2011) This thesis
Support (γ-Al2O3)
a) Specific surface area
(m2/g)
b) Average pore size (nm)
380
7
315
5
Temperature (K) 513 493
Dilution (Catalyst : SiC (v/v) ) 1:18 1:2
Reactor ID (cm) 2 1
Promoter concentration
FT hydrocarbon selectivities (%)
(after 24 hrs)
C1 C2-4 C5 C1 C2-4 C5
Unpromoted 24 16 60 12 29 59
0.5 wt% B 23 16 61 12 28 60
First, an unpromoted 20 wt% Co/γ-Al2O3 catalyst was tested for 120 hours of
FT synthesis at 493 K and 20 bar. Similar to Section 7.2.1, the reactor was
loaded with 1 g of catalyst diluted with about 3g (1:2 v/v) of SiC. The CO
conversion is shown in Figure 7.3B. The CO conversion increased to a
maximum of about 60% in the first 10 hours, followed by a gradual decline to
about 37% at the end of 120 hours (Figure 7.3B). Similar increased in activity
during the initial periods of FT synthesis was observed by Tan et al. (2010;
Tan, PhD Thesis) at 513 K (Figure 7.3A). They observed the highest CO
conversion of about 96% which gradually decline to about 67% at the end of
200 hours of FT synthesis. Tan et al. also observed a rapid deactivation phase
in the first 50 hours on stream, followed by a slower deactivation phase.
Similar observation was also made by van Berge and Everson (1997).
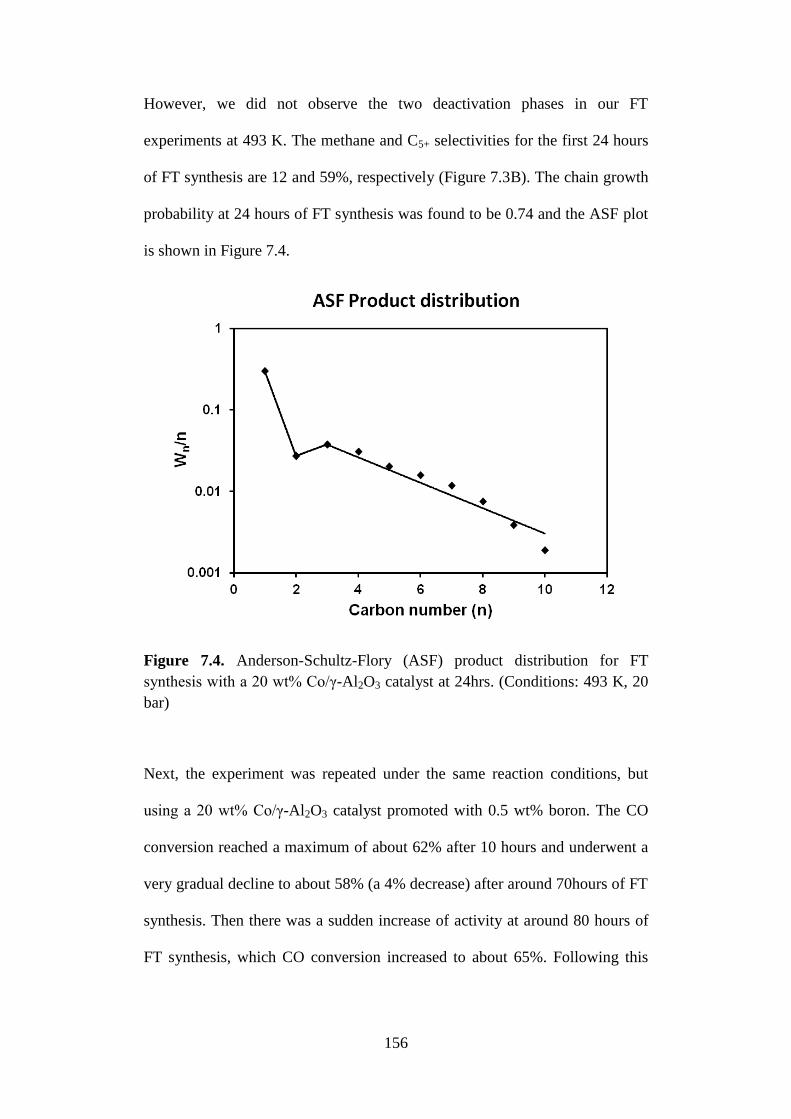
156
However, we did not observe the two deactivation phases in our FT
experiments at 493 K. The methane and C5+ selectivities for the first 24 hours
of FT synthesis are 12 and 59%, respectively (Figure 7.3B). The chain growth
probability at 24 hours of FT synthesis was found to be 0.74 and the ASF plot
is shown in Figure 7.4.
Figure 7.4. Anderson-Schultz-Flory (ASF) product distribution for FT
synthesis with a 20 wt% Co/γ-Al2O3 catalyst at 24hrs. (Conditions: 493 K, 20
bar)
Next, the experiment was repeated under the same reaction conditions, but
using a 20 wt% Co/γ-Al2O3 catalyst promoted with 0.5 wt% boron. The CO
conversion reached a maximum of about 62% after 10 hours and underwent a
very gradual decline to about 58% (a 4% decrease) after around 70hours of FT
synthesis. Then there was a sudden increase of activity at around 80 hours of
FT synthesis, which CO conversion increased to about 65%. Following this
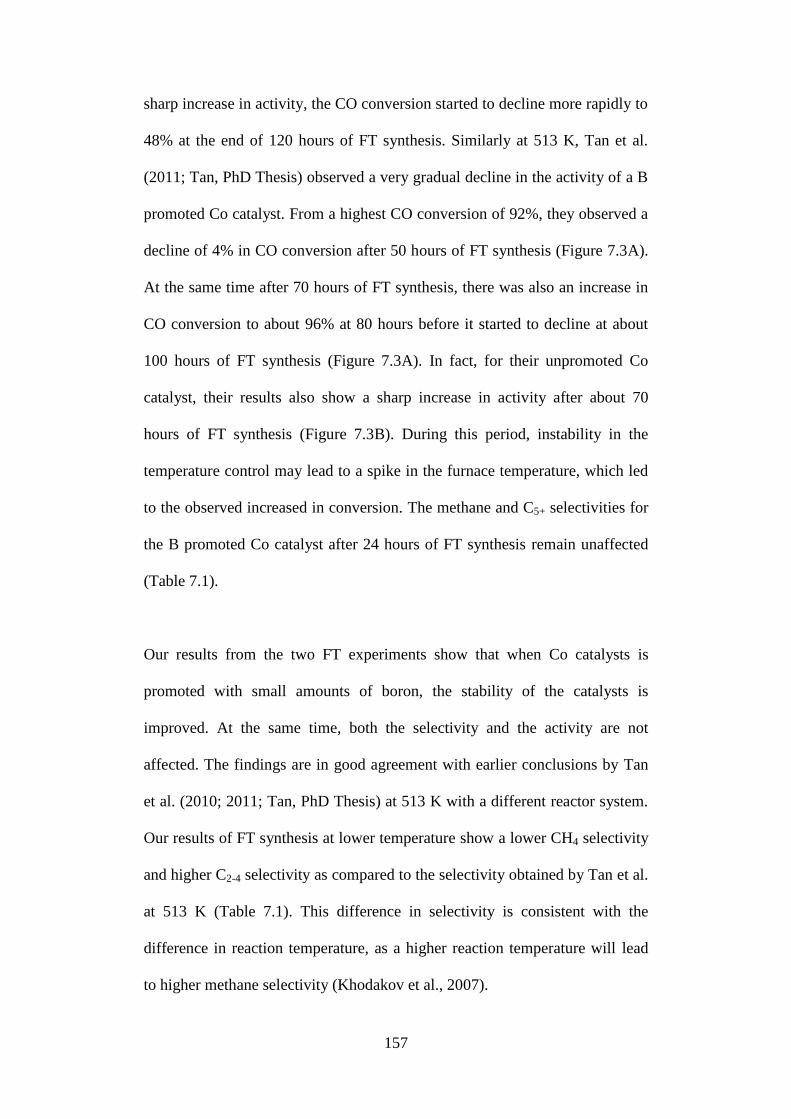
157
sharp increase in activity, the CO conversion started to decline more rapidly to
48% at the end of 120 hours of FT synthesis. Similarly at 513 K, Tan et al.
(2011; Tan, PhD Thesis) observed a very gradual decline in the activity of a B
promoted Co catalyst. From a highest CO conversion of 92%, they observed a
decline of 4% in CO conversion after 50 hours of FT synthesis (Figure 7.3A).
At the same time after 70 hours of FT synthesis, there was also an increase in
CO conversion to about 96% at 80 hours before it started to decline at about
100 hours of FT synthesis (Figure 7.3A). In fact, for their unpromoted Co
catalyst, their results also show a sharp increase in activity after about 70
hours of FT synthesis (Figure 7.3B). During this period, instability in the
temperature control may lead to a spike in the furnace temperature, which led
to the observed increased in conversion. The methane and C5+ selectivities for
the B promoted Co catalyst after 24 hours of FT synthesis remain unaffected
(Table 7.1).
Our results from the two FT experiments show that when Co catalysts is
promoted with small amounts of boron, the stability of the catalysts is
improved. At the same time, both the selectivity and the activity are not
affected. The findings are in good agreement with earlier conclusions by Tan
et al. (2010; 2011; Tan, PhD Thesis) at 513 K with a different reactor system.
Our results of FT synthesis at lower temperature show a lower CH4 selectivity
and higher C2-4 selectivity as compared to the selectivity obtained by Tan et al.
at 513 K (Table 7.1). This difference in selectivity is consistent with the
difference in reaction temperature, as a higher reaction temperature will lead
to higher methane selectivity (Khodakov et al., 2007).
158
Due to a limitation in the reactor system, a much lower dilution ratio was used
in our experiments (Table 7.1). The furnace that controls the temperature of
the catalyst bed during reaction is a single zone heating furnace. The heating
zone has a limited height of about 15 cm (top to bottom). This confines the
catalyst bed in the reactor tube to a space of about 10 cm in height, and thus,
affects the amount of dilution allowed for the catalyst. Without sufficient
dilution, temperature gradients may develop within the catalyst bed during
very exothermic FT synthesis. However, the temperature gradients over the 10
cm catalysts bed was still measured to be less than 1 K during FT synthesis at
493 K and no hot spots were detected. This shows that the lower dilution ratio
as compared to Tan et al. is still sufficient to minimize the temperature
gradients during FT synthesis at 493 K in the parallel reactor system. At the
same time, with a smaller internal diameter (Table 7.1), we expect radial
thermal gradients to be absent.
A different γ-Al2O3 support was used in our FT experiments and it has a
smaller specific surface area and pore size (Table 7.1) than the γ-Al2O3
support used by Tan et al. (2010; 2011; Tan, PhD Thesis). This may affect the
size of the cobalt particles on the support, which may in turn affect the
reducibility of the catalysts. Experimental evidence shows that smaller Co
particles are less reducible (Khodakov et al., 1997; Prieto et al., 2009). From
the TPR profile obtained for our catalysts (Figure 7.5), we did not notice any
significant peaks at the higher temperature range. Thus, the reducibility of the
Co catalysts is not affected by the different γ-Al2O3 support used in our
159
experiments. However, promotion with boron increases the reduction
temperature of the Co catalysts. A similar observation was also reported by
Tan et al. (2011; PhD thesis).
Figure 7.5. Temperature-programmed reduction (TPR) profile of 20 wt%
Co/γ-Al2O3 catalysts.
In summary, we studied the effects of boron promotion on Co catalysts at
lower temperature of 493 K, using a different reactor. The experiments at
lower industrial reaction conditions confirmed that the Co catalyst promoted
with small amounts of boron has better stability, and the selectivity and
activity remains unaffected. The lower reaction temperature led to lower
methane selectivity, consistent with earlier reports (Khodakov et al., 2007).
The results further indicate that stable results for longer periods of FT
synthesis can be obtained using the reactor.
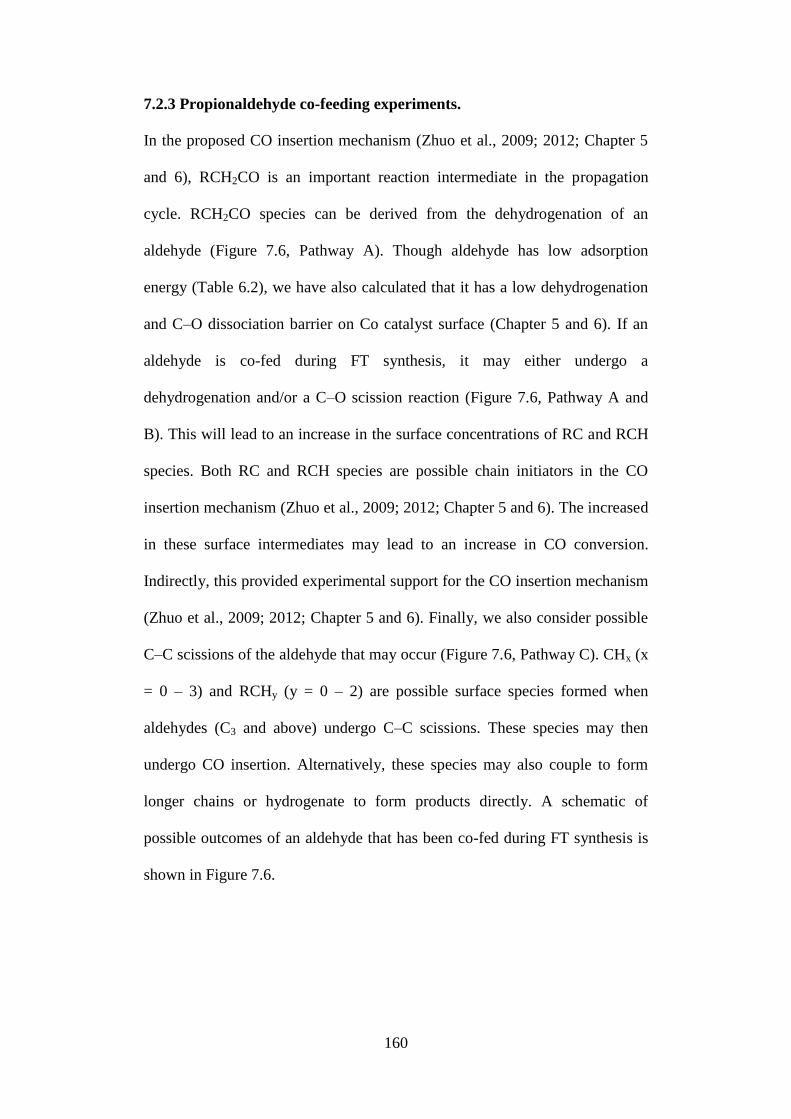
160
7.2.3 Propionaldehyde co-feeding experiments.
In the proposed CO insertion mechanism (Zhuo et al., 2009; 2012; Chapter 5
and 6), RCH2CO is an important reaction intermediate in the propagation
cycle. RCH2CO species can be derived from the dehydrogenation of an
aldehyde (Figure 7.6, Pathway A). Though aldehyde has low adsorption
energy (Table 6.2), we have also calculated that it has a low dehydrogenation
and C–O dissociation barrier on Co catalyst surface (Chapter 5 and 6). If an
aldehyde is co-fed during FT synthesis, it may either undergo a
dehydrogenation and/or a C–O scission reaction (Figure 7.6, Pathway A and
B). This will lead to an increase in the surface concentrations of RC and RCH
species. Both RC and RCH species are possible chain initiators in the CO
insertion mechanism (Zhuo et al., 2009; 2012; Chapter 5 and 6). The increased
in these surface intermediates may lead to an increase in CO conversion.
Indirectly, this provided experimental support for the CO insertion mechanism
(Zhuo et al., 2009; 2012; Chapter 5 and 6). Finally, we also consider possible
C–C scissions of the aldehyde that may occur (Figure 7.6, Pathway C). CHx (x
= 0 – 3) and RCHy (y = 0 – 2) are possible surface species formed when
aldehydes (C3 and above) undergo C–C scissions. These species may then
undergo CO insertion. Alternatively, these species may also couple to form
longer chains or hydrogenate to form products directly. A schematic of
possible outcomes of an aldehyde that has been co-fed during FT synthesis is
shown in Figure 7.6.
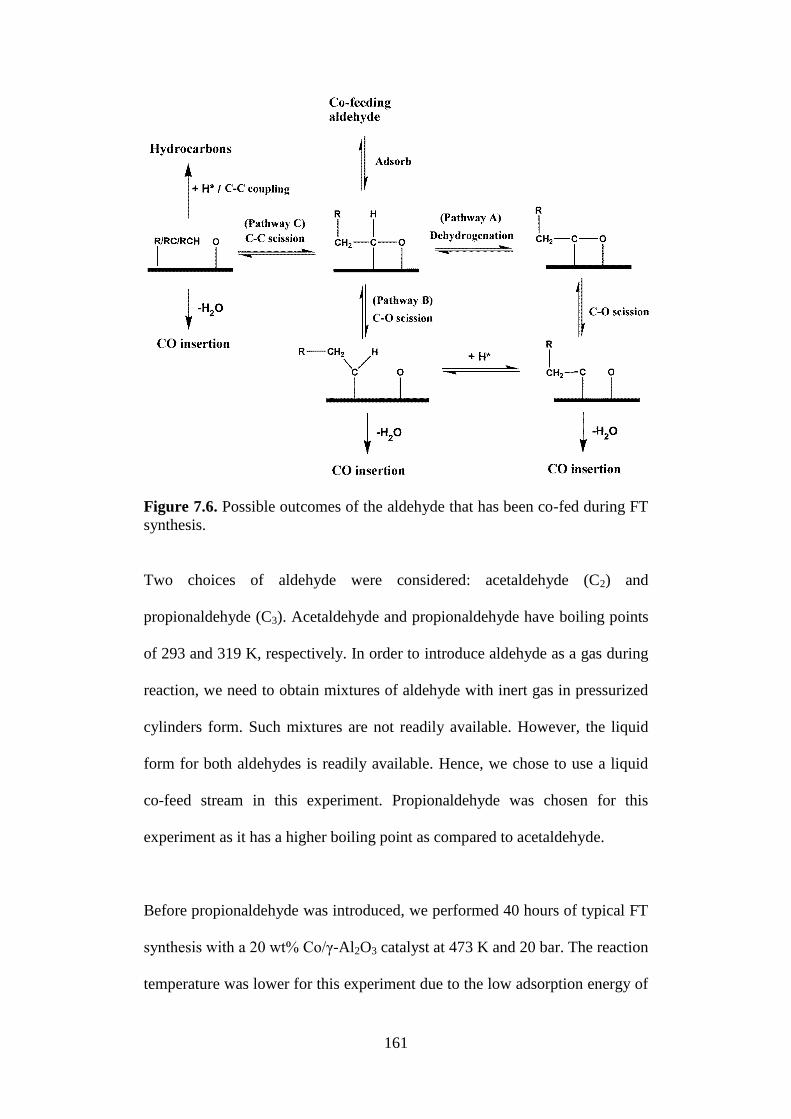
161
Figure 7.6. Possible outcomes of the aldehyde that has been co-fed during FT
synthesis.
Two choices of aldehyde were considered: acetaldehyde (C2) and
propionaldehyde (C3). Acetaldehyde and propionaldehyde have boiling points
of 293 and 319 K, respectively. In order to introduce aldehyde as a gas during
reaction, we need to obtain mixtures of aldehyde with inert gas in pressurized
cylinders form. Such mixtures are not readily available. However, the liquid
form for both aldehydes is readily available. Hence, we chose to use a liquid
co-feed stream in this experiment. Propionaldehyde was chosen for this
experiment as it has a higher boiling point as compared to acetaldehyde.
Before propionaldehyde was introduced, we performed 40 hours of typical FT
synthesis with a 20 wt% Co/γ-Al2O3 catalyst at 473 K and 20 bar. The reaction
temperature was lower for this experiment due to the low adsorption energy of

162
aldehyde. The CO conversion after 40 hours of FT synthesis was 25%. Then
propionaldehyde was introduced at a rate of 1.4 × 10⁻⁴
mol/min for a further
20 hours of FT synthesis. After 5 hours of co-feeding, there was no significant
increase in CO conversion. The CO conversion after 5 hours of aldehyde co-
feeding was 27% and it decreased slightly to 22% after 20 hours of FT
synthesis with propionaldehyde co-feeding. The 5% decrease in CO
conversion is likely due to the slow deactivation of catalyst as discussed in
Section 7.2.2. Though CO conversion did not increase, some interesting
observations were made in the product distribution during the co-feeding
experiment.
During the co-feeding experiment, a few unknown products that were present
in significant amounts were formed. The peaks of these unknown products in
the FID signal were only observed after propionaldehyde was introduced.
They were either present in small quantities or not observed at all in the
products of a typical FT synthesis. However, based on the GC results, it is
insufficient to deduce the chemical composition of these products.
Nevertheless, by comparing against the known products distribution from a
typical FT synthesis, it is still possible to deduce the possible carbon number
of these products from the co-feeding experiment. A total of five unknown
products that correspond to C4, C5, C6 and C7 hydrocarbons and/or oxygenates
were identified. Next, we hydrogenate propionaldehyde over Co catalyst at 20
bars and 473 K, with the same aldehyde molar flow rate in the co-feeding
experiment. By doing so, we can eliminate any possible influence of CO on
the reactivity of propionaldehyde over Co catalyst. This will also isolate the
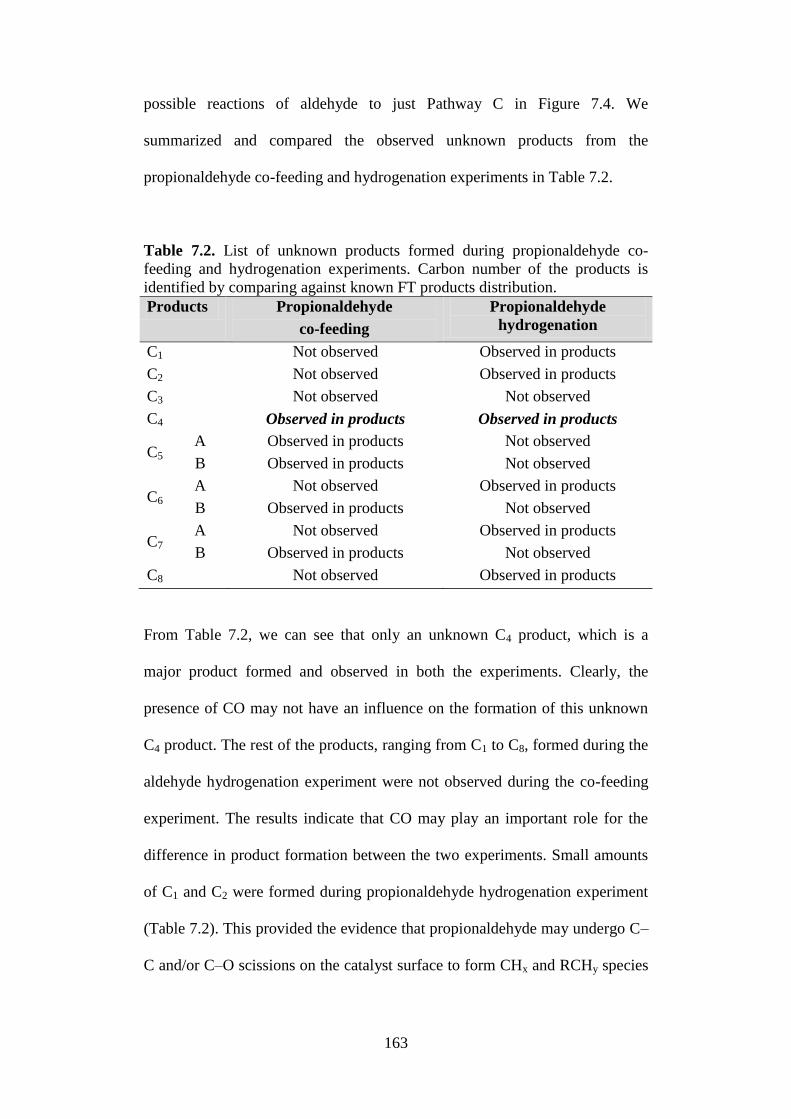
163
possible reactions of aldehyde to just Pathway C in Figure 7.4. We
summarized and compared the observed unknown products from the
propionaldehyde co-feeding and hydrogenation experiments in Table 7.2.
Table 7.2. List of unknown products formed during propionaldehyde co-
feeding and hydrogenation experiments. Carbon number of the products is
identified by comparing against known FT products distribution.
Products Propionaldehyde
co-feeding
Propionaldehyde
hydrogenation
C1 Not observed Observed in products
C2 Not observed Observed in products
C3 Not observed Not observed
C4 Observed in products Observed in products
C5 A Observed in products Not observed
B Observed in products Not observed
C6 A Not observed Observed in products
B Observed in products Not observed
C7 A Not observed Observed in products
B Observed in products Not observed
C8 Not observed Observed in products
From Table 7.2, we can see that only an unknown C4 product, which is a
major product formed and observed in both the experiments. Clearly, the
presence of CO may not have an influence on the formation of this unknown
C4 product. The rest of the products, ranging from C1 to C8, formed during the
aldehyde hydrogenation experiment were not observed during the co-feeding
experiment. The results indicate that CO may play an important role for the
difference in product formation between the two experiments. Small amounts
of C1 and C2 were formed during propionaldehyde hydrogenation experiment
(Table 7.2). This provided the evidence that propionaldehyde may undergo C–
C and/or C–O scissions on the catalyst surface to form CHx and RCHy species
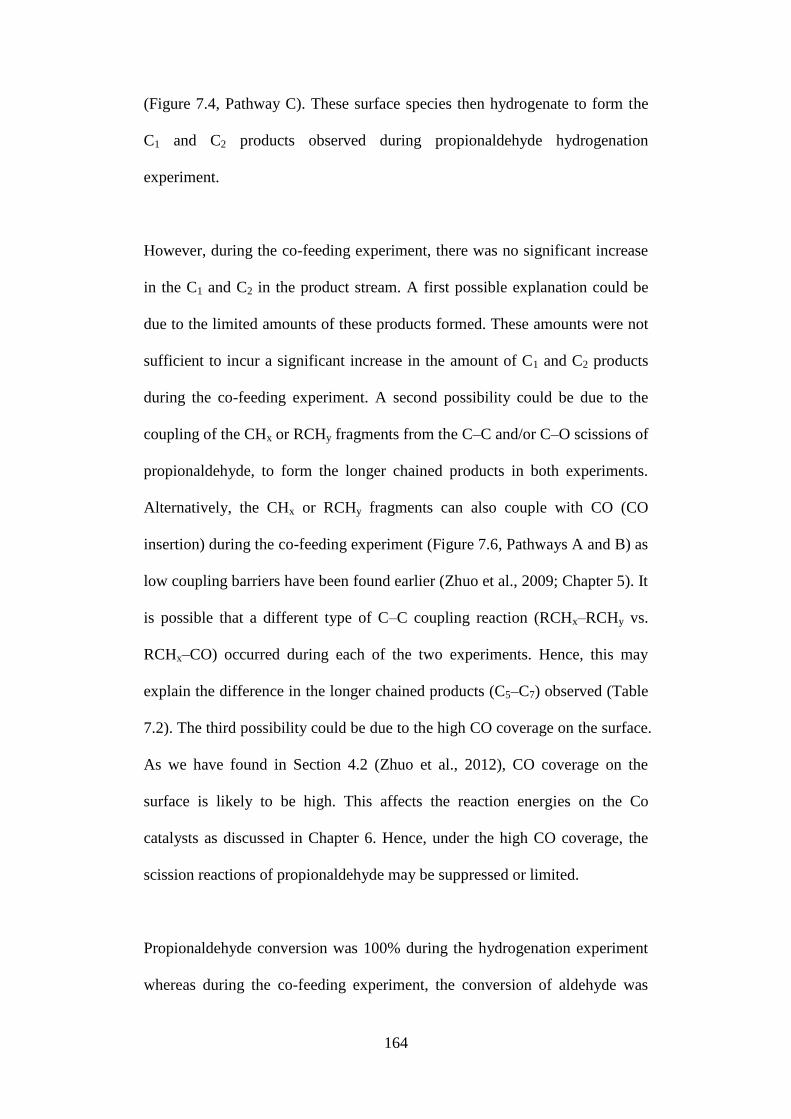
164
(Figure 7.4, Pathway C). These surface species then hydrogenate to form the
C1 and C2 products observed during propionaldehyde hydrogenation
experiment.
However, during the co-feeding experiment, there was no significant increase
in the C1 and C2 in the product stream. A first possible explanation could be
due to the limited amounts of these products formed. These amounts were not
sufficient to incur a significant increase in the amount of C1 and C2 products
during the co-feeding experiment. A second possibility could be due to the
coupling of the CHx or RCHy fragments from the C–C and/or C–O scissions of
propionaldehyde, to form the longer chained products in both experiments.
Alternatively, the CHx or RCHy fragments can also couple with CO (CO
insertion) during the co-feeding experiment (Figure 7.6, Pathways A and B) as
low coupling barriers have been found earlier (Zhuo et al., 2009; Chapter 5). It
is possible that a different type of C–C coupling reaction (RCHx–RCHy vs.
RCHx–CO) occurred during each of the two experiments. Hence, this may
explain the difference in the longer chained products (C5–C7) observed (Table
7.2). The third possibility could be due to the high CO coverage on the surface.
As we have found in Section 4.2 (Zhuo et al., 2012), CO coverage on the
surface is likely to be high. This affects the reaction energies on the Co
catalysts as discussed in Chapter 6. Hence, under the high CO coverage, the
scission reactions of propionaldehyde may be suppressed or limited.
Propionaldehyde conversion was 100% during the hydrogenation experiment
whereas during the co-feeding experiment, the conversion of aldehyde was
165
about 80% at the end of the 20 hours of co-feeding. One of the reasons for the
difference in conversion might be due to the catalyst deactivation. Another
reason could be due to the high coverage of CO and/or reaction intermediates
on the catalyst surface during the co-feeding experiments. This reduces the
adsorption energy of aldehyde which was discussed in Chapter 6 (Table 6.2).
In summary, we have presented a very qualitative discussion of the
experimental results as we were not able to identify the stoichiometry of the
products. To identify the products, a GC that is coupled to a mass
spectrometer (MS) might be required. Nevertheless, the experimental results
discussed in this section did suggest that CO might be involved in the
formation of the unknown products observed during the co-feeding
experiments. Though we did not notice an increase in CO conversion during
the co-feeding experiment, the likelihood that CO insertion is involved in the
formation of these products cannot be excluded. Alternatively, the presence of
high CO coverage on the surface might have changed the preferred reaction
pathway for propionaldehyde on Co. At the same time, the high surface
coverage might also be responsible for the lower aldehyde conversion during
the co-feeding experiment.
166
7.3 Conclusions
A parallel micro fixed bed reactor system was successfully set up for catalyst
testing. The reactor was first tested with 20 wt% Co supported on pure γ–
Al2O3 for a 48 hours duration. Next, we further tested the reactor for longer
period of FT synthesis. At the same time, the effect of boron promotion at a
lower reaction temperature of 493 K was studied. Our results from 120 hours
of FT synthesis with and without boron promotion were in good agreement
with previous work at 513 K in a different reactor. Promoting Co catalyst with
small amounts of boron is able to improve its stability without affecting its
activity and selectivity. Finally, we compared the results from the aldehyde
co-feeding and hydrogenation experiments. Very different unknown products
were identified from the two experiments and it is possible that CO plays an
important role in it.
167
7.4 References
Flory, J.P., J. Am. Chem. Soc.1936, 58, 1877.
Friedel, R.A.; Anderson, R.B. J. Am. Chem. Soc. 1950, 72, 1212.
Henrici-Olive, G.; Olive, S. Angew. Chem.1976, 88, 144.
Herington, E.F.G. Chem. Ind.1946, 346.
Khodakov, A. Y.; Chu, W.; Fongarland, P. Chem. Rev. 2007, 107, 1692.
Khodakov, A. Y.; Lynch, J.; Bazin, D.; Rebours, B.; Zanier, N.; Moisson, B.;
Chaumette, P. J. Catal. 1997, 168, 16.
Prieto, G.; Martínez, A.; Concepción, P.; Moreno-Tost, R. J Catal. 2009, 266,
129.
Saeys, M.; Tan, K. F.; Chang, J.; Borgna, A. Ind. Eng. Chem. Res. 2010, 49,
11098.
Tan, K. F.; Chang, J.; Borgna, A.; Saeys, M. J. Catal. 2011, 280, 50.
Tan, K. F., PhD Thesis, National University of Singapore, Singapore, 2011.
van Berge, P.J.; Everson, R.C. Stud. Surf. Sci. Catal. 1997, 107, 207.
Wilson, J.; de Groot, C. J. Phys. Chem. 1995, 99, 7860.
Zhuo, M.; Tan, K. F.; Borgna, A.; Saeys, M. J. Phys. Chem. C. 2009, 113,
8357.
Zhuo, M.; Borgna, A.; Saeys, M. J. Catal. 2013, January Issue, 217.

168
CHAPTER 8
GENERAL CONCLUSIONS
In this thesis, density functional theory (DFT) calculations were used to
develop a molecular understanding of the surface chemistry of Co catalysts
under Fischer-Tropsch (FT) conditions. Based on the molecular understanding,
we proposed a mechanism for FT synthesis that involves CO as a monomer
for chain growth. Further calculations show that the surface coverage of CO is
likely to be high under FT conditions and under the influence of high CO
coverage, surface reactions and stability of intermediates were affected. The
main findings of this study can be summarized as follows:
The adsorption of CO on a Co(0001) terrace surface was studied. The results
showed that CO forms stable adsorption configurations that are equivalent to
1/3 and 7/12 ML of CO coverage on the Co(0001) terrace surface. A (pCO,T)
stability diagram for CO adsorption on Co(0001) was determined. CO
coverage builds up gradually following a single-site Langmuir isotherm with
nearly constant adsorption enthalpy until a ( 3 3 )R30º-CO structure is
formed for CO pressure above 1 mbar at 500 K. Subsequently, a phase
transition from a ( 3 3 )R30º-CO structure to a ( 2 3 2 3 )R30º-7CO
structure was found when CO pressure reaches 100 bar. No stable adsorption
169
configurations were found between 1/3 and 7/12 ML of coverage. The result
can be compared with earlier experimental data. Using the stability diagram,
the CO coverage under FT conditions was found to be 1/3 ML.
Next, DFT calculations were performed to evaluate the mechanisms of FT
synthesis on a Co(0001) terrace at low coverage. The calculations show that
CO coupling with surface RCH groups has a barrier of 74 kJ/mol.
Subsequently, RCHCO undergo a hydrogenation step with barrier of 75
kJ/mol to form surface RCH2CO species. C–O bond scission in RCH2CO to
form R’C has a barrier of 72 kJ/mol and a propagation cycle starting with CO
insertion into surface RCH groups is proposed. Calculated TOF for the
proposed propagation cycle is 3 × 10⁷ s
-1 and is about 30 times faster than the
TOF for hydrogen-assisted CO activation. The calculated TOF for the
propagation cycle is still significantly lower than the experimental value of
0.02 s-1
. However, taking into account the effect of CO coverage on adsorption
energies, the calculated TOF is expected to increase.
Subsequently, the stability of adsorbed reaction intermediates and the energy
barriers of proposed propagation cycle were re-evaluated under the influence
of 1/3 ML CO coverage on a Co(0001) terrace. The stability of all adsorbed
reaction intermediates evaluated decrease by 10 to 30 kJ/mol. The reduced
stabilities increase the rate of the proposed CO insertion mechanism. When
high CO coverage is taken into account, the calculated CO turnover frequency
for the CO insertion mechanism on Co terraces reproduces the experimental
rates. Next, we evaluated the stability of carbon on a Co(0001) terrace with
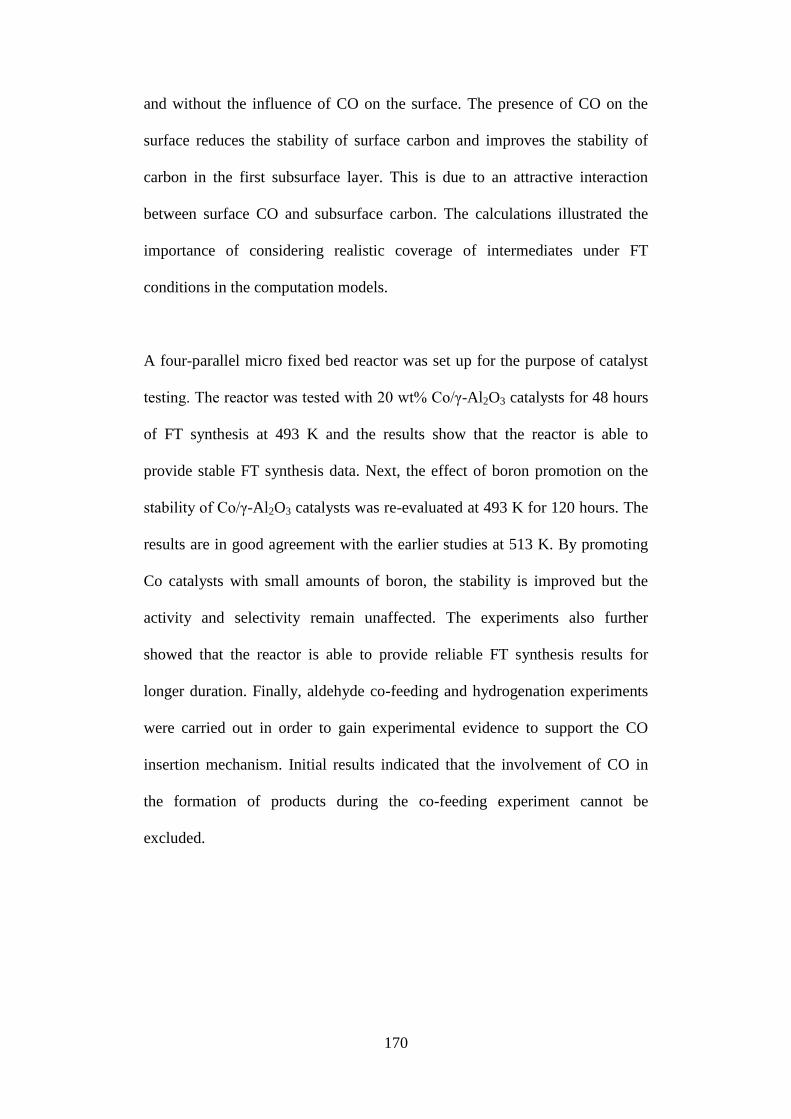
170
and without the influence of CO on the surface. The presence of CO on the
surface reduces the stability of surface carbon and improves the stability of
carbon in the first subsurface layer. This is due to an attractive interaction
between surface CO and subsurface carbon. The calculations illustrated the
importance of considering realistic coverage of intermediates under FT
conditions in the computation models.
A four-parallel micro fixed bed reactor was set up for the purpose of catalyst
testing. The reactor was tested with 20 wt% Co/γ-Al2O3 catalysts for 48 hours
of FT synthesis at 493 K and the results show that the reactor is able to
provide stable FT synthesis data. Next, the effect of boron promotion on the
stability of Co/γ-Al2O3 catalysts was re-evaluated at 493 K for 120 hours. The
results are in good agreement with the earlier studies at 513 K. By promoting
Co catalysts with small amounts of boron, the stability is improved but the
activity and selectivity remain unaffected. The experiments also further
showed that the reactor is able to provide reliable FT synthesis results for
longer duration. Finally, aldehyde co-feeding and hydrogenation experiments
were carried out in order to gain experimental evidence to support the CO
insertion mechanism. Initial results indicated that the involvement of CO in
the formation of products during the co-feeding experiment cannot be
excluded.
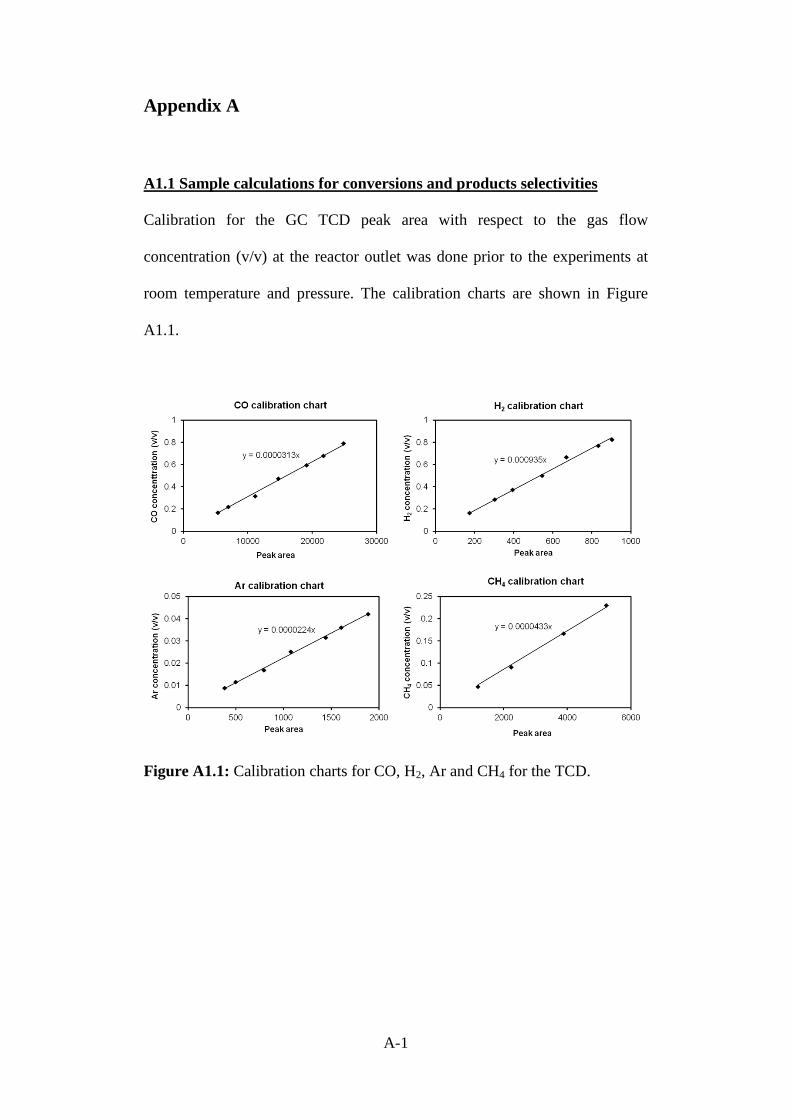
A-1
Appendix A
A1.1 Sample calculations for conversions and products selectivities
Calibration for the GC TCD peak area with respect to the gas flow
concentration (v/v) at the reactor outlet was done prior to the experiments at
room temperature and pressure. The calibration charts are shown in Figure
A1.1.
Figure A1.1: Calibration charts for CO, H2, Ar and CH4 for the TCD.
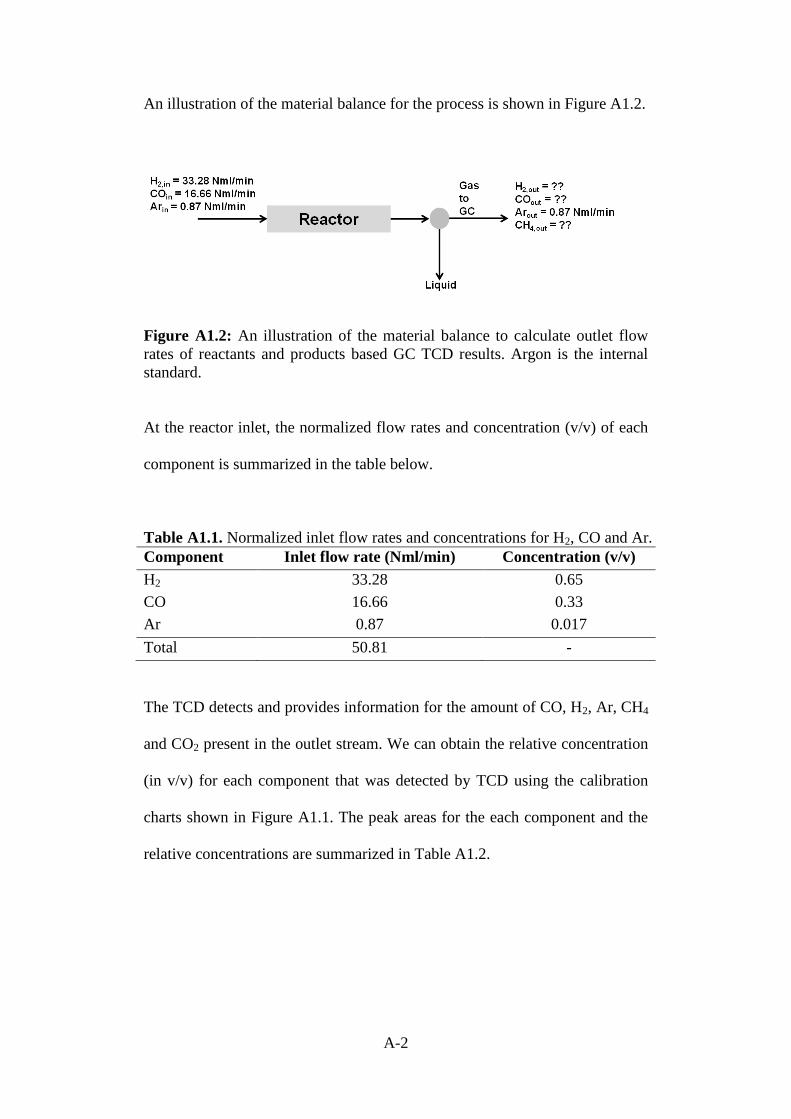
A-2
An illustration of the material balance for the process is shown in Figure A1.2.
Figure A1.2: An illustration of the material balance to calculate outlet flow
rates of reactants and products based GC TCD results. Argon is the internal
standard.
At the reactor inlet, the normalized flow rates and concentration (v/v) of each
component is summarized in the table below.
Table A1.1. Normalized inlet flow rates and concentrations for H2, CO and Ar.
Component Inlet flow rate (Nml/min) Concentration (v/v)
H2 33.28 0.65
CO 16.66 0.33
Ar 0.87 0.017
Total 50.81 -
The TCD detects and provides information for the amount of CO, H2, Ar, CH4
and CO2 present in the outlet stream. We can obtain the relative concentration
(in v/v) for each component that was detected by TCD using the calibration
charts shown in Figure A1.1. The peak areas for the each component and the
relative concentrations are summarized in Table A1.2.
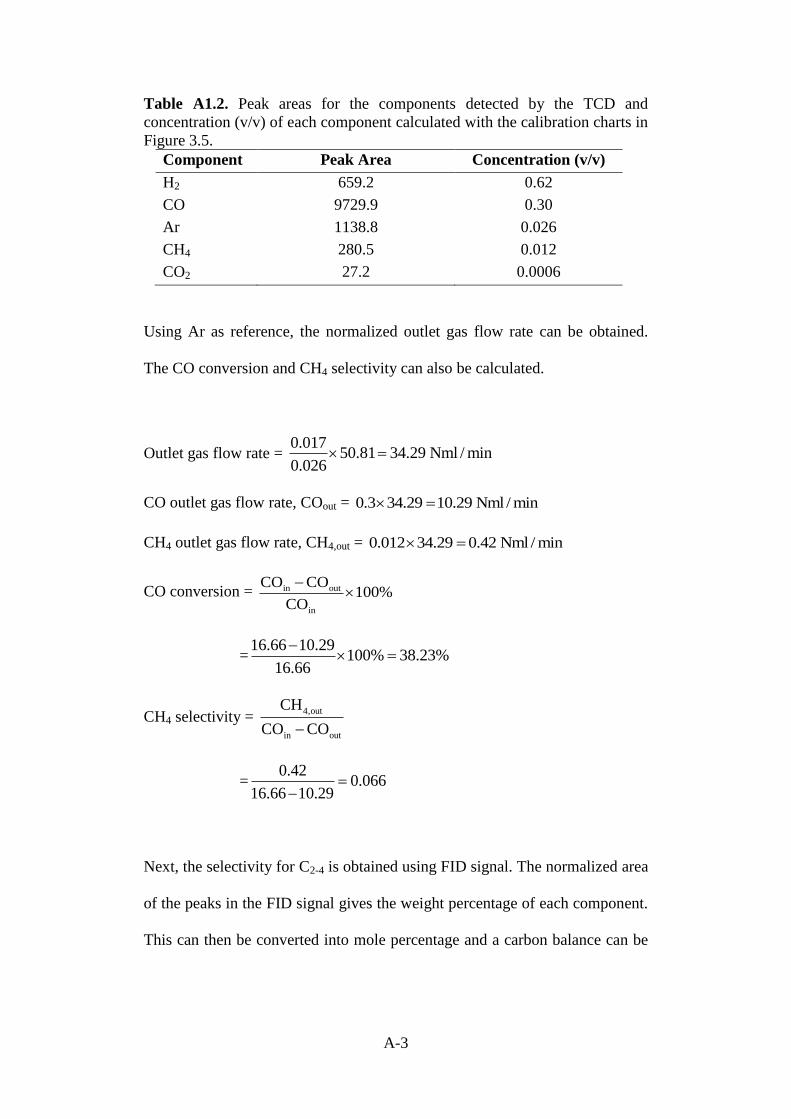
A-3
Table A1.2. Peak areas for the components detected by the TCD and
concentration (v/v) of each component calculated with the calibration charts in
Figure 3.5.
Component Peak Area Concentration (v/v)
H2 659.2 0.62
CO 9729.9 0.30
Ar 1138.8 0.026
CH4 280.5 0.012
CO2 27.2 0.0006
Using Ar as reference, the normalized outlet gas flow rate can be obtained.
The CO conversion and CH4 selectivity can also be calculated.
Outlet gas flow rate = 0.017
50.81 34.29 Nml / min0.026
CO outlet gas flow rate, COout = 0.3 34.29 10.29 Nml / min
CH4 outlet gas flow rate, CH4,out = 0.012 34.29 0.42 Nml / min
CO conversion = in out
in
CO CO100%
CO
=16.66 10.29
100% 38.23%16.66
CH4 selectivity = 4,out
in out
CH
CO CO
=0.42
0.06616.66 10.29
Next, the selectivity for C2-4 is obtained using FID signal. The normalized area
of the peaks in the FID signal gives the weight percentage of each component.
This can then be converted into mole percentage and a carbon balance can be
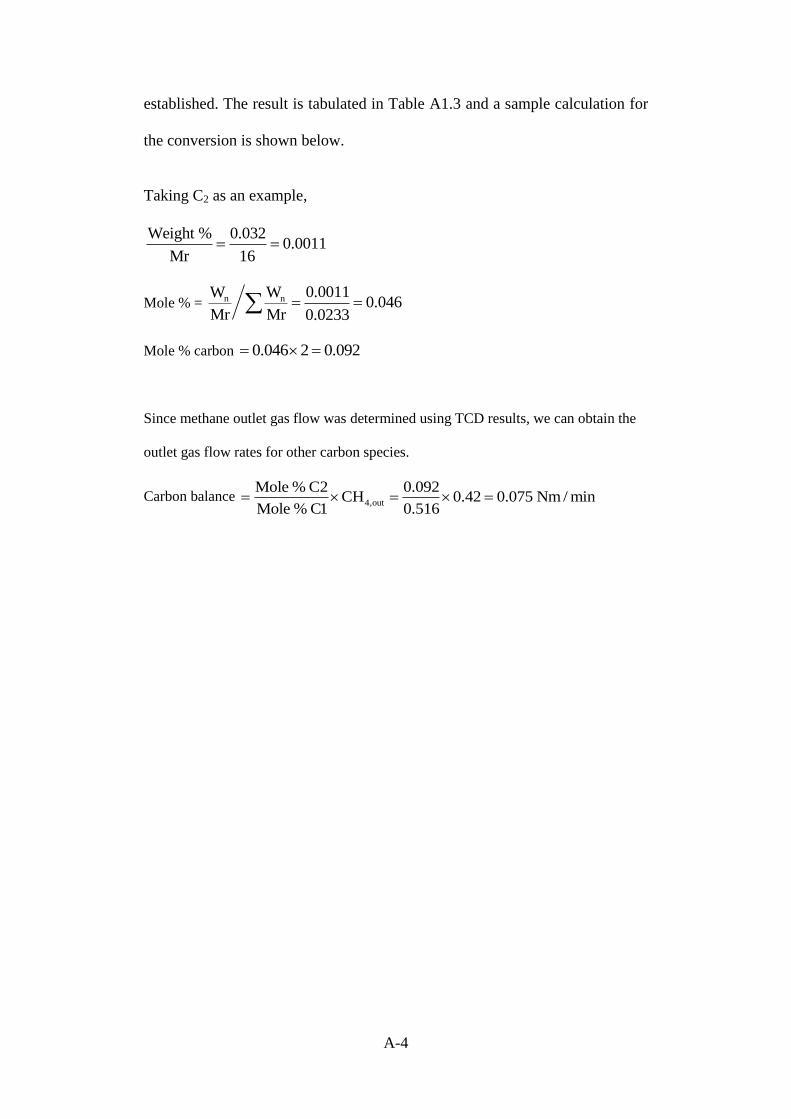
A-4
established. The result is tabulated in Table A1.3 and a sample calculation for
the conversion is shown below.
Taking C2 as an example,
Weight % 0.0320.0011
Mr 16
Mole % = n n0.0011W W
0.046Mr Mr 0.0233
Mole % carbon 0.046 2 0.092
Since methane outlet gas flow was determined using TCD results, we can obtain the
outlet gas flow rates for other carbon species.
Carbon balance 4,out
Mole % C2 0.092CH 0.42 0.075 Nm / min
Mole % C1 0.516
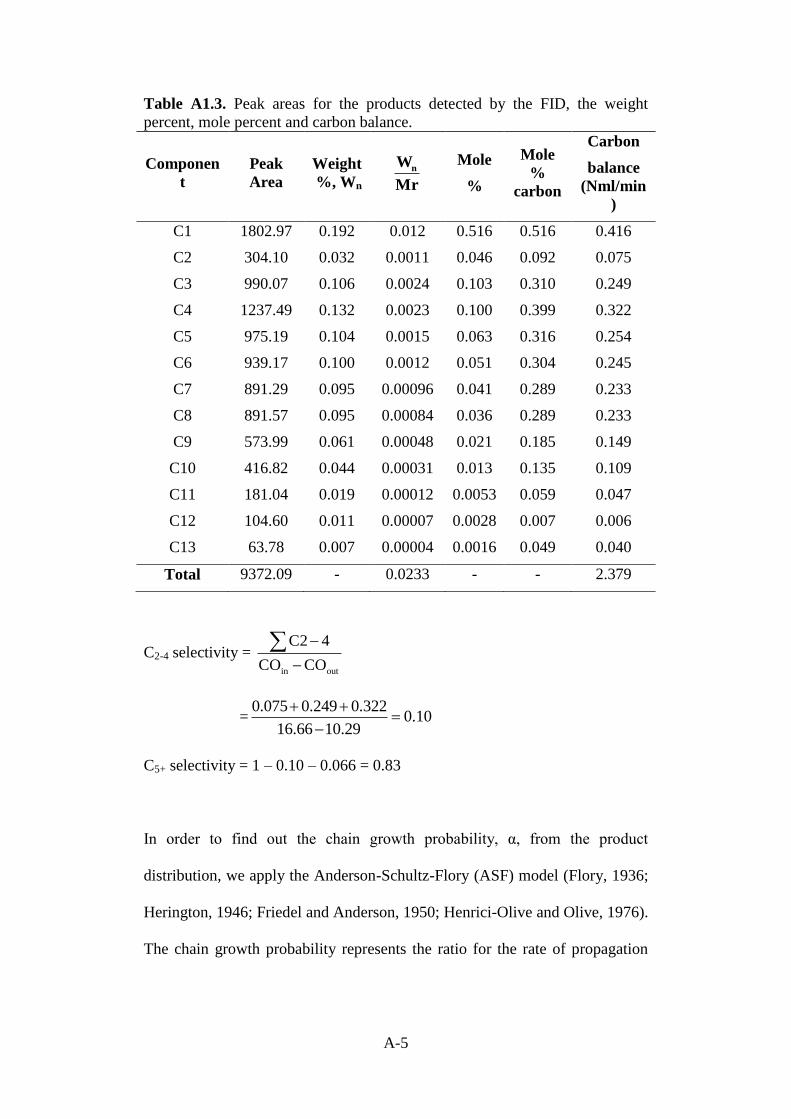
A-5
Table A1.3. Peak areas for the products detected by the FID, the weight
percent, mole percent and carbon balance.
Componen
t
Peak
Area
Weight
%, Wn nW
Mr
Mole
%
Mole
%
carbon
Carbon
balance
(Nml/min
)
C1 1802.97 0.192 0.012 0.516 0.516 0.416
C2 304.10 0.032 0.0011 0.046 0.092 0.075
C3 990.07 0.106 0.0024 0.103 0.310 0.249
C4 1237.49 0.132 0.0023 0.100 0.399 0.322
C5 975.19 0.104 0.0015 0.063 0.316 0.254
C6 939.17 0.100 0.0012 0.051 0.304 0.245
C7 891.29 0.095 0.00096 0.041 0.289 0.233
C8 891.57 0.095 0.00084 0.036 0.289 0.233
C9 573.99 0.061 0.00048 0.021 0.185 0.149
C10 416.82 0.044 0.00031 0.013 0.135 0.109
C11 181.04 0.019 0.00012 0.0053 0.059 0.047
C12 104.60 0.011 0.00007 0.0028 0.007 0.006
C13 63.78 0.007 0.00004 0.0016 0.049 0.040
Total 9372.09 - 0.0233 - - 2.379
C2-4 selectivity = in out
C2 4
CO CO
=0.075 0.249 0.322
0.1016.66 10.29
C5+ selectivity = 1 – 0.10 – 0.066 = 0.83
In order to find out the chain growth probability, α, from the product
distribution, we apply the Anderson-Schultz-Flory (ASF) model (Flory, 1936;
Herington, 1946; Friedel and Anderson, 1950; Henrici-Olive and Olive, 1976).
The chain growth probability represents the ratio for the rate of propagation

A-6
over the sum of propagation and termination rates. The mathematical form is
given as Equations A1 and A2 respectively;
21 )1( n
n nW (A1)
2
nW (1 )log( ) n log log[ ]
n
(A2)
where Wn is the weight percentage of all hydrocarbon products detected by the
FID, n is the carbon number and α is the chain growth probability. By plotting
Wn/n against n on a log scale, α can be obtained from the gradient of the graph.
A-7
A1.2 References
Flory, J.P., J. Am. Chem. Soc.1936, 58, 1877.
Friedel, R.A.; Anderson, R.B. J. Am. Chem. Soc. 1950, 72, 1212.
Henrici-Olive, G.; Olive, S. Angew. Chem.1976, 88, 144.