Mechanisms of Fracture and Friction of Crustal Rock … of Fracture and Friction of ... MECHANISMS...
162
Mechanisms of Fracture and Friction of Crustal Rock in Simulated Geologic Environments B. K. Atkinson, N. J. Price, S. M. Dennis P. G. Meredith, D. MacDonald, and R. F. Holloway Imperial College of Science and Technology Geology Department London SW7 2BP Great Britain USGS Contract No. 14-08-0001-18325 Supported by the Earthquake Hazards Reduction Program OPEN-FILE No. 81-277 U. S. Geological Survey OPEN FILE REPORT This report was prepared under contract to the U.S. Geological Survey and has not been reviewed for conformity with USGS editorial standards and stratigraphic nomenclature. Opinions and conclusions expressed herein do not necessarily represent those of the USGS. Any use of trade names is for descriptive purposes only and does not imply endorsement by the USGS.
Transcript of Mechanisms of Fracture and Friction of Crustal Rock … of Fracture and Friction of ... MECHANISMS...
Mechanisms of Fracture and Friction of Crustal Rock
in Simulated Geologic Environments
B. K. Atkinson, N. J. Price, S. M. Dennis
P. G. Meredith, D. MacDonald, and R. F. Holloway
Imperial College of Science and Technology Geology Department
London SW7 2BP Great Britain
USGS Contract No. 14-08-0001-18325
Supported by the Earthquake Hazards Reduction Program
OPEN-FILE No. 81-277
U. S. Geological Survey OPEN FILE REPORT
This report was prepared under contract to the U.S. Geological Survey and has not been reviewed for conformity with USGS editorial standards and stratigraphic nomenclature. Opinions and conclusions expressed herein do not necessarily represent those of the USGS. Any use of trade names is for descriptive purposes only and does not imply endorsement by the USGS.
IMPERIAL COLLEGE OF SCIENCE AND TECHNOLOGY
Department of Geology, Royal School of Mines Prince Consort Road, London swy IBP Telephone: 01-589 5111 Telex: 261503
MECHANISMS OF FRACTURE AND FRICTION OF CRUSTAL
ROCK IN SIMULATED GEOLOGIC ENVIRONMENTS
Final (second semi-annual) technical report for FY 1980 to the
managers of the US National Earthquake Hazards Reduction Program,
by
B.K. ATKINSON and N.J. PRICE (Principal Investigators)
with contributions by
S.M. DENNIS, P.G. MEREDITH, D. MACDONALD, R.F. HOLLOWAY
Sponsored by the US Geological Survey under
Contract No.: 14-08-0001-18325
Contract effective: 1 October 1979 - 30 September 1980
Amount of contract: $84,000
Date of report: 1 November 1980
The views and conclusions contained in this document are those
of the authors and should not be interpreted as necessarily
representing the official policies, either expressed or implied,
of the US Government.
MECHANISMS OF FRACTURE AND FRICTION OF CRUSTAL ROCK IN SIMULATED GEOLOGIC ENVIRONMENTS
Contract No: 14-08-0001-18325
Principal Investigators: B. K. ATKINSON, N. J. PRICE
Additional Contributions by: S. M. DENNIS, P.G. MEREDITH,D. MACDONALD, and R.F. HOLLOWAY
IMPERIAL COLLEGE OF SCIENCE AND TECHNOLOGY GEOLOGY DEPARTMENT LONDON SW7 2BP GREAT BRITAIN
01-589-5111 X 1683, X 1690
Investigations
1. Construction of apparatus for high-temperature (up to 500 C) and high-pressure (up to 3 kbar) apparatus for
fracture mechanics studies of critical stress intensity factors and subcritical (stress corrosion) crack growth in crustal rocks.
2. Fracture mechanics experiments and associated acousticemission studies of stress corrosion crack growth in
granites and basalts.
3. Study of thermal and stress cycling on fracture and acoustic emission properties of rock.
4. Experimental study of influence of pore water onsliding properties of faults in granites and basalts
at conditions of temperature and pressure typical of the upper 15 km of the earth's crust.
5. Identification of active mechanisms of deformationin the above experiments and construction of fracture
and friction deformation mechanism maps.
Results
1. We have constructed 3 new pieces of apparatus forfracture mechanics experiments, (a) double torsion
environmental cell for deforming rock plates in vacuum or vapour environments to 50QQC, (b) short rod apparatus for tests on cores at ambient humidity to 300°C, and (c) internally pressurized thick-walled cylinder apparatus for tests to 3 kbar and 5OO°C. All three pieces of

1. REPORT SUMMARY
CONTENTS
1. REPORT SUMMARY
2. SUBCRITICAL CRACK PROPAGATION IN ROCK: THEORY,
EXPERIMENTAL RESULTS AND APPLICATIONS - B.K. Atkinson.
3. ACOUSTIC EMISSION AND STRESS CORROSION OF WHIN SILL
DOLERITE _ P.G. Meredith and B.K. Atkinson.
4. INFLUENCE OF THERMAL AND STRESS CYCLING ON THE FRACTURE
AND ACOUSTIC RESPONSE OF WESTERLEY GRANITE - B.K. Atkinson,
D. Macdonald and P.G. Meredith.
5. INFLUENCE OF PORE WATER ON SLIDING OF FAULTS IN
EXPERIMENTALLY DEFORMED WESTERLEY GRANITE AND PRESHAL
MORE BASALT - S.M. Dennis and B.K. Atkinson.
6. DEVELOPMENT OF TECHNIQUES TO MEASURE MODE II CRACK
PROPAGATION PARAMETERS - B.K. Atkinson, R.F. Holloway.
7. SHORT ROD K MEASUREMENTS - P.G. Meredith, B.K. Atkinson.
8. APPARATUS DEVELOPMENT - P.G. Meredith, S.M. Dennis,
B.K. Atkinson, R.F. Holloway.
9. FUTURE WORK.
10. PUBLICATIONS ARISING FROM WORK PERFORMED UNDER THIS
CONTRACT.

2. SUBCRITICAL CRACK PROPAGATION IN ROCK:
THEORY, EXPERIMENTAL RESULTS AND APPLICATIONS
B.K. Atkinson
ABSTRACT
The micromechanisms of tensile fracture are reviewed,
with particular emphasis on the influence of chemical
effects on fracture controlled by pre-existing cracks
(stress corrosion). A fracture mechanism map for quartz
is constructed using a combination of theoretical insights
and experimental data. The manner in which stress corrosion
will modify the predictions of fracture mechanism maps is
discussed by reviewing the numerous theories of stress
corrosion. Experimental data are presented on stress
corrosion in tensile deformation of quartz, quartz rocks,
calcite rocks, basaltic rocks, granitic rocks and other
geological materials. Although the experimental evidence
for stress corrosion is overwhelming, very few data were
obtained under conditions that simulate those
in the bulk of the earth's crust and so the extent of its
geophysical significance is yet to be fully established.
Examples are given, however, of how invoking stress corrosion
as a rate-controlling deformation mechanism sheds new light
on extremely diverse geophysical phenomena, such as:
predicting the strength and sliding friction properties of
rocks, modelling earthquake rupture, the stability of hot,
dry rock geothermal reservoirs, stimulation of oil and gas
reservoirs, the crack-seal mechanism of rock deformation and
low stress dilatancy, fracture mechanics of lunar rocks,
magmatic intrusions and the relaxation of internal stresses
in rock.
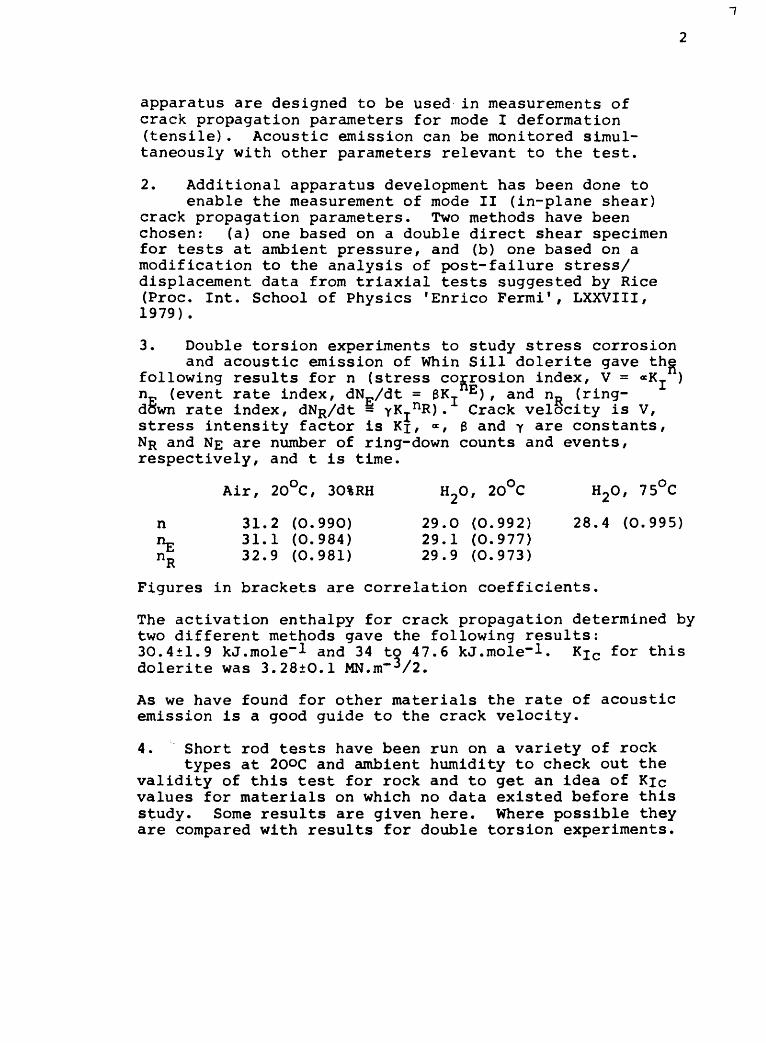
apparatus are designed to be used in measurements of crack propagation parameters for mode I deformation (tensile). Acoustic emission can be monitored simul taneously with other parameters relevant to the test.
2. Additional apparatus development has been done to enable the measurement of mode II (in-plane shear)
crack propagation parameters. Two methods have been chosen: (a) one based on a double direct shear specimen for tests at ambient pressure, and (b) one based on a modification to the analysis of post-failure stress/ displacement data from triaxial tests suggested by Rice (Proc. Int. School of Physics 'Enrico Fermi 1 , LXXVIII, 1979).
3. Double torsion experiments to study stress corrosion and acoustic emission of Whin Sill dolerite gave the
following results for n (stress corrosion index, V = «K,. n (event rate index, dN /dt = 6KT E ), and nR (ring- dSwn rate index, dNR/dt = yK-^R). Crack velocity is V, stress intensity factor is Kj, «, 6 and y are constants, NR and NE are number of ring-down counts and events, respectively, and t is time.
n"E nR
Air, 20 C, 30%RH
31.2 (0.990)31.1 (0.984)32.9 (0.981)
H20, 20WC
29.0 (0.992)29.1 (0.977)29.9 (0.973)
H20, 75UC
28.4 (0.995)
Figures in brackets are correlation coefficients.
The activation enthalpy for crack propagation determined by two different methods gave the following results: 30.4±1.9 kJ.mole" 1 and 34 to 47.6 kJ.mole~l. Kj c for this dolerite was 3.28±0.1 MN.nT 3/2.
As we have found for other materials the rate of acoustic emission is a good guide to the crack velocity.
4. Short rod tests have been run on a variety of rocktypes at 20°C and ambient humidity to check out the
validity of this test for rock and to get an idea of Kjc values for materials on which no data existed before this study. Some results are given here. Where possible they are compared with results for double torsion experiments.
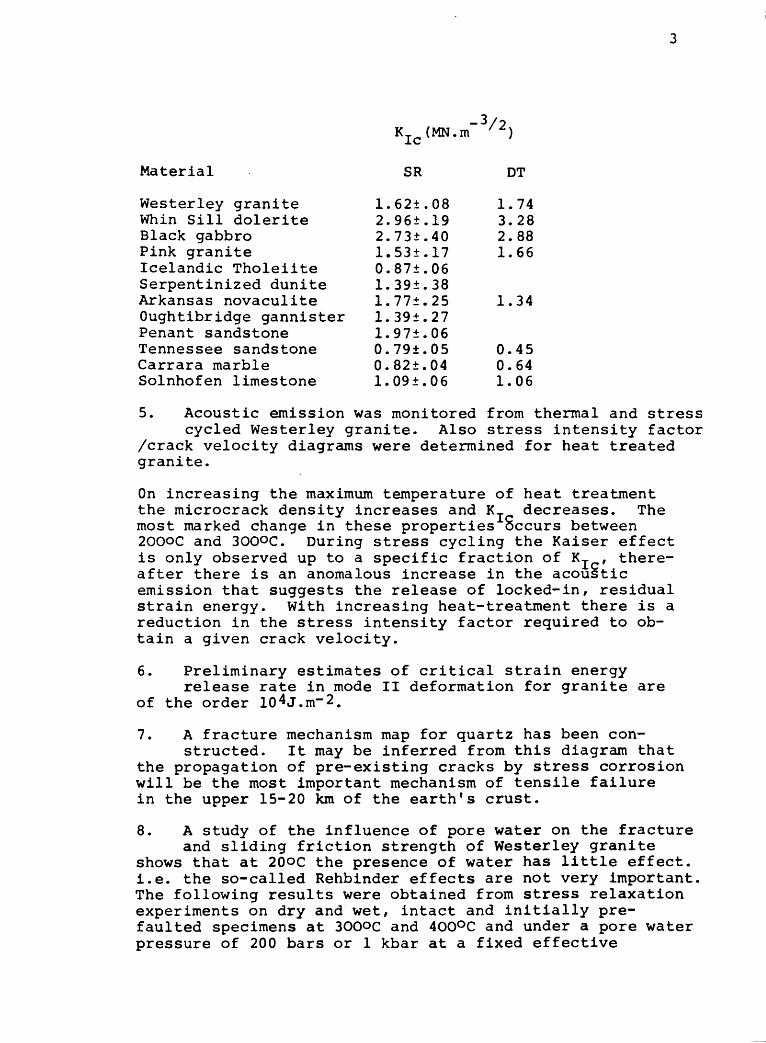
-3/2 KIc (MN.m /Z )
Material SR DT
Westerley granite 1.62±.08 1.74Whin Sill dolerite 2.96±.19 3.28Black gabbro 2.73±.40 2.88Pink granite 1.53±.17 1.66Icelandic Tholeiite 0.87±.06Serpentinized dunite 1.39±.38Arkansas novaculite 1.77±.25 1.34Oughtibridge gannister 1.39±.27Penant sandstone 1.97±.06Tennessee sandstone 0.79±.05 0.45Carrara marble 0.82±.04 0.64Solnhofen limestone 1.09±.06 1.06
5. Acoustic emission was monitored from thermal and stress cycled Westerley granite. Also stress intensity factor
/crack velocity diagrams were determined for heat treated granite.
On increasing the maximum temperature of heat treatment the microcrack density increases and K_ decreases. The most marked change in these properties occurs between 200QC and 30QOC. During stress cycling the Kaiser effect is only observed up to a specific fraction of K, , there after there is an anomalous increase in the acoustic emission that suggests the release of locked-in, residual strain energy. With increasing heat-treatment there is a reduction in the stress intensity factor required to ob tain a given crack velocity.
6. Preliminary estimates of critical strain energyrelease rate in mode II deformation for granite are
of the order 10 4J.m~2.
7. A fracture mechanism map for quartz has been con structed. It may be inferred from this diagram that
the propagation of pre-existing cracks by stress corrosion will be the most important mechanism of tensile failure in the upper 15-20 km of the earth's crust.
8. A study of the influence of pore water on the fractureand sliding friction strength of Westerley granite
shows that at 20oc the presence of water has little effect, i.e. the so-called Rehbinder effects are not very important. The following results were obtained from stress relaxation experiments on dry and wet, intact and initially pre- faulted specimens at 300QC and 400°C and under a pore water pressure of 200 bars or 1 kbar at a fixed effective
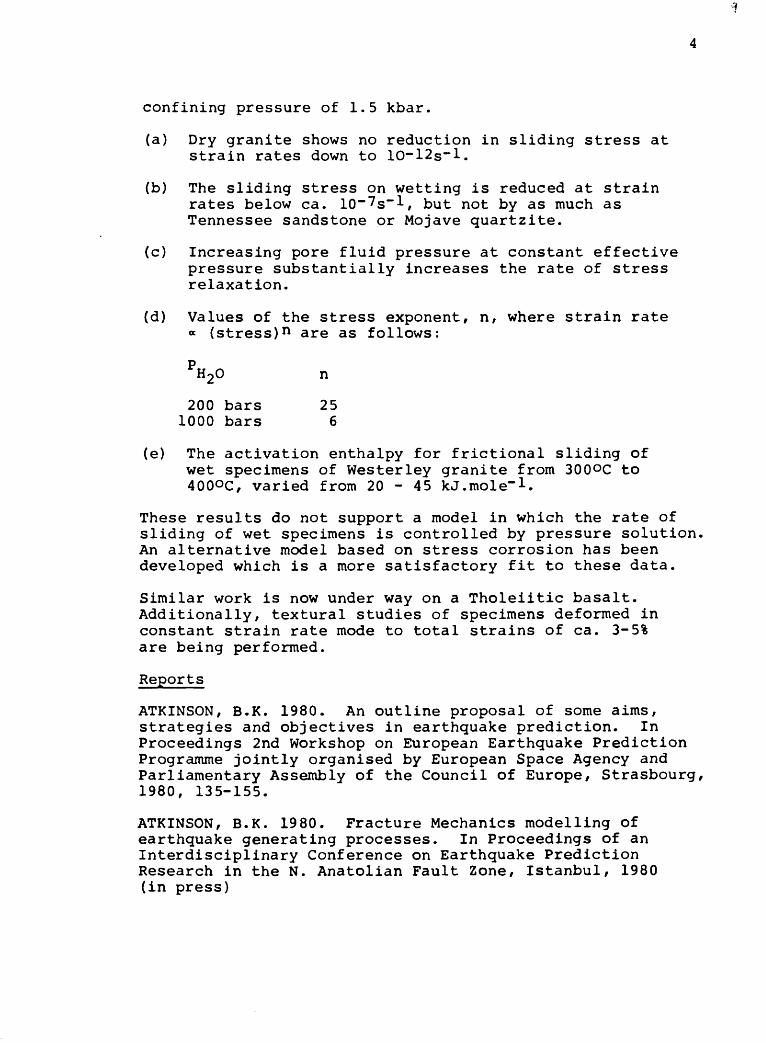
confining pressure of 1.5 kbar.
(a) Dry granite shows no reduction in sliding stress at strain rates down to 10~12s~l.
(b) The sliding stress on wetting is reduced at strain rates below ca. 10~"7s""l, but not by as much as Tennessee sandstone or Mojave quartzite.
(c) Increasing pore fluid pressure at constant effective pressure substantially increases the rate of stress relaxation.
(d) Values of the stress exponent, n, where strain rate * (stress) n are as follows:
PH20 n
200 bars 25 1000 bars 6
(e) The activation enthalpy for frictional sliding of wet specimens of Westerley granite from 300°C to 40QOC, varied from 20 - 45 kJ.mole"!.
These results do not support a model in which the rate of sliding of wet specimens is controlled by pressure solution. An alternative model based on stress corrosion has been developed which is a more satisfactory fit to these data.
Similar work is now under way on a Tholeiitic basalt. Additionally, textural studies of specimens deformed in constant strain rate mode to total strains of ca. 3-5% are being performed.
Reports
ATKINSON, B.K. 1980. An outline proposal of some aims, strategies and objectives in earthquake prediction. In Proceedings 2nd Workshop on European Earthquake Prediction Programme jointly organised by European Space Agency and Parliamentary Assembly of the Council of Europe, Strasbourg, 1980, 135-155.
ATKINSON, B.K. 1980. Fracture Mechanics modelling of earthquake generating processes. In Proceedings of an Interdisciplinary Conference on Earthquake Prediction Research in the N. Anatolian Fault Zone, Istanbul, 1980 (in press)
ATKINSON, B.K. and Avdis, V. 1980. Fracture Mechanics parameters of some rock-forming minerals determined with an indentation technique. Int. J. Rock Mech. Min. Sci. and Geomech. Abstr. (in press).
Norton, M.G. and ATKINSON, B.K. 1980. Stress-dependent morphological features on fracture surfaces of quartz and glass. Tectonophysics (in press).
ATKINSON, B.K. 1980. Review of subcritical crack propa gation in rock. Proc. 26th International Geological Congress, Paris, 1980. (To be published in J. Struct. Geol.)
ATKINSON, B.K. and Rawlings, R.D. 1980. Acoustic emission during stress corrosion cracking in rocks. Proc. 3rd Maurice Ewing Symposium on Earthquake Prediction, New York, 1980. Geophysical Union (in press).
ATKINSON, B.K. and Meredith, P.G. 1980. Stress corrosion of quartz: Influence of chemical environment. Tectono physics (in press).
Meredith, P.G. and ATKINSON, B.K. 1980. Stress corrosion and acoustic emission of Whin Sill dolerite (in preparation)
Dennis, S.M. and ATKINSON, B.K. 1980. The influence of pore fluids on the sliding of faulted surfaces of Westerley granite under simulated geologic environments (in prep.)
Dennis, P.F. and ATKINSON, B.K. 1980. Flow and fracture deformation mechanism maps for quartz (in preparation)
ATKINSON, B.K. 1981. Earthquake precursors. Physics in Technology 12.
ATKINSON, B.K. 1980. How to take the shock out of earth quakes. The Guardian, 25 September.
1.
INTRODUCTION
The fracture mechanics description of crack propagation
(Irwin, 1958) allocates a key role to the stress intensity
factor, K, which is a measure of a body f s resistance to
fracture. Fracture propagation problems can be analysed in
terms of the three stress intensity factors, K , K and KTTJ ,
which pertain to the three fundamental modes of crack propa
gation. These are: mode I - tensile-? mode II - in-plane
shear ; mode III - anti-plane shear. For a two-dimensional
plane crack of any mode the stress intensity factor is given
by
K = Ya a . (1) a
where Y is a geometrical constant, a is the remote applieda
stress and a is a characteristic crack length.
If the stress intensity factor is raised above a critical
value, K , which is a material constant, then the crack will c
propagate at velocities approaching those of sound in the
medium. For many materials such as oxides and silicates,
however, crack propagation can occur at much lower values of
K than K . A variety of environmentally dependent mechanisms,C
noteably stress corrosion, can facilitate this stable,
quasistatic subcritical crack propagation. It occurs at
velocities which decrease as K is lowered to some threshold
value, K , below which no crack propagation is observed.

2.
In recent years there has been a rapid increase in the
number of experimental studies designed to advance our under
standing of subcritical crack propagation in rocks. The
impetus for this has come from both the extensive work of
materials scientists, who have analysed the premature failure
of structural engineering components in terms of subcritical
crack propagation, and the growing awareness amongst earth
scientists that subcritical crack growth can explain many
previously puzzling problems in geophysics.
This paper has four main sections. In the first I will
outline the complexities of subcritical failure in rocks and
present a fracture mechanism map for quartz to illustrate
some of these phenomena. In the second section the current
state of modelling some aspects of subcritical failure at a
theoretical level is reviewed. The third section presents
the findings of experimental studies of subcritical crack
propagation in rocks. The emphasis here is on results, as
experimental methods are to be reviewed elsewhere (Atkinson,
1981). The fourth section contains a number of illustrations
of the potential importance of subcritical cracking in geo
physical phenomena.
To a very large extent this work concentrates on results
for mode I, tensile crack propagation under the influence of
stress corrosion. This arises mainly because the vast
majority of experimental results pertain to this mode.
However, not only is this mode of fracture in itself of
fundamental importance in the fracture of rocks in the earth,
but in addition there is no obvious physico chemical
3.
reason why the form of the law to describe processes such
as stress corrosion, but not necessarily the parameters,
should depend on mode (Das and Scholz, 1980).
MICROMECHANISMS OF FRACTURE
Following Ashby and others (Ashby et al., 1979j Gandhi
and Ashby, 1979) we can identify four main micromechanisms
of tensile crack propagation for materials that cleave. I
consider here only those mechanisms leading to fracture after
relatively modest plastic flow (<10%) . Fractures after large
strain (10 - 100%) without cleavage are not considered.
Fracture controlled by pre-existing cracks
If a brittle solid contains a crack or a flaw it may
propagate at stresses which are lower than that required for
slip or twinning on any crystallographic system. Fracture
occurs at a stress, a,., given by
(2)
where E is Young's modulus, 2c is the pre-existing crack
length and G is the critical strain energy release rate\~*
2 2(G = K (1-v )/E for plane strain, where v = Poisson's{-* JL
ratio). Because the stress at fracture is less than the yield
stress of even the softest slip or twinning system no general
plasticity is possible. There may, however, be local
plasticity at the crack tip. Gandhi and Ashby (1979) call
this mechanism cleavage 1. Note that the fracture strength

4.
of a body is determined by the largest crack it contains.
Fracture controlled by cracks generated through micro-
plasticity.
If pre-existing cracks are very small or absent, then
the stress can reach the level required to initiate slip
or twinning. Provided that slip or twinning only occurs on
a limited number of independent systems (less than 5) and the
total bulk plastic strain is less than about 1% then internal
stresses are generated which can nucleate cracks. This most
commonly occurs when slip or twinning dislocations pile up at
grain boundaries. Cracks that are nucleated in this way
generally have a length which is proportional to the grain
size, d, because this is the wavelength of the internal
stresses. We can envisage that if the stress for twinning or*
slip on the softest system exceeds a where
(3)
then a crack will propagate as soon as it is formed and
fracture will occur at the stress for the onset of micro-*
plasticity, a . If, however, a is greater than a then a
crack nucleated by slip or twinning will not immediately
propagate and the stress will have to be raised even further
before macroscopic fracture occurs. Gandhi and Ashby (1979)
call this mechanism cleavage 2,
Both cleavage 1 and cleavage 2 are mechanisms of fracture
='5
5.
that occur at very low plastic strains (<1%) . If the
temperature is raised then the flow stress falls until
general plasticity or creep is possible. Fracture can still
occur under these conditions, however, as described below.
Fracture controlled by cracks generated through general
plasticity/grain boundary sliding
Substantial plastic strain (1-10%) precedes fracture
by this mechanism. The plasticity blunts small pre-existing
cracks and effectively raises the resistance to fracture, G .\^
Significant general plasticity or grain boundary sliding can
then generate larger grain boundary cracks or cause a pre
existing crack to grow in a stable manner, until its increased
length, coupled with the higher stress caused by work-hardening
cause it to propagate unstably as a cleavage crack. Gandhi
and Ashby (1979) term this mechanism cleavage 3.
At this point it is important to note that because of
the delicate balance between the stress required to cause a
mineral grain to cleave and the stress required to cause brittle
grain boundary cracking it is not always an easy matter to
predict which will predominate under any given set of con
ditions. This balance can be upset by small changes in
temperature, impurity content, cement mineralogy and rock
texture. The dominant fracture path is best determined from
experiments. If brittle intergranular fracture occurs, then
Gandhi and Ashby (1979) refer to it as B.I.F.I,2 or 3.
6.
Intergranular creep fracture
The fourth mechanism of fracture that we will consider
occurs at high temperatures and low stresses. Failure under
these conditions is always byintergranular creep fracture
(Gandhi and Ashby, 1979). Voids or wedge cracks nucleate
and grow (Soderberg, 1972) on grain or phase boundaries.
Nucleation is probably controlled by dislocation creep but
when cracks are small growth is by local diffusion; the rate
of diffusion being controlled by dislocation creep in the
surrounding grains (Ashby et al., 1979). The linking of
voids or cracks leads to a relatively low (<10%) - ductility
fracture after long periods of creep deformation.
Fracture Mechanism Map
Experimental results and theoretical descriptions of
these fracture mechanisms can be combined to aid the con
struction of a fracture mechanism map for specific materials
as described by Ashby et al. (1979) and Gandhi and Ashby (1979)
These maps are analogous to plastic flow deformation mechanism
maps and indeed are partly based on them. They show the
environmental conditions under which different mechanisms of
fracture are dominant; i.e. produce failure in the shortest
time.
In Figure 1 I show a typical fracture mechanism map for
quartz. The method of constructing this figure is outlined
in the Appendix. Note, however, that it is based on a new
plastic deformation fracture mechanism map derived for quartz
7.
by P. Dennis (personal communication, 1980). The top of
Figure 2 is truncated by the stress required for fracture at
the ideal strength, i.e. the stress required to overcome the
interatomic forces in a perfect crystal.
This is given by
"ideal B E/10 (4)
A field is shown on this diagram labelled dynamic fracture
which is for the mechanism active at the highest stresses.
This field cuts off all other fields of lower stress mechanisms
and is the region where even the initial loading must be
described in terms of the propagation of an elastic wave
through the material.
The map could have superimposed on it contours of time-
to-failure or crack velocity but the paucity of data precludes
such a refinement at this stage.
One may infer from the fracture mechanism map that for the
upper 2O km, or so, of the earth's crust, cleavage (B.I.F.) 1
will be the most important fracture mechanism. For this reason
I will concentrate on this mechanism in the ensuing discussion.
Influence of Chemical Effects on Fracture
There are a number of different ways in which the action
8.
of the environment or the chemistry of the phases involved
can help lower the barriers to crack propagation. Consider
the influence of these variables on cleavage/B. I.F. 1 in
quartz.
(a) The presence of liquid water, water vapour or some
other reactive species in the crack tip environment can
facilitate crack propagation by promoting weakening reactions.
For the quartz/water system reactions of the form
(-Si-O-Si-) + H2 0 ->(-Si-OH-HO-Si-) (5)
may occur. The strong silicon-oxygen bonds are replaced
with much weaker hydrogen bonds (Scholz, 1972; Martin, 1972?
Swain et al. , 1973; Atkinson, 1979; Atkinson and Meredith,
1981) . This phenomena is known as stress corrosion.
(b) Some solids contain dissolved chemical impurities, such
as structurally bound water in. quartz, which can have a
degrading effect on strength if present in sufficient quantities.
During crack propagation stress directed diffusion of these
chemical impurities to crack tips may occur, where they can
take part in weakening reactions, thus facilitating crack
extension (Schwartz and Mukherjee, 1974) . In addition, the
difference in chemical potential between the highly stressed
atoms of the crack tip and those in the bulk of the solid can
lead to a concentration gradient of vacancies at the crack
tip. The diffusion of vacancies to the crack tip will then
9.
control the crack propagation rate as described by Stevens
and Dutton (1971). These diffusion-based mechanisms are
only likely to be important at relatively high homologous
temperatures.
(c) If the chemical environment contains species which can
undergo ion exchange with species in the solid phase, and if
there is a gross mis-match in the size of these different
species then lattice strains can result from ion exchange
which can facilitate crack extension, e.g. exchange of H
for Na in silicate glasses (Wiederhorn, 1978) .
Atkinson (1979) has suggested that for quartz at least the
most important of these effects is stress corrosion at low
homologous temperatures.The overwhelming proportion of data on
subcritical crack propagation in rocks relates to this phenomenon.
I shall concentrate on this aspect of subcritical crack propagation
in the rest of this paper.
THEORETICAL BACKGROUND TO STRESS CORROSION
Observations on stress corrosion in a wide range of
glasses, oxides and silicates are broadly consistent with
a schematic stress intensity factor (K )/crack velocity (v)
diagram shown in Fig. 2 for mode I crack propagation.
In this diagram K_ is the critical stress intensity
factor and K is a threshold stress intensity factor below
which no appreciable crack growth occurs. K is not commonly
10.
observed even at very low velocities - but consideration of
the properties of materials suggests it must exist. In
region 1, v is apparently controlled by stress corrosion
reactions. At higher K_ values in region 2 the transport of
reactive species to the crack tip is believed to be rate
controlling. At yet higher K values v is controlled by some
poorly understood, thermally activated process that is compara
tively (but not totally) insensitive to the chemical character
of the environment.
The influence of increasing the partial pressure or
concentration of water in the environment is as shown. In
creasing temperature also tends to shift the K_-v curves to
wards the top left hand of the diagram. The influence of hydro
static pressure is not known. It might be expected that in
creasing the pressure on a water bearing environment would
enhance the rate of stress corrosion because the water molecules
become more concentrated and chemical corrosion reactions are
enhanced. The limited evidence available from work on metals
(Dehart and Liebowitz, 1968) suggests that in some materials,
at least, stress corrosion is suppressed by pressure. In some
cases K may be increased by application of pressure (Gerberich,
1974). Furthermore, Kranz's (198O) study of the influence of
pressure on static fatigue of granite can be interpreted to
show that increasing pressure decreases the rate of stress
corrosion primarily by increasing the activation enthalpy
required for the stress corrosion process. Secondary effects
might include a retardation of the rate at which corrosive
species can reach crack tips by decreasing crack wall spacing
under pressure.
11.
As an aside it is worth noting that even for silicate
glasses the stress corrosion explanation for the schematic
K-v curves of Figure 2 is not universally accepted. Marsh
(1964), Wiedmann and Holloway (1974) and Williams and Marshall
(1975) have suggested that plastic flow may be an alternative
explanation - even at ambient temperatures. The latter two
authors have attempted to put their ideas into quantitative
form. However, it has yet to be shown that the theories of
Wiedmann and Holloway (1974) and Williams and Marshall (1975)
are consistent with the huge volume of data on the environ
mental dependence of crack velocity even in silicate glasses.
Until then these ideas should be viewed with caution, especi
ally in the light of the marked success of chemical theories
of fracture (see later) in accounting for experimental obser
vations of environmentally dependent subcritical cracking
(Wiederhorn, 1974? 1978). Moreover, even allowing that plastic
flow may be of minor significance in low-temperature subcritical
cracking of some minerals, such as calcite or galena, all the
available evidence (Martin and Durham, 1975; Dunning et al.,
198O) suggests that low-temperature subcritical crack propa
gation in quartz is not accompanied by plastic flow.
There have been numerous attempts to develop theoretical
descriptions of K -v curves in terms of chemically assisted
stress corrosion processes. The early theories have been
reviewed by Anderson and Grew (1977) and will not be repeated
here (see also Atkinson, 1979). I will concentrate on the
most widely used expressions and those that have been most
12
recently published.
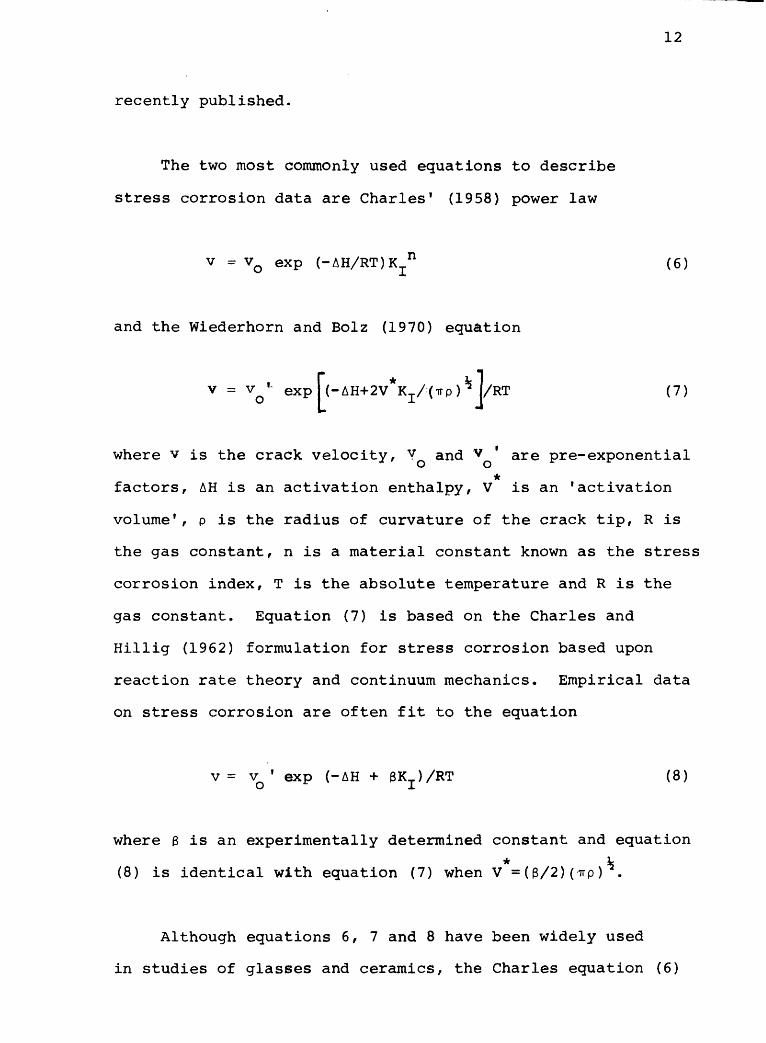
The two most commonly used equations to describe
stress corrosion data are Charles' (1958) power law
v = VQ exp (-AH/RTjKj 11 (6)
and the Wiederhorn and Bolz (1970) equation
v = VQ ' exp (-AH+2V*KI/(Trp) M/RT (7)
where v is the crack velocity, V and v ' are pre-exponential*
factors, AH is an activation enthalpy, V is an 'activation
volume', p is the radius of curvature of the crack tip, R is
the gas constant, n is a material constant known as the stress
corrosion index, T is the absolute temperature and R is the
gas constant. Equation (7) is based on the Charles and
Hillig (1962) formulation for stress corrosion based upon
reaction rate theory and continuum mechanics. Empirical data
on stress corrosion are often fit to the equation
v = v ' exp (-AH + 0K_)/RT (8) o I
where 3 is an experimentally determined constant and equation* k (8) is identical with equation (7) when V =(&/2)(irp) .
Although equations 6, 7 and 8 have been widely used
in studies of glasses and ceramics, the Charles equation (6)
13
has been used most commonly in studies of rocks and minerals.
In part this is because the Wiederhorn and Bolz equation can
only be used to describe region 1 of the schematic K -v
curve. Charles 1 equation on the other hand can be used with
appropriate changes in V , AH and n, to describe all three
regions of the schematic K_-v curve. Furthermore, these
two theories of stress corrosion are still largely empirical
and because n in equation (6) is often large (usually >10)
then it is virtually impossible in practice to distinguish
between equations (6) and (8).
In an attempt to model chemically enhanced subcritical
cracking at the atomic level Lawn (1975) and Lawn and Wilshaw
(1975) developed a two-stage description of crack propagation
in which reactive species must first be transported to the
crack tip before reactions can occur there to facilitate crack
extension. The slowest of these two steps, reaction and
transport, will control the rate of the overall process.
The central idea in crack advance is of an ideally brittle
fracture crack in which sequential bond rupture occurs via
the lateral motion of atomic kinks along the crack front.
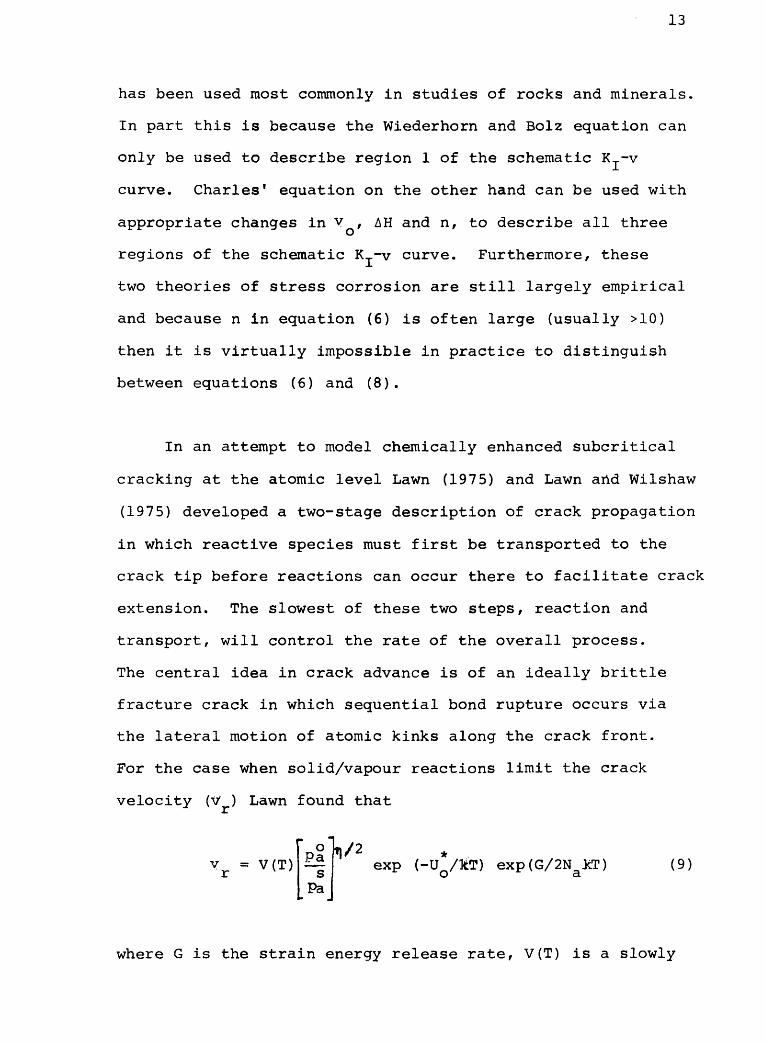
For the case when solid/vapour reactions limit the crack
velocity (V ) Lawn found that
v = V (T)r
o Pas
Pa
k/2exp (-U /kT) exp(G/2N *T) (9)o * a
where G is the strain energy release rate, V(T) is a slowly
14
varying temperature-dependent term, p° is the vapoura
pressure at the crack mouth, ps is the vapour pressure ina
some reference state, n is the number of molecules of
environmental species reacting with one bond in the solid
to produce a weakened state, U* is a collection of various
uncertainty energy constants, k is Boltzmann's constant, and
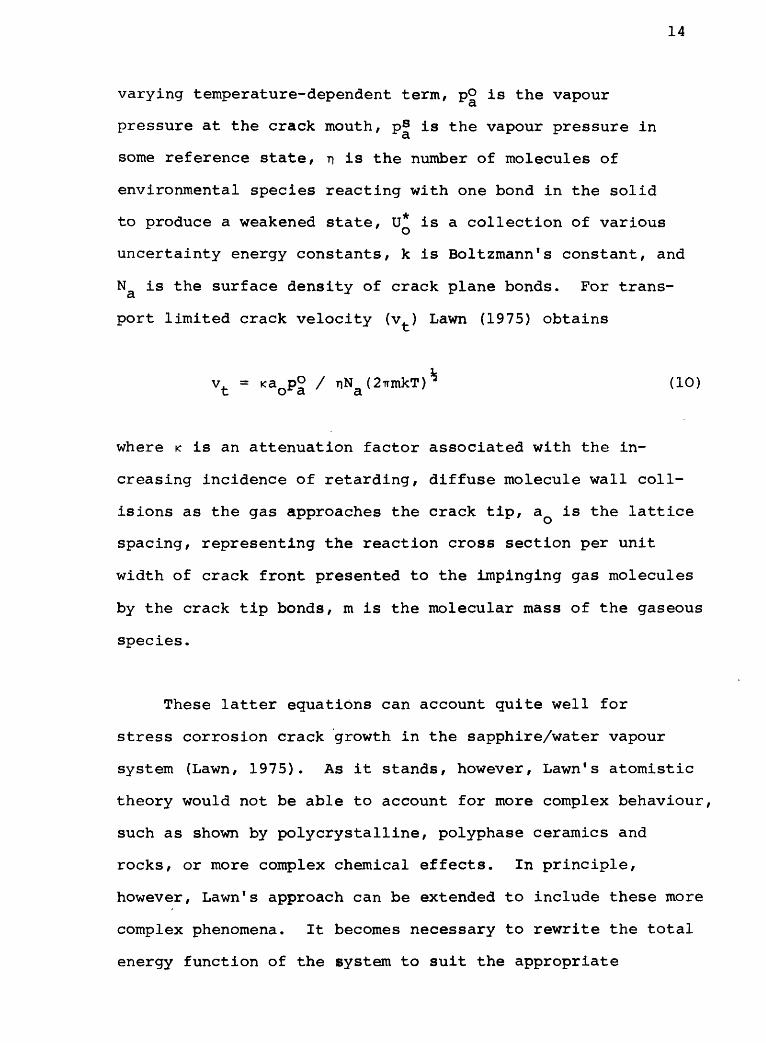
Na is the surface density of crack plane bonds. For trans
port limited crack velocity (v.) Lawn (1975) obtains
v. = i<a D° / nN (2-rrmkT)^ (1O)u O a. a
where K is an attenuation factor associated with the in
creasing incidence of retarding, diffuse molecule wall coll
isions as the gas approaches the crack tip, a is the lattice
spacing, representing the reaction cross section per unit
width of crack front presented to the impinging gas molecules
by the crack tip bonds, m is the molecular mass of the gaseous
species.
These latter equations can account quite well for
stress corrosion crack growth in the sapphire/water vapour
system (Lawn, 1975). As it stands, however, Lawn's atomistic
theory would not be able to account for more complex behaviour,
such as shown by polycrystalline, polyphase ceramics and
rocks, or more complex chemical effects. In principle,
however, Lawn's approach can be extended to include these more
complex phenomena. It becomes necessary to rewrite the total
energy function of the system to suit the appropriate
15
new system variables and to identify the various mechanisms
which contribute to the overall crack growth process / and
then determining the conditions under which each mechanism
might assume a rate-controlling role.
Brown (1979) has recently taken the analysis of sub-
critical crack growth an important stage further. He noted
that no existing theory can account in a unified manner for
all three stages of the schematic KT~V curve. Approaching
the problem of slow crack growth in terms of steady state
multibarrier kinetics (network theory) Brown (1979) derived
a general equation that does account for all three regions
of a K -v curve and from which specialized expressions can
be developed for the crack velocity in specific cases.
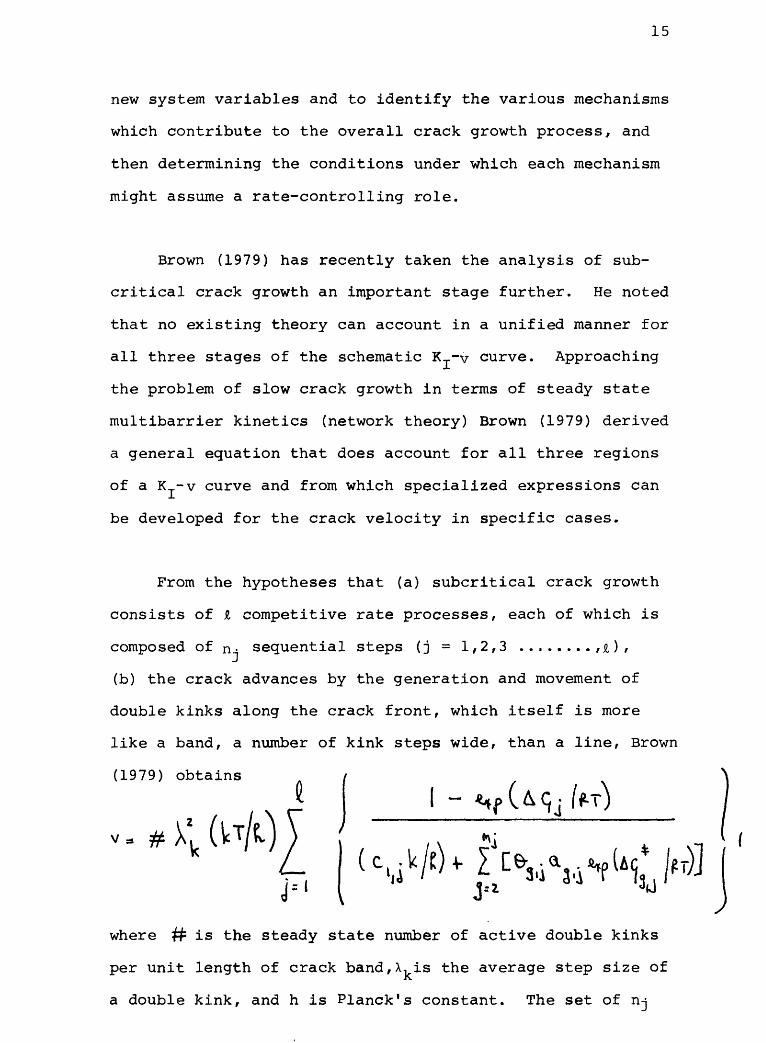
From the hypotheses that (a) subcritical crack growth
consists of £ competitive rate processes, each of which is
composed of n- sequential steps (j = 1/2,3 ........,&),
(b) the crack advances by the generation and movement of
double kinks along the crack front, which itself is more
like a band, a number of kink steps wide, than a line, Brown
(1979) obtains
* X1, (VT/tJK,
where & is the steady state number of active double kinks
per unit length of crack band,A, is the average step size of
a double kink, and h is Planck's constant. The set of rij
16
sequential steps is perceived as a collection of m-;
sequential subsets each of which corresponds uniquely to a
different rate process in the series. 6 . = the number of
sequential steps corresponding to the g th subset both in
the j th set. a .'s are dimensionless parameters whichy r j
lump appropriate geometric factors, reactant concentrations
raised to the powers of their respective orders of reaction,
stoichiometric constants and conversion factors corresponding
to the g th subset of the j th sequence. AG_ . are theg/ J
Gibbs free energies of activation for forward steps in the g th
subset. (-AGj) is the free energy driving force for the
entire j th sequence. c, . is a parameter that relates toJ- / 3
gaseous diffusion processes (transport of reactive species
to crack tip through an interadjacent, stagnant gas film)
where one mj is arbitrarily designated the subset for which
g = 1. It depends on thickness of the stagnant gas film, the
order of the stress-sensitive bond-rupturing reactions, the
collision cross section and molecular weight of both reactant
species and inert gas species, Avagadrdfe number, the mole
fraction of reactant species and the average step size of
a double kink.
Equation (11) is very general and was specialized for
selected cases in order to obtain v = V(K) relations. To
do this odd j suffixes were arbitrarily assigned to those
sequences which include mass transport of a key reactant
or product species between the environment and crack tip.
Even j suffixes correspond to those processes that occur
wholly within the solid, at and/or near the crack tip, that
17
are comparatively unaffected by the environment, £ is
set <4. Subcritical crack growth was classified according
to five general environments: (1) inert gas or liquid, or
vacuum, (2) dilute reactive gas, (3) dilute reactive liquid,
(4) concentrated reactive gas, and (5) concentrated reactive
liquid. The number of v = v(K) relations that can be
obtained from equation (11), even with Jt < 4 is enormous,
but study of a wide range of empirical data suggests that
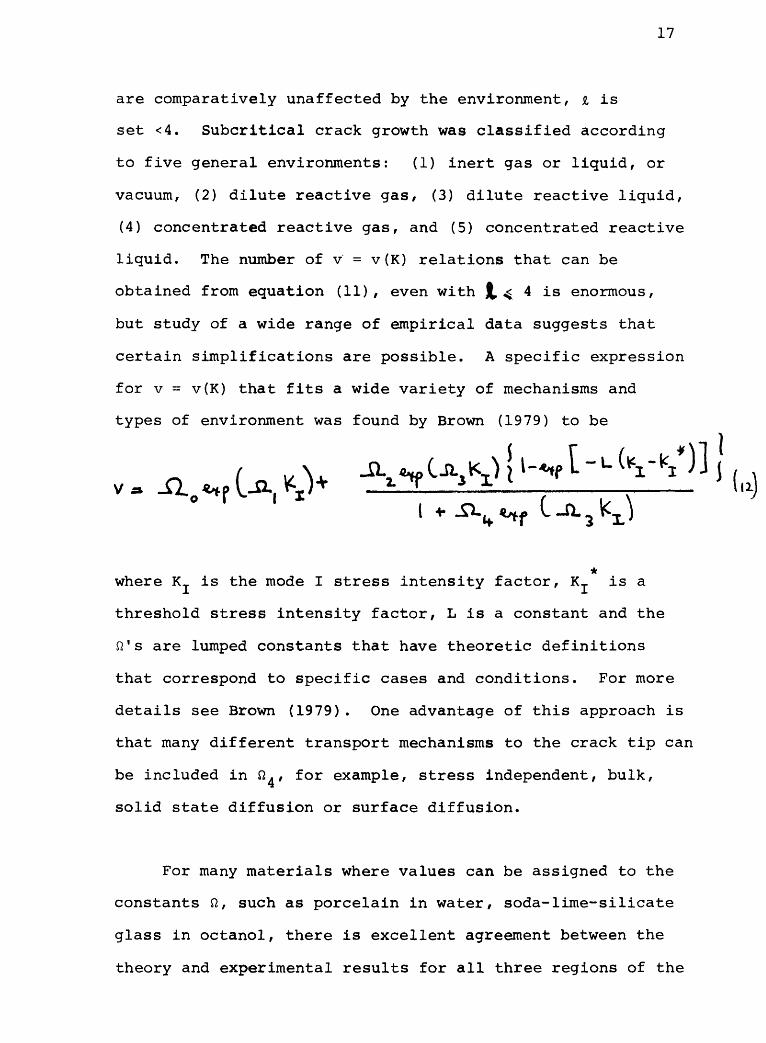
certain simplifications are possible. A specific expression
for v = v(K) that fits a wide variety of mechanisms and
types of environment was found by Brown (1979) to be
where K is the mode I stress intensity factor, K_ is a
threshold stress intensity factor, L is a constant and the
n's are lumped constants that have theoretic definitions
that correspond to specific cases and conditions. For more
details see Brown (1979). One advantage of this approach is
that many different transport mechanisms to the crack tip can
be included in ft,, for example, stress independent, bulk,
solid state diffusion or surface diffusion.
For many materials where values can be assigned to the
constants ft, such as porcelain in water, soda-lime-silicate
glass in octanol, there is excellent agreement between the
theory and experimental results for all three regions of the
18
K -v curve. However, to assign values to the constants
fi can be a formidable task and at least at present is
not really feasible for studies of rocks. Although Brown's
(1979) theory clearly has substantial scope for future
application in geophysics there is at present too much
guesswork involved in assigning values to the constants in
equation (12) for rocks.
Thomson has recently developed Lawn and Wilshaw's
(1975) ideas a stage further (Thomson, 1980; Fuller and
Thomson, 1980) and attempted to provide a more satisfactory
theoretical framework. He addresses the problem of fracture
at an atomically sharp crack assisted by the adsorption of
a gaseous chemical species which lowers the energy of bond
breaking. He obtained a general statistical mechanical
description of brittle crack growth in term* of chemical
absolute reaction rate theory that leads to certain general
conclusions. The most important one is that chemically
assisted fracture should be a widespread phenomena, associ
ated with the lowering of the surface energy of the material
by the external environment. However, steric or size effects
can restrict the external molecules from entering the cohesive
region where chemical reactions occur and a variety of com
plex chemical effects can occur at crack tip to strengthen
the crack or to slow down its growth. Thus the details of
environmentally assisted fracture will vary widely from one
system to another. Despite the enormous literature on
fracture there is little in the way of an appropriate data
base with which to check the specific quantitative predictions
19
of Thomson and to throw light on the specific chemical
processes involved.
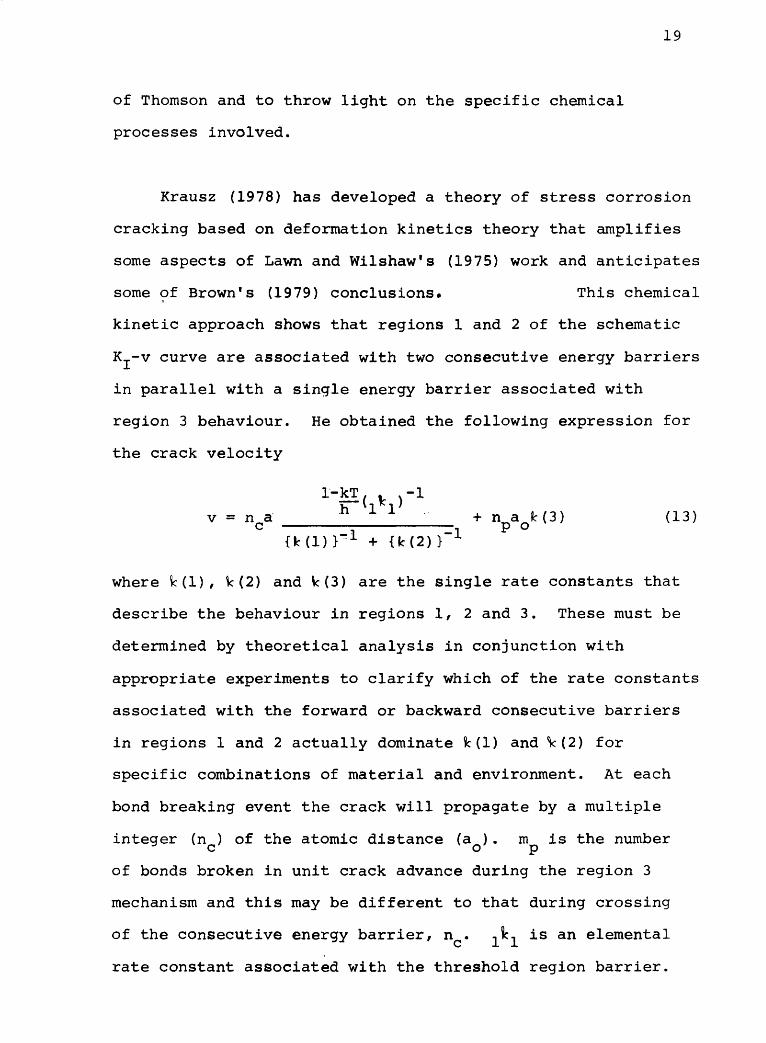
Krausz (1978) has developed a theory of stress corrosion
cracking based on deformation kinetics theory that amplifies
some aspects of Lawn and Wilshaw's (1975) work and anticipates
some of Brown's (1979) conclusions. This chemical
kinetic approach shows that regions 1 and 2 of the schematic
K.J.-V curve are associated with two consecutive energy barriers
in parallel with a single energy barrier associated with
region 3 behaviour. He obtained the following expression for
the crack velocity
v = na + n aQH3) (13)
{Ml)}" 1 + (M2)}' 1
where k(l), k(2) and V:(3) are the single rate constants that
describe the behaviour in regions 1, 2 and 3. These must be
determined by theoretical analysis in conjunction with
appropriate experiments to clarify which of the rate constants
associated with the forward or backward consecutive barriers
in regions 1 and 2 actually dominate Ml) and V(2) for
specific combinations of material and environment. At each
bond breaking event the crack will propagate by a multiple
integer (n ) of the atomic distance (a ) . m is the number c op
of bonds broken in unit crack advance during the region 3
mechanism and this may be different to that during crossing
of the consecutive energy barrier, n . .A, is an elemental
rate constant associated with the threshold region barrier.
20
One interesting conclusion of Krausz's work is that
as long as the mechanism of the consecutive processes in
regions 1 and 2 does not change, then the threshold stress
intensity is independent of temperature.
I have already alluded to the suggestion of Stevens
and Dutton (1971) that at relatively high homologous
temperatures slow crack growth in some materials may be
facilitated by mass transport processes such as volume or
surface diffusion or vapour phase transport. For example,
Stevens and Dutton (1971) show that surface diffusion and
vapour phase transport may control the high-temperature
static fatigue of alumina in a dry environment, even though
at low temperatures in water vapour crack propagation may
well be controlled by stress corrosion. Unfortunately, there
are too few experimental data points to constrain the
theoretical predictions for ceramics. There is no pertinent
data for rocks. However, the general implication of Stevens
and Button's work, that mechanisms of fracture are dominant
over different ranges of environmental conditions is entirely
consistent with the view of fracture that I have sought to
present in this article.
Unfortunately, the more recent of theories described
in this section are only easily applicable to certain simple,
model systems such as soda-lime silicate glass/water or
alumina/water. The complexities of subcritical cracking in
polyphase, polycrystalline rocks which have complicated
microstructures, cements, fabrics and chemistry at present
cannot easily be analysed in these terms. A full description
of subcritical cracking of rocks in terms of fundamental
processes is certain to be highly complex. Evans and Graham
(1975) have used acoustic emission amplitude studies to
construct a model of macro-crack propagation in single phase
polycrystalline ceramics that takes into account some of the
complexities of microstructure, but this sort of work is
still in its infancy.
Under these circumstances, and considering the relatively
limited data available on subcritical cracking of rocks
compared to that of model materials, such as silicate glasses,
the continued use is justified of the relatively simple and
semi-empirical Charles power law (equation 6) to describe
stress corrosion results for geological materials. Not only
has this equation certain advantages (described above) but it
is also the equation that is most often favoured by experi
mentalists who have studied stress corrosion in rocks.
EXPERIMENTAL STUDIES OF STRESS CORROSION IN GEOLOGICAL MATERIALS
Quartz
Static fatigue of quartz in wet environments was studied
by Scholz (1972), Martin (1972) and Martin and Durham (1975),
but their results were not reported in terms of fracture
mechanics parameters. Temperatures up to 25O C were investi
gated in the two latter papers. Some of their data are given
in Table 1. Swain et al. (1973) used a Hertzian indentation
technique to explore the influence of rate of loading,
physical state and concentration of corrosive agent on the
strength of quartz.
Atkinson (1979) was the first to report stress corrosion
data on quartz in terms of K -v diagrams. The double torsion
testing method (Williams and Evans, 1973) was used in this
study to investigate the influence of liquid water and water
vapour on crack propagation at temperatures from 20° to 80°C.
values obtained for the stress corrosion index and the acti
vation enthalpy for crack propagation are shown in Table 1.-9 -1
Crack growth rates as slow as 10 m.s were studied without
any firm evidence of a stress corrosion limit. All of
Atkinson's (1979) data pertain to region 1 of the schematic
K -v curve (Figure 2). Using the theory of Lawn (1975) a
plateau (region 2) in the KT-v curve for quartz (a planej_rJ. ~"~ ~"~
in 68% RH) was calculated to lie at 4 x
outside the range of experimental data.
-4 -1 in 68% RH) was calculated to lie at 4 x 10 m.s or just
Further work on the stress corrosion of quartz has been
reported in terms of K -v diagrams by Bruner (1979). He used
double cantilever beam specimens at room" temper atfure in water
vapour. In Figure 3 is shown a synoptic diagram that includes
the results of Bruner (1979) and some of the results of
Atkinson (1979). Crystallographic orientation can clearly
exert a pronounced influence on crack propagation rates in
this material, especially at slow crack velocities. This
point was also inferred by Scholz (1972) from his static
fatigue experiments. Note that the plateau in the experimen
tal K -v curves (region 2) in Figure 3 is in good agreement with
23
Atkinson's (1979) theoretical prediction.
Atkinson and Meredith (1981) have shown that the pH of
the aqueous environment can strongly influence the rate of
crack propagation at room temperature. This influence is
greatest at low values of K and diminishes as K is raised
(Figure 4). At very high values of K close to K no signifi-JL JLO
cant influence of pH on crack propagation rates is observed.
This is interpreted in terms of a two stage model as follows.
At low crack velocities the crack tip environment is open to
modification by the external environment through diffusion of
chemical species along the crack between the bulk fluid and
the crack tip. Chemical differences between the crack tip
and the bulk fluid are not long sustained and the crack tip
environment is controlled by the chemical composition of the_2 _i
bulk fluid. At high crack velocities (ca. 10 m.s ) trans
port of chemical species from the bulk fluid to the crack tip
environment cannot keep pace with the creation of new sources
of reactive ions in fresh crack surfaces. In this case the
composition of the crack tip solution is controlled primarily
by the chemical composition of the fresh crack surfaces. The
greater the availability of OH ions/ the faster is the rate
of crack propagation, for a given value of K....
As mentioned earlier, electron microscope studies (Martin
and Durham, 1975; Dunning et al., 1980) have shown that
chemically enhanced crack growth is not accompanied by any
significant plastic deformation, at least at temperatures
24
up to 250°C. In Martin and Durham's (1975) study, however,
Dauphine twins were observed in experiments at 125°C and
above. It is possible that Dauphine twins are produced in
advance of crack propagation in contact-loaded quartz (see
Hartley and Wilshaw, 1973) but the very small atomic motions
that this involves serve merely to efficiently accommodate
the local elastic strain that accumulates in elastically
anisotropic quartz.
Hartley and Wilshaw (1973) have interpreted their
Hertzian indentation studies to show that intrinsic water
in the quartz structure may promote strength reduction at
temperatures above 52O°C by stress-assisted diffusion of
lattice water to crack tips. The role of OH ions in the
silica lattice, however/ is markedly affected by annealing.
No systematic attempt has been made here to identify
data pertaining to synthetic or natural quartz. There is
some suggestion, however, that some types of natural
Brazilian quartz may have markedly different mechanical
properties to synthetic quartz (Norton and Atkinson, 1981).
Quartz rocks
A KT-V diagram has been published by Atkinson (1980)
for stress corrosion of double torsion specimens of Arkansas
Novaculite in liquid water at temperatures of 20 -80 C.
This Novaculite ±9 a microcrystalline almost pure quartz rock
25
with a mean grain size of approximately 10 micrometres. The
stress corrosion index was somewhat greater than for any
orientation of single crystals of quartz yet studied but
the activation enthalpy was comparable to that of quartz
(see Table 1). Crack velocity data were obtained in the
range from 10 to 10 m.s All data pertain to region 1
of the schematic K...-V curve and no stress corrosion limit
was observed.
Peck (1980) has noted a 15-20% reduction in fracture
energy determined for double cantilever beam specimens of
' Sioux quartzite in tap water compared to that in air of
ambient humidity. This was attributed to stress corrosion
effects.
Calcite rocks
Henry (1978) and Henry and Paquet (1976) have reported
stress corrosion data for a marble and a micrite in liquid
water containing dissolved CaCO,, and in moist air. These
workers also used the double torsion testing method. They
found that there was a strong orientation dependence of K -v
data for marble; the trends in the data had approximately
the same slope, but their position in K -V space varied
substantially with orientation. The stress corrosion index
for micrite in air was markedly different to that for micrite
in liquid water (Table 1). These data for calcite rocks
showed the trimodal pattern familiar from work on silicate
26
glasses and illustrated schematically in Figure 2. Most
unusually, however, at very low K_ values an apparently
anomalous region of behaviour was encountered. As K was
lowered at the slow velocity end of region 1 behaviour there
appeared a second, constant crack velocity, plateau region.
On lowering K further still this was followed by another
region where crack velocity decreases with decrease in K...
at much the same rate as for region 1 behaviour. This
apparently anomalous region may be ascribed to relatively
poor data obscuring a threshold stress intensity. There is
a considerable scatter to the Henry and Paquet (1976) results
Alternatively, if the effect is real then it may result from
complex chemical reactions between solid and solution or to
the onset of plastic deformation as a significant contributor
to crack growth processes.
For a given stress intensity factor the rate of crack
propagation in micrite is generally increased on raising the
pH of the corrosive medium above 7 (Henry, 1978). Acti
vation enthalpies for crack propagation in micrite at
temperatures from 2O° to 85°C were found to be temperature
dependent by Henry (1978). These data are given in Table 1.
Basaltic rocks
To date, all experiments run on basaltic rocks have
used the double torsion testing method. Some details of
crack growth in basaltic rocks are presented in Figure 5 and
27
Table 1. Stress corrosion crack velocity/K curves for
Black gabbro in liquid water and in air of 3O% R.H. at 2O°C
were found by Atkinson and Rawlings (1979a, b; 1981) to have
the trimodal form characteristic of the behaviour shown by
glasses and ceramics (see Figure 2). Crack growth was-9 -1
followed down to velocities of ca. 1O m.s. (O.54 K_ )Ic
without encountering a stress corrosion limit.
Waza et al. (198O) studied subcritical crack growth in
relatively porous (6%) Kinosaki basalt. The porous nature
of the basalt may explain why it was apparently much weaker
(KT = 1.1 MN.m /2) than the coarser grained Black gabbro
3/2 (KT = 2.88 MN.m ' ). Because only a few data points are
reported by Waza et al. (1980) only very approximate values
can be assigned to the stress corrosion index (Table 1).
Another basalt, Murata basalt, has been tested by Sano and
Ogino (198O) . For this material K... was in excess of
-3/0 2 MN.m ' **. Stress corrosion data for Whin Sill dolerite have
been determined by Meredith and Atkinson (1981).
Crack velocity/K curves for a lunar analogue basaltic
glass at water vapour pressures of 1.33 KPa and 0.13 Pa have
been reported by Soga et al (1979). They found that in common
with other glasses increasing the partial pressure of water
vapour at constant K T dramatically enhances the rate of crack
propagation. The basaltic glass was made from Ralston
intrusive. Stress corrosion data for the crystalline form of
this rock are reported in Atkinson et al (198O).
28
Granitic rocks
Figure 6 shows a synoptic diagram of most of the
available stress corrosion data for granitic rocks. Values
of the stress corrosion index and testing conditions can be
found in Table 1. With the exception of Wilkins* (1980)
fracture statistics approach all other workers on granitic
rocks have used the double torsion method.
One especially interesting feature of Figure 6 is the
absence of a stress corrosion limit in Lac du Bonnet granite
even at crack velocities as slow as 10 m.s
It can be inferred from Swanson's (1980) data for
Westerley Granite in toluene that as crack velocity is raised
above approximately 10" xn.s" there is a gentle reduction in
the slope of the K--v curve. This could mean that region 2
behaviour (see schematic K...-V curve, Figure 2) is being
approached. The gentle slope change observed for granite
contrasts with the rather abrupt change noted for silicate
glasses and some ceramics. Because the crack "tip" in granite
consists of many secondary cracks at these velocities
(Swanson, 1980) the gradual change in slope may be explained as
a result of the differential onset of region 2 behaviour
for different secondary cracks. The conditions for the onset
of this behaviour will depend on crystallographic orientation,
on the nature of the hoet mineral,and on the degree of intra-
and inter-granular character to the crack path.
29
There is some spread in the range of results for
Westerley granite. This is probably due to differences in
testing techniques because when different blocks of Westerley
granite are tested in the same laboratory using identical
testing techniques then relatively similar results are ob
tained. For example, compare curves labelled a and b in
Figure 6 for air of 30% R.H. (Atkinson and Rawlings, 1981;
Atkinson et al. , 1980). The uncertainty in measuring K
and v is approximately 2.5% and 15%, respectively.
Microscopic studies of the crack path during stress
corrosion in Westerley granite have shown that there is a
decrease in the ratio of transgranular to intergranular
fracturing as crack propagation rates are reduced (Swanson,
1980; Atkinson and Rawlings, 1981).
In room temperature time-to-failure tests on Barre
granite with moist air as the stress corrosion agent Kranz
(1980) found that static fatigue is inhibited by the application
of confining pressure. This effect was attributed to an
increase in the activation enthalpy required for. t-he stress
corrosion process, to a change in the rate that corrosive
water vapour could reach the crack tips and a decrease in
crack interaction prior to the onset of tertiary creep. An
increased amount of inelastic deformation also occurs on
raising the pressure before the rock becomes unstable. This
is due to the formation of longer and more numerous micro-
cracks, although the crack angle and length spectra are
JU
grossly similar at the onset of tertiary creep for each
pressure.
Only very approximate values can be quoted for the
stress corrosion index of Yugawara andesite (see Table 1)
determined by Waza et al (1980) in double torsion experi
ments because of the paucity of data points reported. Sano
and Ogino's (1980) double torsion experiments on Oshima
granite are discussed in the following section on acoustic
emission (see also Table 1).
Other geological materials
Time-to-failure tests have been conducted by Schmidt
on oil shale from Anvil Points Colorado in distilled
water, air of 7% R.H. and in dry argon. Schmidt concluded
that stress corrosion can reduce the time-to-failure in this
material provided that K_ is greater than 0.8K . Because
these tests never lasted for longer than 123 hours it is of
course possible that stress corrosion can occur at yet lower
levels of K , but at rates which are so slow that failure J. \*
will result after weeks, months or years rather than a few
hours.
Wiederhorn (1968) has obtained K_-v curves for stress
corrosion of (1012) fractures in sapphire in the presence of
water vapour. These data spanned a range of velocities from
10 to 10 m.s and showed all the features of the schematic
K -v curve (Figure 2). The most striking aspect of these
data is that the plateau, or transport-controlled region
(region 2) is shifted dramatically to higher crack velocities.

31
on raising the pressure of water vapour. For example,-7 -1
region 2 behaviour occurs at ca. 7 x 10 m.s under water_2
vapour pressures of 2,4 N.m , but on raising the pressure-2 -5 -1
to 300 N.m region 2 is shifted to ca. 7 x 10 m.s
Lawn's (1975) atomistic theory can account for the qualita
tive features of these results on sapphire.
Acoustic emission and Stress corrosion
A substantial body of literature exists on acoustic
emissions during subcritical crack growth in ceramics
(e.g. Evans and Linzer, 1973). These transient elastic
waves often have frequencies between 100 kHz and 1 MHz. A
few years ago Anderson and Grew (1977) surveyed the available
literature and arrived at the conclusion that experiments had
not yet satisfactorily answered the question of whether rocks
undergo slow crack growth without acoustic emission. Since
that time there have been a number of reports that have shown
clearly that not only do rocks show acoustic emission during
stress corrosion but that the characteristics of these
emissions can be related to the mechanisms of crack growth
and hence to parameters such as stress intensity factor,
crack velocity and the 'humidity 1 at the crack tip. Acoustic
emission, therefore, is an excellent means of remotely
monitoring the characteristics of stress corrosion crack
growth in rocks.
In an early study, Scholz (1972) showed that the rate
32
of microfracturing, estimated from the rate of acoustic
emission, of single crystals of quartz is proportional to
crack velocity. Byerlee and Peselnick (1970) , however,
were unable to detect with their instruments acoustic
emission from slow crack growth in glass.
Atkinson and Rawlings (1979a, b; 1981) have made an
extensive study of acoustic emission during stress corrosion
in double torsion plates of Westerley granite and Black
Qabbro. Acoustic emissions were observed in the range of
frequencies from 1OO kHz to greater than 1 MHz. A spectral
peak occurred in the region of 2OO kHz and so further monitoring
of emissions was restricted to the bandwidth 1OO kHz - 35O kHz.
In both granite and gabbro significant acoustic emission
accompanies crack propagation at even the slowest crack-9 -1
velocities observed (10 m.s ). The acoustic emission rate
was directly proportional to the crack velocity and could be
used as an indirect measure of this parameter. For example,
see Figure 7. In addition, amplitude distributions, measured
by the parameter b, show distinctive shifts with increase in
stress (see Figure 8). The amplitude distribution parameter,
b, is given by
n(V) -
where n(V) is the fraction of the emission population
whose peak amplitude exceeds amplitude V and V is the lowest
detectable amplitude. Furthermore, both the acoustic emission
33
rate and the amplitude distribution are sensitive to the
details of the mechanism of crack propagation which is
controlled by stress intensity factor and crack tip
1 humidity.'
An especially interesting feature of Figure 8 is that
the trends in the amplitude distributions do not seem sensi
tive to rock type.
Swanson (1980) has used acoustic emission location
techniques to pin-point the source of emissions in double
torsion tests on Westerley granite. He found that subsidiary
microcracking ahead of the main fracture occurred at crack
velocities greater than 1O m.s , but not at lower velocities
Both macrocrack and microcrack extension was probably con
trolled by stress corrosion. The results of Atkinson and
Rawlings (1981) can be interpreted to show that the majority
of acoustic emission from crack growth in double torsion
plates of Westerley granite and Black gabbro over the range
-4 -9 -1 of velocities 1O to 1O m.s occurs by extention of the
macrocrack.
Sano and Ogino (1980) have also noted that acoustic
emission rate in rock shows a close relation with the growth
rate of cracks in double torsion plates. They studied the
behaviour of Murata basalt and Oshima granite. In these
studies a tendency was observed for the dominant frequency
(in the range 1OO kHz to 1MHz) to decrease with increase in
34
crack velocity. In contrast to this, acoustic emission
studies during uniaxial compressive experiments on Ralston
intrusive (basalt), Westerley granite and pyrophyllite
showed an enhancement of high frequency spectral components
in events prior to failure, i.e. as stress or crack velocity
increases (Granryd et al., 1980).
An important aspect of the results of these laboratory
acoustic emission studies lies in their potential application
as a means of monitoring stress corrosion in the earth.
Acoustic emissions with frequencies in the range O.5 to 5 kHz
have been detected with deeply buried geophones in seismic-
ally active areas (Teng a,nd Henyey, 1981) . See also Weeks
et al. (1978). Propagating fractures in petroleum reservoir
rocks have also been monitored with arrays of acoustic emission
transducers (Shuck and Keech, 1977). Because these emissions
occur on a time - scale measured in seconds or minutes, rather
than the much longer time scale associated with low frequency
seismic events, a large enough number of events can be recorded
in a reasonable time so as to establish statistically
meaningful changes in amplitude and frequency distributions
and seismicity rates.
SOME GEOPHYSICAL APPLICATIONS OF SUBCRITICAL CRACK GROWTH DATA.
In this section I will briefly discuss some areas of
geophysics in which I believe subcritical crack growth data
can be important. This list is not exhaustive but has been
chosen in order to show the potential of using the insights
provided by a fracture mechanics description of subcritical
35
crack growth in analysing geophysical phenomena.
Prediction of time- and rate-dependent failure and friction
properties of rocks
In principle, integration of the area under a crack
velocity/stress intensity factor diagram can provide all the
information needed to predict the time- and rate-dependent
fracture strength of rocks. In practice, the problem is made
more difficult by complex stress states and mixed mode crack
growth problems and some simplifying assumptions are necessary,
For the simplest case of pure mode I fracture propagation
the influence of stress rate on fracture stress (a f ) can be
approximated by (Evans and Johnston, 1975)
n- n (15)a f = nn "
where a. is the initial flaw size, a is the stress rate,
Y is a geometrical constant and A,, n, are constants in the
equation v = A,K, "^ describing the region 1 stress corrosion
behaviour of the material. Atkinson (1980) has used this
equation successfully to predict the influence of stress
(strain) rate on the tensile fracture stress of Arkansas
Novaculite in water at 20 C. It was found that at a strain rate-5 -1
faster than ^6 x 10 s stress corrosion does not appreci
ably influence the tensile fracture stress, but at lower strain
rates there is a monotonic reduction in strength from a maximum
36
-2 value of 72MN.m in the absence of stress corrosion effects
to approximately 4OMN.m"" at a strain rate of 10 s.
The time-to-failure (tf ) at a constant tensile stress
(a) is also given by a similar integration of the K -v
diagram (Evans, 1972). It is found that
tf = 2/aVj IC (Kx/v.) dKj (16)
where K . is the stress intensity factor associated with the
initial flaw size.
Henry and Paquet (1976) have used equations based on
(15) and (16) to predict the influence of tensile stress on
time-to-failure and strain rate on tensile fracture stress of
calcite rocks.
Das and Scholz (1980) have developed a simple theoretical
approach to predicting the time-to-failure of an earthquake
rupture subject to stress corrosion. Provided that the static
stress drop is independent of time then time-to-failure is
given by
tf = (X0/V0 ) (2/1^-2) (17)
where X is the earthquake rupture radius and V the rupture
velocity at the threshold stress intensity, and n^ is the
stress corrosion index for region 1 behaviour. Note that
37
here the time-to-failure depends only on the initial
conditions and n, and not on the final conditions as in
the analysis of Evans (1972).
Workers at the Cooperative Institute for Research in
Environmental Science (Mizutani et al., 1977; Soga et al.,
HT1) have developed an equation that is a reasonably good
predictor of the ultimate compressive strength of rocks as
a function of (stress) strain rate, water vapour pressure
and temperature. They assumed that brittle failure in rocks
occurs by the interaction of numerous small cracks that form
parallel to the loading axis under the influence of the applied
stress and the moisture content at crack tips. If the stress
is applied at a slow rate and moisture is abundant at crack
tips then the cracks will grow to be large and coalesce into
a failure plane at low stress. If the stress is applied
rapidly and the moisture content is low then the existing
cracks will not relieve the stress concentrations and many
new small cracks are formed. In the latter case failure
occurs by the coalescence of a larger number of smaller
cracks. Assuming that for a given crack configuration (size,
shape and distribution) the rock will fail at a stress (a )
when the cracks have reached an average critical length and
that the crack growth is governed by an activated mechanism
(stress corrosion by water), then
a = D{ (£na-£n T - n £n p__ - - B) RT + U> (18) u "2
where a = applied stress rate, p H o is the partial pressure
38
of water, n = the order of the chemical reaction in stress
corrosion (-1 in this case), R and T are the gas constant
and the absolute temperature, respectively, U is the acti
vation energy for stress corrosion and D and B are constants
that depend on activation volume, initial crack configuration
and rock type.
The ultimate strengths of basalt, granite and quartz
as a function of strain rate, temperature and water vapour
partial pressure are well described by this equation.
Scholz (1968) and Cruden (1970) have developed theories
of creep in brittle rocks on the basis of stress corrosion
theory. Cruden criticised Scholz's theory on a number of
grounds including the form of the equation used to describe
static fatigue by stress corrosion and the oversimplified
view of the stress distribution in the rock and the assumed
uniformity of physical and chemical properties of elements
of the rock. The importance of Cruden 1 s work is that his
theory could explain the different creep behaviour of Carrara
marble and Penant sandstone in terms of differing stress
corrosion behaviour and crack length distributions.
Anderson and Tiernan (1980) have produced a simple
stress corrosion model of aseismic creep in fault zones which
is envisaged as a slow breaking and reforming of asperities
which are in contact along a fault plane. Thus macroscopic
creep deformation measured at the surface actually consists
of relatively slow rupturing on a microscopic scale.
39
The creep rate measured at the surface (e ) is given r creep
by the time required for cracks to grow a length, 6, through
asperities (6 being a characteristic distance for asperity
disruption) and cause them to transfer their loads to
neighbouring asperities which are on the average, separated
by a distance R. The creep rate is crudely given by
e = v (i.i) (19) creep e £K
where v is the microscopic crack growth velocity, e is the
strain resulting from stress relaxation in the fault zone and
6/R may reasonably be expected to vary between l.O and O.I.
Modelling earthquake rupture
There have been numerous suggestions that stress corrosion
may play an important role in various time-dependent earth
quake phenomena (Scholz, 1972; Martin, 1972; Bonafede et al.,
1976; Atkinson, 1979, 1980; Rice, 1979; Rudnicki, 1980).
Recently, however, Das and Scholz (1980) have taken these
speculations an important stage further and developed a
simple, yet extremely comprehensive theory of shallow earth
quake rupture based upon stress corrosion crack growth of a
two dimensional circular crack. This theory manages to
predict virtually the whole gamut of observed earthquake
phenomena (slow earthquakes, multiple events, delayed multiple
events, postseismic rupture growth and afterslip, foreshocks
and aftershocks). The theory also predicts that there must
40
be a nucleation stage prior to an earthquake and predicts
its form.
Das and Scholz (1980) obtain their results by combining
two simple, but fundamental concepts. Firstly, from fracture
mechanics
K = CATy (20)
and secondly, from stress corrosion theory
- KQ $ \ 'n (21)
where K is the stress intensity factor, AT is the stress*
drop, X is the rupture length and X the rupture velocity,
C is a geometrical factor and K , v / n are material constants
K and n are the stress corrosion limit and stress corrosion
index respectively.
A very important insight that is incorporated into Das
and Scholz's model is that a major fault is not an homogeneous
surface; a point that has been strongly emphasized by geolo
gists. The applied stress, and hence K, and the material
properties K and n will be functions of position on the fault
plane. To avoid the complexities of considering earthquake
rupture as a stochastic growth process Das and Scholz consider
only gross inhomogeneities, termed barriers (after Das and
Aki, 1977b).
For a detailed discussion of this model the reader is
41
referred to the original papers. Only a brief outline is
given here.
Tectonic stress is believed to increase in the earth's
crust at a very slow rate and it is released when an earth
quake occurs. This is equivalent to an increase in K until
K is reached and the earthquake initiates. Stress corrosion
theory, however, suggests a fracture criterion that is in
compatible with this simplistic model. It predicts that
propagation of the earthquake fault begins when K = K and it
quasi-statically accelerates as K approaches K . Thus, onc
this model an earthquake must be preceded by some precursory
slip.
The size of a nucleation zone and the time scale of
the process depend only upon n and K and their spatial
distribution on the fault surface. Das and Scholz (1980)
estimate the time from which the crack starts growing sub-
critically to that when it reaches instability, the nucleation
time (tf ) from equation (17). Estimates of the time-to-
failure, velocity and rupture size immediately (1 second)
before failure for physically reasonable values of X ,
and v and n from Atkinson (1979) leads to the conclusion
that the majority of rupture growth occurs in the last few
hours before an earthquake. This may explain why precursory
slip on earthquake faults is not more commonly observed. An
example of earthquake rupture*growth by stress corrosion is
shown in Figure 9.
Some of the limitations to the Das and Scholz theory are
42
as follows. Firstly, it assumes that stress corrosion
influences crack growth in modes II and III. Although stress
corrosion has only been observed in crack growth in mode I
there is no obvious reason why mode II and III should not
show the same phenomena. Secondly, the simple form of the
K-v curve used by Das and Scholz, which is the basis of
their predictions, can be due to mechanisms other than stress
corrosion, although this would not materially alter their
results. Thirdly, their analysis assumes only one large
crack and their somewhat pessimistic view of earthquake
precursors is based on that. In nature many smaller cracks
might be involved in subcritical growth and the subsequent
strain change might be sufficiently large to be measurable
at the surface. Furthermore, quasi static growth of numerous
smaller ruptures or microscopic grain size level cracks may
lead to the development of other precursory phenomena of
sufficiently large magnitude that they can be observed.
Finally, under conditions where free water is absent and
stress corrosion is presumably impossible earthquake patterns
will not be predictable on the basis of the above model.
This is presumably the case with many deep focus earthquakes
which only rarely are accompanied by aftershocks.
One of the beauties of invoking stress corrosion crack
growth as a necessary precondition for rupture in the earth's
crust is that the difference between so-called 'aseismic'
and seismic fault zones also becomes clear. The difference
43
between seismic and aseismic fault segments is merely a
difference in spatial/temporal variation in material proper
ties and environment along fault zones. Moreover, the
difference between "slow" and "normal" earthquakes, multiple
event earthquakes, delayed multiple event earthquakes and
aftershocks is also largely one of scale.
Stability of hot, dry rock _geo thermal reservoirs
The extraction of thermal energy from hot, initially
dry rocks at depth in the earth's crust involves in theory
the creation of a large quasi-vertical crack in these rocks
by hydrof racturing. To extract the heat from the rock
cold water is circulated within the crack while it is held
open by the water pressure exceeding the local horizontal
stress in the rock. The cold water gains heat from the
large surface area of rock and the heated water is pumped
to the surface where it can be used.
The Los Alamos Scientific Laboratory project for the
development of dry rock geothermal reservoirs in New Mexico
is following a similar scheme to the above. The Cornwall
hot, dry rock project also has the same guiding philosophy.
For a given size of hydrofracture the volume of the
crack will increase linearly with the differential pressure
which is given by
4P = Pfluid - °3 (22)
44
where Pf , ., is the fluid pressure in the hydrofracture,
and a 3 is the horizontal stress in the rock, assuming the
crack to be vertical. The volume of the crack and hence
the flow of water and energy yield are limited by the
maximum fluid pressure which the crack can sustain without
growing appreciably in size during the proposed lifetime of
the geothermal well, (Demarest, 1976). If the proposed
life of the well is measured in tens of years then in this
context an appreciable amount of crack growth would be
hundreds of metres (based upon the Los Alamos experiments).
Thus, in order that the energy yield of the geothermal
reservoir should not be seriously degraded, AP must not
attain a value that leads to crack propagation by stress
-1 -7 -1 corrosion of ca. 10 metres, yr (* 3 x 10 m.s ).
Demarest (1976) notes that the stress intensity factor
governing crack growth in artificial geothermal systems such
as the above is given by
= AP(2/ir)*(a) % (23)
where a is the radius of the circular crack and K_ is the
mode I stress intensity factor. He also points out that
stress corrosion crack growth can occur at stress intensity
factors less than that required to rapidly propagate the
initial hydrofracture and thus degrade the energy yield of
the geothermal well.
A typical reservoir rock is likely to be granite
(e.g. Cornwall, New Mexico). From the data for stress
45
corrosion in Westerley granite (Atkinson and Rawlings, 1981)
we can estimate the value of K_ which will produce a crack
velocity of 10 m.s . This is approximately 1.12 MN.m / 2
for liquid water at 2O°C.
The working down-hole environment of an initially dry
rock geothermal well, such as that at Los Alamos, involves
pressurized water at a temperature of ca. 2OO°C and depths
of 2 - 5 km. One can predict that an increase in temperature
of ca. 2OO C should increase the rate of crack propagation
in granite by approximately one order of magnitude based upon
observations of the temperature dependence of stress corrosion
in quartz (Atkinson, 1979) and novaculite (Atkinson, 1980).
The increased water pressure at these depths may tend to
inhibit stress corrosion and thus this figure is probably
an upper bound. Using these figures a crack velocity of
ild b< T 3 /2
1O m.s would be achieved with a stress intensity factor
of ca. 1 MN.m
Taking K for fast hydrofracturing equal to K leads
to the conclusion that the K... in the geothermal well should
not exceed approximately O.6 of the K to cause hydrofracturing,
If stress corrosion were much more rapid than predicted by
these calculations then it could place a serious constraint
on the extraction of energy from hot, initially dry rocks.
46
Stimulation of oil and gas reservoirs
So called 'tight 1 , i.e. impervious geological formations
bearing oil and gas are often stimulated to increase produc
tion by hydrofracturing. Pressurized water may be pumped
into these artificial fractures in order to force out the
less dense oil and gas. Stress corrosion growth of these
induced fractures could occur in a manner described in the
previous section. If these fractures ran into "loose",
highly permeable strata or zones of high fluid conductivity,
such as faults, then the integrity of the oil or gas
reservoir could be breached and wasteful loss of energy
reserves occur.
Crack-seal mechanism of rock deformation and low stress
dilatancy
Mineralized extension cracks and fissures are common
in rocks that have been tectonically deformed in the upper
3O km of the earth's crust. Such silicate- or carbonate-
filled extension fissures can apparently give rise to quite
large finite strains (Ramsay, 1980). A mechanism whereby
these extension veins are formed by an accretionary process
has been described by Ramsay (1980). This process involves
many cycles of (i) formation of a narrow tensile fracture
as a result of fluid pressure build up to the point where
the tensile strength of the rock is exceeded, and (ii) filling
of the open space by crystalline material deposited from
the fluid phase, perhaps by pressure solution transfer of
47
material from the bulk rock to the low pressure vein.
Ramsay (1980) describes this process as the crack-seal
mechanism of rock deformation.
Extensional mineralized veins are also commonly
associated with some fault zones. Sibson (1980) has
described the fluid pressure build up around normal, reverse
and thrust faults that leads to a form of low stress dilatancy
of the host rock. This process is essentially the same as
Ramsay's crack-seal cycles.
As we have seen in previous sections, if the stress
rate is relatively slow then subcritical crack growth of
hydraulically opened extensional fractures can occur at
stresses substantially below that required to initiate hyd
raulic fracturing if the stress rate is rapid. Caution
should therefore be exercised in using these widespread
geological features to infer stress levels during their
formation. Any such estimates are likely to be upper bounds.
Fracture mechanics of lunar rocks
The available evidence concerning the nonhydrostatic
shape of the moon, the remarkably deep moonquakes and the
existence of mascons strongly suggest that the lunar interior
has both a high strength and a high viscosity (Mizutani et
al., 1977). Furthermore, the lunar lithosphere and surface
are at a high vacuum and so free water is generally absent.
The temperature/depth profile in the moon, however, is
thought to have been extremely high (Anderson and Hanks,

48
1972; Duba et al., 1976). How can one reconcile the
apparently high strength of the lunar lithosphere forQ
periods of the order of 10 years with the inference that
the temperature may have been abnormally high by terrestrial
standards?
Following Martin (1972) and Mizutani et al. (1977)
these observations can be reconciled by noting that all the
available evidence on stress corrosion (see earlier sections)
suggests that the stress required to maintain a given crack
growth rate is higher the lower is the concentration of
liquid water or water vapour. Mizutani et al. (1977) have
shown by experiments that the compressive strength of lunar
rock analogues increases with an increase in the hardness
of the vacuum of the test environment at a rate of approxi
mately 20 MPa per order of magnitude of water vapour pressure,
This has approximately the same effect as raising the strain
rate by one order of magnitude. It was also noted by
Mizutani et al. (1977) that the higher the vacuum the less
was the influence of temperature on strength reduction.
See also the results of Soga et al. (1979) on crack propa
gation studies in analogues of lunar glass under vacuum.
These results confirm the implications of internal friction
studies of lunar and terrestrial rocks under high vacuum
(e.g. Tittmann et al., 1973).
Thus, the apparently high strength of the lunar litho
sphere can be ascribed to the absence of water and hence to
the absence of stress corrosion. Soga et al. (1979) have
49
attempted to illustrate this by constructing a partial
deformation mechanism map for lunar rocks which modifies
an earlier one produced by Verrall and O'Connell (1979) by
incorporating the influence of water vapour pressure on rock
strength.
Magmatic intrusions
Anderson and Grew (1977) have proposed that an important
type of upwards magma transport through the earth's litho-
sphere involves fluid (magma)- filled cracks and that growth
of these cracks due to stress corrosion under the influence
of volatiles can control the movement of the magma. They
also note that the chemistry of the intruding fluid and
volatiles relative to the rock of the crack tip may be a
rate-determining factor. A variety of acids have been found
in natural magmas. At magmatic temperature (>6OO C) and
low pressures, HC1 and HF are weakly dissociated. However,
a cooling fumarolic gas rich in HC1 will become strongly
acidic, e.g. Kilauea steam condensate of 2N HC1 (see Anderson
and Grew, 1977). At shallow crustal depths these corrosive
fluids may exert a profound influence on crack propagation
(see earlier sections).
There are several weaknesses in the so-called 'hot-spot'
theory that accounts for the alignment of volcanic islands,
such as the Hawaiian chain, by invoking the existence of
centres of volcanic activity that are overridden by the
50
lithospheric plates. Anderson and Grew (1977) point to
some of these and suggest that stress corrosion crack propa
gation may be a better explanation. The most obvious ob
jection to the 'hot-spot 1 theory is that direction and the
rate of plate movements deduced from the assumption of fixed
hot spots are inconsistent with plate motions deduced by
other means (Jackson, 1976). This had led to the proposition
that the 'hot-spots' are not fixed but migrate. The simpler
and more elegant proposition of Anderson and Grew (1977)
and others is that a linear volcanic chain is related to the
growth of a slowly propagating crack in the plate. The rate
of propagation of volcanic chains can attain velocities of
from 1-30 cm. yr .(Jackson, 1976; Anguita and Hernan, 1975).
The apparent rate of propagation is controlled by the bending
moment in the plate and only indirectly by the plate velocity.
Thus, as is observed, the direction and rate of plate move
ments can be different to that deduced from the assumption
of fixed hot spots. Moreover, the non linear rates of
propagation in some volcanic chains can be accounted for by
noting that even for a continuous crack volcanoes still will
be rare because magma will only reach the surface along the
crack in those few spots where all the conditions for magma
intrusion to the surface are satisfied. Magmas might rise
repeatedly through older weakened, previously cracked, portions
of the lithosphere or at the advancing portion of the crack
(see Vogt, 1974). Propagating fractures need not be collinear
with plate motions nor proceed at the same velocity as the
plates.
An objection based on fracture mechanics can be raised
51
against this hypothesis of propagating lithosphere fractures
controlling magma transport. The rock at crack tips in
contact with magma or its volatiles is likely to be under
pressure and to be extremely hot (^ 600°C or higher). Under
these conditions the crack tip material is likely to be
highly susceptible to plastic flow. This will blunt the
cracks and inhibit the rate of crack propagation by stress
corrosion. To maintain the same rate of crack propagation
would require that the stress be raised. If it were possible
to so raise the stress then eventually crack growth may
occur more rapidly by a process involving nucleation, growth
and coalescence of microcracks controlled by stress concen
trations arising from heterogeneous plastic flow. For
example, stresses due to dislocation pile-ups at grain
boundaries (see earlier sections). Thus, the environmental
conditions of magma transport might favour mechanisms of
subcritical growth of cracks other than stress corrosion.
Relaxation of Internal Stresses in Rock
It is a relatively common observation that strains as
large as 10 occur in silicate rocks that are removed from
quarries or drill holes or that are disturbed by sawing,
drilling or loading. The spectacular experiments of Price
(1966) provide experimental evidence of stress relaxation
in sedimentary rocks (siltstone) during cyclical loading.
These strains accumulate in periods of a few hours to several
months and have been attributed to the relaxation of internal
52
stresses by some unknown mechanism.
Bruner(1980) has proposed that the most likely mechanism
for this stress relaxation is stress corrosion. He discounts
intragranular creep as a possible mechanism because the mean
internal stresses in exhumed granite and other silicate rocks
are probably two orders of magnitude lower than the strengths
of their constituent minerals at room temperature. Bruner
simulated the cycle of exhuming, unloading and relaxation
for a two-dimensional model of a rock in which grain scale
stresses arise from the thermal and mechanical anistropy of
the polygonal grains. The nucleation of flat cracks at highly
stressed grain boundary junctions and their growth by stress
corrosion across the interior of grains can readily Account
for the observed strain relaxation and its time dependence.
53
CONCLUSIONS
I have outlined some of the complexities of subcritical
tensile failure in materials and presented a large body of
experimental evidence to show that the subcritical growth
of pre-existing cracks in rocks by stress corrosion is a
common phenomena under laboratory conditions. With few
exceptions, however, the range of conditions explored in
the laboratory represents only extremely shallow depths in
the earth's crust. The extent to which stress corrosion
is an important mechanism of rock deformation must still
remain an open question. Nevertheless, a wide range of
geophysical phenomena can plausibly be explained by invoking
stress corrosion crack growth, and some important examples
are given. Under appropriate environmental conditions,
some form of subcritical crack growth other than stress
corrosion may occur which has approximately the same stress
intensity factor/crack velocity relationship. This area has
yet to be explored. Data on the influence of pressure on
stress corrosion are urgently needed.
Unfortunately, the physical interpretation of crack
propagation and static fatigue theories is hampered because
with the sort of data that is readily available an unequivocal
distinction between different theories dannot be reached.
As Wiederhorn (1978) has pointed out, the same set of data is
often used to justify fracture theories that have very different
54
starting assumptions and physical bases.
Two factors cause most of the problems? the stress
dependence of crack growth rate and the activation enthalpy
for crack propagation. Because in a static fatigue test
on rock one order of magnitude change in stress can only be
covered by between 20 and 35 orders of magnitude in time,
a variety of theories will adequately fit the same data.
The activation enthalpies for crack propagation are generally
rather low (ca. 50 - 100 kJ.mole ). Not only are these low
values of activation enthalpy intrinsically hard to measure
(Swanson, 1980), but their determination by an empirical fit
of experimental data depends on the form of the equation
chosen for the fit, and hence on the physical model of crack
propagation adopted. Furthermore, the activation enthalpies
for competing deformation mechanisms are often rather
similar (e.g. for quartz, Atkinson, 1979).
Finally, this article has concentrated to a large
extent on mode I crack propagation. This was inevitable as
no data were available for rock on subcritical crack propa
gation in other modes. It was implicit, however, in much
of the discussion on applications of stress corrosion theory
that this mechanism does occur in modes II and III (shear
modes). Moreover, it was assumed that the form of equations
describing stress corrosion in mode II and III should be the
same as that for mode I crack propagation, even if the values
of parameters in these equations differed. These assumptions
urgently need experimental verification under simulated
crustal conditions.
55
APPENDIX - Construction of fracture mechanism map for quartz.
This diagram was constructed on the assumption that
quartz can deform plastically under high partial pressures
of water in a "hydrolytically" weakened state and that diffusion
of oxygen is the rate controlling step in diffusion-dependent
deformation mechanism. This assumption is based on the im-H
plications of Kroger-Vink diagrams constructed by P. Dennisi
(personal communication, 198O). The values of all unreferenced
constants in constitutive equations presented below also
derive from P. Dennis (personal communication, 198O).
The fracture mechanism map for quartz (Figure 1) is
truncated at its top by the ideal strength which is given
by equation 4. In this equation Young's modulus for quartz
is 97 GPa (Birch, 1966) at 293°K. The temperature dependence
of Young's modulus is taken to be the same as that of the
shear modulus and is given by
ET = E (1 - «T) (A.I)
where E_, and E are respectively Young's modulus at tempera
ture T°K and O°K and « is 2.17 x lo" 4^" 1 (Baeta and Ashbee,
1970).
The upper boundary to the cleavage (brittle intergranular
fracture) fields 2 and 3 is given by the tensile flow stress
corresponding to a strain rate of 1O s~ . At loading rates
56
faster than this dynamic effects become important.
The lower boundary to the field of cleavage 2 is given
by equation 3. In this equation the grain size is
arbitrarily taken to be 100 micrometres. G is taken toc_2
be 24 J.m from the data of Atkinson (1980) on a fine
grained pure quartz rock. The temperature-dependence of
G is estimated from the temperature-dependence of G for
single crystals of quartz (Atkinson and Avdis, 1980).
The boundary between the fields of cleavage 3 and
cleavage 1 and between intergranular creep fracture and
cleavage 1 is given by the stress required for a plastic
strain rate of 10 s .
The boundary between the fields of cleavage 3 and
intergranular creep fracture is the transition stress be
tween conditions where respectively dislocation glide and
dislocation creep are the dominant mechanisms of plastic
flow, i.e. - 10~ of the shear modulus (Weertman, 1968).
Fracture and flow stresses that are taken from results of
compression tests are divided by 8 to get equivalent tensile
stresses (Gandhi and Ashby, 1979).
The melting temperature of quartz is 1470 C (1743 K)
(Kracek and Clark, 1966).
To construct fracture mechanism field boundaries that
depend on rates of plastic flow it was first necessary to
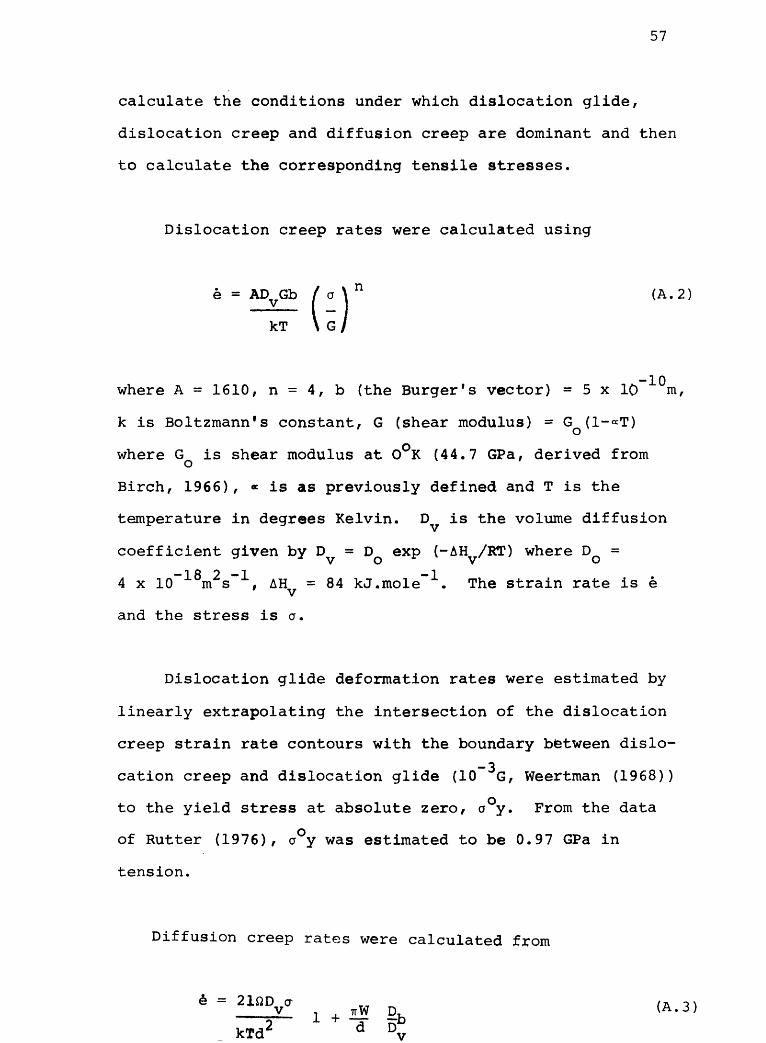
57
calculate the conditions under which dislocation glide,
dislocation creep and diffusion creep are dominant and then
to calculate the corresponding tensile stresses.
Dislocation creep rates were calculated using
e = ADvGb / a \ n (A.2)
kT \ G/
where A = 1610, n = 4, b (the Burger's vector) = 5 x 10 m,
k is Boltzmann's constant, G (shear modulus) = G (1-<*T)
where G is shear modulus at 0°K (44.7 GPa, derived from
Birch, 1966), * is as previously defined and T is the
temperature in degrees Kelvin. D is the volume diffusion
coefficient given by D = D exp (-AH /KT) where D = ift? 1 1
4 x 10 m s , AHv = 84 kJ.mole . The strain rate is e
and the stress is a.
Dislocation glide deformation rates were estimated by
linearly extrapolating the intersection of the dislocation
creep strain rate contours with the boundary between dislo-_3
cation creep and dislocation glide (10 G, Weertman (1968))
to the yield stress at absolute zero, a°y. From the data
of Rutter (1976), a°y was estimated to be 0.97 GPa in
tension.
Diffusion creep rates were calculated from
= 21"Dva , . *w a (A.3)") ~~A~ TV*3
kTd2 d Dv
58
_ c -a . 1where fl is the molar volume = 22 x 10 m .mole , D , e, a,
T, k are as previously defined, d is the grain size, W is
the grain boundary width = 100 nanometres, D, is the grain
boundary diffusion coefficient = D exp ("AH, /RT) where
AH, = 56 kJ.mole"" 1 .D
Acknowledgements
Financial support for much of the work reported here
was provided by the U.S. Geological Survey in the form of
contract numbers 14-08-0001-17662 and 14-08-0001-18325.
This study forms part of the U.S. National Earthquake
Hazards Reduction Programme. Additional funds were provided
by the British Natural Environment Research Council under
grant GR3/3716.
The assistance of Paul Dennis and Philip Meredith in
the preparation of this paper is gratefully acknowledged.
Some of the experimental work described here was undertaken
with facilities provided by Paul Ewing and Rees Rawlings of
Imperial College. Michael Ashby of Cambridge University
has continued to influence strongly my view of the mechanics
of materials. I wlfch to thank him for the! provision of numerous
reprints of his wprk.
REFERENCES
Anderson, D.L. and Hanks, T.C. 1972. Is the moon hot or
cold? Science 178, 1245-1249.
Anderson, O.L. and Grew, P.C. 1977. Stress corrosion theory
of crack propagation with application to geophysics. Rev.
Geophysics. Space Physics 15, 77-104.
Anderson, O.L. and Tiernan, M.F. 1980. Stress corrosion
cracking in premonitory earthquake events. Final Technical
report to managers of U.S. National Earthquake Hazards
Reduction Program, Contract No.: 14-08-0001-16798.
Anguita, F. and Hernan, F. 1975. A propagating fracture
model versus a hot spot origin for the Canary Islands. Earth
Planet Sci. Lett. 27, 11-19.
Ashby, M.F., Gandhi, C. and Taplin, D.M.R. 1979. Fracture-
mechanism maps and their construction for F.C.C. metals
and alloys. Acta Metallurgica 27, 699-729.
Atkinson, B.K. 1979. A fracture mechanics study of sub-
critical tensile cracking of quartz in wet environments.
Pure Applied Geophysics 117, 1011-1024.
Atkinson, B.K. 1980. Stress corrosion and the rate-dependent
tensile failure of a fine-grained quartz rock. Tectonophysics
65, 281-290.
R2
Atkinson, B.K. 1981. Review of experimental methods in
fracture mechanics (in preparation)
Atkinson, B.K. and Avdis, V. 1980. Fracture mechanics
parameters for some rock-forming minerals determined using
an indentation technique. Int. J. Rock Mech. Min. Sci. and
Geomech. Abstr. (in press).
Atkinson, B.K. and Meredith, P.G. 1981. Stress corrosion
cracking of quartz: A note on the influence of chemical
environment. Tectonophysics (in review)
Atkinson, B.K. and Rawlings, R.D. 1979a. Acoustic emission
characteristics of subcritical and fast tensile cracking in
rock. Proc. Institute of Acoustics (London). (in press).
Atkinson, B.K. and Rawlings, R.D. 1979b. Acoustic emission
during subcritical and fast tensile cracking of Westerley
granite and a gabbro. EOS, Transactions American Geophysical
Union 60, 740.
Atkinson, B.K. and Rawlings, R.D. 1981. Acoustic emission
during stress corrosion cracking in rocks. In; Earthquake
Prediction, Third Maurice Ewing Symposium, New York, 1980
(in press).
Atkinson, B.K., Price, N.J., Dennis, S.M., Meredith, P.G.
and Holloway, R.F. 1980. Mechanisms of fracture and
friction of crustal rock in simulated geologic environments.
Semi-annual technical report to managers of U.S. National
R3
Earthquake Hazards Reduction Program, Contract No.:
14-08-0001-18325.
Baeta, R.D. and Ashbee, K.H.G'. 1970. Mechanical deformation
of quartz. 2. Stress relaxation and thermal activation para
meters. Phil. Mag. 22, 624-635.
Birch, F. 1966. Elastic constants and compressibility.i
In: Handbook of Physical Constants (ed. S.P. Clark, Jr.)
Mem. Geol. Soc. Am. 97, 97-173.
Bonafede, M., Fazio, D., Mulargia, F. and Boschi, E. 1976.
Stress corrosion theory of crack propagation applied to the
earthquake mechanism. A possible basis to explain the
occurrence of two or more large seismic shocks in a geologi
cally short time interval. Bolletino di Geofisica, teorica
ed applicata, XIX, 377-403.
Brown, S.D. 1979. Multibarrier kinetics of brittle fracture:
I. Stress dependence of the subcritical crack velocity. J.Am.
Ceramic Soc. 62, 515-524.
Bruner, W.M. 1979. Unpublished Ph.D. thesis, University
of California, Los Angeles.
Bruner, W.M. 1980. Relaxation of internal stresses in rocks
by time-dependent crack growth. EOS, Transactions American
Geophysical Union, 61, 372.
R4
Byerlee, J.D. and Peselnick, L. 1970. Elastic shocks and
earthquakes. Naturwissenschaften, 57, 82-85.
Charles, R.J. 1958. Dynamic fatigue of glass. J.Applied
Phys. 29, 1657-1662.
Charles, R.J. and Hillig, W.B. 1962. Kinetics of glass
failure of stress corrosion. In: Symposium eur la Resistance
Mecanigue du Verre et les Moyens de I'Ameliorer. Union
Scientifique Continentale du Verre, Charleroi, Belgium, 511-27
Cruden, D.M. 1970. A theory of brittle creep in rock under
uniaxial compression. J. Geophys. Res. 75, 3431-3442.
Das, S. and Aki, K. 1977. Fault plane with barriers: A
versatile earthquake model. J. Geophys. Res. 82, 5658-5670
Das, S. and Scholz, C.H. 1980. Theory of time-dependent
rupture in the earth. J.Geophys.Res, (in press).
Dehart, R.C. and Liebowitz, H. 1968. The influence of
ambient pressure on the stress corrosion susceptibility
of metals. Eng. Fract. Mech. 1, 129-135.
Demarest, H.H. Jr. 1976. Application of stress corrosion
to geothermal reservoirs. Informal Report LA-6148-ms, Los
Alamos Scientific Laboratory, 4pp.
R5
Duba, A., Heard, H.C. and Schock, R.N. 1976. Electrical
conductivity of orthopyroxene to 1400°C and the resulting
selenotheny. Proc.Lunar.Sci.Conf. 7th/ 3173-3181.
Dunning, J.D., Lewis, W.L. and Dunn, D.E. 1980. Chemo-
mechanical weakening of synthetic quartz and sandstone in
the presence of surfactants. J.Geophys.Res. (in press).
Evans, A.G. 1972. A method for evaluating the time-dependent
failure characteristics of brittle materials - and its
application to polycrystalline alumina. J.Mater.Sci. 7,
1137-1146.
Evans, A.G. and Graham, L.J. 1975. A model for crack propa
gation in polycrystalline ceramics. Acta Metallurgica, 23,
1303-1312.
Evans, A.G. and Johnson, H. 1975. The fracture stress and
its dependence on slow crack growth. J.Mater.Sci. 10,
214-222.
Evans, A.G. and Linzer, M. 1973. Failure prediction in
structural ceramics using acoustic emission. J.Amer.Ceram.Soc.
56, 575-581.
Fuller, E.R., Jr. and Thompson, R. 1980. Theory of chemically
assisted fracture. Part 2. Atomic models of crack growth.
J.Mat.Sci. 15, 1027-1034.

R6
Gandhi, C. and Ashby, M.F. 1979. Fracture mechanism maps
for materials which cleave: F.C.C., B.C.C. and H.C.P. metals
and ceramics. Acta Metallurgica 27, 1565-1602.
Gerberich, W.W. 1974. On the pressure dependence of threshold
stress intensity. Eng.Fract.Mech. 6, 405-407.
Granryd, L.A., Sondergeld, C.H. and Estey, L.H. 1980.
Precursory changes in acoustic emissions prior to the uni-
axial failure of rock. EOS, Transactions American Geophysical
Union, 61, 372.
Henry, J.P. 1978. Mecanique lineaire de la rupture appliquee
a I 1 etude de la fissuration et de la fracture de roches
calcaires. Unpublished Ph.D. thesis, Universite des Sciences
et Techniques de Lille, 182 pp.
Henry, J.P. and Paquet, J. 1976. Mecanique de la rupture
de roches calcitiques. Bull.Soc.geol.France. XVIII, 1573-82.
Irwin, G.R. 1953. Fracture. In: Handbuch der Physik,
vol. 6 (ed. by S. Flugge) Springer, Berlin, 551-590.
Jackson, E.D. 1976. Linear volcanic chains on the Pacific
plate. In: The Geophysics of the Pacific Ocean Basin and
its Margin, Geophys. Monogr. Sef., vol. 19. (ed. by
G.P. Woolard, G.H. Button, M.H. Manghnani and R. Moberly)
American Geophysical Union, Washington, D.C. 319-335.
R7
Kracek, F.C. and Clark, S.P., Jr., 1966. Melting and trans
formation points in oxide and silicate systems at low
pressure. In: Handbook of Physical Constants (ed. S.P.
Clark, Jr.) Mem. Geol.Soc.Am. 97, 301-322.
Kranz, R.L. 1980. The effects of confining pressure and
stress difference on static fatigue of granite. J.Geophys.
Res. 85, 1854-1866.
Krausz, A.S. 1978. The deformation and fracture kinetics
of stress corrosion cracking. Int.J.Fracture 14, 5-15.
Lawn, B.R. 1975. An atomistic model of kinetic crack growth
in brittle solids. J.Mat.Sci. 10, 469-480.
Lawn, B.R. and Wilshaw, T.R. 1975. Fracture of Brittle Solids
Cambridge Univ. Press, Cambridge, 204 pp.
Marsh, D.M. 1964. Plastic flow in glass. Proc.RoyalSoc.Lond.
A279, 420-435.
Martin, R.J. Ill, 1972. Time-dependent crack growth in
quartz and its application to the creep of rocks. J.Geophys.
Res. 77, 1406-1419.
Martin, R.J. Ill and Durham, W.B. 1975. Mechanisms of crack
growth in quartz. J.Geophys. Res. 80, 4837-4844.
Meredith, P.G. and Atkinson/ B.K. 1981. Acoustic response
and stress corrosion of Whin Sill dolerite (in preparation).

R8
Mizutani, H., Spetzler, H., Getting, I., Martin, R.J. Ill
and Soga, N. 1977. The effect of outgassing upon the
closure of cracks and the strength of lunar analogues.
Proc.Lunar Sci.Conf. 8th, 1235-1248.
Norton, M.G. and Atkinson, B.K. 1981, Stress-dependent
morphological features on fracture surfaces of quartz and
glass. Tectonophysics (in press).
Peck, L. 1980. Stress corrosion cracking of quartzite.
EOS, Transactions American Geophysical Union, 61, 361.
Price, N.J. 1966. Fault and joint development in brittle
and semi-brittle rock. Pergamon, Oxford, 176 pp.
Ramsay, J.G. 1980. The crack-seal mechanism of rock
deformation. Nature 284, 135-139.
Rice, J.R. 1979. Theory of precursory processes in the
inception of earthquake rupture. Gerlands. Beitr. Geophysik,
Leipzig 88, 91-127.
Rudnicki, J.W. 1980. Fracture mechanics applied to the
earth's crust. Annual Rev. Earth Planet Sci. (ed. F.A. Donath),
Annual Reviews Inc. vol. 8, 489-525.
Rutter, E.H. 1976. The kinetics of rock deformation by
pressure solution. Phil.Trans.Roy.Soc.Lond. A283, 203-219.
77
R9
Sano, 0. and Ogino, S. 1980. Acoustic emission during slow
crack growth. Tech.Kept.Yamaguchi Univ. 2 (in press).
Schmidt, R.A. 19^-fc. Fracture mechanics of oil shale -
unconfined fracture toughness, stress corrosion cracking and
tension test results. Proc. 18th U.S. Symposium Rock
Mechanics, Keystone, Colorado, 2A2-1-2A2-6.
Scholz, C.H. 1972. Static fatigue of quartz. J.Geophys.Res.
77, 2104-2114.
Scholz, C.H. 1968. Mechanism of creep in brittle rock.
J.Geophys.Res. 73, 3295-3302.
Shuck, L.Z. and Keach, T.W. 1977. Monitoring acoustic
emission from propagating fractures in petroleum reservoir
rocks. In: Proc. First Conference on Acoustic emission/
Microseismic activity in Geological Structures and Materials
(ed. by H.R. Hardy, Jr. and F.W. Leighton) Trans.Tech.
Publications, Clausthal, Germany, 309-338.
Sibson, R.H. 1980. Low stress hydrofracture dilatancy;
controls on its development in thrust, strike-slip and
normal fault terrains. Nature (in review).
Schwartz, M.W. and Mukherjee, A.K. 1974. The migration of
point defects in crack tip stress fields. Mat.Sci.Engineering
13, 175-179.
RIO
Soderberg, R. 1972. On the growth of intercrystalline
wedge-cracks during creep-deformation. J.Mat.Sci. 7,
1373-1378.
Soga, N., Spetzler, H. and Mizutani, H. 197^ - Comparison
of single crack propagation in lunar analogue glass and the
failure strength of rocks. Proc.Lunar Sci. Conf, 10th(in press)
Stevens, R.N. and Dutton, R. 1971. The propagation of
Griffith cracks at high temperatures by mass transport
processes. 'Mat. Sci. Engineering, 8, 220-234.
Swain, M.V., Williams, J.S., Lawn, B.R. and Beek, J.J.H.
1973. A comparative study of the fracture of various silica
modifications using the Hertzian test. J.Mater.Sci. 8,
1153-1164.
Teng, T. and Henyey, T.L. 1981. Acoustic emission as a
possible earthquake precursor. Proc.Third Ewing Symposium
on Earthquake Prediction (in press)AGO, Washington, D.C.
Thomson, R. 1980. Theory of chemically assisted fracture.
Part 1. General reaction rate theory and thermodynamics.
J.Mater.Sci. 15, 1014-1026.
Tittman, B.R., Housley, R.M. and Cirlin, E.H. 1973.
Internal friction of rocks and volatiles on the moon. Proc.
Lunar Sci. Conf. 4th. 2631-2637.
Rll
Verrall, R.A. and O'Connell, R.J. 1979. Creep and fracture
in the moon. Proc. Lunar Sci. Conf. 10th (in press).
Vogt, P.R. 1974. Volcano spacing, fractures, and thickness
of the lithosphere. Earth Planet Sci. Lett.21, 235-252.
Waza, T., Kurita, K. and Mizutani, H. 1980. The effect of
water on the subcritical crack growth in silicate rocks.
Tectonophysics 67, 25-34.
Weeks, J.D., Lockner, D. and Byerlee, J. 1978. Change in
b-values during movement on cut surfaces in granite. Bull.
Seism. Soc. Am. 68, 333-341.
Weertman, J. 1968. Dislocation climb theory of steady-state
creep. Am.Soc.Metals Trans. 61, 681-694.
Wiederhorn, S.M. 1968. Moisture assisted crack growth in
ceramics. Int.J. Fracture Mechanics 4, 171-177.
Wiederhorn, S.M. 1974. Subcritical crack growth in ceramics.
In: Fracture Mechanics of Ceramics, vol.2 (ed. by R.C. Bradt,
D.P.H. Hasselman and F.F. Lange) Plenum Press, N.York, 613-646,
Wiederhorn, S.M. 1978. Mechanisms of subcritical crack growth
in glass. In: Fracture Mechanics of Ceramics, vol. 4 (ed. by
R.C. Bradt, D.P.H. Hasselman, and F.F. Lange) Plenum Press,
N. York, 549-580.
R12
Wiederhorn, S.M. and Bolz, L.H. 1970. Stress corrosion and
static fatigue of glass. J.Am.Ceram.Soc. 53, 543-548.
Wiedmann, G.W. and Holloway, D.G. 1974. Plastic flow -
slow crack propagation and static fatigue in glass. Phys.
Chem. Glasses 15, 68-75.
Wilkins, B.J.S. 1980. Slow crack growth and delayed failure
of granite. Int.J.Rock Mech.Min.Sci. and Geomech.Abstr.
(in press).
Williams, D.P. and Evans, A.G. 1973. A simple method for
studying slow crack growth. J.Testing and Evaluation 1,
264-270.
Williams, J.G. and Marshall, G.P. 1975. Environmental crack
and craze growth phenomena in polymers. Pr oc.Roya1 Soc.Lond.
A342, 55-77.
TABLE 1 Compilation of stress corrosion parameters (n-
stress corrosion index, and activation enthalpy
for crack propagation) in geological materials.
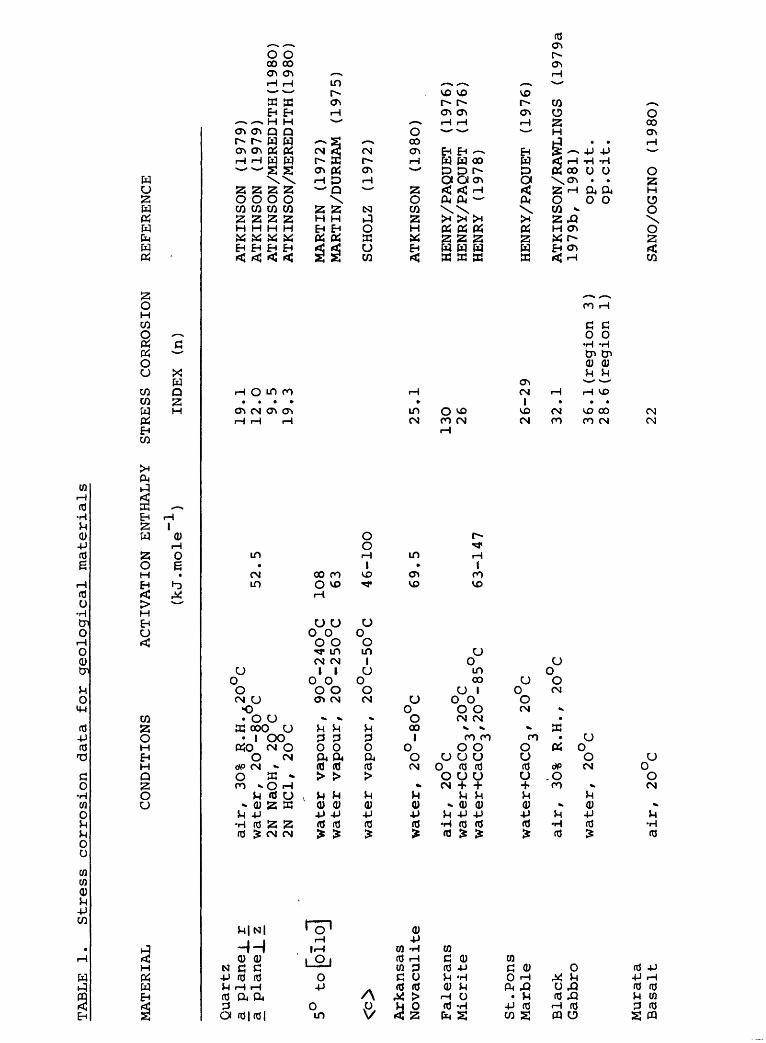
TABLE 1.
Stress corrosion data fo
r geological materials
MA
TE
RIA
LC
ON
DIT
ION
S
5°
to[p
iiq]
Arkansas
Novaculite
Falerans
Micrite
St.Pons
Marble
Black
Gabbro
Murata
Basalt
ACTIVATION ENTHALPY
STRESS CORROSION
INDEX
(n)
REFERENCE
(kJ.
mole
)
Quartz
a plane j_
_ra
plane J_
:z
air, 3O%
R.H.,2OOC
wate
r, 2O-8O C
52.5
2N Na
OH,
2O C
2N HC1, 2O C
19.1
12.0
9.5
19,3
ATKINSON (1979
ATKINSON (1979
ATKINS ON/MERED
ATKINSON/MERED
water vapour, 9O°-24O°C
1O8
water vapour, 2O -25O C
63
water vapour, 2O°C-5O°C
46-10O
water, 2O°-8O°C
air, 2O
°C
water+CaCOv
2O C
water+CaCO^,2O -8
5 C
water+CaCO3
, 20
^C
air, 3O%
R.H.
, 2O
°C
water, 2O
°C
air,
2O
C
69,5
63-147
25,1
130 26 26-29
32.1
36.1
(region 3)
28.6(region 1)
22
MARTIN (1
972)
MARTIN/DURHAM (1
975)
SCHOLZ (1
972)
ATKINSON (198O)
HENRY/PAQUET (1976)
HENRY/PAQUET (1976)
HENRY (1
978)
HENRY/PAQUET (1
976)
ATKINSON/RAWLINGS (1979a
1979b, 1981)
op.c
it.
op.c
it.
SANO/OGINO (198O)
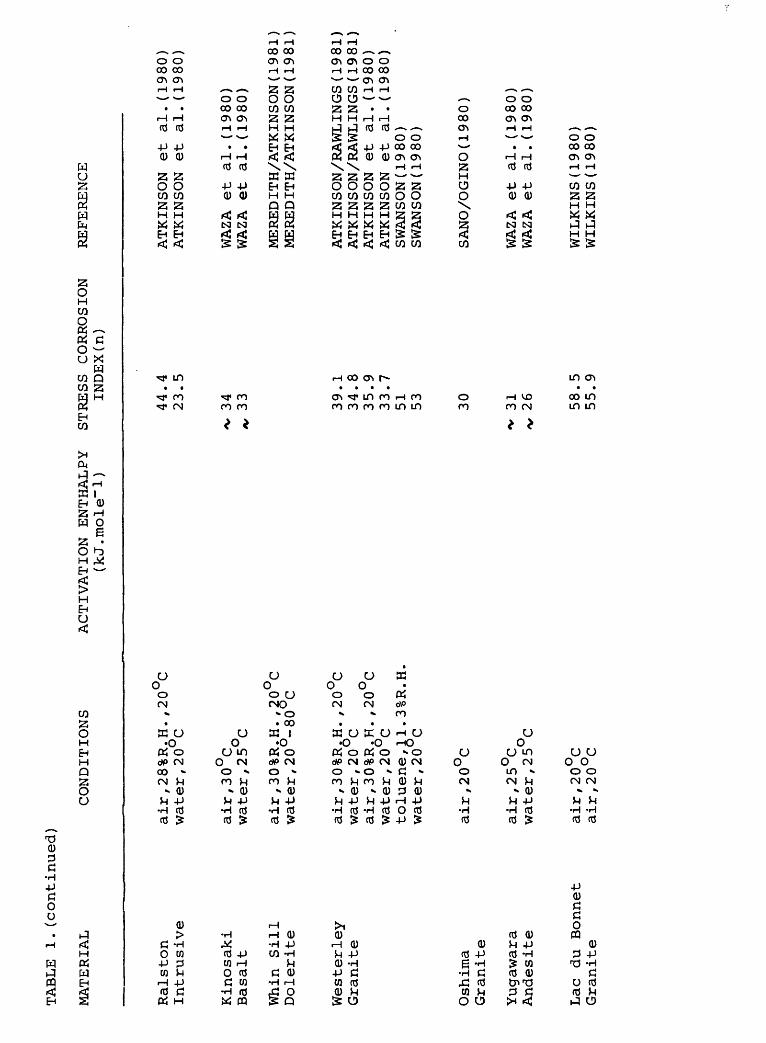
TABLE 1.(continued)
MATERIAL
CONDITIONS
ACTIVATION ENTHALPY
(kJ.mole~l)
STRESS CORROSION
INDEX(n)
REFERENCE
Ralston
Intrusive
Kinosaki
Basalt
Whin Si
ll
Dolerite
Westerley
Granite
Oshima
Granite
Yugawara
Andesite
Lac
du Bonnet
Granite
air,28%R.H. ,20
°C
water, 20°C
air,30°C
water, 2 5 C
air,30%R.H. ,20
°C
water, 20°-80°C
air,30%R.H. ,20
°C
water, 20°C
air,30%R,H. ,20°C
water, 20°C
toluene, 11.
3%R
.H.
water, 20
C
air,20°C
air,25°C
water, 25
C
air,20°C
air,20°C
44.4
23
.5
'v 3
4 *,
33 39.1
34
.8
35.9
33.7
51
53 30
-v 31
/v
26 58.5
55.9
ATKINSON et
al
.(!9
80)
ATKINSON et al
.(19
80)
WAZA et
al. (1980)
WAZA et
al. (1980)
MEREDITH/ATKINSON(1981)
MEREDITH/ATKINSON(198l)
ATKINSON/RAWLINGS (1981)
ATKINSON /RAWLINGS (1981)
ATKINSON et al. (1980)
ATKINSON et al.(l980)
SWANSONU980)
SWANSON(1980)
SANO/OGINO(1980)
WAZA et
al
. (1980)
WAZA et
al. (1
980)
WILKINSU980)
WILKINSU980)
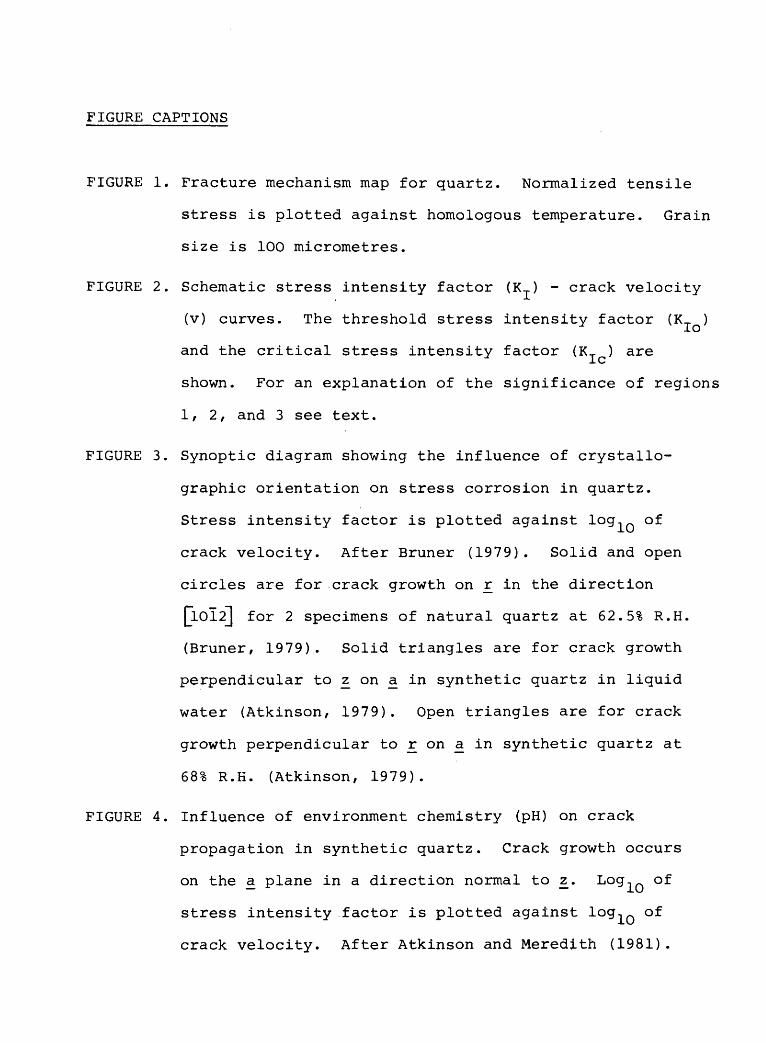
FIGURE CAPTIONS
FIGURE 1. Fracture mechanism map for quartz. Normalized tensile
stress is plotted against homologous temperature. Grain
size is 100 micrometres.
FIGURE 2. Schematic stress intensity factor (KT ) - crack velocity
(v) curves. The threshold stress intensity factor (K )
and the critical stress intensity factor (K ) are-L C*
shown. For an explanation of the significance of regions
1, 2, and 3 see text.
FIGURE 3. Synoptic diagram showing the influence of crystallo-
graphic orientation on stress corrosion in quartz.
Stress intensity factor is plotted against log, of
crack velocity. After Bruner (1979). Solid and open
circles are for crack growth on r in the direction
Q.012] for 2 specimens of natural quartz at 62.5% R.H.
(Bruner, 1979). Solid triangles are for crack growth
perpendicular to z^ on a. in synthetic quartz in liquid
water (Atkinson, 1979). Open triangles are for crack
growth perpendicular to r on a in synthetic quartz at
68% R.K. (Atkinson, 1979).
FIGURE 4. Influence of environment chemistry (pH) on crack
propagation in synthetic quartz. Crack growth occurs
on the a plane in a direction normal to z^. Log, of
stress intensity factor is plotted against log, Q of
crack velocity. After Atkinson and Meredith (1981).
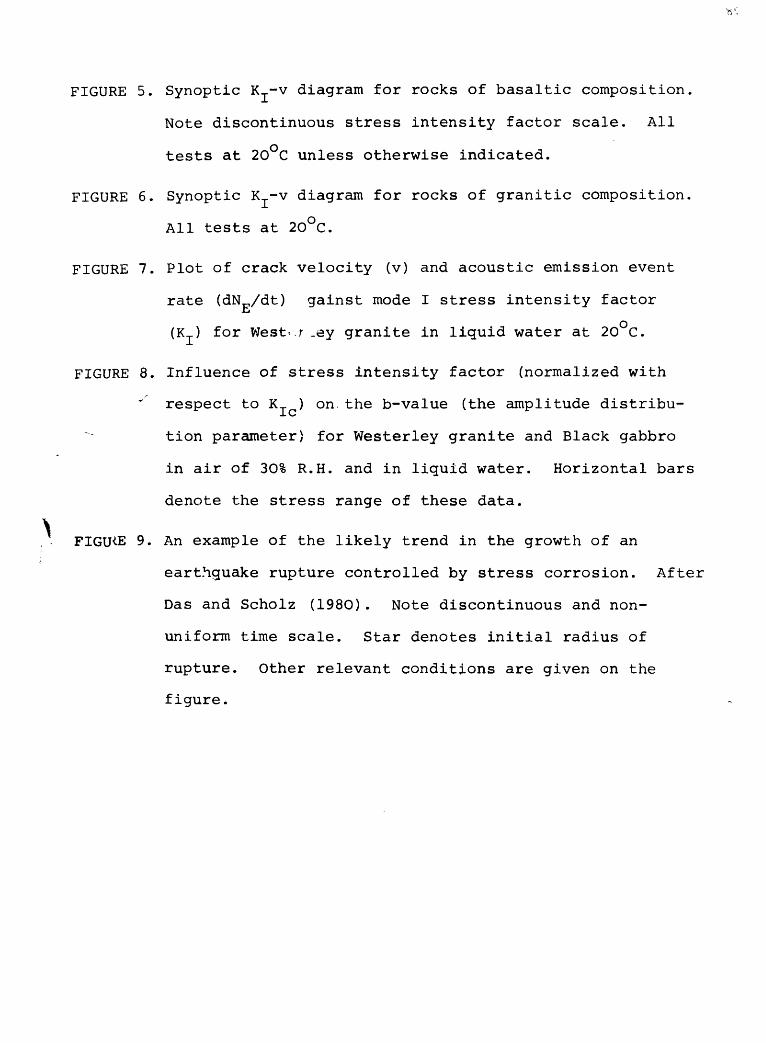
FIGURE 5. Synoptic KT-V diagram for rocks of basaltic composition.
Note discontinuous stress intensity factor scale. All
tests at 20°C unless otherwise indicated.
FIGURE 6. Synoptic K -v diagram for rocks of granitic composition.
All tests at 2O°C.
FIGURE 7. Plot of crack velocity (v) and acoustic emission event
rate (dN^/dt) gainst mode I stress intensity factorJD
(KT ) for West'.r.ey granite in liquid water at 2O C.
FIGURE 8. Influence of stress intensity factor (normalized with
*' respect to K ) on. the b-value (the amplitude distribu
tion parameter) for Westerley granite and Black gabbro
in air of 3O% R.H. and in liquid water. Horizontal bars
denote the stress range of these data.
FIGU<E 9. An example of the likely trend in the growth of an
earthquake rupture controlled by stress corrosion. After
Das and Scholz (198O). Note discontinuous and non-
uniform time scale. Star denotes initial radius of
rupture. Other relevant conditions are given on the
figure.
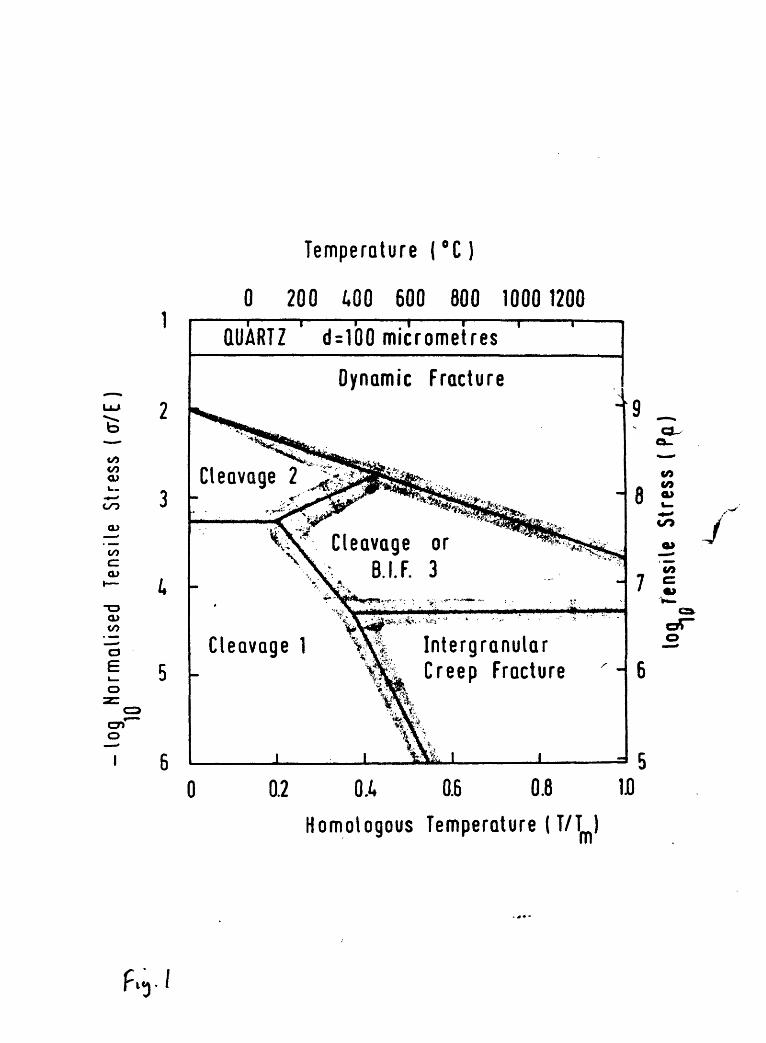
Temperature |°C)
coCOa>u.
a>
ooc
-o a>CO
"a
E
O
I
2
3
1.
6
0 200 400 600 1000 1200
QUARTZ d=100 micrometres
Dynamic Fracture
Cleavage 2
Cleavage 1 Intergranular Creep Fracture
9 _a-
CO CO
8 2CO
CO
7 5"W.
oTo
6
J 50 0.2 0.4 0.6 0.8 ID
Homologous Temperature (T/T )m
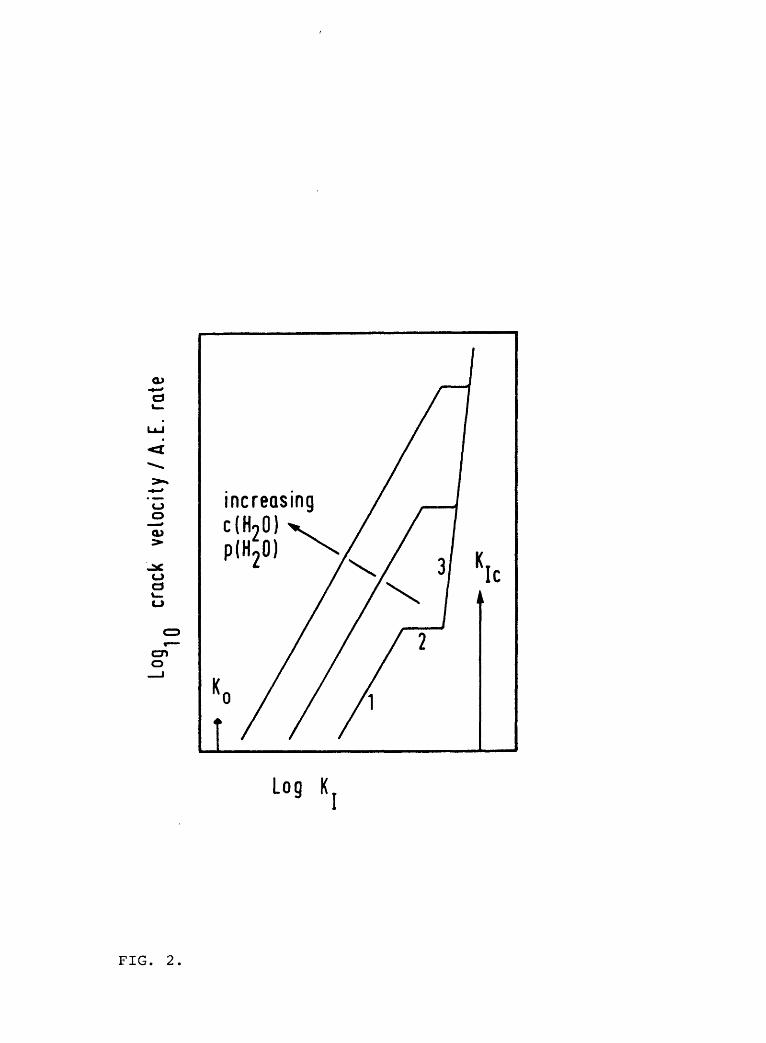
H
O N)
Log
crac
k ve
loci
ty /
A.E
. ra
te
o CO

(MN.rrf372 )
» n
CO
E I. *
* »0o M^
w
>S£
Ocd0
^*"^^dT"o
1
2
3/
£A
5
6
7
8
9
.4 -5 -6 -7 -8 -9 M)1 1 1 1 1 1
" Quartz 4 4.«A A *o
- A A
AA Of A
A ^ ^ ^ ° J
A AA AA A A
" ' ^^ \J
jf^ /^ ^^
/^ / ' o
/ / ° *
A AA 0A O
A A
O
8III 1
-4 -3 ~2 -1
i
,.»
|
0log K (MN-m-3/2)
FIG. 3.
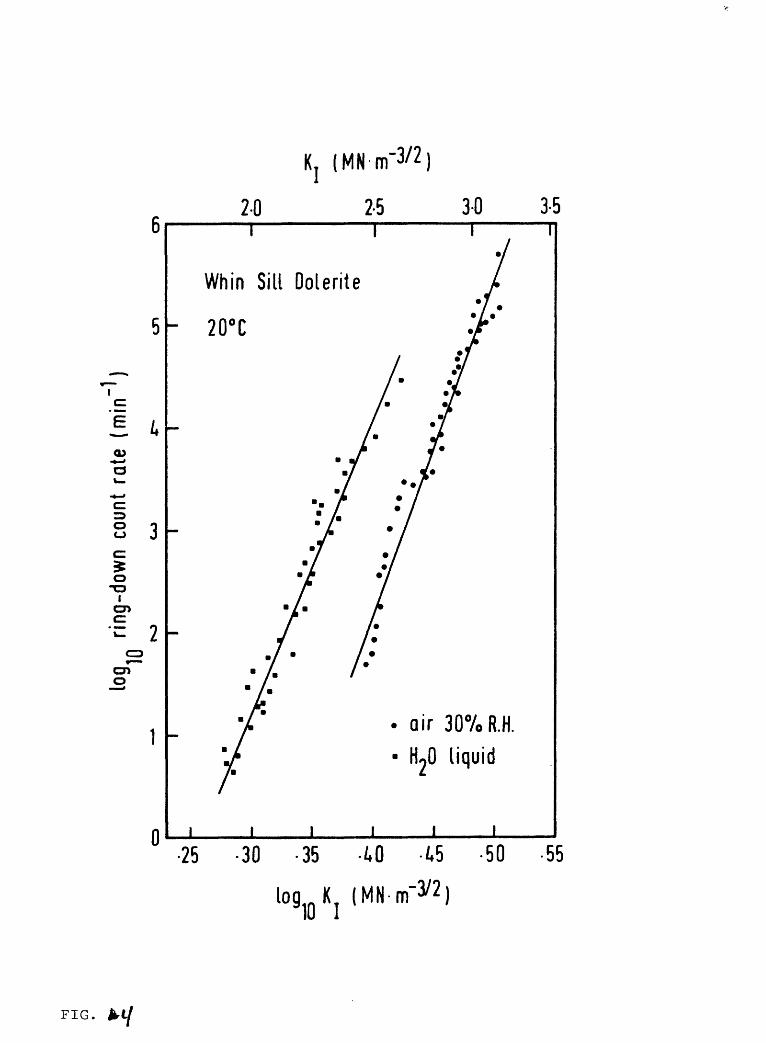
H
O
log
ring-
dow
n co
unt
rate
(m
in~'
)1*
0
o
to
en
CO
CO
en en
en
en
en
en
1*0
CD o
CO
CZ5 O CD CD
CO
CO
CD
CO
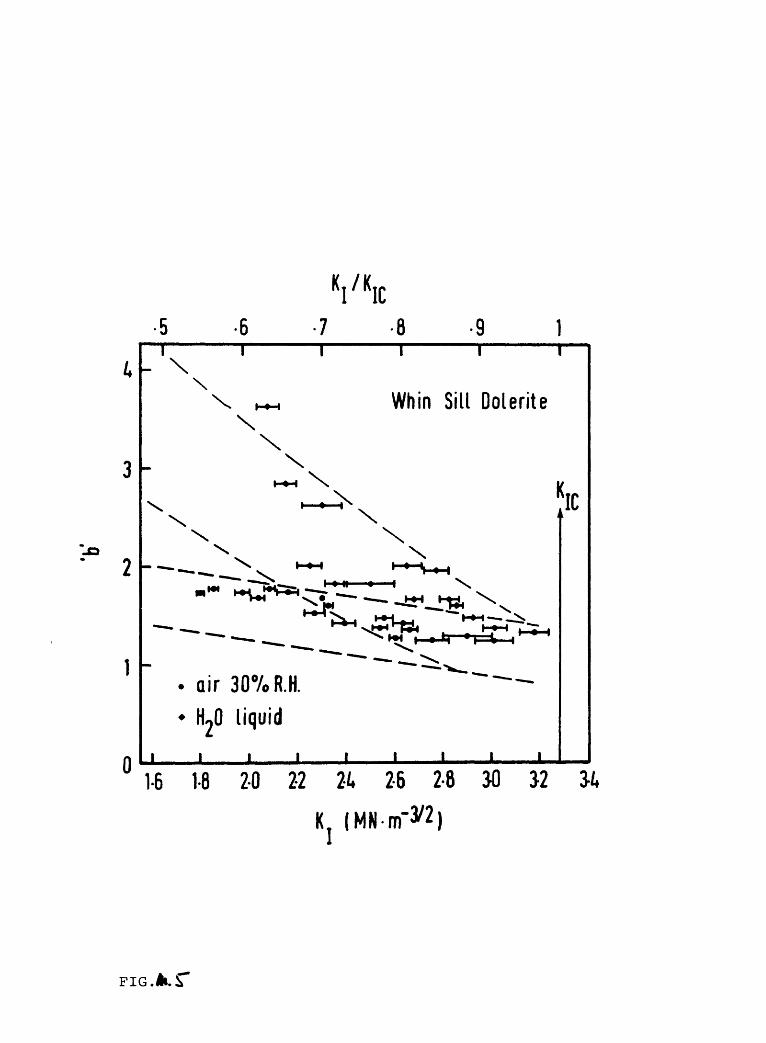
KJ/KIC5 -6 -7 -8 -9
3 ^X. i o
lo' 2
0
i
\ MH Whin Sill Dolerite \ \\
H^H
. ,
I-4HI I \
air 30%R.H.
H20 liquid
i i i i i i1-6 1-8 2-0 22 21. 26 2-8 30 3-2
K (MN-nf3/2 )
FIG.II.S"
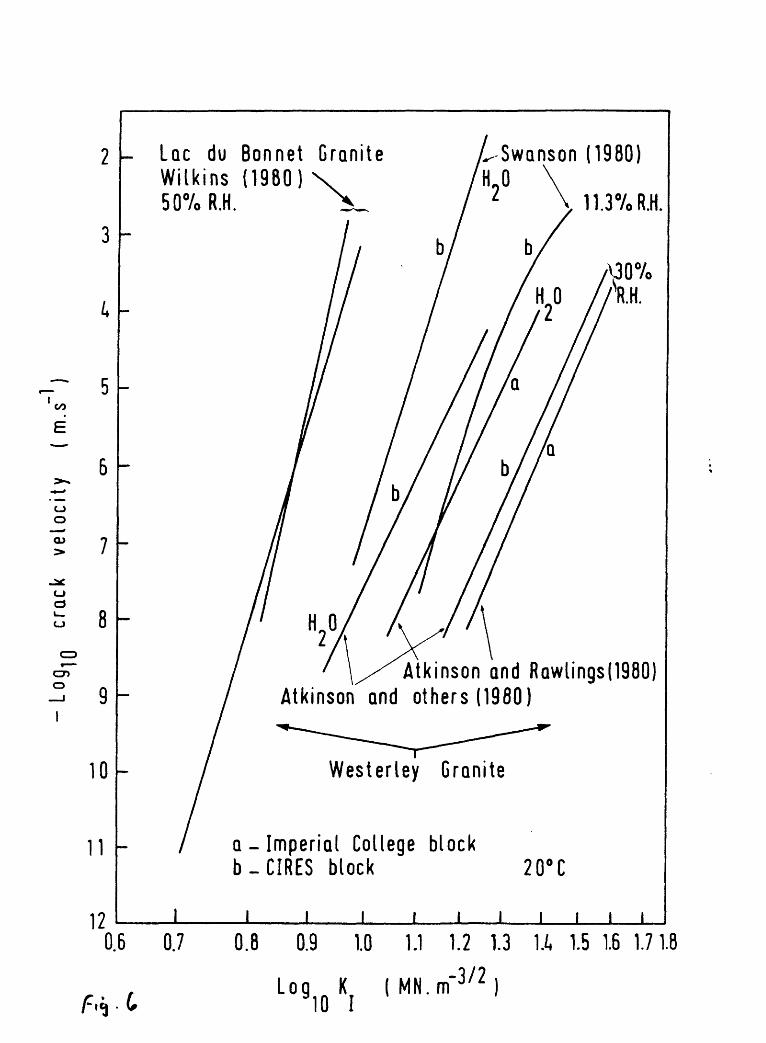
CO
E
o
CD
CJ
CD
O
I
9
10
11 -
12
Loc du Bonnet Granite Wilkins (1980) 50% R.H.
Swanson (I960)
1
\30% SR.H.
Atkinson and Rawlings(1980) Atkinson and others (1960)
Westerley Granite
a - Imperial College block b-CIRES block 20°C
I ____ I
0.6 0.7 0.6 0.9 1.0 1.1 1.2 1.3 U 1.5 1.6 1.71.8
Log K (MN.rrf372 )
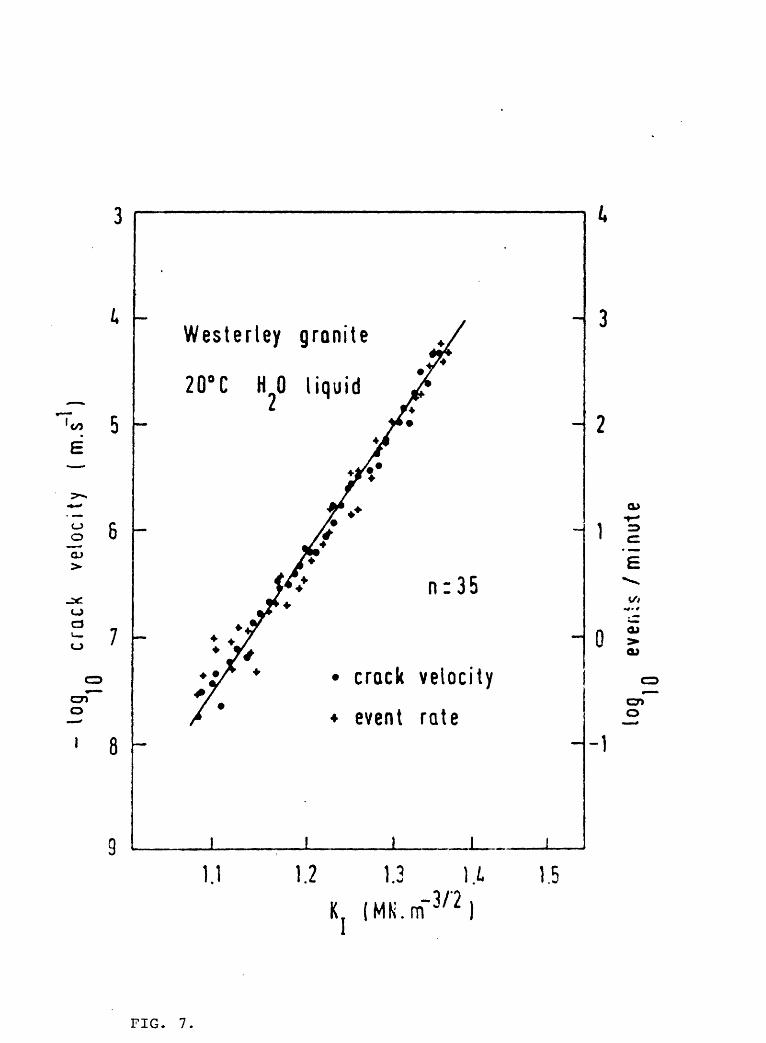
3
' 5E
O
a>6
7 -
C7> O
1 8
Westerley granite
20°C HO liquid
n:35
crack velocity
+ event rate
3
2
O)
0 O)^QJ
C7> O
-1
1.1 1.2 1.3 U 1.5K (MK.m J/i )
FIG. 7.
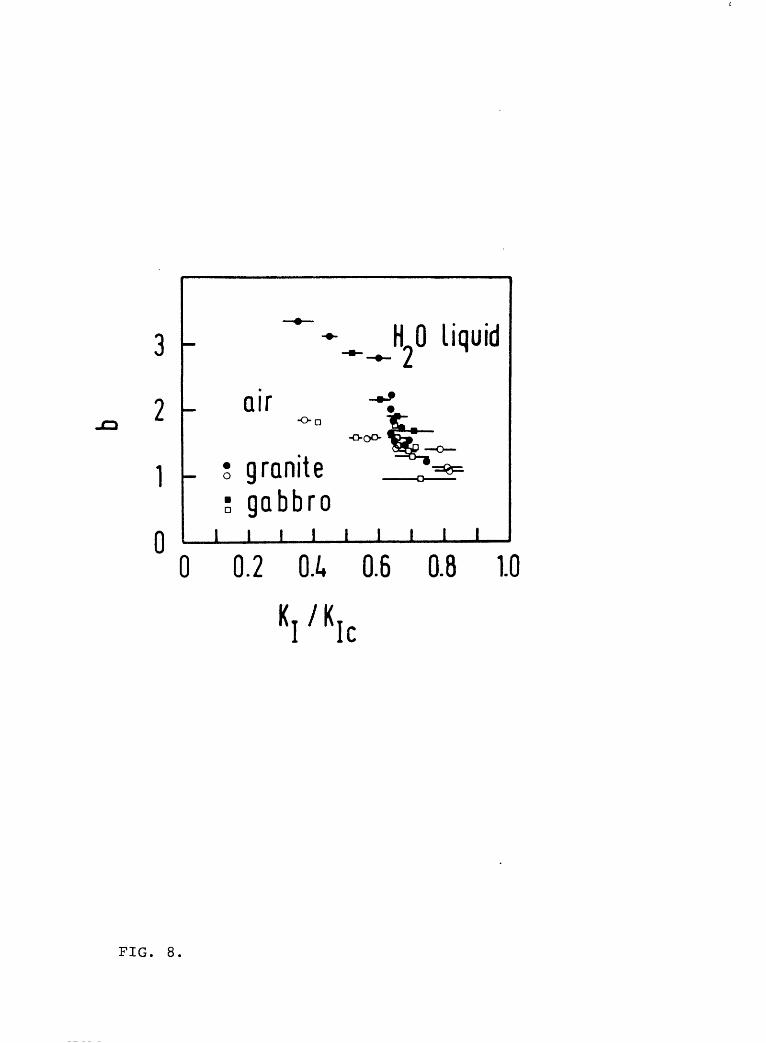
bH 00
CD
CD
r*o
CD
ocz
> en Q
D
CD
I
am
09
CO
r*o
CD
a
(
.i t
H O
15
O)
c:
o10
initi
al
crac
k ra
dius
=
1 km
initi
al
crac
k ve
loci
ty =
0.10
99 e
ras'
1 st
ress
cor
rosio
n in
dex
= 12
.5
^
5o C
O Z3
o o oc
1 00
hour
s
Tim
e
100
sec

3. ACOUSTIC EMISSION AND STRESS CORROSION
OF WHIN SILL DOLERITE.
P.G. Meredith and B.K. Atkinson
Introduction.
Double torsion tests have been run on plates of
Whin Sill dolerite to establish K... , and K -v diagrams for
specimens in air and liquid water. Acoustic response was
monitored during the deformation experiments.
Theoretical considerations
KT values were determined from the expression
KI =
where P is the load, W is the moment arm, v is Poisson'sm
ratio, W is the width, t the thickness and t a reduced thick
ness of the specimen.
Crack velocity was measured from load relaxation curves
using
V = -<J> a fPf (1/P2 ) (dP/dt) (2)
where $ is a constant, a f and Pf are the crack length and load
at the end of a test, P is the load and dP/dt is the rate of
load relaxation.
Activation enthalpies (AH) for crack propagation were
calculated from
AH = RT IT2 (n+1) in
(T -T ) U 2 1 1 ;
where R is the gas constant, n is the stress corrosion index
and T is the temperature.
K -v data were fitted to an equation of the form
V = - K ][n (4)
Acoustic emission data were fitted to equations such as
nF dN£/dt = &K.J. (5)
nR and dN_/dt = yK T (6)
J\ _L
where «, e, y ar^ constants, as are n, n^ and n_.; dN^/dt isEJ K LJ
the rate of events and dN /dt is the rate of ring-down countsi\
Amplitude distributions were described by
n(a) = (a/aQ )~b (7)
where n(a) is the fraction of the emission population whose peak
amplitude exceeds amplitude a and a is the lowest detectable
amplitude. b is the amplitude distribution parameter.
Results
+ " KIC for Whin Sill dolerite was found to be 3.28-0.10 MN.m
The values of n, n^ and n_ as in equations 4, 5 and 6 are givenHi K
below (see Figs. 1, 2 and 3).
Air, 20°C, 30% RH K 90 20°C H90 75°CM 4L*
n 31.2 (0.990) 29.0 (0.992) 28.4 (0.995
31.1 (0.984) 29.1 (0.977)
32.9 (0.981) 29.9 (0.973)
Figures in brackets are correlation coefficients.
Note of close similarity of n_.,, n_, and n, as found forhi K
Westerley granite and Black gabbro in earlier studies.
The activation enthalpy between 20 C and 75 C was found
+ -1 to be 30.4-1.9 kJ.mole using a constant loading rate technique
and 34 to 47.6 kJ.mole using the data of K -v diagrams.
Amplitude distribution b-values shown in Figure 4 show
the same trend as found for granite and gabbro, i.e. the
b-values depend strongly on the "humidity" of the crack tip
environment and K values. The dashed lines in Figure 4 are
the limits of data obtained wet and "dry" for earlier experi
ments on granite and gabbro. Examples of amplitude distribution
nique used to obtain b-value data at high fractions of K .
It is based on capturing emission and ring-down count rate
data on a storage oscilloscope. The slope of Figure 7 is a
measure of the b-parameter.
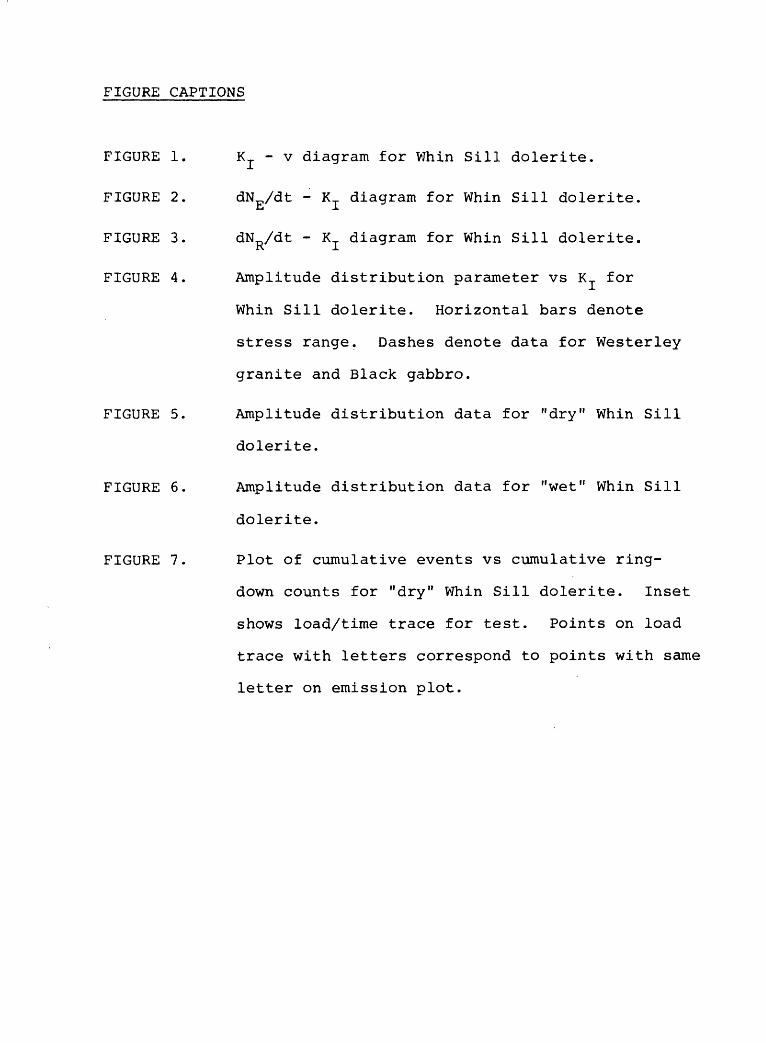
FIGURE CAPTIONS
FIGURE 1
FIGURE 2
FIGURE 3
FIGURE 4
K ... - v diagram for Vlhin Sill dolerite.
FIGURE 5
FIGURE 6
FIGURE 7
dN_/dt - KT diagram for Whin Sill dolerite.El JL
dND/dt - K_ diagram for Whin Sill dolerite.K J.
Amplitude distribution parameter vs KT for
Whin Sill dolerite. Horizontal bars denote
stress range. Dashes denote data for Westerley
granite and Black gabbro.
Amplitude distribution data for "dry" Whin Sill
dolerite.
Amplitude distribution data for "wet" Whin Sill
dolerite.
Plot of cumulative events vs cumulative ring-
down counts for "dry" Whin Sill dolerite. Inset
shows load/time trace for test. Points on load
trace with letters correspond to points with same
letter on emission plot.
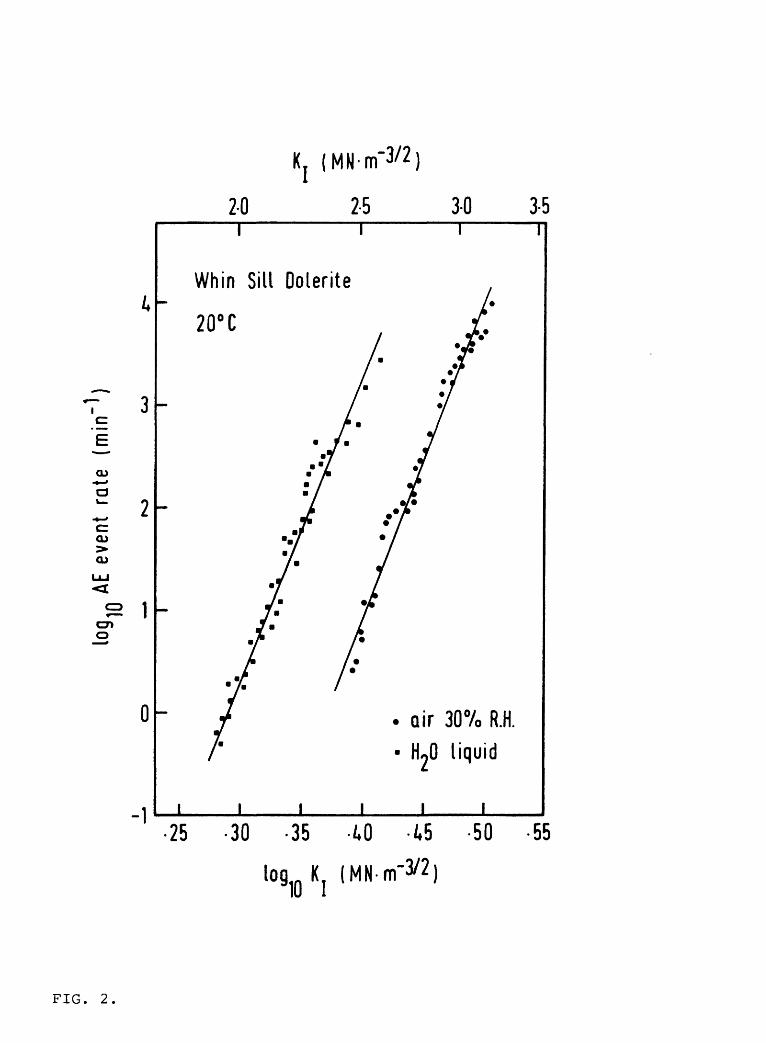
2-0 2-5 3-0 3-5
V 3c=
E^
OD
O)>O)
2
0
Whin Sill Dolente
20° C
-1
air 30% R.H. H0 liquid
25 -30 -35 -tO -45 -50 -55
log K (MN-m'3/2)
FIG. 2.
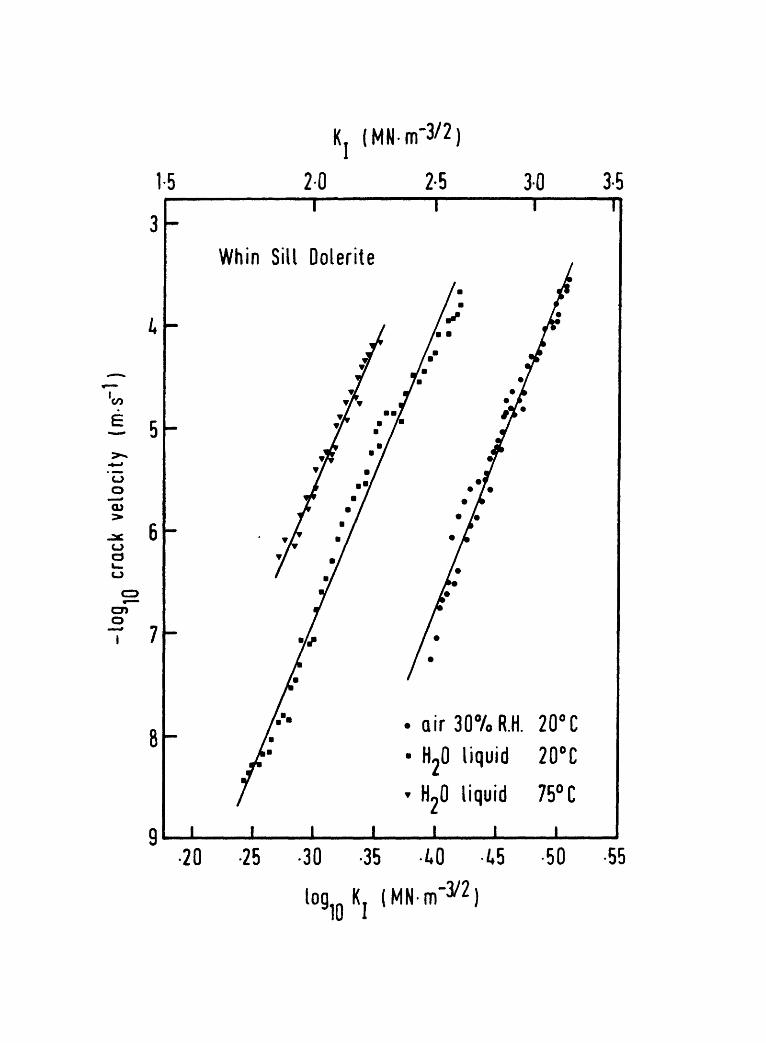
1-5
3
5
o .2O)
6GJ o
CD
en o7 7
8
9
K. (MN-m-3/2)
2-0 2-5 3-0 3-5
Whin Sill Oolerite
air 30%R.H. 20°C H20 liquid 20°C
H20 liquid 75°C
20 -25 -30 -35 -M) -
log Kj IMN-m'3/2 )
50 -55
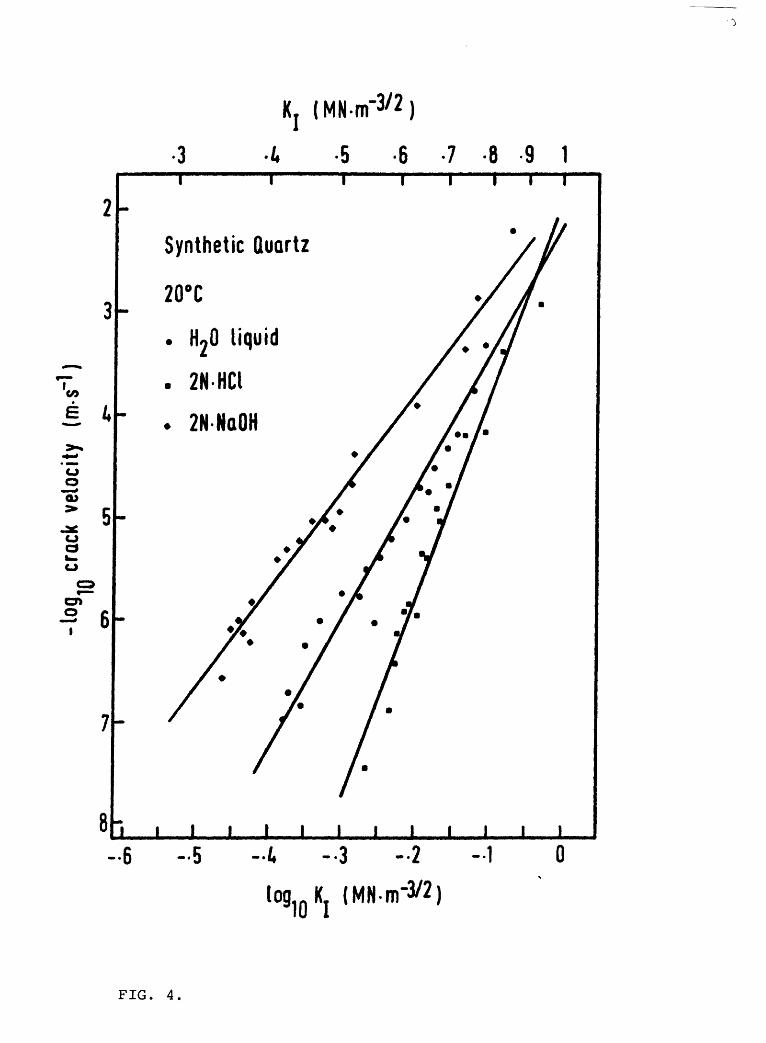
(MN-m'3/2 )
2
3
CO
e 4
OO I fta>
ocsu. o
5
O cT 6
7
3 -5 -6 -7 -8 -9 1
Synthetic Quartz
8". .
T T
i i i i i i i i i i i-6 -5 -d -3 -2 -1
log K (MN-m-3/2)
0
FIG. 4.
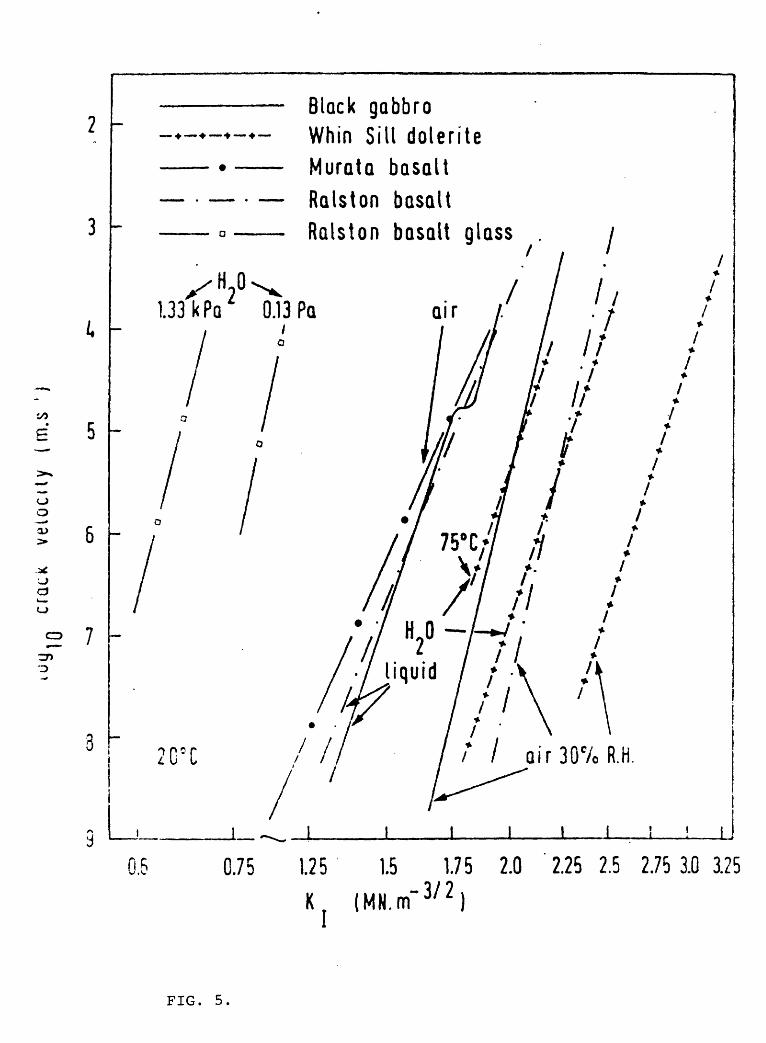
5 -
o
I 6
2 7
Black gabbro +-+-+-+- Whin Sill dolerite Murata basalt
- Ralston basalt o Ralston basalt glass
1.33 kPa 0.13 PQ
0.6 0.75 1.25 1.5 1.75 2.0 '2.25 2.5 2.753.0 3.25
K (MN.rrf 372 )
FIG. 5.
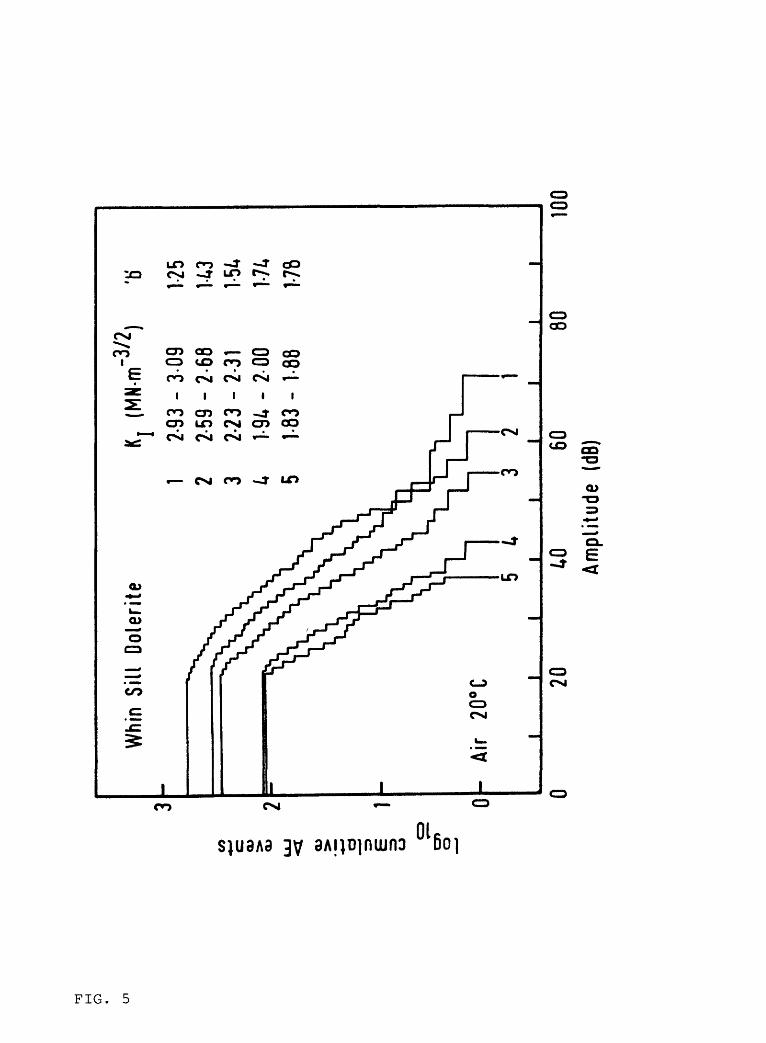
H
O
Whi
n S
ill O
oler
ite3
CO o> r>
o> UJ <I CD E =D
C
O o>
o
2 0-
Air
20°C
5 4
(MN-
m"3
/2)
3 2
'tj 1-25
1-43
1-74
1-78
020
60
Am
plitu
de
(dB)
8010
0
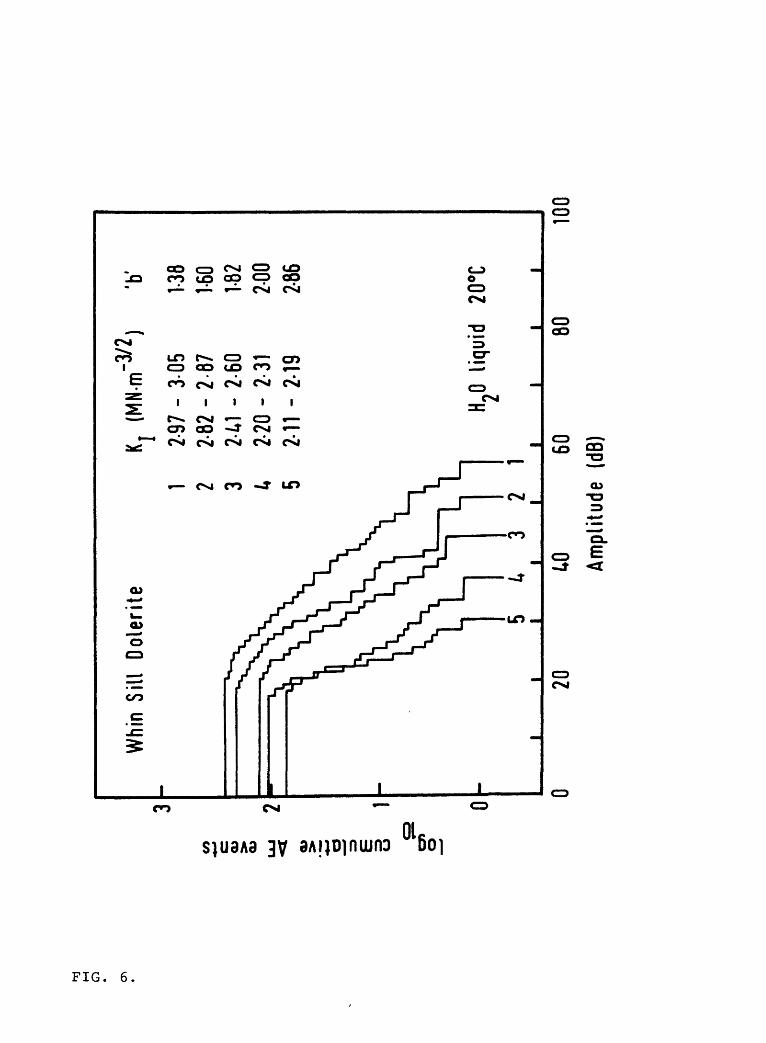
O
Whi
n S
ill
Dol
erite
3
00 c CD
>
CD O)
> ^ » jg =>
E
o
0 o5
d 3
2 1
(MN
-m"^
2)
3-05
2-
87
2-60
2-
31
2-19
'b1
1-38
1-60
1-82
2-00
2-8
6
H20
liqui
d 20
°C
2010
60
Am
plitu
de
(dB)
8010
0
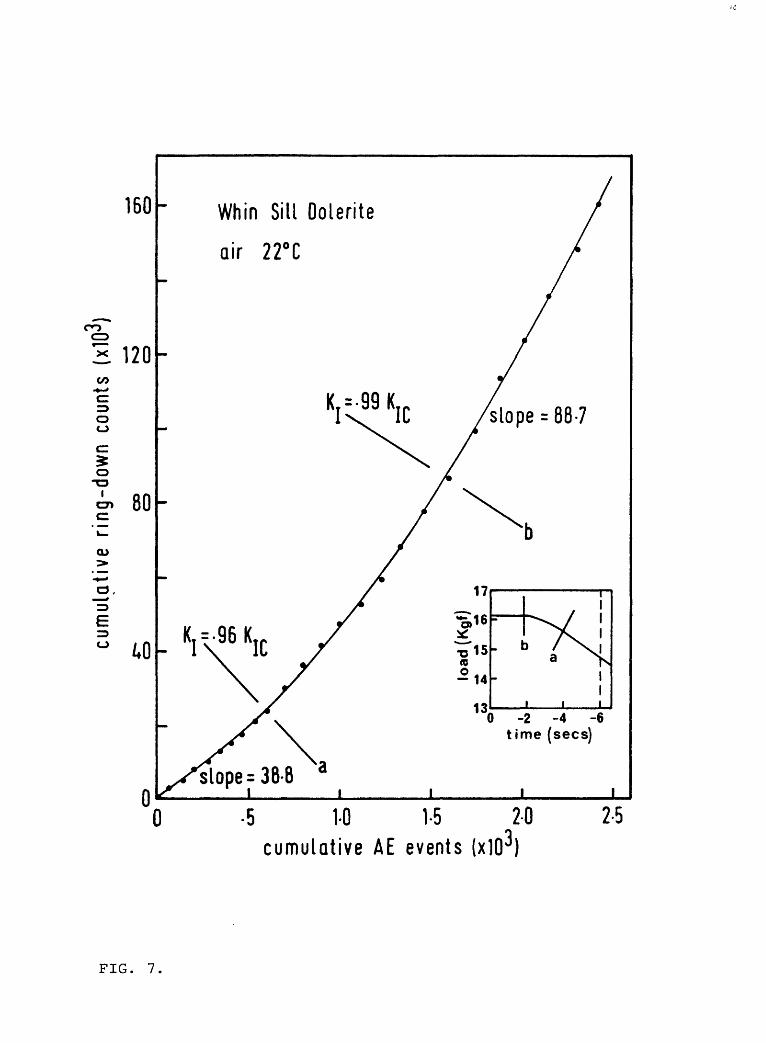
160
CO
120CO
=3 Oo
o
"I 80
e=3 O /.o
0
Whin Sill Oolente
air 22°C
K=-99K
0 -2 -4 -6 time (sees)
= 38-6
0 5 1-0 1-5 2-0qcumulative AE events (x1(r)
2-5
FIG. 7.

4. INFLUENCE OF THERMAL AND STRESS CYCLING ON THE FRACTURE
AND ACOUSTIC RESPONSE OF WESTERLEY GRANITE.
B. K. Atkinson, D. Macdonald and P. G. Meredith
Introduction
A series of thermal cycling and stress cycling experi
ments have been performed on Westerley granite to determine
how such treatment influences fracture mechanics parameters,
such as KT and the KT~V relationship. As a guide to the
growth and development of microcracks the acoustic response
was continuously monitored in all experiments, i.e. event
rates, count rates and amplitude distributions.
Thermal cycling experiments
A 2.5 cm cube of granite was placed in a silver steel
holder into which a stainless steel waveguide was screwed.
The waveguide was screwed down until it exerted a force of
approximately 1 Kg on the specimen. The waveguide/specimen
assembly was placed in a furnace so that the free end of the
wave guide emerged from the furnace. An appropriate trans
ducer was attached by epoxy cement to this free end via a
stainless steel cone.
The specimen was heated slowly (<2.5 C/min) to a pre
determined temperature and then allowed to cool slowly
(<1.5°C/min) to room temperature. This cycle was repeated.
On each subsequent heating cycle the specimen was taken to
a temperature of 100 C higher than on the previous cycle.
A maximum temperature of 500 C was studied so as to avoid
complicating factors due to the «-3 quartz transition.
Additionally, double torsion specimens were given one
cycle of the above heat treatment so that specimens were
available that had been heat-treated to a maximum tempera
ture of 20°C, 100°C, 200°C, 300°C, 400°C and 500°C. These
specimens were then tested for K and to determine K -v
relations. Experiments to determine the latter relations
also involved measurement of the acoustic response.
Before fracture mechanics tests were performed on these
specimens they were stored at 20 C in a dessicator containing
silica gel and evacuated to better than 10" torr.
Stress cycling experiments *
A double torsion specimen was loaded to approximately
/5 of the expected K and then unloaded to near zero load
again. Acoustic response was monitored only on the loading
cycle. This cycle was repeated five times, on each occasion
taking the specimen to a maximum load /5K greater than in the
previous cycle.
Results.
Thin section studies
Thin sections were made of dummy specimens given the same
heat treatment as described in the section on thermal cycling.
A general increase in microcrack density with increase in

maximum temperature of heat treatment was observed. The
differential expansion of neighbouring quartz and feldspar
grains which becomes markedly non linear above 45O°C plays
the dominant role in thermal crack development and widening
during heating.
In specimens heated to 1OO° and 2OO°C the intragranular
thermal cracks develop mainly as cleavage cracks in the
feldspars and as randomly oriented cracks in the quartz grains.
Many of the intragranular cracks do not traverse grains. Grain
boundary cracking, however, is dominant in these specimens.
In the specimens heated to 3OO°C most intragranular cracks do
traverse the grains. In the specimens there is a marked in
crease in the number of microcracks. Although specimens
heated to 4OO C and 5OO C also show an increase in microcrack
density it is not nearly as marked as the increase that occurs
between 20O° and 3OO°C.
Bauer and Johnson (1979) obtained a linear increase in
the microcrack density with increasing temperature up to the
«-B quartz transition of 573°C. This contrasts with our
results (Fig. 1). One explanation of this is the anomalous
lowering of the Hertzian fracture strength of quartz noted by
Swain et al. (1973) in the region 2OO°-3OO°C.
But this does not explain why Bauer and Johnson (1979) did
not observe the effect. An alternative hypothesis, which does
not preclude the existence of the effect noted in Hertzian
studies, is that residual strains locked in the specimen are
released when a sufficient density of microcracks is attained,
which happens to result after heat treatment to 300°C. Such
strains may not have been released in the Bauer and Johnson
experiments or were not present in these specimens.
Acoustic emission during thermal cycling tests
The acoustic response during heating and cooling stages
of each cycle is well illustrated by the data of Figures 2 and
3. These show ring-down counts as a function of temperature.
Note that on heating very little acoustic emission occurs until
the maximum temperature in the previous cycle is reached. At
this point there is a substantial increase in the rate of
emission. This can be viewed as a sort of thermal equivalent
to the Kaiser effect. Note also that heating above 300°C
induces a dramatic increase in the level of acoustic emissions.
The increase in ring-down counts at about the previous cycle's
maximum temperature is thought to reflect the extension and
widening of previously formed microcracks and the formation of
new microcracks. The uniform b-values found for these emissions
argue for a constant source for the emissions.
On cooling there is a rapid drop in ring-down count rate
for a few tens of degrees and then all emission/cooling curves
follow a similar trend. Once more b-values are relatively
constant, except at 500 C. The rapid change in emission rate
is thought to result from grain readjustment and the steady
change to microcrack healing.
KT tests Ic
Two sets of double torsion specimens were used in this
work. Small specimens were 0.23 x 2.9 x 10 cm. Larger
specimens were 0.4 x 6 x 10 cm.
After heat treatment, their K values were determined
and are given in Figure 4. Note the substantial change in
the rate of strength reduction around 200°-300°C, but that
heating to 100°C has little influence on K . The small-3/o
specimens gave a maximum value of KT as 2.37 MN.m ' and-3/o
the larger ones gave a value of 1.69 MN.m ' *. It is not
clear at this time why the discrepancy in the two sets of
data arose.
Crack velocity/stress intensity factor data
K -v curves were obtained by stress relaxation tests on
heat-treated double torsion specimens. Specimens that were
heated to a maximum of 2O°C, 100°C, 300°C and 500°C were
treated at 20°C in air of 30% R.H.
Stress relaxation tests and acoustic emission monitoring
Ring-down count rates and event rates were recorded and
are plotted against stress intensity factor as well as crack
velocity in Figures 5, 6 and 7.
The acoustic emission and crack velocity data were fitted
to expressions of the form of equations 4, 5 and 6 in section
3, where n, n_, nn are constants.Xli K
Values of n, n_ and n_. are given in Table 1.£< K
Table 1: Values of n, n_ and n_. for heat-treated Westerleyiii K
granite tested at 20 C.
20°C 100°C 300°C 500°C
n 39.1 38.5(0.998) 39.1(0.99) 38.6(0.972)
n£ 39.6 40.4(0.996) 41.2(0.982) 39.5(0.990)
nD 38.8 41.4(0.998) 40.0(0.971) 37.4(0.992)K
Figures in brackets are correlation coefficients.
The most notable feature of the data in Table 1 is that
heat treating does not significantly influence the values of
n, n or n . b-values for the specimen heat-treated to 100 Chj K.
decrease as Y. is raised, but those for specimens heated to 300
and 500 C lie close to 1.3 independent of K_.
Stress-cycling and acoustic emission monitoring
Data from these experiments are plotted in Figure 8. For
the first 4 loading cycles the acoustic response illustrates
what has become known as the Kaiser effect, i.e. Only after
the maximum stress attained in a previous cycle has been ex
ceeded will there be any significant acoustic emission. Cycles
5 and 6 ignore this principle, however, and show substantial
emission at much lower stresses than were attained in the
previous cycles.
This is interpreted to show that residual strain energy
is being released by the stress cycling process. Other evi-
dence supporting the presence of residual strains in these
specimens are: anomalous increase in microcrack density
between 200° and 300°C, marked lowering of KT valuesJL G
between 200° and 300°C.
Conclusions and recommendations for further work
Heat treatment can markedly influence the fracture
mechanics properties of Westerley granite, but drying in
ovens to 100 C (a common practice in many laboratories) does
not significantly affect fracture properties, although some
influence is discernible.
Our specimen of Westerley granite probably contains
residual strains which influence fracture behaviour.
The influence of confining pressure on the effects of
heat-treating should be studied as a next stage in this work,
References
Atkinson, B.K., Rutter, E.H., Sibson, R.H., and White, S.H.
1980. Specific experimental and field studies per
taining directly to the mechanisms of seismic and
aseismic faulting. Final technical report to NEHRP,
USGS, 1980. Contract:- 14-08-0001-17662.
Rutter, E.H. and Mainprice, D.H. 1978. The effect of water
on stress relaxation of faulted and unfaulted sandstone
Pure and Applied Geophysics, 116, 634-654.
Rutter, E.H., Atkinson, B.K., Mainprice, D.H. 1978. On the
use of the stress relaxation testing method in studies
of the mechanical behaviour of geologic materials.
Geophys. J. R. Astr. Soc. 55, 155-170.
6.
obtain larger displacements. These experiments will be
carried out in Hoek-Franklin cells (Fig. 10) at room temper
ature and moderate confining pressure (up to 50 MPa (.5Kb.)).
It is also hoped to carry out creep experiments to obtain
creep laws for various gouges.
PRESHAL MORE BASALT
Stress relaxation and long term constant strain rate
experiments are to be carried out to determine the effects of
a varying mineralogy and rock chemistry on deformation
mechanisms along faults at low strain rates. The Tertiary
Preshal More basalt from Skye, N.W. Scotland, was chosen as
it is reasonably unaltered and contains few vesicles and cracks,
Characterisation of basalt.
Preliminary characterisation experiments have been
completed under similar conditions to Westerley granite (Fig.li;
Dry basalt shows similar or slightly lower fracture and
sliding stress to dry Westerley granite. However, a larger
reduction in fracture stress is observed on wetting, and there
fore Rehbinder effects seem to be more important than in
Westerley granite. Stick-slip occurs frequently and is the
dominant sliding behaviour at confining pressures greater than
100 MPa (1 Kb). From these experiments it would seem that
200 MPa (2 Kb) is a suitable confining pressure for pre-
fracturing for stress relaxation and long term constant strain
rate tests, as a single through going fracture is produced.
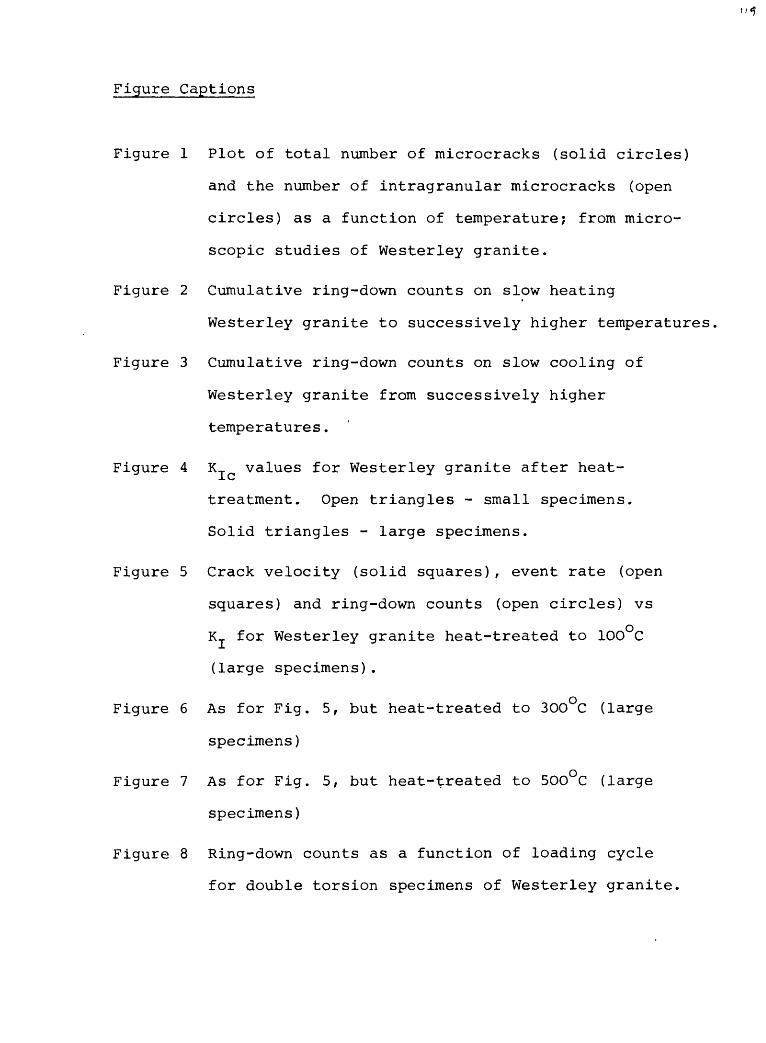
Figure Captions
Figure 1 Plot of total number of microcracks (solid circles)
and the number of intragranular microcracks (open
circles) as a function of temperature; from micro
scopic studies of Westerley granite.
Figure 2 Cumulative ring-down counts on slow heating
Westerley granite to successively higher temperatures
Figure 3 Cumulative ring-down counts on slow cooling of
Westerley granite from successively higher
temperatures.
Figure 4 KT values for Westerley granite after heat-
treatment. Open triangles - small specimens.
Solid triangles - large specimens.
Figure 5 Crack velocity (solid squares), event rate (open
squares) and ring-down counts (open circles) vs
KT for Westerley granite heat-treated to 1OO C
(large specimens).
Figure 6 As for Fig. 5, but heat-treated to 3OO C (large
specimens)
Figure 7 As for Fig. 5, but heat-treated to 5OO°C (large
specimens)
Figure 8 Ring-down counts as a function of loading cycle
for double torsion specimens of Westerley granite.
References
Bauer, S.J. and Johnson, B. 1979. Effects of slow heating
on the physical properties of Westerley and Charcoal
granites. 20th US Symposium on Rock Mechanics, Austin,
Texas.
Swain, M.V., Williams, J.S., Lawn, B.R. and Beek, J.J.H.,
1973. A comparative study of the fracture of various
silica modifications using the Hertzian test. J. Mater
Science 8, 1153-1164.
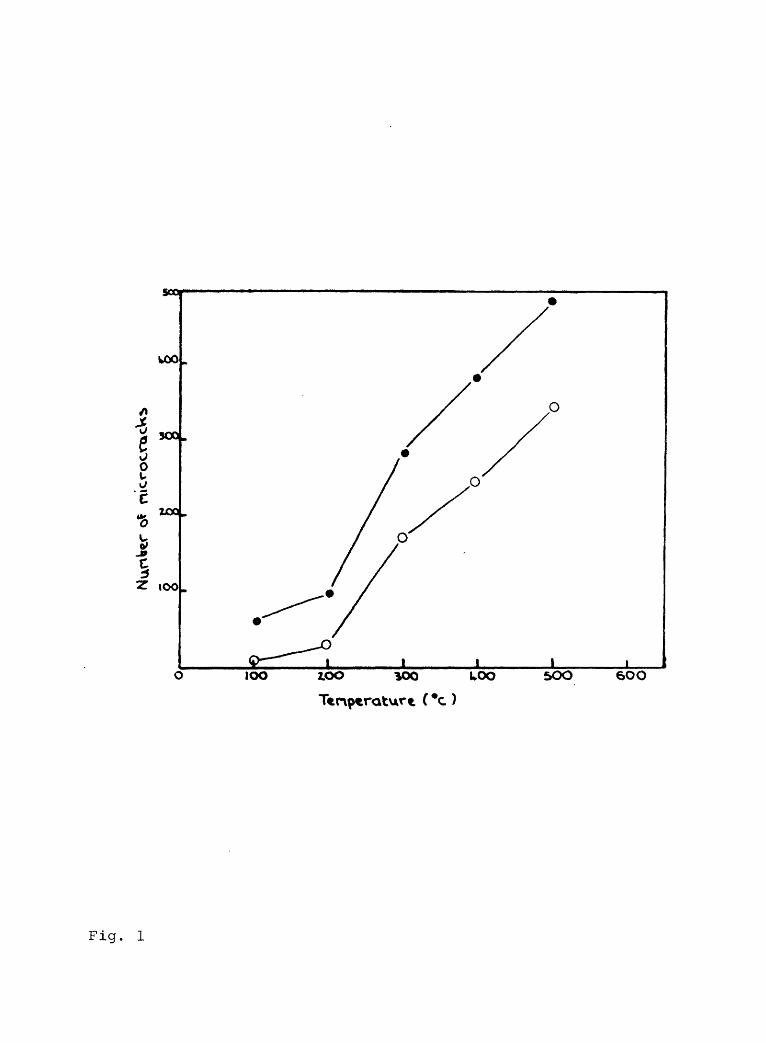
OO9 OOS OOI OOI QO7 OOI
OOI
*
3
ocn
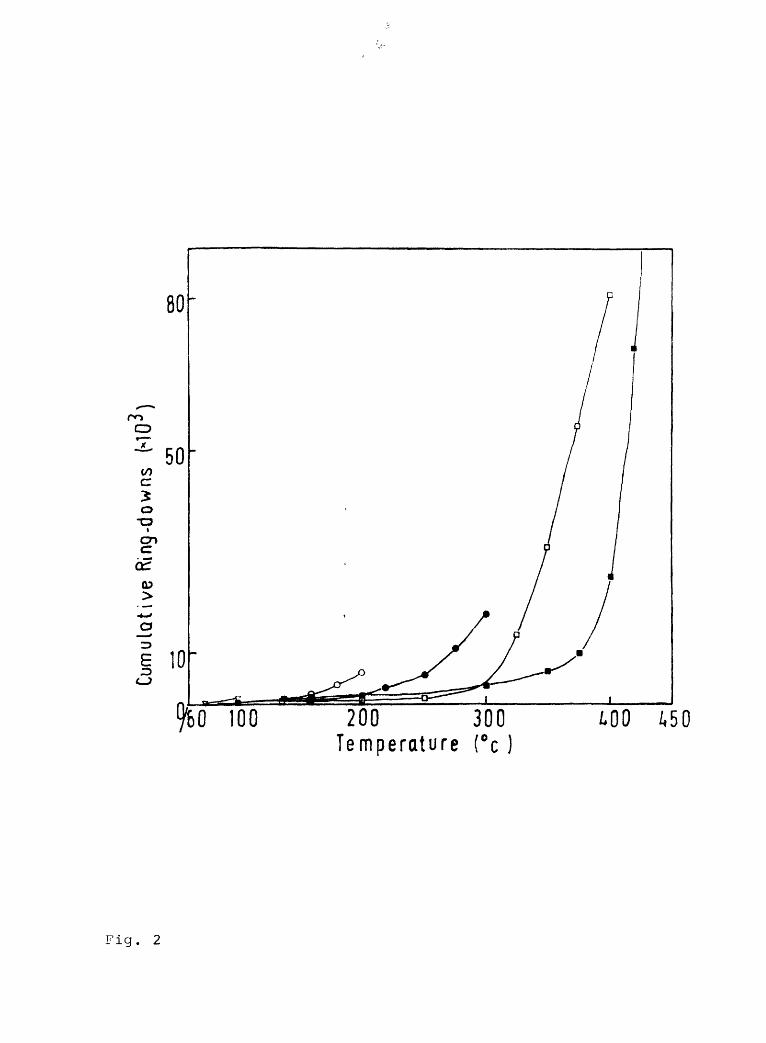
Cum
ulat
ive
Rin
g-do
wns
H
(r)
CJl
cz>
cx>
CD
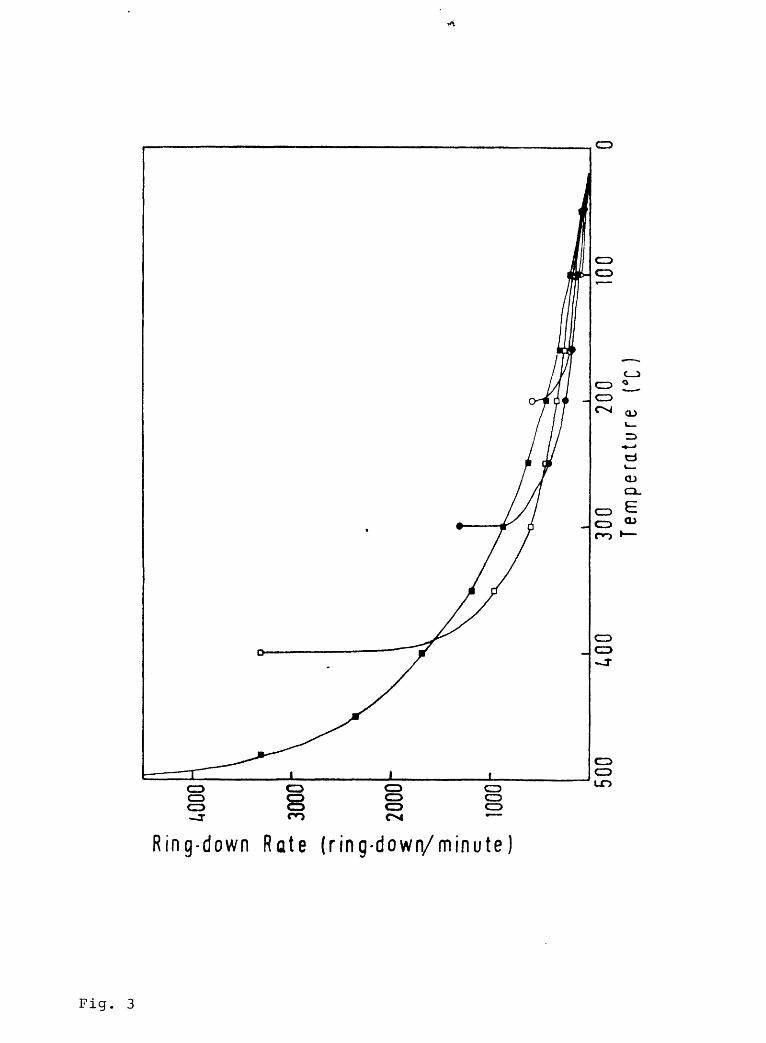
Ring-down Rate (ring-down/minute)
Fig. 3
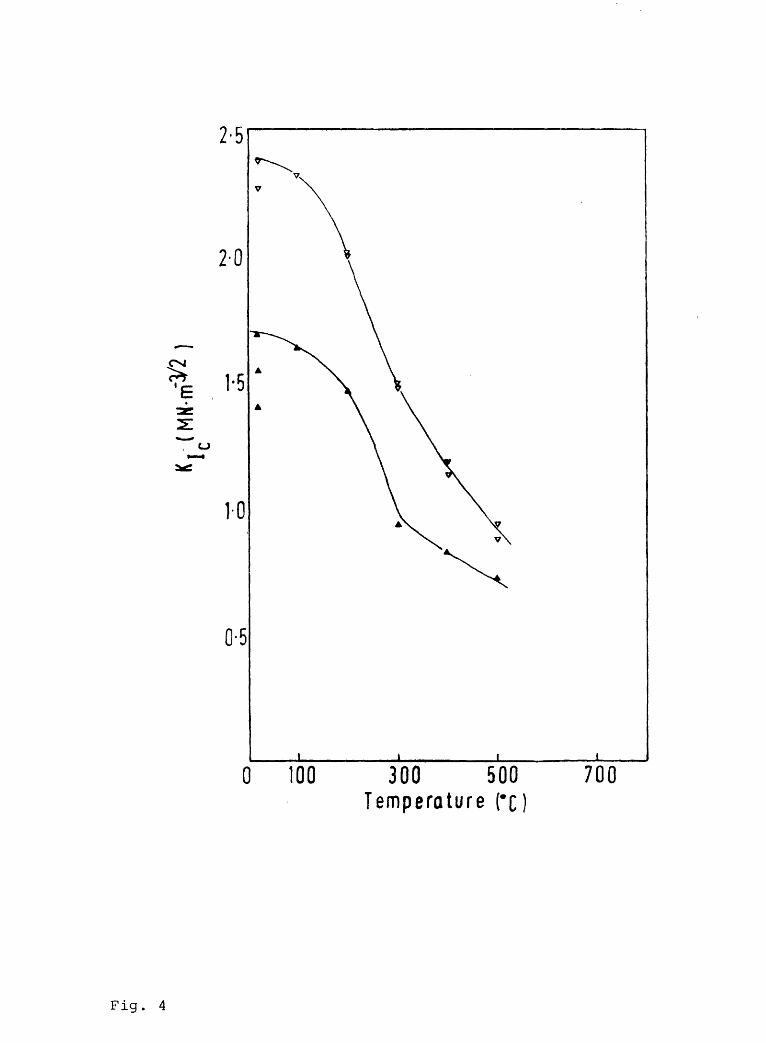
2-5
2-0
1-5
o
1-0
0-5
0 100 300 500 Temperature (*c)
700
Fig. 4
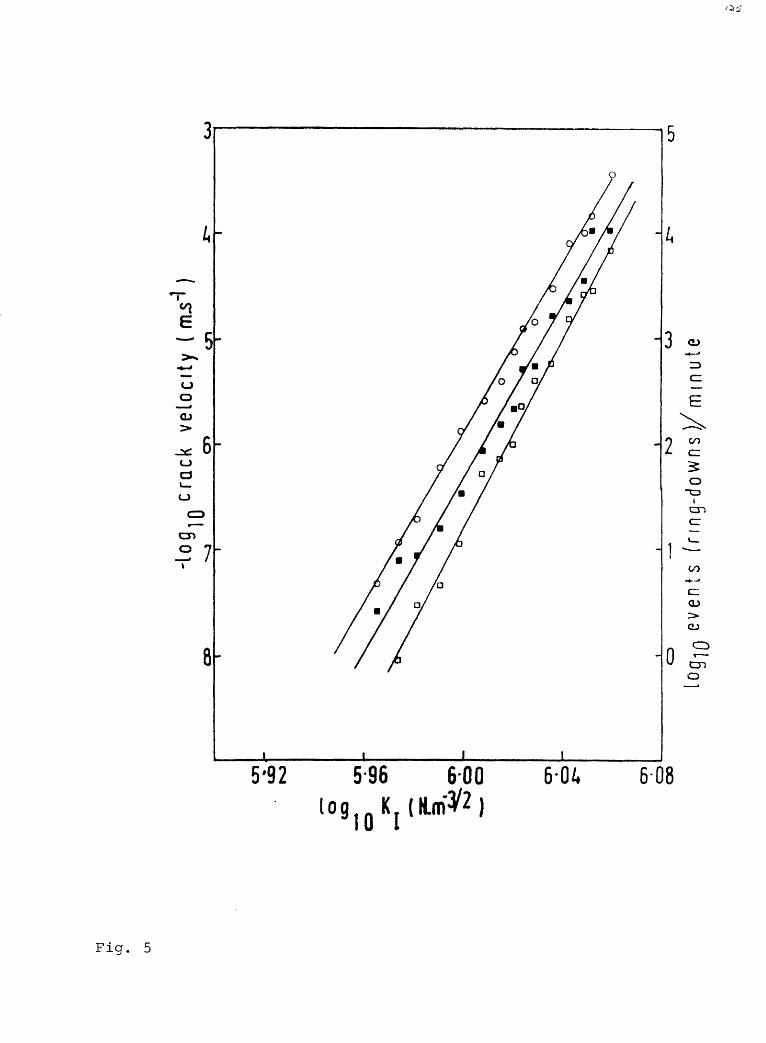
LjO
3jn
uiu
j/(suM
Op
-6u
uj
CO
oo
cpU
D
fN|
^*'e
co
enGT
>
LO
eoG
O
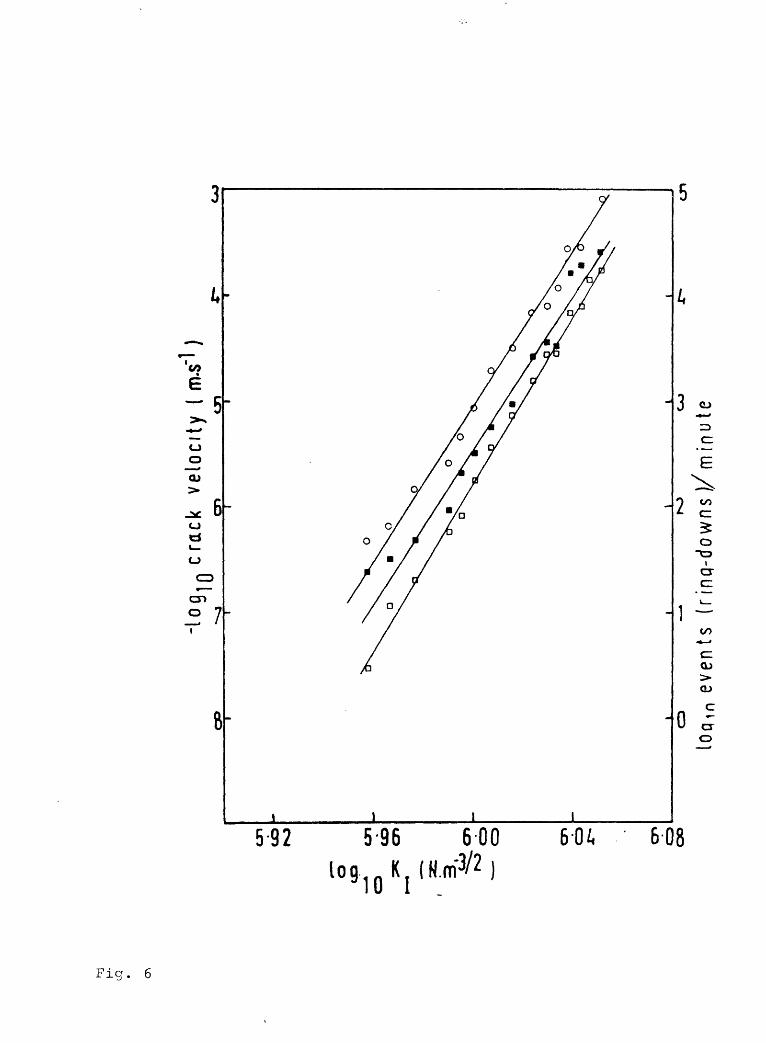
o
I oCO <CO
JO i
Q_ O
I
c:
» £
9
9 10-9 009 96-S 26-9
/ oCO
CZ3
O
o
CDo"
o
9 ^3CO.
e
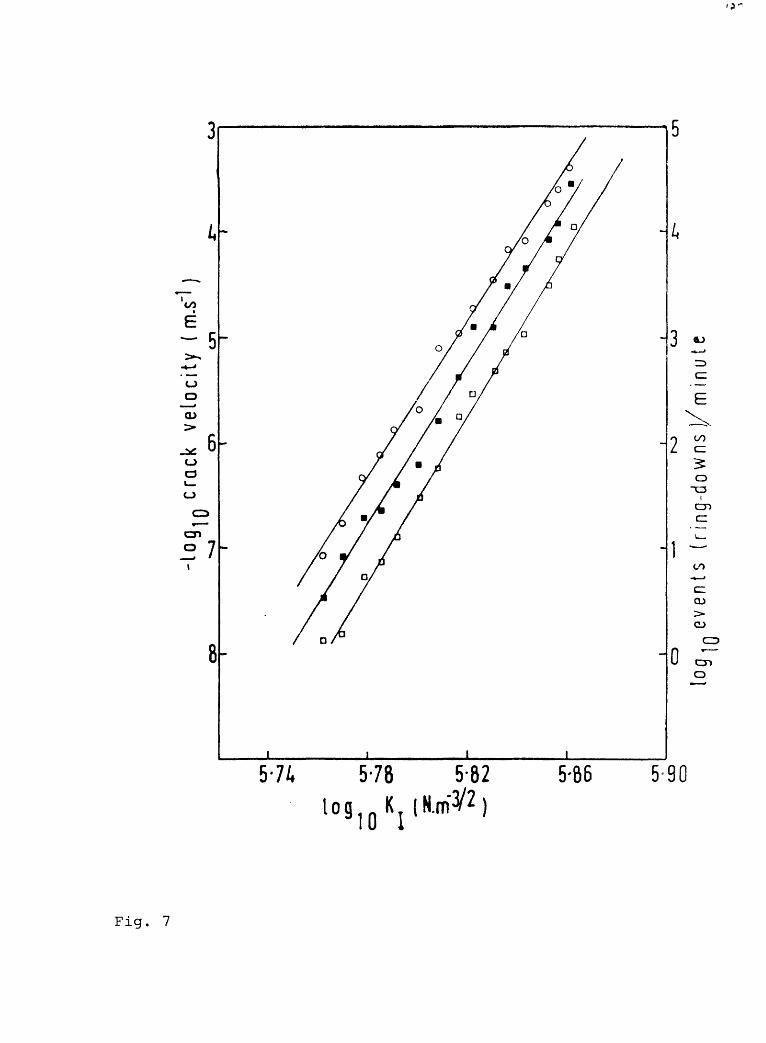
H-
en
o CO
CD
en
^4
OD
3,
KJ
en »
CP
en
en
eo
CD
CD
-Iog
1n c
rack
ve
loci
ty
( m.s
"')en
r-o
log
^eve
nts
(r
ing-
dow
ns )
/m m
ute
en
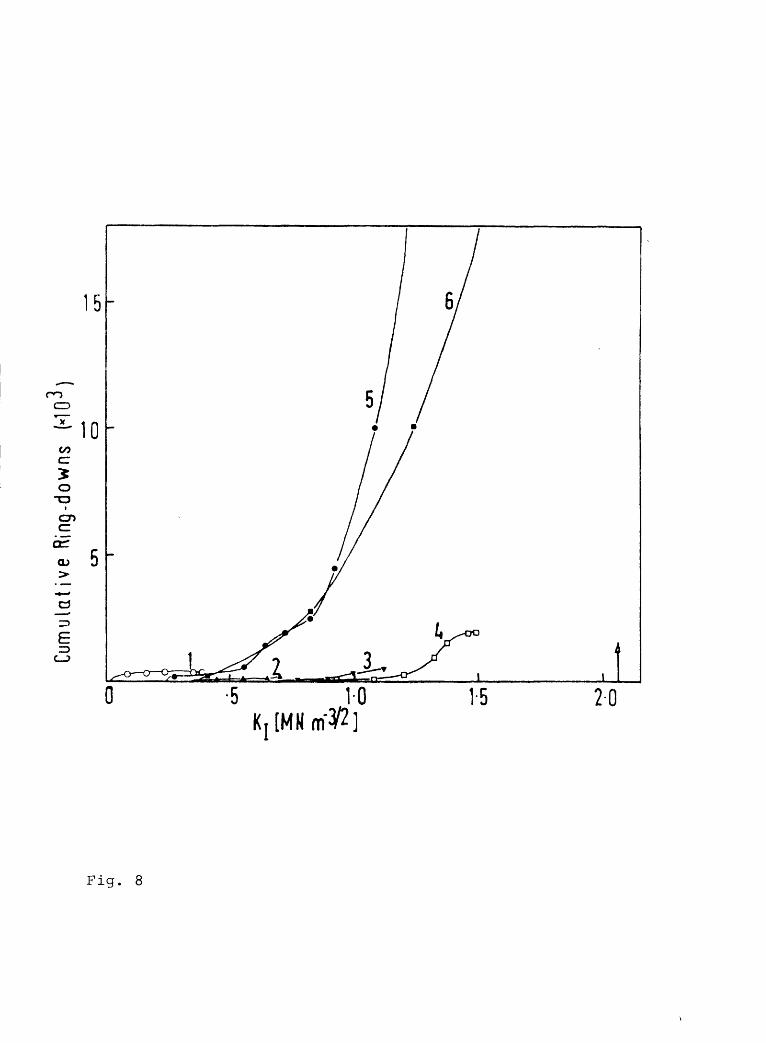
Cum
ulat
ive
Rin
g-do
wns
H
(r)
00
cn
3. s.
cn

5. INFLUENCE OF PORE WATER ON THE SLIDING OF FAULTS IN
EXPERIMENTALLY DEFORMED WESTERLEY GRANITE AND PRESHAL
MORE BASALT
S.M. Dennis and B.K. Atkinson
WESTERLEY GRANITE
The first part of this study into fault slip at low
strain rates has concentrated on Westerley granite.
Experiments were carried out in fluid medium Heard type
deformation rigs using 0.25" diameter cores.
Characterisation of Granite
The rock was first characterised by deforming wet and
dry samples to failure at a constant strain rate of 10 sec ,
confining pressures from 0.1 MPa (Ib) to 300 MPa (3Kb) and
250°C (Fig.l).
The behaviour of the rock varies considerably with con
fining pressures: at low confining pressures failure is
usually slow followed by stable sliding. At high confining
pressures failure is sudden, often with a loud noise, followed
by a rise in stress to a constant sliding stress (stable/stick-
slip transition). Sudden failure and stable/stick-slip sliding
are also commoner in wet samples.
Two main results are obtained from the confining pressure/
strength relationships: i) our samples behaved in a similar
way to those reported in the literature (Fig.2) and ii) water
has little effect on the rock's strength (Fig.l) i.e. Rehbinder
effects are not very important.
2.
Microscopically the rocks seem to show little effect
of confining pressure or whether they are wet or dry. The
wet samples appear to have a narrower zone with widespread
fracturing. There also appears to be more fine grained gouge
of quartz and feldspar above 150 MPa (1.5 Kb). In general
biotite is preserved, quartz develops some fractures and
feldspar is most fractured. Through going fractures are
usually anastamosing and intergranular. Extension fractures
parallel to a, are seen in some higher confining pressure
samples.
Stress relaxation
Stress relaxation tests were carried out to establish
the effects of the presence and pressure of pore fluids on
sliding stress at low strain rates. Samples were prefractured
at confining pressures of 200 MPa (2 Kb) , strain rates of
-5 -1 o 10 sec and temperatures of 25 C. They were then unloaded
and pore fluid pressure added to 20 MPa (.2 Kb) or 100 MPa
(1 Kb) . Effective confining pressure was adjusted to 150 MPa
(1.5 Kb), temperature to 300°C and samples were reloaded to
sliding. Relaxation was started and continued for several
months or until no further relaxation was observed.
Results were as follows: 1) Dry granite shows no
reduction in sliding stress at strain rates down to 10 sec
(Fig. 3 WG 40); 2) The rock is weakened by wetting at strain fi C _Q _ )
rates less than 10 " -10 sec , but not as much as Tennessee
sandstone or Mojave quartzite (Rutter and Mainprice, 1978;
3.
Atkinson et al., 1979) (Fig. 3, WG 30); 3) Increasing the
pore fluid pressure (P f ) with effective pressure held con
stant results in a substantial increase in the rate of
stress relaxation, (Fig. 3, WG 35).
Values of stress exponent 'n 1 , where e and an , were
obtained from linear regression on the data showing signifi
cant strength reduction (Fig. 5). For Pf = 20 MPa (.2Kb)
n * 25, and for 100 MPa ( 1 Kb) n * 6, although WG 35 showed-9 -1
a step with n - 17 at strain rates less than 10 sec . This
could be due to a change in the dominant deformation mechanism.
Pressure solution, a possible deformation mechanism, gives
n = 1, but stress corrosion gives higher values and seems
more likely.
A relaxation test was also carried out using an un
fractured specimen which had been brought to^ 80% of its
fracture stress (Fig. 3, WG 37). Although Pf = 20 MPa (.2 Kb),
no significant relaxation was observed at 300 C and 150 MPa
(1.5 Kb) effective pressure. This again suggests that pressure
solution is not a viable mechanism as it would cause relax
ation in unfractured samples.
A preliminary temperature cycling stress relaxation
experiment was carried out to obtain an estimate of the acti
vation enthalpy (H) for sliding in wet granite (Fig.4). The
sample was relaxed at 400°C, then at 300°C with Pf (20 MPa)
and effective pressure (150 MPa)held constant H can be
calculated from the equation:
4.
e = G on exp. (-H/RT) (Rutter et al, 1978)
Figures of 20 - 35 kJ. mole" are obtained, but more
experiments are needed to verify this.
Reproducibility
Values of *n' are similar for experiments using similar
conditions (Figs. 5 and 6). However, the initial stress
varies considerably; this is probably due to specimen
variability.
8 1 Long term constant strain rate experiments (10 sec )
One long term experiment (WG 39) at 150 MPa (1.5 Kb)
confining pressure, 20 MPa (.2 Kb) pore fluid pressure and
300 C has now been completed. Microscopic analysis is in
progress. However, a slight leak developed during the test
which meant it could only be run for 2 months and therefore
a large enough strain may not have accumulated for easy micro
scope analysis. A repeat experiment (WG 42) is now in progress
and stress-strain plots of both are shown in Fig. 7.
WG 39 shows stick-slip behaviour, although some of the
variation in stress supported may be due to fluctuations in
pressure. WG 42 is similar, but with much less variation in
stress, except where the stress dropped due to furnace failure
Another long term constant strain rate test (WG 43)
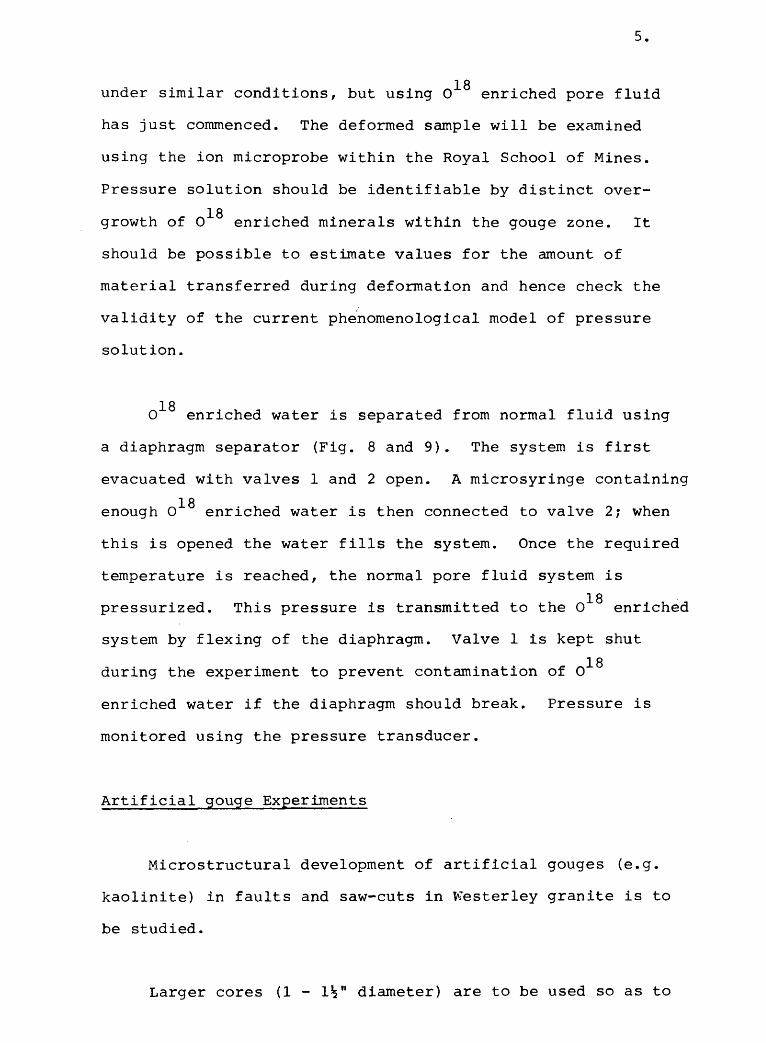
5.
18 under similar conditions, but using 0 enriched pore fluid
has just commenced. The deformed sample will be examined
using the ion microprobe within the Royal School of Mines.
Pressure solution should be identifiable by distinct over-
18 growth of 0 enriched minerals within the gouge zone. It
should be possible to estimate values for the amount of
material transferred during deformation and hence check the
validity of the current phenomenological model of pressure
solution.
18 0 enriched water is separated from normal fluid using
a diaphragm separator (Fig. 8 and 9). The system is first
evacuated with valves 1 and 2 open. A microsyringe containing
18 enough 0 enriched water is then connected to valve 2; when
this is opened the water fills the system. Once the required
temperature is reached, the normal pore fluid system is
18 pressurized. This pressure is transmitted to the 0 enriched
system by flexing of the diaphragm. Valve 1 is kept shut
18 during the experiment to prevent contamination of 0
enriched water if the diaphragm should break. Pressure is
monitored using the pressure transducer.
Artificial gouge Experiments
Microstructural development of artificial gouges (e.g.
kaolinite) in faults and saw-cuts in Westerley granite is to
be studied.
Larger cores (1 - IV diameter) are to be used so as to
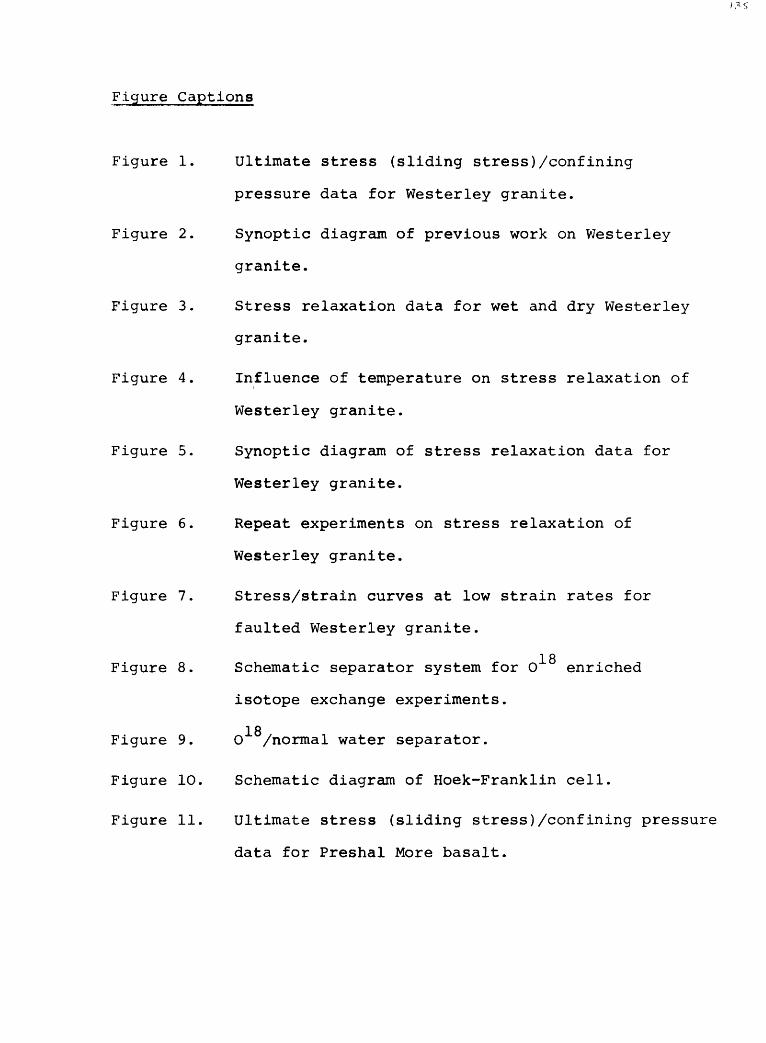
Figure Captions
Figure 1. Ultimate stress (sliding stress)/confining
pressure data for Westerley granite.
Figure 2. Synoptic diagram of previous work on Westerley
granite.
Figure 3. Stress relaxation data for wet and dry Westerley
granite.
Figure 4. Influence of temperature on stress relaxation of
Westerley granite.
Figure 5. Synoptic diagram of stress relaxation data for
Westerley granite.
Figure 6. Repeat experiments on stress relaxation of
Westerley granite.
Figure 7. Stress/strain curves at low strain rates for
faulted Westerley granite.
18 Figure 8. Schematic separator system for O enriched
isotope exchange experiments.
18 Figure 9. O /normal water separator.
Figure 10. Schematic diagram of Hoek-Franklin cell.
Figure 11. Ultimate stress (sliding stress)/confining pressure
data for Preshal More basalt.
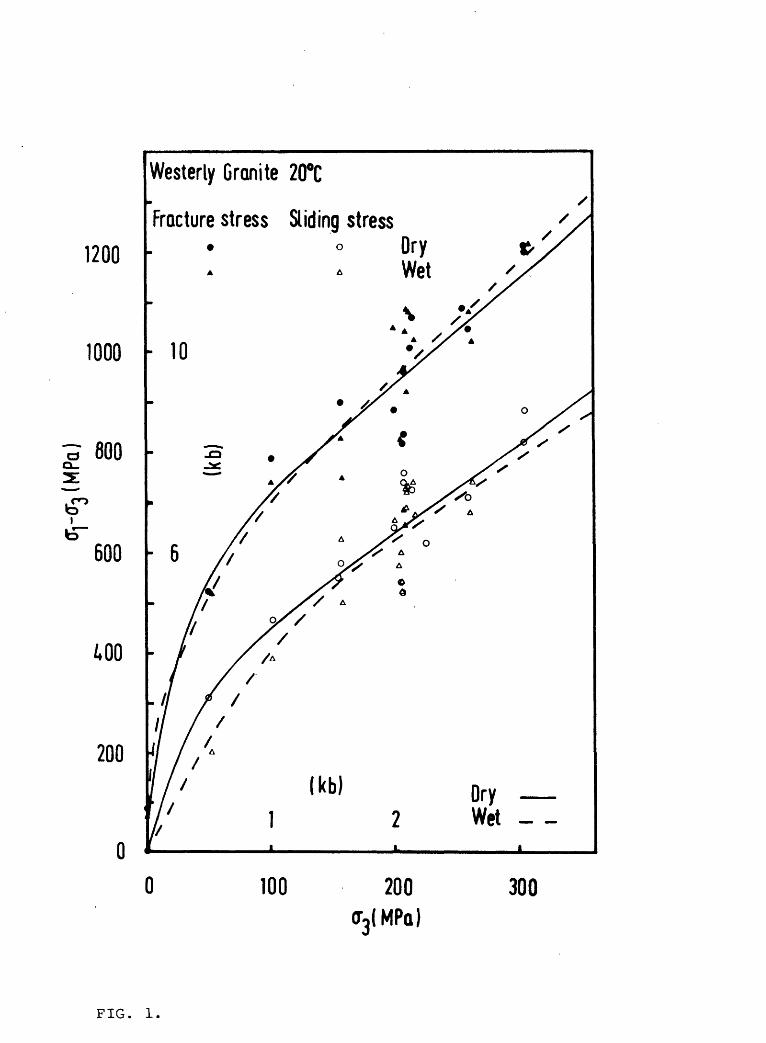
1200
1000
-5 800
600
A 00
200
0
Westerly Granite 20°C»
Fracture stress Sliding stress
0 100 200 300
FIG. 1.
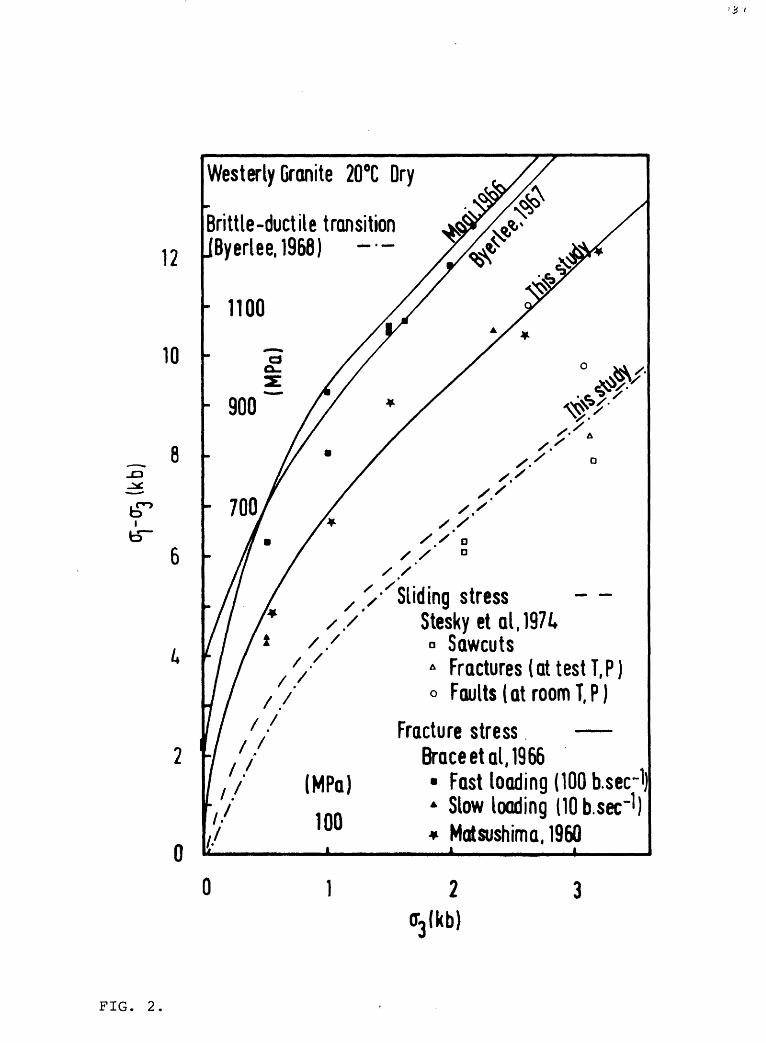
12
10
\I
6
Westerly Granite 20°C Dry
Brittle-ductile transition JByerlee.1968)
1100
V
- 700.
//
0
0
(MPo)
100^^^j^^
1
x 'Sliding stressSteskyetal.197/*
o Sawcuts* Fractures (at test T,P) o Faults (at room T,P)
Fracture stress Brace etal,1966* Fast loading (100 b.sec-1]* Slow loading llOb.sec"1 )* Matsushima, 1960
2(T3 (kb)
3
FIG. 2.
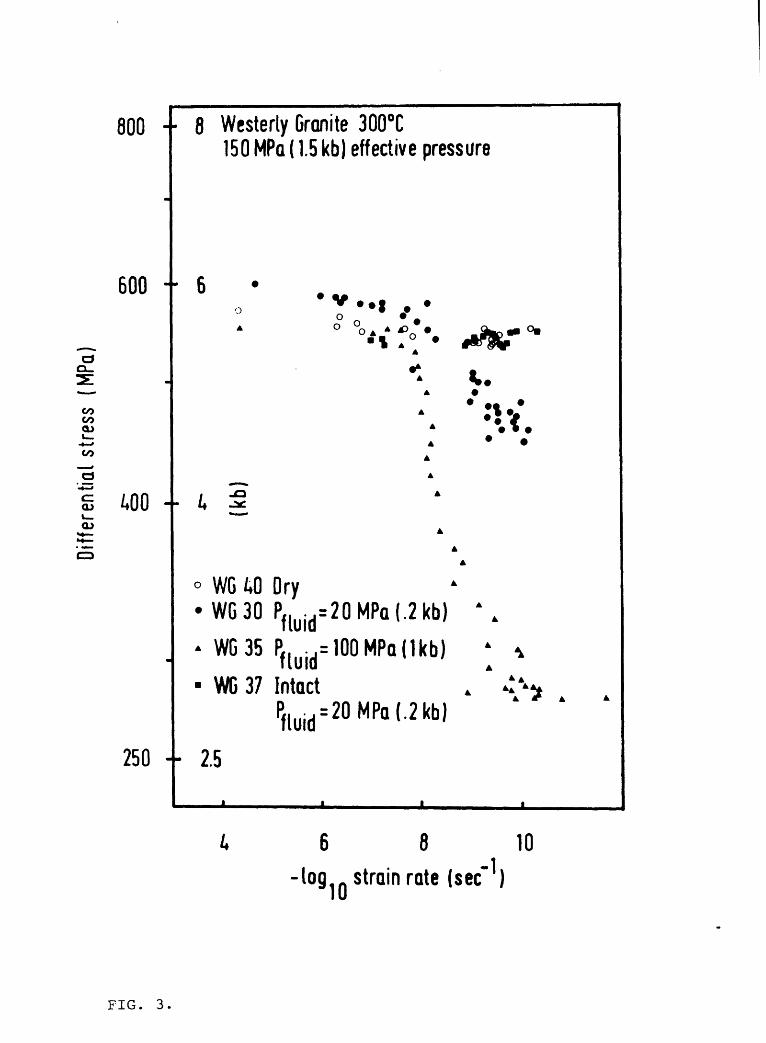
800 + 8 Westerly Granite 300°C150 MPa (1.5 kb) effective pressure
600 - 6
aa.
CO COa>
CO"3
c. a>i__ a>
A
A
A
A
0)0 -I- /, 5A
A
A
° WG 40 Dry WG30 Pf((Jjd =20MPa(.2kb) \
WG35 P.. -.= 100MPa(1kb) * * fluid A WG 37 Intact t «:^
Pf(uJd = 20MPa(.2kb)
250 + 2.5
6 8 10-1
-log .strainrate {sec )
FIG. 3.
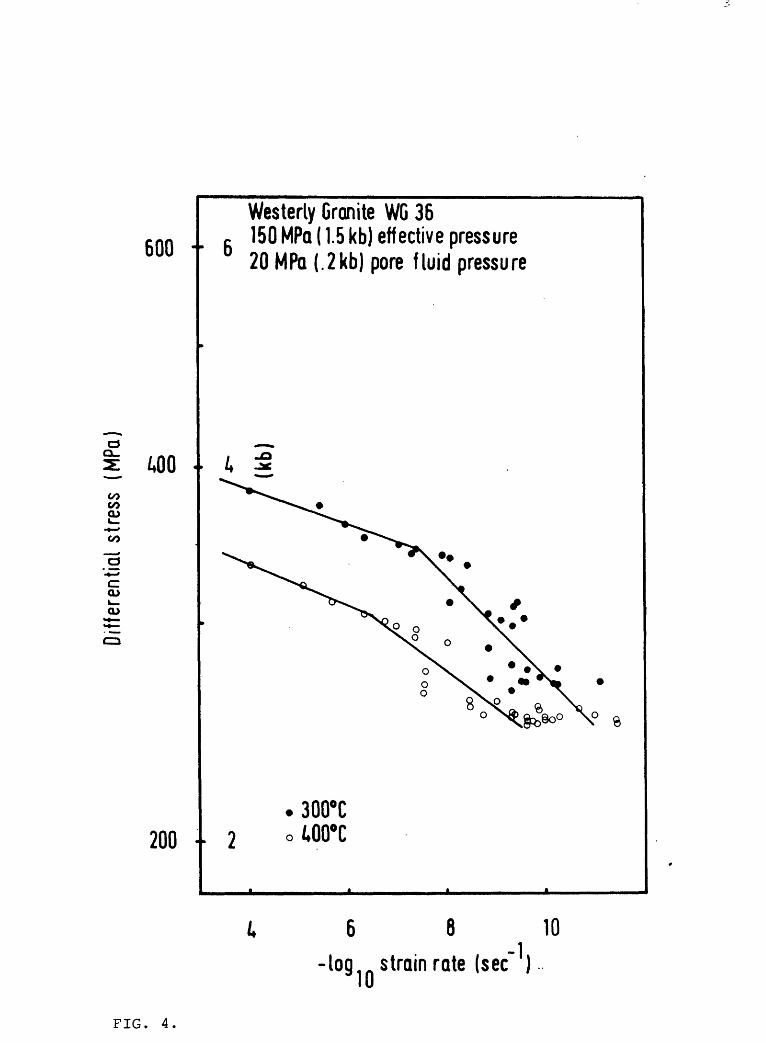
Westerly Granite WG 36finn + fi '50 MPa 11.5kb) effective pressure DUU T 20 MPa {.2kb) pore fluid pressure
6000
CO
c:CDk_ OJ
200 2 300°C
6 6 10-1
-log strain rate (sec )
e
FIG. 4.
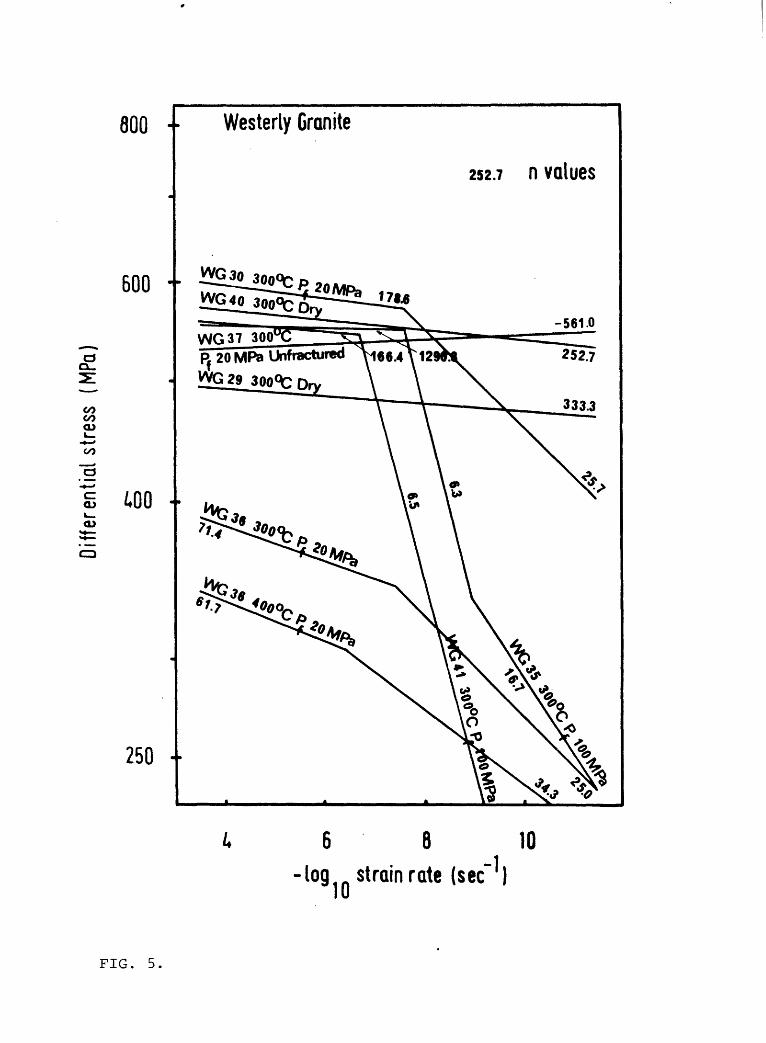
800 - Westerly Granite
600
CO CO CU
00"3
(Z <L>k__cu
too
250
2S2.7 n values
WG37 300Pf 20MPaUnfractured
6 8 10-1
-log strain rate (sec )
FIG. 5
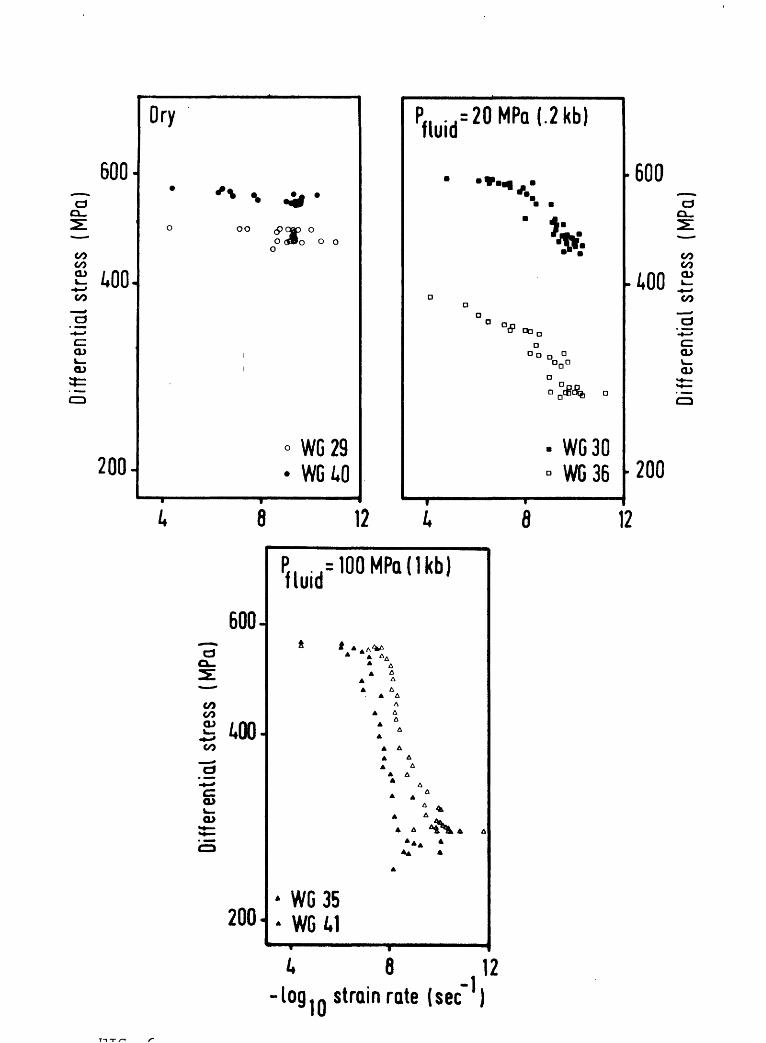
Diff
eren
tial s
tress
(M
Pa)
en
Diff
eren
tial s
tress
(M
Pa)
ro
en
o CO *> 3 CD
CO n>
o
cr>
CO
it CD
C
D
GO
>.«
5
CO
I*O
CT>
C
T>.r
- ro
CD
C
O
ct>
-a °
a
CO CO
Cn CD
II 1*0
cr
en
Diff
eren
tial s
tress
(M
Pa)
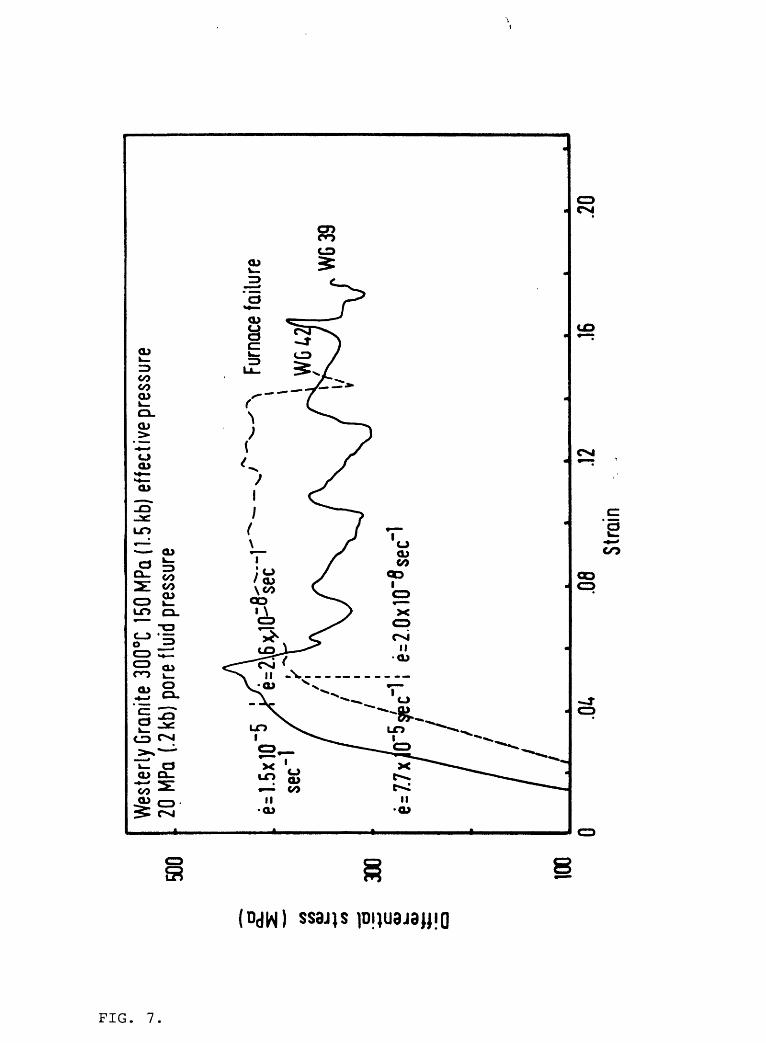
'L
Differential stress (MPa)
CO
CO
3
C7>
CD CO
hO
"i3
CD
Q. _ ̂
"O tn~^ CD CO
CP
ense erCO
COo
CD TDCD CO COcCD
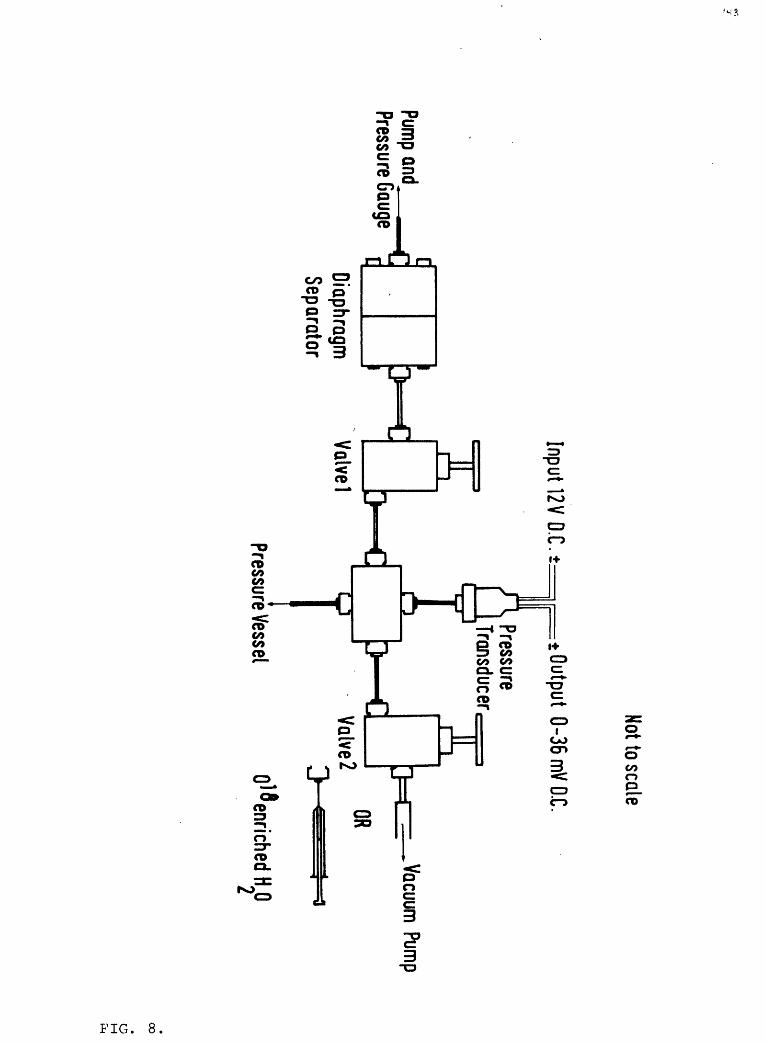
Hot to scale
Pump and Pressure Gauge
tiDiaphragm Separator
Input 12V D.C.±
Valve 1
Output 0-36 mVD.C.
Pressure Transducer
Vacuum Pump
Pressure Vessel
Valve 2OR
Ol8enrichedHO
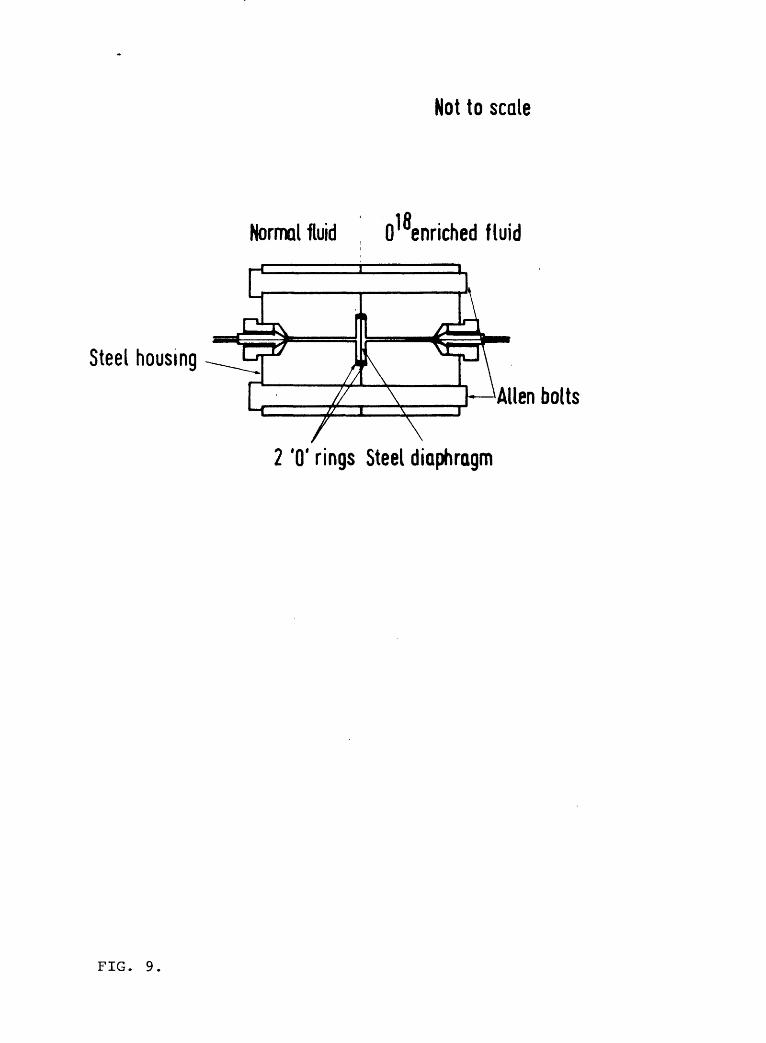
Not to scale
10
Normal fluid 0 enriched fluid
Steel housing
Alien bolts
7^ ^ \ ,
2 '0' rings Steel diaphragm
FIG. 9.
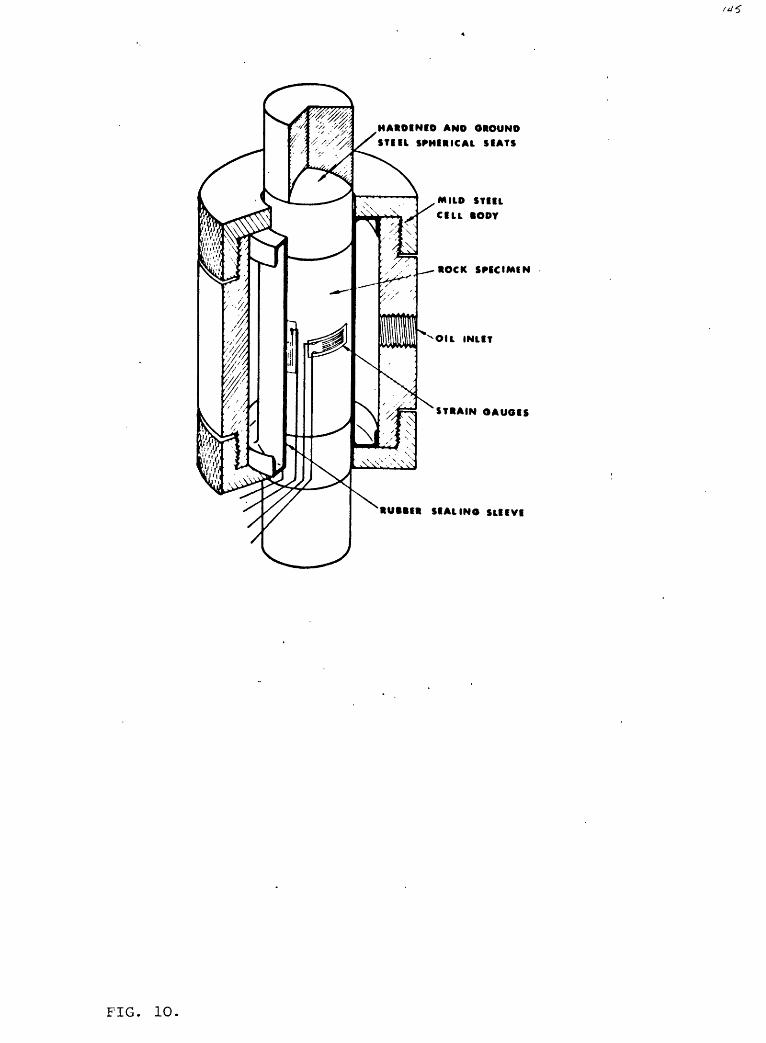
HAROINfD AND GROUND
SPHIRICAL SIATS
MILD STIIL
CILL iODY
ROCK SPICIMIN
OIL INLIT
STRAIN OAUGIS
RUttfR SIALINO SLlfVI
FIG. 10.
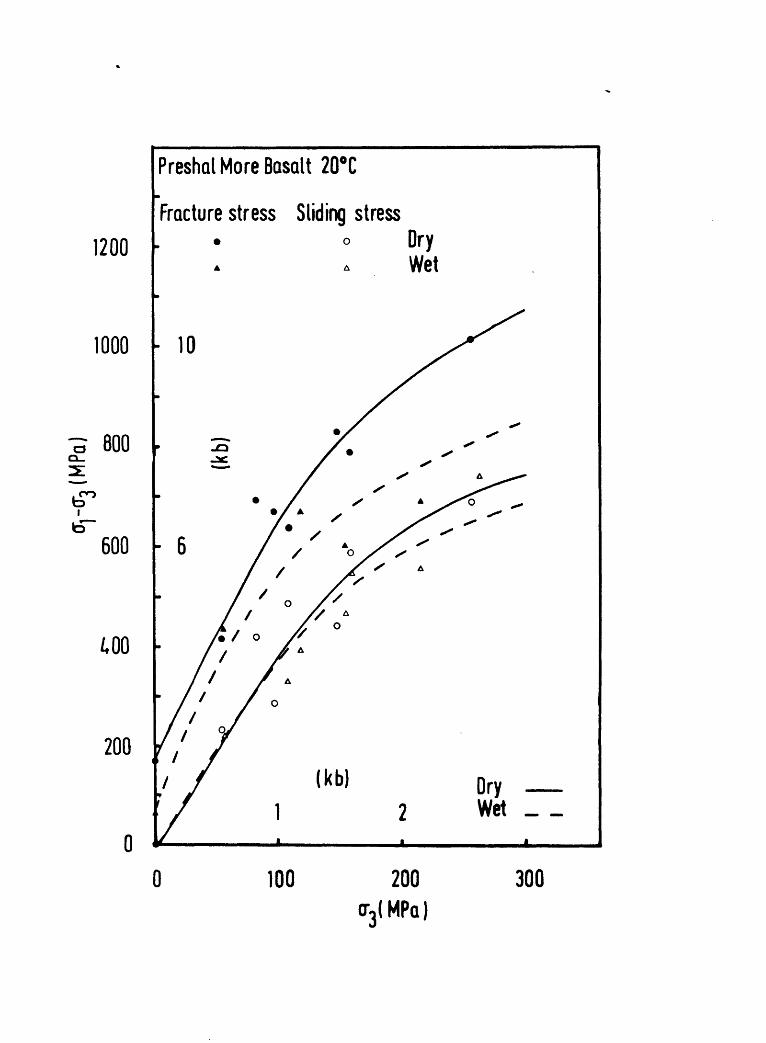
1200
1000
S BOOQ_
I\0
600
(.00
200
0
Preshot More Basalt 20°C
Fracture stress Sliding stressDry Wet
10
6
(kb)2
Dry Wet _
0 100 200 0-3! MPa)
300
6. DEVELOPMENT OF TECHNIQUES TO MEASURE MODE II CRACK
PROPAGATION PARAMETERS.
B.K. Atkinson, R.F. Holloway

Two methods have been chosen to obtain mode II crack
growth parameters.
The first is called the compact shear specimen and is
based upon work done by metallurgists (Jones and Chisholm,
1975). This specimen contains two cracks, is fully symmetric
about the centre axis, but is fully asymmetric about the
crack tips. The mode II stress intensity factor for this
specimen is given by
KJJ = (1.08)o a^ (1)
where a is the applied stress and a is the crack length.
Apparatus to allow the use of this specimen in rock testing
has been constructed.
The second method is based upon an idea put forward by
Rice (1979). In essence, the post-failure region of a stress/
displacement curve can be analyzed in the following way to
give a value of the critical strain energy release rate (G.,-.,-)
which is related to K_._ through the elastic constants. The
area under a curve describing the post-failure shear stress/
displacement behaviour between the peak stress and the post-
failure sliding stress is equal to G__. To obtain useful
data a rather stiff machine is required.
Preliminary calculations using both these methods suggests
4 -2that G is of the order of 10 J.m for granite.
References
Jones, D.L. and Chisholm, D.B. 1975. An investigation of
the edge-sliding mode in fracture mechanics. Engineering
Fract. Mech. 1, 261-270.
Rice, J.R. 1979. The mechanics of earthquake rupture. Proc.
Int. School of Physics 'Enrico Fermi 1 , Course LXXVIII
(in press).

'5'
7. SHORT ROD KT EXPERIMENTSIc
P.G. Meredith and B.K. Atkinson
Apparatus for running short rod tests on cores of
rock to determine KT has been constructed and is now inIc
use on a routine basis.
The peak pressure in a flat jack required to propagate
an internal wedge-shaped crack in the core is a measure of
K through the equation
KIc = AP/B (1)
where P is the peak pressure, B is the specimen diameter and
A is a dimensionlesss constant obtained by 'calibration ex
periments.
We have calibrated this apparatus using soda-lime glass
as a standard and made determinations of K... in a number of
rocks at room temperature in air. These are compared in the
table below with data on KT for the same materials, butIc
obtained using the double torsion apparatus.
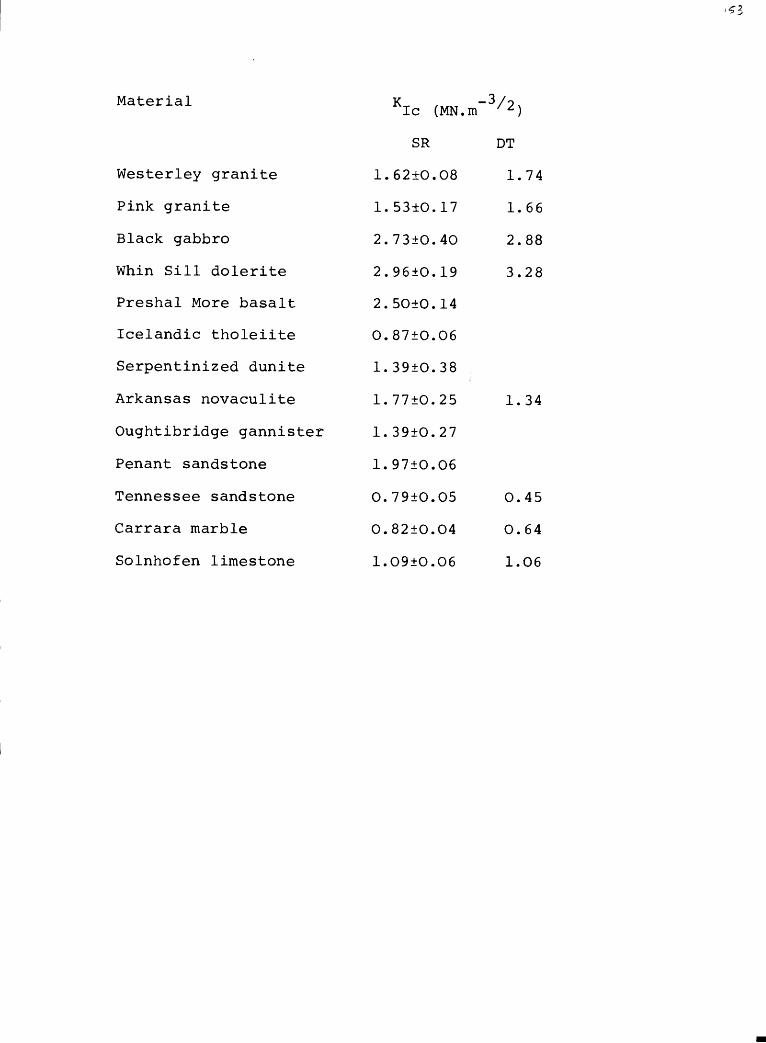
Material
Westerley granite
Pink granite
Black gabbro
Whin Sill dolerite
Preshal More basalt
Icelandic tholeiite
Serpentinized dunite
Arkansas novaculite
Oughtibridge gannister
Penant sandstone
Tennessee sandstone
Carrara marble
Solnhofen limestone
KIc (MN.m"
SR DT
1.62+0.08 1.74
1.53±0.17 1.66
2.73±0.40 2.88
2.96±0.19 3.28
2.50+0.14
0.87±0.06
1.39+0.38i
1.7710.25 1.34
1.39+0.27
1.9710.06
0.79+0.05 0.45
0.82+0.04 0.64
1.0910.06 1.06
8. APPARATUS DEVELOPMENT
P.G. Meredith, S.M. Dennis, B.K. Atkinson, R.F. Holloway
Apparatus required for fracture mechanics tests are
largely completed. Newly manufactured apparatus includes
short-rod apparatus, high<-temperature/high vacuum double
torsion apparatus and internally pressurized thicks-walled
cylinder apparatus. Additionally apparatus development for
compact shear measurement of mode II stress intensity factors
and post^failure analysis of stress<-displacement records is
in hand. We are also attempting to design apparatus for mode
III, anti-plane shear measurements of stress intensity
factors.
Apparatus required for isotopic exchange experiments in
slow sliding tests has been built and is described in an
earlier section. A number of different techniques are being
developed for looking at the textural development of gouge
during relatively large'-displacement experiments.
We are also building apparatus for creep measurements on
gouge and developing ways of looking at scale effects in
frictional sliding.

9. FUTURE WORK
We are poised, waiting to begin the extensive
measurement stage of our project. Most of the apparatus
development is completed or in hand, and we lack only the
funds to begin work.
If further delay in funding occurs we will not be able
to maintain the scientific momentum of our effort, nor keep
our research team together. This would be a cruel waste of
our effort and USGS funds.
1O. PUBLICATIONS ARISING DURING THIS CONTRACT PERIOD.
Atkinson, B.K., 1980. An outline proposal of some aims,
strategies and objectives in earthquake prediction.
In Proceedings 2nd Workshop on European Earthquake
Prediction Programme jointly organised by European
Space Agency and Parliamentary Assembly of the Council
of Europe, Strasbourg, 1980, 135-155.
Atkinson, B.K., 1980. Fracture Mechanics modelling of
earthquake generating processes. In Proceedings of
an Interdisciplinary Conference on Earthquake Prediction
Research in the N. Anatolian Fault Zone, Istanbul, 1980
(in press)
Atkinson, B.K. and Avdis, V., 198O. Fracture Mechanics
parameters of some rock-forming minerals determined
with an indentation technique. Int. J. Rock Mech. Min.
Sci. and Geomech. Abstr. (in press).
Norton, M.G. and Atkinson, B.K., 1980. Stress-dependent
morphological features on fracture surfaces of quartz
and glass. Tectonophysics (in press).
Atkinson, B.K. 1980. Review of subcritical crack propagation
in rock. Proc. 26th International Geological Congress,
Paris, 1980. (To be published in J. Struct. Geol.).
Atkinson, B.K. and Rawlings, R.D., 1980. Acoustic emission
during stress corrosion cracking in rocks. Proc. 3rd
Maurice Ewing Symposium on Earthquake Prediction, New
York, 1980. Geophysical Union (in press).
Atkinson, B.K. and Meredith, P.G. 1980. Stress corrosion
of quartz: Influence of chemical environment. Tecto-
nophysics (in press).
Meredith, P.G. and Atkinson, B.K. 1980. Stress corrosion
and acoustic emission of Whin Sill dolerite (in prep.).
Dennis, S.M. and Atkinson, B.K. 1980. The influence of pore
fluids on the sliding of faulted surfaces of Westerley
granite under simulated geologic environments (in prep.)
Dennis, P.F. and Atkinson, B.K. 1980. Flow and fracture
deformation mechanism maps for quartz (in preparation).
Atkinson, B.K. 1981. Earthquake prediction precursors.
Physics in Technology 12.
Atkinson, B.K. 198O. How to take the shock out of earth
quakes. The Guardian, 25 September.