Mechanisms of CKD-MBD: New insights in the pathogenesis · Mechanisms of CKD-MBD: New insights in...
65
Mechanisms of CKD-MBD: New insights in the pathogenesis Mechanisms in chronic kidney disease Jorge Cannata-Andia University of Oviedo Oviedo, Spain
Transcript of Mechanisms of CKD-MBD: New insights in the pathogenesis · Mechanisms of CKD-MBD: New insights in...

Mechanisms of CKD-MBD:
New insights in the pathogenesis
Mechanisms in chronic kidney disease
Jorge Cannata-Andia
University of Oviedo
Oviedo, Spain

• Role of Classic and New Players in the Pathogenesis of Secondary Hyperparathyroidism and CKD-MBRole of * Calcium (Calcimimetics)
* Vitamin D Receptor Activators (VDRAs)* Phosphorus and FGF 23
Mechanisms of CKD-MBD:New Insights in the Pathogenesis
* Phosphorus and FGF 23* Genomic & Molecular Changes in the Severe and
Refractory Secondary Hyperparathyroidism
• The Links Between the Bone and Vascular Axis in CKD-MBD. Role of Phosphate in the Pathogenesis of Vascular Mineralizationand Bone Demineralization. Possible Self-defensive Mechanisms Triggered by the Vascular System

MEDICINE 22: 103-161; 1943
1943: Renal Osteodystrophy(RO) (Liu et al, Medicine)
• Secondary Hyperparathyroidism• Osteomalacia• Osteosclerosis• Osteoporosis
Mechanisms of CKD-MBD:New Insights in the Pathogenesis
1970’s – 1980’s: PTH Assays and Bone BiopsyDiagnosis of ROD Useful in Clinical Practice (1980´s – 2007)
30 Following Years: Academic Concept With No Chance to be Applied in the Daily Clinical Management of CKD Patients
In 2006 a New Term was Proposed with a Broader Scope

Kidney Disease Improving Global Outcomes
Mechanisms of CKD-MBD:New Insights in the Pathogenesis
RenalOsteodystrophy
SecondaryHyperparathyroidism
the Vessels & BonePlay Important Role

PTH
FGF23/Klotho
•Aluminium• Estrógenos• Magnesio• Acidosis• Otros……
Parathyroid Regulation in Chronic Kidney Disease
Calcitriol Phosphorus
25(OH)DCannata –Andía JBy Rodriguez M.. Nefrología Clínica . Ed L Hernando, 2008,
FGF23/Klotho
Calcium

PTH
FGF23/Klotho
Parathyroid Regulation in Chronic Kidney Disease
CaSRCaSR Discover and Cloned in 1993
G Protein-Coupled Receptor (GPCR)
Cell Surface Receptor
Able to Recognize and Respond to Extracellular Calcium and Others: Al, La, Sr, Ga, .......
Calcitriol Phosphorus
Cannata –Andía JBy Rodriguez M.. Nefrología Clínica . Ed L Hernando, 2008,
FGF23/Klotho
Calcium

Parathyroids
Tissue Distribution
Parathyroid and C cells
Renal proximal tubule
Nephron segments
Gastrointestinal tract
Calcium Sensing Receptor (CaSR)
Gastrointestinal tract
Osteoblast/Osteoclast
Monocytes/macrophages
Nervous system
Bone marrow
Cardiovascular

NH2
Signaling Pathways Activated by the CaSR
Phospholipase C Phospholipase C
Calcium Sensing Receptor (CaSR)
1 2 3 4 5 6 7
P
PP
P
HCOO
Spurney RF, et al. Kidney Int 1999;55(5):1750-8.
Phospholipase C Phospholipase C (Inositol triphosphate, Ca(Inositol triphosphate, Ca2+2+
ii))
Phospholipase A2 Phospholipase A2 (Arachidonic acid)(Arachidonic acid)
Phospholipase D (Phosphatidic acid)Phospholipase D (Phosphatidic acid)MAP KinaseMAP Kinase
Inhibition of Adenylate CyclaseInhibition of Adenylate Cyclase

DNA
mRNA
mRNA
Storage
Transcripcion
Translation
Low Calcium
How Calcium Influence Parathyroid Hormone Synthesis ?
preproPTH
PTH
StorageTranslation
Degradacion
Secretion
Silver et al, 2000-2002
Low CalciumIncreases the Stability
of PTH mRNA
The Stability of PTHmRNA may vary from
5 minutes to 3 hoursPost-transcriptional

In CKD There is a Reduction ofExpression of CaSR (40-60%)
The Calcium Sensing Receptor in CKD
NH2
Reduction in Capacity of theParathyroid Gland to Sense Ca
1 2 3 4 5 6 7
P
PP
P
HCOO

110
100
90
80
70
Normal
Moderate Hyperparathyroidism
Severe Hyperparathyroidism
Refractory Hiperparathyroidism
Changes in the PTH Response to Calcium with the Progression of Secondary Hyperparathyroidism
¿ Is the Decrease of Sensitivity of the Parathyroid
Glands to Calcium “ Clinically Relevant” ?
70
60
50
40
30
20
10
0
PT
H (
%)
Ionized Ca (mmol/L)
1 1.1 1.2 1.3 1.4 1.5 1.6
Set point
0
Increments in “Non Suppressible”
PTH Secretion Due toGland Growth

Parathyroid Gland Response to Calcium Changes in CKD 5
PT
H (p
g /
ml)
COSMOS Study: 4600 patients / 20 Countries
PTH Response to Calcium Changes in CKD 5
Progression of CKD-MBDSeverely Affectthe Response
of the Parathyroid Glands
95%
IC P
TH
>1210.5-11
9.5-108-9
6-7
JL Fernández et al , ERA-EDTA, Stocholm, 2008
Serum Calcium (mg/dL)
of the Parathyroid Glandsto Calcium
Serum Calcium May Influence Outcomes in Dialysis Patients

• Multi-centre, Open Cohort and Observational Study.
• Prospective: 3-year of follow-up.
• European Focused (20 countries)
• Size of the Sample: 4,500 HD Patients from 227 CentresSpread Geographically (medium-large
COSMOS: Una Fotografía delEscenario Europeo en CKD-MBD
CentresSpread Geographically (medium-large hospitals and satellite units)
• Sites and Patients (±20 per centre) Randomly selected
Oviedo

PT
H (p
g /
ml)
Parathyroid Gland Response to Calcium Changes in CKD 5
COSMOS Study: 4600 patients / 21 Countries
Calcimimetics Can Improve the Poor Response of the
Parathyroid Glands to CalciumIncreasing the Sensivity
of CaSR to Calcium
95%
IC P
TH
Serum Calcium (mg/dL)
>1210.5-11
9.5-108-9
6-7
JL Fernández et al , ERA-EDTA, 2007
of CaSR to Calcium

DNA
mRNA
mRNA
preproPTH
PTH
Transcription
Translation
Calcimimetics Reduce PTH Synthesis Calcimimetics
Decrease Cell Proliferation
% Reduction in SizePTHDegradation
Consequences of the Action of Calcimimetics
Calcimimetics Upregulate CaSR and VDR–Interaction and Cooperation- < 500 mm3 > 500 mm3
60%
110
100
90
80
70
60
50
40
PT
H (
%)
Improvement in the Parathyroid Response
“Set Point” Shift to the Left
Hiperparatiroidismo moderado
Effect of Calcimimetics
40
30
20
10
0
Ionized Ca (mmol/L)
1 1.1 1.2 1.3 1.4 1.5 1.60

110
100
90
80
70
60
50
40
PT
H (
%)
Improvement in the Parathyroid Response
“Set Point” Shift to the Left
Hiperparatiroidismo moderado
Effect of Calcimimetics
40
30
20
10
0
Ionized Ca (mmol/L)
1 1.1 1.2 1.3 1.4 1.5 1.60
Curve MayBe Push
Down

Rapid Non-Genomic Response Slow Genomic Response
? Ca2+, ?IP3, ? pH, PKC
- -
1,25-(OH)2D
Membrane Receptor
VDR? Ca2+, ?IP3, ? pH, PKC
Transcription FactorCo-activators and co-represors- -
1,25-(OH)2D
VDR
Cell membrane
CITOPLASM CITOPLASM
2 Messanger
Effects of VDR Activation
- -
VDRE
ARNm ARNm
Co-activators and co-represors- -
VDREVDRE
ARNm ARNm
Nuclear membrane
Protein Protein
NÚCLEUS NÚCLEUSTranscription Transcription

? Ca2+, ?IP3, ? pH, PKC
- -
1,25-(OH)2D
Membrane Receptor
VDR? Ca2+, ?IP3, ? pH, PKC
Transcription FactorCo-activators and co-represors- -
1,25-(OH)2D
VDR
Cell membrane
CITOPLASMA CITOPLASM
2 MessangerOsteopontin OsteocalcinRANK-L VDR
Proteins Regulated by VDR Activation
Cbf1 BMP-2 PTH Collagen 1α hydroxilase Renin
Down Regulated
Slow Genomic Response
Effects of VDR Activation
- -
VDRE
ARNm ARNm
Co-activators and co-represors- -
VDREVDRE
ARNm ARNm
Nuclear membrane
Proteina Protein
NÚCLEO NÚCLEUSTranscription Transcription
Multiple Proteins are Regulated by VDR Activation
VDR 24-hydroxilase Calbindin TRPV5-6 IL-10, IL-4Insulin p-21, p-27
Up Regulated
Renin IFN-γIL-Iβ, IL-2, -6, -12 Ciclin E Gen C-myc

� Parathyroid Glands
� Kidney� Bone
� Intestine� Bone and Mineral � Cardiovascular System
� Myocardial Structure� Myocardial Function� Vascular System
- Arterial Pressure- Vascular Function
� Immune System
Effects of VDR Activation
� Immune System -Infections-
� Inflammatory Response� Skin � Muscular System� Antiproliferative effect
-Cancer-� Renoprotection
Survival

1,5No vitamin D
Relaytive Risk (RR)
The Better Results Were
Obtained With Dose < 1 mcg/day
CORES
VDR Activation and Survival
1
0,75
No vitamin D
0,50
0,25
0,54 (0,46-0,63)
< 0.25ug/d(n=1.304)
0.25-0,50µg/d(n=1.053)
> 0.50-1 µg/d(n=432)
0,60 (0,51-0,72)0,66 (0,51-0,85)
> 1 µg/d(n=184)
0,74 (0,52-1,05)
Obtained With Dose < 1 mcg/day
Vitamin D
Benefits of Oral Active VDR Activators on Survival

Main Factors Influencing the VDR Response
� Adequate VDR Expression
Mechanisms of CKD-MBD:New Insights in the Pathogenesis
� Optimal Concentration of VDR Activator

DNA
mRNA
mRNA
Storage
Transcription
Translation
TranscriptionCalcitriolDeficit
VDR Expression in CKD
No Inhibition of PTHGene Transcription
preproPTH
PTH
StorageTranslation
Degradation
VDR
Decreased Expression of VDR
Secretion
Increase mRNA PTH
Synthesis
Transcriptional

DNA
mRNA
mRNA
Storage
Transcription
Translation
Administration of Calcitriol
218,7±42,6*
100,0
50
100
150
200
250
300
mR
NA
VD
R/1
8s (
%) Expression
of VDRInhibition of PTHGene Transcription
Normalize Serum Calcitriol Levels
VDR Expression in CKD
Cooperation Between VDR & CaSR
Reduce preproPTH
PTH
StorageTranslation
DegradationParathyroid Glands Culture
0
50
Control Calcitriol 10-8M
Reduce PTH
Synthesis212,8±39,9
*
100,0
0
50
100
150
200
250
300
Control Calcitriol 10-8M
mR
NA
CaR
/18s
(%
) Expressionof CaSR

Main Factors Influencing the VDR Response
� Adequate Concentration of VDR
Mechanisms of CKD-MBD:New Insights in the Pathogenesis
� Optimal Concentration of VDR Activator

50
40
30
1,25D
60
70
80
90
100
Pat
ien
ts W
ith
Ele
vate
d P
TH
(%
)*CKD Stage 2 Stage 3
Cal
citr
iol
2D3
(pg
/mL
)
Stage 4●●●●
●●●●●●●●
●●●●
●●●●
Lower range of 1,25D
� Optimal Concentration of VDR Activator -CALCITRIOL- ?
A Levin et al KI 2007
GFR (mL/min/1.73 m2)
20
10
0105 95 7585 65 45 35 1555 25
10
20
30
4050
Pat
ien
ts W
ith
Ele
vate
d P
TH
(%
)*
Cal
citr
iol
1,25
(OH
) 2
●●●●
●●●●●●●●
●●●●
●●●●
Why and Whenthe Calcitriol
Reduction Start in CKD ?
of 1,25D

50
40
30
1,25D
60
70
80
90
100
Pat
ien
ts W
ith
Ele
vate
d P
TH
(%
)*CKD Stage 2 Stage 3
Cal
citr
iol
2D3
(pg
/mL
)
Stage 4●●●●
●●●●●●●●
●●●●
●●●●
Lower range of 1,25D ?
Serum Calcitriol Levels inEarly CKD
A Levin et al KI 2007
GFR (mL/min/1.73 m2)
20
10
0105 95 7585 65 45 35 1555 25
10
20
30
4050
Pat
ien
ts W
ith
Ele
vate
d P
TH
(%
)*
Cal
citr
iol
1,25
(OH
) 2
●●●●
●●●●●●●●
●●●●
●●●●
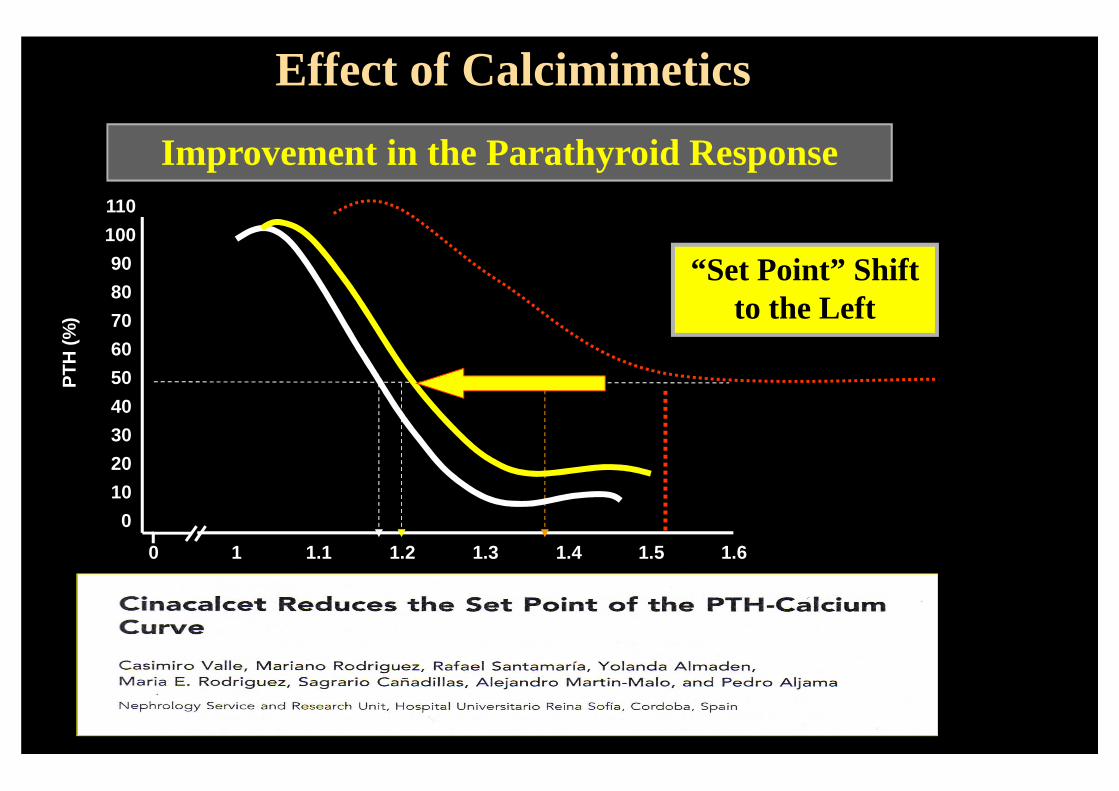
Posible Effect of Early Increase of FGF23 in CKD
of 1,25D ?
Why and Whenthe Calcitriol
Reduction Start in CKD ?
PTHUrinary P
PTH
(+)
(-)
Calcitriol Phoshorus
Calcium
(-)(+)
FGF 23 (-) (-) 1 alpha Hydroxylase
(+) 24,25 alpha Hydroxilase

PTHUrinary P
PTH
(+)
(-)
(+)
Consequence
Calcitriol Phoshorus
Calcium
(-)(+)
FGF 23 (-) (-) 1 alpha Hydroxylase
(+) 24,25 alpha Hydroxilase
?

50
40
30
1,25D
60
70
80
90
100
Pat
ien
ts W
ith
Ele
vate
d P
TH
(%
)*CKD Stage 2 Stage 3
Cal
citr
iol
2D3
(pg
/mL
)
Stage 4●●●●
●●●●●●●●
●●●●
●●●●
Lower range of 1,25D
Serum Calcitriol Levels inEarly CKD
GFR (mL/min/1.73 m2)
20
10
0105 95 7585 65 45 35 1555 25
10
20
30
4050
Pat
ien
ts W
ith
Ele
vate
d P
TH
(%
)*
Cal
citr
iol
1,25
(OH
) 2
●●●●
●●●●●●●●
●●●●
●●●●
of 1,25D
FGF 23 Through its Capacity to Reduce CalcitriolCould Be an Important Indirect Factor “Early” Involved in the Pathogenesis of Secondary Hyperparathyroidism

Indirect Factor ?
PTH ?2007
control
(-)
(-)(+)
FGF 23
Calcitriol Phosphorus
Calcium
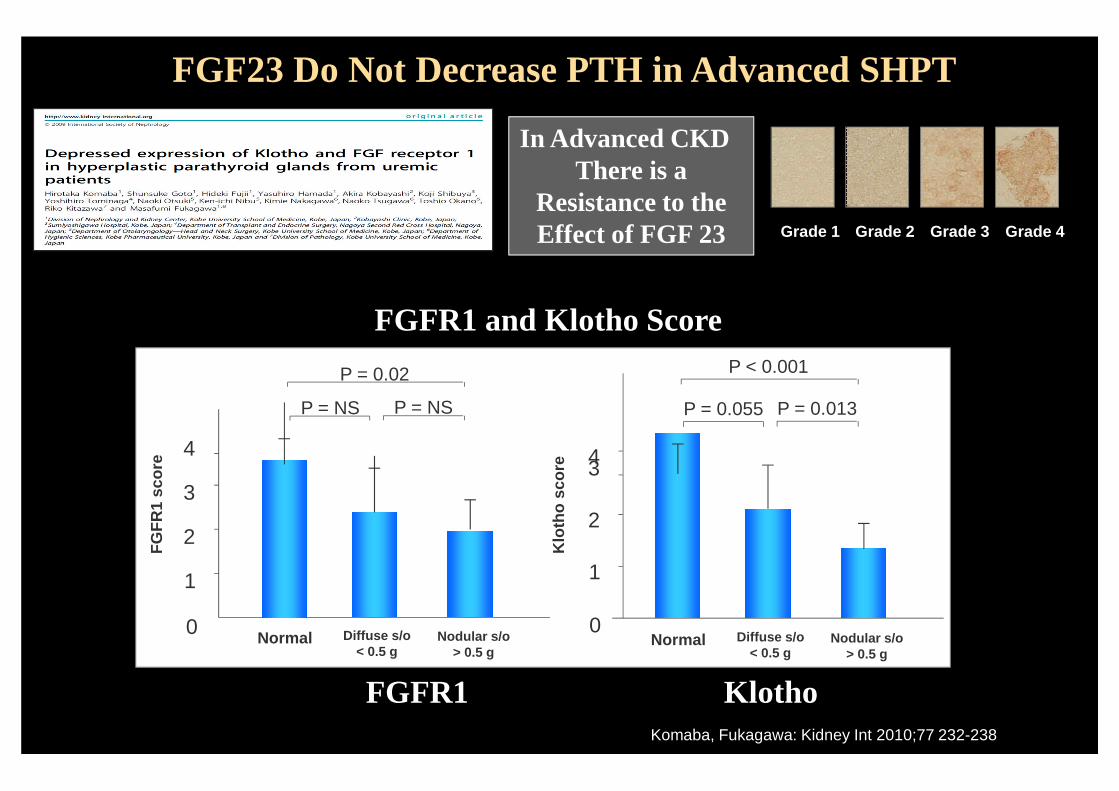
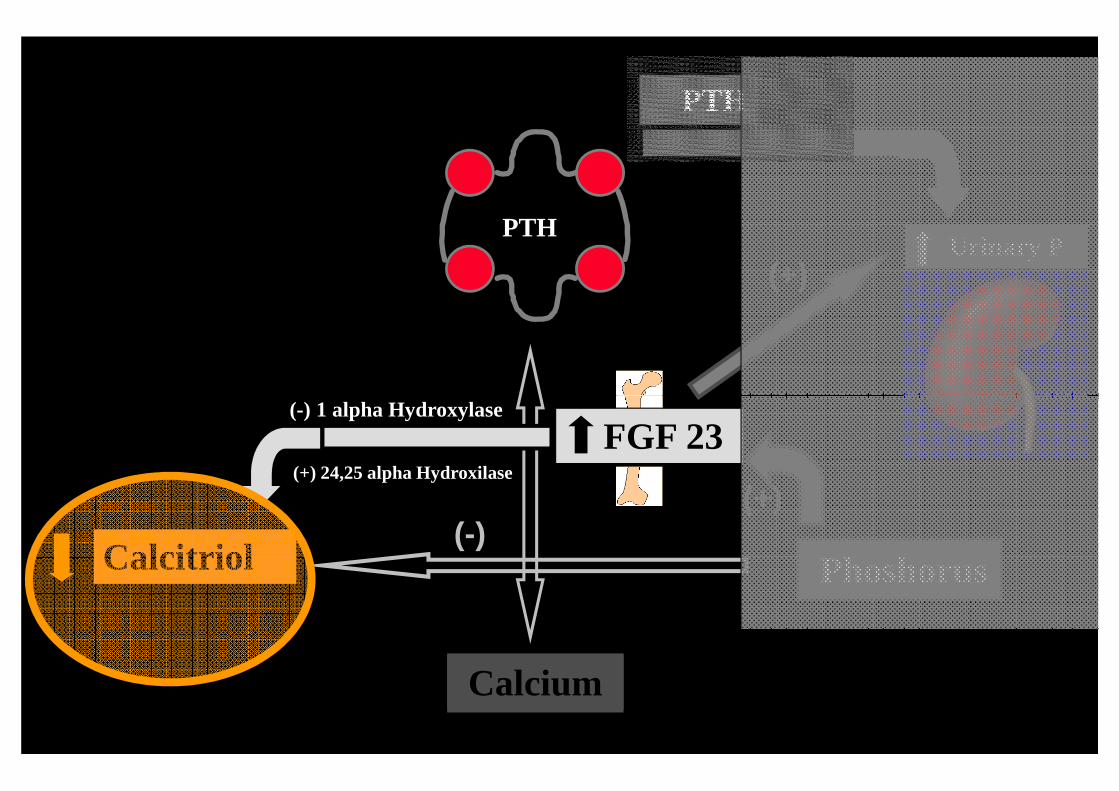
P < 0.001P = 0.02
FGFR1 and Klotho Score
Grade 4Grade 3Grade 2Grade 1
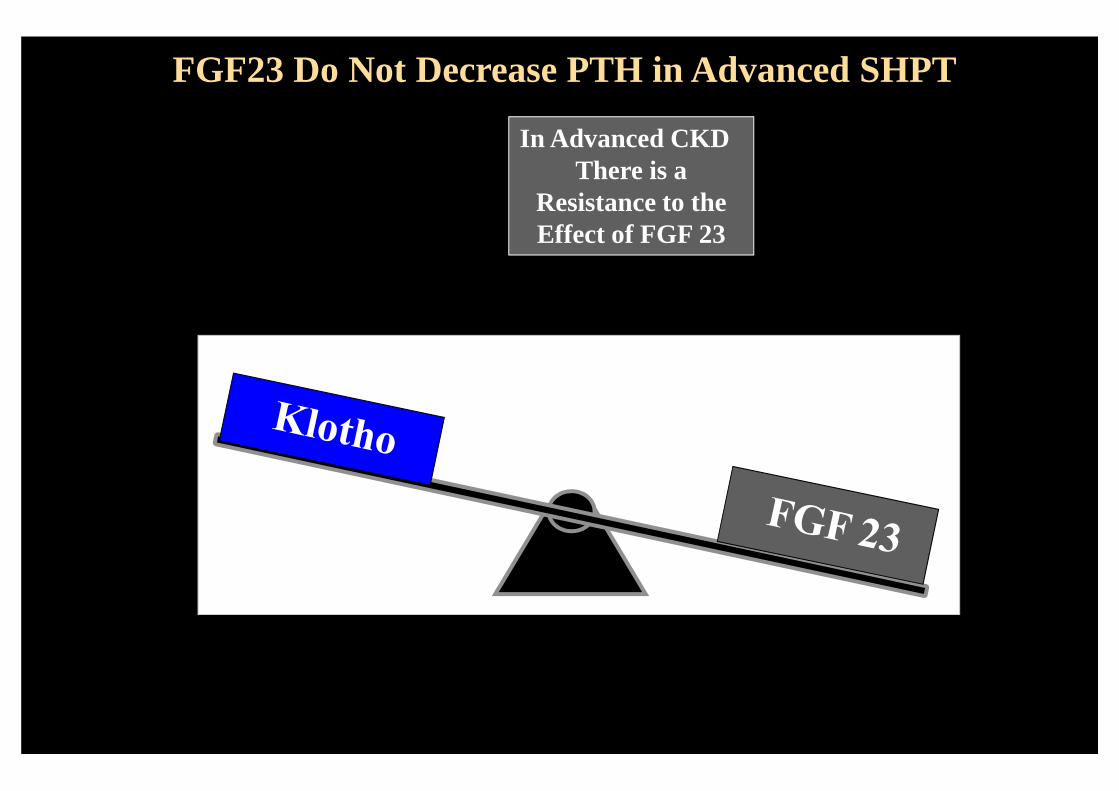
FGF23 Do Not Decrease PTH in Advanced SHPT
In Advanced CKD There is a
Resistance to theEffect of FGF 23
43
2
0
P = 0.055
Normal Nodular s/o> 0.5 g
Klo
tho
sco
re1
P = 0.013
Diffuse s/o< 0.5 g
4
3
2
0
P = NS
Normal Nodular s/o> 0.5 g
FG
FR
1 sc
ore
1
P = NS
Diffuse s/o< 0.5 g
Komaba, Fukagawa: Kidney Int 2010;77 232-238
FGFR1 Klotho
FGF23 Do Not Decrease PTH in Advanced SHPT
In Advanced CKD There is a
Resistance to theEffect of FGF 23

PTHLast Decade Phosphorus
Have Increased itsImportance in PTH
Regulation and CKD-MBD
Mechanisms of CKD-MBD:New Insights in the Pathogenesis
Calcitriol Phosphorus
Calcium
Regulation and CKD-MBD

Outcomes
• Vascular Calcifications
• Lack of Response to Vit D Metabolites
• Increased Mortality
Ngative Effects of Phosphorus
2012: Combination/Association of • Increased Mortality
• Decrease in Cortical Bone*
• Decrease in Bone Mass*
• Decrease in Bone Strength*
• Pro-Inflamatory
• Pro-Ageing Element
Makoto Kuro-O. Avances en Metabolismo Óseo y Mineral, Edited by JB Cannata-Andía y col, 2010
Association of Effects of
Phosphorus& FGF 23

Na-Pi 2aNa-Pi 2c
Proximal Kidney Tubule Cells
PTH
Mechanisms of CKD-MBD:New Insights in the Pathogenesis
Klo
tho
FGF-R
Calcitriol Phosphorus
Calcium25(OH)D
(-)
(-)(+)
FGF 23
FGF-23

PTHUrinary
Phosphate
PTH
(+)
UrinaryPhosphate
Calcitriol Phosphorus
Calcium25(OH)D
(-)
(-)(+)
FGF 23

PTHUrinary
Phosphate
PTH
(+)
¿ Cuáles son las Sinergias Entre Fósforo, FGF 23,Kotho y Vitamina D ?
0
mm
ol/L
Creatinine Clearance
0.75
1.00
1.25
1.50
Phosphorus0.50
UrinaryPhosphate
Calcitriol Phosphorus
Calcium25(OH)D
(-)
(-)(+)
FGF 23 (-)
(-)1 alpha Hydroxylase
(+) 24,25 alpha Hydroxilase5 Mechanisms

DNA
mRNA
mRNA
Storage
Transcription
Translation
High Phosphorus
Increases PTH Synthesis
Effect of Phosphorus on the Parathyroid Glands in CKD
preproPTH
PTH
StorageTranslation
Degradation
Silver et al, 2000-2002
Secretion
Post -transcriptional
High PhosphorusIncreases the Stability
of PTH mRNA

Decrease CaSR Expression
Effect of Phosphorus in Cell Proliferation and CaSR
THE HIGHER THE PHOSPHORUS CONCENTRATION
• THE GREATER THE DIRECT STIMULATION OF PTH SYNTHES IS
Increase Cell Proliferation
Brown AJ. Kidney Int 55:1284Brown AJ. Kidney Int 55:1284--1292, 19991292, 1999
• THE GREATER THE DIRECT STIMULATION OF PTH SYNTHES ISTHE GREATER THE CELL PROLIFERATION (Gland Grow th)
AND THE LOWER THE CaSR EXPRESSION
¿ Is the Effect of High Serum Phosphorus on the Parathyroid Glands “Clinically Relevant” ?

High Serum Phosphorus and PTH in CKD 5 Patients
PT
H (p
g /
ml) 600
500
400
Serum Ca (mg/dL)
> 1210.5-11
9.5-108-9
6-7
95%
IC P
TH
>109-9.9
8-8.97-7.9
6-6.95-5.9
4-4.93-3.9
1-2.9
300
200
100
Serum P (mg / dl)
JL Fernández et al , ERA-EDTA, 2007

PT
H (p
g /
ml) 600
500
400
Serum Phosphorus is the Strongest Factor
Associated to PTH
High Serum Phosphorus and PTH in CKD 5 Patients
95%
IC P
TH
>109-9.9
8-8.97-7.9
6-6.95-5.9
4-4.93-3.9
1-2.9
300
200
100
Serum P (mg / dl)
Associated to PTH Levels in CKD 5
Serum Phosphorus May Influence Outcomes in Dialysis Patients
JL Fernández et al , ERA-EDTA, 2007

PTH
FGF23/Klotho
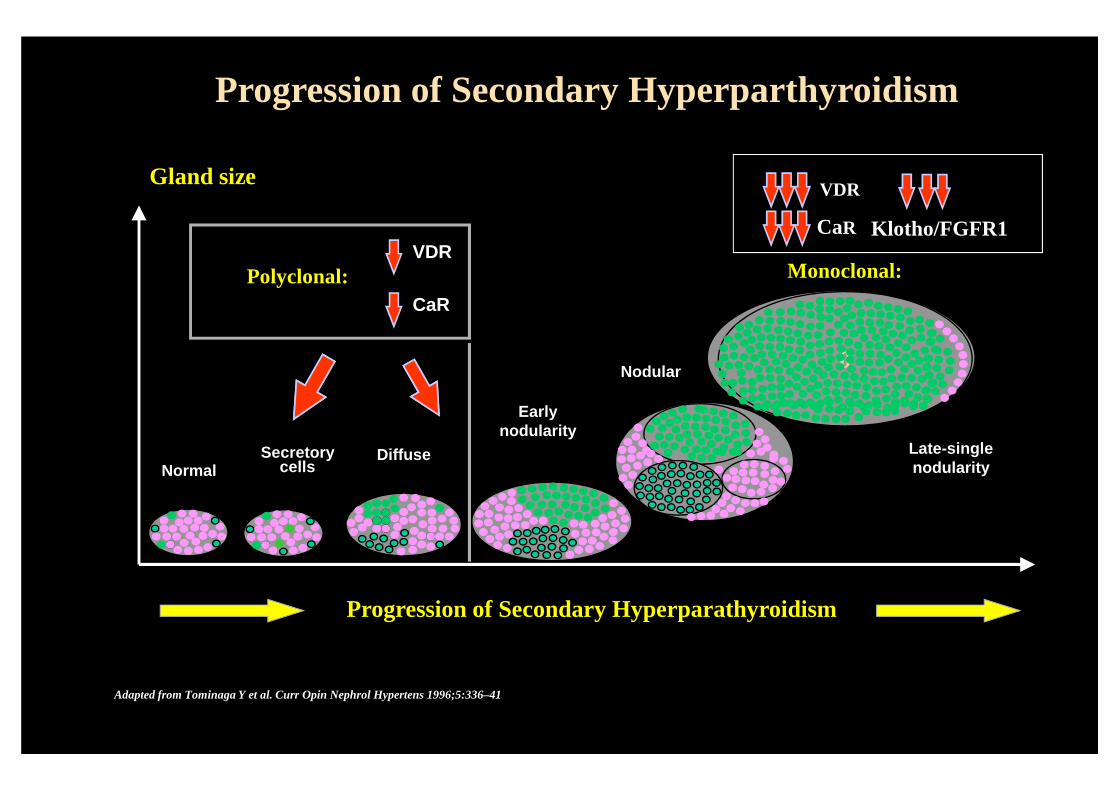
Progression of Secondary Hyperparthyroidism
Calcitriol Phosphorus
25(OH)D
Cannata –Andía JBy Rodriguez M.. Nefrología Clínica . Ed L Hernando, 2008,
Calcium
VDR
CaRPolyclonal:
Gland size
Progression of Secondary Hyperparthyroidism
0Nodular
Monoclonal:
VDR
CaR Klotho/FGFR1
NormalDiffuseSecretory
cells
Adapted from Tominaga Y et al. Curr Opin Nephrol Hypertens 1996;5:336–41
Progression of Secondary Hyperparathyroidism
Earlynodularity
Late-singlenodularity

VDR
CaRPolyclonal:
0Nodular
Monoclonal:VDR
CaR• Severe Molecular Changes
• Genomic Alterations
Progression of Secondary Hyperparthyroidism
NormalDiffuseSecretory
cells
Adapted from Tominaga Y et al. Curr Opin Nephrol Hypertens 1996;5:336–41
Progresión del Hiperparatiroidismo Secundario
Earlynodularity
Late-singlenodularity

VDR
CaRPolyclonal:
0Nodular
Monoclonal:VDR
CaRDuplicationsLosses
Losses & Duplications ofChromosomes
J Cigudosa , I Santamaría , J Cannata et al
Parathyroid Tissue from Severe 2ª & 3ª Hyperparathyroidism
Progression of Secondary Hyperparthyroidism
NormalDiffuseSecretory
cells
Progresión del Hiperparatiroidismo Secundario
Earlynodularity
Late-singlenodularity
Adapted from Tominaga Y et al. Curr Opin Nephrol Hypertens 1996;5:336–41
J Cigudosa , I Santamaría , J Cannata et alKidney Int 2003: 63,
Changes inGene Expression
Con
trol
Difu
sas
Nod
ular
esC
ontro
lD
ifusa
sN
odul
ares
I Santamaría et al Kidney Int, 2005.
GeneRepression

VDR
CaRPolyclonal:
0Nodular
Monoclonal:VDR
CaR
Calcificaciones Vasculares
•Mala Evolución Clínica
The Parathyroid Glands
Progresively Loose its
Complex and
Progression of Secondary Hyperparthyroidism
Just Produce
PTHNormal
DiffuseSecretorycells
Adapted from Tominaga Y et al. Curr Opin Nephrol Hypertens 1996;5:336–41
Progresión del Hiperparatiroidismo Secundario
Earlynodularity
Late-singlenodularity
Calcificaciones Vasculares
MortalidadFracturasPTH
Exquisite Regulatory
Leadership Role
PTH

• Role of Classic and New Players in the Pathogenesis of Secondary Hyperparathyroidism and CKD-MBRole of * Calcium (Calcimimetics)
* Vitamin D Receptor Activators (VDRAs)* Phosphorus and FGF 23
Mechanisms of CKD-MBD:New Insights in the Pathogenesis
* Phosphorus and FGF 23* Genomic & Molecular Changes in the Severe and
Refractory Secondary Hyperparathyroidism
• The Links Between the Bone and Vascular Axis in CKD-MBD. Role of Phosphate in the Pathogenesis of Vascular Mineralizationand Bone Demineralization. Possible Self-defensive Mechanisms Triggered by the Vascular System

HIGHBONE
TURNOVER
Current
EvolutionHigh PTH
Patterns of Renal Osteodystrophy
CKD
MEDICALMANAGEMENT
DIABETES - AGE
LOWBONE
TURNOVER

Moriniere et al, 1989 (France) 76 % 24 %Lorenzo et al, 1991 (Spain) 71% 25 %Sherrard et al, 1993 (USA) 48 % 37 %
Change in the Prevalence of High and Low Bone Turnover Disease in CKD5
Low Bone Turnover
High Bone Turnover
1/43/4
Sherrard et al, 1993 (USA) 48 % 37 %Herz et al, 1993 (USA) 50 % 50 %Torres et al, 1995 (Spain) 52 % 45 %Ferreira et al 2008 (Portugal) 32% 63%
Erkan, Gulay et al 2009(Turkey) 23% 73%
1/4 3/4

High Bone Turnover Low Bone Turnover
Common Risks
Risks of High and Low Bone Turnover
Vascular Calcifications
MortalityBone MassFractures

J Am Soc Nephrol 15: 1943-1951,2004
Bone TurnoverCKD
Relationship Between Vascular Calcification & Bone
High Calcification Scores in the Aorta
Low Bone Activity

Coronary Calcification is Associated with Lower Mineralized Bone Volume
CKD
Relationship Between Vascular Calcification & Bone
Coronary Calcification
Low Mineralized Bone
High Pulse Wave Velocity
10
20
30
%
10
20
30
%
Pulse Wave Velocity
> 9.4≤≤≤≤ 9.4> 400≤≤≤≤ 400
p=0.03 p=0.02
Min
eral
ized
bo
ne
volu
me
Min
eral
ized
bo
ne
volu
me
Coronary Agatston score

Relationship Between Vessels & Bone
General Population
CKD

Relationship Between Vessels & Bone
Osteoporos Int 19: 1161-1166, 2008
4 Years Follow up
General Population
General Population
4 Years Follow up

From Patient to Bench
Relationship Between Vascular Calcification & Bone
CKD
General Population
Osteoporos Int 19: 1161-1166, 2008
?

Week4
Week8
Week16
Week20
Week0
Week12
N 5/6
Scheme of the Study
Relationship Between Vascular Calcification & Bone
4 8 16 200Normal (n=10) High P (n=10)
Control (n=10)High P (n=10)Control (n=10)
High P (n=10)Control (n=10)
High P (n=10)Control (n=10)Normal (n=10)
12High P (n=10)Control (n=10)
Aorta
Bone
Macroscopic
Histologic
Genomics
Proteomics
High P
High Mortality50% Vs 10%

Aortic Calcification (20 weeks)
20%NO Aortic
Calcification (20 weeks)
High PhosphorusDiet (+ 50%)
Relationship Between Vascular Calcification & Bone
High PhosphorusDiet (+ 50%)
80%
Román-García et al. Bone 2010:46; 121-128.

Bone Histology
20%
Relationship Between Vascular Calcification & Bone
80%
Román-García et al. Bone 2010:46; 121-128.
VascularCalcification
Bone
No VascularCalcification
Bone

Week4
Week8
Week16
Week20
Week0
Week12
N 5/6
Scheme of the Study
Relationship Between Vascular Calcification & Bone
4 8 16 200Normal (n=10) High P (n=10)
Control (n=10)High P (n=10)Control (n=10)
High P (n=10)Control (n=10)
High P (n=10)Control (n=10)Normal (n=10)
12High P (n=10)Control (n=10)
Aorta
Bone
Macroscopic
Histologic
Genomics
Proteomics

Elastin
-1
-0,5
0
0,5
FC 8NP FC 16NP FC 20NP FC 8HP FC 16HP FC 20HP
Fo
ld C
han
ge
Elastin
Muscle Related GenesMuscle Related Genes
No CalcificationRed: Overexpression
Calcification
Gene
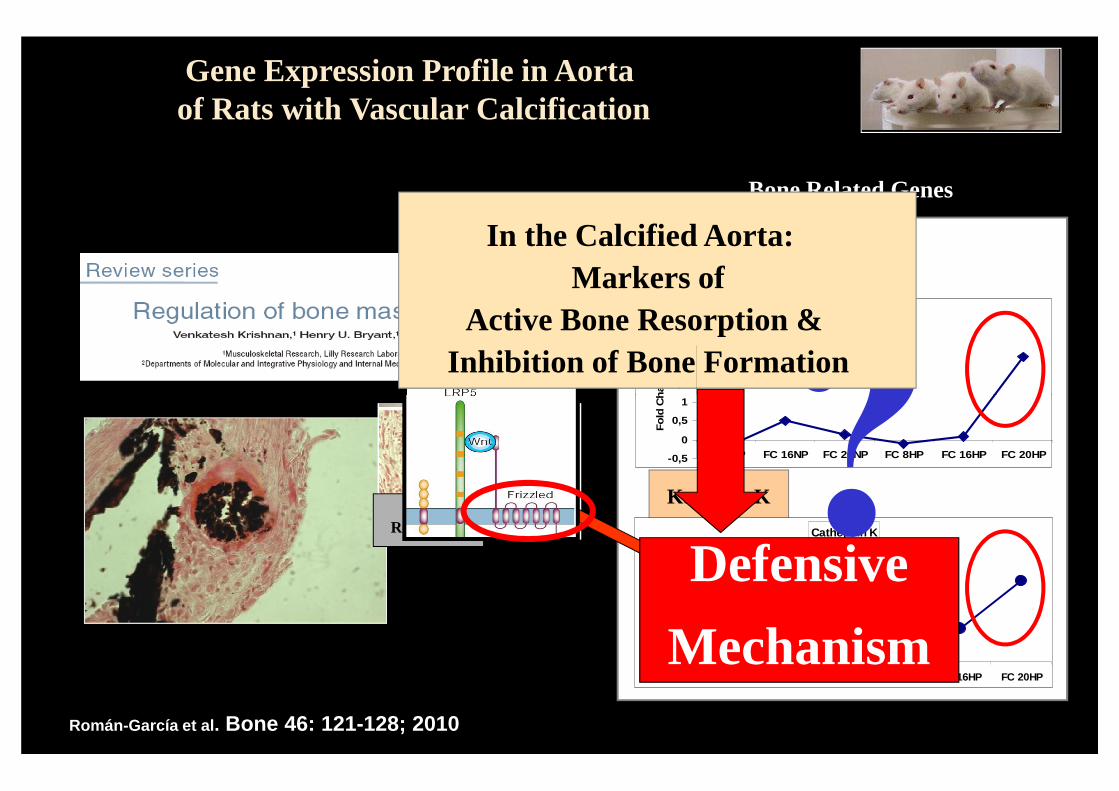
Gene Expression Profile in Aorta of Rats with Vascular Calcification
Tropomyosin, Alpha 1
-2
-1,5
-1
-0,5
0
0,5
FC 8NP FC 16NP FC 20NP FC 8HP FC 16HP FC 20HP
Fo
ld C
han
ge
Tropomyosin Alpha 1
-2
-1,5
-1
Fo
ld C
han
ge
-1.5 +1.5
Signal LogRatioGreen: Repression
Gene
Román-García et al . Bone 46: 121-128; 2010

Red: Overexpression
Bone Related Genes
RED: Overexpression
CalcificationNo
Calcification
Gene
Muscle Related Genes
No CalcificationCalcification
Gene Expression Profile in Aorta of Rats with Vascular Calcification
-1.5 +1.5
Signal LogRatioGreen: Repression
-1.5 +1.5
Signal LogRatioGreen: Repression
Gene
Román-García et al . Bone 46: 121-128; 2010

SFRP-1
1,5
2
2,5
Fo
ld C
han
ge
SRFP 4 (Wnt)
Bone Related GenesBone Related Genes
RED: Overexpression
CalcificationNo
Calcification
Gene Expression Profile in Aorta of Rats with Vascular Calcification
Katepsin K
Cathepsin K
0
0,5
1
1,5
2
FC 8NP FC 16NP FC 20NP FC 8HP FC 16HP FC 20HP
Fo
ld C
han
ge
-0,5
0
0,5
1
FC 8NP FC 16NP FC 20NP FC 8HP FC 16HP FC 20HP
Fo
ld C
han
ge
-1.5 +1.5
Signal LogRatioGreen: Repression
Román-García et al . Bone 46: 121-128; 2010
Bone Related Genes
SFRP-1
1,5
2
2,5
Fo
ld C
han
ge
SRFP 4 (Wnt)
Gene Expression Profile in Aorta of Rats with Vascular Calcification
?In the Calcified Aorta:
Markers ofActive Bone Resorption &
Inhibition of Bone Formation
Katepsin K
Cathepsin K
0
0,5
1
1,5
2
FC 8NP FC 16NP FC 20NP FC 8HP FC 16HP FC 20HP
Fo
ld C
han
ge
-0,5
0
0,5
1
FC 8NP FC 16NP FC 20NP FC 8HP FC 16HP FC 20HP
Fo
ld C
han
ge
Román-García et al . Bone 46: 121-128; 2010
Bone Resorption
?
Defensive
Mechanism

?
SFRPs
Dkk 1
Aorta
Wnt and BMP Inhibition
Vessels: Reduce or Stop Vascular Mineralization
Price to Pay ?
Relationship Between Vascular Calcification & Bone
Which is Molecular the Link ?
GremlinBone: Decrease Bone
Mineralization
and Bone Mass