Mechanism of Flexural Toppling Failure of Rock · PDF fileMechanism of Flexural Toppling...
36
Mechanism of Flexural Toppling Failure of Rock Slopes Civil Engineer Project Jesús José Díaz Jurado Senior Scientist: Vincent Labiouse Laboratory Manager: Laurent Gastaldo Doctoral Assistant: Luis Felipe Orellana Spring 2014 Rock Mechanics Laboratory LMR Fig. 1 Flexural Toppling at Clear Creek in the Granite Gorge of the Grand Canyon (Rogers, 1978)
Transcript of Mechanism of Flexural Toppling Failure of Rock · PDF fileMechanism of Flexural Toppling...

Mechanism of Flexural Toppling Failure of Rock Slopes
Civil Engineer Project
Jesús José Díaz Jurado
Senior Scientist: Vincent Labiouse
Laboratory Manager: Laurent Gastaldo
Doctoral Assistant: Luis Felipe Orellana
Spring 2014
Rock Mechanics
Laboratory
LMR
Fig. 1 Flexural Toppling at Clear Creek in the Granite Gorge of the Grand Canyon (Rogers, 1978)

Mechanism of Flexural Toppling Failure of Rock Slopes
1
Index
Index ............................................................................................................................ 1
Table of illustrations ................................................................................................... 3
1 Introduction .............................................................................................................. 5
2 Theoretical approach ............................................................................................... 6
2.1 Introduction ....................................................................................................... 6
2.2 Types of toppling failure ................................................................................... 6
2.2.1 Block toppling ............................................................................................. 6
2.2.2 Flexural toppling ......................................................................................... 7
2.2.3 Block-flexure toppling ................................................................................ 7
2.2.4 Secondary toppling models ....................................................................... 7
2.3 Stability analysis for flexural toppling ............................................................. 7
3 Laboratory tests description ................................................................................... 9
3.1 Objective ............................................................................................................ 9
3.2 Methodology ...................................................................................................... 9
3.3 Hypothesis ....................................................................................................... 10
3.4 Material and equipment used ......................................................................... 10
3.4.1 Base friction machine ............................................................................... 10
3.4.2 Rock mass model ..................................................................................... 12
3.5 Development of tests ...................................................................................... 12
3.5.1 Mixture compression ................................................................................ 12
3.5.2 Remove from the mold and placing the mixture in the friction machine.
............................................................................................................................ 12
3.5.3 Columns and slope cutting for the model. .............................................. 13
3.6 Planning and optimization of the tests ....................................................... 14
4 Experimental analysis ........................................................................................... 16
4.1 Development of the tests ................................................................................ 16
4.1.1 Test 1 ......................................................................................................... 17
4.1.2 Test 2 ......................................................................................................... 18
4.1.3 Test 3 ......................................................................................................... 19
4.1.4 Test 4 ......................................................................................................... 20
4.1.5 Test 5 ......................................................................................................... 21
4.1.6 Test 6 ......................................................................................................... 23
4.1.7Test 7 .......................................................................................................... 24
4.1.8 Test 8 ......................................................................................................... 25
4.1.9 Test 5.1 ...................................................................................................... 26
4.1.10 Test 5.2 .................................................................................................... 27

Spring 2014
2
4.2 Presentation of calculus and results ............................................................. 29
4.2.1 Hcr parameter ............................................................................................. 29
4.2.2 Obtaining the Hcr for each test ................................................................. 30
4.2.3 Analyzes of results ................................................................................... 31
5 Limits of model and improvements ...................................................................... 32
5.1 Engine of the machine .................................................................................... 32
5.2 Mold size .......................................................................................................... 32
6 Conclusion ............................................................................................................. 33
7 Biography ............................................................................................................... 34
8 Annex...................................................................................................................... 35

Mechanism of Flexural Toppling Failure of Rock Slopes
3
Table of illustrations
Fig. 1: Flexural Toppling at Clear Creek in the Granite George of the Gran Canyon
(Roger, 1978) ............................................................................................................... 0
Fig. 2: Suggested toppling mechanims of the north face of Vaiont slide (Muller,
1968) ............................................................................................................................ 6
Fig. 3: Principal toppling failures (Wyllie & Mah, 2004) ............................................ 8
Fig. 4: Ilustration for the proposed tests ................................................................... 9
Fig. 5: Mold used for the rock mass model (Frutiger, Spring 2013) ...................... 10
Fig. 6: Base friction machine (Pritchard & Savigny, 1990) ..................................... 10
Table 1. Dimensios of the mold and frame from base friction machine ............... 11
Fig. 7: Aluminum profile for the camera fixed to the wall ...................................... 11
Fig. 8 Frame’s upper view, area where the testing model will be put ................... 11
Fig. 9: Base frictionc views (Esaki, Aikawa, Jiang, & Mitani, 1993) ....................... 11
Fig. 10 compression of the mixture (Frutiger, Spring 2013) .................................. 12
Fig. 11 Placing of the model and remove of the lower plate of mold .................... 13
Fig. 12 Procedure for cutting the rock mass model ............................................... 14
Table 2: Main test performed ................................................................................... 15
Table 3: Extra tests performed ................................................................................ 15
Fig. 13: Explanation image for the nomenclatures used in the observations ...... 16
Table 4: Parameters test 1 ........................................................................................ 17
Fig. 14: Test 1 ............................................................................................................ 17
Table 5: Parameters test 2 ........................................................................................ 18
Fig: 15: Test 2 ............................................................................................................ 18
Table 6: Parameters test 3 ........................................................................................ 19
Fig. 16: Test 3 ............................................................................................................ 19
Table 7: Parameters test 4 ........................................................................................ 20
Fig. 17: Test 4 ............................................................................................................ 20
Table 8: Parameters test 5 ........................................................................................ 21
Fig. 18: Test 5 ............................................................................................................ 21
Table 9: Result of the settlements from test 5 ........................................................ 22
Table 10: Parameters test 6 ...................................................................................... 23
Fig. 19: Test 6 ............................................................................................................ 23
Table 11: Parameters test 7 ...................................................................................... 24
Fig. 20: Test 7 ............................................................................................................ 24
Table 12: Parameters test 8 ...................................................................................... 25
Fig. 21: Test 8 ............................................................................................................ 25
Table 13: Parameters test 5.1 ................................................................................... 26

Spring 2014
4
Fig. 22: Test 5.1 ......................................................................................................... 26
Table 14: Parameters test 5.2 ................................................................................... 29
Fig. 23: Test 5.2 ......................................................................................................... 29
Table 15: Results of the settlements from test 5.2 ................................................ 30
Fig. 24: Design chart for joint friction angle of 35° (Adhikary, Dyskin, Jewell, &
Steward, 1997) ........................................................................................................... 31
Fig. 25: Design charts for joint friction angle of 35° used for the different
developed tests (Adhikary, Dyskin, Jewell & Stewart, 1997) ................................. 30
Table 16: Hcr values according to the design chart for a 35° joint friction angle of
professor Adhikary fro all test performed ............................................................... 32
Table 17: Tensile strength (σt) values obtained from tests with toppling
development, test 5 and 5.2 ..................................................................................... 31
Table 18: Security factor achieved during each test .............................................. 31
Table 19: H values needed to have had obtained flexural toppling development
for each test ............................................................................................................ 322

Mechanism of Flexural Toppling Failure of Rock Slopes
5
1 Introduction
This report its part of the subject “Projet Génie Civil” (Civil Engineer Project) of
the career; during the spring semester and under the supervision of Ph.D. Vincent
Labiouse, Luis Felipe Orellana and Laurent Gastaldo. The main objective of this
research is to learn more about the conditions for flexural toppling of rock slopes
by the simulation of different cases, using for it the friction base machine of
Goodman.
As starting point it is taken the investigation done by professor Adhikary; and the
older research about flexural toppling done by the students of the same subject
“Projet Génie Civil” from past years.
Christof Frutiger (spring 2013).
Buzio Guilia and Goube Mathilde (spring 2011)
Christohp Kenellwolf, Laura Vigne, Cyrilee Gattiker (winter 2007)
With the objective of continue the line of investigation that had been developed
trough years at the “École Polytechnique Fédérale de Lausanne” led by Ph.D.
Vincent Labiouse.
The mixture is the one proposed by Thibaut Meynet, which is elaborated in a 45%
of quartz sand, 45% flour and 10% of sunflower oil (Frutiger, Labiouse, Sandrone,
& Gastaldo, Spring 2013)
This document present the different found results supported on images and a CD
annexed at the end of the document, which includes videos with the complete
sequences* of pictures taken in each test. Helping in this way the lector to
comprehend easier and faster the collected information.
*Each sequence, is formed by 9 different pictures each one taken with a difference of 15 minutes: 0 min, 15
min, 30 min, 45 min, …., 120 min.
Spring 2014
6
2 Theoretical approach
2.1 Introduction
Toppling is the rotation forwards and outside a slope, of a rock or soil mass
around an axis located below its center of gravity. Destabilizing forces are the
gravity, the adjacent land and the fluids (water or ice) in the cracks (Corominas).
Rock or soil mass can be principally found in columns or block shapes, which
rotate around a fixed base during toppling. One of the earliest references about
toppling failures is by Muller (1968) who suggested that block rotation or toppling
may have been a contributory factor in the failure of the north face of the Vaiont
slide (Fig. 2) (Wyllie & Mah, 2004).
Fig. 2 Suggested toppling mechanism of the north face of Vaiont slide (Muller, 1968)
2.2 Types of toppling failure
Goodman y Bray (1976) have described a number of different types of toppling
failures that can be found in the field: block toppling, flexural toppling, block-
flexure toppling and secondary toppling models (Wyllie & Mah, 2004).
2.2.1 Block toppling
Block toppling happens when, in strong rocks, individual columns are formed by
a set of discontinuities dipping steeply into the face and a second set of widely
spaced orthogonal discontinuities that defines the columns height.
Short columns which conform the slope’s toe are pushed forward by the charges
of the columns behind beginning to collapse, and this displacement of the toe
allows to develop toppling, principally in the higher part of the slope. The base of
the failure generally consist of a stepped surface crossing from one discontinuity
to another (Fig. 3a). The typical geological conditions in which this kind of failure

Mechanism of Flexural Toppling Failure of Rock Slopes
7
happens are the bedded sandstone and basalt columns, due to their orthogonal
joints well developed (Wyllie & Mah, 2004).
2.2.2 Flexural toppling
This kind of toppling presents sets of rock columns separated and well developed,
their discontinuities are steeply dipping, breaking in flexure as they bend forward
(Fig. 3b). The typical geological conditions to reproduce this kind of failure is in
the slim layers of shale and slate because in this rocks their orthogonal joints are
not well developed. Generally the basal plane of flexural toppling there not as well
defined like in the one of block toppling (Wyllie & Mah, 2004).
2.2.3 Block-flexure toppling
One of the main characteristic about block-flexure toppling is the pseudo-
continuous flexure along of columns that are divided by numerous transversal
joints. In difference to the flexural toppling of continuous columns producing a
flexural toppling, the flexure of columns in this case results from the accumulation
of displacement in the transversal joints (Fig. 3) (Wyllie & Mah, 2004)
2.2.4 Secondary toppling models
Almost this failures start by the weakening in the slope’s toe, it could be due to
natural agents like weather (Fig. 3d), or to human activities (Wyllie & Mah, 2004).
2.3 Stability analysis for flexural toppling
Some of techniques that have been developed for the studying of the stability for
flexural toppling includes base friction models (Goodman, 1976), centrifuges
(Adhikary et al., 1997) and numerical modeling (Pritchard & Savigny, 1990, 1991).
Adhikary’s model has been used for develop graphs series which relate the
stability with the slope angle, the dip of the blocks into the face and the ratio
between the slope height to the width of the columns (Wyllie & Mah, 2004).

Spring 2014
8
Fig. 3 Principal toppling failures: a) block toppling of columns of rock containing widely spaced orthogonal
joints; b) flexural toppling of labs of rock dipping steeply into face; c) block flexure toppling characterized by
pseudo-continuous flexure of long columns through accumulated motions along numerous cross-joints; d)
toppling of columns in strong upper material due to weathering of underlying weak material (Wyllie & Mah,
2004).

Mechanism of Flexural Toppling Failure of Rock Slopes
9
3 Laboratory tests description
3.1 Objective
Analyze more deeply the mechanism of flexural toppling of rock slopes,
developing for it different laboratory test using the base friction machine model of
Goodman.
During the tests were four principal variables between each one, these variables
were: height (H), base (B), slope angle (α), angle between the columns joint and
the base (β), and the thickness of columns (bj) (Fig. 4). The bj is assumed to be
equal in all columns.
Fig. 4 Illustration for the proposed tests
3.2 Methodology
Taking as reference the research of professor Adhikary (1997) and students
Buzio Giulia and Goube Mathilde (2011) where the goal of reproduce toppling
effects was achieved; was taken the decision to select the next parameters:
Slope angle (α): 70° and 75°
Joint dip angle (β): 70° and 80°
Thickness of the columns (bj): 1.5 cm and 2cm
Compression force applied to the mixture: 40 kN and 80 kN

Spring 2014
10
For height (H) and base (B), was decided to take a
ratio H/B = 1. This was decided during a series of
experiments analyzed previous this research, being
the best option for reproduce flexural toppling
mechanism, due to reduce as much as possible the
base size (B) and the maximal height available of the
mold (Fig 5.)
3.3 Hypothesis
Expect to create flexural toppling with the parameters defined above and study
the relation between the design charts form professor Adhikary (1997) and the
flexural topping mechanism, also analyze if the angle of the basal failure plane
(θ) (Fig. 4) can be well developed as it is said on his research.
3.4 Material and equipment used
3.4.1 Base friction machine
The base friction machine of Goodman has a conveyor belt that rotates with a
constant velocity (Fig. 6) thanks to an engine localized in the under part of the
machine, producing the gravity effect over the models that are put in the frame
that is over the conveyor belt.
To obtain the sequence of images for each test, was used a digital remote control
camera hanged over an aluminum profile fixed to the wall (Fig. 7).
This kind of test are used for the analysis of the stability in rock slopes or for the
simulations of the gravity forces acting in the tunnels (Frutiger, Labiouse,
Sandrone & Gastaldo, Spring 2013).
Fig. 5 Mold used for the rock mass model (Frutiger, Spring 2013)
Fig. 6 Base friction machine (Pritchard & Savigny, 1990)

Mechanism of Flexural Toppling Failure of Rock Slopes
11
The dimensions of the mold (Fig. 5) and the frame of the base friction machine
(Fig. 8) are the next ones:
Base (B) Height (H) Thickness
Mold 46.8 cm 24.1 cm 2.5 cm
Frame 46.8 cm 48.1 cm 2.5 cm
In Fig. 9 can be observed the top, side and frontal view of base friction machine,
as the one used by Goodman.
Fig. 9 Base friction views: top a), side b) and frontal c) (Esaki, Aikawa, Jiang, & Mitani, 1993)
Fig. 8 Frame’s upper view, area where the testing model will be put
Table 1 Dimensions of the mold and frame from base friction machine
Fig. 7 Aluminum profile for the camera fixed to the wall
Spring 2014
12
3.4.2 Rock mass model
The models are the representation of a rock mass, the mixture used for develop
this tests is the one proposed by Thibaud Meynet which consist in 45% of sand,
45% of flour and 10% of sunflower oil. It must be said that the mixture is inert, for
that reason it can be reused for the next tests (Frutiger, Labiouse, Sandrone &
Gastaldo, Spring 2013).
3.5 Development of tests
The procedures described below where developed each time a new test was
performed.
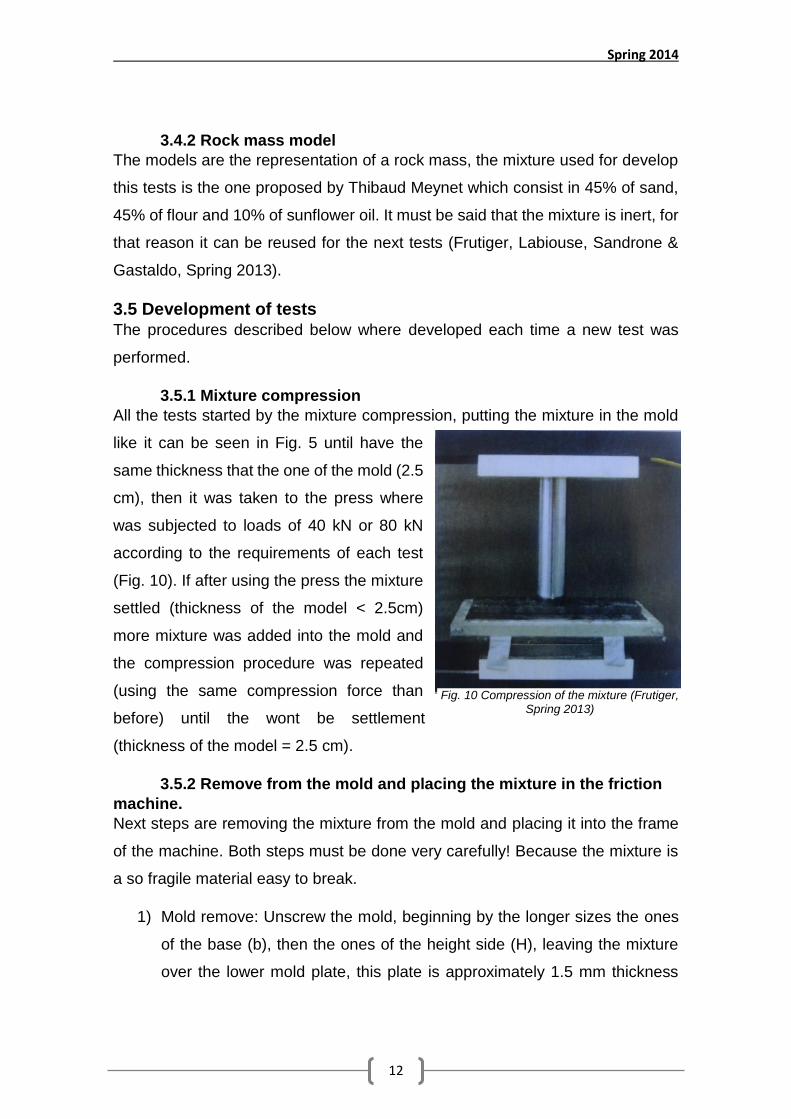
3.5.1 Mixture compression
All the tests started by the mixture compression, putting the mixture in the mold
like it can be seen in Fig. 5 until have the
same thickness that the one of the mold (2.5
cm), then it was taken to the press where
was subjected to loads of 40 kN or 80 kN
according to the requirements of each test
(Fig. 10). If after using the press the mixture
settled (thickness of the model < 2.5cm)
more mixture was added into the mold and
the compression procedure was repeated
(using the same compression force than
before) until the wont be settlement
(thickness of the model = 2.5 cm).
3.5.2 Remove from the mold and placing the mixture in the friction
machine.
Next steps are removing the mixture from the mold and placing it into the frame
of the machine. Both steps must be done very carefully! Because the mixture is
a so fragile material easy to break.
1) Mold remove: Unscrew the mold, beginning by the longer sizes the ones
of the base (b), then the ones of the height side (H), leaving the mixture
over the lower mold plate, this plate is approximately 1.5 mm thickness
Fig. 10 Compression of the mixture (Frutiger, Spring 2013)

Mechanism of Flexural Toppling Failure of Rock Slopes
13
and base (B) and height (H) equal to the one of the mold (46.8 cm and
24.1 cm respectively). The lower mold plate can be observed in Fig. 11.
2) Placing of the mixture in the friction machine: The mixture is placed in the
bottom of the machine’s frame. Then the lower plate of the mold is
removed from the mixture very careful pulling from the strings that are
attached to the plate (Fig. 11).
In order to avoid that the mixture being affected by the efforts that could
deformed it, a metal bar was place in the upper part of the mixture, to
ensure boundary conditions around all the mixture trying with this that the
movement of the plate affects the less possible to the mixture.
Fig. 21 Placing of the model and remove of the lower plate of mold
3.5.3 Columns and slope cutting for the model.
For last step before turn on the machine and begin the test, the correspondent
cuts according to the test parameters must be done. This step is divided in other
three:
1) Cut downwards the model in diagonal way with the joint dip angle (β) and
the width between the columns (bj) needed (Fig. 12a).
2) Turn on the friction machine making the conveyor belt rotate for 5 minutes,
like is shown in the Fig. 12b. This step is with the target to close any
opening in excess between the joints of the slabs and ensure that there is
contact between them.
3) Finally, cut the model downwards for create the slope angle (α) (Fig. 12c)

Spring 2014
14
Fig. 32 Procedure for cutting the rock mass model
3.6 Planning and optimization of the tests
For the development of the test was a two level factorial design with four factors
(variables) (24), this means to develop tests with four different variables and
giving to each variable two different parameters. According to (Box, Hunter, &
Hunter, 2005) there are two different possibilities for develop this experimental
design:
1) A 24 un-replicated design.
2) A two level eight-run fractional factorial design of four variables.
To develop the first of them needs a total of 16 test, while the second only 8;
meaning that the first one will need more time to have the results, therefore the
chosen was the second one in order to save the most possible time.
Below are shown the tables of the different performed tests:
Main tests: based in the two level eight-run fractional design of four
variables.
Extra test: repetition of the test with the best results (test 5), but with the
half compression force (40 kN), with the objective to get a deeply analysis
about flexural toppling.

Mechanism of Flexural Toppling Failure of Rock Slopes
15
Main tests
Test
Slope
height
(H)
Column’s
width (bj)
Slope
angle
α
Joint
dip
angle
β
Compression
force
Total
time of
the test
1 24 cm 1.5 cm 70° 70° 80 kN 120 min
2 18 cm 1.5 cm 70° 80° 80 kN 120 min
3 24 cm 2 cm 70° 80° 80 kN 120 min
4 18 cm 2 cm 70° 70° 80 kN 120 min
5 24 cm 1.5 cm 75° 80° 80 kN 120 min
6 18 cm 1.5 cm 75° 70° 80 kN 120 min
7 24 cm 2 cm 75° 70° 80 kN 120 min
8 18 cm 2 cm 75° 80° 80 kN 120 min
Extra tests
Test
Slope
height
(H)
Column’s
width (bj)
Slope
angle
α
Joint
dip
angle
β
Compression
force
Total
time of
the test
5.1 24 cm 1.5 cm 75° 80° 40 kN 120 min
5.2 24 cm 1.5 cm 75° 80° 40 kN 120 min
Table 3 Extra tests performed
Table 2 Main tests performed

Spring 2014
16
4 Experimental analysis
4.1 Development of the tests For the observations comments of the test, the number of columns are going to be mention in order from left to right, and the rows from the bottom to the top, as its shown in the image below (Fig. 13).
In order to have a quickly visual difference between the columns, rows, and the slope were used little paper dots series always placed in the same order: purple, orange, blue and green.
Thanks to these dots, create images with the toppling sequence was possible, as it could be observed at tests 5 and 5.2.
All the test except tests 5 and 5.2, are presented in the next way:
Image a): Picture taken at the beginning of the test (time = 0 min). Image b): Picture taken at the end of the test (time = 120 min).
Test number 5 and 5.2 have, are exposed in the next way:
Image a): Picture taken at the beginning of the test (time = 0 min). Image b). Picture at moment in which the angle of the basal failure plane
(θ) is produced. Image c): Analysis image of the main affected zones. Image d): Image with the toppling sequence represented by color dots. Image e): Displacement of the main zones (settlement zone, and model’s
slope).
Fig. 43 Explanation image for the nomenclatures used in the observations
Mechanism of Flexural Toppling Failure of Rock Slopes
17
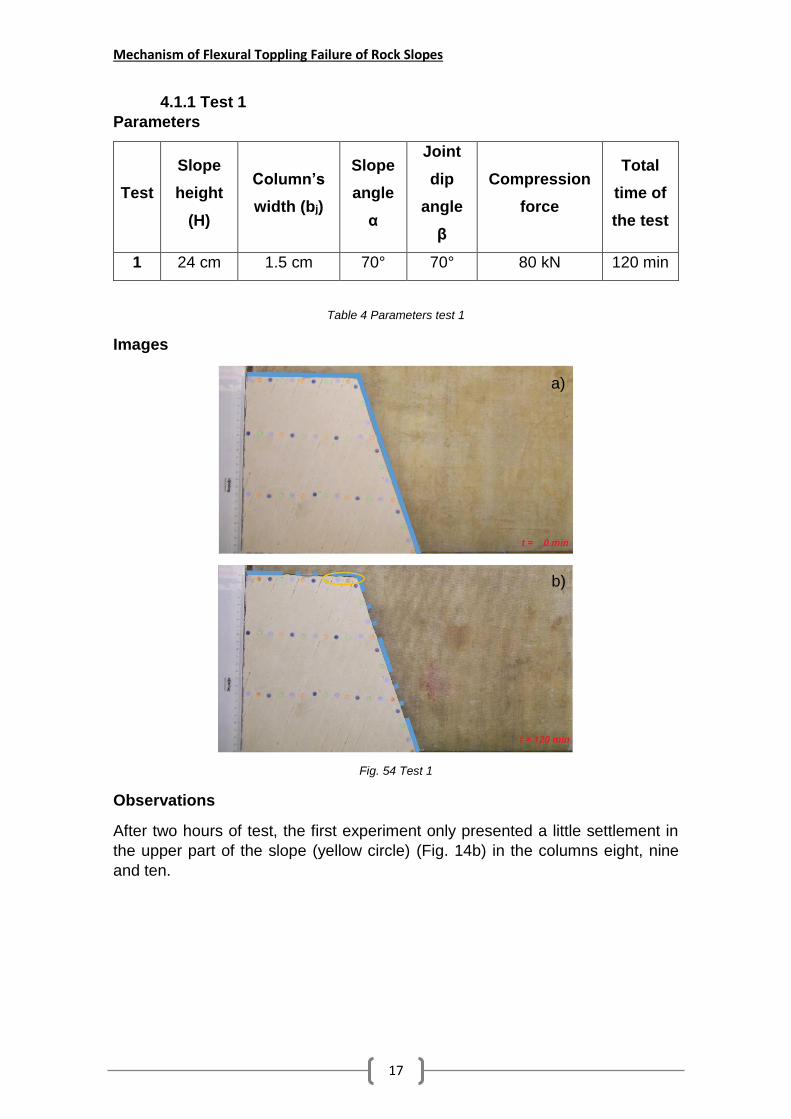
4.1.1 Test 1
Parameters
Test
Slope
height
(H)
Column’s
width (bj)
Slope
angle
α
Joint
dip
angle
β
Compression
force
Total
time of
the test
1 24 cm 1.5 cm 70° 70° 80 kN 120 min
Table 4 Parameters test 1
Images
Fig. 54 Test 1
Observations
After two hours of test, the first experiment only presented a little settlement in
the upper part of the slope (yellow circle) (Fig. 14b) in the columns eight, nine
and ten.
a)
b)

Spring 2014
18
4.1.2 Test 2
Parameters
Test
Slope
height
(H)
Column’s
width (bj)
Slope
angle
α
Joint
dip
angle
β
Compression
force
Total
time of
the test
2 18 cm 1.5 cm 70° 80° 80 kN 120 min
Table 5 Parameters test 2
Images
Fig. 65 Test 2
Observations
There were produced three different fissure zones (red circles) (Fig. 15b), at columns 1, 2, 5 and 6; and it can be also observed a settlement zone in row three column one, this settlement is almost of 1.3 cm that is equal to the 7.2% of the total height of the model. It also can be seen a small displacement at columns thirteen and fourteen in the base.
Crack in columns five and six is the first continue fissure gotten in the experiments.
a)
b)
Mechanism of Flexural Toppling Failure of Rock Slopes
19
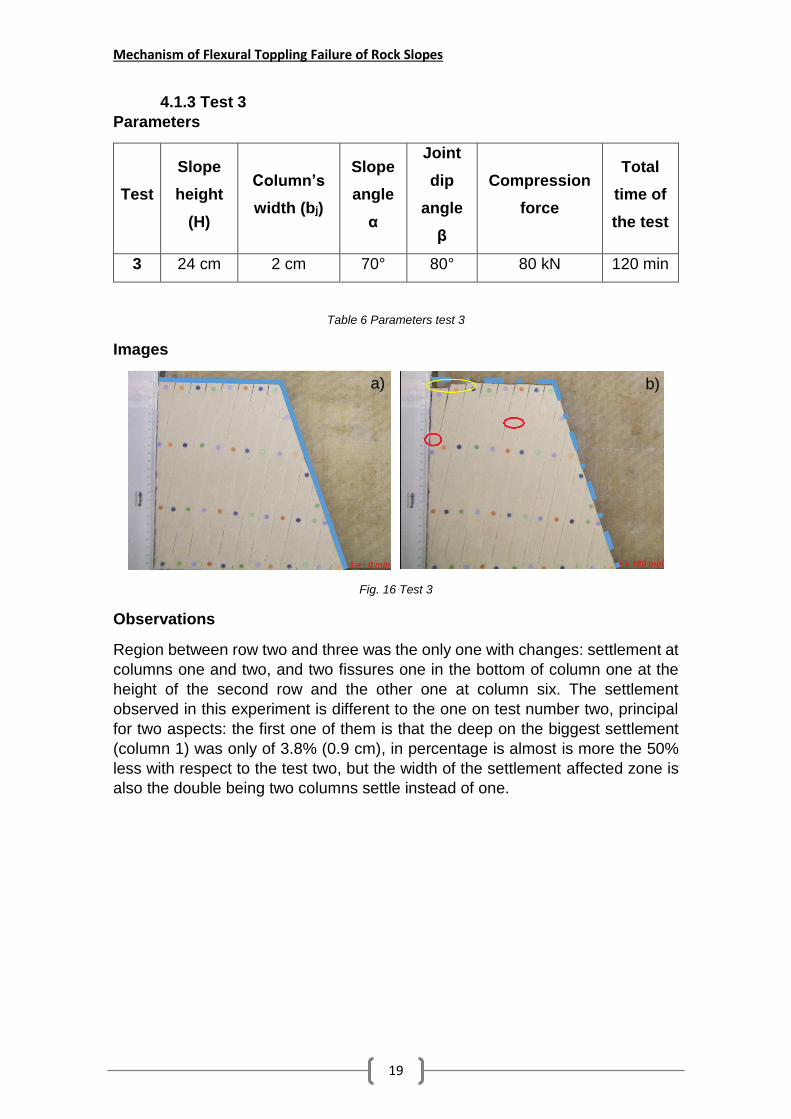
4.1.3 Test 3
Parameters
Test
Slope
height
(H)
Column’s
width (bj)
Slope
angle
α
Joint
dip
angle
β
Compression
force
Total
time of
the test
3 24 cm 2 cm 70° 80° 80 kN 120 min
Table 6 Parameters test 3
Images
Fig. 16 Test 3
Observations
Region between row two and three was the only one with changes: settlement at
columns one and two, and two fissures one in the bottom of column one at the
height of the second row and the other one at column six. The settlement
observed in this experiment is different to the one on test number two, principal
for two aspects: the first one of them is that the deep on the biggest settlement
(column 1) was only of 3.8% (0.9 cm), in percentage is almost is more the 50%
less with respect to the test two, but the width of the settlement affected zone is
also the double being two columns settle instead of one.
a) b)

Spring 2014
20
4.1.4 Test 4
Parameters
Test
Slope
height
(H)
Column’s
width (bj)
Slope
angle
α
Joint
dip
angle
β
Compression
force
Total
time of
the test
4 18 cm 2 cm 70° 70° 80 kN 120 min
Table 7 Parameters test 4
Images
Fig. 77 Test 4
Observations
It is the first time that a toppling beginning can be observed (Fig. 17b), it can be
also seen two principal fissure lines one in the top crossing from columns one to
seven, and the other one is in developed downwards and diagonal from columns
three to ten, in the fissure has a little “non-brake space” between columns eight
and nine, but the tendency shown during the test suggest that this is the path that
the fissure will fallow.
The columns of the slope that presented toppling were the seventh, eighth and
tenth.
a)
b)

Mechanism of Flexural Toppling Failure of Rock Slopes
21
4.1.5 Test 5
Parameters
Test
Slope
height
(H)
Column’s
width (bj)
Slope
angle
α
Joint
dip
angle
β
Compression
force
Total
time of
the test
5 24 1.5 75° 80° 80 120
Table 8 Parameters test 5
Images
Fig. 88 Test 5
Observations
Test five is the first experiment were a complete development of toppling can be observed, on it can be seen two principal failures (Fig. 18b); three settlement zones (yellow circles), and a collapse zone outside the original slope position.
a)
b) c)
d) e)

Spring 2014
22
The three settlement zones had affected to different columns and also sink them in a different percentage with respect to the total height of the model (H).
Settlement zone
Sink displacement
% sink with respect to the model height (H)
Affected columns
Affected rows
1 9.96 cm 41.5% 1 2 and 3
2 2.7 cm 11.2% 2 3
3 1 cm 4.4% 3 to 11 3
Table 9 Result of the settlements from test 5
Of the two fissures the upper one, is the one that correspond to the basal angle failure plane (θ) obtained at the 75 minutes of the test. This crack will be analyzed more depth in the calculus part of this research. Both of the fissures were developed downwards and in diagonal way, the upper one crosses from column five to the fifteenth, while the fissure in the bottom crossed from the third column to the twelfth.
In the collapse zone surrounded in a green circle (Fig. 18c) the top toe of the slope breaks and start to separate its self from the rest of the mass rock model, this section correspond approximately to the area between rows two and three.
Finally on Fig. d) and e) can be observed the sequence that fallowed the slope’s dots during all the test and the total displacement of them. Being the column twelve which arrive further with respect to the base axis and a magnitude of 19.8 cm.
Column 11 was the one which got the biggest magnitude for its total distance displaced of 20.7 cm.
Mechanism of Flexural Toppling Failure of Rock Slopes
23
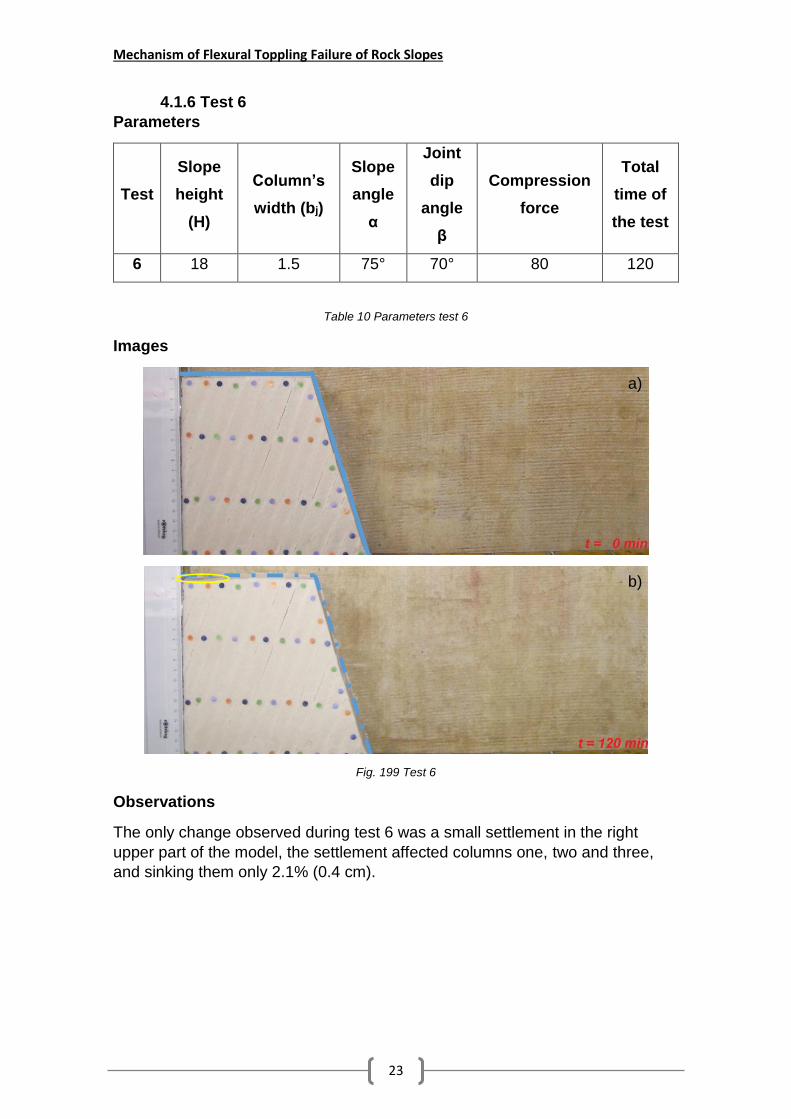
4.1.6 Test 6
Parameters
Test
Slope
height
(H)
Column’s
width (bj)
Slope
angle
α
Joint
dip
angle
β
Compression
force
Total
time of
the test
6 18 1.5 75° 70° 80 120
Table 10 Parameters test 6
Images
Fig. 199 Test 6
Observations
The only change observed during test 6 was a small settlement in the right
upper part of the model, the settlement affected columns one, two and three,
and sinking them only 2.1% (0.4 cm).
a)
b)

Spring 2014
24
4.1.7Test 7
Parameters
Test
Slope
height
(H)
Column’s
width (bj)
Slope
angle
α
Joint
dip
angle
β
Compression
force
Total
time of
the test
7 24 2 75° 70° 80 120
Table 11 Parameters test 7
Images
Fig. 20 Test 7
Observations
Like in test six here is also observed a settlement in the right upper section of the model, but this time it sink five columns instead of two but also the sink displacement was lees (0.3 cm) only of the 1.4% against the 2.1% on test six.
a)
b)

Mechanism of Flexural Toppling Failure of Rock Slopes
25
4.1.8 Test 8
Parameters
Test
Slope
height
(H)
Column’s
width (bj)
Slope
angle
α
Joint
dip
angle
β
Compression
force
Total
time of
the test
8 18 2 75° 80° 80 120
Table 12 Parameters test 8
Images
Fig. 21 Test 8
Observations
For test eight there was no settlement develop but instead of that, like in test number four was produced a continue fissure between rows two and three, from columns five to eight. Being this the second time that an important failure was developed in a different way to the angle basal failure plane (θ), explained in the research of professor Adhikary (1997).
a)
b)

Spring 2014
26
4.1.9 Test 5.1
Parameters
Test
Slope
height
(H)
Column’s
width (bj)
Slope
angle
Α
Joint
dip
angle
β
Compression
force
Total
time of
the test
5.1 24 1.5 75° 80° 40 120
Table 13 Parameters test 5.1
Observations
This test was the first of two replications of test five, where toppling was well
develop. Another important difference between this pair of test was the
compression force applied to the mixture (40 kN), being the half of the used
previously 80 (kN); expecting to have toppling in less time, in order to further
analyze toppling.
During the test, the engine of the base friction machine started to fail, decreasing
the velocity of the conveyor belt almost to the no-movement; reason why was
decided to develop a second test (5.2) with the same parameter of test 5.1.
Images
Fig. 22 Test 5.1
Observations
The principal affected zone was at the slope of the model, were can be observed
a diagonal settlement (yellow circle) normal to all its surface (Fig. 22 b).
a) b)

Mechanism of Flexural Toppling Failure of Rock Slopes
27
4.1.10 Test 5.2
Parameters
Test
Slope
height
(H)
Column’s
width (bj)
Slope
angle
α
Joint
dip
angle
β
Compression
force
Total
time of
the test
5.2 24 1.5 75° 80° 40 120
Table 14 Parameters test 5.2
Images
Fig. 23 Test 5.2
e) d)
c) b)
a)

Spring 2014
28
Observations
Test 5.2 is the second experiment were a complete development of toppling can be observed and a well define basal angle failure plane (θ) (Fig. 23c); two settlement zones (yellow circles), and a collapse zone outside the original slope position (green circle).
The two settlement zones had affected to different columns and also sink them in a different percentage with respect to the total height of the model (H).
Settlement zone
Sink displacement
% sink with respect to the model height (H)
Affected columns
Affected rows
1 6.9 cm 28.7 % 1 3
2 2.8 cm 11.8 % 2 to 12 3
Table 15 Results of the settlements from test 5.2
Comparing this results with the ones obtained in Table 9 from test nine, the biggest sink displacement were more small (41.5% vs 28.7%) and there were only two principal settlement zones.
The fissure correspond to the angle basal failure plane crossed all the columns, becoming the biggest failure found in this research. And like it’s explained in the paper of professor Adhikary the failure ends in the toe of the slope face. The base failure was obtained in less time that in test five, like it was expected due to the half compression force applied to this test; in test 5 the failure was reached at 75 minutes, while in this case was obtained at the 30 minutes as can be seen in Fig. 23 b).
In the collapse zone surrounded in a green circle (Fig. 23c) can be seen that the principal columns affected are the ones which were part of the slope face.
Finally on Fig. d) and e) can be observed the sequence that fallowed the slope’s dots during all the test and the total displacement of them. Being the column twelve which arrive further with respect to the base axis and with the biggest distance displaced, 28.4cm, this means a 118.3% of the distance with respect to the total height of the model, and also becoming the biggest percentage displacement observed during all the performed test.

Mechanism of Flexural Toppling Failure of Rock Slopes
29
4.2 Presentation of calculus and results
4.2.1 Hcr parameter
In the research of professor Adhikary, they provide a chart like the one below (Fig.
24) making a relation between the slope degree (α), joint dip degree (β) and a
non-dimensional parameter Hcr, which is defined by the next formula:
𝐻𝑐𝑟 =𝛾𝑛𝐻2
(𝜎𝑡 𝐹. 𝑆.⁄ )𝑏 (1)
Where, 𝛾 the unit weight of the mixture, n a factor used for increase the unit
weight until the limiting equilibrium of the slope was achieved (taken as 1 in
Adhikary’s research and also in this research), H is the slope height, 𝜎𝑡 the
tensile strength of the material, F.S. the security factor of the slope, b the average
joint space of the columns (used before as bj) (Adhikary, Dyskin, Jewell, &
Stewart, 1997).
Fig. 24 Design chart for joint friction angle of 35° (Adhikary, Dyskin, Jewell, & Stewart, 1997)
The formula of professor Adhikary has been adapted, due to that for this research
was not use a gravitational model like the one he used; instead of this was used
a base-friction model, obtaining the next formula, where Φ is the friction angle
between the model and the conveyor belt of the base friction machine:
𝐻𝑐𝑟 =tan(Φ) 𝛾𝑛𝐻2
(𝜎𝑡 𝐹. 𝑆.⁄ )𝑏 (2)

Spring 2014
30
4.2.2 Obtaining the Hcr for each test
Based on (Fig. 24) were obtained the Hcr parameter for each one of the test like
it is shown in (Fig. 25), for test 1 and 4 was used the Fig. 25a, for test 2 and 3 the
Fig. 25b, for test 6 and 7 Fig. 25c, and for test 5, 5.1, 5.2 and 8 Fig. 25d.
In Table16 are the results for Hcr obtained from the four different chars of Fig. 25.
Fig. 25 Design charts for joint friction angle of 35° used for the different developed tests (Adhikary, Dyskin, Jewell, & Stewart, 1997)
Test
Slope
angle
α
Joint dip
angle
β
HCR
1 and 4 70° 70° 25.3
2 and 3 70° 80° 14.8
6 and 7 75° 70° 13
5, 5.1, 5.2 and 8 75° 80° 8.4
Table 16 Hcr values according to the design chart for a 35° joint friction angle of professor Adhikary for all test performed
b) a)
c) d)
Mechanism of Flexural Toppling Failure of Rock Slopes
31
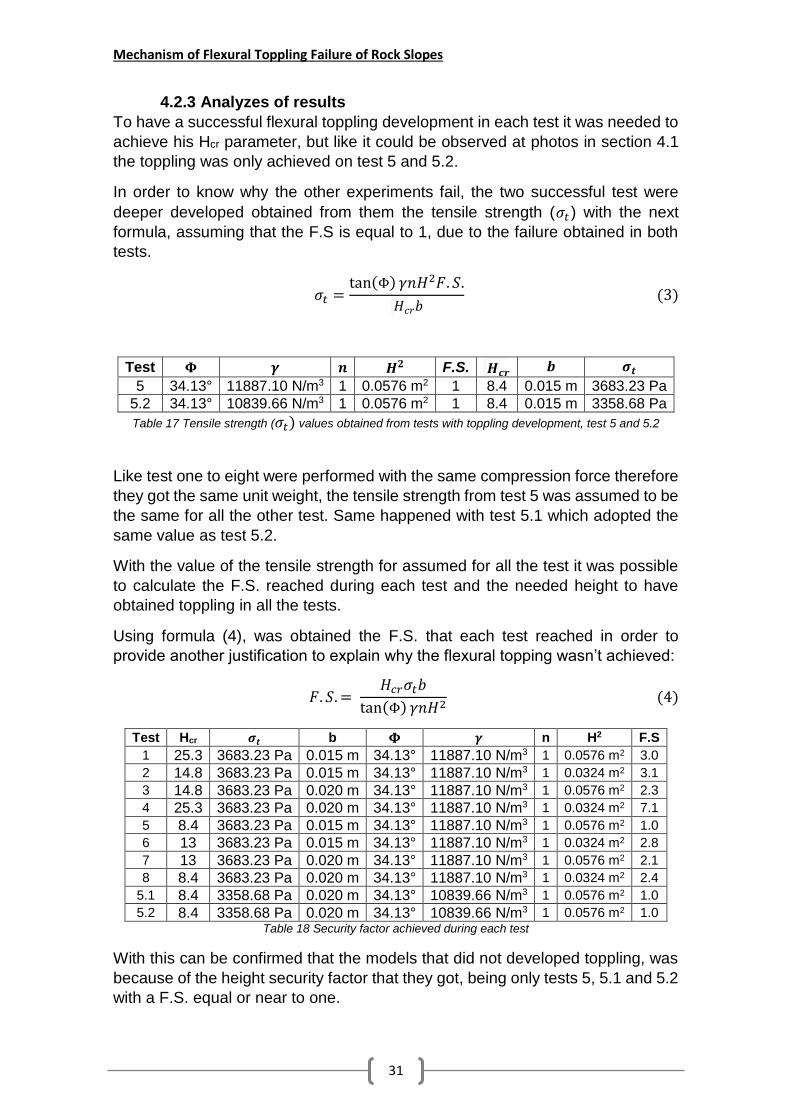
4.2.3 Analyzes of results
To have a successful flexural toppling development in each test it was needed to
achieve his Hcr parameter, but like it could be observed at photos in section 4.1
the toppling was only achieved on test 5 and 5.2.
In order to know why the other experiments fail, the two successful test were
deeper developed obtained from them the tensile strength (𝜎𝑡 ) with the next
formula, assuming that the F.S is equal to 1, due to the failure obtained in both
tests.
𝜎𝑡 =tan(Φ) 𝛾𝑛𝐻2𝐹. 𝑆.
𝐻𝑐𝑟𝑏 (3)
Test 𝚽 𝜸 𝒏 𝑯𝟐 F.S. 𝑯𝒄𝒓 𝒃 𝝈𝒕
5 34.13° 11887.10 N/m3 1 0.0576 m2 1 8.4 0.015 m 3683.23 Pa
5.2 34.13° 10839.66 N/m3 1 0.0576 m2 1 8.4 0.015 m 3358.68 Pa
Table 17 Tensile strength (𝜎𝑡) values obtained from tests with toppling development, test 5 and 5.2
Like test one to eight were performed with the same compression force therefore
they got the same unit weight, the tensile strength from test 5 was assumed to be
the same for all the other test. Same happened with test 5.1 which adopted the
same value as test 5.2.
With the value of the tensile strength for assumed for all the test it was possible
to calculate the F.S. reached during each test and the needed height to have
obtained toppling in all the tests.
Using formula (4), was obtained the F.S. that each test reached in order to
provide another justification to explain why the flexural topping wasn’t achieved:
𝐹. 𝑆. = 𝐻𝑐𝑟𝜎𝑡𝑏
tan(Φ) 𝛾𝑛𝐻2 (4)
Test Hcr 𝝈𝒕 b 𝚽 𝜸 n H2 F.S
1 25.3 3683.23 Pa 0.015 m 34.13° 11887.10 N/m3 1 0.0576 m2 3.0
2 14.8 3683.23 Pa 0.015 m 34.13° 11887.10 N/m3 1 0.0324 m2 3.1
3 14.8 3683.23 Pa 0.020 m 34.13° 11887.10 N/m3 1 0.0576 m2 2.3
4 25.3 3683.23 Pa 0.020 m 34.13° 11887.10 N/m3 1 0.0324 m2 7.1
5 8.4 3683.23 Pa 0.015 m 34.13° 11887.10 N/m3 1 0.0576 m2 1.0
6 13 3683.23 Pa 0.015 m 34.13° 11887.10 N/m3 1 0.0324 m2 2.8
7 13 3683.23 Pa 0.020 m 34.13° 11887.10 N/m3 1 0.0576 m2 2.1
8 8.4 3683.23 Pa 0.020 m 34.13° 11887.10 N/m3 1 0.0324 m2 2.4
5.1 8.4 3358.68 Pa 0.020 m 34.13° 10839.66 N/m3 1 0.0576 m2 1.0
5.2 8.4 3358.68 Pa 0.020 m 34.13° 10839.66 N/m3 1 0.0576 m2 1.0 Table 18 Security factor achieved during each test
With this can be confirmed that the models that did not developed toppling, was
because of the height security factor that they got, being only tests 5, 5.1 and 5.2
with a F.S. equal or near to one.

Spring 2014
32
Using formula (5), the next step was to calculate:
The needed height to have obtained toppling
(5)
Test 𝑯𝒄𝒓 𝝈𝒕 b F.S. 𝚽 𝜸 n H
1 25.3 3683.23 Pa 0.015 m 1 34.13° 11887.10 N/m3 1 0.42 m
2 14.8 3683.23 Pa 0.015 m 1 34.13° 11887.10 N/m3 1 0.32 m
3 14.8 3683.23 Pa 0.020 m 1 34.13° 11887.10 N/m3 1 0.37 m
4 25.3 3683.23 Pa 0.020 m 1 34.13° 11887.10 N/m3 1 0.48 m
5 8.4 3683.23 Pa 0.015 m 1 34.13° 11887.10 N/m3 1 0.24 m
6 13 3683.23 Pa 0.015 m 1 34.13° 11887.10 N/m3 1 0.30 m
7 13 3683.23 Pa 0.020 m 1 34.13° 11887.10 N/m3 1 0.34 m
8 8.4 3683.23 Pa 0.020 m 1 34.13° 11887.10 N/m3 1 0.28 m
5.1 8.4 3358.68 Pa 0.020 m 1 34.13° 10839.66 N/m3 1 0.24 m
5.2 8.4 3358.68 Pa 0.020 m 1 34.13° 10839.66 N/m3 1 0.24 m Table 19 H values needed to have had obtained flexural toppling development for each test
As it can be seen in order to have had a flexural toppling, a grater height is needed, and also confirming that the highest Hcr parameters (25.3) need the greatest height (0.42 m and 0.48 m) to develop flexural toppling.
5 Limits of model and improvements
5.1 Engine of the machine During test five the engine of the machine started to fail, therefore the time to develop more experiments was a little shortened.
5.2 Mold size In order to can develop test with a bigger height and can aspire to better results, the height (H) of the model could be double, becoming from 24.1 cm to 48.2 cm. With this can be achieved bigger Hcr factor, and based on the results obtained in table 19 the eight experiments of this test would be able to develop flexural toppling.

Mechanism of Flexural Toppling Failure of Rock Slopes
33
6 Conclusion
Flexural toppling was achieved only in one of the eight main tests performed, equivalent to the 12.5%, this is because they did not reached the required Hcr parameter, being the limit of the model height one of the most important causes.
Test number 5, which was the only test from the main test performed that achieved flexural toppling, was also the experiment with the most unstable conditions:
Smallest Hcr parameter: 8.4 Biggest H/bj ratio: 16 Biggest model height: 24 cm Greatest slope face angle: 75° Greatest dip angle: 80°
For further experiments two possible options are:
1) Perform test with an Hcr parameter slower than 8.4 from the design chart for a joint friction angle of 35° of professor Adhikary. Being possible to achieve this Hcr with the current equipment available.
2) Increase the model height for have more options to achieve flexural toppling, thanks to the increase of the Hcr parameter.

Spring 2014
34
7 Biography
Adhikary, D., Dyskin, A., Jewell, R., & Stewart, D. (1997). A Study of the Mechanism of
Flexural Toppling Failures of Rock Slopes. 75-93. Nedlands, Australia:
Department of Civil Engineering, The University of Western Australia.
Box, G., Hunter, J., & Hunter, W. (2005). Statistics for Experimenters (Second ed.).
Jonh Wiley & Sons, Inc.
Buzio, G., Goube, M., Labiouse, V., & Gastaldo, L. (Spring 2011). Stabilité de pentes
rocheuses Mécanisme de fauchage. Lausanne, Switzerland: EPFL.
Corominas, J. (s.f.). TIPOS DE ROTURA EN LADERAS . Spain: Universidad
Politécnica de Cataluña.
Esaki, T., Aikawa, A., Jiang, Y., & Mitani, Y. (1993). Development of a new base friction
technique and its application to geotechnical study. Assessment and Prevention
of Failure Phenomena in Rock Engineering, 405.
Frutiger, C., Labiouse, V., Sandrone, F., & Gastaldo, L. (Spring 2013). La stabilité de
tunnels à grande profondeur dans des massifs rocheux fracturés. Lausanne,
Switzerland: EPFL.
Knellwolf, C., Vigne, L., Gattiker, C., & Labiouse, V. (12 de December de 2007).
Laboratoire GC. Manuel de mise en place de l'essai à frottement de base.
Lausanne, Switzerland: EPFL.
Muller, L. (1968). New considerations of the Vaiont slide. Felsmechanik und
engenieurgeologie, 1-91.
Pritchard, M. A., & Savigny, K. W. (5 de July de 1990). Numerical modelling of toppling.
826.
Rogers, J. D. (June - July de 1978). J. David Rogers' Grand Canyon Research Granite
Gorge Toppling Studies. Obtenido de
http://web.mst.edu/~rogersda/grand_canyon_research/granite_gorge_toppling.
htm
Wyllie, D., & Mah, C. (2004). ROCK SLOPE ENGINEERING - CIVIL AND MINING
(Fourth ed.). Spon Press.

Mechanism of Flexural Toppling Failure of Rock Slopes
35
8 Annex