Intratumoral Heterogeneity as a Therapy Resistance Mechanism
CHAPTER 5
MECHANISM OF DRUG RESISTANCE
Single Strand Conformation Polymorphism 97
Characterization of Mutations in Drug Target Genes 102
Novel Mechanism of Drug Resistance Involving
Efflux Protein/s 122
Discussion 125
Mechanism of Drug Resistance
Single Strand Conformation Polymorphism
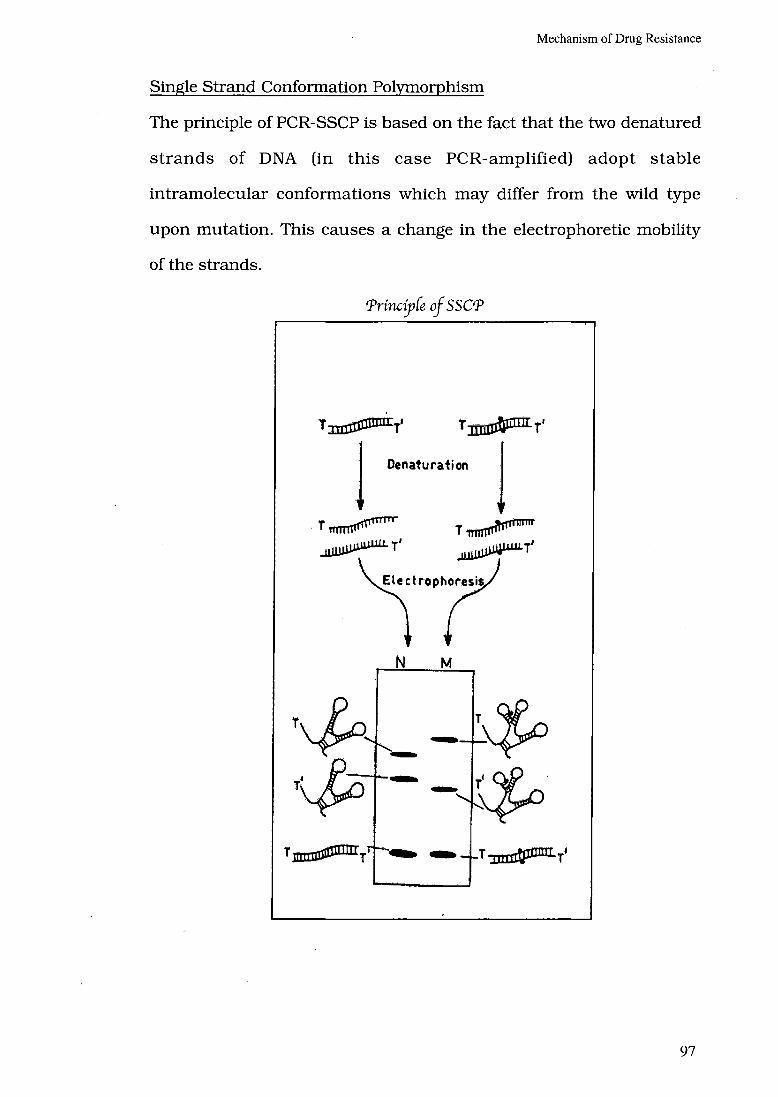
The principle of PCR-SSCP is based on the fact that the two denatured
strands of DNA (in this case PCR-amplified) adopt stable
intramolecular conformations which may differ from the wild type
upon mutation. This causes a change in the electrophoretic mobility
of the strands.
Princi_p(e of SSCP
.r~ ~T'
N
T~ ~r'
97

Mechanism of Drug Resistance
We utilized SSCP to conduct a primary screening of the rpo B, kat G
and gyr A amplicons for the presence of mutations. The results of
SSCP analysis reveal that while most of the rifampicin resistant
strains did exhibit the expected mobility shifts correlating with point
mutations, a very large percentage of isolates resistant to isoniazid
and fluoroquinolone that had point mutations (revealed subsequently
after sequencing), however did not display altered electrophoretic
mobility. Some typical SSCP gel electrophoresis patterns
corresponding to the rpof3 (Figure 5.1), katG (Figure 5.2) and gyrA
amplicons (Figure 5.3) are presented. To rule out any false negative we
did sequencing for all the suspected loci for all the drug resistant
Mycobacterium tuberculosis patient isolates included in our study.
Our findings indicate that certain sequences possibly lack secondary
structures or such different structures may not show mobility
differences. In such cases the SSCP will not be useful for screening for
mutations. With the advent of automated sequencing large number of
samples can now be directly sequenced to identify mutations.
Therefore the use of SSCP can be restricted to situations where
automated sequencing is not available.
98

A
c 1 2 3 4 5 6 7 8 9 10 11
B
c 1 2 3 4 5 6 7 8
Figure 5.1: The SSCP gel pictures of rpoB amplicons. The purified amplicons were fractionated on composite gel (5% polyacrylamide, 2% agarose). The wild type amplicon is loaded in lanes marked C in panel A and B. Arrows indicate bands which are not present in the wild type amplicon.
99
A
c 1 2 3 4 5 6 7
B
12 3 4 56 7 8 9 10 11 12 13 14 c
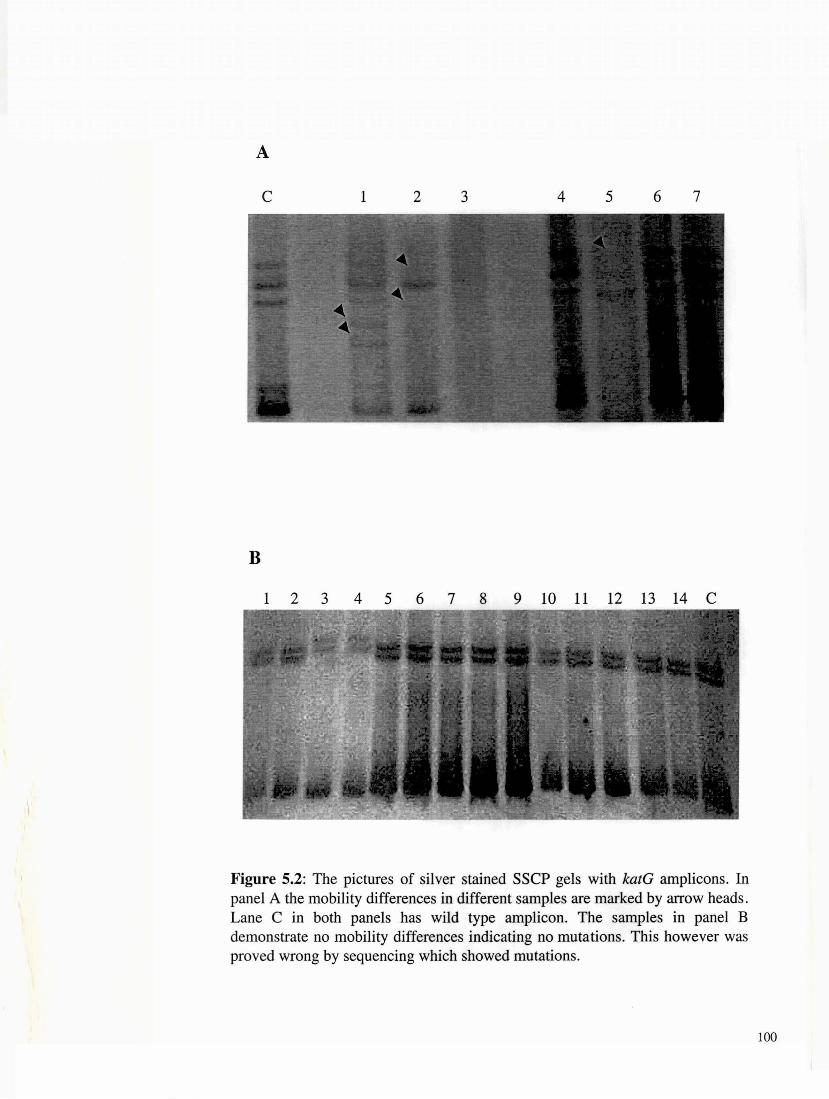
Figure 5.2: The pictures of silver stained SSCP gels with katG amplicons. In panel A the mobility differences in different samples are marked by arrow heads. Lane C in both panels has wild type amplicon. The samples in panel B demonstrate no mobility differences indicating no mutations. This however was proved wrong by sequencing which showed mutations.
100

A
1 2 3 4 5 6 7 8 9 c
B
1 2 3 4 c 5 6 7 8 9 10 11 12 13
Figure 5.3: The hotspot region in the gyrA loci was amplified by PCR. The amplicons were purified and fractionated on a composite gel (5% polyacrylamide, 2% agarose gel). The numbered lanes in panel A and B have samples while the lane marked C has the wild type amplicon. The arrow heads show the mobility differences indicating mutations in these sequences. In panel B the samples with S95T polymorphism were resolved. There is little mobility difference compared to the wild type.
101
Mechanism of Drug Resistance
Characterization of Mutations in Drug Target Genes
A large number of the patients (75%) had previous treatment history
and were on antitubercular treatment at the time of collection of the
sputa. Most of these cases had been through varying degree of
antitubercular drug therapy during the past 20 months. Of the total
126 isolates analysed, 73% (92) were resistant to rifampicin or a
combination of rifampicin with one or more drugs. This is supportive
of rifampicin being a surrogate marker for MDR tuberculosis in India
(Siddiqi et al., 1998).
Mutations in the hotspot regions of various loci were characterized.
The results are summarized in the Table 5.1. Based on the drug
susceptibility profile for an isolate, the corresponding loci
(representing the drug target gene) ~ere amplified and sequenced. The
largest number of samples was obtained fr'om Delhi followed by
Chandigarh, Ahmedabad, Agra, Bangalore, Shimla and few samples
from J aipur and Chennai. Except Chennai and Bangalore all the cities
are located in North India. We could establish previous treatment
history in 94 cases out of the total 126 cases included in the history.
These cases probably represent acquired resistance cases as the
patients had at some time point been given the antitubercular drug
therapy.
A stretch of 30 amino acids at the center of the amplicon for the rpo .13
locus was studied. The amino acids 432 to 458 comprised the hotspot
region for mutations. For the sake of comparison we used the
corresponding E. coli numbering which is 507 to 533.
102

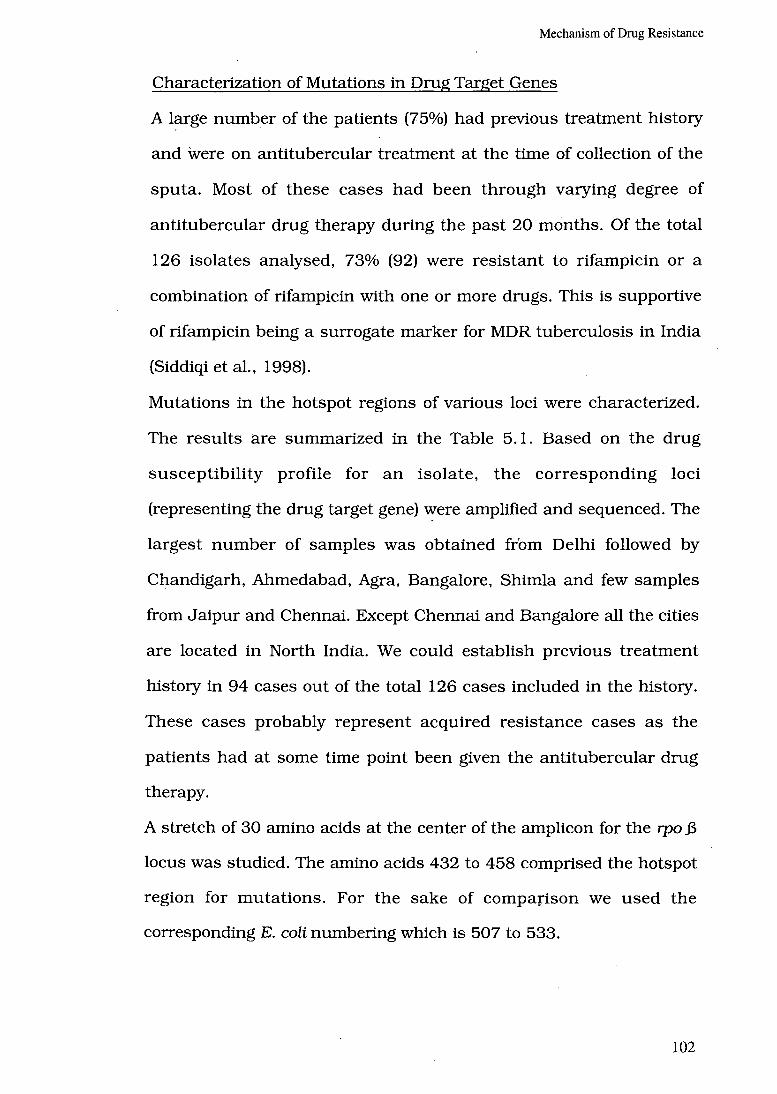
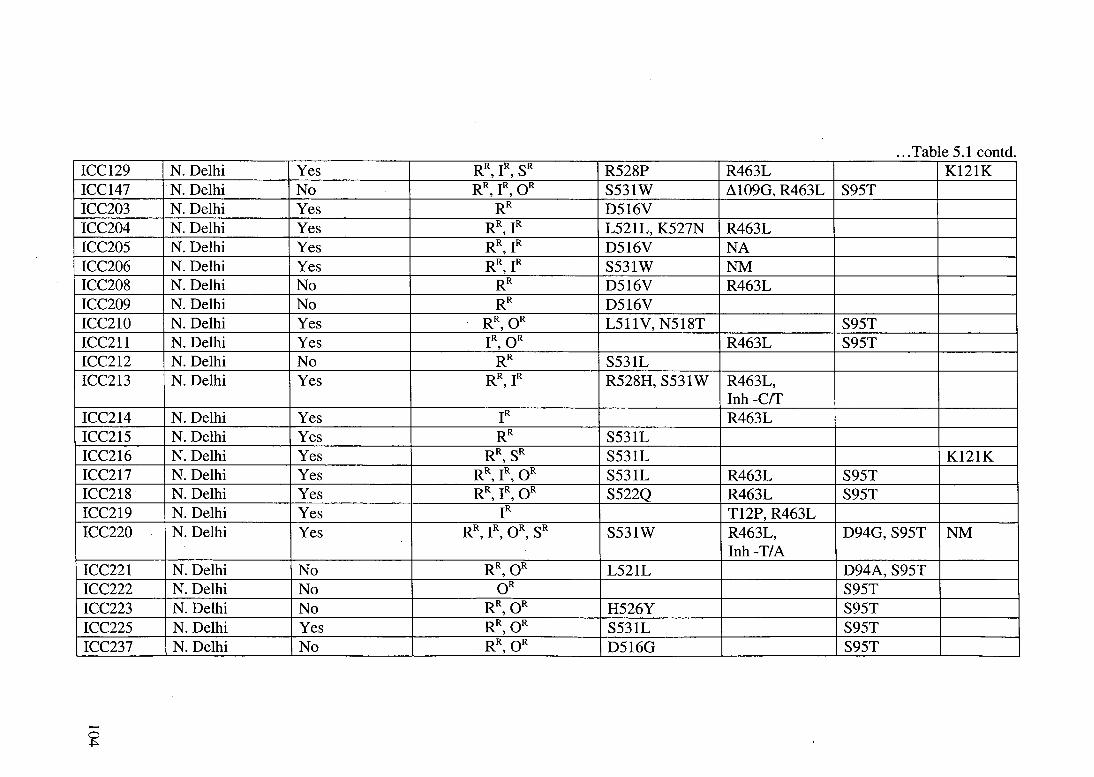
Table 5.1: A summary of the patient isolates of Mycobacterium tuberculosis. The drug resistance profile and the mutation/ s in the corresponding target gene loci are shown. These samples were collected from the different cities in North-India and these are mentioned for each isolate. A 'yes' in the treatment history column indicates that the patient had received some kind of antitubercular drug therapy in the past twenty months.
STRAIN GEOGRAPHIC TREATMENT DRUG . POLYMORPHISM ID LOCATION HISTORYa SUSCEPTIBILITYb rpo katG/inhA gyrA rpsL
ICC14 N. Delhi Yes RR, IR, OR D516V N35D,NAat S95T 2"ct locus
ICC19 N. Delhi Yes. RR, IR, OR L511L, S531L R463L S95T ICC23 N. Delhi Yes RR IR
' L511L, S531L NA
ICC98 N. Delhi No IR, OR R463L, S95T Inh -err
ICClOO N. Delhi Yes RR, IR, OR, SR S531L R463L S95T NM ICC101 N. Delhi Yes RR OR
' S531L S95T
ICC102 N. Delhi Yes RR IR OR ' '
S531L NM S95T ICC103 N. Delhi Yes RR IR OR
' ' L511L, N518T NM A90A, S95T
ICC104 N. Delhi Yes RR IR OR ' '
D516V ~30C, R463L S95T ICC105 N. Delhi Yes RR, IR K527N R463L ICC107 N. Delhi No RR OR SR
' ' N518T, R528P S95T NM
ICC109 N. Delhi Yes IR NM ICClll N. Delhi Yes RR, IR, SR S531W Insertion 185C K121K ICC114 N. Delhi Yes IR R463L ICC115 N. Delhi Yes RR, IR S531W Insertion 98A,
R463L ICC123 N. Delhi Yes RR, IR, OR R528P NA S95T ICC124 N. Delhi Yes RR, IR H526Y R463L ICC125 N. Delhi Yes RR L511L, S531L ICC128 N. Delhi Yes RR, OR, SR H526Y, R528H S95T K121K
... Table 5.1 contd. ICC129 N. Delhi Yes RR IR SR
' ' R528P R463L K121K
ICC147 N. Delhi No RR IR OR ' '
S531W ~109G, R463L S95T ICC203 N. Delhi Yes RR D516V ICC204 N. Delhi Yes RR IR
' L521L, K527N R463L
ICC205 N. Delhi Yes RR, IR D516V NA ICC206 N. Delhi Yes RR, IR S531W NM ICC208 N. Delhi No RR D516V R463L ICC209 N. Delhi No RR D516V ICC210 N. Delhi Yes RR, OR L511V, N518T S95T ICC211 N. Delhi Yes IR, OR R463L S95T ICC212 N. Delhi No RR S531L ICC213 N. Delhi Yes RR, IR R528H, S531W R463L,
Inh -err ICC214 N. Delhi Yes IR R463L ICC215 N. Delhi Yes RR S531L ICC216 N. Delhi Yes RR, SR S531L K121K ICC217 N. Delhi Yes RR, IR, OR S531L R463L S95T ICC218 N. Delhi Yes RR IR OR
' ' S522Q R463L S95T
ICC219 N. Delhi Yes IR T12P, R463L ICC220 N. Delhi Yes RR, IR, OR, SR S531W R463L, D94G, S95T NM
Inh -T/A ICC221 N. Delhi No RR, OR L521L D94A, S95T ICC222 N. Delhi No OR S95T ICC223 N. Delhi No RR, OR H526Y S95T ICC225 N. Delhi Yes RR,OR S531L S95T ICC237 N. Delhi No RR, OR D516G S95T

... Table 5.1 contd. ICC239 N. Delhi Yes RR IR
' D516V R463L
ICC240 N. Delhi Yes RR, IR D516V R463L ICC242 N. Delhi Yes RR,OR L511V S95T ICC244 N. Delhi Yes RR, IR, OR S531L A61T, R463L S95T ICC246 N. Delhi Yes IR, OR Insertion 185C, S95T
R463L ICC275 N. Delhi Yes RR,OR H526Y S95T ICC277 N. Delhi Yes RR IR OR SR
' ' ' H526Y ~30C D94A, S95T K121K
ICC284 N. Delhi No OR NM ICC286 N. Delhi Yes RR IR
' D516G NM
ICC287 N. Delhi Yes RR, IR H526Y NM ICC325 N. Delhi Yes IR OR SR
' ' NM NM NM
ICC326 N. Delhi Yes RR, IR, SR H526L Insertion 98A, NM R463L
ICC327 N. Delhi Yes RR, IR, SR S509R R463L K121K ICC328 N. Delhi No OR NM ICC408 N. Delhi Yes RR IR OR SR
' ' ' Q510H, S531W R463L S95T K121K
ICC425 N. Delhi Yes RR IR '
S531L R463L F4 N. Delhi Yes RR OR
' H526Y D94G, S95T
F5 N. Delhi Yes RR OR ' S531L S95T
F7 N. Delhi Yes RR,OR S531L A90V, S95T F8 N. Delhi Yes RR, OR S531L A90V, S95T F9 N. Delhi Yes RR OR
' N518T S91P,S95T N31 N. Delhi Yes IR R463L N33 N. Delhi Yes IR R463L N34 N. Delhi Yes IR R463L
-0 VI
... Table 5 1 contd N35 N. Delhi Yes IR D73N,R463L N36 N. Delhi No IR R463L ICC32 Ahmedabad Yes RR, IR S531L NA ICC33 Ahmedabad Yes RR, IR, OR S509R R463L S95T ICC36 Ahmedabad Yes IR, OR R463L S95T ICC37 Ahmedabad Yes RR, IR D516G Insertion 98 A,
R463L ICC131 Ahmedabad Yes RR, IR H526Y, R528P R463L ICC132 Ahmedabad No OR S95T ICC133 Ahmedabad Yes· R\IR H526R ~30C, R463L ICC134 Ahmedabad No RR, OR S522Q S95T ICC136 Ahmedabad Yes RR, IR H526R Insertion 98 A,
R463L ICC137 Ahmedabad No OR S95T ICC138 Ahmedabad No OR S95T ICC226 Ahmedabad Yes RR, IR L511L, H526R ~109G, R463L ICC233 Ahmedabad Yes RR, IR D516V, H526Y ~30C, R463L ICC151 Chandigarh No OR S95T ICC154 Chandigarh No RR IR OR
' ' S531L ~30C,R463L S95T
ICC155 Chandigarh Yes IR ~30C, R463L ICC159 Chandigarh Yes RR, OR H526Y S95T ICC161 Chandigarh Yes RR,OR S522Q S95T ICC162 Chandigarh No RR,OR S522Q S95T ICC164 Chandigarh No OR S95T ICC165 Chandigarh No OR S95T ICC166 Chandigarh No OR S95T
-0 0'1

... Table 5.1 contd. ICC167 Chandigarh Yes IR, OR R463L S95T ICC168 Chandigarh Yes OR S95T ICC169 Chandigarh Yes RR, IR N518T R463L ICC170 Chandigarh No OR S95T ICC171 Chandigarh Yes RR IR
' S531L R463L
ICC172 Chandigarh Yes RR,OR S522Q S95T ICC173 Chandigarh No RR SR
' H526L K121K
ICC174 Chandigarh Yes OR S95T ICC175 Chandigarh No RR,OR H526Y S95T ICC247 Chandigarh No RR, OR D516V S95T ICC248 Chandigarh No RR,OR D516V S95T ICC249 Chandigarh No OR S95T ICC251 Chandigarh No OR NM ICC254 Chandigarh Yes RR S531L ICC255 Chandigarh No RR,OR N518T NM ICC256 Chandigarh Yes RR IR
' H526Y NM
ICC257 Chandigarh Yes RR,OR Q510H, L511L S95T ICC262 Chandigarh Yes RR, IR, OR D516V R463L S95T ICC95 Bangalore No OR S95T ICC96 Bangalore Yes RR,OR S531L S95T ICC399 Bangalore Yes RR, OR S531W NM ICC524 Bangalore Yes RR, IR S531L R463L ICC525 Bangalore Yes RR IR
' S531L R463L ICC143 Shimla No OR NM ICC144 Shimla Yes IR R463L ICC145 Shimla No OR NM
-s

... Table 5.1 contd. A3 Agra Yes RR, IR, SR S531L R463L NM A4 Agra Yes RR IR
' D516V R463L A9 Agra Yes RR IR
' S531L R463L All Agra Yes RR IR
' D516G TllA, R463L
A12 Agra Yes RR IR '
D516V N35D, R463L A13 Agra Yes RR IR
' D516V, N518T R463L
A14 Agra Yes RR, IR D516V R463L A15 Agra Yes RR IR
' S531L R463L
ICC332 Jaipur Yes RR IR '
H526R Insertion 185C, R463L
ICC337 Jaipur Yes RR, IR S531L R463L S95T ICC85 Chennai Yes RR IR OR
' ' H526R NA S95T
a: History of previous treatment b: RR-Rifampicin resistant; 1R-Isoniazid resistant; OR-Of1oxacin resistant; SR-Streptomycin resistant NA: No Amplification NM: No Mutation Inh: Mutation in the inhA ribosome binding site ~: Deletion at nucleotide position
-0 00

Mechanism of Drug Resistance
Many reported mutations as well as certain novel mutations were
identified. Codon 531 seemed to be the most vulnerable to mutations,
as most rifampicin resistant isolates had this mutation (Figure 5.4). Of
the 93 RIF resistant strains in our study, 28 had the mis-sense
mutation Ser531Leu and 8 had the substitution Ser531Trp. The next
most common mutations were the amino acid substitutions
Asp516Val/Gly (20 isolates) and His526Tyr/Leu/Arg (19 isolates). We
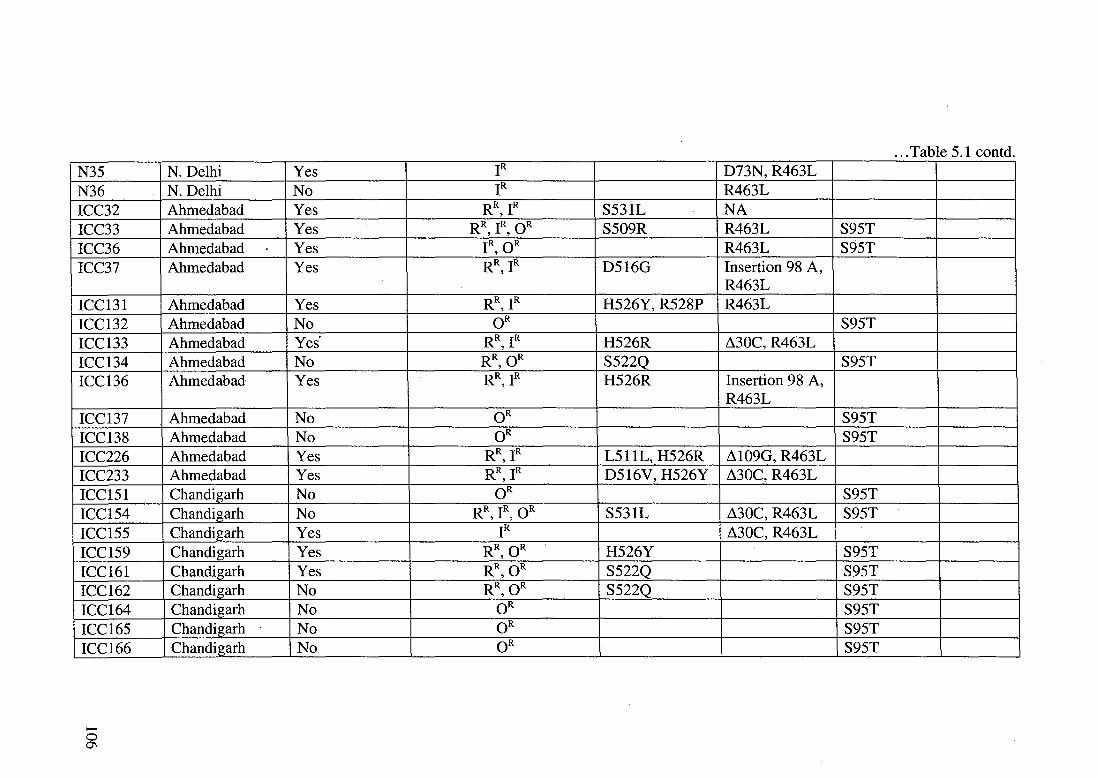
found two isolates with Gln510His changes. The figures 5.5a and 5.5b
show few of the typical electropherograms obtained by sequencing the
resistant isolates. While all these mutations have been reported
earlier, we also found mutations that have not been reported
previously. These include Ser509Arg (ICC33), Leu511Val (ICC242),
Asn518Thr (ICC107), Ser522Gln (ICC172), Lys527Asn (ICC105),
Arg528Pro (ICC129) and Arg528His (ICC213). Most of these mutations
were less frequent, comprising about 24% of the total mutations in the
94 isolates studied. Other mutations identified in our study were
silent mutations at the amino acids Leu511 and Leu521. Interestingly,
this mutation at position 511 never occurred alone and was only
present in isolates having more than one mutation at the rpo ..13 locus.
An important outcome of these studies is the direct correlation of
certain mutations with high MIC values. Table 5.2 lists the isolates,
their mutations and the corresponding MIC level till which they
remained resistant.
109

G G A G
G
• • • • 12?9 t Hl t t t t l t l t t t 1353 . ...ACC AGC CAG CTG AGC C,:AA TTC ATG GAC CAG AAC AAC CCG CTG TCG GGG TTG ACC CAC AAG CGC CGA CTG TCG. GCG
''T S Q L S Q F M D Q N N P L S G L T H K R R L S A
503 ~ ~ ~ ~ ~ ~ ~ . ~ ~ ~ 532
...... ...... 0
~ R H v T Q N p
• L
• G
y
• L H w
• R
Figure 5.4 : Summary of mutations at codons 508 to 532 in the rpoB gene. The wild type sequence and amino acids are shown in the middle frame. Nucleotide changes are marked with arrows in the top frame and the corresponding amino acid changes are denoted in the bottom frame. Changes marked in pink are novel mutations while silent mutations are marked in yellow .

...... ...... ......
, G C T T G T A. G G TC ,4 . . f14
' 190
1333 CAC --7 TAC H. 526 . Y
1333 CAC --7 GAC
H 526 D
G .,., G r c· .i\. ~· c· · It G r· · c L ~ . A j:l4i,:- ~Pi ' .:.
170
1349 TCG --7 TTG
S 531 L
Figure 5.5a: Some typical electropherograms showing the sequence of the rpoB hotspot region. The actual nucleotide and amino' a<?~d changes are marked below. The electropherograms are of the complement strand .
T C T GAT C CAT G .8. :1\ C T G C G AC ~0 . 2~ .
CAA1~6CAG Q 513 Q
GAC1~5 GAT D 516 D
C T GiTI; C C C .A. G T T C - ( ..• > 100 -
. 1291-92 . 1296 CAG ~ CTC CAA ~ CAG
Q 510 L Q 513 Q
C GACAGAC GAC GC TTGTGG .60 170 .
CGA 1~4CGT R . 529 R
GTTCTGGACCAT 210
~ 1
,1,
+ \ dt ~~ ~A II
r . ) '
J VJJf'v r:i . \/ ,1,, ;',;;!
1304 GAC ~ GTC
D 516 V
Figure S.Sb : Sothe typical electropherograms showing the sequence of the rpoB hotspot region. The actual nucleotide and amino acid change;\ are marked below. The electropherograms are of the complement strand.

Mechanism of Drug Resistance
Table 5.2: Specific mutations correlate with different minimum inhibitory concentration (MIC) values for rifampicin. Mis-sense mutations in the RpoB protein at amino acid positions 510, 511, 522, 526, 527, 528, 531 confer higher resistance (2:40~-tg/ml) levels than those at positions 509, 516 and 521 (_:510 1-lg/ml).
Level of
Rifampicin Amino Acid Strain Mutations Type
resistance change
(~-tg/ml)
ICC221 10 G1317A Novel L521L
ICC208 10 A1304T Reported D516V
ICC205
ICC37 10 A1304G Reported D516G
Gl317A Novel L521L ICC204 40
G1336T Novel K527N
ICC105 40 G1336T Novel K527N
ICC129 40 G1338C Novel R528P
C1331T Reported H526Y ICC131 40
G1338C Novel R528P
ICC123 64 G1338C Novel R528P
ICC100 64 C1349T Reported S531L
G1340A Novel R528H ICC213 64
C1349G Reported S531W
T1321C ICC218 64
C1322A Novel S522Q
G1287T Novel Q510H ICC257 64
C1288T Novel L5J1L
ICC275 64 C1333T Reported H526Y
ICC220 64 C1349G Reported S531W
C1331T Reported H526Y ICC128 128
G1338A Novel R528H
113

Mechanism of Drug Resistance
Mutations in codons 516 and 521 conferred low level resistance
(<40~g/ml) to rifampicin, whereas mutations in codons 510, 526, 527,
528 and 531 were seen to confer high levels of resistance (~64 ~g/ml).
The amino acids 526 to 531 appear to be very important in drug
target interactions, and mutations in them result in MIC levels in the
range of 64~g/ml and above. In a few cases (e.g. ICC204, 257 and
128) double mutations were found to have an additive effect on the
degree of resistance.
Insertion, deletion and substitution mutations were mapped in the
katG locus in 24 INH resistant isolates. In the present study we looked
for mutations in the 5' region (nt 3-239) and the mid-region (nt 1187-
1600) of the katG gene, corresponding to amino acid positions 2-77
and 395-533 respectively. The results are summarized in Figure 5.6. A
'C' nucleotide at position 30 was deleted in 6 of the isolates. This
deletion results in chain termination, thereby generating only a short
polypeptide of 26 amino acids. Another single G nucleotide deletion at
position 109 in 2 isolates was observed, which would result in the
production of a 45 amino acid long truncated polypeptide. Insertions
were also observed at nucleotide positions 98 (an A nucleotide) and
185 (a C nucleotide) in 4 and 3 isolates, respectively. Both these
insertions cause aberrant chain termination. Ala61Thr, Thr12Pro,
Thr11Ala, Asp73Asn and Asn35Asp mis-sense mutations were
observed in this locus in few of the isolates. These are novel
observations, as there are no reports of such mutations occurring in
INH resistant strains from other parts of the world.
114

...... ...... VI
+ + • t ~.
30nt 98nt 185nt
109nt
{/ II
1388nt
G .A. T C C T G G C .A. T 160
COG + CTG Arg 463 Leu
Figure 5.6: Summary of muta:tions in the katG gene. Deletions are indicated by orange lines superscripted with a ~ sign while insertions are depicted by black lihes superscripted with a+ sign. Substitutions are shown with blue lines. The electropherogram shows
t '- ~
the common mutation at the 463rd codon .

..... ..... 0\
A RBS
5----GAGAq GATAGG fTGTC----3
I ~ \ G T A/G
G.~ G ,AC G A TAG G T T G TC 130 1
GAG .AC GA iTAG G G T GTU 140 150''""'
G A G A T G .A. IT".~ G G T T G TC 130 140
C .... T
B c D
Figure 5.7: Panel A shows the known mutations in the putative RBS of inhA gene. The electropherogram showing the wild type sequence is shown in panel B. The panels C and D show the mutations observed in the patient isolates of Mycobacterium tuberculosis .
Mechanism of Drug Resistance
This locus could not be amplified in 6 of the isolates (ICC14, 23, 32,
85, 123, 205), indicating a partial deletion of the gene. A common
mutation in all these isolates was Arg463Leu (Figure 5.6). However,
this mutation has been shown to have no direct consequence for drug
resistance. The sequencing of this locus in isoniazid susceptible
isolates included in this study was done for confirmation. It was found
that the majority of the isolates carried this change. It has been
argued previously that this polymorphism in the katG locus might be
more important as a marker for evolution than resistance (Sreevatsan
et al, 1997)). Three INH resistant isolates carried mutations in the
ribosomal binding site (RBS) upstream of the inhA gene. While two
isolates showed a C to T transition, one had a T to A transversion
(Figure 5.7). These mutations have been reported previously by other
groups. The present understanding of these mutations is that they
probably confer resistance by a drug titration effect.
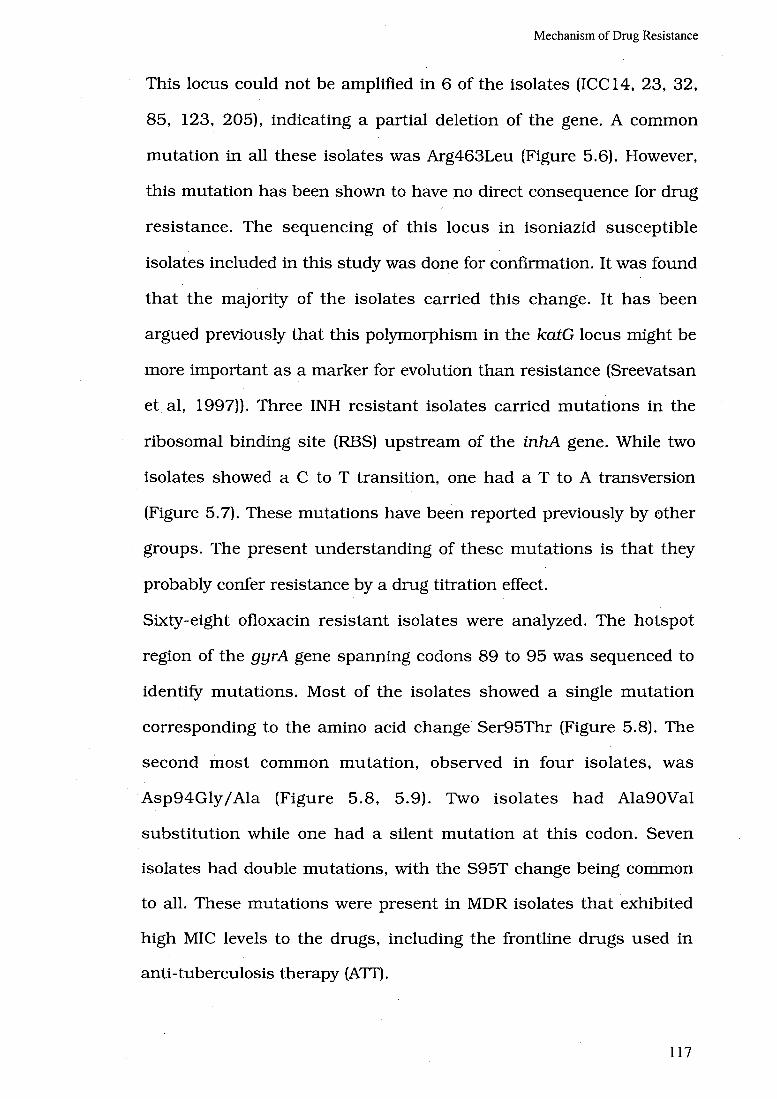
Sixty-eight ofloxacin resistant isolates were analyzed. The hotspot
region of the gyrA gene spanning codons 89 to 95 was sequenced to
identify mutations. Most of the isolates showed a single mutation
corresponding to the amino acid change Ser95Thr (Figure 5.8). The
second most common mutation, observed in four isolates, was
Asp94Gly I Ala (Figure 5.8, 5.9). Two isolates had Ala90Val
substitution while one had a silent mutation at this codon. Seven
isolates had double mutations, with the S95T change being common
to all. These mutations were present in MDR isolates that exhibited
high MIC levels to the drugs, including the frontline drugs used in
anti-tuberculosis therapy (ATI).
117
--00
T C
87 I i
c G
i CG
I I 96
2564 CAC GGC GAC GCG TCG ATC TAC GAC AGC CTG 2s9s
H G D I v
A I p
s I y D I
G A
s I T
L
Figure 5.8: Summary of mis-sense mutations in the gyrA locus. Nucleotide changes are indicated on top of the wild type sequence and the corresponding amino acid changes at the bottom. The most common mutation in this locus is Ser95Thr.

Mechanism of Drug Resistance
All the strains were also checked for mutations in the gyrB locus,
which is associated with low levels of resistance. However, we found
no mutations in the gyrB loci of these isolates. It has been argued that
the S95T mutation does not correlate with drug resistance (Sreevatsan
et al, 1997). It therefore appears that the isolates have acquired
resistance to ofloxacin via other mechanisms.
We tested 14 isolates resistant to streptomycin for mutations in the
rpsL and rrs loci. We found a novel silent mutation in eight strains at
amino acid position 121 in the rpsL locus (Figure 5.10) where the
codon AAA (Lys) was changed to AAG (Lys), but no mutations in the
rrs genes. To our knowledge there are no reports of this mutation. The
reported mutations at the rpsL locus are generally Leu43Arg,
Leu43Thr or Lys88Arg. We are still not clear about how this mutation
leads to the development of streptomycin resistance. The remaining
isolates probably acquired resistance by other means such as by
developing a permeability barrier or by producing drug-altering
enzymes.
A point to be kept in mind is that the majority of isolates included in
this study were from north India. Our data therefore, is inherently
biased towards drug resistant strains from this region and therefore
should not be seen as representing whole of India.
120

AAA Lys
--...... ~ AAG Lys
Figure 5.10: The electropherogram showing the novel silent mutation Lysl21Lys in the rpsL locus.
121

Mechanism of Drug Resistance
Novel Mechanism of Drug Resistance Involving Efflux Protein/ s
Rf-PCR with different sets of primer using RNA isolated from different ~
. drug resistant isolates was performed. These isolates were selected on
the basis of high level of MIC to the front line drugs such as
rifampicin, isoniazid and ofloxacin. Figure 5.11 depicts the amplicons
obtained by RT-PCR. The transcripts obtained from primers to genes
Rv783c, Rv1410c and Rv1819c demonstrated no appreciable
differences in their expression level under drug pressure. However, a
variance in the transcript level for Rv1258c obtained from isolate
ICC154 was observed.
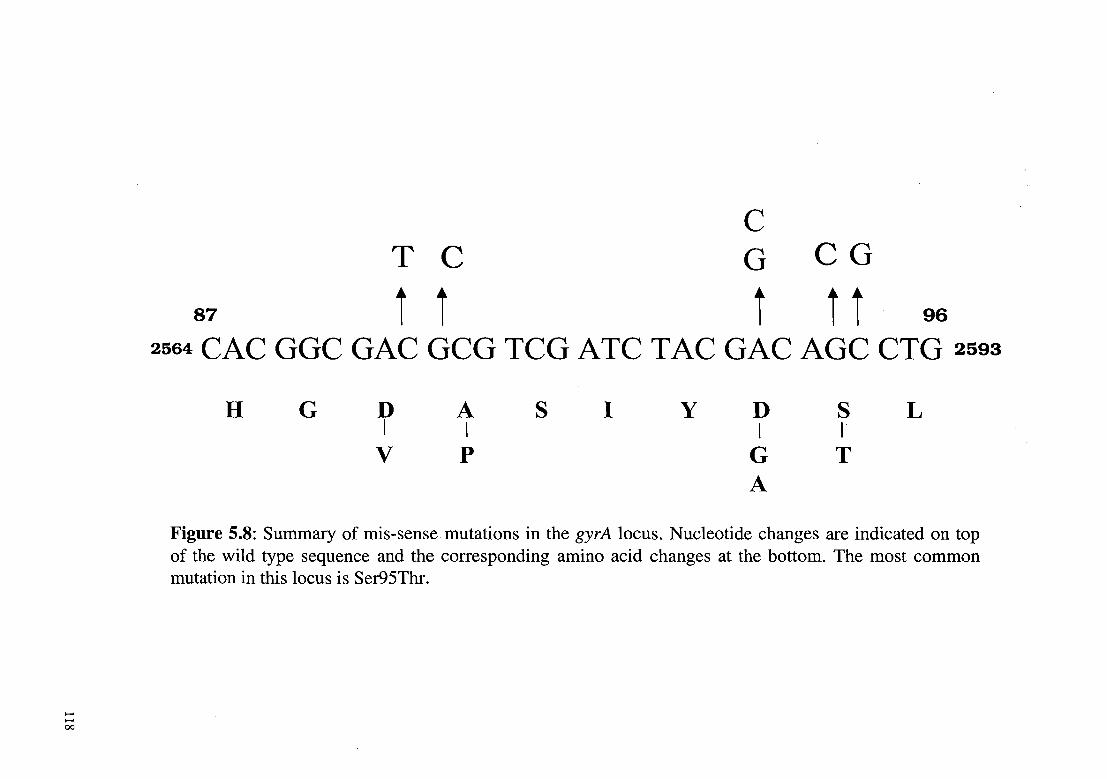
The band intensity of 456 bp amplicon when divided by intensity of
the 245 bp band (from the constitutively expressed gene) provided a
means to compare the RNA transcript level of Rv1258c gene. The band
intensities were normalized in all the lanes and were subsequently
compared to each other. It is quite apparent that the levels of Rv1258c
RNA vary in presence or absence of different drugs from Figure 5.12.
Lane 1 and lane 4 represent the RNA from bacterium grown under
rifampicin and ofloxacin respectively. Lane 2 and 3 represent the
isolate grown in media containing isoniazid and no drug respectively.
The control H37Rv strain in lane 5 shows hardly any Rv1258c gene
RNA while the drug resistant isolate ICC154 shows an appreciable
increase in the corresponding RNA levels. There is a 10 fold increase
in the Rv1258c transcript level in isolate grown in the presence of
rifampicin and a six fold increase in the isolate when grown in
presence of ofloxacin. The drug target regions namely rpoB, katG and
gyrA in ICC 154 were amplified and sequenced.
122

A 1 2 3 4
+447 bp
+245 bp
c 1 2 3 4
B
D 1
1 2
2 3
3 4
4
456 bp
245 bp
•5o9 bp
Figure 5.11: RNA was extracted from M.tb. isolates grown in presence of low level of drugs-rifampicin (0.5~g/ml) , isoniazid (O.l~g/ml) and ofloxacin (O.l~g/ml). Out of the eight isolates only four grew in these conditions- ICC524, ICC337, ICC154 and ICC162. RT-PCR was done on RNA from these isolates using four set of primers corresponding to the genes Rv783c (Panel A), Rv1258c (Panel B), Rv1410c and Rv1819c (Panel D). A variance in transcript levels was observed in the case of Rv1258c (Panel B). Lane 2 in Panel D had very low amount of product possibly because of degradation of RNA. The bottom band (245 bp) in all the gels was the control RT-PCR amplicon.
123
M 1 2 3 4 5
500bp ___. .- 456bp
._ 245 bp Control
Figure 5.12: The RT-PCR products fractionated in a 2% agarose gel. Lane 5 represents the ~ontrol strain H37Rv. Lanes 1 to 4 show the amplicon generated from RNA extracted from ICC 154 when the isolate was grown in the presence of rifampicin, isoniazid, no drug and ofloxacin respectively. Lane M is the 100 bp DNA ladder.

Mechanism of Drug Resistance
There is deletion in the katG gene. The mutations in gyrA and rpoB
loci are generally associated with weak resistance. This correlates well
with the RT-PCR results. The high resistance to rifampicin and
ofloxacin could possibly be associated to overexpression of Rv1258c
product.
This gene was cloned and sequenced to look for any mutations. No
mutation in the gene isolated from this. particular isolate was
observed. To further understand the mechanism of up-regulation of
the transcript in the presence of the drugs the putative promoter
regions of this gene was examined. This gene has no recognized
promoter therefore 200 bp upstream of the translation start site of
this gene was sequenced and compared to the sequence of H3 7Rv.
Once again no changes in this region were seen.
Discussion
Resistance to drugs primarily arises due to mutations in genes coding
for drug target proteins (Ramaswamy and Musser, 1998). However,
this is not the exclusive mechanism employed by the pathogen to
evade killing by the drug. All mycobacteria, especially M. tb., have a
complex cell wall which blocks drug entry into the cell and thus
prevents the drug from accessing the cytoplasmic targets. A more
recent mechanism that is well documented in other systems is the
presence of membrane proteins that act as drug efflux pumps (Cole et
al, 1998; Lewis et al, 1994). The objective of this study was to identify
mutations in drug-target loci in Indian strains of Mycobacterium
tuberculosis and identify the different drug resistant genotypes. As in
125

Mechanism of Drug Resistance
all such studies, the aim was to generate information about the
markers associated with drug resistance, polymorphisms in the drug
target genes, association of level of resistance with particular
mutations, and for developing improved diagnostic and therapeutic
strategies to combat this menace. Rifampicin and isoniazid form the
backbone of the short course therapy for treating tuberculosis. These
drugs are the most effective, and resistance to them would necessitate
using drugs which are more toxic coupled with a longer treatment
period (Bloom et al, 1992).
The findings of mutations in the rpof3, katG and rpsL loci are similar to
those reported from other parts of the world, especially the common
mutations, which reflect a global pattern (Ramaswamy and Musser,
1998). The important feature of this study is the identification of novel
mutations, which assume significance while devising tools for the
diagnosis of MDR TB or designing alternate therapeutic strategies.
All mutations in the rpoB loci of the isolates fall in the 81 bp hot spot
region spanning amino acids 507 to 533. Resistance to rifampicin is a
relatively rare event and generally occurs only after resistance to other
components of short-course chemotherapy has already developed.
Therefore, rifampicin resistance is often regarded as an excellent
surrogate marker for MDR-TB (CDC, 1993; Hasnain et al, 1998). The
mutation frequency of codon 531 was similar to that reported earlier
by other groups (Kapur et al, 1994; Miller et al, 1994; Musser, 1995;
Ramaswamy and Musser, 1998; Siddiqi et al, 1998; Telenti et al,
1993a; Nachamkin et al, 1997; Telenti et al, 1997). Significantly, the
frequency of mutations (relative to other mutations) was higher at
126

Mechanism of Drug Resistance
codon 516 and lower at codon 526 in Indian isolates compared to
those reported elsewhere (Ramaswamy and Musser, 1998). The novel
mutations reported in this broaden the range of known mutations at
this locus. When taken together, these mutations represent a
significant number of drug resistant isolates, a fact that needs to be
considered while designing tools for the detection of MDR TB. Many of
these mutations confer a high degree of drug resistance. A definite
correlation between MIC values and the type of mutation in many
isolates was observed. As reported by previous investigators
(Taniguchi et al, 1996) mutations at positions 528 and 531 are
important in developing high MIC levels. The present findings further
strengthen the belief that the degree of resistance to rifampicin
exhibited by an isolate is related to the type of mutation in the rpoB
locus.
In isoniazid resistant isolates significantly more deletion and
insertions than substitution mutations were found. It was observed
that almost all the isolates carried the Arg463Leu substitution.
However, this mutation was also found to be present in isolates that
were sensitive to INH. This is in concordance with a report from
Sreevatsan et al ( 1997) that argues that polymorphism at this residue
does not contribute to resistant per se but is an important marker for
evolutionary genetics. The insertions and deletions in the katG locus
invariably resulted in chain truncation and termination, leading to the
generation of dysfunctional polypeptides. Changes in the putative
ribosomal binding site of the inM gene in three isolates were also
seen. While the exact mechanism of how these mutations confer
127

Mechanism of Drug Resistance
resistance to isoniazid is not clear, reports (Ramaswamy and Musser,
1998) indicate that they probably increase the levels of enoyl-ACP
reductase which in turn leads to resistance via a drug titration
mechanism.
Flouroquinolones comprise the secondary drug regimen in the
treatment of tuberculosis. Fluoroquinolones bind to DNA gyrase; the
g y r A and g y r B genes of M. tuberculosis have been cloned and
mutations in the quinolone-binding site have been mapped (Takiff et
al, 1994). Surprisingly, a large number of isolates resistant to
ofloxacin, was found. This could be in part due to the inaccurate
diagnosis of tuberculosis as a bacterial infection and fluoroquinolone
overuse in the population. The codons 89, 90, 91, 94 and 95 in the
gyrA gene have been shown to be polymorphic (Ramaswamy and
Musser, 1998; Xu et al, 1996). The most common mutation in
ofloxacin resistant isolates in this study was Ser95Thr. As reported
previously, there seems to be no direct role of this mutation in
developing drug resistance as it occurs in drug sensitive strains too
(Sreevatsan et al, 1997). It seems likely that ofloxacin resistance
possibly results due to mutations elsewhere in the gene or the
presence of drug efflux pumps.
Mutations in codons 43 and 88 of the rpsL gene result generally in
high levels of resistance to streptomycin, while mutations in the 530
loop or 915 regions of the rrs locus are associated with low levels of
resistance (Bottger, 1994). None of these mutations were seen in the
14 streptomycin resistant isolates included in our study. However, a
silent mutation at codon 121 that has not been reported by any other
128

Mechanism of Drug Resistance
group was observed. Studies are underway to provide direct evidence
of the role of this mutation in conferring resistance to streptomycin.
Isolates that have no mutation in either gene may acquire resistant by
developing a permeability barrier to the drug.
Our study provides valuable data on different kinds of mutations
occurring at various target loci in Indian clinical isolates of M. tb. that
enhances our understanding of the molecular mechanisms of drug
resistance. The diversity of polymorphism exhibited at these loci by
the drug resistant strains indicates prevalence of a large number of
strains in this region. Additionally, these data will also assist in the
process of designing new molecular techniques for the diagnosis of
multi-drug resistant tuberculosis (Piatek et al, 2000; Wilson et al,
1999). Such methods promise faster detection rates compared to
methods solely based on the culturing of isolates.
Similar to other bacteria that demonstrate resistance to four or five
antibiotics, mycobacterium has also come up with novel means of
drug resistance. One of the mechanisms of resistance that has been
characterized in bacteria is the regulation and expression of genes
coding for drug efflux proteins. This study demonstrates, probably for
the first time, the association of similar efflux proteins to drug
resistance in Mycobacterium tuberculosis. Resistance in M. tb. has long
been associated with mutations in target genes. But studies indicate
other novel means of developing resistance.
In the clinical isolate ICC 154 included in this study we find a direct
correlation was found between RNA transcript levels of gene Rvl258c
and the different drugs included in the growth medium. The many fold
129

Mechanism of Drug Resistance
increase in the transcript level when the isolate is grown under
rifampicin and ofloxacin point to the possibility of an operational
efflux pump. Studies carried out in M. smegmatis demonstrated the
efflux properties of the LFR protein (Liu et al, 1996; Sander et al,
2000) and increased levels of mRNA of pstB gene in ciprofloxacin
resistant strain (Banerjee et al, 1998). Both these genes are involved
in fluoroquinolone resistance. More recently two of the mdr-efflux
pump genes included in this have been cloned and expressed. Ainsa
et al ( 1998) have demonstrated that a recombinant plasmid containing
the Rv1258 gene when expressed in M. smegmatis confers low level
resistance to tetracycline (upto 4J..Lg/ml). This strengthens the data
discussed in the present study about this protein being a true drug
efflux pump. In a more recent study (Silva et al, 2001) the gene
Rv1410c homologue in M. bovis (termed P55) was expressed in M.
smegmatis. In this case also a weak tetracycline resistance was
observed. The question that needs to be answered is on the functional
regulation of these genes in the presence and absence of drugs. One
hypothesis is that these genes are part of operons where the other
units act as sensors for presence of drug and subsequently upregulate
the expression of the efflux pump genes.
130


![Thomson Chassis-icc19!50!100 Training-manual [Et]](https://static.fdocuments.in/doc/165x107/55cf85ae550346484b908853/thomson-chassis-icc1950100-training-manual-et.jpg)