Mechanics of Advanced Composite Structures · A. Albooyeh et al. / Mechanics of Advanced Composite...
13
* Corresponding author. Tel.: +98-23-35220414; Fax: +98-23-35220414 E-mail address: [email protected] DOI: 10.22075/MACS.2019.15614.1160 Mechanics of Advanced Composite Structures 6 (2019) 225 - 237 Semnan University Mechanics of Advanced Composite Structures journal homepage: http://MACS.journals.semnan.ac.ir Influence of Different Foaming Conditions on the Mechanical, Physical, and Structural Properties of Polypropylene Foam A. Albooyeh * , S. Eskandarzadeh, A. Mousavi School of Engineering, Damghan University, Damghan, Iran PAPER INFO ABSTRACT Paper history: Received 2018-09-26 Received in revised form 2018-11-25 Accepted 2019-04-15 In this article, the effects of different foam production times and temperatures on the mechanical, physical, and structural properties of polypropylene (PP) foam has been investigated. The mi- crocellular PP foams were carried out using supercritical carbon dioxide (sc-CO2) as a physical foaming agent in a batch process. The samples were placed in a pressure vessel and were satu- rated with sc-CO2 at room temperature (23 - 25 °C) and saturation pressure of 40 MPa for 35 hours. Then, samples were removed from the vessel after releasing the pressure and were im- mersed in a glycerin bath for different times of 90, 180, and 270 seconds and different tempera- tures of 155 °C, 165 °C, and 175 °C. The mechanical responses of samples, e.g., flexural, Izod im- pact, and dynamic mechanical thermal properties, and physical characterization containing wa- ter absorption and relative density, were studied. Scanning Electron Microscopy (SEM) was ap- plied to investigate the surface morphology. The cell size, cell density, and cell structure of PP foams were investigated by morphological parameters. X-ray diffractometer was utilized to eval- uate the interaction effect on the samples. Results showed that in the semi-crystalline polymers such as polypropylene, the foaming temperature must be higher than the melting temperature of PP. A simultaneous examination of mechanical, physical, and morphological test results as well as cell structure properties indicate that the best temperature and time conditions for producing PP foams are the temperature of 175 °C and time of 270 seconds, respectively. These optimum conditions could be used in the industrial production of PP foams. Keywords: Polypropylene Microcellular foam Mechanical properties Foaming conditions Physical foaming method © 2019 Published by Semnan University Press. All rights reserved. 1. Introduction Compared to unfoamed polymers, polymeric foams exhibit many advantages such as higher im- pact strength, higher stiffness-to-weight ratio, higher fatigue life, higher thermal stability, higher acoustic insulation properties, lower dielectric constant, and lower thermal conductivity [1, 2]. Thus, their appli- cations have been found instrumentally in food pack- aging, airplane, and automotive parts, sporting equipment, insulation, controlled release devices, and filters, etc. [3, 4]. In the physical method of polymeric foam produc- tion, optimizing the foaming conditions has an im- portant influence on the mechanical and structural properties of the final foam. Also, due to the difficulty of foam production for some polymers, the exact ad- justment of conditions is more important. PP foams are considered as substitutes for other thermoplastic foams, such as polystyrene (PS), poly- ethylene (PE), and polyurethane (PU), due to their low material cost, high service temperature, and po- tential degradation ability [5]. Therefore, some ef- forts have been made to fabricate PP foams [6, 7]. The foaming process of PP with the supercritical carbon dioxide (sc-CO2) has attracted widespread at- tention from the global industrial and academic re- searchers. However, PP cannot be easily foamed be- cause of its properties, such as high crystalline, linear
Transcript of Mechanics of Advanced Composite Structures · A. Albooyeh et al. / Mechanics of Advanced Composite...
* Corresponding author. Tel.: +98-23-35220414; Fax: +98-23-35220414 E-mail address: [email protected]
DOI: 10.22075/MACS.2019.15614.1160
Mechanics of Advanced Composite Structures 6 (2019) 225 - 237
Semnan University
Mechanics of Advanced Composite Structures
journal homepage: http://MACS.journals.semnan.ac.ir Influence of Different Foaming Conditions on the Mechanical,
Physical, and Structural Properties of Polypropylene Foam
A. Albooyeh *, S. Eskandarzadeh, A. Mousavi
School of Engineering, Damghan University, Damghan, Iran
P A P E R I N F O
A B S T R A C T
Pap e r h is to ry :
Received 2018-09-26
Received in revised form
2018-11-25
Accepted 2019-04-15
In this article, the effects of different foam production times and temperatures on the mechanical,
physical, and structural properties of polypropylene (PP) foam has been investigated. The mi-
crocellular PP foams were carried out using supercritical carbon dioxide (sc-CO2) as a physical
foaming agent in a batch process. The samples were placed in a pressure vessel and were satu-
rated with sc-CO2 at room temperature (23 - 25 °C) and saturation pressure of 40 MPa for 35
hours. Then, samples were removed from the vessel after releasing the pressure and were im-
mersed in a glycerin bath for different times of 90, 180, and 270 seconds and different tempera-
tures of 155 °C, 165 °C, and 175 °C. The mechanical responses of samples, e.g., flexural, Izod im-
pact, and dynamic mechanical thermal properties, and physical characterization containing wa-
ter absorption and relative density, were studied. Scanning Electron Microscopy (SEM) was ap-
plied to investigate the surface morphology. The cell size, cell density, and cell structure of PP
foams were investigated by morphological parameters. X-ray diffractometer was utilized to eval-
uate the interaction effect on the samples. Results showed that in the semi-crystalline polymers
such as polypropylene, the foaming temperature must be higher than the melting temperature
of PP. A simultaneous examination of mechanical, physical, and morphological test results as well
as cell structure properties indicate that the best temperature and time conditions for producing
PP foams are the temperature of 175 °C and time of 270 seconds, respectively. These optimum
conditions could be used in the industrial production of PP foams.
K ey wo rds :
Polypropylene
Microcellular foam
Mechanical properties
Foaming conditions
Physical foaming method
© 2019 Published by Semnan University Press. All rights reserved.
1. Introduction
Compared to unfoamed polymers, polymeric foams exhibit many advantages such as higher im-pact strength, higher stiffness-to-weight ratio, higher fatigue life, higher thermal stability, higher acoustic insulation properties, lower dielectric constant, and lower thermal conductivity [1, 2]. Thus, their appli-cations have been found instrumentally in food pack-aging, airplane, and automotive parts, sporting equipment, insulation, controlled release devices, and filters, etc. [3, 4].
In the physical method of polymeric foam produc-tion, optimizing the foaming conditions has an im-portant influence on the mechanical and structural
properties of the final foam. Also, due to the difficulty of foam production for some polymers, the exact ad-justment of conditions is more important.
PP foams are considered as substitutes for other thermoplastic foams, such as polystyrene (PS), poly-ethylene (PE), and polyurethane (PU), due to their low material cost, high service temperature, and po-tential degradation ability [5]. Therefore, some ef-forts have been made to fabricate PP foams [6, 7].
The foaming process of PP with the supercritical carbon dioxide (sc-CO2) has attracted widespread at-tention from the global industrial and academic re-searchers. However, PP cannot be easily foamed be-cause of its properties, such as high crystalline, linear
226 A. Albooyeh et al. / Mechanics of Advanced Composite Structures 6 (2019) 225 - 237
structure, low melt strength, poor ability to hold bub-bles are growing in the gas foaming process, and its necessity for accurate temperature control in the foaming apparatus [7-9].
Some studies concerning the influence of pro-cessing conditions on the production of polymeric foams can be found in the literature. Doroudiani et al. [9] carried out experiments on polyethylene, poly-butylene, polypropylene, and polyethylene tereph-thalate. They found that a significant decrease in foamed areas and non-uniformity in the foam struc-ture may occur when the degree of crystallization in-creases. On the other hand, in the semi-crystalline polymer with an increase in the degree of crystalliza-tion, the microcellular structure is locally created, while foam structures (that are more uniform) are obtained in polymers with a lower degree of crystal-lization. Colton et al. [10] showed that in producing amorphous polymer foams, the germination of the cells was conducted homogeneously. However, in the semi-crystalline polymers, the absorption and re-lease of gas were carried out in the amorphous areas. Therefore, the polymer-gas solution did not have uni-form relative density, and the foam structure was af-fected by the polymer crystalline morphology. Fur-thermore, they reported that the foaming process should be carried out within the melting temperature range of the polymer to eliminate these problems in the production of semi-crystalline polymer foams. Fu et al. [11] studied the effect of foaming pressure and saturation time of PP foam to optimize the PP foam-ing process using sc-CO2; they found a threshold foaming pressure of 13.8 MPa to achieve low-density foams. Chenyang et al. [6] evaluated the foam ability of four PP samples with different molecular architec-tures using nitrogen (N2) as a physical foaming agent. Huang et al. [12] studied microcellular foaming that was carried out in a batch process from a wide range of immiscible polypropylene/polystyrene (PP/PS) blends using sc-CO2 as a physical foaming agent. Wan et al. [13] studied nanocomposite foams of polypro-pylene/multi-walled carbon nanotubes (PP/CNTs) with four wt. % eight wt. % multi-walled CNTs using sc-CO2 as a foaming agent at different soaking tem-peratures. Muoi et al. [14] explained the foaming be-havior of poly (vinylidene fluoride-co-hexafluoro-propylene) (PVDF-HFP). Goel et al. [15] studied the influence of pressure and temperature on nucleation generation of microcellular polymeric foams using sc-CO2. Aroram et al. [16] investigated the prepara-tion and characterization of microcellular polysty-rene foams processed in sc-CO2. Hu et al. [17] re-ported the advantages of the sc-CO2 application as an environmentally benign solvent and a swelling agent for carrying out the free radical grafting process of vinyl monomers onto isotactic PP in the solid state. Liu et al. [18] studied the manipulation of polymer
foam structure based on CO2-induced changes in pol-ymer properties. They also reported that the poly-propylene foam structure was manipulated through CO2-induced plasticization. Moreover, based on CO2-induced crystallization, a new molten foaming strat-egy was proposed and utilized to fabricate PLA foam with highly porous and inter-connected structures from the ordinary virgin PLA. Long Kong et al. [19] proposed a novel process of preparing open-cell pol-ymer foams by CO2 assisted foaming of polymer blends. Furthermore, compression results indicate that the open-cell foams exhibit good flexibility and elasticity. Yuanxiang et al. [20] investigated con-trolled foaming of polycarbonate/polymethyl meth-acrylate thin film with sc-CO2. They found that the mean diameter of cells in foamed PC/PMMA films de-creased with the increment of saturation tempera-ture and saturation pressure; however, the incre-ment of the foaming time increased. They also re-ported that the cell density (Nc) increased with the increment of saturation temperature and saturation pressure; and, it then decreased with the increment of the foaming time. However, Nc increased first but then decreased with the increment of the foaming temperature. Notario et al. [21] fabricated poly (me-thyl methacrylate) (PMMA) nano-cellular and micro-cellular foams using the CO2 system to produce com-parable bulk foams both in the micrometer and na-nometer ranges. Rodrigue et al. [22] produced thin polypropylene (PP) foam films by continuous extru-sion using supercritical nitrogen (N2) and then charged via corona discharge. The morphological and mechanical results showed that higher cell as-pect ratio led to lower Young's modulus. Enayati et al. [23] produced an open-celled structure using poly-styrene and supercritical carbon dioxide in a novel batch process. They found that saturation pressure, foaming temperature, and foaming time were three important parameters affecting the production of an open-cellular structure. They indicated that by en-hancing the saturation pressure and the foaming temperature, there was a drop in the time required for open-celled structure formation. At saturation pressure of 130 bar, foaming temperature of 150 °C and a foaming time of 60 seconds, open-celled micro-cellular polystyrene foams were obtained using su-percritical CO2 in the batch process. Li et al. [24] stud-ied the effects of different foaming conditions on the cell structure and impact strength of constrained foamed polystyrene using supercritical CO2 (Sc-CO2) as a physical blowing agent. They found that cell di-ameters in the constrained foaming process increase with the increase in the foaming time. Moreover, higher impact strength could be obtained for foamed polystyrene as foaming time was prolonged, foaming temperature increased, or saturation pressure was enhanced.

A. Albooyeh et al. / Mechanics of Advanced Composite Structures 6 (2019) 225 - 237 227
To the authors’ knowledge, the influence of foam-ing time and temperature on the flexural, Izod im-pact, dynamic mechanical thermal and water absorp-tion properties of PP foam were not investigated. In this study, microcellular foaming was carried out in a batch process using sc-CO2 as a physical foaming
agent. In order to investigate the effect of foaming time and temperature on the flexural, impact, dy-namic mechanical thermal and structural properties of PP foams and finding the best foaming conditions, samples were foamed at times of 90, 180, and 270 seconds and at temperatures of 155 °C, 165 °C, and 175 °C. Also, the saturation time of samples was cal-culated by placing samples in the presence of carbon dioxide gas at different times to reach a constant weight. The flexural properties of foamed samples, containing flexural strength, flexural modulus, and elongation at rupture point, were studied. Further, structural properties such as average cell diameter, relative density, and cell density were investigated. In addition, the values of storage modulus and Tanδ were investigated through dynamic mechanical ther-mal test.
2. Experimental Program
2.1. Material
Pellet form homopolymer polypropylene (PP 570P), was purchased from Sabic company (Saudi Arabia) with a density of 905 kg/m3 and Melt Flow Index (MFI) of 8 g/10 min (230 °C/2.16 kg). Indus-trial CO2 with 99.9% purity, was applied as a physical foaming agent.
2.2. Preparation of Solid PP Samples
Before the preparation of the specimens, PP was dried in a vacuum oven for 48 h at 80 °C. PP granules were melt-compounded in a Brabender twin-screw extruder (DSE 25) with a 25 mm diameter screw and length-to-diameter (L/D) ratio of 40. The screw speed was fixed at 100 rpm, and the temperatures from the hopper to barrel were fixed at 170, 180, 190, 170, and 160 °C [25]. The extrudates were pelletized, dried in an oven, and injection molded (using Aslanian injection molding machine; EM80) into standard test specimens for mechanical tests (ASTM: D790 standard for the flexural test, ASTM: D256 standard for impact test, and ASTM: D4065 standard for the dynamic mechanical thermal test). The hold-ing pressure and speed were 135 Bar and 60 rpm, re-spectively, with a throughput of 50 cm3/s. The barrel temperature ranged from 200 to 210 °C, and the mold temperature was kept at 25 °C [25].
2.3. Preparation of PP Foam Samples
PP foam samples were produced using the phys-ical foaming agent (sc-CO2) with a microcellular
foaming device in the procedure of pressure quenching. The foam production steps are: (a) put-ting the sample in a high-pressure vessel at room temperature; (b) increasing the pressure of vessel to foaming pressure (40 MPa) using sc-CO2; (c) sat-urating the samples at foaming pressure for 35 hours in the vessel; (d) depressurizing the vessel to atmospheric pressure; (e) removing the samples out of vessel and placing them at room temperature; (f) immersing the samples in a glycerin bath for dif-ferent times of 90, 180, and 270 seconds at different foaming temperatures of 155 °C, 165 °C, and 175 °C. It should be noted that the certain foaming temper-atures were chosen based on the reasons given in reference [10] within the PP melting range. In fact, the temperatures higher than 175 °C and lower than 155°C have been investigated, but the results have not been presented. The reason for not presenting these temperature results are that at temperatures lower than 155 °C, the sample is not foamed and at the temperatures higher than 175 °C, the samples are deformed. Various foaming times and tempera-tures of prepared samples and samples names are tabulated in Table 1. It should be noted that in the samples name, the PP is the abbreviation of poly-propylene, the first number indicates different foaming times (90, 180, and 270 sec) and the second number represents the different foaming tempera-tures (155, 165, and 175 °C). For example, in the PP90-155 sample, the foaming time is 90 seconds, and the foaming temperature is 155 °C.
2.4. Morphological and Structural Characteriza-tion
The Prepared parts of PP foam samples were in-vestigated using X-ray diffraction (XRD). The XRD patterns of samples were registered using a D8 ad-vanced-Bruker with Cu×Kα≈1.5406 A°. The diffrac-tometer operated at 35 kV and 30 mA. All the values were determined as averages over five samples for each combination, and the average results are ex-pressed.
Table 1. Different foaming times and temperatures and samples names
Sample name
Foaming time (seconds)
Foaming tempera-ture (°C)
PP90-155 90 155 PP180-155 180 155 PP270-155 270 155 PP90-165 90 165 PP180-165 180 165 PP270-165 270 165 PP90-175 90 175 PP180-175 180 175 PP270-175 270 175

228 A. Albooyeh et al. / Mechanics of Advanced Composite Structures 6 (2019) 225 - 237
For scanning electron microscope (SEM) observa-tion, the foamed samples were immersed in liquid ni-trogen for the time of 5 min and, then, freeze-frac-tured to provide the surfaces. The fracture surface of the PP foam was investigated by the SEM (Tescan VEGA II) at an accelerating voltage of 15 kV. A thin layer of gold was sputtered on the surface of the spec-imens for electrical conductivity (using Emitech K350) [25].
The cellular structures of foamed samples, includ-ing the cell size and cell density, were quantitatively characterized through the analysis of the SEM images using the Scion Image software. The cell size was characterized by the mean diameter of the dispersed cells, and the cell density was calculated based on the number of dispersed cells per unit volume [12]. By analyzing the SEM images, the mean diameter (d̅) and density (ρ
c) of cells were calculated with Eq. (1) and
Eq. (2), respectively [12].
d̅=∑ di
ni=1
n (1)
ρc=(
NM2
A)
32⁄
(2)
where di is the single cell diameter, n is the number of counted cells, A is the area of SEM micrograph, N is the number of cells in area A, and M is the magnifica-tion factor of SEM micrograph. Three zones, each of which contains about 50 cells, were selected ran-domly from the SEM micrographs of each sample to evaluate the mean diameter and density of cells. The density of the samples was calculated by measuring the weight and volume of the samples directly.
2.5. Flexural Tests
Flexural properties of PP foam samples contain-ing flexural strength, flexural modulus, and elonga-tion at rupture point were investigated by three-point bending tests in accordance with ASTM: D790 standard. The universal testing machine GOTECH (Tcs-2000) at a crosshead speed of 10 mm/min and a thickness-to-span length ratio of 1:16 was carried out. The rectangular cube samples (100 mm × 13 mm × 5mm) were used. All the values were determined as averages over five samples for each combination. Fig. 1 shows the experimental set-up and a schematic form of a three-point bending test sample.
By analyzing the stress-strain curves of the three-point bending test, flexural strength (𝜎𝑓), flexural
modulus (𝐸𝐵), and elongation at rupture point (𝜀𝑓)
were calculated through Eqs. (3), (4), and (5), respec-tively.
σf=3fl
2bh2 (3)
EB=l3m
4bh3 (4)
εf=6snh
l2 (5)
where m is the slope of the linear region of the force-displacement curve obtained from the bending test machine, b is the width of the sample, h is the thick-ness of sample, l is the gage length of machine, s is the extension of the sample during the applied force, and f is the applied force from the machine.
2.6. Izod impact Tests
Izod impact test was estimated with an impact Ceast tester (model 6958) according to ASTM: D256 standard at room temperature. All the values were determined as averages over five samples for each combination. The samples were notched with a BHO-CA machine according to ASTM: A370-E23 standard before testing. Fig. 2 shows a schematic form of the izod impact test.
Fig. 1. (a) The experimental setup of three-point bending test
and (b) schematic form of the three-point bending test sample
Fig. 2. A schematic form of izod impact test sample

A. Albooyeh et al. / Mechanics of Advanced Composite Structures 6 (2019) 225 - 237 229
2.7. Dynamic Mechanical Thermal Analysis (DMTA)
DMTA was performed on the rectangular speci-mens (46 mm × 11 mm × 1 mm) using Tritec 2000 machine, manufactured by Triton technology of Eng-land, according to the ASTM: D4065 standard. This test was performed at the frequency of 1 Hz and in a three-point bending state in the non-isothermal con-ditions and in the very low strain that the material is located in the linear viscoelastic region and follows the Hooke's law. Also, the test was performed within the temperature range of -110 to 150 °C with a heat-ing rate of 3 °C.min-1. The values of the storage mod-ulus or reversible energy (E'), the damping coeffi-cient, or loss factor (Tanδ) and the glass transition temperature (Tg) were extracted for different sam-ples. In this test, three specimens for each composi-tion were used.
2.8. Water Absorption Test
Water-uptake measurements were applied to es-timate the amount of hydrophobicity of PP foams. Ac-cording to ASTM D570, specimens with dimensions of 77 × 25 × 3.2 were cut from samples and used for the water absorption tests. In the water absorption test, the specimens were completely immersed in distilled water at room temperature. It should be noted that higher hydrophobicity led to a lower in-crease in the mass of samples.
In order to dry the specimens, all samples were placed in the oven at 110 °C for 20 min before the tests. Then, the dried samples were weighed and were soaked in the distilled water for one hour, one day, and one week, respectively. The samples were weighed in each time step. Finally, the percentage of mass increase was recorded. Water-uptake of PP samples at time t was calculated using Eq. (6).
%Water-uptake=Mt-M
M×100 (6)
where Mt is the mass increase of the sample at time t, and M0 is the initial mass of the sample.
3. Results and Discussion
3.1. Saturation Time of Samples
The sample was placed in the vessel at a constant pressure of 40 MPa and at different times of 12, 24, 36, and 48 hours to assess the saturation time. The sample was weighed after leaving the vessel. The time required for sample saturation by CO2 gas is given in Fig. 2. The saturation time is approximately 35 hours, as seen in Fig. 3. The weight of the samples remained constant after 35 hours, indicating that the sample is saturated with gas.
Fig. 3. Changes in sample weight at different times
Table 2.The relative density of different samples
Sample name Relative density PP90-155 0.98 PP180-155 0.97 PP270-155 0.95 PP90-165 0.94 PP180-165 0.81 PP270-165 0.72 PP90-175 0.83 PP180-175 0.65 PP270-175 0.60
3.2. Relative Density
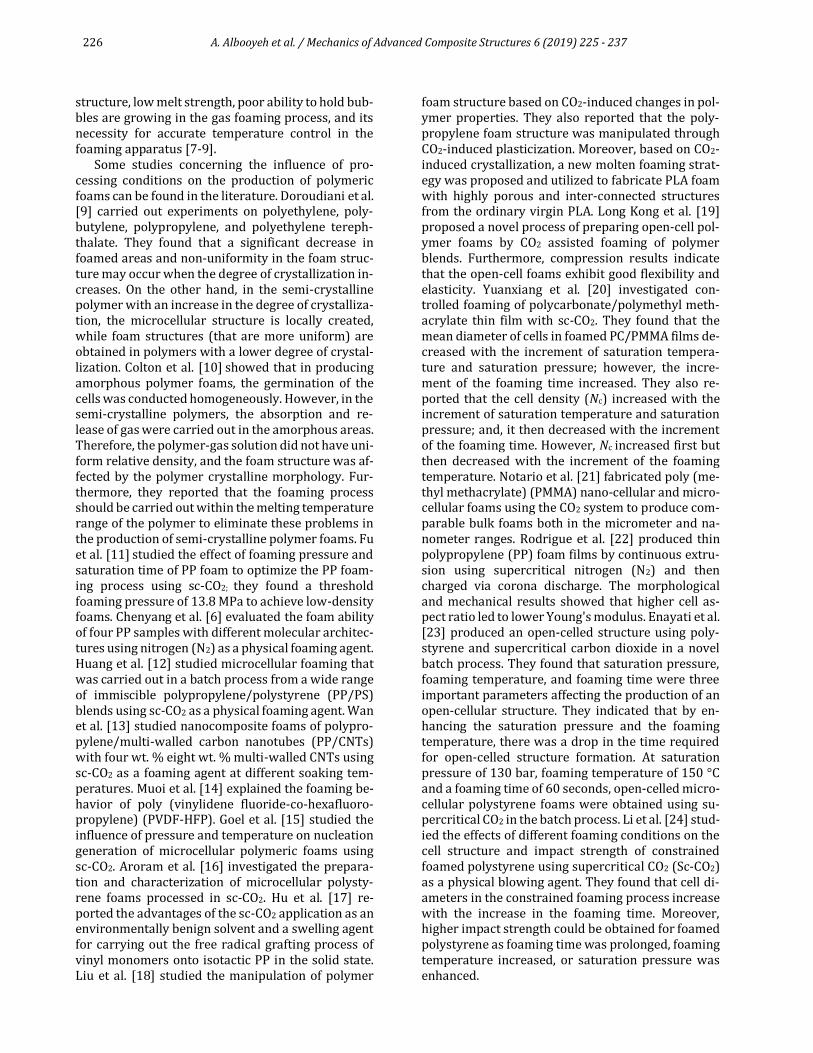
Relative density was calculated by Eq. (7). Fig. 4 shows the variation of relative foam density as a func-tion of foaming time and temperature. The relative den-sities of different samples are presented in Table 2.
Relative Density=Density of foamed sample
Density of solid sample (7)
As shown in Fig. 4, the foaming temperature and time have a significant influence on the relative density of foamed samples. With increasing the foaming time from 90 to 270 seconds and foaming temperature from 155 °C to 175 °C, the relative density decreases. The density reductions of PP90-165 and PP90-175 samples with respect to PP90-155 sample are 3.2% and 14.96%, respectively. Moreover, the relative density reductions for PP180-165 and PP180-175 samples with respect to PP180-155 are 16.70% and 32.57%, respectively. Den-sity reductions for foaming times of 270 seconds and foaming temperatures of 165 °C and 175 °C are 23.73% and 31.79% with respect to time of 90 seconds and tem-perature of 155 °C, respectively. By placing the samples in the hot glycerin bath, due to the reduced solubility of the gas at high temperature, a thrust force is produced to remove gas from the polymer matrix. The thrust force causes the saturated gas molecules to penetrate into the bubbles and make them grow. Therefore, with increasing time and temperature, larger bubbles are created, and the density decreases [26]. On the other hand, the lower density at higher temperatures can be explained by the effect of high temperature stimulation on the thrust and penetration of gases into produced bubbles. This result is in agreement with those derived by other researchers [9, 10, 20].
230 A. Albooyeh et al. / Mechanics of Advanced Composite Structures 6 (2019) 225 - 237
Fig. 4. The relative density of different foaming conditions
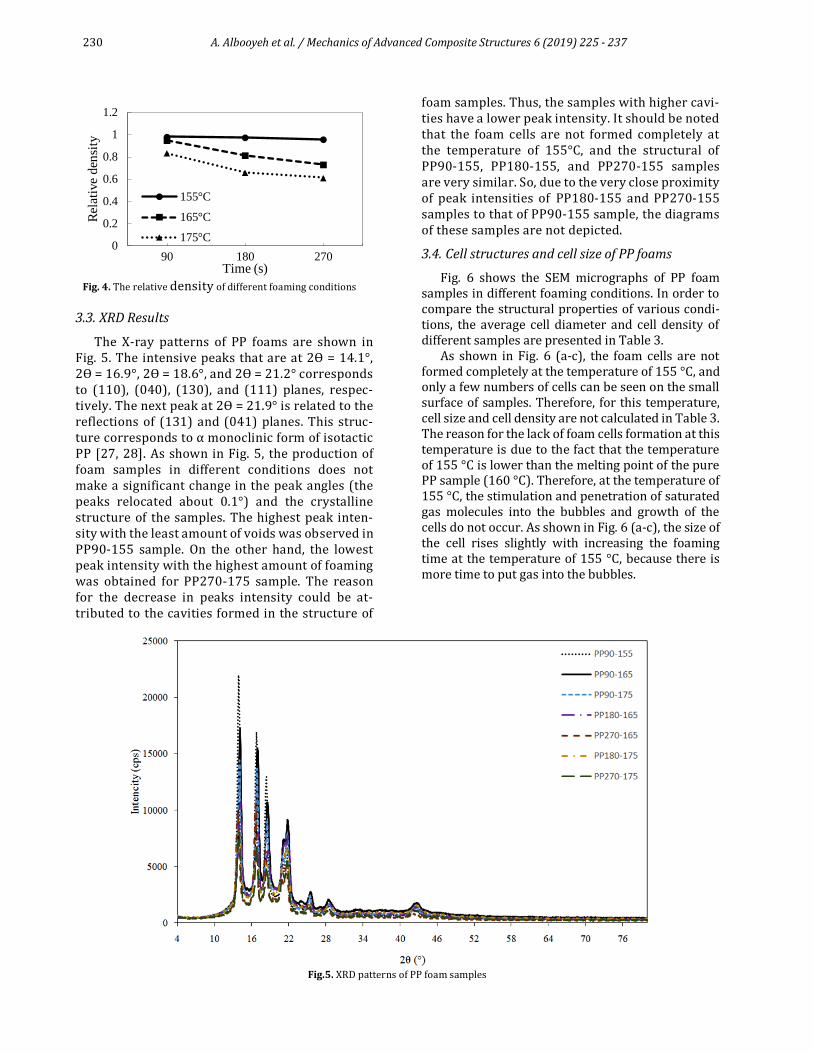
3.3. XRD Results
The X-ray patterns of PP foams are shown in Fig. 5. The intensive peaks that are at 2ϴ = 14.1°, 2ϴ = 16.9°, 2ϴ = 18.6°, and 2ϴ = 21.2° corresponds to (110), (040), (130), and (111) planes, respec-tively. The next peak at 2ϴ = 21.9° is related to the reflections of (131) and (041) planes. This struc-ture corresponds to α monoclinic form of isotactic PP [27, 28]. As shown in Fig. 5, the production of foam samples in different conditions does not make a significant change in the peak angles (the peaks relocated about 0.1°) and the crystalline structure of the samples. The highest peak inten-sity with the least amount of voids was observed in PP90-155 sample. On the other hand, the lowest peak intensity with the highest amount of foaming was obtained for PP270-175 sample. The reason for the decrease in peaks intensity could be at-tributed to the cavities formed in the structure of
foam samples. Thus, the samples with higher cavi-ties have a lower peak intensity. It should be noted that the foam cells are not formed completely at the temperature of 155°C, and the structural of PP90-155, PP180-155, and PP270-155 samples are very similar. So, due to the very close proximity of peak intensities of PP180-155 and PP270-155 samples to that of PP90-155 sample, the diagrams of these samples are not depicted.
3.4. Cell structures and cell size of PP foams
Fig. 6 shows the SEM micrographs of PP foam samples in different foaming conditions. In order to compare the structural properties of various condi-tions, the average cell diameter and cell density of different samples are presented in Table 3.
As shown in Fig. 6 (a-c), the foam cells are not formed completely at the temperature of 155 °C, and only a few numbers of cells can be seen on the small surface of samples. Therefore, for this temperature, cell size and cell density are not calculated in Table 3. The reason for the lack of foam cells formation at this temperature is due to the fact that the temperature of 155 °C is lower than the melting point of the pure PP sample (160 °C). Therefore, at the temperature of 155 °C, the stimulation and penetration of saturated gas molecules into the bubbles and growth of the cells do not occur. As shown in Fig. 6 (a-c), the size of the cell rises slightly with increasing the foaming time at the temperature of 155 °C, because there is more time to put gas into the bubbles.
Fig.5. XRD patterns of PP foam samples
0
0.2
0.4
0.6
0.8
1
1.2
90 180 270
Rel
ativ
e den
sity
Time (s)
155°C
165°C
175°C
A. Albooyeh et al. / Mechanics of Advanced Composite Structures 6 (2019) 225 - 237 231
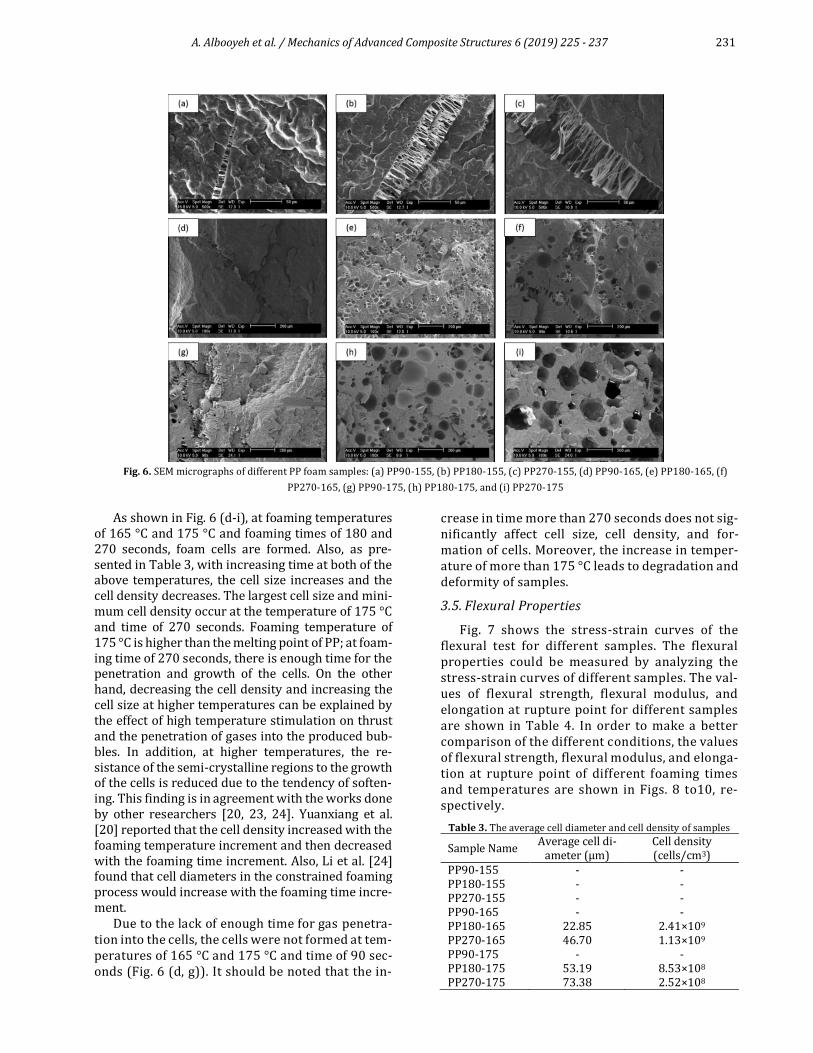
Fig. 6. SEM micrographs of different PP foam samples: (a) PP90-155, (b) PP180-155, (c) PP270-155, (d) PP90-165, (e) PP180-165, (f)
PP270-165, (g) PP90-175, (h) PP180-175, and (i) PP270-175
As shown in Fig. 6 (d-i), at foaming temperatures
of 165 °C and 175 °C and foaming times of 180 and 270 seconds, foam cells are formed. Also, as pre-sented in Table 3, with increasing time at both of the above temperatures, the cell size increases and the cell density decreases. The largest cell size and mini-mum cell density occur at the temperature of 175 °C and time of 270 seconds. Foaming temperature of 175 °C is higher than the melting point of PP; at foam-ing time of 270 seconds, there is enough time for the penetration and growth of the cells. On the other hand, decreasing the cell density and increasing the cell size at higher temperatures can be explained by the effect of high temperature stimulation on thrust and the penetration of gases into the produced bub-bles. In addition, at higher temperatures, the re-sistance of the semi-crystalline regions to the growth of the cells is reduced due to the tendency of soften-ing. This finding is in agreement with the works done by other researchers [20, 23, 24]. Yuanxiang et al. [20] reported that the cell density increased with the foaming temperature increment and then decreased with the foaming time increment. Also, Li et al. [24] found that cell diameters in the constrained foaming process would increase with the foaming time incre-ment.
Due to the lack of enough time for gas penetra-tion into the cells, the cells were not formed at tem-peratures of 165 °C and 175 °C and time of 90 sec-onds (Fig. 6 (d, g)). It should be noted that the in-
crease in time more than 270 seconds does not sig-nificantly affect cell size, cell density, and for-mation of cells. Moreover, the increase in temper-ature of more than 175 °C leads to degradation and deformity of samples.
3.5. Flexural Properties
Fig. 7 shows the stress-strain curves of the flexural test for different samples. The flexural properties could be measured by analyzing the stress-strain curves of different samples. The val-ues of flexural strength, flexural modulus, and elongation at rupture point for different samples are shown in Table 4. In order to make a better comparison of the different conditions, the values of flexural strength, flexural modulus, and elonga-tion at rupture point of different foaming times and temperatures are shown in Figs. 8 to10, re-spectively.
Table 3. The average cell diameter and cell density of samples
Sample Name Average cell di-
ameter (µm) Cell density (cells/cm3)
PP90-155 - - PP180-155 - - PP270-155 - - PP90-165 - - PP180-165 22.85 2.41×10⁹ PP270-165 46.70 1.13×10⁹ PP90-175 - - PP180-175 53.19 8.53×10⁸ PP270-175 73.38 2.52×10⁸

232 A. Albooyeh et al. / Mechanics of Advanced Composite Structures 6 (2019) 225 - 237
Fig .7. Stress-strain diagram of different samples
Table 4. Flexural properties of different samples
Sample Name Flexural strength (MPa) Flexural modulus (MPa) Elongation at rupture point (%) PP90-155 46.40±0.77 1304.20±31.2 8.8±0.1
PP180-155 44.13±0.71 1183.50±26.4 9.3±0.1 PP270-155 42.19±0.42 1145.01±21.2 9.7±0.1 PP90-165 42.94±0.33 1126.80±21.5 10.1±0.1
PP180-165 29.75±0.41 748.65±19.1 11.3±0.2 PP270-165 27.17±0.40 683.34±18.4 11.8±0.2 PP90-175 36.39±0.43 980.66±20.6 10.5±0.2
PP180-175 21.58±0.42 520.78±14.3 12.3±0.3 PP270-175 17.93±0.32 367.72±12.7 13.6±0.3
Fig.8. Flexural strength of different samples
Fig. 9. Flexural modulus of different samples
Fig. 10. Elongation at rupture point of different samples
The results of the flexural test indicate that the
flexural strength and flexural modulus decrease with increasing the foaming time at a constant temperature. The reduction rates of the men-tioned flexural properties for PP180-155 and PP270-155 samples with respect to PP90-155 sample are 4.90% and 7.45% for flexural strength and 9.25% and 12.20% for flexural modulus, re-spectively. Another important result of the flex-ural test is the reduction of the mentioned flex-ural properties with increasing the temperature in constant time. The flexural strength and flex-
0
5
10
15
20
25
30
35
40
45
50
0 5 10 15 20
Str
ess
(M
Pa
)
Strain (%)
PP90-155PP180-155PP270-155PP90-165PP180-165PP270-165PP90-175PP180-175PP270-175
0
10
20
30
40
50
90 180 270
Fle
xura
l str
engt
h (
MP
a)
Time (s)
155°C
165°C
175°C
0
200
400
600
800
1000
1200
1400
90 180 270Fle
xura
l mo
du
lus
(MP
a)
Time (s)
155°C
165°C
175°C
0
5
10
15
90 180 270Elo
nga
tio
n a
t ru
ptu
re p
oin
t (%
)
Time (s)
155°C
165°C
175°C
A. Albooyeh et al. / Mechanics of Advanced Composite Structures 6 (2019) 225 - 237 233
ural modulus for PP90-165 and PP90-175 sam-ples relative to PP90-155 sample are 9.06% and 21.57% for flexural strength and 13.60% and 24.80% for flexural modulus, respectively. Fur-thermore, these flexural properties for PP180-165 and PP180-175 samples relative to PP180-155 sample are 32.58% and 51.09% for flexural strength and 36.74% and 55.99% for flexural modulus, respectively. The flexural strength and flexural modulus for PP270-165 and PP270-175 samples relative to PP270-155 sample are 37.73% and 58.23% for flexural strength and 40.32% and 67.88% for flexural modulus, respec-tively. According to the obtained results, it is clear that the presence of cavities would reduce the flexural strength and flexural modulus of sam-ples. In other words, the cells in the structure of the samples are the stress concentration location during bending loads, reducing the mentioned flexural properties of the samples.
According to the obtained results from the flex-ural and structural characteristics of samples, it is clear that PP270-175 sample has maximum cell size and minimum cell density as well as minimum flex-ural properties. In other words, because of the den-sity reduction of foam samples, foams exhibit values of flexural properties significantly lower than the val-ues of unfoamed samples. The introduction of voids invariably reduces absolute strength because it re-duces the amount of load-carrying materials [25].
As shown in Fig. 10, by enhancing the foaming time and temperature, the elongation at rupture point increases continuously. The maximum increase of elongation at rupture point occurs for PP270-175 sample. The existing cells in the structure of samples lead to the softening of the samples and an increase in the value of elongation at rupture point. Therefore, PP270-175 sample, which has the highest amount of foaming, shows the highest value of elongation. In ad-dition, this result is confirmed by the fact that the temperature of 175 °C and time of 270 seconds are the best conditions for PP foam production.
3.6. Izod Impact Properties
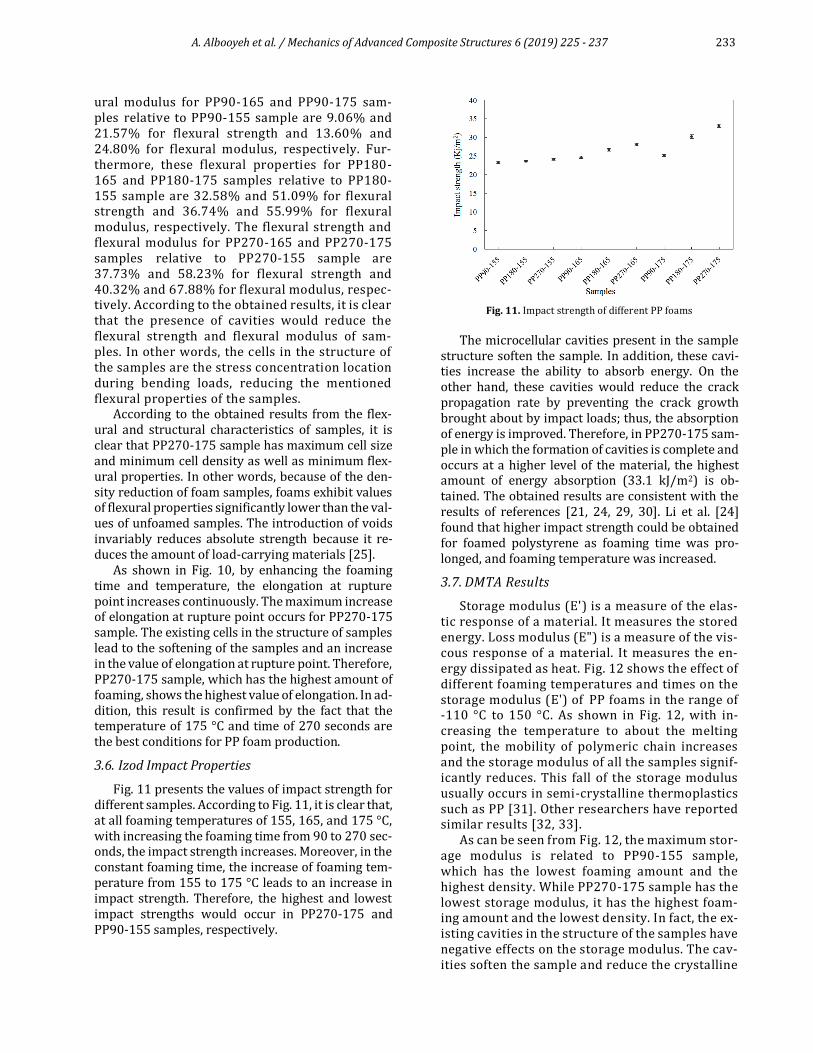
Fig. 11 presents the values of impact strength for different samples. According to Fig. 11, it is clear that, at all foaming temperatures of 155, 165, and 175 °C, with increasing the foaming time from 90 to 270 sec-onds, the impact strength increases. Moreover, in the constant foaming time, the increase of foaming tem-perature from 155 to 175 °C leads to an increase in impact strength. Therefore, the highest and lowest impact strengths would occur in PP270-175 and PP90-155 samples, respectively.
Fig. 11. Impact strength of different PP foams
The microcellular cavities present in the sample structure soften the sample. In addition, these cavi-ties increase the ability to absorb energy. On the other hand, these cavities would reduce the crack propagation rate by preventing the crack growth brought about by impact loads; thus, the absorption of energy is improved. Therefore, in PP270-175 sam-ple in which the formation of cavities is complete and occurs at a higher level of the material, the highest amount of energy absorption (33.1 kJ/m2) is ob-tained. The obtained results are consistent with the results of references [21, 24, 29, 30]. Li et al. [24] found that higher impact strength could be obtained for foamed polystyrene as foaming time was pro-longed, and foaming temperature was increased.
3.7. DMTA Results
Storage modulus (E') is a measure of the elas-tic response of a material. It measures the stored energy. Loss modulus (E") is a measure of the vis-cous response of a material. It measures the en-ergy dissipated as heat. Fig. 12 shows the effect of different foaming temperatures and times on the storage modulus (E') of PP foams in the range of -110 °C to 150 °C. As shown in Fig. 12, with in-creasing the temperature to about the melting point, the mobility of polymeric chain increases and the storage modulus of all the samples signif-icantly reduces. This fall of the storage modulus usually occurs in semi-crystalline thermoplastics such as PP [31]. Other researchers have reported similar results [32, 33].
As can be seen from Fig. 12, the maximum stor-age modulus is related to PP90-155 sample, which has the lowest foaming amount and the highest density. While PP270-175 sample has the lowest storage modulus, it has the highest foam-ing amount and the lowest density. In fact, the ex-isting cavities in the structure of the samples have negative effects on the storage modulus. The cav-ities soften the sample and reduce the crystalline

234 A. Albooyeh et al. / Mechanics of Advanced Composite Structures 6 (2019) 225 - 237
areas. When applying bending loads, the sample weakens, and storage modulus reduces.
Another remarkable point is that the samples with smaller average cell diameters and higher cell densities have larger storage modulus. This tendency corresponds to the flexural modulus presented by the flexural test.
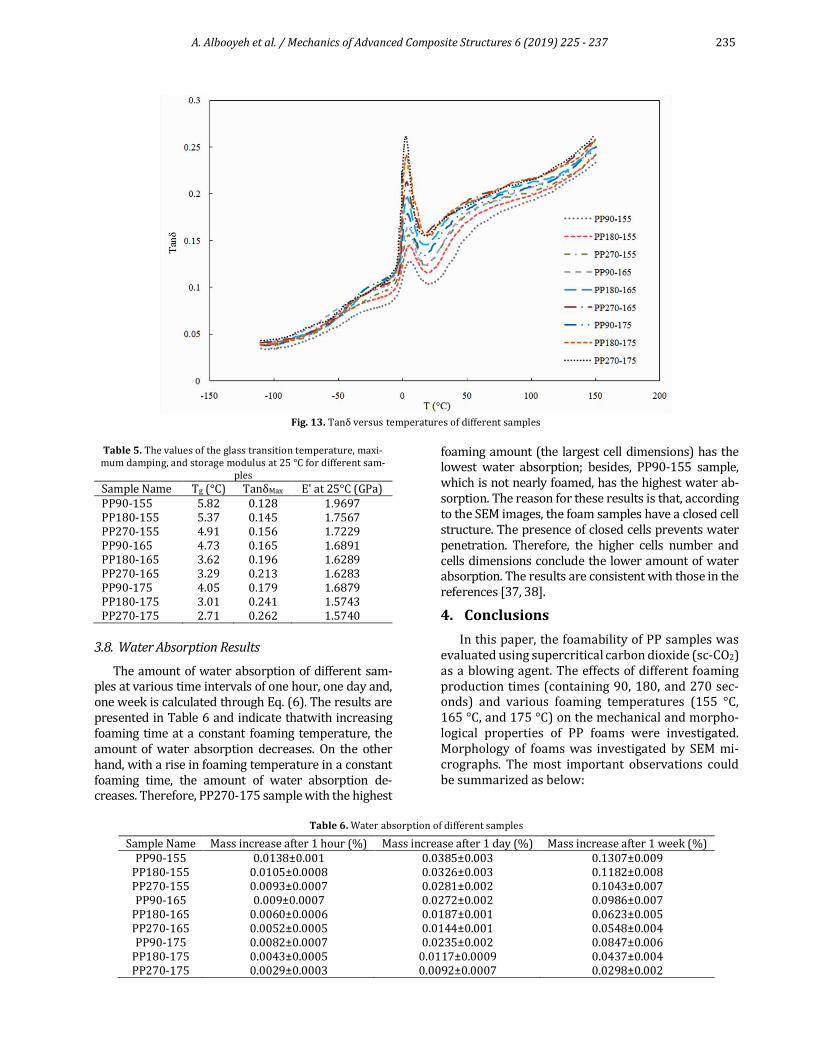
In the dynamic modulus-temperature curve, the storage modulus (E') at a specific temperature has maximum curvature. At this point, the loss factor (Tanδ) has the maximum peak, called the glass transition temperature (Tg) [34].
Tanδ is the ratio of loss to the storage modulus and is called damping. It is a measure of the en-ergy dissipation for a material. Mechanical losses in intermittent loading are generally known as damping. For this reason, the performance of the damping of materials in relation to their rigidity can be a good description of the total damping of materials [35, 36]. Fig. 13 shows the Tanδ graph regarding temperature for different samples. As shown in Fig. 13, the glass transition temperature for all samples is between 2 and 6 °C, and no sig-nificant change in the glass transition tempera-ture occurs when the foaming conditions change. In addition, PP90-155 sample has the highest glass transition temperature (5.82 °C) due to higher rigidity; PP270-175 sample has the lowest glass transition temperature (2.71 °C) due to the softening, which has been resulted from cavities.
As presented in Fig. 13, at temperatures lower than Tanδ peak, the amount of damping is small, and almost
all stored energy in material deformation is rapidly re-stored when the stress is removed. On the other hand, the molecular slides are very small at these tempera-tures, which is the reason for the damping reduction at temperatures lower than the peaks of the graph. At a temperature of maximum damping (Tanδ), some of the molecular chains can move freely, while the other parts are motionless. When stress is applied to the motion-less part in the chain, the part starts moving in such a way as to reduce the stress on it. Therefore, after mov-ing, due to the reduced stress, the considered part has a lower stored energy amount, and its excess energy is wasted as heat on the damping peak. In a small temper-ature range after Tanδ peak, a significant portion of the polymeric chain is animated, and the adhesion of the polymer reduces; and as a result, energy dissipation de-creases [36].
Another important result extracted from Fig. 13 is that PP270-175 and PP90-155 samples have the high-est and lowest damping ratios in the samples, respec-tively. In addition, samples which are better foamed and cells formed in their structure have better damping properties. In other words, the foaming agent, by creat-ing closed cell cavities in the structure of the samples, increases the energy absorption capacity of the cavities.
Table 5 presents a summary of the results obtained from the DMTA test of the samples. Comparison of stor-age modulus (E') and flexural modulus (E) shows ac-cordance of the values obtained for various samples, confirming the results of both DMTA and flexural tests.
Fig. 12. Storage modulus versus temperatures of different samples
A. Albooyeh et al. / Mechanics of Advanced Composite Structures 6 (2019) 225 - 237 235
Fig. 13. Tanδ versus temperatures of different samples
Table 5. The values of the glass transition temperature, maxi-mum damping, and storage modulus at 25 °C for different sam-
ples
Sample Name Tg (°C) TanδMax E' at 25°C (GPa) PP90-155 5.82 0.128 1.9697 PP180-155 5.37 0.145 1.7567 PP270-155 4.91 0.156 1.7229 PP90-165 4.73 0.165 1.6891 PP180-165 3.62 0.196 1.6289 PP270-165 3.29 0.213 1.6283 PP90-175 4.05 0.179 1.6879 PP180-175 3.01 0.241 1.5743 PP270-175 2.71 0.262 1.5740
3.8. Water Absorption Results
The amount of water absorption of different sam-ples at various time intervals of one hour, one day and, one week is calculated through Eq. (6). The results are presented in Table 6 and indicate thatwith increasing foaming time at a constant foaming temperature, the amount of water absorption decreases. On the other hand, with a rise in foaming temperature in a constant foaming time, the amount of water absorption de-creases. Therefore, PP270-175 sample with the highest
foaming amount (the largest cell dimensions) has the lowest water absorption; besides, PP90-155 sample, which is not nearly foamed, has the highest water ab-sorption. The reason for these results is that, according to the SEM images, the foam samples have a closed cell structure. The presence of closed cells prevents water penetration. Therefore, the higher cells number and cells dimensions conclude the lower amount of water absorption. The results are consistent with those in the references [37, 38].
4. Conclusions
In this paper, the foamability of PP samples was evaluated using supercritical carbon dioxide (sc-CO2) as a blowing agent. The effects of different foaming production times (containing 90, 180, and 270 sec-onds) and various foaming temperatures (155 °C, 165 °C, and 175 °C) on the mechanical and morpho-logical properties of PP foams were investigated. Morphology of foams was investigated by SEM mi-crographs. The most important observations could be summarized as below:
Table 6. Water absorption of different samples
Sample Name Mass increase after 1 hour (%) Mass increase after 1 day (%) Mass increase after 1 week (%) PP90-155 0.0138±0.001 0.0385±0.003 0.1307±0.009
PP180-155 0.0105±0.0008 0.0326±0.003 0.1182±0.008 PP270-155 0.0093±0.0007 0.0281±0.002 0.1043±0.007 PP90-165 0.009±0.0007 0.0272±0.002 0.0986±0.007
PP180-165 0.0060±0.0006 0.0187±0.001 0.0623±0.005 PP270-165 0.0052±0.0005 0.0144±0.001 0.0548±0.004 PP90-175 0.0082±0.0007 0.0235±0.002 0.0847±0.006
PP180-175 0.0043±0.0005 0.0117±0.0009 0.0437±0.004 PP270-175 0.0029±0.0003 0.0092±0.0007 0.0298±0.002
236 A. Albooyeh et al. / Mechanics of Advanced Composite Structures 6 (2019) 225 - 237
1- Results showed that mechanical and morpho-logical properties of PP foams depend on both foam-ing time and temperature.
2- The results of mechanical, physical, and struc-tural properties showed that the best conditions of producing PP foams are the temperature of 175°C and time of 270 seconds.
3- In the mentioned conditions, the sample had the lowest cell density and relative density and the largest cell size.
4- The highest amount of foaming was observed at the temperature of 175 °C and time of 270 seconds.
5- The results of the flexural test showed that at the temperature of 175 °C and time of 270 seconds, the sample had the minimum flexural strength and flexural modulus and maximum elongation at rup-ture point.
6- The maximum value of impact strength and a minimum amount of water absorption occurred in PP270-175 sample.
7- DMTA showed that higher amount of damping characteristics and a lower amount of storage modu-lus were obtained at the foaming temperature of 175 °C and foaming time of 270 seconds.
8- Due to the difficulty of foam production from semi-crystalline polymers such as PP, optimized con-ditions in this paper can be used to produce PP foams as industrial foams.
9- In the semi-crystalline polymers such as PP, the foaming temperature should be higher than the melt-ing temperature of the polymer, unlike the amor-phous polymers in which the temperature of foaming usually is determined within a glass transition tem-perature range.
References
[1] Kumar V. Microcellular polymers: novel materials for the 21st century. Cellular Polymers 1993; 12(3): 207-23.
[2] Tomasko DL, Li H, Liu D, Han X, Wingert MJ, Lee LJ, et al. A Review of CO2Applications in the Processing of Polymers. Indust & Engin Chemis Res 2003; 42(25): 6431-56.
[3] Suh KW, Park CP, Maurer MJ, Tusim MH, Genova RD, Broos R, et al. Lightweight Cellular Plastics. Advanced Materials 2000; 12(23): 1779-89.
[4] Krause B, Sijbesma HJP, Münüklü P, van der Vegt NFA, Wessling M. Bicontinuous Nanoporous Polymers by Carbon Dioxide Foaming. Macromolecules 2001; 34(25): 8792-801.
[5] Naguib HE, Park CB, Panzer U, Reichelt N. Strategies for achieving ultra low-density polypropylene foams. Polymer Engin & Sci 2002; 42(7): 1481-92.
[6] Park CB, Cheung LK. A study of cell nucleation in the extrusion of polypropylene foams. Polymer Engin & Sci 1997; 37(1): 1-10.
[7] Yu C, Wang Y, Wu B, Xie Y, Yu C, Chen S, et al. Evaluating the foamability of polypropylene with nitrogen as the blowing agent. Polymer Testing 2011; 30(8): 887-92.
[8] Xu ZM, Jiang XL, Liu T, Hu GH, Zhao L, Zhu ZN, et al. Foaming of polypropylene with supercritical carbon dioxide. J Supercritical Fluids 2007; 41(2): 299-310.
[9] Doroudiani S, Park CB, Kortschot MT. Effect of the crystallinity and morphology on the microcellular foam structure of semicrystalline polymers. Polymer Engin & Sci 1996; 36(21): 2645-62.
[10] Colton JS, Suh NP. The nucleation of microcellular thermoplastic foam with additives: Part I: Theoretical considerations. Polymer Engin & Sci 1987; 27(7): 485-92.
[11] Fu D, Chen F, Kuang T, Li D, Peng X, Chiu DY, et al. Supercritical CO2 foaming of pressure-induced-flow processed linear polypropylene. Materials & Design 2016; 93: 509-13.
[12] Huang H, Xu HF. Preparation of microcellular polypropylene/polystyrene blend foams with tunable cell structure. Polymers for Adv Tech 2011; 22(6): 822-9.
[13] Wan F, Tran MP, Leblanc C, Béchet E, Plougonven E, Léonard A, et al. Experimental and computational micro-mechanical investigations of compressive properties of polypropylene/multi-walled carbon nanotubes nanocomposite foams. Mechanics of Materials 2015; 91: 95-118.
[14] Tang M, Wang TC. Foaming of poly(vinylidene fluoride-co-hexafluoropropylene) using supercritical carbon dioxide. J Taiwan Instit Chem Engin 2017; 73: 146-53.
[15] Goel SK, Beckman EJ. Generation of microcellular polymeric foams using supercritical carbon dioxide. I: Effect of pressure and temperature on nucleation. Polymer Engin & Sci 1994; 34(14): 1137-47.
[16] Arora KA, Lesser AJ, McCarthy TJ. Preparation and Characterization of Microcellular Polystyrene Foams Processed in Supercritical Carbon Dioxide. Macromolecules 1998; 31(14): 4614-20.
[17] Liu T, Hu GH, Tong GS, Zhao L, Cao GP, Yuan WK. Supercritical Carbon Dioxide Assisted Solid-State Grafting Process of Maleic Anhydride onto Polypropylene. Industl & Engin Chem Res 2005; 44(12): 4292-9.
[18] Liu T, Li D, Zhao L, Yuan W. Manipulation of polymer foam structure based on CO2-induced changes in polymer fundamental properties. Particuology 2010; 8(6): 607-12.
[19] Kong Wl, Bao JB, Wang J, Hu G, Xu Y, Zhao L. Preparation of open-cell polymer foams by CO 2
A. Albooyeh et al. / Mechanics of Advanced Composite Structures 6 (2019) 225 - 237 237
assisted foaming of polymer blends. Polymer 2016; 90: 331-41.
[20] Luo Y, Ding Y, Wang C, Tan L, Ying S. Controlled foaming of polycarbonate/polymethyl methacrylate thin film with supercritical carbon dioxide. J Thermoplast Compos Mat 2016; 30(12): 1713-27.
[21] Notario B, Pinto J, Rodríguez-Pérez MA. Towards a new generation of polymeric foams: PMMA nanocellular foams with enhanced physical properties. Polymer 2015; 63: 116-26.
[22] Mohebbi A, Mighri F, Ajji A, Rodrigue D. Polymer ferroelectret based on polypropylene foam: piezoelectric properties prediction using dynamic mechanical analysis. Polymers for Adv Tech 2017; 28(4): 476-83.
[23] Enayati M, Famili MHN, Janani H. Open-celled microcellular foaming and the formation of cellular structure by a theoretical pattern in polystyrene. Iranian Polymer J 2013; 22(6): 417-28.
[24] Li M, Cao X, Luo Y. Cell structure and impact properties of foamed polystyrene in constrained conditions using supercritical carbon dioxide. Iranian Polymer J 2014; 23(10): 775-81.
[25] Fereidoon A, Memarian S, Albooyeh A, Tarahomi S. Influence of mesoporous silica and hydroxyapatite nanoparticles on the mechanical and morphological properties of polypropylene. Materials & Design 2014; 57: 201-10.
[26] Park CB, Behravesh AH, Venter RD. A Strategy for the Suppression of Cell Coalescence in the Extrusion of Microcellular High-Impact Polystyrene Foams. 1997; 669: 115-29.
[27] Wang N, Gao N, Jiang S, Fang Q, Chen E. Effect of different structure MCM-41 fillers with PP-g-MA on mechanical and crystallization performances of polypropylene. Compos Part B: Engin 2011; 42(6): 1571-7.
[28] Weidinger A, Hermans PH. Die Makromolekulare Chemie 1961; 50(1): 98-115.
[29] Taherkhani A, Sadighi M, Vanini AS, Mahmoudabadi MZ. An experimental study of high-velocity impact on elastic–plastic
crushable polyurethane foams. Aerospace Scie & Tech 2016; 50: 245-55.
[30] Saemi E, Fereidoon A, Albooyeh A. The experimental investigation of mechanical and morphological properties of polystyrene. J Model Engin 2017; 15(20): 30.
[31] Karamipour S, Ebadi-Dehaghani H, Ashouri D, Mousavian S. Effect of nano-CaCO3 on rheological and dynamic mechanical properties of polypropylene: Experiments and models. Polymer Test 2011; 30(1): 110-7.
[32] Drozdov AD, Jensen EA, Christiansen JdC. Nonlinear time-dependent response of polypropylene/nanoclay melts: Experiments and modeling. Comput Mat Sci 2010; 47(3): 807-16.
[33] Abu-Zurayk R, Harkin-Jones E, McNally T, Menary G, Martin P, Armstrong C, et al. Structure–property relationships in biaxially deformed polypropylene nanocomposites. Composit Sci & Tech 2010; 70(9): 1353-9.
[34] Mortezaei M, Navid F, Kokabi M. Effect of surface modification of nano silica on the viscoelastic properties of its polystyrene nano composite. Polymer Sci & Tech 2009; 21(6): 523-31.
[35] Tham WL, Chow WS, Mohd Ishak ZA. Effects of titanate coupling agent on the mechanical, thermal, and morphological properties of poly(methyl methacrylate)/hydroxyapatite denture base composites. J Compos Mat 2011; 45(22): 2335-45.
[36] Pan Y, Xiong D, Gao F. Viscoelastic behavior of nano-hydroxyapatite reinforced poly(vinyl alcohol) gel biocomposites as an articular cartilage. J Mat Sci 2008; 19(5): 1963-9.
[37] Deng H, Reynolds CT, Cabrera NO, Barkoula NM, Alcock B, Peijs T. The water absorption behaviour of all-polypropylene composites and its effect on mechanical properties. Compos Part B: Engin 2010; 41(4): 268-75.
[38] Demir H, Atikler U, Balköse D, Tıhmınlıoğlu F. The effect of fiber surface treatments on the tensile and water sorption properties of polypropylene–luffa fiber composites. Compos Part A: Appl Sci & Manufact 2006; 37(3): 447-56.