Mechanical Properties of Nafion and Titania/Nafion...
19
Mechanical Properties of Nafion and Titania/Nafion Composite Membranes for Polymer Electrolyte Membrane Fuel Cells M. BARCLAY SATTERFIELD, 1 PAUL W. MAJSZTRIK, 2 HITOSHI OTA, 2 JAY B. BENZIGER, 1 ANDREW B. BOCARSLY 2 1 Department of Chemical Engineering, Princeton University, Princeton, New Jersey 08544 2 Chemistry Department, Princeton University, Princeton, New Jersey 08544 Received 23 January 2006; revised 21 March 2006; accepted 13 April 2006 DOI: 10.1002/polb.20857 Published online in Wiley InterScience (www.interscience.wiley.com). ABSTRACT: Measurements of the mechanical and electrical properties of Nafion and Nafion/titania composite membranes in constrained environments are reported. The elas- tic and plastic deformation of Nafion-based materials decreases with both the tempera- ture and water content. Nafion/titania composites have slightly higher elastic moduli. The composite membranes exhibit less strain hardening than Nafion. Composite mem- branes also show a reduction in the long-time creep of 40% in comparison with Nafion. Water uptake is faster in Nafion membranes recast from solution in comparison with extruded Nafion. The addition of 3–20 wt % titania particles has minimal effect on the rate of water uptake. Water sorption by Nafion membranes generates a swelling pressure of 0.55 MPa in 125-lm membranes. The resistivity of Nafion increases when the mem- brane is placed under a load. At 23 8C and 100% relative humidity, the resistivity of Nafion increases by 15% under an applied stress of 7.5 MPa. There is a substantial hy- steresis in the membrane resistivity as a function of the applied stress depending on whether the pressure is increasing or decreasing. The results demonstrate how the dynamics of water uptake and loss from membranes are dependent on physical con- straints, and these constraints can impact fuel cell performance. V V C 2006 Wiley Periodicals, Inc. J Polym Sci Part B: Polym Phys 44: 2327–2345, 2006 Keywords: ionomer; mechanical properties; Nafion; PEM fuel cells; polymer compo- sites; structure-property relations; water sorption INTRODUCTION Polymer electrolyte membrane (PEM) fuel cells based on perfluorinated membranes have success- fully been operated in a temperature range of approximately 50–90 8C. 1–3 Efforts to develop poly- mer membranes able to operate above 120 8C have been prompted by the additional benefits of enhanced carbon monoxide (CO) tolerance and improved heat removal. 4–8 The most significant barrier to running a polymer electrolyte fuel cell at elevated temperatures is maintaining the proton conductivity of the membrane. Most polymer membranes rely on absorbed water to ionize acid groups and permit proton transport. The conduc- tivity of a dry membrane is several orders of mag- nitude lower than that of a fully saturated mem- brane; proton conductivity increases exponentially with water activity in the membrane. Increasing the fuel cell temperature raises the vapor pressure required to keep a given amount of water in the membrane, thereby increasing the likelihood that water loss will occur and significantly reduce pro- ton conductivity. Correspondence to: J. B. Benziger (E-mail: benziger@princeton. edu) Journal of Polymer Science: Part B: Polymer Physics, Vol. 44, 2327–2345 (2006) V V C 2006 Wiley Periodicals, Inc. 2327
Transcript of Mechanical Properties of Nafion and Titania/Nafion...

Mechanical Properties of Nafion and Titania/NafionComposite Membranes for Polymer ElectrolyteMembrane Fuel Cells
M. BARCLAY SATTERFIELD,1 PAULW. MAJSZTRIK,2 HITOSHI OTA,2 JAY B. BENZIGER,1 ANDREW B. BOCARSLY2
1Department of Chemical Engineering, Princeton University, Princeton, New Jersey 08544
2Chemistry Department, Princeton University, Princeton, New Jersey 08544
Received 23 January 2006; revised 21March 2006; accepted 13 April 2006DOI: 10.1002/polb.20857Published online in Wiley InterScience (www.interscience.wiley.com).
ABSTRACT: Measurements of the mechanical and electrical properties of Nafion andNafion/titania composite membranes in constrained environments are reported. The elas-tic and plastic deformation of Nafion-based materials decreases with both the tempera-ture and water content. Nafion/titania composites have slightly higher elastic moduli.The composite membranes exhibit less strain hardening than Nafion. Composite mem-branes also show a reduction in the long-time creep of �40% in comparison with Nafion.Water uptake is faster in Nafion membranes recast from solution in comparison withextruded Nafion. The addition of 3–20 wt % titania particles has minimal effect on therate of water uptake. Water sorption by Nafion membranes generates a swelling pressureof �0.55 MPa in 125-lm membranes. The resistivity of Nafion increases when the mem-brane is placed under a load. At 23 8C and 100% relative humidity, the resistivity ofNafion increases by �15% under an applied stress of 7.5 MPa. There is a substantial hy-steresis in the membrane resistivity as a function of the applied stress depending onwhether the pressure is increasing or decreasing. The results demonstrate how thedynamics of water uptake and loss from membranes are dependent on physical con-straints, and these constraints can impact fuel cell performance. VVC 2006 Wiley Periodicals,
Inc. J Polym Sci Part B: Polym Phys 44: 2327–2345, 2006
Keywords: ionomer; mechanical properties; Nafion; PEM fuel cells; polymer compo-sites; structure-property relations; water sorption
INTRODUCTION
Polymer electrolyte membrane (PEM) fuel cellsbased on perfluorinated membranes have success-fully been operated in a temperature range ofapproximately 50–90 8C.1–3 Efforts to develop poly-mer membranes able to operate above 120 8C havebeen prompted by the additional benefits ofenhanced carbon monoxide (CO) tolerance andimproved heat removal.4–8 The most significant
barrier to running a polymer electrolyte fuel cell atelevated temperatures is maintaining the protonconductivity of the membrane. Most polymermembranes rely on absorbed water to ionize acidgroups and permit proton transport. The conduc-tivity of a dry membrane is several orders of mag-nitude lower than that of a fully saturated mem-brane; proton conductivity increases exponentiallywith water activity in the membrane. Increasingthe fuel cell temperature raises the vapor pressurerequired to keep a given amount of water in themembrane, thereby increasing the likelihood thatwater loss will occur and significantly reduce pro-ton conductivity.
Correspondence to: J. B. Benziger (E-mail: [email protected])
Journal of Polymer Science: Part B: Polymer Physics, Vol. 44, 2327–2345 (2006)VVC 2006Wiley Periodicals, Inc.
2327

Water management is a significant challengefor polymer electrolyte fuel cell operation. To keepthe membrane fully hydrated, it is essential toincrease the pressure in the fuel cell abovethe water vapor pressure. The other hydrationmethod—operating with fully humidified feeds—creates a situation in which water that has formedin the fuel cell can flood the gas flow channels.However, avoiding flooding by keeping the wateractivity below unity can dehydrate the membraneand reduce the proton conductivity. In addition,changes in the water activity result in dimensionalchanges of the polymer as the polymer absorbswater.9–14 Water sorption creates an internal pres-sure in the membrane that causes it to swellagainst the confinement of the electrodes.15 Theamount of water sorption of the membrane isdetermined by a balance between the membraneswelling pressure and the applied pressure fromthe electrode pressing against the membrane. Inaddition, the mechanical properties of the polymerchange as functions of the temperature and watercontent. Further complications can result fromtaking the polymer above its glass transition(�110 8C for dry protonated Nafion),16–19 whichcan cause polymer chain rearrangements, leadingto structural changes in the membrane at the mo-lecular scale. These changes in the polymer prop-erties may lower the membrane stability, perform-ance, and lifetime.20–22
We have studied the dynamic performance offuel cell startup from a dry state and the currentresponse to changes in the load. We have observeda multistep change in the current; this suggeststhat the membrane swells as it absorbs water,which alters the membrane electrode interface. Ithas also been observed that increasing the appliedpressure sealing the fuel cell causes the internalmembrane electrode assembly (MEA) resistance toincrease, and this has been attributed to the physi-cal confinement of the Nafion membrane in a fuelcell limiting the water absorbed.15,23
The addition of an inorganic material to a poly-mer membrane can alter and improve the physicaland chemical polymer properties of interest [e.g.,elastic modulus, proton conductivity, solvent per-meation rate, tensile strength, hydrophilicity, andglass-transition temperature (Tg)] while retainingthe polymer properties important to enabling theoperation in the fuel cell. A number of investiga-tors have examined composite membranes for usein polymer electrolyte fuel cells.7,8,24–35 The com-posite membranes may also improve the water-retention properties of these membranes under
low-humidity conditions. We have examined anumber of composite polymer/inorganic mem-branes (Nafion/zirconium phosphate, Nafion/tita-nia, Nafion/silica, and Nafion/alumina) in fuel cellsat elevated temperatures. Little correlation hasbeen found between the fuel cell performance andchemical formulation, and this has led us to sug-gest that mechanical properties may play an im-portant role in the improved performance ofNafion composite membranes in fuel cells.
Because of the evidence for mechanical proper-ties affecting the water content of a polymer mem-brane, a program was initiated to measure thephysical and mechanical properties of Nafion andNafion composite membranes, especially under con-ditions relevant to PEM fuel cell operation (elevatedtemperature, elevated water activity, and con-strained environments). In this article, we describea variety of physical, mechanical, and electricalmeasurements for Nafion and Nafion/titania com-posite membranes. Some are standard measure-ments, such as weight gain, dimensional changes,and tensile testing. Other measurements are lesscommon, including long-term creep, swelling pres-sure, and proton conductivity under load. Several ofthese new measurement techniques permit us tofollow the dynamic changes of polymer ionomers.These measurements give greater appreciation ofthe complex property changes of the polymer mem-branes in the environment of a fuel cell.
EXPERIMENTAL
Membrane Preparation
Extruded Nafion 115 films (DuPont) were used asthe base material against which other membraneformulations were compared. Recast Nafion mem-branes were prepared from a 15 wt % Nafion solu-tion (Liquion 1100, Ion Power) mixed with isopro-pyl alcohol (IPA). The solution was cast onto a flat,glass surface, and the solvent was removed at�70 8C. After the solvent was removed, the mem-branes were annealed at �165 8C for 1 h. To obtainuniform, high-purity films, the membranes werecleaned with a standard treatment procedure: (1)boiling in 3% hydrogen peroxide for 1 h to oxidizeorganic impurities, (2) rinsing with boiling waterfor 1 h, (3) boiling in 0.5 M sulfuric acid for 1 h toremove ionic impurities, and (4) rinsing again inboiling water to remove any excess acid.
Nafion/TiO2 composite membranes were pre-pared by the recasting of a 15 wt % Nafion solution
2328 SATTERFIELD ET AL.
Journal of Polymer Science: Part B: Polymer PhysicsDOI 10.1002/polb

(Ion Power) mixed with a solvent [IPA, ethanol(EtOH), or dimethyl sulfoxide (DMSO)] and TiO2
particles. A variety of different sources and prepa-rations of TiO2 particles have been examined. Inthis article, we focus on 21-nm TiO2 particles (ana-tase) from Degussa-Huls. To prepare a compositemembrane, a colloidal suspension of the TiO2 par-ticles and one of the solvents was created by thesonication of the particles in the solvent for overan hour. A Nafion solution was added to the sus-pension, and it was further sonicated. This suspen-sion was cast onto a flat, glass surface, and the sol-vent was removed by evaporation at �80 8C in avacuum oven (for DMSO) or at �70 8C without avacuum (for IPA and EtOH). Once the solventswere completely removed, the membranes wereannealed via heating to a temperature of �165 8Cfor 1 h. The membranes were then cleaned andconverted to the Hþ form according to the proce-dure detailed previously.
Fuel Cell Tests
MEA Preparation
Commercial gas-diffusion electrodes (20% Pt oncarbon, 0.4 mg of Pt/cm2; purchased from E-TEK)were brushed with 5 wt % solubilized Nafion(Aldrich) to impregnate the active layer (0.6 mg/cm2) and then dried at 80 8C for 1 h. The geometri-cal area of the electrodes was 5 cm2. A membranewas sandwiched between two electrodes and gas-sealing gaskets, and then the MEAwas pressed for2 min at 135 8C at 2 MPa with a Carver hot press.
Single-Cell Test Fixture and Performance Evaluation
The MEAs, coupled with gas-sealing gaskets, wereplaced in a Globe Tech, Inc., single-cell test fixturedescribed elsewhere.36 The H2 and O2 (BOC) gaseswere fed to the single cell at 100 sccm. The gaseswere bubbled through water in temperature-con-trolled stainless steel bottles to fully humidify thefeeds before entry to the fuel cell. The baseline testwas performed at a total pressure of 1 bar, celltemperature of 80 8C, and anode and cathodehumidifier bottles at 90 8C. The fuel cell perform-ance was characterized by current–voltage meas-urements (polarization curves). These were re-corded at 80 8C and atmospheric pressure.
We obtained current–voltage, iv, measurementsby connecting the fuel cell to a load resistance (anelectronic Amrel load) and sweeping the voltagefrom 1 to 0.2 V at 10 mV/s, recording the voltage
and current. Because the entire current–potentialcurve for a given temperature/humidification con-dition was obtained in �2 min, it was assumedthat the membranes had a constant water contentthroughout the measurement. The fuel cell waspreconditioned by operation at 0.5 V for 2–3 hbefore the iv measurement.
Physical/Chemical Characterization
The ion-exchange capacity (IEC) was determinedby an exchange of acidic protons with another cat-ion in solution.37,38 The membranes were driedand weighed and then placed in a 1 M NaCl solu-tion at 80 8C overnight to exchange Naþ ions withHþ. The large excess of Naþ ions ensured virtuallycomplete exchange. The membranes were removedfrom the solution, and the solution was titrated tothe phenolphthalein end point with a 0.1 M NaOHsolution to determine the quantity of exchangedHþ ions. The IEC and equivalent weight (g of poly-mer/mol of Hþ) were calculated with the dryweight of the polymer and the quantity of ex-changed protons.
The membranes (�3 cm � 3 cm � 127 lm) werevacuum-dried at �80 8C for 3 h and then weighed,and the length was measured. The water uptakewas measured for membranes placed both in andabove liquid water for 24 h at 25 8C and for mem-branes placed in boiling water for �1 h. The mem-branes were removed from the water, blotted toremove droplets, and then weighed and measured.The linear expansion factor (L%) and H2O sorption(W%) were obtained with eqs 1 and 2:
L% ¼ L1 � L0
L0� 100 ð1Þ
W% ¼ W1 �W0
W0� 100 ð2Þ
where L0 and L1 are the lengths of the membranesbefore and after water sorption, respectively, andW0 and W1 are the masses of the membranesbefore and after water sorption, respectively.
Resistivity measurements were carried outwith a membrane sheet 0.5 cmwide and 3 cm long.The membrane was placed between two polycar-bonate plates. The top plate had two flush-fitstainless steel electrodes 2.54 cm apart. The alter-nating-current (ac) impedance across the mem-brane was obtained at several frequencies from0.1 Hz to 100 kHz. We found no change in the im-pedance from 10 Hz to 20 kHz. To record dynamic
TITANIA/NAFION COMPOSITE MEMBRANES 2329
Journal of Polymer Science: Part B: Polymer PhysicsDOI 10.1002/polb

changes in resistance, the membrane was madeone leg of a voltage divider. A driving voltage of100 Hz was applied across the membrane in serieswith a fixed 1-kO resistor. A pair of ac voltmetersmeasured the voltage drops across the membraneand themembrane in series with the fixed resistor.The dynamics of the change in the resistance ofthe membrane could be determined with a re-sponse time of�0.5 s.
Mechanical Testing
Tensile Tests
The membranes were cut into ASTM standarddog-bone samples with a gauge length of 2.2 cmand a width of 0.5 cm. The samples were tested inan Instron with a constant strain rate of 5 cm/min.The testing chamber was heated to temperaturesin the range of 20–120 8C. The water content wasvaried by the preconditioning of the samples incontrolled-humidity environments (above satu-rated salt solutions). At room temperature, thewater evaporation was sufficiently slow that thewater content per sulfonic acid group did notchange by more than 2 during the test. To testsamples at higher temperatures without the lossof water, the dog bones were positioned inside aZiploc polyethylene bag, and the samples and
Ziploc bag were clamped in the grips of the Ins-tron. The Ziploc bag was kept slack so it added anegligible contribution to the stress when eachsample was strained. The membrane water con-tent during the test was determined by the weigh-ing of the sample before and after the test. The dryweight of the sample was determined after dryingat 170 8C for 24 h. All tested samples containedNafion EW 1100, so the water content per sulfonicacid residue (k) was calculated with eq 3:
kmol H2O
mol SO�3
� �¼
ðMTest �MDryÞ � 1 mole H2O18:015 g H2O
MDry�ð1�Wt%TiO2Þ
EWg Membrane=mol SO�3
ð3Þ
where MTest is the mass (g) of the sample duringthe test and MDry is the mass after drying at170 8C for 24 h.
The Young’s modulus and plastic modulus weredetermined for each sample and plotted as a func-tion of the temperature and k value. (The plasticmodulus, as we apply the term, refers to thechange in the stress with strain beyond the yieldpoint, which is a measure of the strain hardeningof the material.) The tested membranes includedextruded Nafion, Nafion recast with 0, 0.5, 1, 3, 6,or 20 wt % TiO2 and purchased from Degussa-Huls, Nafion recast with 3% TiO2 and purchasedfrom Alfa-Aesar, Nafion recast with 3% rutile nee-dles, and Nafion recast with 3% Degussa-HulsTiO2 with the solvents IPA, DMSO, and EtOH.Although different solvents were tested, we saw nodistinction between the membranes cast fromthese three solvents.
Creep Testing
The effect of a constant stress on the differentmembrane materials was evaluated by the mea-surement of their creep. The membranes were cutinto ASTM standard dog-bone samples with agauge length and width of 2.2 cm and 0.5 cm,respectively. Polymer dog bones of 115 membraneswere cut and clamped in the apparatus shown inFigure 1. The entire apparatus was placed insidean acrylic box with beakers of saturated salt waterbaths to control the water activity, and the acrylicbox was placed in an oven. A weight was hungfrom the bottom of the dog bone, and the polymerstrain was recorded as a function of time.
Dynamic Water Uptake and Conductivity
Water sorption by Nafion and Nafion/titania com-posite membranes was measured at several differ-
Figure 1. Apparatus for creep measurements of poly-mer membranes. The entire apparatus fit inside anacrylic box and was placed in an oven.
2330 SATTERFIELD ET AL.
Journal of Polymer Science: Part B: Polymer PhysicsDOI 10.1002/polb
ent temperatures from 25 to 75 8C. The membraneswere dried in an oven at 130 8C for 1 h and used im-mediately. Dry samples were suspended on a Teflonthread from a bottom weighing balance. After thedetermination of the dry weight, the sample waspositioned inside a three-necked flask half-filledwith water. The flask temperature was controlledby a heating tape wrapped around the flask. A ther-mocouple was positioned in one neck of the flask tomonitor the temperature. The temperature was con-stant to 61.5 8C over the course of the experiment.The mass increase was recorded as a function oftime for �4000–5000 s. A combination temperature/relative humidity (RH) sensor placed where themembrane samples normally hanged verified thatthe test conditions were 95–100% RH and the sametemperature reported by the thermocouple.
Membrane Proton Conductivity
A polymer membrane in a fuel cell is in a con-strained environment under compression. Toexamine the effect of compression on the protonconductivity, the apparatus shown in Figure 2 wasbuilt. Polymer dog bones were placed in the com-pression cell shown in Figure 2(A). The bottomplate had two 1 mm � 1 mm � 15 mm channelswith water running through them. The top platehad two stainless steel cross bars machined flushwith the polycarbonate, which ran perpendicularlyto the water flow channel in the bottom plate. Thecentral section of the dog bone was positioned
between the two flow channels. The flow channelswere filled with water to maintain the water activ-ity in the membrane at unity (the membranes didnot lose any water by evaporation during the com-pression measurements).
Three types of measurements were performed:(1) the membrane resistance was measured as afunction of the compressive stress on the mem-brane, (2) the membrane resistance was measuredas a function of time at a constant stress, and (3)the membrane resistance was measured as theconstrained membrane absorbed water. In the firstexperiment, the stress was increased from 0 to7.25 MPa in incremental steps every minute, andthen the pressure was reduced back to 0 in thereverse sequence. The entire cycle took 20 min.The second experiment consisted of permitting themembrane to equilibrate for �2 h at a fixed stressand then changing the stress and following the re-sistance as a function of time.
For the third set of experiments, rectangularsamples (5 cm � 2.5 cm) were prepared with two2.5 mm � 20 mm slots cut out of the membrane inthe area of the water flow channels.
A load was imposed on the top plate [Fig. 2(B)].The force of the load was measured via a loadwasher. A heavy-duty die spring kept the appliedload fixed while allowing the membrane to expandor contract with the water uptake. The resistanceof the membrane was measured by the applicationof an ac voltage across the membrane in serieswith a 1-kO resistor. The ac voltages across the
Figure 2. Resistance measurement cell for membranes in a confined environment. Thewater flow goes through the channels on the bottom plate (shown in the left rear). Themembrane sits between the two plates and absorbs water. The polycarbonate plates sitbeneath the load washer. The membrane resistance (Rm) is determined across the stain-less steel electrode in the upper plate. The cell is compressed: a screw drive compresses aspring in the blue cylinder above the load washer (right).
TITANIA/NAFION COMPOSITE MEMBRANES 2331
Journal of Polymer Science: Part B: Polymer PhysicsDOI 10.1002/polb

1-kO resistor and the membrane and resistor inseries were measured to determine the membraneresistance. In principle, the capacitance of the cir-cuit could also be measured, but we found that thecapacitance was negligible for the nonporous,stainless steel electrodes, so there was negligiblephase lag for frequencies greater than 1 Hz.
The dynamics of water sorption were measuredby the resistance of a membrane as it absorbedwater. In a typical transient experiment, the waterchannels were dried thoroughly, and a dry mem-brane was positioned in the cell and clamped with aspecified force. A peristaltic pump was used to flowwater through the flow channels. The water flowrate was typically�10 mL/min, but the results werenot dependent on the water flow as long as the flowchannels stayed filled with liquid. The resistance ofthe membrane was measured as a function of time.
Swelling Pressure
The swelling pressure was measured in the envi-ronmental compression cell shown in Figure 3.Samples (1.4-cm discs) were cut from sheets ofNafion 115 and Nafion/TiO2 115 composite mem-branes that were equilibrated at the ambient tem-perature and RH. After drying at 130 8C for 1 h,the samples were �1.2 cm in diameter and werepositioned between porous, stainless steel frits andcompressed by a threaded screw. This apparatushad a fixed strain, as opposed to the fixed stresssystem used in the conductivity measurements.After vacuum evacuation of the chamber, thewater vapor pressure was increased by the injec-tion of known aliquots of water. The polymerabsorbed water and swelled. A load cell measuredthe force generated by the membrane as it swelled
with water sorption. We simultaneously measuredthe temperature, RH, total gas pressure, and forcegenerated by the membrane.
RESULTS
Fuel Cell Response andWater Sorption
Figure 4 shows the iv curves for fuel cells contain-ing a Nafion 115 extruded membrane and a Nafion115/3 wt % TiO2 membrane. Both membranes hada nominal thickness of �127 lm. The voltagesobtained at the same current density were greaterwith the composite membrane than those obtainedwith Nafion. The in situ resistivity of the mem-brane was estimated from the slope of the iv curvein the ohmic region. The composite membranehad a resistivity of 20 6 2 O cm, whereas theNafion membrane had an estimated resistivity of30 6 4 O cm. Fuel cell tests for temperatures from60 to 120 8C with fully humidified feeds did notshow any measurable difference in the membraneresistivity for either of the membranes.
Physical/Chemical Characterization
Table 1 compares the density, dimensional changewith water sorption, IEC, and proton conductivityfor the Nafion and Nafion/TiO2 composite mem-branes. The fractional mass gain for both sets ofmembranes was the same to within 3%; contraryto many reports in the literature,11,39,40 we foundno difference in water sorption between liquid andvapor after 24 h in a sealed container. Membranesplaced in water at 100 8C for 1 h absorbed almosttwice the amount of water as membranes placed inwater at 25 8C for 24 h.
Figure 4. Current–voltage sweep of fuel cells at 80 8Cwith fully humidified feeds for Nafion 115 and Nafion115/3 wt % 21-nm TiO2 particle composite membranes.
Figure 3. Swelling pressure measurement device. Theentire cell was placed inside an insulated box (notshown) to maintain a uniform temperature.
2332 SATTERFIELD ET AL.
Journal of Polymer Science: Part B: Polymer PhysicsDOI 10.1002/polb

After being weighed, the membranes that hadbeen removed from boiling water were placed inbeakers of water at room temperature for 24 h andthen reweighed. The mass of the membranes wasthe same as that determined immediately aftertheir removal from water at 100 8C. This simpleexperiment demonstrates that water sorption byNafion-type membranes can be controlled bykinetics; water sorption is not thermodynamicallyequilibrated within 24 h at 25 8C, and substantialhysteresis can exist, depending on the history ofthe membrane.
There was no measurable difference in the swel-ling behavior or IEC of Nafion and Nafion/TiO2
membranes. The resistivity of the membranesmeasured ex situ is about a factor of 2 less than theresistivity inferred from the ohmic region of the ivcurve in the fuel cell. Part of the difference in theresistivity is due to using the nominal thickness ofthe membrane (127 lm) to determine the resistiv-ity in the fuel cell. The membrane thicknessincreases from water sorption. The transverse re-sistivity (across the membrane as it would be mea-sured in the fuel cell) scales with the membranethickness. The longitudinal resistivity (measuredin the ex situ device) scales inversely with thethickness. If the membrane thickness is swollenby 25%, the in situ fuel cell resistivity is in-creased by 25%, whereas the ex situ resistivity isreduced by 25%. Making these corrections bringsthe values in Table 1 into close agreement withthe resistivity determined from the slope of theiv curve shown in Figure 4.
Mechanical Properties
Tensile Tests
Water sorption is accompanied by membrane swel-ling, which depends on the mechanical propertiesof the polymer or composite. We have looked at
several different mechanical property measure-ments of the membrane materials. The most com-mon polymer tests are tensile tests. A typical ten-sile test for extruded Nafion and a Nafion/titaniacomposite membrane is shown in Figure 5. A vari-ety of values can be extracted from the tensile test-ing; we focus on two properties, the elastic modu-lus (the slope of the stress–strain curve at smallstrains) and the plastic modulus (the slope of thestress–strain curve beyond the yield point). A trueplastic would show no increase in stress withincreasing strain above the yield point. Nafionshowed increasing stress as it was strained pastthe yield point. A positive slope of the stress–straincurve past the yield point is indicative of strainhardening.41,42
Figures 6 and 7 summarize our stress–strainmeasurements for Nafion and Nafion/titania com-posite membranes. As expected, Figure 6 showsthat the elastic modulus decreases with increasingtemperature. At room temperature, the elastic
Table 1. Physical Characteristics of Nafion and Nafion/Titania Composite Membranes
MembraneDry Density
(g/cm3)
Wet Density (g/cm3) IEC
(lequiv/g)
Water Swelling (DL/L)
Resistivityat 23 8C and100% RH(O cm)23 8C 100 8C 23 8C 100 8C
Nafion 115(extruded)
1.926 0.08 1.656 0.08 1.426 0.08 9506 25 0.106 0.01 0.206 0.01 12.46 0.5
Nafion 115(recast)
1.966 0.10 1.686 0.08 1.446 0.08 9606 25 0.126 0.01 0.246 0.01 10.66 0.5
Nafion/titania115 (3 wt %)
1.946 0.11 1.686 0.08 1.506 0.08 9706 25 0.126 0.01 0.236 0.01 9.36 0.5
Figure 5. Stress–strain response of extruded Nafionand Nafion/titania composite membranes. The strainrate was 5 cm/min. The data were obtained at room tem-perature (22–25 8C). The water content for each mem-brane was k � 10.9 H2O/SO3.
TITANIA/NAFION COMPOSITE MEMBRANES 2333
Journal of Polymer Science: Part B: Polymer PhysicsDOI 10.1002/polb

Figure 6. Elastic modulus of Nafion and Nafion/titania composite membranes. Eachpoint represents a different sample. A variety of Nafion/titania composite samples havebeen included on this graph to illustrate the magnitude of the effect with increased loading.
Figure 7. Plastic modulus of Nafion and Nafion/titania composite membranes. A vari-ety of Nafion/titania composite samples have been included on this graph to illustrate themagnitude of the effect with increased loading.
2334 SATTERFIELD ET AL.
Journal of Polymer Science: Part B: Polymer PhysicsDOI 10.1002/polb

modulus is �300 MPa, and it decreases to�100 MPa at 80 8C (the normal operating temper-ature for PEM fuel cells). The elastic modulusdrops precipitously to less than 10 MPa above100 8C. The large decrease in the elastic moduluscoincides with Tg, which has been reported to be110 8C.17,20,43 Absorbed water also reduces the elas-tic modulus; the elastic modulus at 25 8C decreases
from 300 to 50 MPa as the water content in themembrane increases.
The plastic modulus of Nafion (Fig. 7) shows aweaker dependence on the temperature andwater content than the elastic modulus. Theplastic modulus is almost independent of thetemperature below Tg (Tg � 110 8C) with a valueof �8–10 MPa, and it decreases to �2 MPa aboveTg. At room temperature, the water content inthe membrane has little measurable effect on theplastic modulus.
We have found two key results when compar-ing the properties of Nafion and Nafion/titaniacomposites: (1) water sorption reduces the elasticmodulus of Nafion more than that of Nafion/tita-nia composites and (2) water sorption reducesthe plastic modulus of Nafion/titania compositesmore than that of Nafion. The temperatureaffects the mechanical properties of Nafion andNafion/titania composite membranes compara-bly. Composite materials generally have higher
elastic moduli, but at the low loading of 3 wt %(�1.5 vol %), we did not see much effect in thedry materials. The effects of adding the metal ox-ide particles were manifested at higher mem-brane water contents.
Creep Tests
During the normal operation of a fuel cell, electro-des are pressed against the polymer electrolytemembrane, and this puts the polymer under com-pressive stress. The effect of constant tensile stresson two different membrane materials was eval-uated by the measurement of their creep. Figure 8compares the creep responses of an extrudedNafion 115 membrane and a Nafion/3 wt % TiO2
115 membrane. Nafion 115 crept nearly 40% morethan the composite membrane over a period of3000 min (>2 days) when subjected to the samestress.
Both the polymer and composites stretched rap-idly over the first several minutes (the short-timeresponse is blown up in the inset in Fig. 8). After�1–10 min, the polymer membrane strains muchmore slowly. Polymer creep data can be fit to vari-ous functional forms, including stretched exponen-tials derived from spring-dashpot models. Thedata shown in Figure 8 are linear when plotted asthe strain versus log(time) for times from 10 s to
Figure 8. Creep data for Nafion 115 and Nafion/3 wt % titania 115 at 23 8C for both 0%RH (dry) and 100% RHwith an applied engineering stress of 7.5 MPa.
TITANIA/NAFION COMPOSITE MEMBRANES 2335
Journal of Polymer Science: Part B: Polymer PhysicsDOI 10.1002/polb
greater than 104 s. For fuel cell performance, weare principally interested in the long-time creep,and we have defined the creep rate (eq 4) as theslope of the strain–log(time) response at timesgreater than 100 min, normalized by the appliedstress:44,45
Creep Rate ¼ d strainstress
� �d½logðtimeÞ� ð4Þ
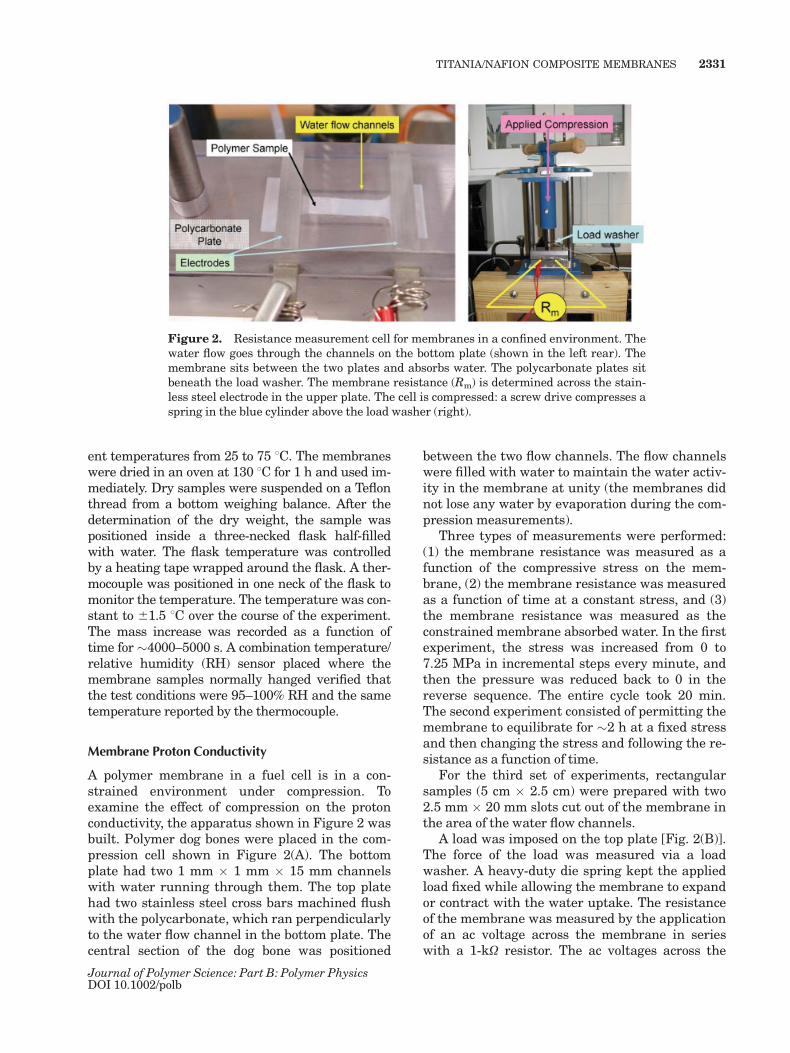
Figure 9 shows the creep rate of extruded Nafion115 membranes as a function of the temperatureand water content. We determined the water con-tent by weighing the membranes immediately af-ter the creep measurements. At a fixed stress, thecreep rate increased with increasing temperatureand decreased with increasing water content. Thereduced creep rate with an increased water con-tent, shown in Figure 9, would appear to be at oddswith Figure 8, in which a higher water contentleads to greater total creep. This apparent discrep-
ancy is because the creep rate refers to long times.Samples with higher water contents crept fasterinitially, but the rate of creep slowed more at lon-ger times. The dry samples crept less initially butcontinued to creep more at longer times.
Dynamic Water Uptake
Figure 10 shows typical results for the wateruptake from saturated vapor for unconstrainedsamples of extruded and recast Nafion/titania com-posite membranes at various temperatures. Thesame three materials reported in Table 1 wereused for the data shown in Figure 10. The resultsshow that water was absorbed faster at highertemperatures and that recast Nafion membranes,with or without titania, absorbed water faster thanextruded Nafion. The results for equilibratedwater sorption given in Table 1 show small differ-ences in the water sorption between the three dif-ferent materials. It appears that the kinetics ofwater sorption is sensitive to the method of prepa-ration. This is not surprising considering becauseothers have reported different microstructuralmorphologies (based on small-angle X-ray scatter-ing experiments) between extruded Nafion and so-lution-cast Nafion.46 The extrusion process resultsin orientation of the material’s microstructure,and this leads to differences in the physical proper-ties (viz., electrical conductance and swelling).Because solvent transport is linked to both thedegree of swelling and morphology, the kinetics ofwater absorption should differ for recast and ex-truded Nafion.
The water diffusivity (D) was estimated bythe fitting of the data at a low water uptake toeq 5:12
D ¼ M
M1
� �2p‘2
16tð5Þ
where M/M? is the mass uptake at time t withrespect to the mass uptake after 24 h and ‘ is theinitial membrane thickness. A value of �1 � 10�8
cm2/s was obtained for the diffusivity. However,the diffusivities for the recast membranes werelower than those for extruded Nafion. This resultwas disturbing because the recast membranessorbed water faster than extruded Nafion. Theproblem with this analysis for diffusivities isthat it fails to account for the energy changesand dimensional changes that accompany watersorption. Values of diffusivities are not reported
Figure 9. Long time creep rate (defined by eq 4) ofNafion 115 (A) as a function of temperature at a fixedwater content of k � 8 6 2 H2O/SO3
� and (B) as a func-tion of the water content at 21–25 8C.
2336 SATTERFIELD ET AL.
Journal of Polymer Science: Part B: Polymer PhysicsDOI 10.1002/polb

because the simple analysis misses key physicsassociated with the water sorption process. Thedrying temperature before absorption, 130 8C for1 h, is higher than those used by other research-ers, who dried Nafion below its Tg of 110 8C toavoid disturbing its microstructure.39,47 How-ever, drying at 130 8C more closely matches theconditions at which an MEA is hot-pressed, andthis is relevant to the changes encountered dur-ing water absorption in a fuel cell. The effect ofthe thermal history on membrane water absorp-tion is an important question, but a completestudy is beyond the scope of this article.
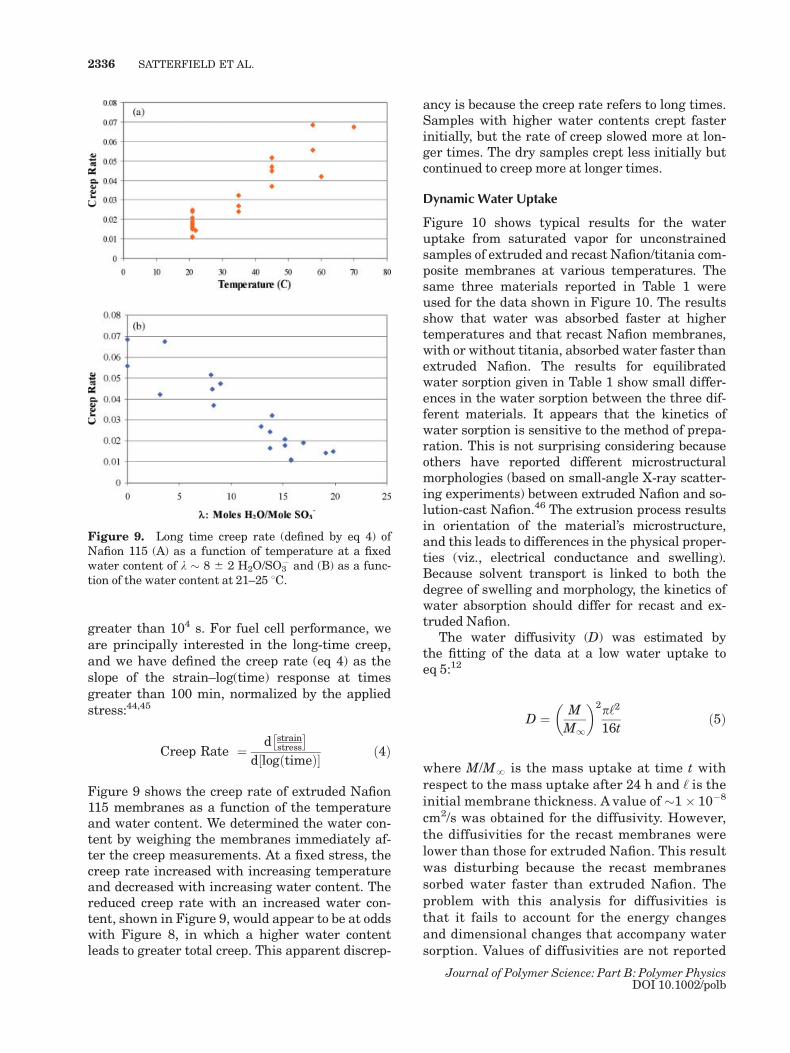
The dynamics of water absorption were alsoseen in the changing membrane resistance as itabsorbed water inside the device depicted in Fig-ure 2. A typical result is shown in Figure 11 for amembrane under a compressive load of 40 kPa at21 8C. Figure 11 shows that water was rapidlyabsorbed into the membrane, reducing the re-sistivity by over an order of magnitude in thefirst 100 s. The rate of change of the resistivityslowed dramatically after the initial decrease.The membrane resistivity kept decreasing for�100,000 s. The membrane resistivity decreasedfrom 60 to 15 O cm between 1000 s and 5000 sand to less than 13 O cm after 20,000 s. Itreached its equilibrated resistance of 12.6 O cmafter 40,000 s. The resistivity decreased slightly
faster for a Nafion/titania (3 wt %) 115 mem-brane than extruded Nafion 115 at room temper-ature; this is consistent with the water uptakemeasured by the change in mass. Preliminaryexperiments have shown that the resistivitychange is slowed by an increasing applied load,but we do not yet have sufficient data to quantifythese phenomena.
Membrane Proton Conductivity
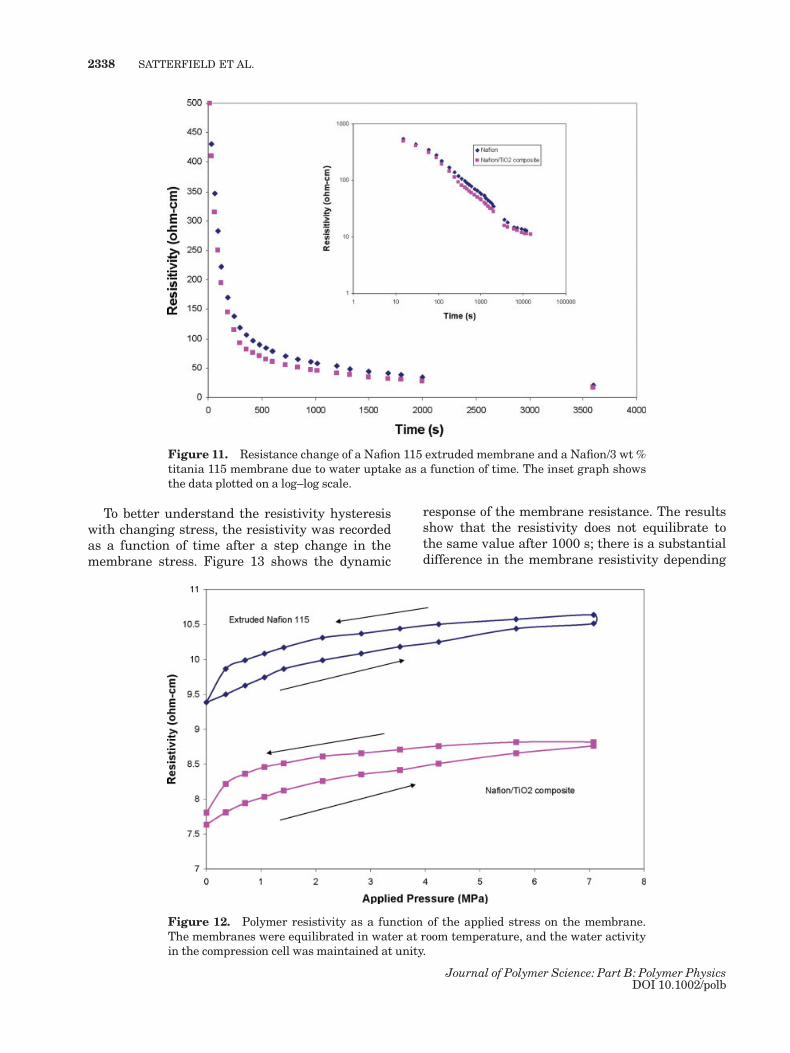
A polymer membrane in a fuel cell is in a con-strained environment under compression. Figure 12shows the resistivity as a function of the appliedstress on the membrane for both extruded Nafion115 and Nafion/3 wt % TiO2 115 membranes. Theresistivity was based on the dry membrane thick-ness. The stress was increased from 0 to 7.25 MPain incremental steps every minute. After 1 min ateach applied stress, the resistivity change wasslow (<2%/min), but we did not wait for full equili-bration. The membrane resistivity had increasedby �15% at the maximum applied stress of7.25 MPa. After the maximum was reached, thestress was reduced with the reverse sequence.There was a substantial hysteresis in the resist-ance at the same stress level on the return path.We did find that the resistivity at �0 stress wasrecovered but only after �1000 s. This hysteresisof the resistance with stress was reproducible.
Figure 10. Mass gain of Nafion and Nafion/titania composite membranes from satu-rated water vapor at different temperatures.
TITANIA/NAFION COMPOSITE MEMBRANES 2337
Journal of Polymer Science: Part B: Polymer PhysicsDOI 10.1002/polb
To better understand the resistivity hysteresiswith changing stress, the resistivity was recordedas a function of time after a step change in themembrane stress. Figure 13 shows the dynamic
response of the membrane resistance. The resultsshow that the resistivity does not equilibrate tothe same value after 1000 s; there is a substantialdifference in the membrane resistivity depending
Figure 11. Resistance change of a Nafion 115 extruded membrane and a Nafion/3 wt %titania 115 membrane due to water uptake as a function of time. The inset graph showsthe data plotted on a log–log scale.
Figure 12. Polymer resistivity as a function of the applied stress on the membrane.The membranes were equilibrated in water at room temperature, and the water activityin the compression cell was maintained at unity.
2338 SATTERFIELD ET AL.
Journal of Polymer Science: Part B: Polymer PhysicsDOI 10.1002/polb

on the direction of approach to the applied stress.The stress relaxation hysteresis shown in Figure13 persisted for more than 200 min with bothmembranes. Both membranes relaxed back totheir zero stress resistivity in approximately 10min if the applied stress was completely removed.
Dynamics of Membrane Swelling
Membrane swelling associated with water sorptionrequires the membrane to develop sufficient inter-nal pressure to overcome the applied stress com-pressing the membrane. The energy of water sorp-tion per unit of volume gives rise to a swellingpressure of the membrane, as measured by the de-vice depicted in Figure 3. Typical data are shownin Figure 14(A,B). Both extruded Nafion 115 andNafion/3 wt % TiO2 115 membranes generated aswelling pressure of 0.55 6 0.03 MPa for watersorption at 60–90 8C. The swelling pressurechanged by less than 10% between 30 and 90 8C.Figure 14(B) is a blowup of the force generatedwhen water is injected and shows that the watersorption and swelling pressure build up quicklywithin �100 s. After the initial increase in force,there is a slow decrease in the force with a muchlonger response time, �10,000 s. The slow relaxa-tion to the swelling pressure occurs with a timeresponse similar to that of membrane creep. Fromlimited data for composite membranes, the swel-ling pressure of the Nafion/3 wt %TiO2 compositemembranes is the same as that of Nafion withinthe experimental error.
DISCUSSION
The studies reported here were initiated to eluci-date how polymer electrolytes in constrained envi-ronments respond to applied stresses. The mem-brane in a PEM fuel cell is constrained betweenthe porous electrodes; the compression sealing ofthe fuel cell assembly puts the membranes understress. As the polymer electrolyte absorbs anddesorbs water, it swells and shrinks, altering thestress levels and proton conductivity. There is pre-cious little data available concerning the mechani-cal properties of polymer electrolytes as functionsof both the temperature and water activity, andthere is virtually no data for the properties of thesematerials in confined environments. The data pre-sented here are by no means complete, but theybegin to elucidate how water and temperatureaffect the mechanical and electrical properties ofpolymer electrolyte membranes, which may impactfuel cell performance.
The addition of TiO2 particles to a Nafion mem-brane improves the fuel cell performance. Theseimprovements have been documented by us andothers.36 There have been several different ex-planations for this improvement; most of thetheories have focused on greater water sorption inthe composite membranes, particularly underreduced-humidity conditions.5,31,48 The fuel celldata shown in Figure 4 were obtained under fullyhumidified conditions and show that the compositemembrane had lower resistivity even at full hu-
Figure 13. Resistivity change during the stress relaxation of Nafion and Nafion/TiO2
composite membranes.
TITANIA/NAFION COMPOSITE MEMBRANES 2339
Journal of Polymer Science: Part B: Polymer PhysicsDOI 10.1002/polb

midification. Also, the measurements of equili-brated water sorption did not show any significantincrease in the water content due to the presenceof the TiO2 particles. Dynamic measurements ofwater sorption showed that the recast membraneswith and without particles had higher water sorp-
tion rates than extruded Nafion. The high sorptionrates correlated with reduced resistivity in therecast Nafion and Nafion/TiO2 membranes. Theseresults suggest that recasting modifies the micro-structure of Nafion membranes, facilitating waterdiffusion and proton mobility.
Figure 14. (A) Swelling measurement of Nafion 115 at 90 8C. Water was injected at17,250 s, increasing the RH from 0 to 100%. The gas pressure inside the chamber roseslowly over time because of a small leak in the septum. (B) Swelling of Nafion 115 afterwater injection. This is a blowup of part A around the time of the water injection. It showsthe timescale for the water uptake and the swelling pressure buildup to be�500–1000 s.
2340 SATTERFIELD ET AL.
Journal of Polymer Science: Part B: Polymer PhysicsDOI 10.1002/polb

The membranes become less stiff with increas-ing temperature and increasing water content.Both the elastic and plastic moduli decrease grad-ually with increasing temperature up to �100 8C;above the Tg of �110 8C, the elastic modulusdecreases by over an order of magnitude. The plas-tic modulus also decreases with increasing temper-ature and drops at Tg. Water plasticizes Nafion.From Figure 6, it is evident that at 25 8C, the elas-tic modulus decreases by almost a factor of 6 froma dry membrane to a water-saturated membrane.This decrease in the elastic modulus is comparableto that observed when the temperature of a dryNafion membrane is increased from 25 to 80 8C.Water sorption has a much smaller effect on theplastic modulus, as shown in Figure 7. The mecha-nism for strain hardening does not show a strongdependence on the water content in the polymer.
The plasticizing effect of water and temperatureon the elastic modulus of the membranes canexplain why water sorption increases with increas-ing temperature. Water sorption by the sulfonicacid moieties is an exothermic process, and assuch, it would be expected that water sorptionshould be greater at lower temperatures. However,it has been documented by many investigationsthat water sorption by Nafion increases withincreasing temperature.48–51 The total energychange due to water sorption (Esorption) is the sumof the chemical energy of water solvating the sul-fonic acid groups and the mechanical energy ofswelling the membrane, as expressed in eq 6. Thefirst term in the integral is the heat of solvation,and the second term is the work of polymer swel-ling. Both the solvation energy and the elasticmodulus of the polymer decrease with increasingwater content. We have approximated these withsimple linear functions of k; kmax � 20 is the maxi-mum solvation of the sulfonic acid groups. For sim-plicity, the enthalpy of water sorption has been setto decrease linearly from �DH0 at zero water con-tent to zero at the maximum water uptake, andthe elastic modulus, E0, has been scaled to de-crease by a fraction a from its dry state to the fullyhydrated state. It has also been assumed that thevolume of swelling is linear with the molar volumeof water (Vw):
EsorptionðkÞ ¼Z k
ko
��Hokmax � kkmax
� ��
þ Eo 1� ak
kmax
� ��Vw
�dk ð6Þ
The equilibrium water content (ke) occurs for theminimum in the energy as expressed in eq 7:
ke ¼ ��Ho þ Eo�Vw
��Ho þ aEo�Vw
kmax ð7Þ
Figure 15 shows the total energy of water sorptionalong with the contributions of the energy of solva-tion and the energy of swelling based on eq 6. Theminimum in the total energy corresponds to the kevalue predicted by eq 7. As the temperature isincreased, the elastic modulus decreases muchmore than the energy of solvation, and this resultsin the energy released by solvation being able tofurther expand the polymer membrane andreduces the total energy of the system. This alsoshifts the number of water molecules sorbed intothe membrane. Figure 15 shows that for typicalvalues of the elastic modulus and solvation en-thalpy, the decrease in the elastic modulus from350 MPa for Nafion at 25 8C to 100 MPa at 80 8Cresults in an increase in the number of sorbedwater molecules from 12 to 16 water/SO3. The sim-ple model presented here neglects the entropiccontributions to the free energy. However, for thelarge energies associated with water sorption intoionomers, the entropic contribution will be smallwith respect to the energetic contributions.
It is evident from Figures 6 and 7 that the me-chanical properties of Nafion have not beenexplored in much of the parameter space at ele-vated temperatures and elevated water activity. Asynergistic effect between water plasticizing thematerial and temperature reducing the mechani-cal strength is expected. There are a few datapoints shown on Figures 6 and 7 taken at elevatedtemperatures with increased water content. Those
Figure 15. Swelling, solvation, and sorption energyfor water into a Nafion membrane [DH0 ¼ �20 kJ/mol,E0(25 8C) ¼ 350 MPa, kmax ¼ 16 water/SO3, a ¼ 0.4,E0(80 8C)¼ 100MPa].
TITANIA/NAFION COMPOSITE MEMBRANES 2341
Journal of Polymer Science: Part B: Polymer PhysicsDOI 10.1002/polb

data show that the elastic modulus is less thanthat of a dry membrane at those temperatures orthat of a wet membrane at 25 8C. There are not yetsufficient data to identify how Tg changes with thewater content.
Adding TiO2 to make a composite membraneincreased the elastic modulus of the membrane atincreased water content. This improvement is high-lighted in Figure 6. The addition of TiO2 did nothave a significant effect on the temperature depend-ence of the elastic modulus. A surprising resultobtained for the Nafion/titania composite materialswas that the plastic modulus decreased. The com-posite membranes showed less strain hardeningthan Nafion, especially at high water contents.Figure 7 shows that the plastic modulus of the com-posite membrane decreased compared with that ofNafion at high water contents and 25 8C. SomeNafion/Zirconia composite membranes that wetested showed a plastic modulus of zero; there wasno change in the stress as they were strained.
The results show that modifying membraneswith titania causes the mechanical properties ofthe membranes to be altered more by water thantemperature. Because the metal oxide particles arehydrophilic, we believe that they interact stronglywith the hydrophilic (sulfonic acid) domains ofNafion. Water sorption alters the interactionbetween the metal oxide surfaces and the hydro-philic domains of Nafion, and this results inchanges in the mechanical properties. We do notyet have sufficient experimental information toquantify the magnitude of the particle/Nafion/water interaction.
The creep experiments showed that the mem-branes crept over a long time period when placedunder moderate stress. It was surprising thatNafion/TiO2 composite membranes crept muchless than Nafion when placed under a constantstress, as shown in Figure 8. It was anticipatedthat the composite membranes would creep morethan Nafion because they had a lower plastic mod-ulus, which indicated less strain hardening; thisshould have permitted the composite materials toflow more readily. However, most of the creepexperiments were performed at stresses less thanthe yield stress, so there was not a direct connec-tion between the creep and the plastic modulus.Creep does increase with increasing temperatureand decreasing water content, as shown in Figure9(A,B). Creep may play an important role in fuelcell failure; the creep from high stress points maythin out the membrane over time, eventually caus-ing pinholes in the membrane.
The measurements shown in Figures 12 and 13are some of the first data showing how the com-pressive forces can alter the resistance of polymerelectrolytes. These results also show substantialhysteresis in the membrane resistivity from com-pression. Membrane resistivity increased by 10–15% for an applied pressure of 7.25 MPa. Thisincrease in resistivity appears to be the result ofsimple mechanical compression of the membraneand not actually a change in the resistivity. The re-sistance of the central section of the dog bone ismeasured lengthwise along the neck of the dogbone. The resistance (Rmembrane) is given by eq 8:
Rmembrane ¼ qL
Wtð8Þ
where q is the resistivity, t is the membrane thick-ness,W is the width, and L is the length. When themembrane is compressed, t will decrease by Dtwith the applied stress (Papplied):
�t ¼ Papplied
Et ð9Þ
where E is the elastic modulus. A wet membraneat 25 8C has an elastic modulus of �50 MPa (seeFig. 6), so an applied stress of 7 MPa will reducethe membrane thickness by 14% and hence in-crease the membrane resistance by 14%. The datashown in Figure 12 assume a constant membranethickness, so the changes in the resistivity mayrepresent dimensional changes in the membranedue to applied stresses. At room temperature, theelastic modulus is large, so dimensional changes ofthe membrane by compression produce only mod-est changes in the membrane resistance. However,at higher temperatures of 80–100 8C, the modulusis less than 10 MPa, so the applied compressionsealing the fuel cell could increase the membraneresistance by factors of 2 or more.
If the hysteresis in the resistivity shown in Fig-ures 12 results from dimensional changes of themembrane, the results from Figure 13 suggestsubstantial hysteresis in the dimensions of themembrane upon compression and relaxation. Acc-ording to the compression and relaxation experi-ment shown in Figure 13, a membrane that is com-pressed may be frozen into a partially compressedstate for extremely long periods of time. The resist-ance measurements indicate a change of 5%existed between compressing a membrane to 3.6MPa from 0 MPa and decompressing a membraneto 3.6 MPa from 7.2 MPa.
2342 SATTERFIELD ET AL.
Journal of Polymer Science: Part B: Polymer PhysicsDOI 10.1002/polb

MEAs for PEM fuel cells are typically made bythe pressing of the membrane between the electro-des layers (catalyst and gas diffusion layers) andthen by the sealing of the MEA between the bipo-lar plates that supply the gases to the fuel cell. Allthis is done while the membrane is dry. In the fuelcell, water is absorbed into the membrane fromthe feed streams. Membrane hydration is accom-panied by membrane swelling. The membraneswelling creates a pressure against the electrodelayers and bipolar plates. The swelling pressure ofthe membrane is the result of the increase inenergy by water sorption into the membrane. Asimple energy balance shows that the swellingpressure (Pswelling) is the energy of water sorption,DHabsorption, divided by the change in volume asso-ciated with the water sorption VH2O.
Pswelling¼ ðEnergy of water absorptionÞðVolumechange onabsorptionÞ
¼ ½SO�3 � #H2O=SO�
3
� �½��Habsorption�½SO�
3 � #H2O=SO�3
� �½�VH2O�ð10Þ
Equation 10 is a simple statement that the swellingpressure is the ratio of the enthalpy of water sorp-tion divided by the partial molar volume of water inthe membrane. The swelling pressure decreases asthe water content increases because the heat ofsorption of water decreases with the water content.
Figure 14 shows the dynamic measurement ofthe swelling pressure of Nafion 115. Just after thewater injection, the force increased, went through amaximum 2000 s after water injection, and thenrelaxed over a time of 50,000 s. The rise in the forceafter water injection corresponds to the water sorp-tion into the membrane. The dynamic water uptakemeasurements (Figs. 10 and 11) show that it took1000–4000 s for water sorption to be equilibrated,which is the same time observed for membraneswelling. The long time relaxation out to 50,000 s isthe result of polymer creep from the applied stressof the swelling pressure. The dynamics of the swel-ling pressure measurement should be representa-tive of what happens in a fuel cell when the mem-brane is hydrated: it swells, creating a stress, andsubsequently creeps because of the applied stress.
The surprising result from the swelling pres-sure measurements was that the swelling pressureshowed little or no dependence on temperature,whereas all the other mechanical properties andwater uptake varied substantially with tempera-ture. According to eq 10, the swelling pressuredepends on the enthalpy of water absorption andthe partial molar volume of water. The enthalpy of
water absorption is the solvation energy. By con-straining the swelling, we are looking at the waterabsorption energy for the initially sorbed water,which should correspond to ionization of the acidmoieties. The enthalpy of ionization is not verysensitive to temperature. The swelling pressurewas used to determine an enthalpy of water sorp-tion of �206 3 kJ/mol. To obtain this value, it wasassumed that the partial molar volume of water inNafion was equal to the molar volume of water.This enthalpy of water absorption is comparable tothat obtained by Morris and Sun12 and byEscoubes and Pineri.52
CONCLUSIONS
The mechanical and electrical properties of Nafionand Nafion/TiO2 composite membranes wereexamined; we focused on the properties of thesematerials in constrained environments. The keyresults from these studies are as follows:
1. Composite membranes have a lower resistiv-ity than Nafion under fully humidified condi-tions and give better iv performance in fuelcells.
2. Water sorption into Nafion-based mem-branes increases with increased tempera-ture. Recast membranes sorbed water fasterthan extruded Nafion.
3. The elastic modulus of dry Nafion andNafion/TiO2 composite membranes decreasesfrom 300 MPa at 25 8C to 80 MPa at 90 8Cand then decreases to 2–3MPa at 110 8C.
4. Water sorption is a balance between theenergy of solvation of the sulfonic acid groupsand the energy to swell the membrane. Thereduction of the elastic modulus with in-creased temperature reduces the energy re-quired to swell the membrane and permitsgreater water sorption.
5. Water plasticizes Nafion and Nafion/TiO2
membranes. At room temperature, the elas-tic modulus decreased from 300 MPa for drymembranes to 50 MPa for fully humidifiedmembranes. The elastic modulus of compos-ite membranes did not decrease as muchwith the water content as Nafion membranesdid.
6. Water reduced the plastic modulus of Nafion/TiO2 membranes more than that of Nafion.
7. Nafion/TiO2 membranes crept 40% less thanNafion membranes did at 25 8C and 100%RH after 3 h.
TITANIA/NAFION COMPOSITE MEMBRANES 2343
Journal of Polymer Science: Part B: Polymer PhysicsDOI 10.1002/polb

8. The resistance of Nafion and Nafion/TiO2
membranes increased when they were com-pressed. The resistance increase was con-sistent with the elastic compression of themembrane. Increasing and decreasing thecompression of the membranes resulted inhysteresis of the resistance. Membranescompressed to the same pressure had differ-ent resistance depending on whether thepressure was increased or decreased.
9. Water sorption by Nafion-based membranesresults in a swelling pressure. The swellingpressure of a Nafion 115 membrane at 100%RH and 80 8C was 0.55 MPa.
10. The swelling pressure of Nafion was not verysensitive to the temperature. The enthalpy ofwater absorption into Nafion was �20 kJ/molon the basis of the swelling pressure.
The results show that the mechanical properties ofNafion-based membranes will impact the dynamicperformance of PEM fuel cells, especially duringstartup when the membranes swell as they absorbwater. The results did not reveal any direct con-nection between the mechanical properties of com-posite membranes and their improved perform-ance in PEM fuel cells.
The authors thank the National Science Foundation(CTS-0354279 and DMR-0213707 through the MaterialsResearch and Science Engineering Center at Princeton)for its support of this work.
REFERENCES AND NOTES
1. Fuel Cell Systems; Blomen, L. J. M. J.; Mugerwa,M. N., Eds.; Plenum: New York, 1993; p 614.
2. EG&G Services. Fuel Cell Handbook; U.S. Depart-ment of Energy: Morgantown, WV, 2000; p 312.
3. Srinivasan, S.; Dave, B. B.; Murugesamoorthi,K. A.; Parthasarathy, A.; Appleby, A. J. In Fuel CellSystems; Blomen, L. J. M. J.; Mugerwa, M. N., Eds.;Plenum: New York, 1993; pp 37–72.
4. Yang, C.; Costamagna, P.; Srinivasan, S.; Benziger,J.; Bocarsly, A. B. J Power Sources 2001, 103, 1–9.
5. Malhotra, S.; Datta, R. J Electrochem Soc L 1997,144, 23–26.
6. Doyle, M.; Choi, S.; Proulx, G. J Electrochem Soc2000, 147, 34–37.
7. Alberti, G.; Casciola, M.; Palombari, R. J Membr Sci2000, 172, 233–239.
8. Mauritz, K. A.; Payne, J. T. J Membr Sci 2000, 168,39–51.
9. Gebel, G.; Aldebert, P.; Pineri, M. Polymer 1993, 34,333–339.
10. Kreuer, K. D. J Membr Sci 2001, 185, 29–39.11. Choi, P.; Jalani, N. H.; Datta, R. J Electrochem Soc
E 2005, 152, 84–89.12. Morris, D. R.; Sun, X. D. J Appl Polym Sci 1993, 50,
1445–1452.13. Chen, S. L.; Bocarsly, A. B.; Benziger, J. J Power
Sources 2005, 152, 27–33.14. Aldebert, P.; Guglielmi, M.; Pineri, M. Polym J
1991, 23, 399–406.15. Benziger, J.; Chia, E.; Moxley, J. F.; Kevrekidis, I. G.
Chem Eng Sci 2005, 60, 1743–1759.16. Escoubes, M.; Pineri, M.; Robens, E. Thermochim
Acta 1984, 82, 149–160.17. Bauer, F.; Denneler, S.; Willert-Porada, M. J Polym
Sci Part B: Polym Phys 2005, 43, 786–795.18. Pineri, M. ACS Symp Ser 1986, 302, 159–174.19. Jalani, N. H.; Datta, R. J Membr Sci 2005, 264, 167–
175.20. Yeo, S. C.; Eisenberg, A. J Appl Polym Sci 1977, 21,
875–898.21. Hinatsu, J. T.; Mizuhata, M.; Takenaka, H. J Elec-
trochem Soc 1994, 141, 1493–1498.22. Zook, L. A.; Leddy, J. Anal Chem 1996, 68, 3793–
3796.23. Lee, W. K.; Ho, C. H.; Van Zee, J. W.; Murthy, M.
J Power Sources 1999, 84, 45–51.24. Adjemian, K. T.; Lee, S. J.; Srinivasan, S.; Benziger,
J.; Bocarsly, A. B. J Electrochem Soc A 2002, 149,256–261.
25. Antonucci, P. L.; Arico, A. S.; Creti, P.; Ramunni, E.;Antonucci, V. Solid State Ionics 1999, 125, 431–437.
26. Doyle, M.; Choi, S.; Proulx, G. J Electrochem Soc2000, 147, 34–37.
27. Grot, W. G.; Rajendran, G. Membranes ContainingInorganic Fillers and Membrane and ElectrodeAssemblies and Electrochemical Cells EmployingSame; United States, US Patent No 5919583, July6, 1999.
28. Honma, I.; Hirakawa, S.; Yamada, K.; Bae, J. M.Solid State Ionics 1999, 118, 29–36.
29. Lee, S. J.; et al. The Electrochemical Society Me-eting; Electrochemical Society: Toronto, Canada,2000.
30. Malhotra, S.; Datta, R. J Electrochem Soc L 1997,144, 23–26.
31. Mauritz, K. A. Mater Sci Eng 1998, 6, 121–133.32. Miyake, N.; Wainright, J. S.; Savinell, R. F. J Elec-
trochem Soc A 2001, 148, 898–904.33. Murphy, O. J.; Cisar, A. J. Composite Membrane
Suitable for Use in Electrochemical Devices; UnitedStates, Patent No 6,059,943; May 9, 2000.
34. Si, Y.; Lin, J.-C.; Kunz, H. R.; Fenton, J. M. Meetingof the Electrochemical Society; Electrochemical So-ciety: Philadelphia, 2002.
35. Honma, I.; Nishikawa, O.; Sugimoto, T.; Nomura,S.; Nakajima, H. Fuel Cells 2002, 2, 52–58.
36. Adjemian, K. T.; Srinivasan, S.; Benziger, J.;Bocarsly, A. B. J Power Sources 2002, 109, 356–364.
2344 SATTERFIELD ET AL.
Journal of Polymer Science: Part B: Polymer PhysicsDOI 10.1002/polb

37. Chen, T.-Y.; Leddy, J. Langmuir 2000, 16, 2866–2871.38. Clearfield, A.; Stynes, J. A. J Inorg Nucl Chem
1964, 26, 117–129.39. Zawodzinski, T. A.; Derovin, C. R.; Radzinski, S.;
Sherman, R. J.; Smith, V. T.; Springer, T. E.; Gottes-feld, S. J Electrochem Soc 1993, 140, 1041–1047.
40. Choi, P. H.; Datta, R. J Electrochem Soc E 2003,150, 601–607.
41. Alfrey, T. J.; Gurnee, E. F. Organic Polymers; Pren-tice Hall: Englewood Cliffs, NJ, 1967.
42. Loveday, D.; Wilkes, G. L.; Lee, Y.; Storey, R. F. J ApplPolymSci 1997, 63, 507–519.
43. Jalani, N. H.; Dunn, K.; Datta, R. Electrochim Acta2005, 51, 553–560.
44. Wood, L. A.; Bullman, G. W. J Polym Sci Part A-2:Polym Phys 1972, 10, 43–50.
45. Publishing, W. A. Effect of Creep and Other TimeRelated Factors on Plastics and Elastomers; Plastic
Design Library; William Anderson Publishing: Nor-wich, NY; 1991.
46. Mauritz, K. A.; Moore, R. B. Chem Rev 2004, 104,4535–4585.
47. Bunce, N. J.; Sondheimer, S. J.; Fyfe, C. A. Macro-molecules 1986, 19, 333–339.
48. Alberti, G.; Casciola, M.; Massinelli, L.; Bauer, B.J Membr Sci 2001, 185, 73–81.
49. Zawodzinski, T. A.; Springer, T. E.; Davey, J.; Jestel,R.; Lopez, C.; Valerio, J.; Gottesfeld, S. J Electro-chem Soc 1993, 140, 1981–1985.
50. Yang, C.; Srinivasan, S.; Bocarsly, A. B.;Tulyani, S.; Benziger, J. B. J Membr Sci 2004,237, 145– 161.
51. Jalani, N. H.; Choi, P.; Datta, R. J Membr Sci 2005,254, 31–38.
52. Escoubes, M.; Pineri, M. ACS Symp Ser 1982, 180,9–23.
TITANIA/NAFION COMPOSITE MEMBRANES 2345
Journal of Polymer Science: Part B: Polymer PhysicsDOI 10.1002/polb