Mechanical properties and plasticity size effect of Fe-6 ...
12
Mechanical properties and plasticity size effect of Fe-6%Cr irradiated by Fe ions and by neutrons C.D. Hardie a, b, * , G.R. Odette c , Y. Wu c , S. Akhmadaliev d , S.G. Roberts a, b a EURATOM/CCFE Association, Culham Centre for Fusion Energy (CCFE), Abingdon, Oxfordshire, OX14 3DB, United Kingdom b Department of Materials, University of Oxford, Oxford, OX1 3PH, United Kingdom c UCSB Department of Mechanical Engineering, 2343 Engineering II Building, Santa Barbara, CA 93106-5070, USA d Helmholtz-Zentrum Dresden-Rossendorf, Institute of Ion Beam Physics and Materials Research, D-01328 Dresden, Germany article info Article history: Received 26 June 2016 Received in revised form 14 October 2016 Accepted 16 October 2016 Available online 19 October 2016 abstract The mechanical behaviour of Fe6%Cr in the un-irradiated, self-ion irradiated and neutron irradiated conditions was measured and compared. Irradiations were performed to the same dose and at the same temperature but to very different damage rates for both methods. The materials were tested using nanoindentation and micromechanical testing, and compared with microstructural observations from Transmission Electron Microscopy (TEM) and Atom Probe Tomography (APT) reported elsewhere. Irra- diated and un-irradiated micro-cantilevers with a wide range of dimensions were used to study the interrelationships between irradiation hardening and size effects in small-scale plasticity. TEM and APT results identified that the dislocation loop densities were ~2.9 10 22 m 3 for the neutron irradiated material and only 1.4 10 22 m 3 for the ion irradiated material. Cr segregation to loops was only found for the neutron-irradiated material. The nanoindentation hardness increase due to neutron irradiation was 3 GPa and that due to ion irradiation 1 GPa. The differences between the effects of the two irra- diation types are discussed, taking into account inconsistencies in damage calculations, and the differ- ences in PKA spectra, dose rate and transmutation products for the two irradiation types. © 2016 EURATOM/CCFE Fusion Association. Published by Elsevier B.V. All rights reserved. 1. Introduction The use of heavy ion implantation for the simulation of neutron irradiation under reactor conditions is common practice, due to the short time scales to reach relatively high damage levels and the absence of induced radioactivity; the latter avoids costly re- quirements for additional handling precautions and the use of hot cell facilities. However, there are issues with the correlation of the effects on microstructure and mechanical behaviour between ion implantation and neutron irradiation (usually from a fission reactor). Additionally, the use of either type of radiation for inves- tigating likely response of materials within a fusion environment has limitations; for example, the deuterium-tritium fusion neutron energy spectrum includes a peak in neutron flux at 14.1 MeV, compared to lower energies in typical fission spectra, with few neutrons of energy higher than 5 MeV [1]. The fast fusion neutrons also produce significant levels of solid and gaseous transmutation products in structural materials such as steels, tungsten and SiC, which can be difficult to simulate, even with dual- and triple-beam ion irradiation facilities. Therefore it is recognised that all sources of irradiation have specific characteristic effects on materials and the limitations of each type of irradiation must be accounted for when interpreting data. Mechanical testing of irradiated materials may be constrained by volume limitations: either by laboratory limits in handling radioactive material, or by the limited depth of the micron-scale damage layers typically produced by heavy ion implantation. The challenges in measuring mechanical properties of ion irradiated materials are discussed further in Refs. [2,3]. For the fusion mate- rials community, small irradiation volumes are common amongst all concepts for Early Neutron Source accelerator-driven high-en- ergy neutron sources proposed in the EU ‘roadmap to the realisa- tion of fusion energy’ [4]. It has long been established that the mechanical response of a material is not independent of specimen size, particularly at small sizes [5]; therefore, the reduction of test specimen dimensions required to utilise these radiation sources presents a significant risk to the validity of data available. This paper reports on a systematic study conducted on the ef- fects of ion and neutron irradiation on the small-scale mechanical * Corresponding author. Culham Centre for Fusion Energy (CCFE), Abingdon, Oxfordshire, OX14 3DB, United Kingdom. E-mail address: [email protected] (C.D. Hardie). Contents lists available at ScienceDirect Journal of Nuclear Materials journal homepage: www.elsevier.com/locate/jnucmat http://dx.doi.org/10.1016/j.jnucmat.2016.10.028 0022-3115/© 2016 EURATOM/CCFE Fusion Association. Published by Elsevier B.V. All rights reserved. Journal of Nuclear Materials 482 (2016) 236e247
Transcript of Mechanical properties and plasticity size effect of Fe-6 ...

lable at ScienceDirect
Journal of Nuclear Materials 482 (2016) 236e247
Contents lists avai
Journal of Nuclear Materials
journal homepage: www.elsevier .com/locate/ jnucmat
Mechanical properties and plasticity size effect of Fe-6%Cr irradiatedby Fe ions and by neutrons
C.D. Hardie a, b, *, G.R. Odette c, Y. Wu c, S. Akhmadaliev d, S.G. Roberts a, b
a EURATOM/CCFE Association, Culham Centre for Fusion Energy (CCFE), Abingdon, Oxfordshire, OX14 3DB, United Kingdomb Department of Materials, University of Oxford, Oxford, OX1 3PH, United Kingdomc UCSB Department of Mechanical Engineering, 2343 Engineering II Building, Santa Barbara, CA 93106-5070, USAd Helmholtz-Zentrum Dresden-Rossendorf, Institute of Ion Beam Physics and Materials Research, D-01328 Dresden, Germany
a r t i c l e i n f o
Article history:Received 26 June 2016Received in revised form14 October 2016Accepted 16 October 2016Available online 19 October 2016
* Corresponding author. Culham Centre for FusioOxfordshire, OX14 3DB, United Kingdom.
E-mail address: [email protected] (C.D. Hardi
http://dx.doi.org/10.1016/j.jnucmat.2016.10.0280022-3115/© 2016 EURATOM/CCFE Fusion Association
a b s t r a c t
The mechanical behaviour of Fe6%Cr in the un-irradiated, self-ion irradiated and neutron irradiatedconditions was measured and compared. Irradiations were performed to the same dose and at the sametemperature but to very different damage rates for both methods. The materials were tested usingnanoindentation and micromechanical testing, and compared with microstructural observations fromTransmission Electron Microscopy (TEM) and Atom Probe Tomography (APT) reported elsewhere. Irra-diated and un-irradiated micro-cantilevers with a wide range of dimensions were used to study theinterrelationships between irradiation hardening and size effects in small-scale plasticity. TEM and APTresults identified that the dislocation loop densities were ~2.9 � 1022m�3 for the neutron irradiatedmaterial and only 1.4 � 1022m�3 for the ion irradiated material. Cr segregation to loops was only foundfor the neutron-irradiated material. The nanoindentation hardness increase due to neutron irradiationwas 3 GPa and that due to ion irradiation 1 GPa. The differences between the effects of the two irra-diation types are discussed, taking into account inconsistencies in damage calculations, and the differ-ences in PKA spectra, dose rate and transmutation products for the two irradiation types.
© 2016 EURATOM/CCFE Fusion Association. Published by Elsevier B.V. All rights reserved.
1. Introduction
The use of heavy ion implantation for the simulation of neutronirradiation under reactor conditions is common practice, due to theshort time scales to reach relatively high damage levels and theabsence of induced radioactivity; the latter avoids costly re-quirements for additional handling precautions and the use of hotcell facilities. However, there are issues with the correlation of theeffects on microstructure and mechanical behaviour between ionimplantation and neutron irradiation (usually from a fissionreactor). Additionally, the use of either type of radiation for inves-tigating likely response of materials within a fusion environmenthas limitations; for example, the deuterium-tritium fusion neutronenergy spectrum includes a peak in neutron flux at 14.1 MeV,compared to lower energies in typical fission spectra, with fewneutrons of energy higher than 5 MeV [1]. The fast fusion neutronsalso produce significant levels of solid and gaseous transmutation
n Energy (CCFE), Abingdon,
e).
. Published by Elsevier B.V. All rig
products in structural materials such as steels, tungsten and SiC,which can be difficult to simulate, even with dual- and triple-beamion irradiation facilities. Therefore it is recognised that all sources ofirradiation have specific characteristic effects on materials and thelimitations of each type of irradiation must be accounted for wheninterpreting data.
Mechanical testing of irradiated materials may be constrainedby volume limitations: either by laboratory limits in handlingradioactive material, or by the limited depth of the micron-scaledamage layers typically produced by heavy ion implantation. Thechallenges in measuring mechanical properties of ion irradiatedmaterials are discussed further in Refs. [2,3]. For the fusion mate-rials community, small irradiation volumes are common amongstall concepts for Early Neutron Source accelerator-driven high-en-ergy neutron sources proposed in the EU ‘roadmap to the realisa-tion of fusion energy’ [4]. It has long been established that themechanical response of a material is not independent of specimensize, particularly at small sizes [5]; therefore, the reduction of testspecimen dimensions required to utilise these radiation sourcespresents a significant risk to the validity of data available.
This paper reports on a systematic study conducted on the ef-fects of ion and neutron irradiation on the small-scale mechanical
hts reserved.

Fig. 1. EBSD maps taken from a representative area on a sample of Fe6%Cr showing (a)Inverse pole figure map showing crystal orientations with respect to the sample sur-face normal and (b) band contrast image showing grain boundaries with an angulardifference in orientation between 2� and 10� in blue and greater than 10� in red. (Forinterpretation of the references to colour in this figure legend, the reader is referred tothe web version of this article.)
C.D. Hardie et al. / Journal of Nuclear Materials 482 (2016) 236e247 237
properties a model Fe 6%Cr alloy. The larger volume of radiationdamage available in the neutron-irradiated material enabled themanufacture of micro-cantilever specimens with a wide range ofsizes, providing an opportunity to investigate the effect of radiationdamage on the mechanisms controlling the commonly observedsize effect on measured strength. Samples were taken from a singlebatch of Fe 6%Cr alloy, irradiated with comparable doses and irra-diation temperature, and tested by using identical nanoindentationand micro-cantilever methods.
2. Experimental details
2.1. Material: Fe 6%Cr
A detailed description of the alloy manufacture and character-ization of the microstructure is given by Gelles [6]. A one hundredpound (~45 kg) heat of the Fe 6%Cr alloy was melted at the Paul D.Merica Research Laboratory in New York. Compositions providedby the manufacturer and chemical analysis performed by LukensSteel Company (Pennsylvania) are given in Table 1. The alloy wasprovided in the form of a 10 mm diameter extruded bar, which wasthen rolled to approximately 3 mm thickness.
The alloywas annealed under an argon atmosphere at 950 �C for15 min followed by air cooling, then tempered at 750 �C, againfollowed by air cooling. Electron Backscattered Diffraction (EBSD)was conducted using a NordlysMax2 EBSD camerawithin a TESCANMira3 XMH field electron scanning electron microscope (SEM). A~325 mm � 190 mm map of the crystal structure from a repre-sentative area on a sample was produced with a step size of 0.5 mm.This analysis measured 175 grains and measured the average graindiameter at 10.2 mmwith one standard deviation of 12.2 mm (bordergrains were omitted from the results). The minimum andmaximum grain size detected was 0.57 mm and 55.6 mm respec-tively. The microstructure measured from this analysis is shown inFig. 1.
For the un-irradiated and ion irradiated material, sample pol-ishing included a series of lapping stages using SiC abrasive papersfrom FEPA P120 to P4000 grades followed by a chemo-mechanicalpolish using a colloidal silica suspension (0.05 mm). The neutron-irradiated specimen was prepared by Idaho National Laboratory(INL) staff after irradiation. In order to reduce total activity, a250 mm thick, 2.3 mm diameter disc was punched from a largersheet. The sample was ground with a series of abrasive papers to afinal stage using FEPA P1200, polished using 3 mm and 1 mm dia-mond suspensions, followed by a chemo-mechanical polish using acolloidal silica suspension (0.05 mm).
2.2. Neutron irradiation
A sample was irradiated in capsule 6A in the ATR1 materials testreactor in INL at a controlled temperature of 288 �C ± 12 �C. Theduration of the irradiation cycle was approximately 9 weeks andhad a target total dose of 1.7 dpa. The geometry of the sample used
Table 1Elemental analysis provided by the manufacture and separate examination (com-positions in weight percent). Data taken from Ref. [6].
Manufacturer Chemical Analysis
Cr 6.0C 0.007O2 0.021 0.001N2 0.0014 0.05P 0.005Ni 0.1Mn 0.02
in this study is a 2 mm diameter disc ~200 mm thick, correspondingto a volume of ~0.6 mm3.
The neutron irradiation produced radioactive isotopes withinthe material and therefore required special precautions for trans-portation, storage and handling. Despite the relatively small vol-ume, the total activity of the sample was measured at 199 MBq;Table 2 shows the activity measurements for the sample. Dose ratemeasurements were 0.15 mSv/hr gamma (15 mrem/hr) and 0.9mSv/hr beta (90 mrem/hr) on contact and 0.01 mSv/hr gamma (1mrem/hr) at 30 cm. This activity was 90% of the active materialinventory limit for non-invasive work in the Department of Mate-rials at the University of Oxford, UK and required use of the ‘hot’focused ion beam (FIB) facilities at the Center for Advanced EnergyStudies (CAES), USA.
2.3. Ion irradiation
Ion implantations using iron ions were conducted at the 3 MV-Tandetron accelerator at Helmholtz-Zentrum Dresden-Rossendorf.The implantationwas designed with multiple ion charges, energiesand beam currents in an attempt to maintain a constant level ofdamage and dose rate with depth into the sample. The beam wasscanned at ~1 kHz over the sample during irradiation. The beamconditions used are shown in Table 3.
The implantation temperature was measured and controlled at288 �C by a thermocouple mechanically clamped adjacent to the

Table 2Isotope activity measurements for Fe%6Cr sample irradiated inthe ATR1 reactor at INL. Data provided by Collin Knight (INL).
Isotope Curies MBq
HE 6 0.00Eþ00 0.0BE 8 0.00Eþ00 0.0B 12 0.00Eþ00 0.0C 14 3.34E-09 0.0SC 47 1.29E-18 0.0SC 48 2.00E-25 0.0SC 49 0.00Eþ00 0.0TI 51 0.00Eþ00 0.0V 52 0.00Eþ00 0.0V 53 0.00Eþ00 0.0V 54 0.00Eþ00 0.0CR 51 9.91E-04 36.7CR 55 0.00Eþ00 0.0MN 54 7.50E-04 27.8MN 56 0.00Eþ00 0.0MN 57 0.00Eþ00 0.0MN 58 0.00Eþ00 0.0FE 55 3.42E-03 127.0FE 59 1.88E-04 7.0CO 60 3.57E-05 1.3CO 60M 0.00Eþ00 0.0CO 61 0.00Eþ00 0.0Y 90 4.02E-15 0.0Y 90M 0.00Eþ00 0.0Y 91 2.50E-09 0.0TOTAL 5.38E-03 199.8
Fig. 2. SRIM calculations showing (a) irradiation damage from iron ions vs. depth intosample surface, including total damage and contributions from each beam energy, and(b) dose rate vs. depth into sample surface for each energy.
C.D. Hardie et al. / Journal of Nuclear Materials 482 (2016) 236e247238
samples on the base plate. The beam conditions were designedaccording to SRIM detailed calculation with full damage cascades[7] using a displacement energy for iron of 40 eV [8] and producedan average damage of 1.7 dpa in a layer 2 mm in depth from thesample surface as shown in Fig. 2a. Beam currents were set duringimplantation to give a consistent peak dose rate of 5 � 10�5 dpa/sfor all energies (Fig. 2b).
2.4. Nanoindentation and micro-cantilever testing
Nanoindentation was conducted with an MTS NANO IndenterXP (MTS NANO Oak Ridge Tennessee, USA) with a single Berkovichtip; the tip shape was calibrated before each test series. The“continuous stiffness measurement” (CSM) indentation and anal-ysis method [9] was used to make at least 16 indents with a depthof 1000 nm in each sample, in arrays with an indent-to-indentspacing of 40 mm. The amplitude and frequency of the CSM tech-nique was 2 nm and 45 Hz respectively. Due to the fine grain size ofthe sample, data from each indent series, averaged across all in-dents, includes the response of several grains.
Micro-cantilevers were manufactured by FIBmilling in theun-irradiated and ion irradiated material using a Zeiss AurigaFIB/SEM dual beam system in the Department of Materials, OxfordUniversity. Micro-cantilevers were manufactured in the neutron
Table 3Ion beam conditions for implantation with multiple energies at the Ion Beam Center, Ro
Target Temperature 288 �C Ion
Energy (MeV) Dose (ions/cm2) Ion Charge Dos
0.5 1.16 � 1014 1 1.601 2.18 � 1014 1 1.842 2.18 � 1014 1 2.003 2.18 � 1014 1 2.164.5 2.18 � 1014 2 2.386 2.91 � 1014 2 2.319 8.00 � 1014 3 2.34TOTAL 2.08 � 1015
irradiated material using the ‘hot’ FEI Quanta dual beam micro-scope at CAES in Idaho Falls (USA). The following test specimenswere produced:
i. Neutron irradiated sample - 66 cantilevers with cross-sectional heights from 0.82 to 7.30 mm (Fig. 3).
ii. Ion irradiated sample - 30 cantilevers with cross-sectionalheights from 0.36 to 2.3 mm
iii. Un-irradiated sample - 32 cantilevers with cross-sectionalheights from 0.53 to 5.11 mm
The cantilever beams were FIB milled by using 30 KV Gaþ andvarious beam currents depending on the cantilever beam size andwere finished with lower polishing currents to achieve a geometrywith sharp edges. The All beams were measured by stereo-imagingtechniques using the principles described in Ref. [10]. Tests wereconducted using the Nano-XP nanoindenter by bending the
ssendorf.
species Feþ Time (hrs)
e Rate (ions/cm2/s) Beam Current (nA/cm2)
� 1010 2.56 2.02� 1010 2.95 3.29� 1010 3.21 3.03� 1010 3.46 2.80� 1010 7.62 2.55� 1010 7.41 3.49� 1010 11.24 9.50
TOTAL 26.69

Fig. 3. SEM micrographs showing entire neutron irradiated sample (left) and region ofarrays of micro-cantilevers of various sizes (right).
C.D. Hardie et al. / Journal of Nuclear Materials 482 (2016) 236e247 239
beams to a final maximum peak strain (at the lower surface at thebeam root), εmax, of ~0.05 and a target strain rate at the beam rootsurface of 2 � 10�4 s�1; for the varying beam sizes, this requiredcontrolled displacement rates from 1.4 to 30 nm s�1. The stress-strain response from each test was calculated from the load-displacement data, P-d, measured with the nanoindenter.Maximum stress for the triangular beams were calculated byintegrating the second moment of area for a triangularbeam, ¼wh3/36 , with the equation for stress using simple beamtheory, s¼My/I, where y¼2h/3 :
smax ¼ 24Plwh2
(1)
Similarly maximum strain was calculated by using eq. (1) andε¼s/E from Hooke's Law, and the equation for maximum deflectionof a cantilever beam loaded at the free end d¼Pl3/3EI from simplebeam theory:
εmax ¼ 2dhl2
(2)
where l is the distance between the beam's fixed end and the pointof loading, and w is the beam width. The elastic modulus wascalculated from the initial linear gradient of the stress-strain curve,and the proof stress was calculated as the stress at the point ofinterception between the stress-strain curve and a line with agradient equal to the elastic modulus and x-intercept at 0.2% strain.
Errors were calculated by summing measuring and calculatingall errors for elastic modulus and stress equations in quadrature:
vE ¼ffiffiffiffiffiffiffiffiffiffiffiffiffiffiffiffiffiffiffiffiffiffiffiffiffiffiffiffiffiffiffiffiffiffiffiffiffiffiffiffiffiffiffiffiffiffiffiffiffiffiffiffiffiffiffiffiffiffiffiffiffiffiffiffiffiffiffiffiffiffiffiffiffiffiffiffiffiffiffiffiffiffiffiffiffiffiffiffiffiffiffiffiffiffiffiffiffiffiffiffiffiffiffiffiffiffiffiffiffiffiffiffiffiffiffiffiffiffiffiffiffiffiffiffiffiffiffiffiffiffiffiffiffiffiffiffiffi�EP
�2
vP2 þ�3El
�2
vl2 þ��E
d
�2
vd2 þ��Ew
�2
vw2 þ��3E
h
�2
vh2
s(3)
vs ¼ffiffiffiffiffiffiffiffiffiffiffiffiffiffiffiffiffiffiffiffiffiffiffiffiffiffiffiffiffiffiffiffiffiffiffiffiffiffiffiffiffiffiffiffiffiffiffiffiffiffiffiffiffiffiffiffiffiffiffiffiffiffiffiffiffiffiffiffiffiffiffiffiffiffiffiffiffiffiffiffiffiffiffiffiffiffiffiffiffiffiffiffiffiffiffiffiffiffiffiffiffiffiffiffiffi�sP
�2vP2 þ
� s
l
�2vl2 þ
��s
w
�2vw2 þ
��2sh
�2vh2
s(4)
Each micro-cantilever test was modelled using Finite ElementAnalysis (FEA) to fit the simulation load-displacement curves to theexperimental data by changing the modelled material's isotropicstress-strain properties, via a process of progressive convergentapproximation. The continuum isotropic plasticity model used in
FEA could not represent the stochastic nature of plasticity at themicron scale, hence the aim was to fit the model to the averagedexperimental curve. A series of MATLAB functions was written toautomate several tens of FEA simulations required for the fitting ofdata within a specified accuracy, and the final model isotropicstress-strain properties were recorded.
The radiation damage microstructures of these irradiated alloyshave been characterised by Transmission Electron Microscopy (ionirradiated specimen) and Atom Probe Tomography (neutron andion irradiated specimens). Results have been reported in detailelsewhere [11,12], but are summarised in this paper when discus-sing likely hardening mechanisms.
3. Results
3.1. Nanoindentation
Nanoindentation data for elastic modulus versus indentationdepth are shown in Fig. 4a. At shallow indentation depths themeasured elastic moduli for ion and neutron irradiated materialsare similar and are higher than for the un-irradiated material. Asthe indentation depth increases, the measured elastic modulus forthe ion-irradiated material tends towards the values for the un-irradiated material, which correlates with an increasing influenceon the measured modulus from the un-irradiated bulk substratematerial below the ion-irradiated layer.
The modulus measured by the nanoindenter may be affected byerrors in the tip to surface contact area calculated from the indenterdisplacement, hc, and tip area function, f(hc), resulting from plasticpile-up of material surrounding the indents. Post-indentationcontact area measurements of all indent impressions in the un-irradiated and neutron irradiated material were conducted bySEM imaging (Fig. 5). This was done by measurement of the pro-jected contact area, which is clearly visible by a sharp change insurface gradient (edge) of the indent pit using a similar method tothat of Tsui et al. [13]. This area measurement is then used tocalculate area-corrected values of hardness and elastic modulususing the same equations as reported in Ref. [9]. Elastic moduluswas then recalculated for the maximum indentation depth of1000 nm using the measured post-indentation contact area foreach indent; the average values with standard deviation are shownin Fig. 4a (“Area Correction” points). The use of actual contact areagives derived modulus values lower than those calculated from tiparea functions; however modulus of the neutron-irradiated mate-rial is still calculated to be ~15% greater than that of the unirradi-
ated material.Fig. 4b shows average values for hardness versus indentation
depth, and hardness values at maximum indentation depth cor-rected for post-indentation contact area measurement. Irradiationhardening is clearly evident in both irradiated alloys; however thehardening in the neutron-irradiated material is more than doublethat in the ion-irradiated material. Similar to the elastic modulusmeasurements, hardness in the ion-irradiated material tends to-wards the un-irradiated hardness as the indentation depth

Fig. 4. (a) Average elastic modulus and (b) hardness versus indentation depth for ar-rays of at least 16 indents produced in each of the un-irradiated, ion-irradiated andneutron irradiated Fe 6%Cr specimens. Error bars represent ± one standard deviation.For the un-irradiated and neutron irradiated condition, data at maximum displace-ment has been corrected to account for pile-up of material surrounding the indentertip from post indent contact area measurements.
C.D. Hardie et al. / Journal of Nuclear Materials 482 (2016) 236e247240
increases. Larger pile-up surrounding the indenter tip in theneutron-irradiated material results in a slight over estimation ofirradiation hardening in calculations based on the tip area function;however pile-up in the ion-irradiated material may also over-estimate the irradiation hardening.
Typical SEM images of indent impressions in the un-irradiatedand neutron irradiated material are shown in Fig. 5. Plasticallydeformed material forming the pile-up lobes showed diffuse sliplines in the un-irradiated material and highly localised slip steps inthe neutron-irradiated material. In both cases, slip lines were wavyand curved, rather than linear, indicating extensive cross slip ofdislocations between available slip planes.
Fig. 5. SEM micrographs of typical indent impressions in the un-irradiated andneutron irradiated material.
3.2. Micro-cantilever testing
Typical stress-strain curves for micro-cantilever tests of varioussizes are shown in Fig. 6. For the un-irradiated material, as plasticdeformation progresses, large load drops are visible, which tend toincrease in magnitude as the beam sizes increase. Such load dropswere not observed in either the ion- or neutron-irradiated alloys,where plastic deformation produced smooth variations in load.Very little work hardening was observed in the un-irradiated andion-irradiated material. In comparison, the neutron-irradiatedmaterial clearly exhibits work hardening.
The elastic modulus measurements with error bars calculatedusing the simple beam theory methods described in Section 2 areplotted in Fig. 7 for all cantilever tests. A large scatter in themodulus between ~150 and 350 GPa was observed in the smallestcantilevers, which may be partially attributed to variations incrystal orientation across each test (the elastic modulus of pure Fevaries from ~125 GPa along the <100> axis to 275 GPa along the<111> axis [14]). As the beam size increases, more grains contributeto the elastic modulus measurements and the scatter decreases;these values should tend towards approximately 210 GPa, themacroscopic polycrystalline value [15]. The values of elasticmodulus measured in the largest beams appear to be slightly lowerthan this value; this may be due to lower stiffness measurementscaused by the deformation of material at the base of the beam andsurrounding the indenter tip; this is not taken into account in thesimple beam model, which assumes an purely elastic cantilever,rigidly fixed at one end.
The proof stresses calculated at 0.2% strain offset versus thebeam height are plotted in Fig. 8. All three materials exhibit anincrease in the measured proof stress as the cantilever size de-creases. In the neutron-irradiated material, proof stress valuesabove those for the unirradiated material are clearly evident acrossthe entire range of beam sizes. In the ion-irradiated material theproof stress values for beams with h < 1 mm are not separable fromthose for unirradiated beams. For each material, it was found thatthe proof stress, sproof, could be fitted closely to a function of theform:
sproof ¼ A0h�1 þ A1 (5)
where h is the beam height and A1 is the asymptotic value of proofstress (sproof at h¼ ∞). The fitted curves are shown in Fig. 8. Thevalues for A0 and A1 are given in Table 4 with the correlation co-efficient R; these values are discussed further in Section 4.3.
Typical SEM images of the plastically deformed surfaces at thebeam base are shown in Fig. 9. Slip steps are visible in the largercantilever beams, but no slip steps were observable in the smallestbeams. Large beams in the un-irradiated material exhibited only afew large slip steps in the deformed region. Slip steps in both typesof irradiated material are more numerous and are well-separated,suggesting plasticity progresses inhomogeneously within local-ised slip planes.
4. Discussion
The experiments reported in this paper were conducted withtwo objectives. The first objectivewas to assess the validation of ionimplantation as an analogue for neutron irradiation, by means of adirect comparison. The second objective was to investigate theinfluence of irradiation hardening on the intrinsic size effects onsample strength, by conducting micro-mechanical testing with testspecimens of various sizes. The implications of the results on bothobjectives are discussed below.

Fig. 6. Typical stress-strain curves from micro-cantilever tests of various sizes in: (a) un-irradiated, (b) ion-irradiated and (c) neutron irradiated material. Various rounded beamheights shown with different colours. (For interpretation of the references to colour in this figure legend, the reader is referred to the web version of this article.)
C.D. Hardie et al. / Journal of Nuclear Materials 482 (2016) 236e247 241
4.1. Hardening effects of radiation damage
The radiation damage defect types, sizes and densities found inprevious studies of these irradiated materials [11,12] are summar-ised in Table 5. The main points are that:
1) Dislocation loops are of ½<111>{111} type for both irradiationmethods.
2) For the ion irradiated material, there is good agreement be-tween the TEM and the APT measurements for the numberdensity of loops: 1.3 to 1.4 � 1022 m�3.
3) The loop number density in the neutron irradiated material(2.9 � 1022 m�3) is roughly double that in the ion-irradiatedmaterial.
4) APT finds somewhat larger loops than TEM. Considering bothtechniques, typical loop diameters are ~6e9 nm in ion-
irradiated material, and bimodal in the neutron irradiated ma-terials (~9 nm and ~18 nm).
5) Chromium segregation to the loops is found only in the neutronirradiated sample, but Si segregates (more weakly than chro-mium) to the loops for both irradiation types.
The irradiation hardening due to damage from neutrons or ionscan be considered in terms of interactions between mobile dislo-cations and the observed dislocation loops (and their associatedsolute clusters). If it is assumed that the loops act as local obstaclesto dislocation motion, their effect on increasing the shear flowstress on the material (by Dty) can be modelled as either:
Dty ¼ Gbl½cosðfcÞ�
23 (8)
Or

Fig. 7. Elastic modulus measurements versus beam height, h, for all micro-cantileverstested in the un-irradiated, ion-irradiated and neutron-irradiated material. Error barsrepresent estimated error according to analysis reported in Section 2.4.
Fig. 8. Proof stress measurements versus beam height, h, for all micro-cantileverstested in the un-irradiated, ion-irradiated and neutron-irradiated material. Error barsrepresent estimated error according to analysis reported in Section 2.4.
Table 4Fitting parameters for equation (5) and correlation coefficient R.
A0 (mmGPa) A1 (GPa) R
Un-irradiated 2.43 0.477 0.90Ion-irradiated 1.88 1.16 0.94Neutron-irradiated 3.79 1.29 0.91
Fig. 9. Typical SEM micrographs of plastically deformation on the surfaces of micro-cantilever beams tested in the un-irradiated, ion-irradiated and neutron-irradiatedbeams.
C.D. Hardie et al. / Journal of Nuclear Materials 482 (2016) 236e247242
Dty ¼ Gbl
cosðfcÞ; (9)
where G is the material's shear modulus (82 GPa for iron), b is thelength of the Burgers vector (0.248 nm), l is the inter-obstaclespacing and 2fc is the critical angle subtended by the two armsof the dislocation as it breaks away from an obstacle. The parameterfc characterises the obstacle strength, with low values implying astrong obstacle; at one limit, when fc ¼ 0, the obstacle is impen-etrable, and the dislocation will pass the obstacle by the Orowanbowing process, at the other limit, when fc ¼ 90�, the dislocationpasses the obstacle without hindrance. Equation (8), the “Friedelrelation”, applies when obstacles are weak (fc > ~50�), with theradius of dislocation line curvature under the applied stress beingmuch greater than the typical inter-obstacle spacing [16,17];
equation (9) applies when obstacles are strong (fc < ~50�), with theradius of dislocation line curvature being of the same order as thetypical inter-obstacle spacing [16].
The inter-obstacle spacing, l, is determined as:
l ¼ ½r$d��12 � d (10)
where r is the number of obstacles, of diameter d, per unit volume.To obtain first-approximation values for fc for the obstacles in
the ion-irradiated and neutron irradiated materials, we use thenanoindentation data rather than the microcantilever data, as be-ing less subject to scaling effects. Fig. 4b indicates that the hardnessincrease due to ion-irradiation is ~1 GPa and that due to neutronirradiation is ~3 GPa; we take hardness as being ~3� (tensile) yieldstress [18], and shear flow stress as being ½ the yield stress (ac-cording to a maximum possible Schmid factor of 0.5 for a singlecrystal). Table 5, in the bottom 5 rows, shows results of these cal-culations (note that the data for defect sizes used for the ion-irradiated material were the mean value of those derived fromTEM and APT data; for the neutron irradiated data, the mean of thevalues derived for the two loop sizes). These rather crude calcula-tions indicate that.
1) the obstacle spacing is significantly less in the neutron-irradiated material than in the ion-irradiated material (evengiven the uncertainties in dealing with the bimodal size distri-bution in the neutron-irradiated material),

Table 5Dislocation loops found in ion irradiated and neutron irradiated samples, and obstacle strength calculations.
Ion irradiation [11] Neutron irradiation [11,12]
TEM APT APT
Loop type Mostly ½<111>{111}-type N/A Mostly ½<111>{111}-typeSegregating elements N/A Si along the dislocation lines
with lower C and P but no CrCr enriched at the periphery,Si located inside the loops
Both Si and Cr outsidethe dislocation loops
Size (nm) 6.4 9.2 9.2 18.1Number density (/ 1022/m3) 1.3 1.4 2.9
Ion Irradiation (Current work) Neutron Irradiation (Current work)
l (nm) 100 80 41 32Mean l (nm) 90 37Dty (MPa) 170 500fc (eqn (1)) 42� 26�
fc (eqn (2) 50� 32�
C.D. Hardie et al. / Journal of Nuclear Materials 482 (2016) 236e247 243
2) in both cases the loops are relatively strong obstacles, and aretherefore best dealt with by equation (9),
3) the obstacle strength in the neutron irradiated material issignificantly higher than in the ion-irradiated material.
The greater hardness increase due to neutron irradiation,compared with ion irradiation, thus results from both an increaseddislocation loop density, and from the loops having greater obstaclestrength to gliding dislocations. This greater obstacle strength inthe neutron irradiated material is likely to be related to the higherlevel of segregation of chromium (and possibly silicon) to thedislocation loops. Greater obstacle strength in the neutron irradi-ated alloy is also consistent with the observation of work hardeningin micro-cantilever tests, where it is possible that additionalhardening features such as Orowan loops are produced whenglissile dislocations overcome strong obstacles.
4.2. Size effects in irradiated materials
The observed increase in mechanical strength of a material withdecrease in test specimen size is a well-known phenomenon. Thefirst observations of size dependence in tensile strength weremadeby Brenner in 1956 by tensile testing whiskers of iron, copper andsilver from 1.2 mm to 15 mm in diameter [5]. There have been severalattempts to characterise the underlying mechanisms which pro-duce this effect, yet at present there is no clear explanation whichcan account for all of the various observations throughout theliterature. The mechanisms identified which result in size effectsare:
i. Strain gradient plasticity theory (beam bending andindentation)
ii. Dislocation starvationiii. Dislocation truncationiv. Dislocation pile-up at the beam neutral axis (beam bending
only)
A variation of hardness with indentation depth is commonlyobserved in many materials and provides a method to measure thesize dependence of strength in a single test. Nix and Gao [19]developed a law for strain gradient plasticity which suggests thatthe density of geometrically necessary dislocations (GNDs)required to support the shape of the indent impression is respon-sible for the indentation size effect (ISE). Assuming a simplifiedmodel comprising of a rigid conical indenter and deformationaccommodated by circular GNDs in a hemispherical volumebeneath the indenter tip, the density of GNDs is defined as [19]:
rGND ¼ 32bh
tan2q (11)
where q is the centreline-to-face angle of the indenter tip, b is theBurgers vector and h is the indentation depth. Thus, as the indenteris driven into the sample surface, rGND , and thereby the contribu-tion to hardness due to work-hardening effects, decreases withindentation depth.
This theory does not apply to the strong size effect observed inmicro-pillar tests [20], where there are no strain gradients pro-duced from uniaxial loading. It has been proposed that the lack ofdislocation multiplication events during the deformation of suchsmall volumes may lead to a lack of available dislocations, termeddislocation starvation, and requires the nucleation of dislocations ata higher stress [21]. Similarly, dislocation sources require a char-acteristic volume to operate. The fabrication of test specimens maycreate surfaces which reduce the length of available dislocationsegments and limit the volume available for source operation;these shorter segments and sources may require higher stresses tooperate, known as truncation hardening [22].
The theories of source starvation and truncation suggest thatplastic deformation is increasingly controlled by the activationcharacteristics of dislocation sources as the size of the test volumedecreases. In the present work, there are two observations whichindicate that the activation of dislocation sources influence plas-ticity in the tests. Firstly, discrete pop-in events in the load-displacement behaviour were observed during nanoindentationat small depths in several tests on all samples. This represents thetransformation from elastic to fully plastic deformation by theactivation of dislocation sources. Secondly, as commonly observedin other micro-mechanical tests [23], plasticity in the micro-cantilever tests shown in Fig. 6 progressed in a stochastic natureexhibiting several drops in load during mechanical testing. Theseload drops are likely to be related to the activation of individualsources as the deformation progresses.
As shown in Fig. 6a, the magnitude of the load drops increaseswith increasing beam size in the un-irradiated material. Themagnitude of the load drop may be proportional to the strainaccommodated once a dislocation source has been activated; it islikely that this strain is controlled by the number of dislocationswhich can be emitted before stresses produced by pile-up at theneutral axis cause the source to shut down. Hence, the increase inmagnitude of the load drops with increasing beam size may relateto the longer distance dislocations glide on larger slip planes, whichaccommodate a greater number of dislocations emitted from asingle source. This observation is supported by the appearance ofvisible slip steps at the surface only in the larger plastically

1 A large extent of the plastically deformed region is more likely to be confinedwithin the bottom half of the beam, however the entire beam thickness is assumedhere for consistency with the method developed by Motz et al. [23].
C.D. Hardie et al. / Journal of Nuclear Materials 482 (2016) 236e247244
deformed beams in Fig. 9, where each slip plane can accommodatea greater number of dislocations.
Load drops in cantilever tests indicate that the stress to activatedislocation sources dominates the observed strength of the mate-rial, resulting in no difference in the yield stress between the un-irradiated and ion-irradiated material for beams <1 mm depth. Asimilar observation was made in the investigation conducted byKiener et al. [24], where no irradiation hardening in proton irra-diated Cu was measured in micro-pillar tests below a diameter of400 nm. However, even though the measured yield stress does notchange with irradiation, strain localisation characteristics maydiffer; Kiener et al. identified that glissile dislocations partially orfully remove the irradiation-induced defects and that plasticdeformation developed by localised slip within defect-free chan-nels. The highly localised slip steps observed in the irradiatedmaterial around indents (Fig. 5) and at the deformed surfaces ofmicro-cantilevers (Fig. 9) suggests that the material investigatedhere deforms in a similar manner. This type of plastic deformationhas been characterised for an ion-irradiated Fe 12%Cr alloy [25] andis caused by the annihilation of irradiation-induced defects byglissile dislocations. In the presence of high stresses produced toovercome size effect mechanisms, the defects may be annihilatedwithout additional stress and plastic deformation progresses at thesame stress as the un-irradiated material.
When the size of the test specimen increases above a critical size(~1 mm in the present case), the stress determined by the size effectmechanisms is lower than that determined by the irradiation-induced defects and the response of the ion-irradiated materialdeviates from that of the un-irradiated material. In Kiener's study[24], this critical size was found to be a pillar diameter of 400 nm,above which the yield stress of the irradiated Cu was apparentlyindependent of size. This is clearly not observed in the tests re-ported here where the yield stress of the irradiated material con-tinues to decrease as the beam depth increases.
Unlike the behaviour of ion-irradiated material, irradiationhardening measured for the neutron irradiated material was notcompletely obscured in the smallest beams. This suggests that theinteraction between glissile dislocations and irradiation induceddefects is different for the defects produced by ion-irradiation andthose produced by neutron-irradiation. As suggested in Section 4.1,the neutron-irradiated material is likely to exhibit Cr enrichmentassociated with radiation damage dislocation loops. Unlike the“clean” dislocation loops, areas of Cr enrichment cannot annihilateby reaction with a glissile dislocation, and thus will contribute tothe stress required for plastic deformation in addition to themechanisms controlling the size effect. Furthermore, the increasedwork hardening behaviour observed in the neutron-irradiatedmaterial indicates the resistance to annihilation of Cr enriched re-gions. .
4.3. Comparison with macro-scale properties
The Fe 6%Cr material studied here was also investigated byVickers micro-hardness testing. A LECO LM247 AT instrument wasoperated with a load of 500 g, to produce indents into both the un-irradiated and neutron irradiated material. Values of hardness were117.2 Hv ( ±2.7) for the un-irradiated material and 232.9 Hv ( ±5.8)for the neutron-irradiated material. Multiplying these values bystandard gravity of 9.81 to provide SI units of stress and dividingthese values by 3 (see Ref. [18]) provides an estimate of the macroscale yield stress; this produces a yield stress of 383MPa for the un-irradiated material and 762 MPa for the neutron-irradiated mate-rial. Using the same technique on the nanoindentation measuredhardness at the maximum displacement of 1000 nm produceshardness values of ~500 MPa for the un-irradiated material and
~1000 MPa for the neutron irradiated material, suggesting that theresults are subject to indentation size effect.
The micro-cantilever data described in Section 3.2 may providea means for extrapolation to macro scale properties. The observa-tion that the proof stress is strongly proportional to h�1 was alsomade by Motz et al. [23] for micro-cantilever tests in a coppersingle crystal. Motz provided an analytical model which accountsfor the increase in flow stress produced by the pile-up of disloca-tions at the neutral axis. This contribution, sPU, is given by:
sPU ¼ aGb
u2
x2hl2 (12)
where a is a constant (0e1), G is the shear modulus (84 GPa foriron), b is the Burgers vector (248 pm for iron), u is the beambending angle, x is the size of the plastically deformed region, h isthe beam height and l is the dislocation source spacing. Theassumption that the size of the plastically deformed region can beapproximated as the beam thickness1 (x¼h) gives [23]:
sPU ¼ aGb
u2
hl2 (13)
According to the equations in Section 3.2, values of A0 may bedescribed by:
A0 ¼ aGbu2l2 (14)
Using the fitted values for A0 in Table 4 produces an averagedislocation source spacing from ~20 nm to ~200 nm for the threematerials at values of a from 0.1 to 0.9. This range corresponds wellwith the distribution of slip steps in the deformed beams shown inFig. 9.
The values for A1 in Table 4 represents the asymptotic values ofproof stress (sproof at h¼ ∞) of 477 MPa for the un-irradiated and1290 MPa for the neutron irradiated material, which is similar tothe yield stress calculated from nanoindentation hardness asdescribed above. These values are larger than the values of yieldstress calculated from the Vickers hardness data and indicate thatadditional size effect mechanisms such as source starvation/trun-cation may also contribute to the response of the material. Thissuggests that the extrapolation of yield stress to macro scaleproperties requires a more complex model of the mechanismswhich contribute to the size effect or a larger range of test sizes.
4.4. Comparison of ion and neutron irradiation
The production and evolution of radiation damage in a givenmaterial depends on several parameters including the type andenergy of the irradiating particle, the fluence/ dose (number ofdisplacements, dpa), the irradiation temperature and flux/dose rate(damage rate, dpa/s) [26]. The current experiment producedneutron and ion irradiated materials with planned dose of 1.7dpaand irradiation temperature of 288 �C, yet the nanoindentationmeasurements presented in Fig. 4b and micro-cantilever results inFig. 8 show clear differences between hardening produced byirradiation with ions and that with neutrons. These differencesmight be caused by inconsistencies in damage calculations, thedifferent PKA energy spectra between the two irradiation types, thepresence of transmutation He and H in neutron-irradiated mate-rials only, or by differences in damage types and densities produced
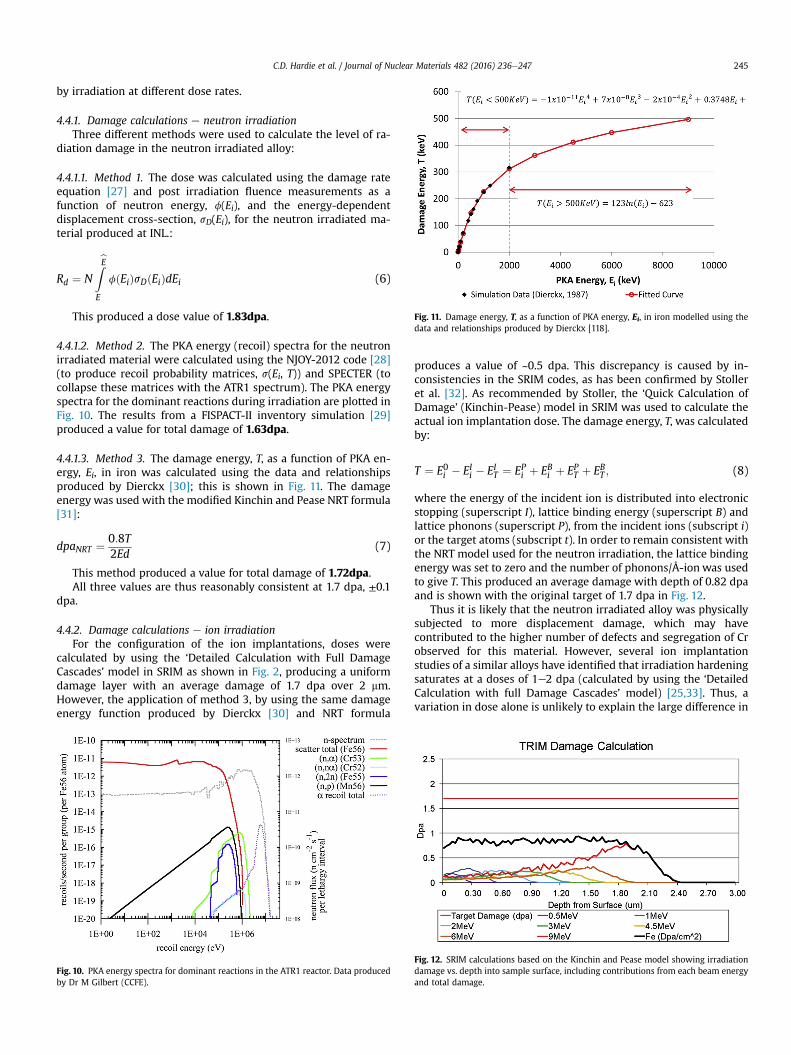
Fig. 11. Damage energy, T, as a function of PKA energy, Ei, in iron modelled using thedata and relationships produced by Dierckx [118].
C.D. Hardie et al. / Journal of Nuclear Materials 482 (2016) 236e247 245
by irradiation at different dose rates.
4.4.1. Damage calculations e neutron irradiationThree different methods were used to calculate the level of ra-
diation damage in the neutron irradiated alloy:
4.4.1.1. Method 1. The dose was calculated using the damage rateequation [27] and post irradiation fluence measurements as afunction of neutron energy, f(Ei), and the energy-dependentdisplacement cross-section, sD(Ei), for the neutron irradiated ma-terial produced at INL.:
Rd ¼ NZbEE
fðEiÞsDðEiÞdEi (6)
This produced a dose value of 1.83dpa.
4.4.1.2. Method 2. The PKA energy (recoil) spectra for the neutronirradiated material were calculated using the NJOY-2012 code [28](to produce recoil probability matrices, s(Ei, T)) and SPECTER (tocollapse these matrices with the ATR1 spectrum). The PKA energyspectra for the dominant reactions during irradiation are plotted inFig. 10. The results from a FISPACT-II inventory simulation [29]produced a value for total damage of 1.63dpa.
4.4.1.3. Method 3. The damage energy, T, as a function of PKA en-ergy, Ei, in iron was calculated using the data and relationshipsproduced by Dierckx [30]; this is shown in Fig. 11. The damageenergy was used with the modified Kinchin and Pease NRT formula[31]:
dpaNRT ¼ 0:8T2Ed
(7)
This method produced a value for total damage of 1.72dpa.All three values are thus reasonably consistent at 1.7 dpa, ±0.1
dpa.
4.4.2. Damage calculations e ion irradiationFor the configuration of the ion implantations, doses were
calculated by using the ‘Detailed Calculation with Full DamageCascades’ model in SRIM as shown in Fig. 2, producing a uniformdamage layer with an average damage of 1.7 dpa over 2 mm.However, the application of method 3, by using the same damageenergy function produced by Dierckx [30] and NRT formula
Fig. 10. PKA energy spectra for dominant reactions in the ATR1 reactor. Data producedby Dr M Gilbert (CCFE).
produces a value of ~0.5 dpa. This discrepancy is caused by in-consistencies in the SRIM codes, as has been confirmed by Stolleret al. [32]. As recommended by Stoller, the ‘Quick Calculation ofDamage’ (Kinchin-Pease) model in SRIM was used to calculate theactual ion implantation dose. The damage energy, T, was calculatedby:
T ¼ E0i � EIi � EIT ¼ EPi þ EBi þ EPT þ EBT ; (8)
where the energy of the incident ion is distributed into electronicstopping (superscript I), lattice binding energy (superscript B) andlattice phonons (superscript P), from the incident ions (subscript i)or the target atoms (subscript t). In order to remain consistent withthe NRT model used for the neutron irradiation, the lattice bindingenergy was set to zero and the number of phonons/Å-ion was usedto give T. This produced an average damage with depth of 0.82 dpaand is shown with the original target of 1.7 dpa in Fig. 12.
Thus it is likely that the neutron irradiated alloy was physicallysubjected to more displacement damage, which may havecontributed to the higher number of defects and segregation of Crobserved for this material. However, several ion implantationstudies of a similar alloys have identified that irradiation hardeningsaturates at a doses of 1e2 dpa (calculated by using the ‘DetailedCalculation with full Damage Cascades’ model) [25,33]. Thus, avariation in dose alone is unlikely to explain the large difference in
Fig. 12. SRIM calculations based on the Kinchin and Pease model showing irradiationdamage vs. depth into sample surface, including contributions from each beam energyand total damage.

C.D. Hardie et al. / Journal of Nuclear Materials 482 (2016) 236e247246
hardening between the ion and neutron irradiated materials.
4.4.3. The effect of PKA energy spectraFission neutrons produce PKA energies of up to 200 keV [30] and
have an energy spectrumwhich includes a tail of lower energies. Incomparison, in ion implantation experiments each incident ionsimulates a PKA with an energy equal to that of the beam energy(up to 9 MeV in the current experiment) [34,35]. Using recoilspectra for 56Fe and calculations of displacements from method 3above, the damage as a function of PKA energy produced by the ionand neutron irradiations is shown in Fig. 13.
The difference in the total number of displacements produced byeach incident particle should be accounted for in the damage cal-culations for each irradiation; thus, areas beneath the curves for ionsand neutrons in Fig. 13 should be equal to the total dose calculatedfor eachmethod. However, the types of primary defects produced byan incident ion or neutron may differ depending on the PKA energy.There is agreement amongst several authors [30,36e38] that abovea threshold damage energy of approximately 5e10 KeV, the pro-duction of primary defects in a material is independent of damageenergy. The threshold energy represents the transition from theproduction of Frenkel pairs at the lowest PKA energies to largercascades and sub-cascade formation at higher PKA energies. Abovethis threshold energy, formations of separate sub-cascades producethe same primary defect types and the numbers of these defectsremain a constant function of the energy (30% of the NRT value[38]). On the other hand, recent MD simulations [39] identified thatcascades were in the form of a continuous distribution of damageand that the primary defect morphology continues to change as afunction of energy up to 0.5 MeV.
For the neutron irradiation, the majority of the damage wasproduced by PKA energies from ~60 to 275 keV with a peak at158 keV. In contrast, PKA energies produced during the ion im-plantationwere 0.5e9 MeV. This suggests that the cascade damagemorphology produced by the fission neutrons may be significantlydifferent to that produced by ion implantation. This is likely to in-fluence the fraction of freely migrating defects in both ion andneutron irradiations [40,41]; that is, the fraction of isolated pointdefects or defects within small clusters which are mobile. Thefraction of freely migrating defects produced within an irradiatedmaterial will directly influence diffusion mediated processes suchas creep, swelling and radiation induced segregation (RIS). In thecurrent experiment, differences in the PKA energies between theion and neutron irradiated sample may have contributed to theobserved RIS of Cr in the neutron irradiated sample. The influence
Fig. 13. Radiation damage as a function of PKA energy for ion and neutron irradiations.See text for details.
of freely migrating defects is also determined whether on averagethey recombine and annihilate, or agglomerate to form dislocationloops or voids, or migrate to sinks such as grain boundaries etc. Thisis directly influenced by dose rate as described below.
4.4.4. The effect of dose rateThe dose rate of the ion-implantation was approximately 500
times higher than for the neutron irradiation. The rate of interac-tion between cascade defects is dependent on defect mobility andis proportional to the square of the defect density. The lower doserate neutron irradiation results in a lower defect density in a givenvolume per unit time; this may result in a lower number of defectinteractions and an increase in the length of defect migration pathscompared to higher dose rates. Increasing rates of irradiation creepand swelling with decreasing dose rate have been shown foraustenitic steels [42,43]. More recently an increase in irradiationhardening at lower dose rates was shown in ion-irradiated FeeCralloys of similar composition [44]; here it was shown that height-ened Cr segregation was the cause of additional hardening in thealloy irradiated with the lowest dose rate. The observation of Crsegregation described in Section 4.1 and Table 5, is comparable tothat reported in Ref. [44] and thus is likely to have been the primarycause of higher irradiation hardening produced by neutron irradi-ation compared to ion irradiation.
As discussed, the variation in the effects of irradiation withdifferent dose rates has been identified elsewhere. Methods toovercome variation in dose rate have been proposed, such as theuse of a temperature shift to manipulate defect mobility andaccommodate a different dose rate [45]. However, radiation pro-duces several types of defect all with a characteristic mobilitywhich cannot be accommodated by a single temperature shift. Atemperature shift may therefore not facilitate the complete com-parison of irradiations conducted at different rates accurately.
4.4.5. Transmutation He and HIn addition, the FISPACT-II inventory simulation indicated that
approximately 10 appm He and 6.5 appm H was produced in thealloy during neutron irradiation. This may have also contributed tothe increase in irradiation hardening.
5. Summary
i. Fe 6%Cr irradiated to a nominal dose of 1.7 dpa at 288 �Cexhibited significantly different irradiation hardeningdepending on whether the irradiation was by ions or byneutrons.
a. Nanoindentation results showed that irradiation hard-ening in the neutron-irradiated material was ~3 GPa,whilst it was ~1 GPa in the ion-irradiated material.
b. Unlike the un-irradiated and ion-irradiated material, theneutron-irradiated material exhibited some work hard-ening in micro-cantilever tests.
ii. The variation of hardening may be caused by:
a. Inconsistencies in damage calculations between thestandard NRT formula for neutron irradiations and‘detailed calculation with full damage cascades’ model inTRIM for ion-irradiation. As described in Section 4.4.2,comparison with similar work suggests that the ion im-plantation damage is likely to be at or near saturation.
b. A difference in the characteristics of the radiation damageintroduced by the two radiation types has been observed;principally a higher density of dislocation loops in theneutron irradiated material (2.9 � 1022 m�3) compared tothe ion irradiated material (1.4 � 1022 m�3) and a ten-dency for Cr clustering in the neutron irradiated material.

C.D. Hardie et al. / Journal of Nuclear Materials 482 (2016) 236e247 247
This clustering is likely to be associated with the disloca-tion loops, making them stronger obstacle to dislocationmotion, and more resistant to removal by the passage ofmobile dislocations.
c. The presence of the enhanced Cr enriched regions in theneutron irradiated material may results from differencesin the dose rate (5 � 10�5 dpa/s for ion-irradiation and~3 � 10�7 dpa/s for neutron-irradiation) and/or PKA en-ergy spectra (see Fig. 13).
iii. All materials exhibited a size effect with yield stress varyingby up to 700% for beam depths from ~0.5 mm to ~7 mm(Fig. 8). The effect in the ion-irradiated material was suchthat hardening due to irradiation was obscured by size ef-fects. In the neutron irradiated material, the stronger hard-ening due to irradiation was not fully obscured by sizeeffects. These differences in strength and irradiation hard-ening are likely to have been caused by the different types ofdefect produced by the ion and neutron irradiations, inparticular a stronger tendency to produce chromiumenriched regions for the neutron irradiation where the doserate is much lower than for ion irradiation.
iv. Attempts to extrapolate micro-cantilever results to themacro-scale in Section 4.3 appear unsuccessful. This is likelyto be caused by errors in empirical relationships used forVickers hardness data and/or multiple size effect mecha-nisms including source activation and dislocation pile-up atthe neutral axis, which require a more complex model.
Acknowledgements
Work on the neutron irradiated sample was supported by theNational Scientific User Facility (NSUF) and the Center for AdvancedEnergy Studies-Microscopy and Characterization Suite (CAES-MaCS); in particular we thank Jatuporn Burns for assistance withthe FIB at CAES-MaCS. The authors thank Mr J.W. Nielsen at INL forsupplying post irradiation fluence measurements as a function ofneutron energy, f(Ei), and the energy-dependent displacementcross-section, sD(Ei), for the neutron irradiated material. Thanks toDr M. Gilbert at UKAEA for providing damage calculations usingNJOY, SPECTER and FISPACT codes. Thanks to Mr T Milot at INL forsupplying Vickers hardness data. The work reported here waspartially supported by the Engineering and Physical Science Council(EPSRC) via a Programme Grant “Materials for Fusion and FissionPower”, EP/H018921. C.D. Hardie thanks EPSRC and the CulhamCentre for Fusion Energy (CCFE) for funding in the form of an In-dustrial CASE studentship.
References
[1] R.E. Stoller, L.R. Greenwood, Subcascade formation in displacement cascadesimulations: implications for fusion reactor materials, J. Nucl. Mater 271e272(1999) 57e62.
[2] Peter Hosemann, et al., Issues to consider using nano indentation on shallowion beam irradiated materials, J. Nucl. Mater. 425.1 (2012) 136e139.
[3] Christopher D. Hardie, Steve G. Roberts, Andy J. Bushby, Understanding theeffects of ion irradiation using nanoindentation techniques, J. Nucl. Mater. 462(2015) 391e401.
[4] F. Romanelli, P. Barabaschi, D. Borba, G. Federici, L. Horton, R. Neu, D. Stork,H. Zohm, Fusion Electricity: a Roadmap to the Realisation of Fusion Energy,EFDA Report, 2013.
[5] S.S. Brenner, Tensile strength of whiskers, J. Appl. Phys. 27 (1956) 1484e1491.[6] D.S. Gelles, Microstructural examination of neutron-irradiated simple ferritic
alloys, J. Nucl. Mater. 108e109 (1982) 515e526.[7] J.F. Ziegler, M.D. Ziegler, J.P. Biersack, SRIM e the stopping and range of ions in
matter (2010), Nucl. Instrum. Methods B268 (2010) 1818e1823.[8] Standard Practice for Measurement of Mechanical Properties during Charged-
particle Irradiation, ASTM International E821-96, 2009.[9] W.C. Oliver, G.M. Pharr, An improved technique for determining hardness and
elastic modulus using load and displacement sensing indentation experi-ments, J. Mater Res. 7 (1992) 1564e1583.
[10] G. Piazzesi, Photogrammetry with the scanning electron micrscope, J. Phys. ESci. Instrum. 6 (1973) 392e396.
[11] Y. Wu, P. Wells, G.R. Odette, T. Yamamoto, S. Roberts, C. Hardie,D. Bhattacharyya, M. Bachhav, E.A. Marquis, Microstructural characterizationof a Feþ irradiated Fe-6%Cr alloy, in: Report on the Fusion Reactor MaterialsProgram, US Department of Energy, 2015, pp. 8e11. DOE/ER-0313/58.
[12] M. Bachhav, L. Yao, G.R. Odette, E.A. Marquis, J. Nucl. Mater 453 (2014) 334.[13] T.Y. Tsui, G.M. Pharr, Substrate effects on nanoindentation mechanical prop-
erty measurement of soft films on hard substrates, J. Mater. Res. 14 (1998)292e301.
[14] G.E. Dieter, Mechanical Metallurgy, McGraw-Hill, New York, 1976.[15] G. Speich, A. Schwoeble, W. Leslie, Elastic constants of binary iron-base alloys,
Metall. Trans. 3 (1972) 2031e2037.[16] L.M. Brown, R.K. Ham, Strengthening Methods in Crystals, Applied Science
Publishers, London (, 1971.[17] J.W. Martin, Micromechanisms in Particle-re-enforced Alloys, Cambridge
University Press, 1980, p. p50.[18] David Tabor, The Hardness of Metals, Oxford university press, 2000.[19] W.D. Nix, H. Gao, Indentation size effects in crystalline materials: a law for
strain gradient plasticity, J. Mech. Phys. Solids 46 (1998) 411e425.[20] J.R. Greer, J.T.M. De Hosson, Plasticity in small-sized metallic systems: intrinsic
versus extrinsic size effect, Prog. Mater. Sci. 56 (2011) 654e724.[21] W.D. Nix, J.R. Greer, G. Feng, E.T. Lilleodden, Deformation at the nanometer
and micrometer length scales: effects of strain gradients and dislocationstarvation, Thin Solid Films 515 (2007) 3152e3157.
[22] T.A. Parthasarathy, S.I. Rao, D.M. Dimiduk, M.D. Uchic, D.R. Trinkle, Contri-bution to size effect of yield strength from the stochastics of dislocationsource lengths in finite samples, Scr. Mater 56 (2007) 313e316.
[23] C. Motz, T. Sch€oberl, R. Pippan, Mechanical properties of micro-sized copperbending beams machined by the focused ion beam technique, Acta Mater. 53(2005) 4269e4279.
[24] D. Kiener, P. Hosemann, S.A. Maloy, A.M. Minor, In situ nanocompressiontesting of irradiated copper, Nat. Mater 10 (2011) 608e613.
[25] C.D. Hardie, S.G. Roberts, Nanoindentation of model FeeCr alloys with self-ionirradiation, J. Nucl. Mater 433 (2013) 174e179.
[26] C. Abromeit, Aspects of simulation of neutron damage by ion irradiation,J. Nucl. Mater 216 (1994) 78e96.
[27] G.S. Was, Fundamentals of Radiation Materials Science: Metals and Alloys,Springer, 2007.
[28] R. MacFarlane, D. Muir, The NJOY Nuclear Data Processing System, Los AlamosNational Laboratory, 2012. LA-UR-12e27079.
[29] J. Sublet, J. Eastwood, J. Morgan, The FISPACT-II user manual CCFE-R(11)11issue 3, Tech. Rep. CCFE (7) (2012) 1e205.
[30] R. Dierckx, The importance of the PKA-energy spectrum for radiation damagesimulation, J. Nucl. Mater 144 (1987) 214e227.
[31] M.J. Norgett, M.T. Robinson, I.M. Torrens, A proposed method of calculatingdisplacement dose rates, Nucl. Eng. Des. 33 (1975) 50e54.
[32] R.E. Stoller, M.B. Toloczko, G.S. Was, A.G. Certain, S. Dwaraknath, F.A. Garner,On the use of SRIM for computing radiation damage exposure, in: NuclearInstruments and Methods in Physics Research Section B: Beam Interactionswith Materials and Atoms, vol. 310, 2013, pp. 75e80.
[33] C. Heintze, F. Bergner, M. Hern�andez-Mayoral, Ion-irradiation-induced dam-age in FeeCr alloys characterized by nanoindentation, J. Nucl. Mater 417(2011) 980e983.
[34] S. Ishino, Implications of fundamental radiation damage studies in theresearch and development of materials for a fusion reactor, J. Nucl. Mater 239(1996) 24e33.
[35] R.S. Nelson, D.J. Mazey, J.A. Hudson, The use of ion accelerators to simulate fastneutron-induced voidage in metals, J. Nucl. Mater 37.1 (1970) 1e12.
[36] R.E. Stoller, G.R. Odette, B.D. Wirth, Primary damage formation in bcc iron,J. Nucl. Mater 251 (1997) 49e60.
[37] R. More, J. Spitznagel, Primary recoil spectra and subcascade effects in ionbombardment experiments, Radiat. Eff. 60 (1982) 27e33.
[38] R.E. Stoller, The role of cascade energy and temperature in primary defectformation in iron, J. Nucl. Mater 276 (2000) 22e32.
[39] E. Zarkadoula, S. Daraszewicz, D. Duffy, M. Seaton, I. Todorov, K. Nordlund,M. Dove, K. Trachenko, The nature of high-energy radiation damage in iron,J. Phys. Condens. Matter 25 (2013) 125402.
[40] H. Wiedersich, Effects of the primary recoil spectrum on long-range migrationof defects, Radiat. Eff. defects solids 113 (1990) 97e107.
[41] L. Rehn, Production of freely-migrating defects, J. Nucl. Mater 174 (1990)144e150.
[42] J.L. Seran, J.M. Dupouy, Swelling of solution annealed 316 cladding in Rapsodieand Phenix, in: J.S.P. Brager (Ed.), Effect of Radiation on Materials: 11th In-ternational Symposium, ASTM, Baltimore, MD, 1982.
[43] G.W. Lewthwaite, D. Mosedale, The effects of temperature and dose-ratevariations on the creep of austenitic stainless steels in the dounreay fastreactor, J. Nucl. Mater 90 (1980) 205e215.
[44] C.D. Hardie, C.A. Williams, S. Xu, S.G. Roberts, Effects of irradiation tempera-ture and dose rate on the mechanical properties of self-ion implanted Fe andFeeCr alloys, J. Nucl. Mater 439 (2013) 33e40.
[45] L.K. Mansur, Correlation of neutron and heavy-ion damage: II. The predictedtemperature shift if swelling with changes in radiation dose rate, J. Nucl.Mater. 78.1 (1978) 156e160.