U5MEA08-ENGG METROLOGY & INSTRUMENTATION. UNIT- I METROLOGY UNITS AND MEASUREMENTS.
QMP 7.1 D/F
Channabasaveshwara Institute of Technology
(An ISO 9001:2008 Certified Institution)
NH 206 (B.H. Road), Gubbi, Tumkur – 572 216. Karnataka.
Department of Mechanical Engineering
Mechanical Measurements And Metrology
Laboratory
10MEL47B
B.E - IV Semester
Lab Manual 2015-16
Name : ____________________________________
USN : ____________________________________
Batch : ________________ Section : ____________
Channabasaveshwara Institute of Technology
(An ISO 9001:2008 Certified Institution)
NH 206 (B.H. Road), Gubbi, Tumkur – 572 216. Karnataka.
Department of Mechanical Engineering
Mechanical Measurements and
Metrology Lab Manual
Version 1.0
February 2016
Prepared by: Reviewed by:
Mr. Chikkannaswamy V M & Mr. Ravi N S
Mr. Lokesh N Assistant Professor
Assistant Professors
Approved by:
Head of the Department
Department of Mechanical Engineering
Channabasaveshwara Institute of Technology NH 206 (B.H. Road), Gubbi, Tumkur – 572 216. Karnataka.
Department of Mechanical Engineering
MECHANICAL MEASUREMENTS AND METROLOGY LABORATORY
Subject Code: 10MEL37B / 47B IA Marks: 25
Hours/Week: 03 Exam Hours: 03
Total Hours: 48 Exam Marks: 50
PART-A: MECHANICAL MEASUREMENTS
1. Calibration of Pressure Gauge
2. Calibration of Thermocouple
3. Calibration of LVDT
4. Calibration of Load cell
5. Determination of modulus of elasticity of a mild steel specimen using strain
gauges.
PART-B: METROLOGY
1. Measurements using Optical Projector / Toolmaker Microscope.
2. Measurement of angle using Sine Center / Sine bar / bevel protractor
3. Measurement of alignment using Autocollimator / Roller set
4. Measurement of cutting tool forces using
a) Lathe tool Dynamometer
b) Drill tool Dynamometer.
5. Measurement of Screw threads Parameters using Two wire or Three-wire
method.
6. Measurements of Surface roughness, Using Tally Surf/Mechanical
Comparator
7. Measurement of gear tooth profile using gear tooth vernier /Gear tooth
micrometer
8. Calibration of Micrometer using slip gauges
9. Measurement using Optical Flats
Scheme of Examination
ONE question from part-A: 20 Marks
ONE question from part-B: 20 Marks
Viva -Voice: 10 Marks
Total: 50 Marks
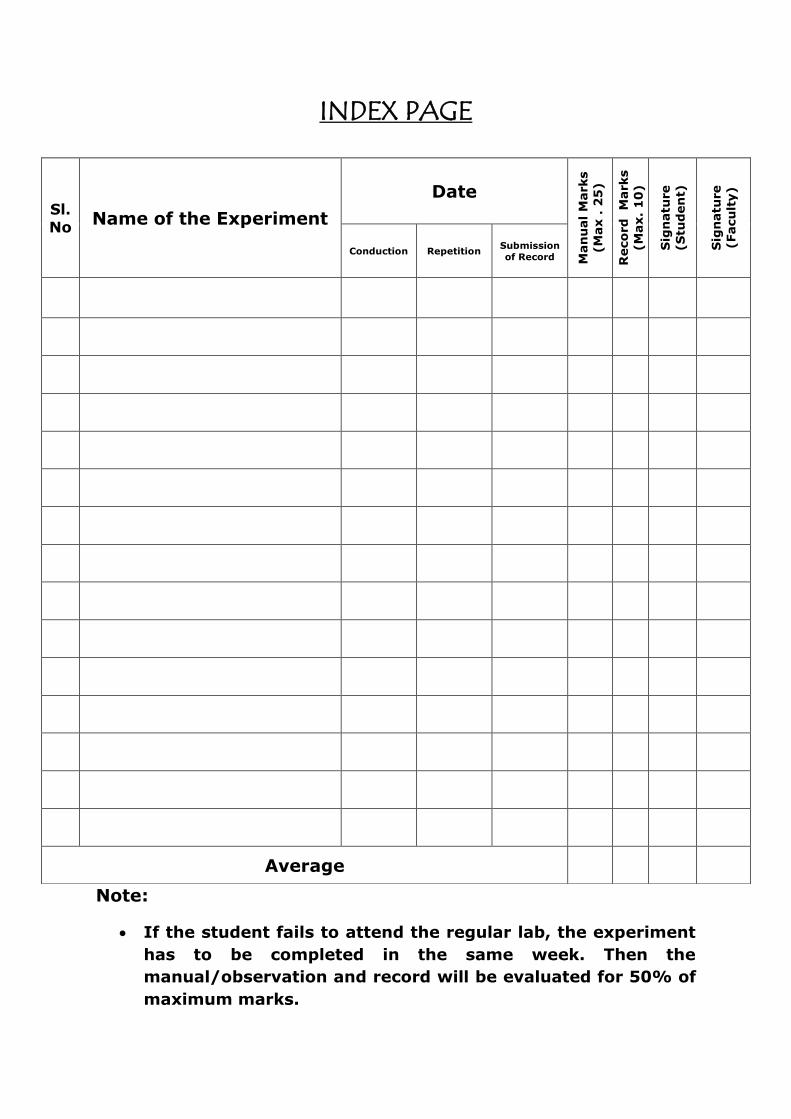
INDEX PAGE
Note:
If the student fails to attend the regular lab, the experiment
has to be completed in the same week. Then the
manual/observation and record will be evaluated for 50% of
maximum marks.
Sl.
No Name of the Experiment
Date
Man
ual
Marks
(M
ax .
25
)
Reco
rd
M
arks
(M
ax.
10
)
Sig
natu
re
(S
tud
en
t)
Sig
natu
re
(Facu
lty)
Conduction Repetition Submission
of Record
Average
OBJECTIVES
The objectives of Mechanical Measurements & Metrology lab is To demonstrate the theoretical concepts taught in Mechanical
Measurements & Metrology. To understand and use various measuring tools. To understand calibration of various measuring devices.
OUTCOMES
The expected outcome of Mechanical Measurements & Metrology lab is that the students will be able
To understand the basic measurement units and able to calibrate
various measuring devices. To express error and correction factors of various measuring devices. To use measuring tools such as Sine Bar, Sine Center, Bevel Protractor,
Tool Maker Microscope, Gear Tooth Micrometer, Optical Flats etc.
General instructions to the students
Laboratory uniform, shoes & safety glasses are compulsory in the lab.
Do not touch anything with which you are not completely familiar. Carelessness may not only break the valuable equipment in the lab but may also cause serious injury to you and others in the lab.
Please follow instructions precisely as instructed by your
supervisor. Do not start the experiment unless your setup is
verified & approved by your supervisor.
Do not leave the experiments unattended while in progress.
Do not crowd around the equipment’s & run inside the
laboratory.
During experiments material may fail and disperse, please
wear safety glasses and maintain a safe distance from the
experiment.
If any part of the equipment fails while being used, report it
immediately to your supervisor. Never try to fix the problem
yourself because you could further damage the equipment
and harm yourself and others in the lab.
Keep the work area clear of all materials except those needed
for your work and cleanup after your work.
CONTENTS
Expt.
No.
Title of the Experiment Page
No.
PART A
1 Calibration of Pressure Gauge 1
2 Calibration of Thermocouple 5
3 Calibration of LVDT 13
4 Calibration of Load cell 17
5 Determination of modulus of elasticity of a mild steel specimen using
strain gauges
21
PART B
6 Measurement of thread parameters using Optical Projector / Toolmaker
Microscope
31
7A Measurement of angle using Sine center 35
7B Measurement of angle using Sine bar 39
7C Measurement of angle using bevel protractor 43
8 Measurement of alignment using Autocollimator / Roller set 47
9A Measurement of cutting tool forces using Lathe tool Dynamometer 51
9B Measurement of torque & thrust force using Drill tool Dynamometer.
55
10 Measurement of Screw thread parameters using two wire or Three-wire
method
59
11A Measurements of Surface roughness using Taly Surf 71
11 B Measurements of Surface roughness using Mechanical Comparator 73
12 Measurement of gear tooth profile using gear tooth vernier /Gear tooth
micrometer
77
13 Calibration of Micrometer using slip gauges 81
14 Measurement of surface flatness using Optical Flats 85
ADDITIONAL EXPERIMENTS
15 Calibration of vernier caliper & measurement of the given component 89
16 Power measurement using Rope brake dynamometer 93
VIVA QUESTIONS AND ANSWERS 95
Mechanical Measurements & Metrology Laboratory (10MEL47B) 2015-16
Department of ME, CIT, Gubbi Page No. 1
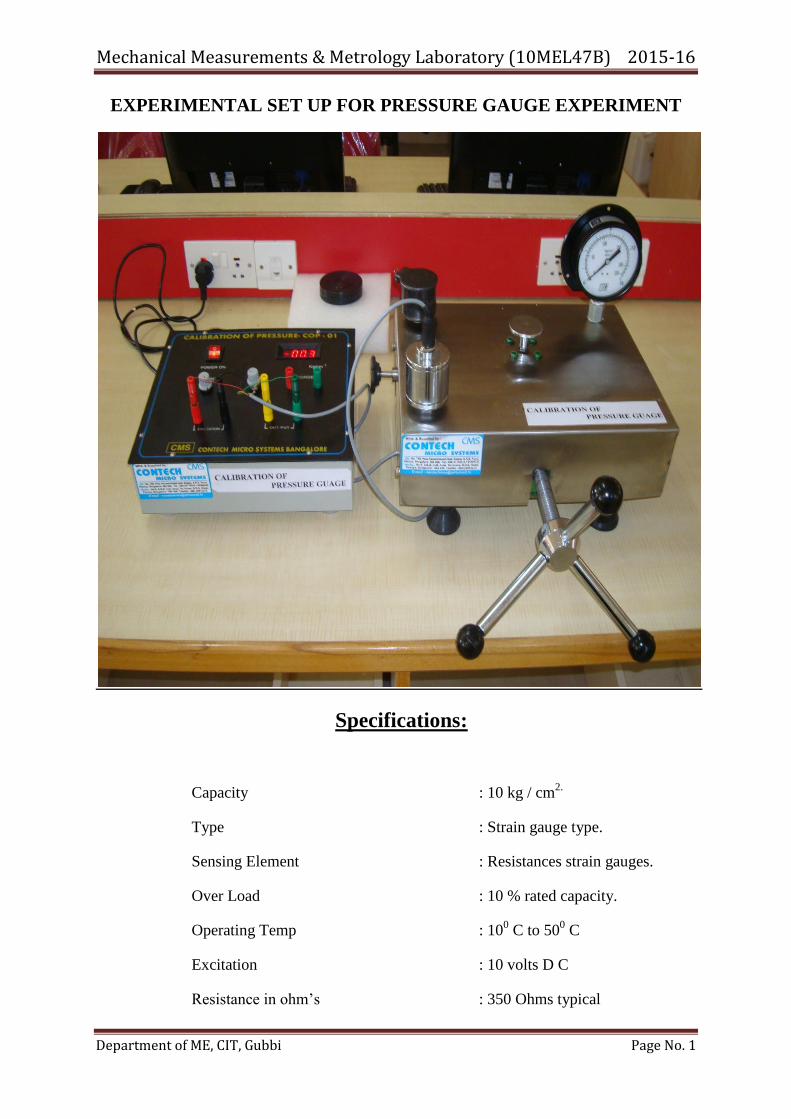
EXPERIMENTAL SET UP FOR PRESSURE GAUGE EXPERIMENT
Specifications:
Capacity : 10 kg / cm2.
Type : Strain gauge type.
Sensing Element : Resistances strain gauges.
Over Load : 10 % rated capacity.
Operating Temp : 100 C to 50
0 C
Excitation : 10 volts D C
Resistance in ohm‘s : 350 Ohms typical
Mechanical Measurements & Metrology Laboratory (10MEL47B) 2015-16
Department of ME, CIT, Gubbi Page No. 2
PART - A
Experiment No: 1 Date:
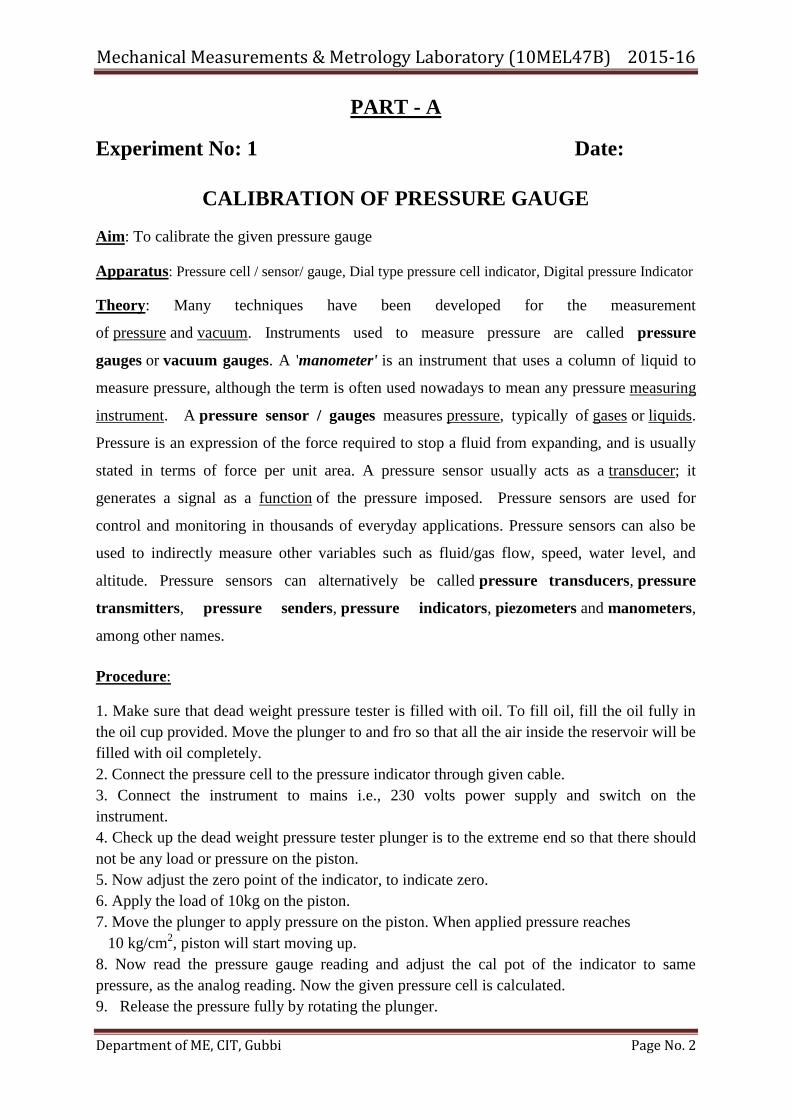
CALIBRATION OF PRESSURE GAUGE
Aim: To calibrate the given pressure gauge
Apparatus: Pressure cell / sensor/ gauge, Dial type pressure cell indicator, Digital pressure Indicator
Theory: Many techniques have been developed for the measurement
of pressure and vacuum. Instruments used to measure pressure are called pressure
gauges or vacuum gauges. A 'manometer' is an instrument that uses a column of liquid to
measure pressure, although the term is often used nowadays to mean any pressure measuring
instrument. A pressure sensor / gauges measures pressure, typically of gases or liquids.
Pressure is an expression of the force required to stop a fluid from expanding, and is usually
stated in terms of force per unit area. A pressure sensor usually acts as a transducer; it
generates a signal as a function of the pressure imposed. Pressure sensors are used for
control and monitoring in thousands of everyday applications. Pressure sensors can also be
used to indirectly measure other variables such as fluid/gas flow, speed, water level, and
altitude. Pressure sensors can alternatively be called pressure transducers, pressure
transmitters, pressure senders, pressure indicators, piezometers and manometers,
among other names.
Procedure:
1. Make sure that dead weight pressure tester is filled with oil. To fill oil, fill the oil fully in
the oil cup provided. Move the plunger to and fro so that all the air inside the reservoir will be
filled with oil completely.
2. Connect the pressure cell to the pressure indicator through given cable.
3. Connect the instrument to mains i.e., 230 volts power supply and switch on the
instrument.
4. Check up the dead weight pressure tester plunger is to the extreme end so that there should
not be any load or pressure on the piston.
5. Now adjust the zero point of the indicator, to indicate zero.
6. Apply the load of 10kg on the piston.
7. Move the plunger to apply pressure on the piston. When applied pressure reaches
10 kg/cm2, piston will start moving up.
8. Now read the pressure gauge reading and adjust the cal pot of the indicator to same
pressure, as the analog reading. Now the given pressure cell is calculated.
9. Release the pressure fully by rotating the plunger.
Mechanical Measurements & Metrology Laboratory (10MEL47B) 2015-16
Department of ME, CIT, Gubbi Page No. 3
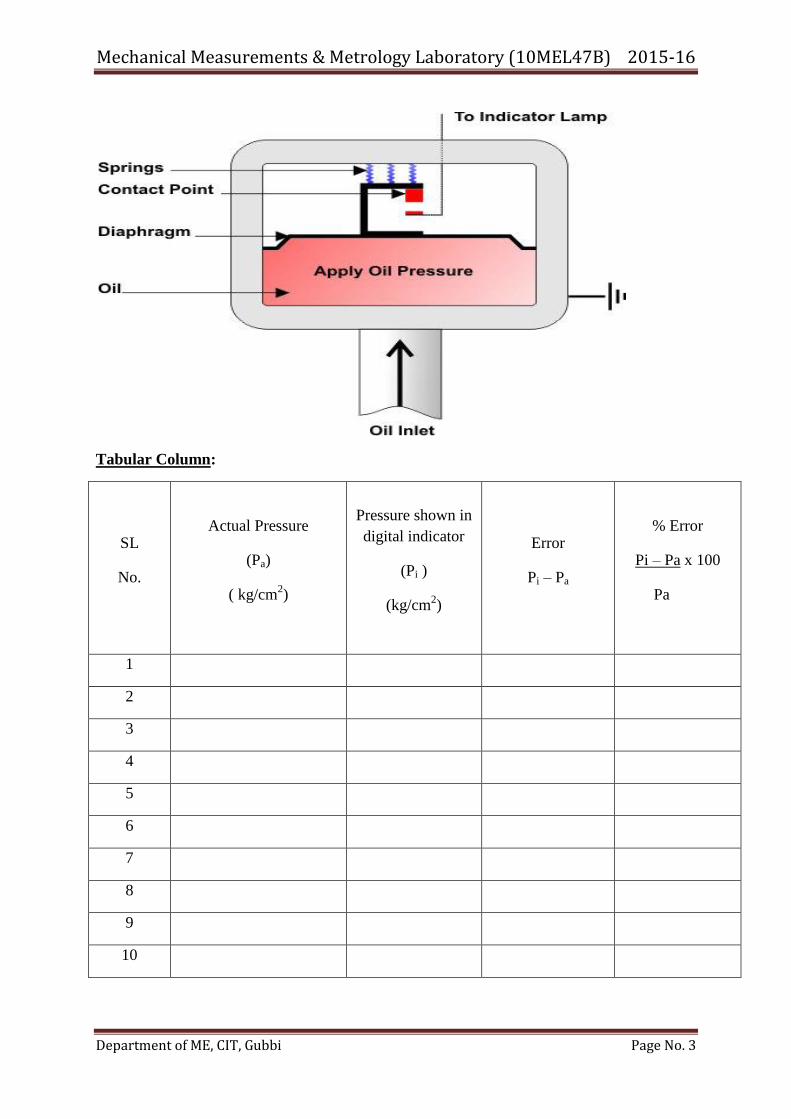
Tabular Column:
SL
No.
Actual Pressure
(Pa)
( kg/cm2)
Pressure shown in
digital indicator
(Pi )
(kg/cm2)
Error
Pi – Pa
% Error
Pi – Pa x 100
Pa
1
2
3
4
5
6
7
8
9
10
Mechanical Measurements & Metrology Laboratory (10MEL47B) 2015-16
Department of ME, CIT, Gubbi Page No. 4
10. Load the piston by one kg; apply the pressure by rotating the plunger. At a Pressure of
one kg /cm2, piston starts lifting up. Note down the reading.
11. Repeat the experiment for different loads on the piston step by step, and note down the
readings of dial gauge and pressure indicator, simultaneously in every step.
12. Calculate the percentage error and plot the graph.
Calculation: % Error = Indicated Pressure – Actual Pressure X 100
Actual Pressure
Plot the Graphs as follows:
1. Indicated Pressure v/s Actual Pressure
2. Indicated Pressure v/s Percentage error
Applications:
Pressure gauges are used for variety of industrial and application-specific pressure-
monitoring applications. Their uses include visual monitoring of air & gas pressure
for compressors, vacuum equipment, process lines & specialty tank applications such
as medical gas cylinders & fire extinguishers.
Fluid pressure industrial hydraulic circuits.
Measurement of steam pressure in power plants & boilers.
Measurement of pressure in large pumping stations/ water works/ or minor/major
irrigations.
Results:
Finally the pressure gauge has been calibrated.
Mechanical Measurements & Metrology Laboratory (10MEL47B) 2015-16
Department of ME, CIT, Gubbi Page No. 5
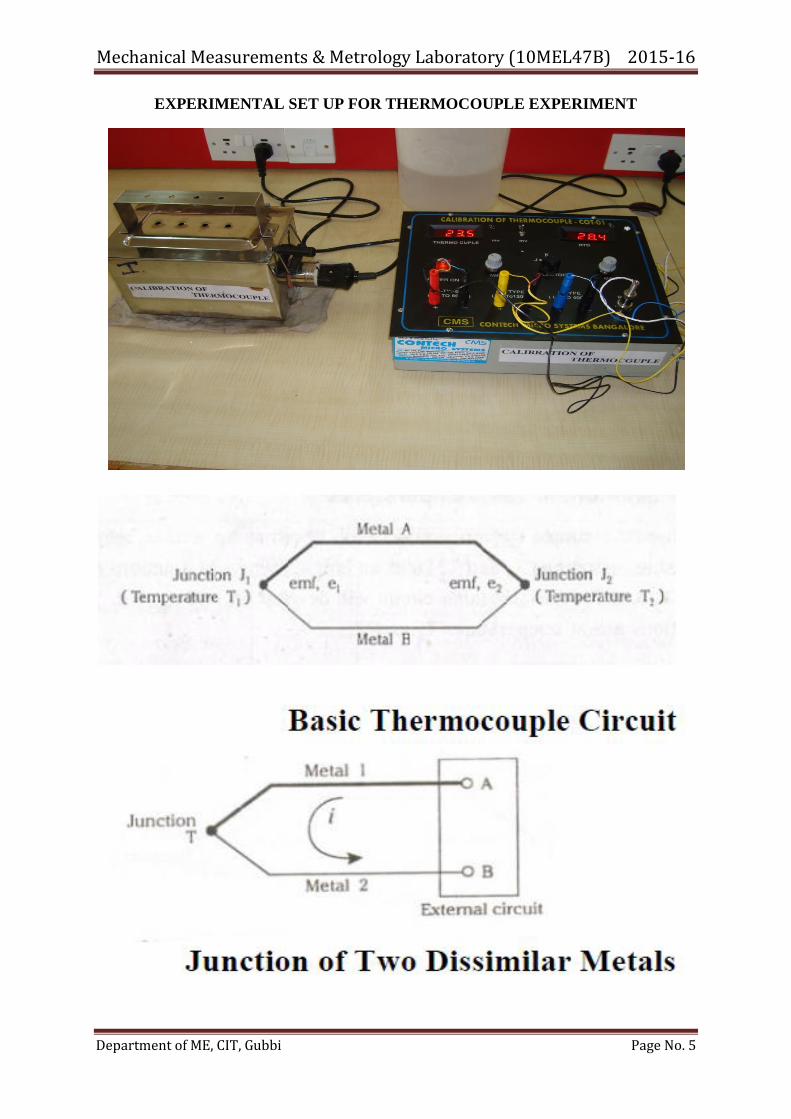
EXPERIMENTAL SET UP FOR THERMOCOUPLE EXPERIMENT
Mechanical Measurements & Metrology Laboratory (10MEL47B) 2015-16
Department of ME, CIT, Gubbi Page No. 6
Experiment No. 2: Date:
CALIBRATION OF THERMO COUPLE
Aim: To calibrate the given thermo couple using Resistance thermometer (RTD).
Apparatus: Thermocouple, RTD, Digital temperature Indicator, Water bath
Theory:
Temperature measurement is the most common and important measurement in controlling
any process. Temperature may be defined as an indication of intensity of molecular kinetic
energy within a system. It is a fundamental property similar to that of mass, length and time
& hence it is difficult to define. Temperature cannot be measured using basic standards
through direct comparison. It can only be determined through some standardized calibrated
device. Change in temperature of a substance causes a variety of effects such as:
i) Change in physical state ii) Change in chemical state iii) Change in physical dimensions iv)
Change in electrical properties and v) Change in radiating ability. And any of these effects
may be used to measure the temperature Temperature Measurement by Electrical Effects,
Thermo resistive Elements, Electrical Resistance Thermometers, Electrical Resistance
Thermometers, Instrumentation for Resistance Thermometers and Thermocouple.
The electrical resistance of most materials varies with temperature. Resistance elements
which are sensitive to temperature are made of metals and are good conductors of electricity.
Examples are nickel, copper, platinum and silver. Any temperature-measuring device which
uses these elements are called resistance thermometers or resistance temperature detectors
(RTD). If semiconducting materials like combination of metallic oxides of cobalt, manganese
and nickel having large negative resistance co- efficient are used then such devices are called
thermistors.
When two dissimilar metals are joined together as shown in the Fig. electromotive forces
(emf) will exists between the two points A and B, which is primarily a function of the
junction temperature. This phenomenon is called the see beck effect. If the two metals are
connected to an external circuit in such a way that a current is drawn, the emf may be altered
slightly owing to a phenomenon called the peltier effect. Further, if a temperature gradient
exists along either or both of the metals, the junction emf may undergo an additional slight
alteration. This is called the Thomson effect. Hence there are, three emf‘s present in a
thermoelectric circuit: i) The See beck emf, caused by the junction of dissimilar metals ii)
The Peltier emf, caused by a current flow in the circuit and iii) The Thomson emf, resulting
from a temperature gradient in the metals. The See beck emf is important since it depends on
the junction temperature. If the emf generated at the junction of two dissimilar metals is
carefully measured as a function of temperature, then such a junction may be used for the
measurement of temperature. The above effects form the basis for a thermocouple which is a
temperature measuring element.
Mechanical Measurements & Metrology Laboratory (10MEL47B) 2015-16
Department of ME, CIT, Gubbi Page No. 7
Experiment no. 2:
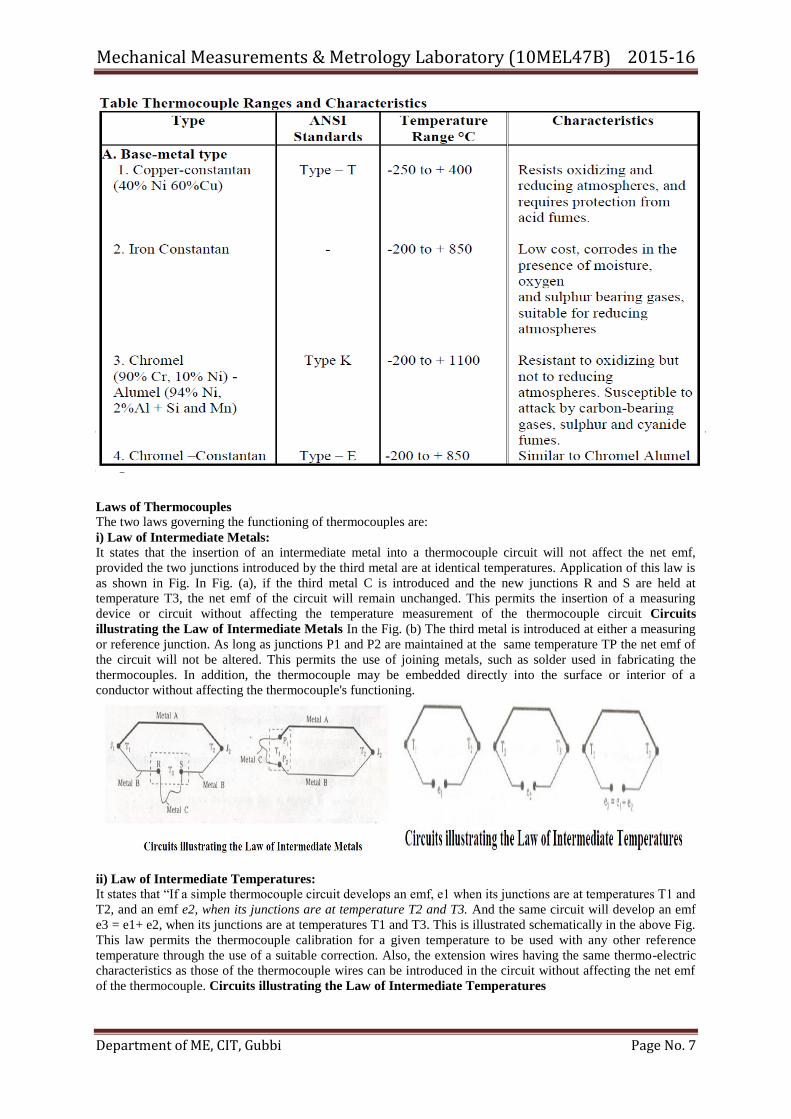
Laws of Thermocouples
The two laws governing the functioning of thermocouples are:
i) Law of Intermediate Metals:
It states that the insertion of an intermediate metal into a thermocouple circuit will not affect the net emf,
provided the two junctions introduced by the third metal are at identical temperatures. Application of this law is
as shown in Fig. In Fig. (a), if the third metal C is introduced and the new junctions R and S are held at
temperature T3, the net emf of the circuit will remain unchanged. This permits the insertion of a measuring
device or circuit without affecting the temperature measurement of the thermocouple circuit Circuits
illustrating the Law of Intermediate Metals In the Fig. (b) The third metal is introduced at either a measuring
or reference junction. As long as junctions P1 and P2 are maintained at the same temperature TP the net emf of
the circuit will not be altered. This permits the use of joining metals, such as solder used in fabricating the
thermocouples. In addition, the thermocouple may be embedded directly into the surface or interior of a
conductor without affecting the thermocouple's functioning.
ii) Law of Intermediate Temperatures: It states that ―If a simple thermocouple circuit develops an emf, e1 when its junctions are at temperatures T1 and
T2, and an emf e2, when its junctions are at temperature T2 and T3. And the same circuit will develop an emf
e3 = e1+ e2, when its junctions are at temperatures T1 and T3. This is illustrated schematically in the above Fig.
This law permits the thermocouple calibration for a given temperature to be used with any other reference
temperature through the use of a suitable correction. Also, the extension wires having the same thermo-electric
characteristics as those of the thermocouple wires can be introduced in the circuit without affecting the net emf
of the thermocouple. Circuits illustrating the Law of Intermediate Temperatures
Mechanical Measurements & Metrology Laboratory (10MEL47B) 2015-16
Department of ME, CIT, Gubbi Page No. 8
Thermocouple :
If two dissimilar metals are joined an emf exists which is a function of several factors
including the temperature. When junctions of this type are used to measure temperature, they
are called thermocouples. The principle of a thermocouple is that if two dissimilar metals A
and B are joined to form a circuit as shown in the Fig. It is found that when the two junctions
J1 and J2 are at two different temperatures T1 and T2, small emf's e1 and e2 are generated at
the junctions. The resultant of the two emf causes a current to flow in the circuit. If the
temperatures T1 and T2 are equal, the two emf will be equal but opposed, and no current will
flow. The net emf is a function of the two materials used to form the circuit and the
temperatures of the two junctions. The actual relations, however, are empirical and the
temperature-emf data must be based on experiment. It is important that the results are
reproducible and therefore provide a reliable method for measuring temperature. It should be
noted that two junctions are always required; one which senses the desired or unknown
temperature is called the hot or measuring junction. The other junction maintained at a
known fixed temperature is called the cold or reference junction.
Thermocouple materials and Construction
Any two dissimilar metals can be used to form thermocouple, but certain metals and
Combinations are better than others. The desirable properties of thermocouple materials are:
i) Linear temperature-emf relationship ii) High output emf iii) Resistance to chemical change
when in contact with working fluids iv) Stability of emf v) Mechanical strength in their
temperature range and vi) Cheapness. The thermocouple materials can be divided into two
types 1. Rare-metal types using platinum, rhodium, iridium etc and 2. Base-metal types as
given in the table.
Procedure:
1. Turn the type selector to the desired position according to the given T.C. probe.
2. Connect the RTD (Resistance Temperature Detector) probe to the resistance Temperature
detector display.
3. Connect the given thermocouple to the thermocouple temperature display.
4. Place the thermocouple hot junction and the RTD probe into a beaker containing water
at room temperature.
5. Connect the power supply to the temperature indicator.
6. Record the room temperature from the RTD temperature indicator.
7. Adjust the zero setting knob of the thermocouple temperature indicator until the display
shows the room temperature.
8. Connect the power supply to heating coil & heat the water in the water bath.
9. Set the temperature of thermocouple to the temperature of RTD indicator when the
Water is boiling, using CAL knob.
10. Now the given thermocouple is calibrated with reference to RTD.
11. Record the RTD and thermocouple temperature indicator reading simultaneously at
regular intervals.
Mechanical Measurements & Metrology Laboratory (10MEL47B) 2015-16
Department of ME, CIT, Gubbi Page No. 9
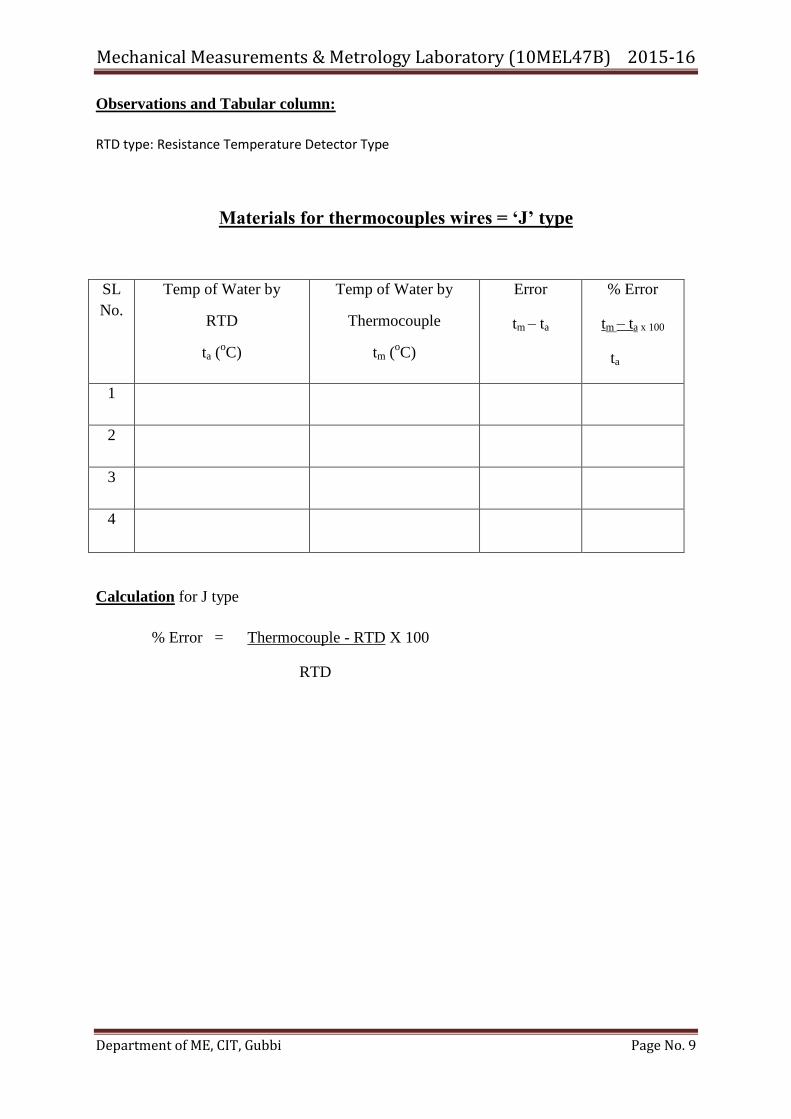
Observations and Tabular column:
RTD type: Resistance Temperature Detector Type
Materials for thermocouples wires = ‗J‘ type
SL
No.
Temp of Water by
RTD
ta (oC)
Temp of Water by
Thermocouple
tm (oC)
Error
tm – ta
% Error
tm – ta x 100
ta
1
2
3
4
Calculation for J type
% Error = Thermocouple - RTD X 100
RTD
Mechanical Measurements & Metrology Laboratory (10MEL47B) 2015-16
Department of ME, CIT, Gubbi Page No. 10
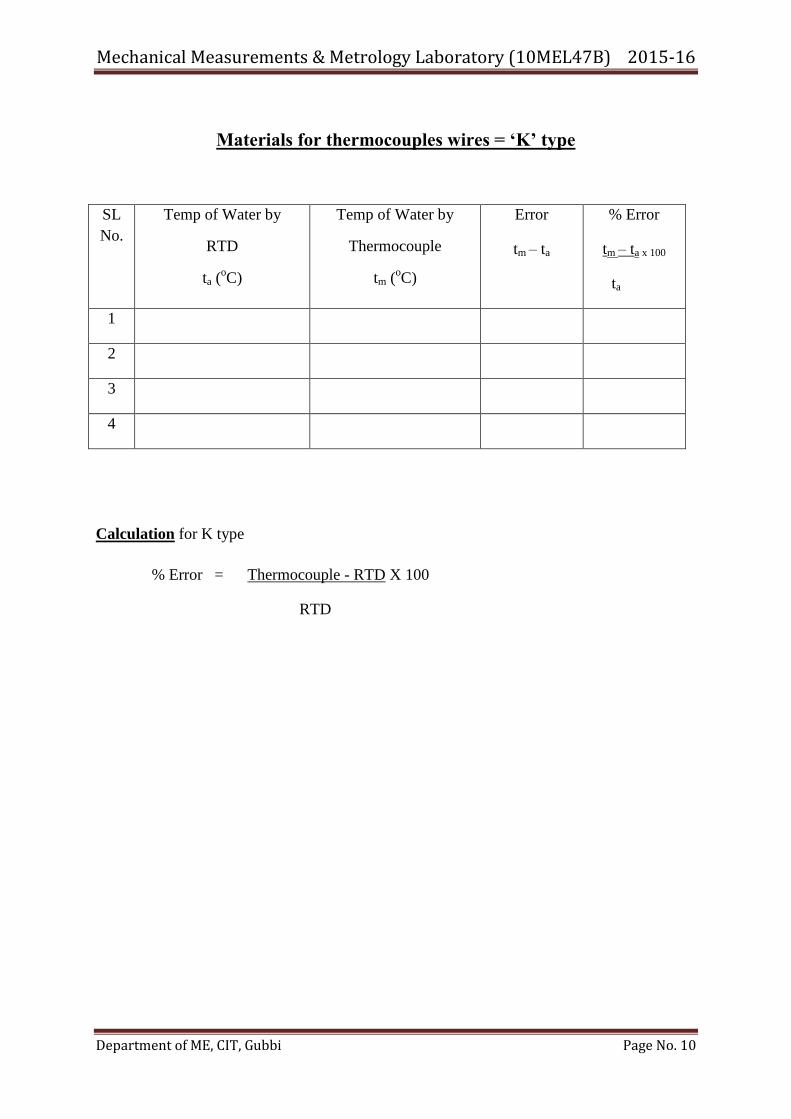
Materials for thermocouples wires = ‗K‘ type
SL
No.
Temp of Water by
RTD
ta (oC)
Temp of Water by
Thermocouple
tm (oC)
Error
tm – ta
% Error
tm – ta x 100
ta
1
2
3
4
Calculation for K type
% Error = Thermocouple - RTD X 100
RTD
Mechanical Measurements & Metrology Laboratory (10MEL47B) 2015-16
Department of ME, CIT, Gubbi Page No. 11
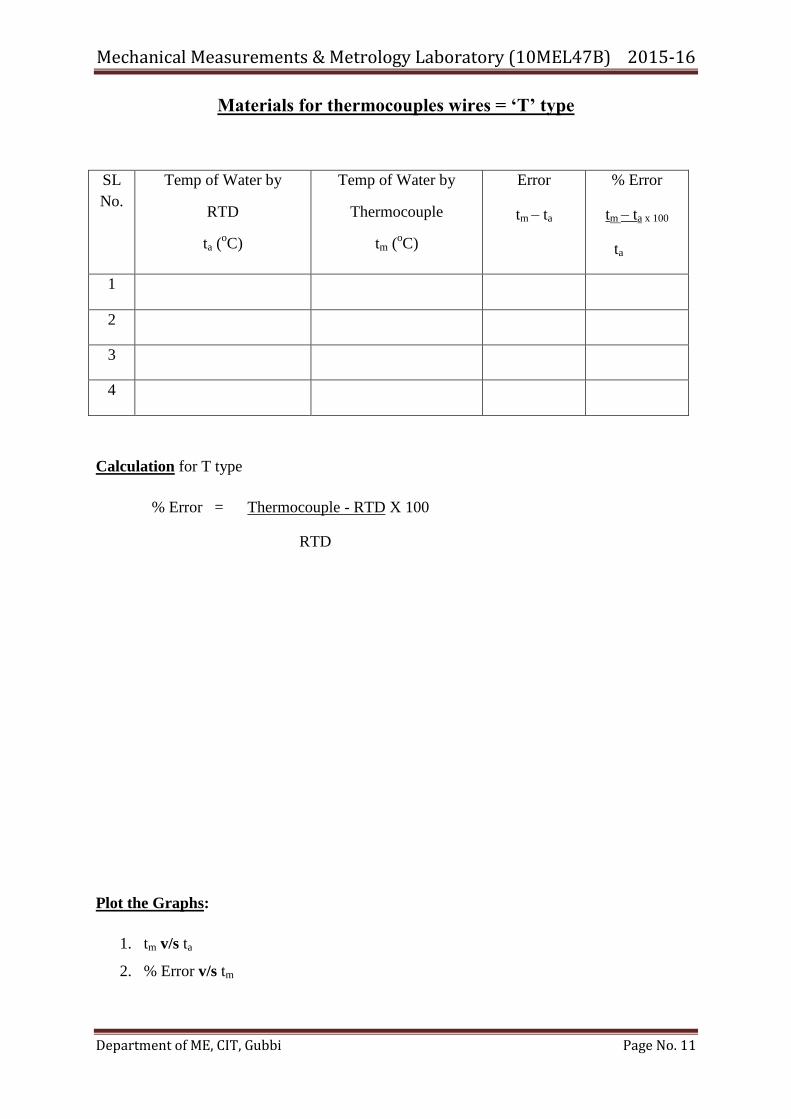
Materials for thermocouples wires = ‗T‘ type
SL
No.
Temp of Water by
RTD
ta (oC)
Temp of Water by
Thermocouple
tm (oC)
Error
tm – ta
% Error
tm – ta x 100
ta
1
2
3
4
Calculation for T type
% Error = Thermocouple - RTD X 100
RTD
Plot the Graphs:
1. tm v/s ta
2. % Error v/s tm
Mechanical Measurements & Metrology Laboratory (10MEL47B) 2015-16
Department of ME, CIT, Gubbi Page No. 12
Advantages:
1. Thermocouples are cheaper than the resistance thermometers.
2. Thermocouples follow the temperature changes with small time lag thus suitable for
recording rapidly changing temperatures.
3. They are convenient for measuring the temperature at a particular point.
Disadvantages:
1. Possibility of inaccuracy due to changes in the reference junction temperature hence
they cannot be used in precision work.
2. For long life, they should be protected to prevent contamination and have to be
chemically inert and vacuum tight.
3. When thermocouples are placed far from the measuring systems, connections are
made by extension wires. Maximum accuracy is obtained only when compensating
wires are of the same material as that of thermocouple wires, thus the circuit becomes
complex.
Applications:
Thermocouples are used in big blast furnaces.
Thermocouples are used in transformers
Thermocouples are used in automobiles, diesel electrical railways and large motors.
In pressure vessel temperature controls in petrochemical and chemical industries
thermocouples have been used.
In steel melting & rolling mills for temperature control, these are used.
Results:
The given thermocouple is calibrated Using RTD.
Mechanical Measurements & Metrology Laboratory (10MEL47B) 2015-16
Department of ME, CIT, Gubbi Page No. 13
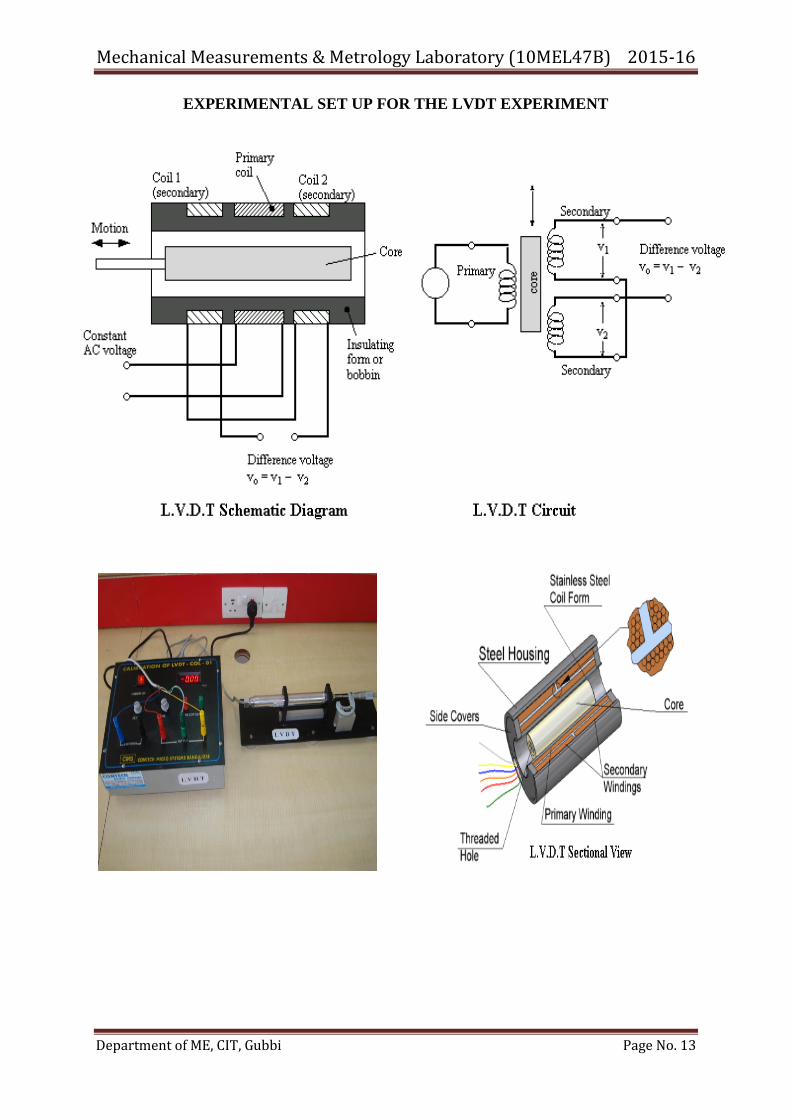
EXPERIMENTAL SET UP FOR THE LVDT EXPERIMENT
Mechanical Measurements & Metrology Laboratory (10MEL47B) 2015-16
Department of ME, CIT, Gubbi Page No. 14
Experiment No. 3: Date:
CALIBRATION OF L.V. D. T
Aim: To measure the displacement of core using linear variable differential Transformer.
Apparatus: LVDT with Micrometer (±10 mm Capacity), Digital displacement Indicator.
Theory:
LVDT is a mutual inductance Transducer device which produces an A C Voltage output
proportional to the displacement of a core passing through the windings. It consists of a
primary A C Coil on each side of which are mounted to secondary coil wired in series
opposition along the axis of three coils an iron core is mounted. The movement of the iron
core causes the induced emf in the secondary coils to vary and because of their series
opposition connection their combined output will be the difference of emf‘s induced. Thus
the output voltage of the device is an indication of the displacement of the core. When
operating in the linear range, the device is called L V D T. Since the secondary coil is
connected in series opposition, a null position exists at which the net output voltage is
essentially zero. The out put voltage undergoes an 180O phase shift from one side of the null
position to the other.
In the practical differential transformer is always a capacitive effect between the
primary and secondary coils which results in a small out put voltage even when the induced
emf‘s in the secondary coils are in equal opposition. This is normally less than one percent of
the maximum voltage. L V D T provides comparatively high out put and is also insensitive to
temperature.
Procedure:
1. Connect the L V D T and Digital displacement meter to main supply.
2. Adjust the zero pot of the displacement indicator to indicate zero.
3. Connect the L V D T sensor to the displacement indicator through the cable.
4. Rotate the micrometer knob to clock wise or antilock direction, to bring the L V D T core
to null position of the sensor. Where there is no induced emf. At this position indicator
will read zero. Note down the micrometer reading. This is initial reading of micrometer.
Mechanical Measurements & Metrology Laboratory (10MEL47B) 2015-16
Department of ME, CIT, Gubbi Page No. 15
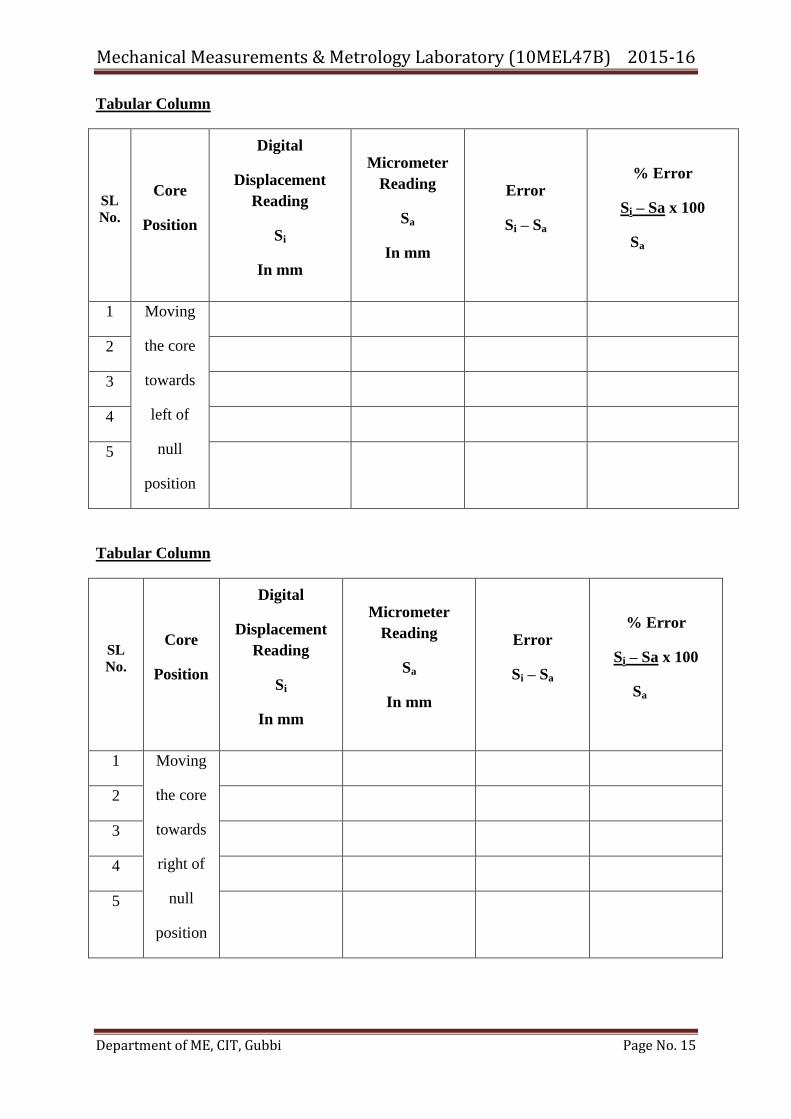
Tabular Column
SL
No.
Core
Position
Digital
Displacement
Reading
Si
In mm
Micrometer
Reading
Sa
In mm
Error
Si – Sa
% Error
Si – Sa x 100
Sa
1 Moving
the core
towards
left of
null
position
2
3
4
5
Tabular Column
SL
No.
Core
Position
Digital
Displacement
Reading
Si
In mm
Micrometer
Reading
Sa
In mm
Error
Si – Sa
% Error
Si – Sa x 100
Sa
1 Moving
the core
towards
right of
null
position
2
3
4
5
Mechanical Measurements & Metrology Laboratory (10MEL47B) 2015-16
Department of ME, CIT, Gubbi Page No. 16
Calculation: for left of null position
% Error = LVDT Reading – Micrometer reading X 100
Micrometer Reading
Calculation: for right of null position
% Error = LVDT Reading – Micrometer reading X 100
Micrometer Reading
Applications
LVDT‘s are used in position control in machine tools.
To measure the furnace tilting position in steel melting shops.
To check the position of an Alerons in the wing assembly in aerospace.
In landing gear position, LVDT‘s are used.
LVDT are suitable for use in applications where the displacements are too large for
strain gauge to handle. There are often employed together other transducers for
measurement of force, weight & pressure etc.
Plot the Graphs:
1. L V D T reading v/s Core displacement.
2. L V D T reading v/s % error.
Results:
Calibration of LVDT is performed.
Mechanical Measurements & Metrology Laboratory (10MEL47B) 2015-16
Department of ME, CIT, Gubbi Page No. 17
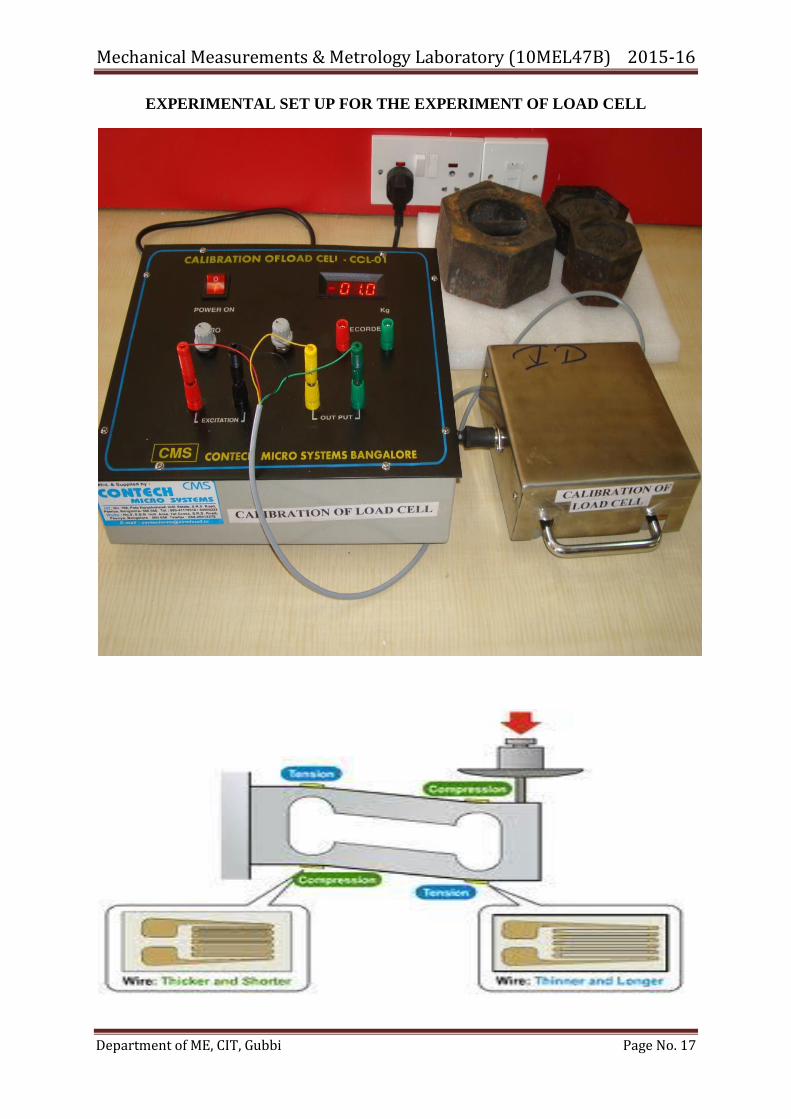
EXPERIMENTAL SET UP FOR THE EXPERIMENT OF LOAD CELL
Mechanical Measurements & Metrology Laboratory (10MEL47B) 2015-16
Department of ME, CIT, Gubbi Page No. 18
Experiment No. 4: Date:
CALIBRATION OF LOAD CELL
Aim: To calibrate given load cell by actual load.
Apparatus: Load cell of (10 kg capacity), dead weights and digital load indicator.
Theory: Weighing load/force using spring deflection is widely accepted one. But the
deflection of spring reading mechanically is very tedious and time consuming. One of the
most effective & accurate method is using strain gauge based load cells. Using the principle
of deflection of high tensile strength material when load is applied on it and converting it into
proportional electrical signal by using strain gauges will give accurate way of measuring
load. Strain gauges are bonded on the columns of corrosion resistance super tough alloy of
high tensile strength steel that deforms very minutely under load. This deformation is
converted to electrical signal through strain gauges bonded on the column and connected to
form a wheat stone bridge. This electrical output is proportional to the load acting on the
columns. The output of the load cell is calibrated with reference to some standard i.e.,
primary standard i.e. dead weights.
Procedure:
1. Connect the load cell to digital indicator inserting the corresponding color codes.
2. Connect the digital indicator to mains and switch on the indicator.
3. Adjust the zero knob of the indicator to 0000.
4. Apply the weights up to 08 kg.
5. Apply the ‗Cal‘ knob of the indicator to read 78.48 N. i.e. (9 x 9.81 N).
6. Remove weights form the load cell.
7. Set the zero knob to zero and repeat the calibration.
8. Now instrument is ready for measurement
9. Keep the weights one by one and take down the indicator reading.
10. Calculate the correction, error and % error.
Mechanical Measurements & Metrology Laboratory (10MEL47B) 2015-16
Department of ME, CIT, Gubbi Page No. 19
Tabular Column
Sl. No
Actual Load
La
in Kg
Indicated Load
Li
in Kg
Error
Li - La
% Error
Li - La x 100
La
1
2
3
4
5
Calculation:
Error = Indicated Load - Actual Load
% Error = Indicated Load – Actual Load X 100
Actual Load
Mechanical Measurements & Metrology Laboratory (10MEL47B) 2015-16
Department of ME, CIT, Gubbi Page No. 20
Plot the Graphs:
1. Indicated Load v/s Actual Load.
2. Indicated Load v/s % Error.
Applications
1. Weighing systems are used in both static and dynamic applications.
2. In road and railway weigh bridges.
3. In electrical overhead travelling cranes.
4. Roll force measurement in steel plants/rolling mills.
5. Weigh bridges in conveyers & bunker
Result:
The given Load cell is calibrated by using actual loads.
Mechanical Measurements & Metrology Laboratory (10MEL47B) 2015-16
Department of ME, CIT, Gubbi Page No. 21
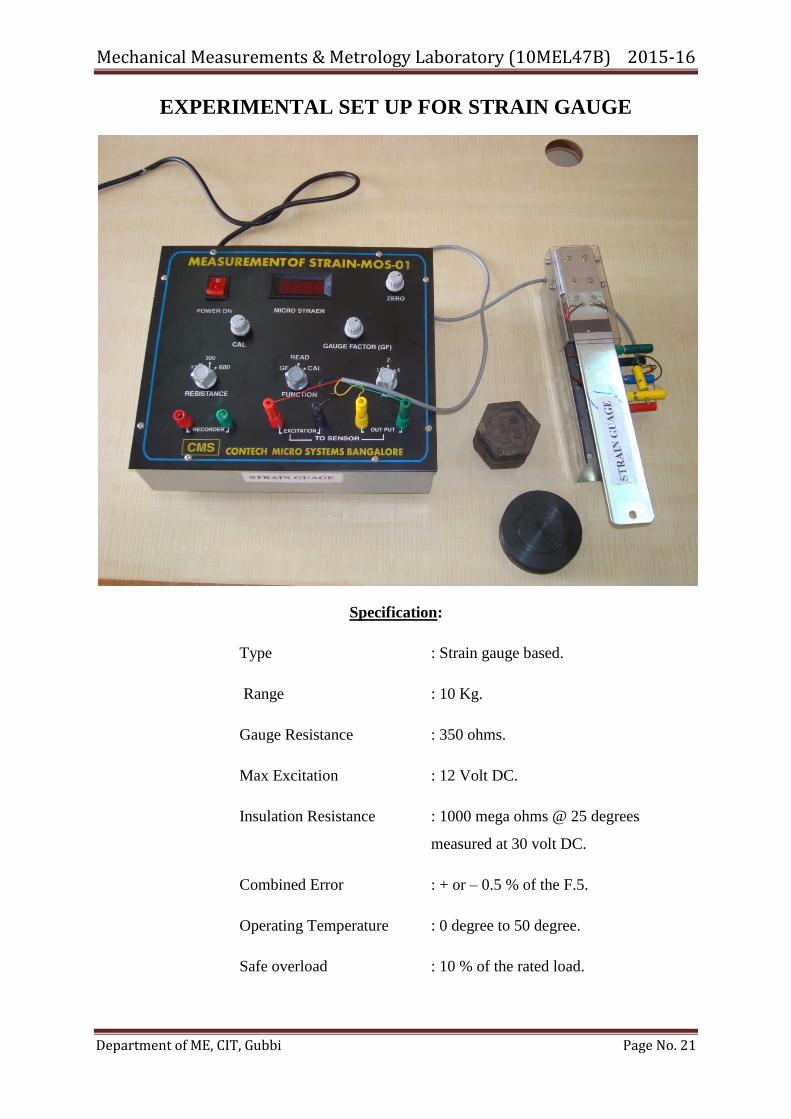
EXPERIMENTAL SET UP FOR STRAIN GAUGE
Specification:
Type : Strain gauge based.
Range : 10 Kg.
Gauge Resistance : 350 ohms.
Max Excitation : 12 Volt DC.
Insulation Resistance : 1000 mega ohms @ 25 degrees
measured at 30 volt DC.
Combined Error : + or – 0.5 % of the F.5.
Operating Temperature : 0 degree to 50 degree.
Safe overload : 10 % of the rated load.
Mechanical Measurements & Metrology Laboratory (10MEL47B) 2015-16
Department of ME, CIT, Gubbi Page No. 22
Experiment No. 5: Date:
DETERMINATION OF MODULUS OF ELASTICITY OF A
MILD STEEL SPECIMEN USING STRAIN GAUGES
Aim: To determine the elastic constant (modulus of elasticity) of a cantilever beam
subjected to concentrated end load by using strain gauges.
Apparatus: Cantilever beam, Strain Gauges and strain indicator.
Theory:
A body subjected to external forces is in a condition both stress and strain. Stress
cannot be directly measured but its effects, i.e. change of shape of the body can be measured.
If there is a relationship between stress and strain, the stresses occurring in a body can be
computed if sufficient strain information is available. The constant connecting the stress and
strain in elastic material under the direct stresses is the modulus of elasticity. i.e. E= /
The principle of the electrical resistance strain gauge was discovered by Lord Kelvin,
when he observed that a stress applied to a metal wire, besides changing its length and
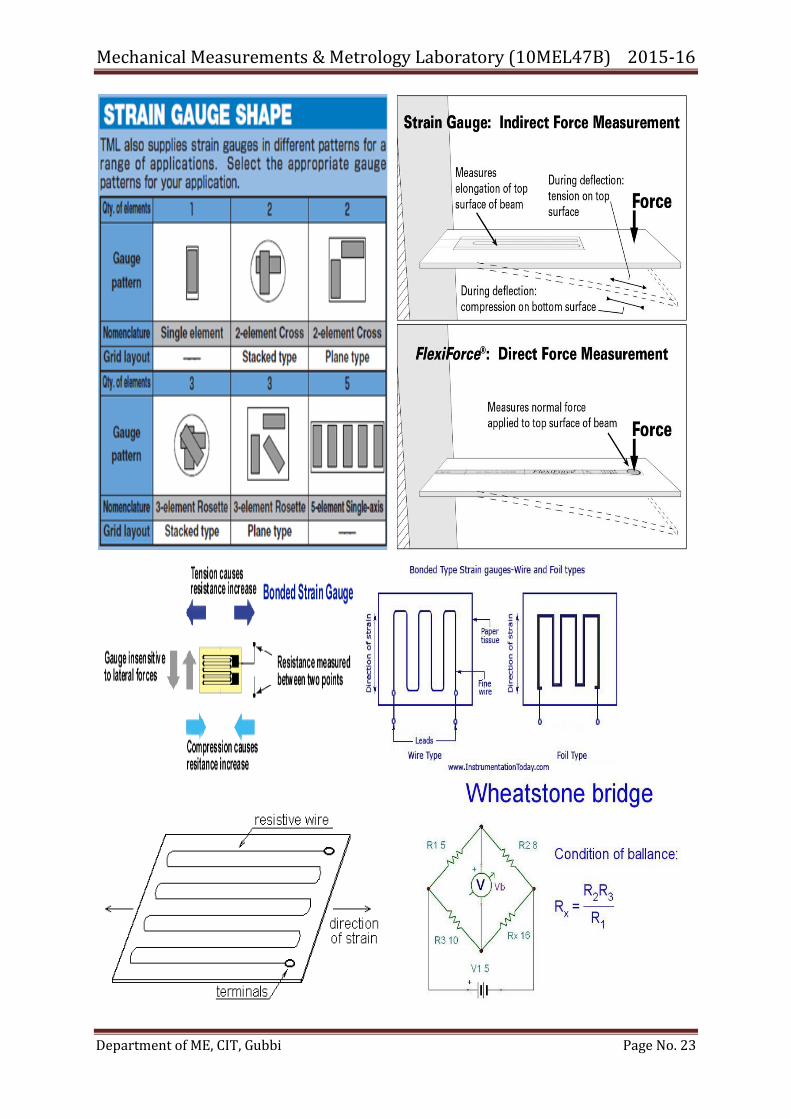
diameter, also changes its electrical resistance. Metallic electrical strain gauges are made in to
two basic forms, bonded wire and bonded foil. Wire gauges are sand witched between two
sheets thin paper and foil gauges are sand witched between two thin sheets of epoxy. The
resistance R of a metal depends on its electrical resistivity, its area a and the length l
according to the equation. R= l / a. Thus to obtain a high resistance gauge occupying a
small area the metal chosen has a high resistivity, a large number of grid loops and a very
small cross sectional area. The most common material for strain gauges is a copper- nickel
alloy known as advance.
The strain gauge is connected to the material in which it is required to measure the
strain, with a thin coat of adhesive. Most common adhesive used is Eastman, duco cement,
etc. As the test specimen extends are contracts under stress in the direction of windings, the
length and cross sectional area of the conductor alter, resulting in a corresponding increase or
decrease in electrical resistance.
Mechanical Measurements & Metrology Laboratory (10MEL47B) 2015-16
Department of ME, CIT, Gubbi Page No. 23
Mechanical Measurements & Metrology Laboratory (10MEL47B) 2015-16
Department of ME, CIT, Gubbi Page No. 24
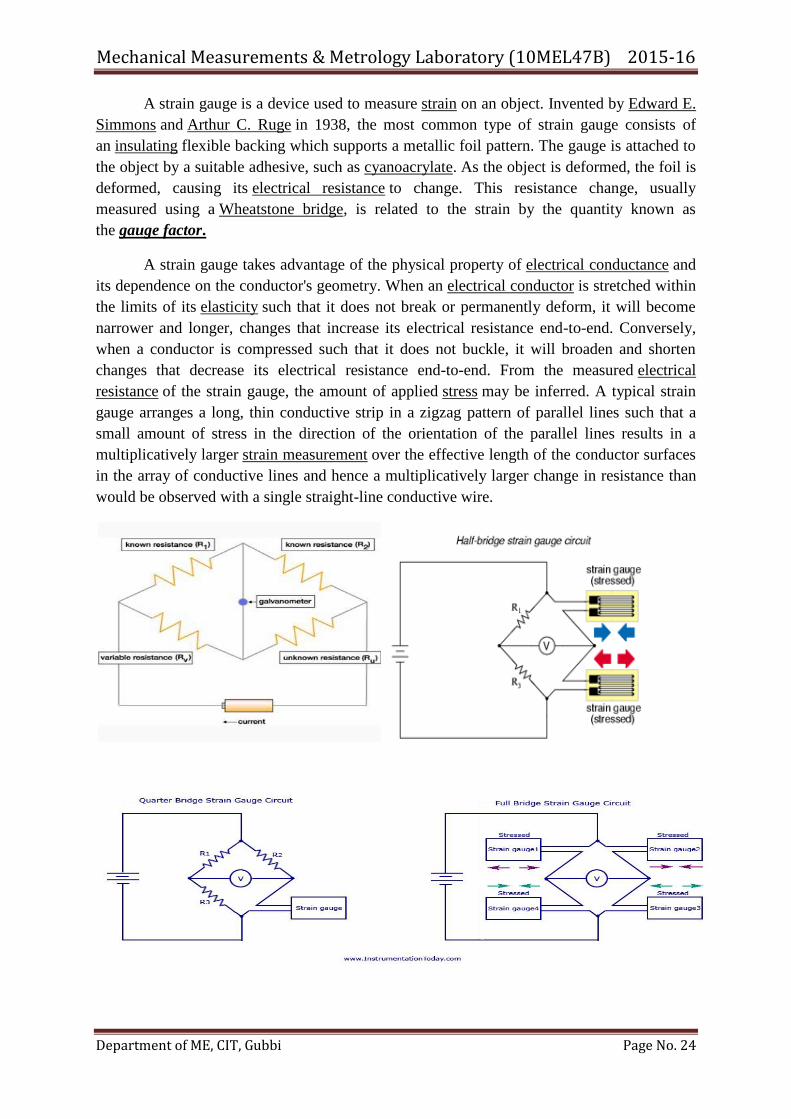
A strain gauge is a device used to measure strain on an object. Invented by Edward E.
Simmons and Arthur C. Ruge in 1938, the most common type of strain gauge consists of
an insulating flexible backing which supports a metallic foil pattern. The gauge is attached to
the object by a suitable adhesive, such as cyanoacrylate. As the object is deformed, the foil is
deformed, causing its electrical resistance to change. This resistance change, usually
measured using a Wheatstone bridge, is related to the strain by the quantity known as
the gauge factor.
A strain gauge takes advantage of the physical property of electrical conductance and
its dependence on the conductor's geometry. When an electrical conductor is stretched within
the limits of its elasticity such that it does not break or permanently deform, it will become
narrower and longer, changes that increase its electrical resistance end-to-end. Conversely,
when a conductor is compressed such that it does not buckle, it will broaden and shorten
changes that decrease its electrical resistance end-to-end. From the measured electrical
resistance of the strain gauge, the amount of applied stress may be inferred. A typical strain
gauge arranges a long, thin conductive strip in a zigzag pattern of parallel lines such that a
small amount of stress in the direction of the orientation of the parallel lines results in a
multiplicatively larger strain measurement over the effective length of the conductor surfaces
in the array of conductive lines and hence a multiplicatively larger change in resistance than
would be observed with a single straight-line conductive wire.
Mechanical Measurements & Metrology Laboratory (10MEL47B) 2015-16
Department of ME, CIT, Gubbi Page No. 25
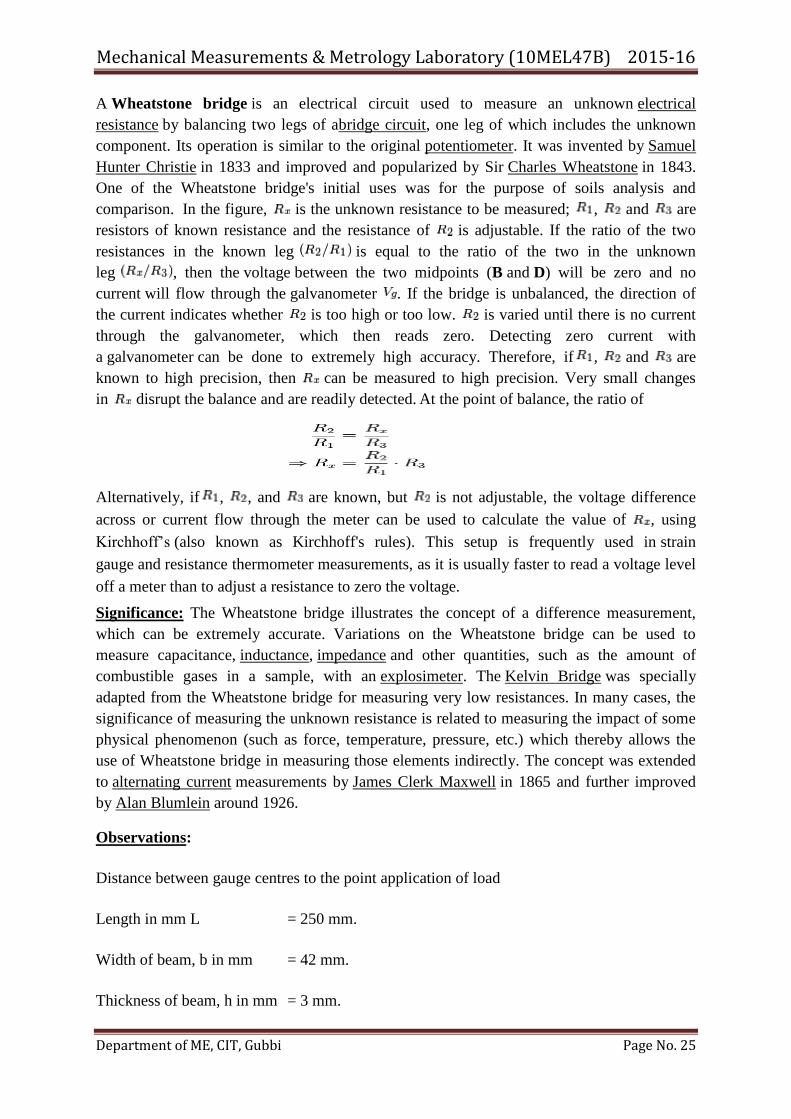
A Wheatstone bridge is an electrical circuit used to measure an unknown electrical
resistance by balancing two legs of abridge circuit, one leg of which includes the unknown
component. Its operation is similar to the original potentiometer. It was invented by Samuel
Hunter Christie in 1833 and improved and popularized by Sir Charles Wheatstone in 1843.
One of the Wheatstone bridge's initial uses was for the purpose of soils analysis and
comparison. In the figure, is the unknown resistance to be measured; , and are
resistors of known resistance and the resistance of is adjustable. If the ratio of the two
resistances in the known leg is equal to the ratio of the two in the unknown
leg , then the voltage between the two midpoints (B and D) will be zero and no
current will flow through the galvanometer . If the bridge is unbalanced, the direction of
the current indicates whether is too high or too low. is varied until there is no current
through the galvanometer, which then reads zero. Detecting zero current with
a galvanometer can be done to extremely high accuracy. Therefore, if , and are
known to high precision, then can be measured to high precision. Very small changes
in disrupt the balance and are readily detected. At the point of balance, the ratio of
Alternatively, if , , and are known, but is not adjustable, the voltage difference
across or current flow through the meter can be used to calculate the value of , using
Kirchhoff‘s (also known as Kirchhoff's rules). This setup is frequently used in strain
gauge and resistance thermometer measurements, as it is usually faster to read a voltage level
off a meter than to adjust a resistance to zero the voltage.
Significance: The Wheatstone bridge illustrates the concept of a difference measurement,
which can be extremely accurate. Variations on the Wheatstone bridge can be used to
measure capacitance, inductance, impedance and other quantities, such as the amount of
combustible gases in a sample, with an explosimeter. The Kelvin Bridge was specially
adapted from the Wheatstone bridge for measuring very low resistances. In many cases, the
significance of measuring the unknown resistance is related to measuring the impact of some
physical phenomenon (such as force, temperature, pressure, etc.) which thereby allows the
use of Wheatstone bridge in measuring those elements indirectly. The concept was extended
to alternating current measurements by James Clerk Maxwell in 1865 and further improved
by Alan Blumlein around 1926.
Observations:
Distance between gauge centres to the point application of load
Length in mm L = 250 mm.
Width of beam, b in mm = 42 mm.
Thickness of beam, h in mm = 3 mm.
Mechanical Measurements & Metrology Laboratory (10MEL47B) 2015-16
Department of ME, CIT, Gubbi Page No. 26
I. Strain Measurement in Four Arm Modes (Full bridge)
Procedure:
1. Switch on the instrument and leave 15 minutes to warm up.
2. Connect the respective colour wires of sensors to terminals in the indicator panel.
3. Keep the arm selector switch on 4.
4. Keep the function switch to gauge factor and adjust the gauge factor pot, to read 500 in
display.
5. Select the function switch to cal and adjust the cal pot to read 1000.
6. Keep the function switch to read and adjust the display to read zero.
7. Apply load 100 gms step by step and note the readings.
8. Calculate the Young‘s Modulus and compare the value with theoretical value.
Gauge Factor or Strain Sensitivity
For a given amount of unit strain (ΔL/L), the gauge will undergo a corresponding change in
resistance (ΔR/R). The ratio of the unit change in the resistance to the unit change in the
length is known as gauge factor. where R is the nominal resistance of the gauge
conventional foil gauges have standardised nominal resistance values of 120
& 350 ohms & typically exhibit gauge factors between 1.5 & 3.5. in typical transducer
applications, they are subjected to full scale design strain levels ranging from 500 to 2000
microstrain.
Results:
Using the strain gauges, Young‘s Modulus of the given mild steel specimen has been
determined for full bridge
Mechanical Measurements & Metrology Laboratory (10MEL47B) 2015-16
Department of ME, CIT, Gubbi Page No. 27
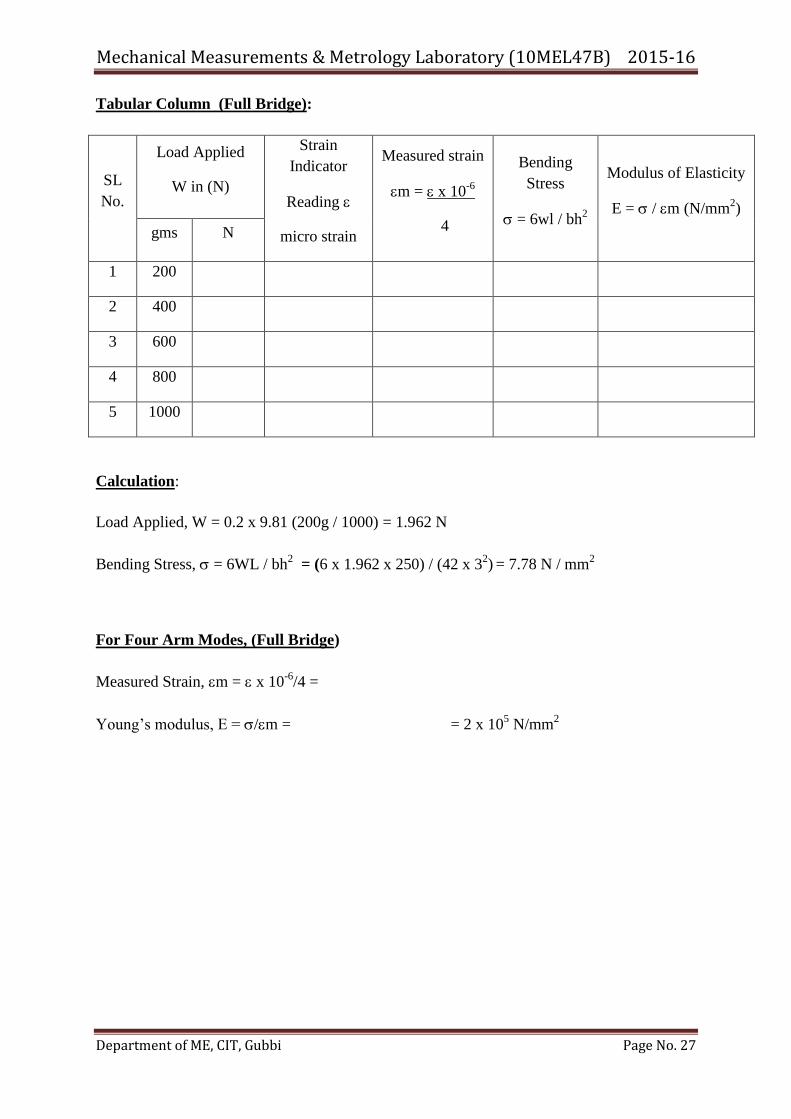
Tabular Column (Full Bridge):
SL
No.
Load Applied
W in (N)
Strain
Indicator
Reading
micro strain
Measured strain
m = x 10-6
4
Bending
Stress
= 6wl / bh2
Modulus of Elasticity
E = / m (N/mm2)
gms N
1 200
2 400
3 600
4 800
5 1000
Calculation:
Load Applied, W = 0.2 x 9.81 (200g / 1000) = 1.962 N
Bending Stress, = 6WL / bh2
= (6 x 1.962 x 250) / (42 x 32) = 7.78 N / mm
2
For Four Arm Modes, (Full Bridge)
Measured Strain, m = x 10-6
/4 =
Young‘s modulus, E = /m = = 2 x 10⁵ N/mm
2
Mechanical Measurements & Metrology Laboratory (10MEL47B) 2015-16
Department of ME, CIT, Gubbi Page No. 28
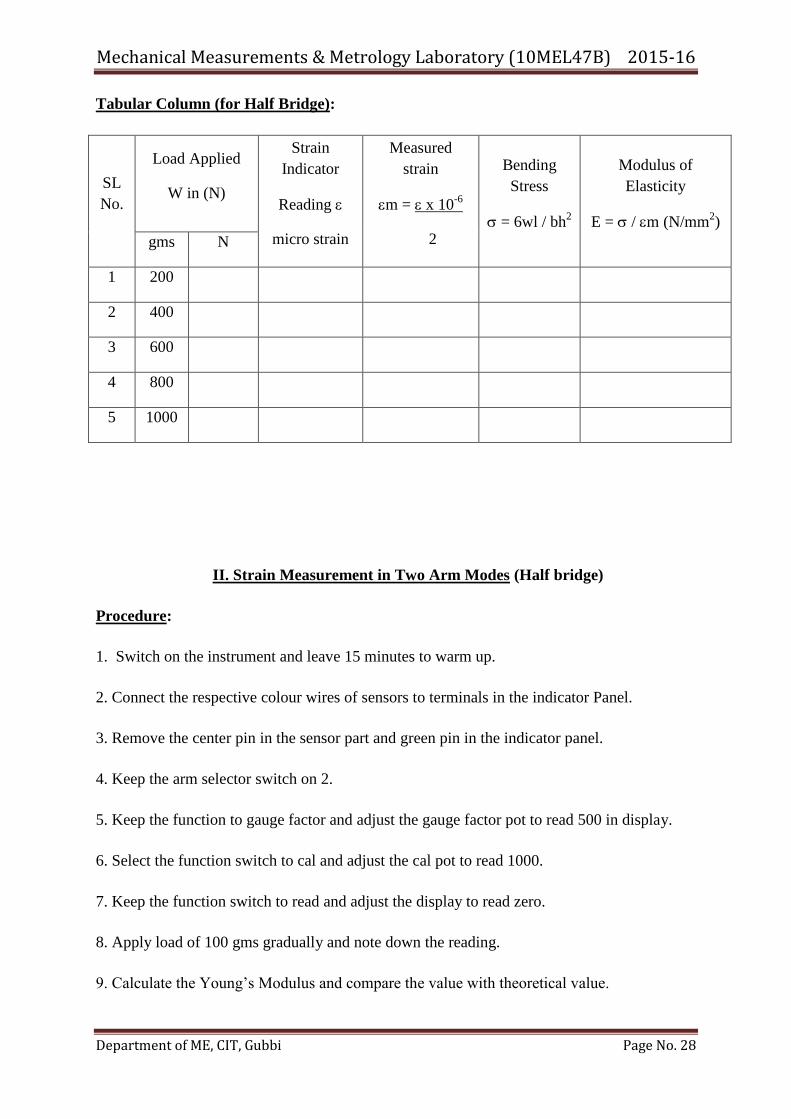
Tabular Column (for Half Bridge):
SL
No.
Load Applied
W in (N)
Strain
Indicator
Reading
micro strain
Measured
strain
m = x 10-6
2
Bending
Stress
= 6wl / bh2
Modulus of
Elasticity
E = / m (N/mm2)
gms N
1 200
2 400
3 600
4 800
5 1000
II. Strain Measurement in Two Arm Modes (Half bridge)
Procedure:
1. Switch on the instrument and leave 15 minutes to warm up.
2. Connect the respective colour wires of sensors to terminals in the indicator Panel.
3. Remove the center pin in the sensor part and green pin in the indicator panel.
4. Keep the arm selector switch on 2.
5. Keep the function to gauge factor and adjust the gauge factor pot to read 500 in display.
6. Select the function switch to cal and adjust the cal pot to read 1000.
7. Keep the function switch to read and adjust the display to read zero.
8. Apply load of 100 gms gradually and note down the reading.
9. Calculate the Young‘s Modulus and compare the value with theoretical value.
Mechanical Measurements & Metrology Laboratory (10MEL47B) 2015-16
Department of ME, CIT, Gubbi Page No. 29
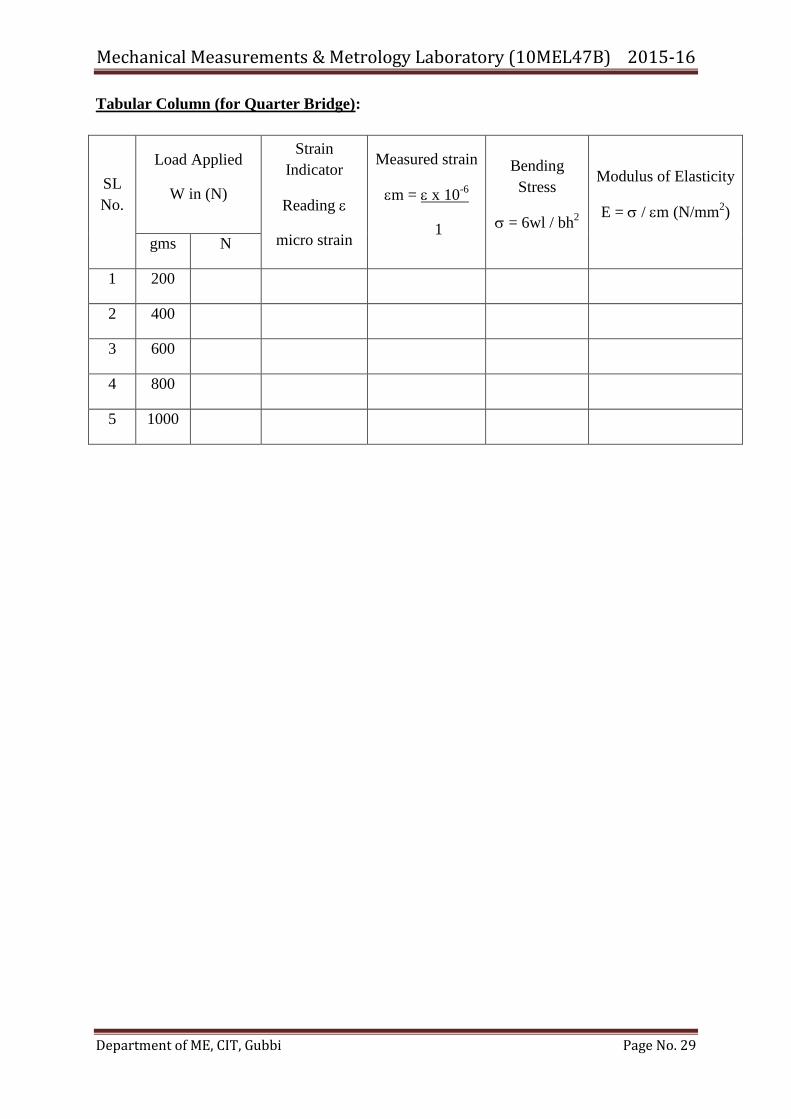
Tabular Column (for Quarter Bridge):
SL
No.
Load Applied
W in (N)
Strain
Indicator
Reading
micro strain
Measured strain
m = x 10-6
1
Bending
Stress
= 6wl / bh2
Modulus of Elasticity
E = / m (N/mm2)
gms N
1 200
2 400
3 600
4 800
5 1000
Mechanical Measurements & Metrology Laboratory (10MEL47B) 2015-16
Department of ME, CIT, Gubbi Page No. 30
III. Strain Measurement in one Arm Modes (Quarter Bridge)
Procedure: Remove the center pin in the sensor part and black pin in the indicator panel.
Remaining is same as half bridge.
Applications:
1. Wherever load cells are using there is a strain gauge embedded in it.
2. Estimation of structural strength in steel & concrete structures, bridges &
hydraulic structures.
3. In large machineries, pipelines & pressure vessels.
4. Estimation of remaining life of old & huge structures like civil engineering
structures, rail bridges & electrical towers.
5. Strain gauges are used for the stress analysis without any experiments.
6. Strain gauges are also used in measuring the stress developed in the moving parts
of the engine. Ex: piston.
Graphs:
By plotting the graph, m as the base and as the ordinate, a straight line is obtained from
which the slope can be found.
Modulus of elasticity E = slope of the line
Results:
Using the strain gauges, Young‘s Modulus of the given mild steel specimen has been
determined for half and quarter bridges.
Mechanical Measurements & Metrology Laboratory (10MEL47B) 2015-16
Department of ME, CIT, Gubbi Page No. 31
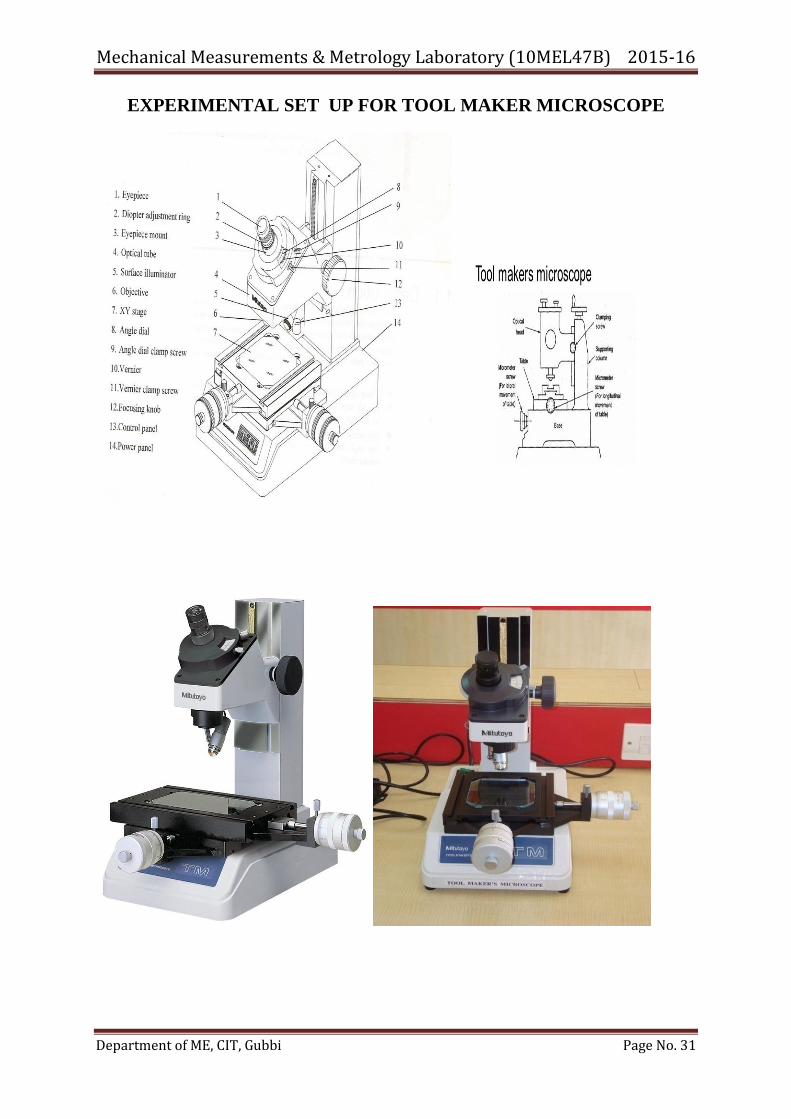
EXPERIMENTAL SET UP FOR TOOL MAKER MICROSCOPE
Mechanical Measurements & Metrology Laboratory (10MEL47B) 2015-16
Department of ME, CIT, Gubbi Page No. 32
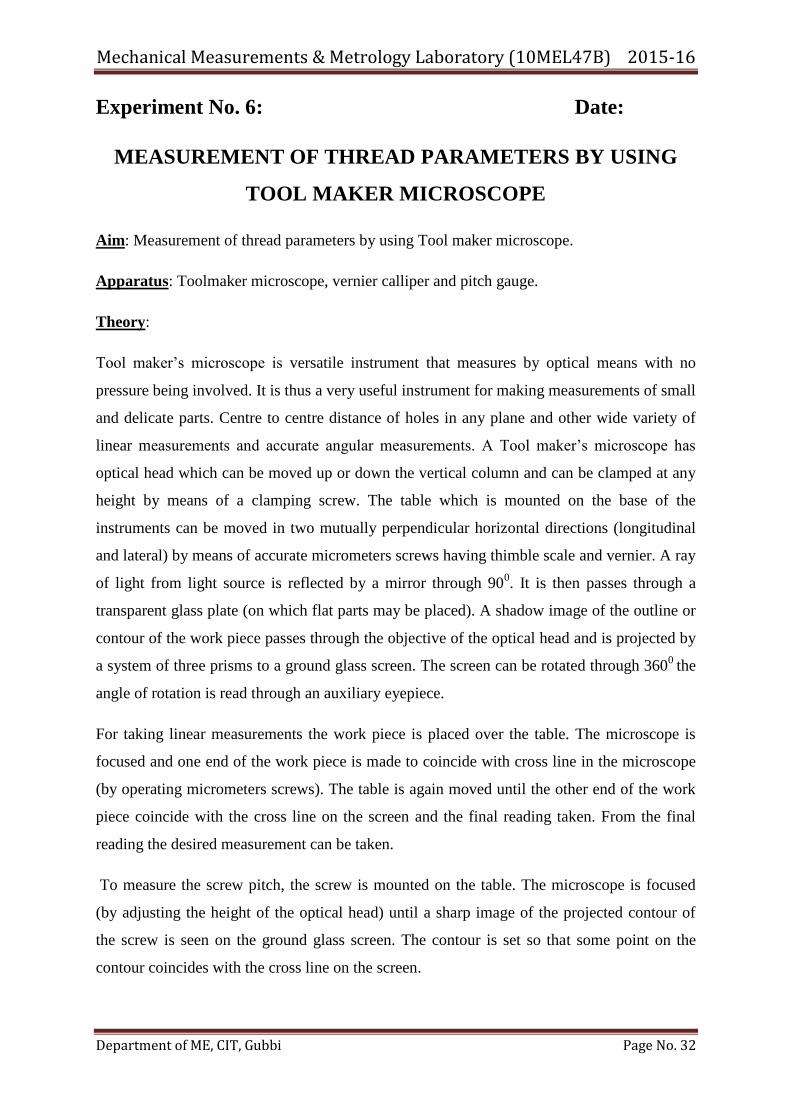
Experiment No. 6: Date:
MEASUREMENT OF THREAD PARAMETERS BY USING
TOOL MAKER MICROSCOPE
Aim: Measurement of thread parameters by using Tool maker microscope.
Apparatus: Toolmaker microscope, vernier calliper and pitch gauge.
Theory:
Tool maker‘s microscope is versatile instrument that measures by optical means with no
pressure being involved. It is thus a very useful instrument for making measurements of small
and delicate parts. Centre to centre distance of holes in any plane and other wide variety of
linear measurements and accurate angular measurements. A Tool maker‘s microscope has
optical head which can be moved up or down the vertical column and can be clamped at any
height by means of a clamping screw. The table which is mounted on the base of the
instruments can be moved in two mutually perpendicular horizontal directions (longitudinal
and lateral) by means of accurate micrometers screws having thimble scale and vernier. A ray
of light from light source is reflected by a mirror through 900. It is then passes through a
transparent glass plate (on which flat parts may be placed). A shadow image of the outline or
contour of the work piece passes through the objective of the optical head and is projected by
a system of three prisms to a ground glass screen. The screen can be rotated through 3600
the
angle of rotation is read through an auxiliary eyepiece.
For taking linear measurements the work piece is placed over the table. The microscope is
focused and one end of the work piece is made to coincide with cross line in the microscope
(by operating micrometers screws). The table is again moved until the other end of the work
piece coincide with the cross line on the screen and the final reading taken. From the final
reading the desired measurement can be taken.
To measure the screw pitch, the screw is mounted on the table. The microscope is focused
(by adjusting the height of the optical head) until a sharp image of the projected contour of
the screw is seen on the ground glass screen. The contour is set so that some point on the
contour coincides with the cross line on the screen.
Mechanical Measurements & Metrology Laboratory (10MEL47B) 2015-16
Department of ME, CIT, Gubbi Page No. 33
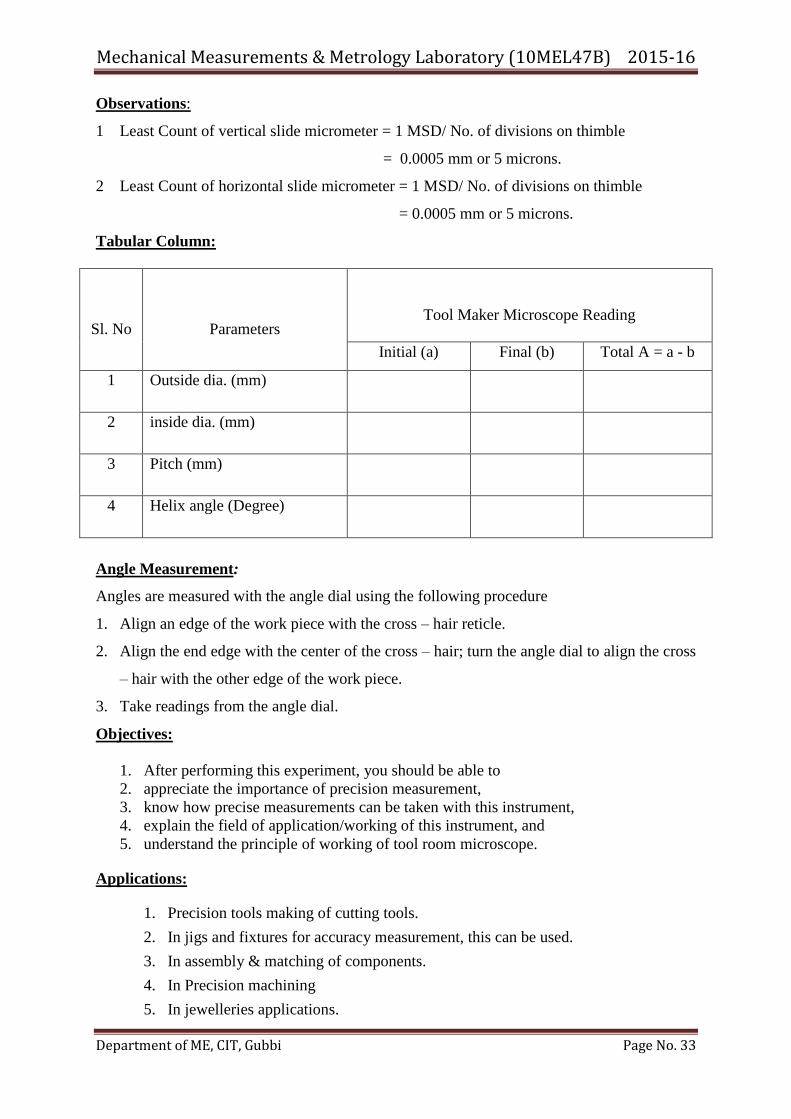
Observations:
1 Least Count of vertical slide micrometer = 1 MSD/ No. of divisions on thimble
= 0.0005 mm or 5 microns.
2 Least Count of horizontal slide micrometer = 1 MSD/ No. of divisions on thimble
= 0.0005 mm or 5 microns.
Tabular Column:
Sl. No
Parameters
Tool Maker Microscope Reading
Initial (a) Final (b) Total A = a - b
1 Outside dia. (mm)
2 inside dia. (mm)
3 Pitch (mm)
4 Helix angle (Degree)
Angle Measurement:
Angles are measured with the angle dial using the following procedure
1. Align an edge of the work piece with the cross – hair reticle.
2. Align the end edge with the center of the cross – hair; turn the angle dial to align the cross
– hair with the other edge of the work piece.
3. Take readings from the angle dial.
Objectives:
1. After performing this experiment, you should be able to
2. appreciate the importance of precision measurement,
3. know how precise measurements can be taken with this instrument,
4. explain the field of application/working of this instrument, and
5. understand the principle of working of tool room microscope.
Applications:
1. Precision tools making of cutting tools.
2. In jigs and fixtures for accuracy measurement, this can be used.
3. In assembly & matching of components.
4. In Precision machining
5. In jewelleries applications.
Mechanical Measurements & Metrology Laboratory (10MEL47B) 2015-16
Department of ME, CIT, Gubbi Page No. 34
Procedure:
1. Note the least count of the micrometers.
2. Dimensions of the screw thread whose elements have to be measured are noted.
3. Place or fix the screw thread on XY stage (stage glass) of the tool maker‘s microscope.
4. Align a measuring point on the work piece with one of the cross hairs.
5. Take the reading from the micrometer head.
6. Move the XY stage by turning the micrometer head and align another measuring point
with the same cross hair and take the reading at this point.
7. Difference between the two readings represents the dimension between the two
measuring points.
8. Repeat the experiment for different screw thread.
Results:
The following parameters are found that;
1. Outside dia. = _____________mm
2. Inside dia. = _____________mm
3. Pitch = _____________mm
4. Helix angle = _____________ Degrees
Mechanical Measurements & Metrology Laboratory (10MEL47B) 2015-16
Department of ME, CIT, Gubbi Page No. 35
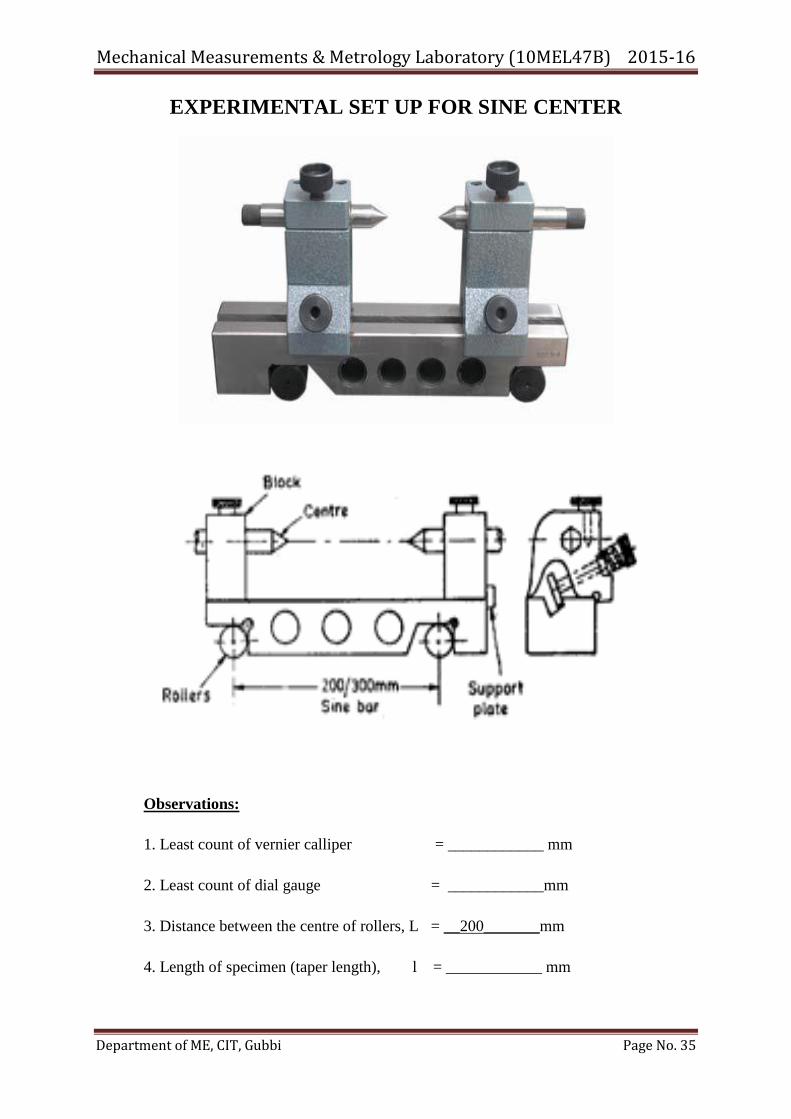
EXPERIMENTAL SET UP FOR SINE CENTER
Observations:
1. Least count of vernier calliper = ____________ mm
2. Least count of dial gauge = ____________mm
3. Distance between the centre of rollers, L = __200_______mm
4. Length of specimen (taper length), l = ____________ mm
Mechanical Measurements & Metrology Laboratory (10MEL47B) 2015-16
Department of ME, CIT, Gubbi Page No. 36
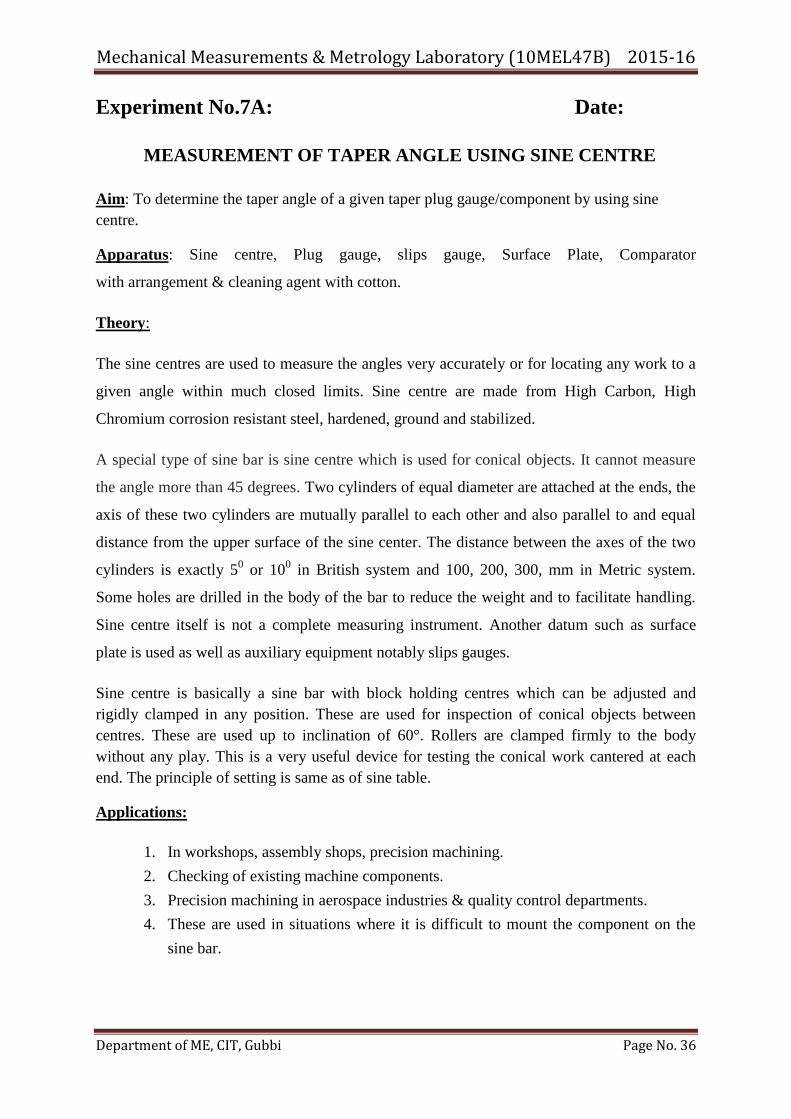
Experiment No.7A: Date:
MEASUREMENT OF TAPER ANGLE USING SINE CENTRE
Aim: To determine the taper angle of a given taper plug gauge/component by using sine
centre.
Apparatus: Sine centre, Plug gauge, slips gauge, Surface Plate, Comparator
with arrangement & cleaning agent with cotton.
Theory:
The sine centres are used to measure the angles very accurately or for locating any work to a
given angle within much closed limits. Sine centre are made from High Carbon, High
Chromium corrosion resistant steel, hardened, ground and stabilized.
A special type of sine bar is sine centre which is used for conical objects. It cannot measure
the angle more than 45 degrees. Two cylinders of equal diameter are attached at the ends, the
axis of these two cylinders are mutually parallel to each other and also parallel to and equal
distance from the upper surface of the sine center. The distance between the axes of the two
cylinders is exactly 50 or 10
0 in British system and 100, 200, 300, mm in Metric system.
Some holes are drilled in the body of the bar to reduce the weight and to facilitate handling.
Sine centre itself is not a complete measuring instrument. Another datum such as surface
plate is used as well as auxiliary equipment notably slips gauges.
Sine centre is basically a sine bar with block holding centres which can be adjusted and
rigidly clamped in any position. These are used for inspection of conical objects between
centres. These are used up to inclination of 60°. Rollers are clamped firmly to the body
without any play. This is a very useful device for testing the conical work cantered at each
end. The principle of setting is same as of sine table.
Applications:
1. In workshops, assembly shops, precision machining.
2. Checking of existing machine components.
3. Precision machining in aerospace industries & quality control departments.
4. These are used in situations where it is difficult to mount the component on the
sine bar.
Mechanical Measurements & Metrology Laboratory (10MEL47B) 2015-16
Department of ME, CIT, Gubbi Page No. 37
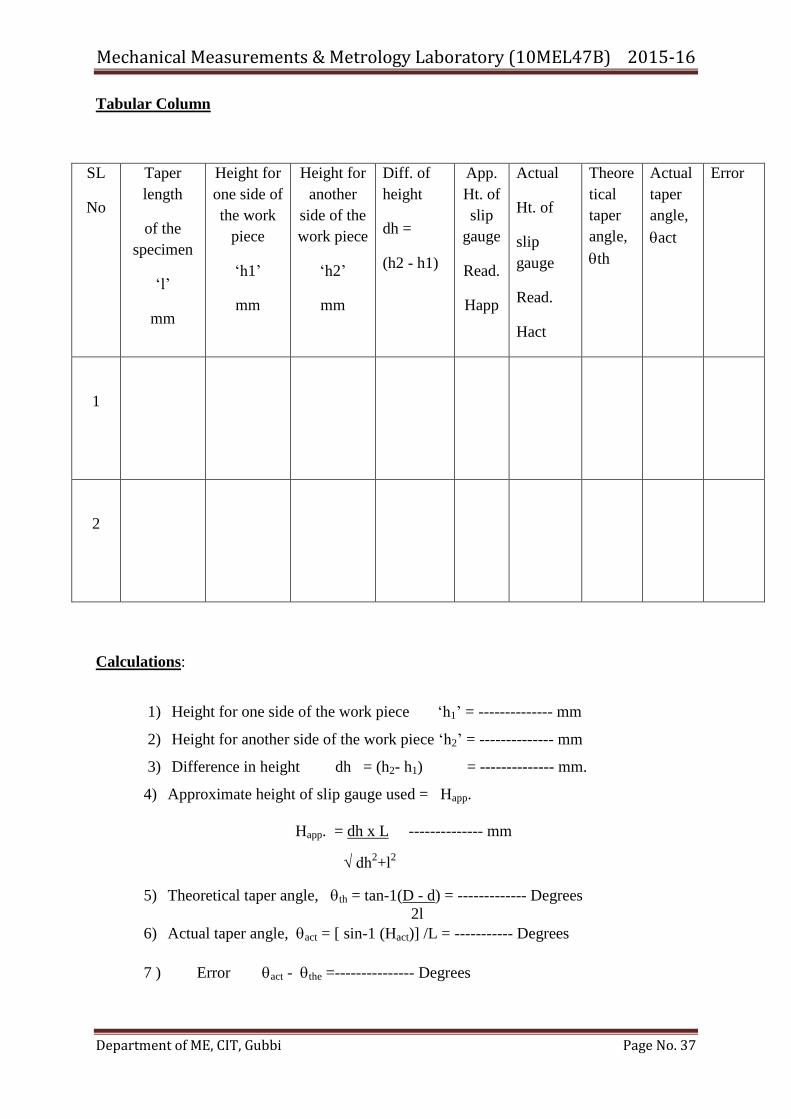
Tabular Column
SL
No
Taper
length
of the
specimen
‗l‘
mm
Height for
one side of
the work
piece
‗h1‘
mm
Height for
another
side of the
work piece
‗h2‘
mm
Diff. of
height
dh =
(h2 - h1)
App.
Ht. of
slip
gauge
Read.
Happ
Actual
Ht. of
slip
gauge
Read.
Hact
Theore
tical
taper
angle,
th
Actual
taper
angle,
act
Error
1
2
Calculations:
1) Height for one side of the work piece ‗h1‘ = -------------- mm
2) Height for another side of the work piece ‗h2‘ = -------------- mm
3) Difference in height dh = (h2- h1) = -------------- mm.
4) Approximate height of slip gauge used = Happ.
Happ. = dh x L -------------- mm
√ dh2+l
2
5) Theoretical taper angle, th = tan-1(D - d) = ------------- Degrees
2l
6) Actual taper angle, act = [ sin-1 (Hact)] /L = ----------- Degrees
7 ) Error act - the =--------------- Degrees
Mechanical Measurements & Metrology Laboratory (10MEL47B) 2015-16
Department of ME, CIT, Gubbi Page No. 38
Procedure:
1. Note down the least count of the vernier calliper and dial gauge.
2. Measure the minimum, maximum diameter and axial length of taper plug gauge using
Vernier calliper.
3. Calculate approximate height of slip gauge using formula.
4. Build up the height using M-87 set of cleaning the surface of slip gauge using acetone
liquid and use wringing technique to build the height.
5. Place the slips below one of the cylinder of sine centre which is placed above the surface
plate.
6. Keep the plug gauge in between the sin centre.
7. Use the dial gauge with assembling to check the deviation from one end to other end of
plug gauge and note down the deviations.
8. Add or subtract the value of the deviation to difference in dial gauge Reading (dh) and
repeat the step 7 until zero reading occur in dial gauge and rebuilt the slips repeatedly.
9. Calculate the actual angle of taper plug gauge using actual slip heights.
Results:
For a given component/ plug gauge , we found the theoretical taper angle is _______ degrees
& also actual taper angle is __________ degrees.
Mechanical Measurements & Metrology Laboratory (10MEL47B) 2015-16
Department of ME, CIT, Gubbi Page No. 39
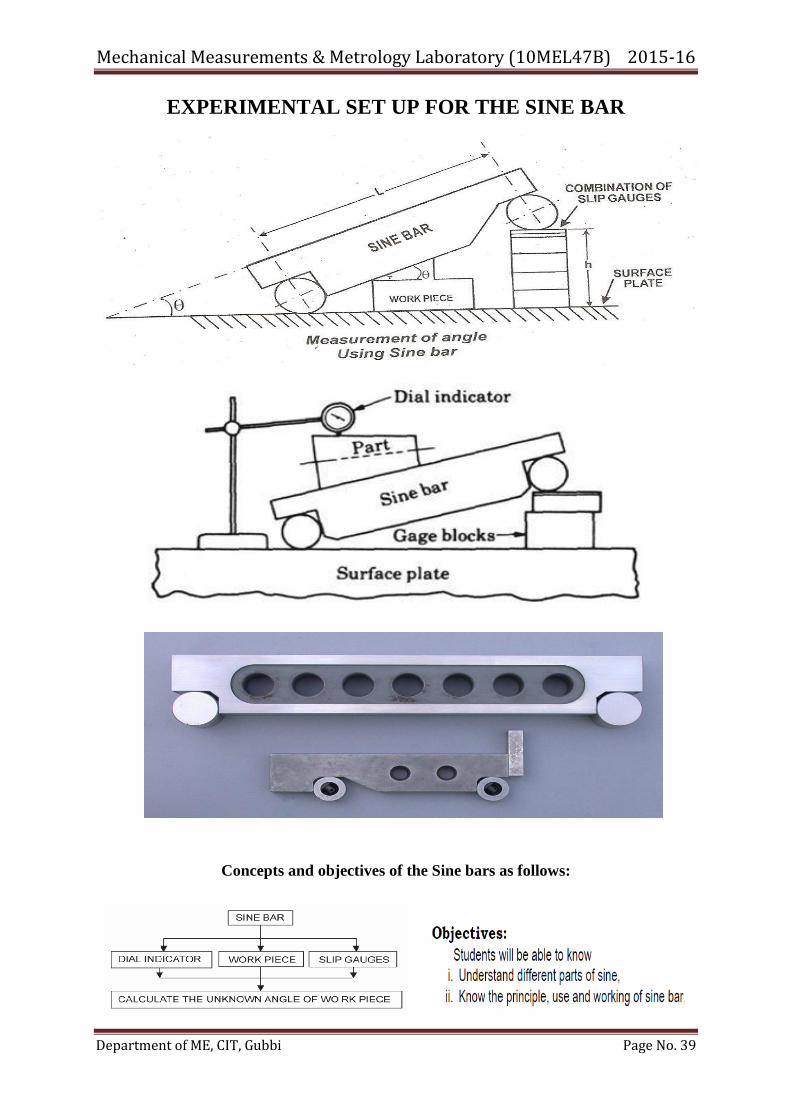
EXPERIMENTAL SET UP FOR THE SINE BAR
Concepts and objectives of the Sine bars as follows:
Mechanical Measurements & Metrology Laboratory (10MEL47B) 2015-16
Department of ME, CIT, Gubbi Page No. 40
Experiment No. 7B: Date:
MEASUREMENT OF TAPER ANGLE USING SINE BAR
Aim: To determine the taper angle of the given work piece and compare it with theoretical
value by using sine bar.
Apparatus: Surface plate, sine bar, slip gauge sets, Vernier calliper, cleaning agent, tapered
work piece, clean dry soft cloth, clamping devices etc.
Theory:
Sine bar is a precision instrument used along with slip gauges for accurate angle
measurements or angle setting. Sine bar consists of an accurate straight bar in which two
accurately lapped cylindrical plugs or rollers are located with extreme position. The straight
bar are made of high carbon, high chromium, corrosion resistant steel and the surfaces are
hardened, grounded and lapped. Ends of the straight bar are stepped so that the plugs can be
screwed at each step. Plugs are the two rollers of same diameter fixed at a distance L between
them and is called as length of the bar. This distance L is the centre to centre distance of
plugs is which is generally 100, 200 and 300 mm and so on.
Use of Sine bar: The work piece whose angle is to be measured is placed on sine bar. Below
one roller of sine bar, slip gauges are placed. Slip gauges are added till the work piece surface
is straight. Dial indicator is moved from one end of work piece till another end. Slip gauges
are added till dial pointer does not move from zero position. The use of sine bar is based on
the laws of trigonometry. When sine bar set up is made for the purpose of angle
measurement, sine bar itself forms hypotenuse of right angle triangle and slip gauges form
the side opposite to the required angle. Sin θ= (h/L), Therefore θ= sin-1(h/L), Angle θ is
determined by an indirect method as a function of sine so this device is called as sine bar.
Sine bar is always used in conjunction with slip gauge and dial indicator for the measurement
of angle.
The angle is defined as the opening between the two lines or planes, which meet at a
point. So angle is a thing which can be generated very easily requiring no absolute standard.
Sine bars are used in junction with slip gauges constitute a very good device for the precision
measurement of angles. Since sine bars are used either to measure angle very accurately or
for locating any work to a given angle within very close limit. Sine bars are used only for
measuring and setting any angle of the object having flat surface. Sine bars are also used to
measure or set angle of the object not larger than the 450, if higher accuracy is demanded.
Mechanical Measurements & Metrology Laboratory (10MEL47B) 2015-16
Department of ME, CIT, Gubbi Page No. 41
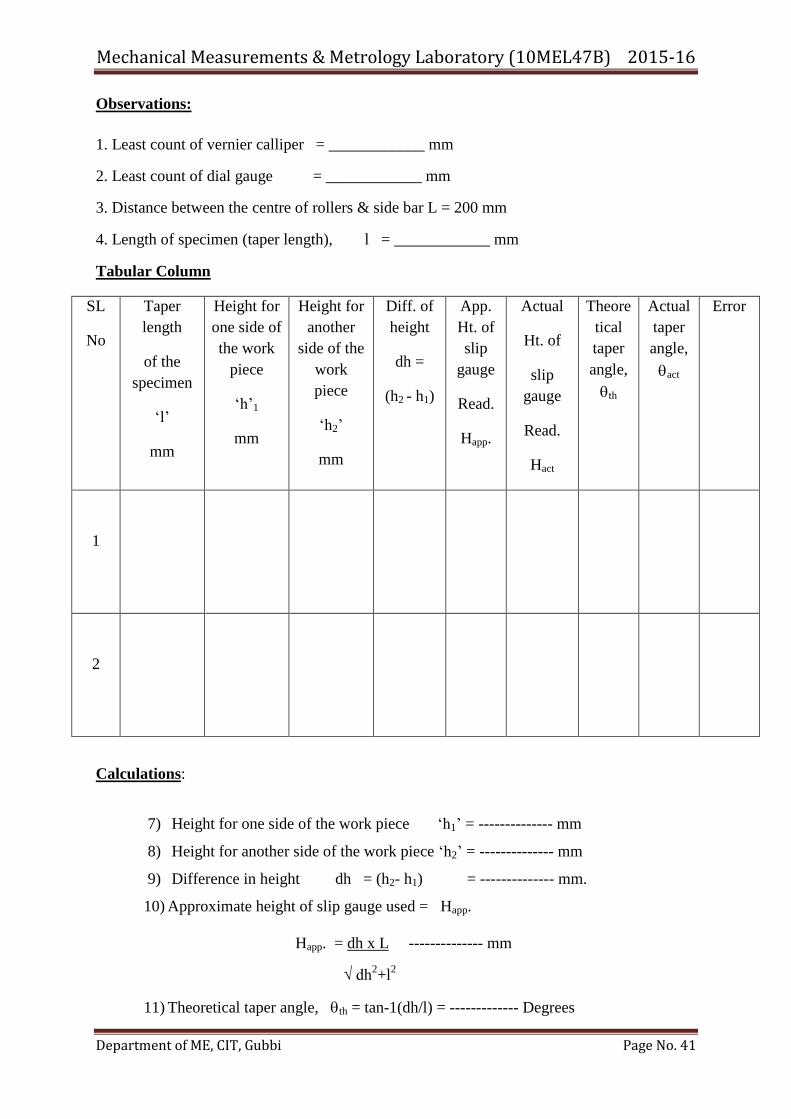
Observations:
1. Least count of vernier calliper = ____________ mm
2. Least count of dial gauge = ____________ mm
3. Distance between the centre of rollers & side bar L = 200 mm
4. Length of specimen (taper length), l = ____________ mm
Tabular Column
SL
No
Taper
length
of the
specimen
‗l‘
mm
Height for
one side of
the work
piece
‗h‘1
mm
Height for
another
side of the
work
piece
‗h2‘
mm
Diff. of
height
dh =
(h2 - h1)
App.
Ht. of
slip
gauge
Read.
Happ.
Actual
Ht. of
slip
gauge
Read.
Hact
Theore
tical
taper
angle,
th
Actual
taper
angle,
act
Error
1
2
Calculations:
7) Height for one side of the work piece ‗h1‘ = -------------- mm
8) Height for another side of the work piece ‗h2‘ = -------------- mm
9) Difference in height dh = (h2- h1) = -------------- mm.
10) Approximate height of slip gauge used = Happ.
Happ. = dh x L -------------- mm
√ dh2+l
2
11) Theoretical taper angle, th = tan-1(dh/l) = ------------- Degrees
Mechanical Measurements & Metrology Laboratory (10MEL47B) 2015-16
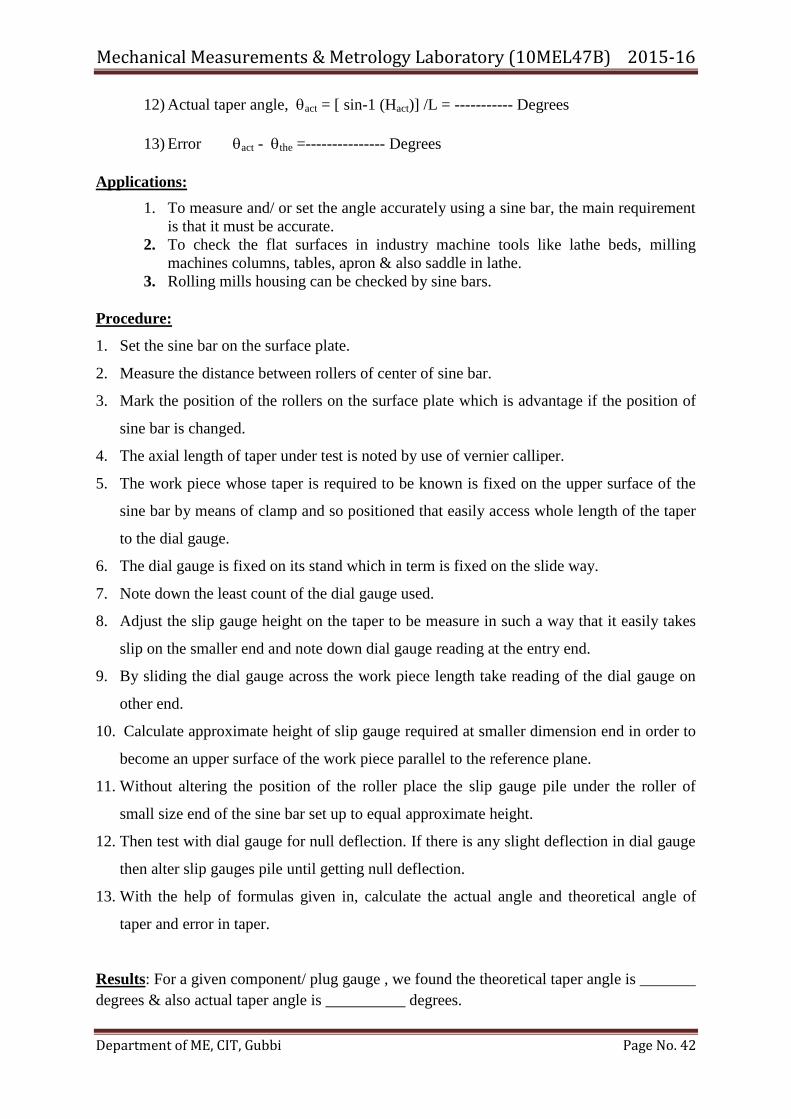
Department of ME, CIT, Gubbi Page No. 42
12) Actual taper angle, act = [ sin-1 (Hact)] /L = ----------- Degrees
13) Error act - the =--------------- Degrees
Applications:
1. To measure and/ or set the angle accurately using a sine bar, the main requirement
is that it must be accurate.
2. To check the flat surfaces in industry machine tools like lathe beds, milling
machines columns, tables, apron & also saddle in lathe.
3. Rolling mills housing can be checked by sine bars.
Procedure:
1. Set the sine bar on the surface plate.
2. Measure the distance between rollers of center of sine bar.
3. Mark the position of the rollers on the surface plate which is advantage if the position of
sine bar is changed.
4. The axial length of taper under test is noted by use of vernier calliper.
5. The work piece whose taper is required to be known is fixed on the upper surface of the
sine bar by means of clamp and so positioned that easily access whole length of the taper
to the dial gauge.
6. The dial gauge is fixed on its stand which in term is fixed on the slide way.
7. Note down the least count of the dial gauge used.
8. Adjust the slip gauge height on the taper to be measure in such a way that it easily takes
slip on the smaller end and note down dial gauge reading at the entry end.
9. By sliding the dial gauge across the work piece length take reading of the dial gauge on
other end.
10. Calculate approximate height of slip gauge required at smaller dimension end in order to
become an upper surface of the work piece parallel to the reference plane.
11. Without altering the position of the roller place the slip gauge pile under the roller of
small size end of the sine bar set up to equal approximate height.
12. Then test with dial gauge for null deflection. If there is any slight deflection in dial gauge
then alter slip gauges pile until getting null deflection.
13. With the help of formulas given in, calculate the actual angle and theoretical angle of
taper and error in taper.
Results: For a given component/ plug gauge , we found the theoretical taper angle is _______
degrees & also actual taper angle is __________ degrees.
Mechanical Measurements & Metrology Laboratory (10MEL47B) 2015-16
Department of ME, CIT, Gubbi Page No. 43
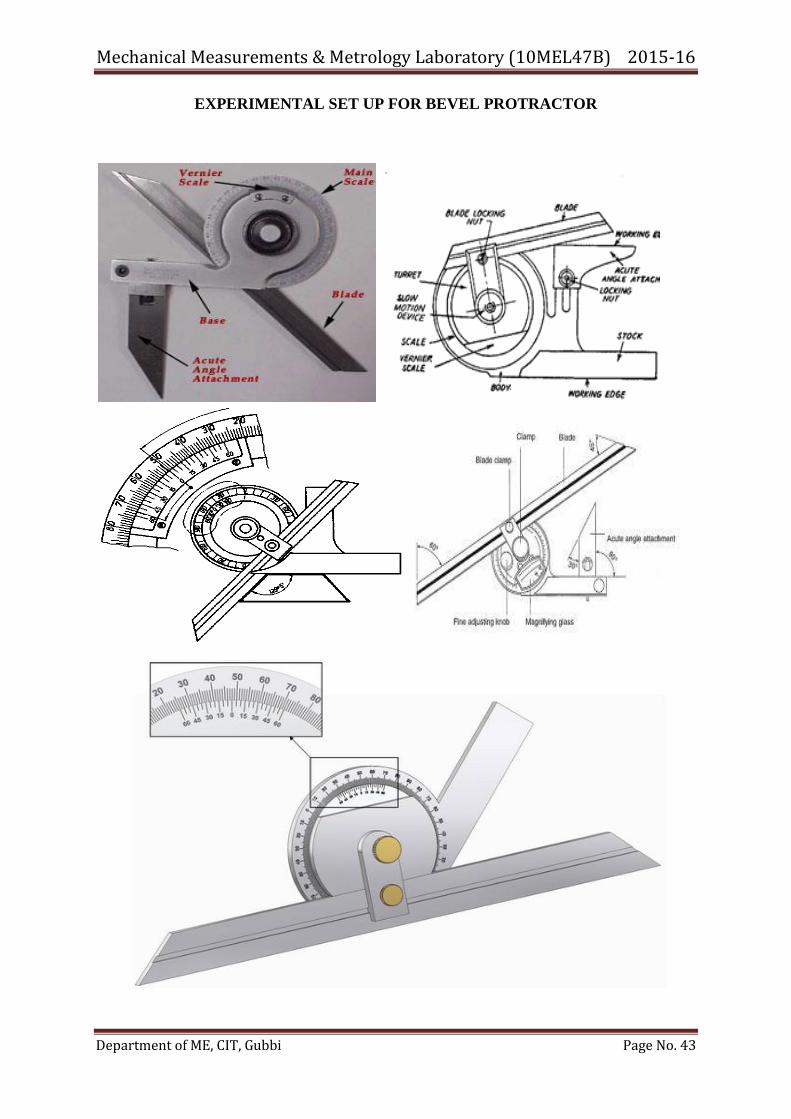
EXPERIMENTAL SET UP FOR BEVEL PROTRACTOR
Mechanical Measurements & Metrology Laboratory (10MEL47B) 2015-16
Department of ME, CIT, Gubbi Page No. 44
Experiment No. 7C: Date:
MEASUREMENT OF TAPER ANGLE USING BEVEL
PROTRACTOR
Aim: To find out the taper angle of given work piece by using Bevel Protractor.
Apparatus: Surface Plate, Bevel Protractor, Tapered work piece.
Objectives:
Students will be able to know
Understand different parts of vernier bevel protractor,
Know the use and working of bevel protractor,
Understand the use of vernier bevel protractor.
Theory:
Main parts of bevel protractor are
1. Fixed Base blade and a circular body is attached to it.
2. Adjustable blade.
3. Blade clamp.
4. Scale magnifier lens.
5. Acute angle attachment.
Bevel protractor is used for measuring and lying out of angles accurately and precisely
within 5 minutes. The protractor dial is slotted to hold a blade which can be rotated with the
dial to the required angle and also independently adjusted to any desired length. The blade
can be locked in any position.
It is the simplest instrument for measuring the angle between two faces of component. It
consists of base plate attached to the main body and an adjustable blade which is attached to a
circular plate containing vernier scale. The adjustable blade is capable of rotating freely about
the centre of the main scale engraved on the body of the instrument and can be locked in the
any position. It is capable of measuring from zero to 3600. The vernier scale has 24 divisions
coinciding with 23 main scale divisions. Thus the least count of the instrument is 51. This
instrument is most commonly used in work shop for angular measurements.

Mechanical Measurements & Metrology Laboratory (10MEL47B) 2015-16
Department of ME, CIT, Gubbi Page No. 45
Note the reading, magnifying lens has been provided for easy reading of the instrument. Main
scale is circular and is graduated in degrees on the circular body. Main scale graduations are
all around the circular body which is attached to fixed base blade. Fixed base blade also
called as stock is attached to circular body of bevel protractor as shown in figure. Once the
reading is fixed, blade clamp fixes the reading. Blades are about 150 mm long or 300mm
long, 13mm wide and 2mm thick. Its ends are bevelled at angles of 45 degree and 60 degree.
Vernier scale is also marked on turret which can rotate all over the fixed body. Adjustable
blade can pass through the slot provided in turret. So as the turret rotates, adjustable blade
also rotates full 360 degrees. There are 12 graduations of Vernier scale starting from 0 to 60o
on both sides of zero of Vernier scale as shown in figure.
Observations:
Least count of the Bevel Protractor _________________ minutes
Tabular Column:
SL No. Faces/Sides Angles
1
2
3
4
Mechanical Measurements & Metrology Laboratory (10MEL47B) 2015-16
Department of ME, CIT, Gubbi Page No. 46
Applications:
1. To measure the acute & obtuse angles in case of flat & circular objects with large
radius.
2. In machining processes like production of flat surfaces.
3. For checking the ‗V‘ block, it is used.
Procedure:
1. Note down the least count of the Bevel Protractor.
2. Keep the work piece on the surface plate.
3. Fix the slide of Bevel Protractor to the Turret.
4. Keep one of the surfaces of the specimen on the working edge and rotate the turret.
Remove the slide on to the other surface.
5. Fix the centre, after matching the both the faces and note down the reading.
6. Repeat the experiment for different faces
Results:
By using the bevel protractor, the taper angle of the given specimen is calculated.
Mechanical Measurements & Metrology Laboratory (10MEL47B) 2015-16
Department of ME, CIT, Gubbi Page No. 47
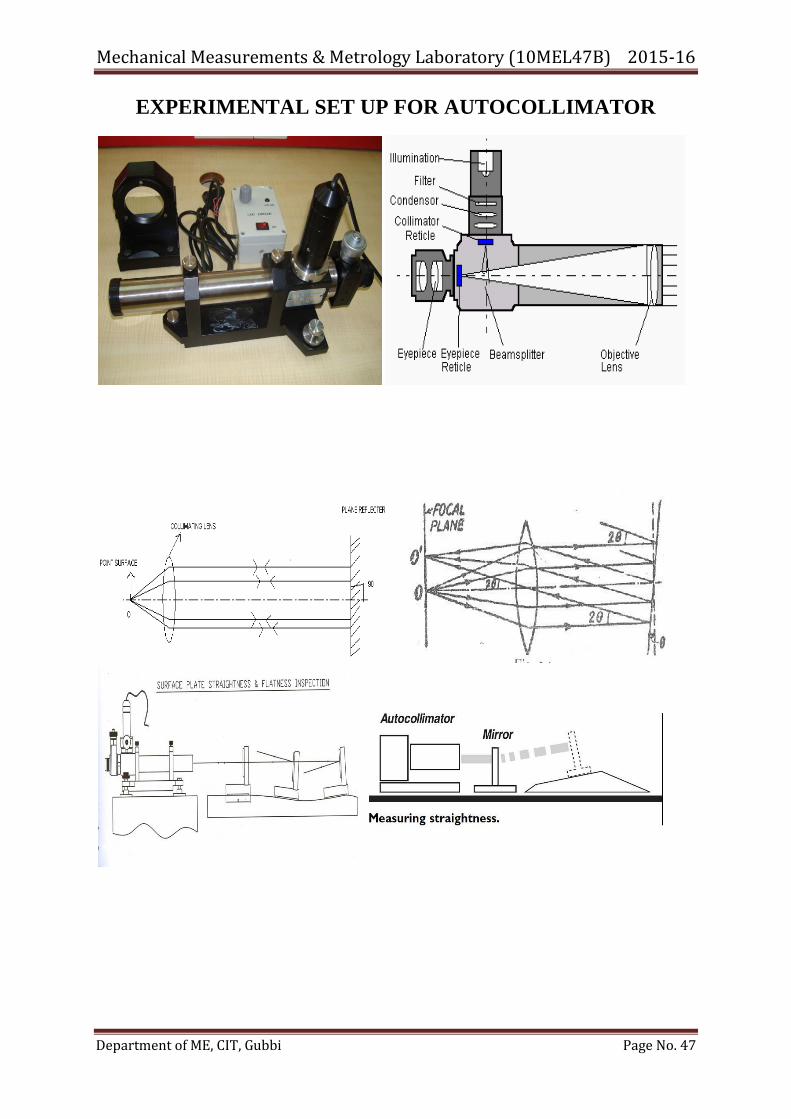
EXPERIMENTAL SET UP FOR AUTOCOLLIMATOR
Mechanical Measurements & Metrology Laboratory (10MEL47B) 2015-16
Department of ME, CIT, Gubbi Page No. 48
Experiment No. 8: Date:
MEASUREMENT OF ALIGNMENT USING
AUTOCOLLIMATOR
Aim: To check the Straightness & flatness of the given component by using Autocollimator.
Apparatus: Autocollimator, work piece/ object to be tested.
Theory:
Definition of straightness-a plane is to be said straight over a given length. If the variation
or distance of its point from two planes perpendicular to each other and parallel to the
generation direction at of the line remain within specified tolerance limits. The reference
planes being so chosen that there intersection is parallel to the straight line joining two points
suitably located on the line to be tested and two points being close ends of the length to be
measured.
Principle of the Autocollimator: A cross line ―target‖ graticule is positioned at the focal
plane of a telescope objective system with the intersection of the cross line on the optical
axis, i.e. at the principal focus. When the target graticule is illuminated, rays of light
diverging from the intersection point reach the objective via a beam splitter and are projected-
from the objective as parallel pencils of light. In this mode the optical system is operating as a
―collimator‖.
A flat reflector placed in front of the objective and exactly normal to the optical axis reflects
the parallel pencils of light back along their original paths. They are then brought to focus in
the plane of the target graticule and exactor coincident with its intersection. A proportion of
the returned light passes straight through the beam splitter and the return image of the target
cross line is therefore visible through the eyepiece. In this mode, the optical system is
operating as a telescope focused at infinity.
If the reflector is tilted through a small angle the reflected pencils of light will be deflected
by twice the angle of tilt (principle of reflection) & will be brought to focus in the plane of
target graticule but linearly displaced from the actual target cross lines by an amount 2θ* f.
An optical system of an auto collimator consists of a light source, condensers, semi-
reflectors, target wire, collimating lens and reflector apart from microscope eyepiece. A
target wire takes place of the light source into the focal plane of the collimator lenses. Both
the target wire and the reflected image are seen through a microscope eyepiece. The eyepiece
incorporates a scale graduated in 0.05mm interval and a pair of parallel setting wires which
can be adjusted. Movements of wires are effected through a micrometer, one rotation of the
drum equals to one scale division movement of the wires. The instrument is designed to be
rotated through 90 degrees about its longitudinal axis so that the angles in both horizontal &
vertical planes are measured.

Mechanical Measurements & Metrology Laboratory (10MEL47B) 2015-16
Department of ME, CIT, Gubbi Page No. 49
Tabular Column:
SL
No
Bridge Length
(Base length of
the reflector)
Cumulative
Bridge length
(Position of the
reflector)
Micrometer final
reading
(Autocollimator)
Difference
from previous
Position
(X in seconds)
Deviation for
each 100mm
(Ѳ in degrees)
1
2
3
4
Calculation:
Tan = X / 100
X = (100 x Tan ) x 1000 in Microns
Where X = Level at position B with respect to position A
= Angle/Deviation in degrees/ Seconds (1 Degree = 60 Minutes, 1 Minute = 60 Seconds).

Mechanical Measurements & Metrology Laboratory (10MEL47B) 2015-16
Department of ME, CIT, Gubbi Page No. 50
Autocollimators: It is an instrument designed to measure small angular deflections & may
be used in conjunction with a plane mirror or other reflecting surface. An automator is
essentially an infinity telescope & a collimator combined into one instrument. This is an
optical instrument used for the measurement of small angular differences. For small angular
measurements, autocollimator provides a very sensitive and accurate approach. Auto-
collimator is essentially an infinity telescope and a collimator combined into one instrument.
The principle on which this instrument works is given below. O is a point source of light
placed at the principal focus of a collimating lens. The rays of light from O incident on the
lens will now travel as a parallel beam of light. If this beam now strikes a plane reflector
which is normal to the optical axis, it will be reflected back along its own path and refocused
at the same point O. If the plane reflector be now tilted through a small angle 0, then parallel
beam will be deflected through twice this angle, and will be brought to focus at O‘ in the
same plane at a distance x from O. Obviously
OO‘=x=2θ.f, where f is the focal length of the lens.
Applications:
1. To find the control line & alignment of circular & flat surfaces in machining.
2. Alignment of beams & columns in construction buildings / industries, steel
structures.
3. In measuring the straightness, flatness and parallelism, these can be used.
Procedure:
(1) Make the distance of 100mm internal on the work piece.
(2) Set the cross wire so that two cross will coincide.
(3) Set the mirror so that the cross wire will be visible
(4) Move the reflector on next 100mm mark and adjust it to see reflection of cross wire.
(5) Take the reading of reflected crosswire deviated or moved up or down. Measure the
distance between two crosswire.
Result:
The values are analyzed and necessary modification of the surface may be recommended
based on the accuracy required on flatness. If the values observed from the micrometer are
varying linearly then straightness/flatness can be judged.
Mechanical Measurements & Metrology Laboratory (10MEL47B) 2015-16
Department of ME, CIT, Gubbi Page No. 51
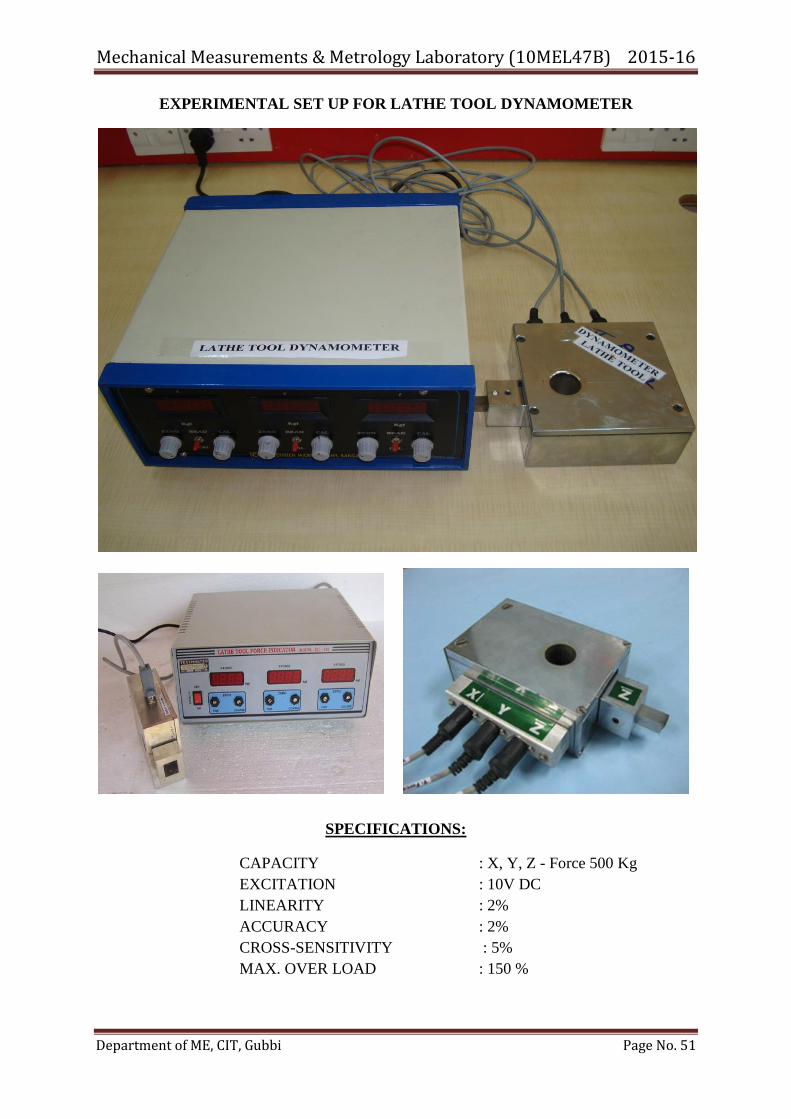
EXPERIMENTAL SET UP FOR LATHE TOOL DYNAMOMETER
SPECIFICATIONS:
CAPACITY : X, Y, Z - Force 500 Kg
EXCITATION : 10V DC
LINEARITY : 2%
ACCURACY : 2%
CROSS-SENSITIVITY : 5%
MAX. OVER LOAD : 150 %
Mechanical Measurements & Metrology Laboratory (10MEL47B) 2015-16
Department of ME, CIT, Gubbi Page No. 52
Experiment No. 9A: Date:
MEASUREMENT OF CUTTING TOOL FORCES BY USING
LATHE TOOL DYNAMOMETER
Aim: To measure the cutting tool forces by using lathe Tool Dynamometer.
Apparatus: Lathe tool dynamometer, digital force indicator, work piece of any material and
lathe machine tool.
Applications:
1. To determine the cutting forces in all the directions in cutting tools mounted on a
machine like lathe, milling etc.
2. In metal forming operations, like to find out the forces on punch press tools.
Theory: The dynamometers being commonly used now-a-days for measuring machining
forces desirably accurately and precisely (both static and dynamic characteristics) are either a
strain gauge type or a piezoelectric type. Strain gauge type dynamometers are inexpensive but
less accurate and consistent, whereas, the piezoelectric type are highly accurate, reliable and
consistent but very expensive for high material cost and stringent construction.
Turning/Lathe Dynamometer: Turning dynamometers may be strain gauge or piezoelectric
type and may be of one, two or three dimensions capable to monitor all of PX, PY and PZ.
For ease of manufacture and low cost, strain gauge type turning dynamometers are widely
used and preferably of 2 – D (dimension) for simpler construction, lower cost and ability to
provide almost all the desired force values. Pictorially shows use of 3 – D turning
dynamometer having piezoelectric transducers inside.
Procedure: Lathe Tool Dynamometer is a cutting force measuring instrument used to
measure the cutting forces coming on the tool tip on the Lathe Machine. The sensor is
designed in such a way that it can be rigidly mounted on the tool post, and the cutting tool
can be fixed to the sensor directly. This feature will help to measure the forces accurately
without lose of the force. The sensor is made of single element with three different wheat
stones strain gauge bridge. Provision is made to fix 1/2" size Tool bit at the front side of the
sensor. The tool tip of the tool bit can be grind to any angle required. Forces in X - Y - Z
directions will be shown individually & simultaneously in three digital Indicators Supplied
Mechanical Measurements & Metrology Laboratory (10MEL47B) 2015-16
Department of ME, CIT, Gubbi Page No. 53
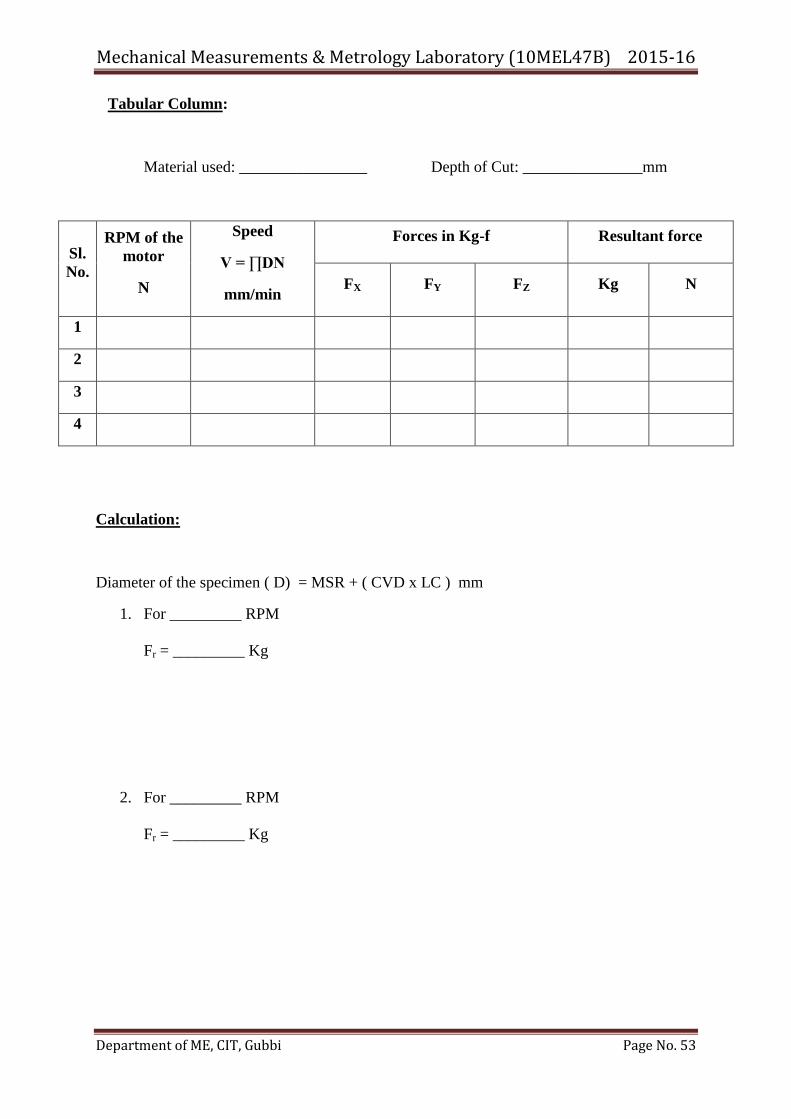
Tabular Column:
Material used: ________________ Depth of Cut: _______________mm
Sl.
No.
RPM of the
motor
N
Speed
V = ∏DN
mm/min
Forces in Kg-f Resultant force
FX FY FZ Kg N
1
2
3
4
Calculation:
Diameter of the specimen ( D) = MSR + ( CVD x LC ) mm
1. For _________ RPM
Fr = _________ Kg
2. For _________ RPM
Fr = _________ Kg
Mechanical Measurements & Metrology Laboratory (10MEL47B) 2015-16
Department of ME, CIT, Gubbi Page No. 54
3. For _________ RPM
Fr = _________ Kg
4. For _________ RPM
Fr = _________ Kg
Result:
The resultant forces are found out for different speeds (V) by lathe tool dynamometer
Mechanical Measurements & Metrology Laboratory (10MEL47B) 2015-16
Department of ME, CIT, Gubbi Page No. 55
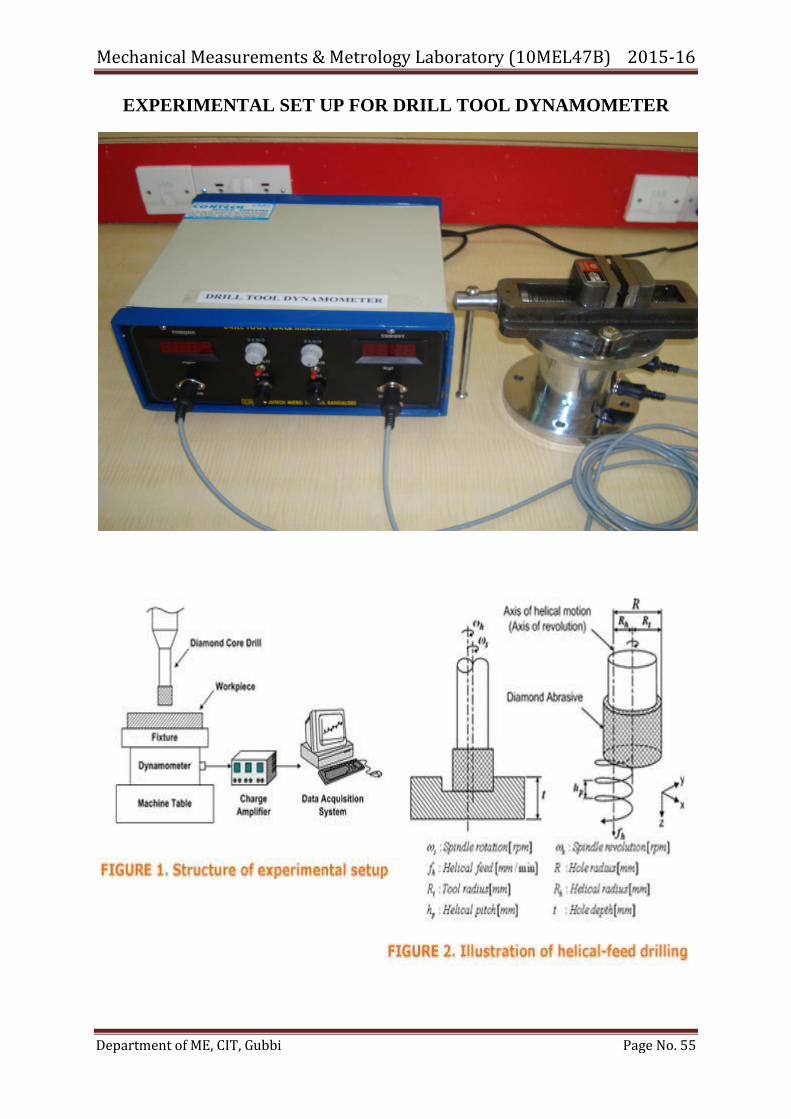
EXPERIMENTAL SET UP FOR DRILL TOOL DYNAMOMETER
Mechanical Measurements & Metrology Laboratory (10MEL47B) 2015-16
Department of ME, CIT, Gubbi Page No. 56
Experiment No. 9B: Date:
MEASUREMENT OF THRUST FORCE AND TORQUE BY
USING DRILL TOOL DYNAMOMETER
Aim: Measurement of ―Torque and Thrust‖ forces by using Drill Tool Dynamometer.
Apparatus: Drill tool dynamometer, digital force indicator, work piece of any material and
drilling machine. .
Theory: Drill tool Dynamometer measures both the Thrust and Torque force of the drill bit
and the torque produced on the work piece. It is used to establish drilling forces, study tool
configuration and lubricant characteristics. This can be bolted directly on the bed of the
machine using slots provided. The specimen is fixed using a vice or fixture.
The drill tool dynamometer provided load as well as torque output. The sensing portion of the
drill dynamometer is bonded with two sets of strain gauge bridges one to sense the load and
the other to sense the torque. Two output sockets are provided for both the forces.
The instrument comprises of a digital displays calibrated to read two forces at a time. When
used with the tool dynamometer keeping both the forces sensing Strain Gauge Bridge
energized simultaneously. It has built in excitation supply with independent null balancing
for respective strain gauge bridge independent signal processing system with digital display
operated on 230V, S, .50c/s A.C. Mains.
SPECIFICATIONS:
Force : Thrust force and Torque.
Range of Force : 200 kg-f thrust 20 kg-m torque
Bridge Resistance : 350 ohms
Bridge voltage : 12 Volts maximum
Applications:
1. To estimate the torque required & tool & thrust force requirements in drilling
operations.
2. In boring and trepanning operations to find torque and thrust force.
Mechanical Measurements & Metrology Laboratory (10MEL47B) 2015-16
Department of ME, CIT, Gubbi Page No. 57
Tabular Column Material used:___________________
Sl. No.
Torque
in
Kg-m
Thrust Force
in
Kg-f
Drill Bit Size
in
mm
1
2
3
4
Calculations:
Mechanical Measurements & Metrology Laboratory (10MEL47B) 2015-16
Department of ME, CIT, Gubbi Page No. 58
Procedure:
1. Fix the drill Tool dynamometer on the work platform post using slot provided on the
dynamometer. Ensure that the object being drilled is mounted on the top center of the drill
tool dynamometer.
2. Plug the power cable to the 230V, 50Hz mains supply.
3. Connect the in put cable to the respectively thrust and Torque axis to the output socket of
the dynamometer the other end to sensor socket on the front panel of the instrument.
4. Place the READ-CAL switch at READ position.
5. Switch ON the instrument by placing the POWER-ON switch at ON position.
6. Adjust the ZERO potentiometer such that the display reads Zero in both the display.
7. Place the READ-CAL switch to CAL position adjust CAL potentiometer until the display
reads the range of force. This operation has to be conducted when the dynamometer does
not have any load applied. This operation is conducted for both forces.
8. Turn back the READ – CAL switch to READ position. Now the instrument is calibrated
to read force values up to calibrated capacity of the dynamometer in respective axis.
Results:
Measured the ―Torque and Thrust‖ forces by using Drill Tool Dynamometer.
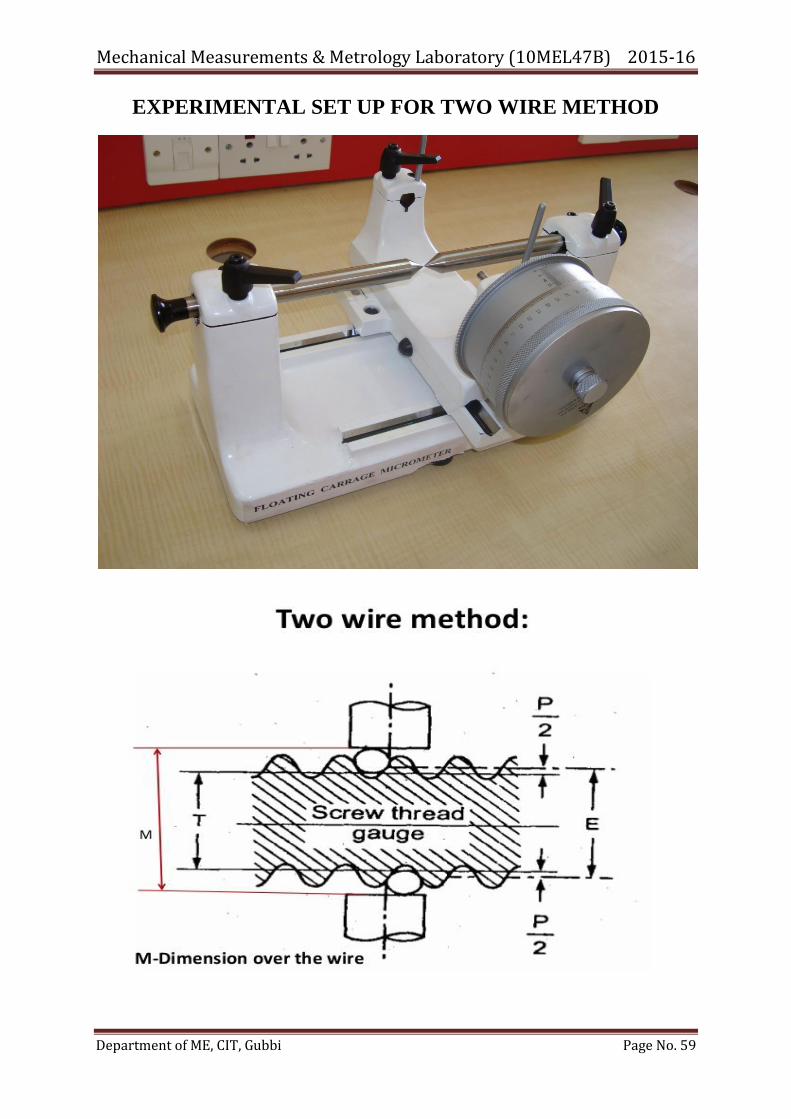
Mechanical Measurements & Metrology Laboratory (10MEL47B) 2015-16
Department of ME, CIT, Gubbi Page No. 59
EXPERIMENTAL SET UP FOR TWO WIRE METHOD
Mechanical Measurements & Metrology Laboratory (10MEL47B) 2015-16
Department of ME, CIT, Gubbi Page No. 60
Experiment No. 10: Date:
MEASUREMENT OF SCREW THREAD PARAMETERS USING TWO
WIRE METHOD BY FLOATING CARRIAGE MICROMETER
Aim: To measure the screw thread parameters using two wire method by Floating carriage
micrometer.
Apparatus: Micrometer, micrometer stand, a set of two wires, pitch gauge and Screw thread
specimen.
Procedure:
1. Fix the given screw thread specimen to the arrangement block.
2. Measure the pitch of the given thread using pitch gauges and also note down the angle of
the thread based on Metric or With Worth.
3. Measure the maximum diameter of the screw thread using micrometer.
4. Calculate the best wire to be used by using the given equation.
5. Consider the available wires and fix the two wires to one end on micrometer Anvil and one
wire towards another anvil.
6. Measure the distance over the wire properly by using micrometer.
7. Calculate the effective diameter of the screw thread.
8. Find out the error in effective diameter of the screw thread.
Observations:
1. Least Count of the Micrometer = _____________mm.
2. Initial error in the micrometer = _____________mm.
3. Pitch of the thread p = _____________mm.
4. Best size of the wire used d = ____________mm.
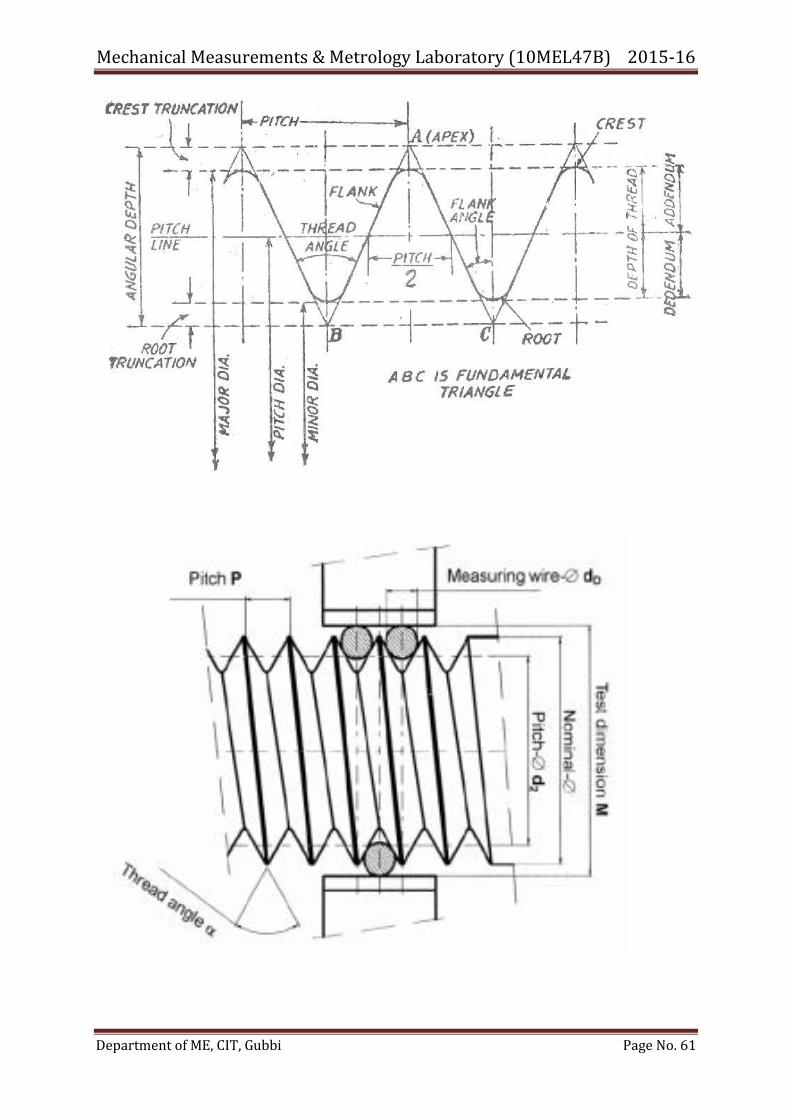
Mechanical Measurements & Metrology Laboratory (10MEL47B) 2015-16
Department of ME, CIT, Gubbi Page No. 61
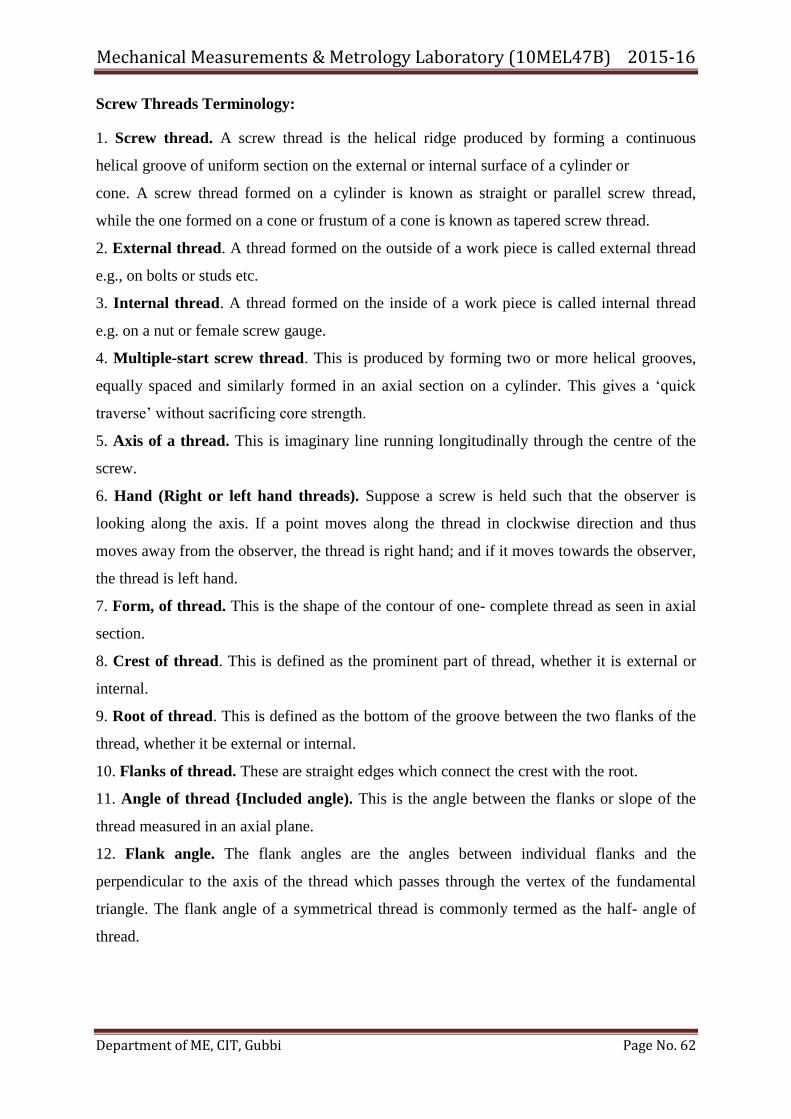
Mechanical Measurements & Metrology Laboratory (10MEL47B) 2015-16
Department of ME, CIT, Gubbi Page No. 62
Screw Threads Terminology:
1. Screw thread. A screw thread is the helical ridge produced by forming a continuous
helical groove of uniform section on the external or internal surface of a cylinder or
cone. A screw thread formed on a cylinder is known as straight or parallel screw thread,
while the one formed on a cone or frustum of a cone is known as tapered screw thread.
2. External thread. A thread formed on the outside of a work piece is called external thread
e.g., on bolts or studs etc.
3. Internal thread. A thread formed on the inside of a work piece is called internal thread
e.g. on a nut or female screw gauge.
4. Multiple-start screw thread. This is produced by forming two or more helical grooves,
equally spaced and similarly formed in an axial section on a cylinder. This gives a ‗quick
traverse‘ without sacrificing core strength.
5. Axis of a thread. This is imaginary line running longitudinally through the centre of the
screw.
6. Hand (Right or left hand threads). Suppose a screw is held such that the observer is
looking along the axis. If a point moves along the thread in clockwise direction and thus
moves away from the observer, the thread is right hand; and if it moves towards the observer,
the thread is left hand.
7. Form, of thread. This is the shape of the contour of one- complete thread as seen in axial
section.
8. Crest of thread. This is defined as the prominent part of thread, whether it is external or
internal.
9. Root of thread. This is defined as the bottom of the groove between the two flanks of the
thread, whether it be external or internal.
10. Flanks of thread. These are straight edges which connect the crest with the root.
11. Angle of thread {Included angle). This is the angle between the flanks or slope of the
thread measured in an axial plane.
12. Flank angle. The flank angles are the angles between individual flanks and the
perpendicular to the axis of the thread which passes through the vertex of the fundamental
triangle. The flank angle of a symmetrical thread is commonly termed as the half- angle of
thread.
Mechanical Measurements & Metrology Laboratory (10MEL47B) 2015-16
Department of ME, CIT, Gubbi Page No. 63
13. Pitch. The pitch of a thread is the distance, measured parallel to the axis of the thread,
between corresponding points on adjacent thread forms in the same axial plane and on the
same side of axis. The basic pitch is equal to the lead divided by the number of thread starts.
On drawings of thread sections, the pitch is shown as the distance from the centre of one
thread crest to the centre of the next, and this representation is correct for single start as well
as multi-start threads.
14. Lead. Lead is the axial distance moved by the threaded part, when it is given one
complete revolution about its axis with respect to a fixed mating thread. It is necessary to
distinguish between measurements of lead from measurement of pitch, as uniformity of pitch
measurement does not assure uniformity of lead. Variations in either lead or pitch cause the
functional or virtual diameter of thread to differ from the pitch diameter.
15. Thread per inch. This is the reciprocal of the pitch in inches.
16. Lead angle. On a straight thread, lead angle is the angle made by the helix of the thread
at the pitch line with plane perpendicular to the axis. The angle is measured in an axial plane.
17. Helix angle. On straight thread, the helix angle is the angle made by the helix of the
thread at the pitch line with the axis. The angle is measured in an axial plane.
18. Depth of thread. This is the distance from the crest or tip of the thread to the root of the
thread measured perpendicular to the longitudinal axis or this could be defined as the distance
measured radially between the major and minor cylinders.
19. Axial thickness. This is the distance between the opposite faces of the same thread
measured on the pitch cylinder in a direction parallel to the axis of thread.
20. Fundamental triangle. This is found by extending the flanks and joining the points B
and C. Thus in Fig. 13.2, triangle ABC is referred to as fundamental triangle. Here BC=pitch
and the vertical height of the triangle is called the angular or theoretical depth. The point A is
the apex of the triangle ABC.
21. Truncation. A thread is sometimes truncated at the crest or at the root or at both crest and
root. The truncation at the crest is the radial distance from the crest to the nearest apex of the
fundamental triangle. Similarly the truncation at the root is the radial distance from the root to
the nearest apex.
22. Addendum. For an external thread, this is defined as the radial distance between the
major and pitch cylinders. For an internal thread this is the radial distance between the minor
and pitch cylinders.
Mechanical Measurements & Metrology Laboratory (10MEL47B) 2015-16
Department of ME, CIT, Gubbi Page No. 64
23. Dedendum. This is the radial distance between the pitch and minor cylinder for external
thread, and for internal thread, this is the radial distance between the major and pitch
cylinders.
24. Major diameter. In case of a straight thread, this is the diameter of the major cylinder
(imaginary cylinder, co-axial with the screw, which just touches the crests of an external
thread or the root of an internal thread). It is often referred to as the outside diameter, crest
diameter or full diameter of external threads.
25. Minor diameter. In case of straight thread, this is the diameter of the minor cylinder (an
imaginary cylinder, co-axial with the screw which just touches the roots of an external thread
or the crest of an internal thread). It is often referred to as the root diameter or cone diameter
of external threads.
26. Effective diameter or pitch diameter. In case of straight thread, this is the diameter of
the pitch cylinder (the imaginary‘ cylinder which is co-axial with the axis of the screw, and
intersects the flank of the threads in such a way as to make the width of threads and width of
the spaces between the threads equal). If the pitch cylinder be imagined as generated by a
straight line parallel to the axis of screw, that straight line is then referred to as the pitch line.
Along the pitch line, the widths of the threads and the widths of the spaces are equal on a
perfect thread. This is the most important dimension at it decides the quality of the fit
between the screw and the nut.
27. Functional (virtual) diameter. For an external or internal thread, this is the pitch
diameter of the enveloping thread of perfect pitch, lead and flank angles having full depth of
engagement but clear at crests and roots. This is defined over a specified length of thread.
This may be greater than the simple effective diameter by an amount due to errors in pitch
and angle of thread. The virtual diameter being the modified effective diameter by pitches
and angle errors, is the most important single dimension of a screw thread gauge. In the case
of taper screw thread, the cone angle of taper, for measurement of effective diameter, and
whether pitch is measured along the axis or along the pitch cone generator also need to be
specified.
Applications of Measurement of screw thread parameters using two wire methods
1. By using floating carriage micrometer the minor, major and effective diameters are
to be determined.
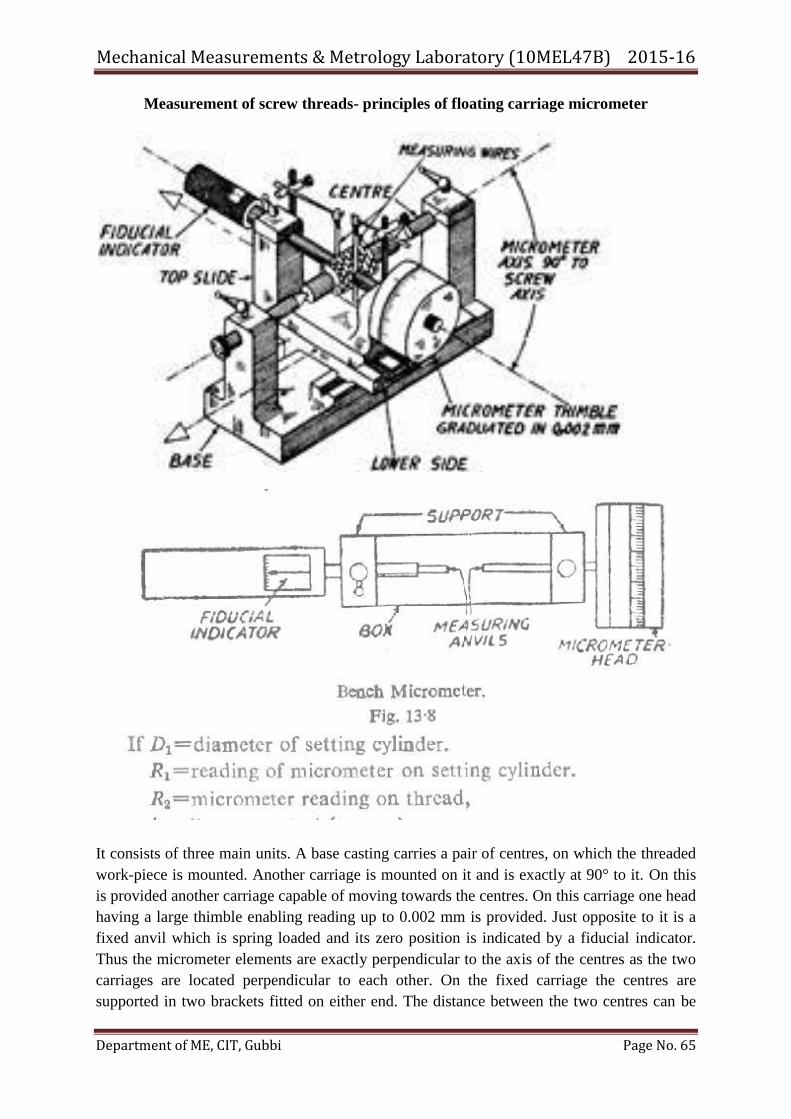
Mechanical Measurements & Metrology Laboratory (10MEL47B) 2015-16
Department of ME, CIT, Gubbi Page No. 65
Measurement of screw threads- principles of floating carriage micrometer
It consists of three main units. A base casting carries a pair of centres, on which the threaded
work-piece is mounted. Another carriage is mounted on it and is exactly at 90° to it. On this
is provided another carriage capable of moving towards the centres. On this carriage one head
having a large thimble enabling reading up to 0.002 mm is provided. Just opposite to it is a
fixed anvil which is spring loaded and its zero position is indicated by a fiducial indicator.
Thus the micrometer elements are exactly perpendicular to the axis of the centres as the two
carriages are located perpendicular to each other. On the fixed carriage the centres are
supported in two brackets fitted on either end. The distance between the two centres can be
Mechanical Measurements & Metrology Laboratory (10MEL47B) 2015-16
Department of ME, CIT, Gubbi Page No. 66
adjusted depending upon the length of tie threaded job. After job is fitted between the centres
the second carriage is adjusted in correct position to take measurements and is located in
position, the third carriage is then moved till the fiducial indicator is against the set point.
The readings are noted from the thimble head. It is now obvious that the axis of the indicator
and micrometer head spindle is same and is perpendicular to the line of two centres. The
indicator is specially designed for this class of work and has only one index line, against
which the pointer is always to be set. This ensures constant measuring pressure for all
readings. Sufficient friction is provided by the conical pegs to restrain the movement of
carriage along the line of centres. The upper carriage is free to float on balls and enables
micrometer readings to be taken on a diameter without restraint. Squareness of the
micrometer to the line of centre can be adjusted by rotating the pegs in the first carriage
which is made eccentric in its mounting. Above the micrometer carriage, two supports are
provided for supporting the wires and Vee pieces for measurement of effective diameter etc.
(i) Measurement of Major Diameter.
For the measurement of major diameter of external threads, a good quality hand micrometer
is quite suitable. In taking readings, a light pressure must be used as the anvils make contact
with the gauge at points only and otherwise the errors due to compression can be introduced.
It is, however, also desirable to check the micrometer reading on a cylindrical standard of
approximately the same size, so that the zero error etc., might not come into picture. For
greater accuracy and convenience, the major diameter is measured by bench micrometer. This
instrument was designed by N.P.L. to estimate some deficiencies inherent in the normal hand
micrometer. It uses constant measuring pressure and with this machine the error due to pitch
error in the micrometer thread is avoided. In order that all measurements be made at the same
pressure, a fiducial indicator is used in place of the fixed anvil. In this machine there is no
provision for mounting the work piece between the centres and it is to be held in hand. This is
so, because, generally the centres of the work piece are not true with its diameter. This
machine is used as a comparator in order to avoid any pitch errors of micrometers, zero error
setting etc. A calibrated setting cylinder is used as the setting standard. The advantage of
using cylinder as setting standard and not slip gauges etc., is that it gives greater similarity of
contact at the anvils. The diameter of the setting cylinder must be nearly same as the major
diameter. The cylinder is held and the reading of the micrometer is noted down. This is then
replaced by threaded work piece and again micrometer reading is noted for the same reading
of fiducial indicator. Thus, if the size of cylinder is approaching, that of major diameter, then
for a given reading the micrometer thread is used over a short length of travel and any pitch
errors it contains are virtually eliminated.
Then major diameter=D1+ (R2−R1). In order- to determine the amount of taper, the readings
should‘ be taken at various positions along the thread and to detect the ovality, two or three
readings must be taken at one plane in angular positions.
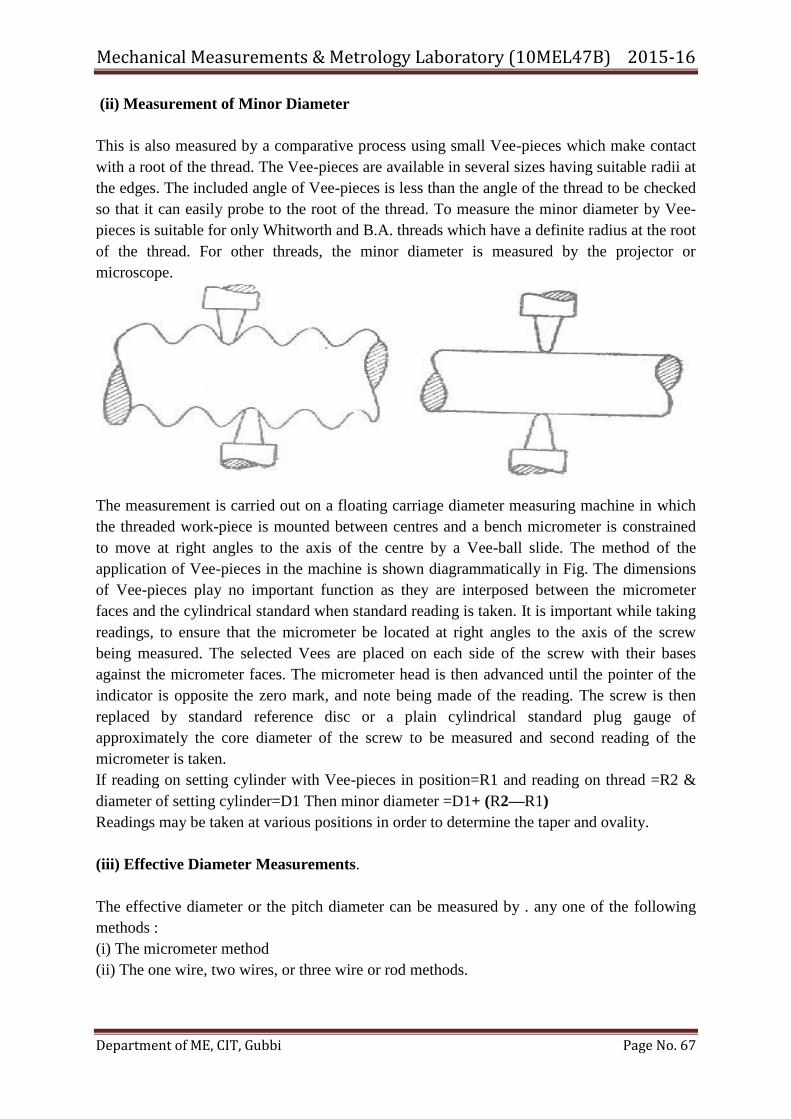
Mechanical Measurements & Metrology Laboratory (10MEL47B) 2015-16
Department of ME, CIT, Gubbi Page No. 67
(ii) Measurement of Minor Diameter
This is also measured by a comparative process using small Vee-pieces which make contact
with a root of the thread. The Vee-pieces are available in several sizes having suitable radii at
the edges. The included angle of Vee-pieces is less than the angle of the thread to be checked
so that it can easily probe to the root of the thread. To measure the minor diameter by Vee-
pieces is suitable for only Whitworth and B.A. threads which have a definite radius at the root
of the thread. For other threads, the minor diameter is measured by the projector or
microscope.
The measurement is carried out on a floating carriage diameter measuring machine in which
the threaded work-piece is mounted between centres and a bench micrometer is constrained
to move at right angles to the axis of the centre by a Vee-ball slide. The method of the
application of Vee-pieces in the machine is shown diagrammatically in Fig. The dimensions
of Vee-pieces play no important function as they are interposed between the micrometer
faces and the cylindrical standard when standard reading is taken. It is important while taking
readings, to ensure that the micrometer be located at right angles to the axis of the screw
being measured. The selected Vees are placed on each side of the screw with their bases
against the micrometer faces. The micrometer head is then advanced until the pointer of the
indicator is opposite the zero mark, and note being made of the reading. The screw is then
replaced by standard reference disc or a plain cylindrical standard plug gauge of
approximately the core diameter of the screw to be measured and second reading of the
micrometer is taken.
If reading on setting cylinder with Vee-pieces in position=R1 and reading on thread =R2 &
diameter of setting cylinder=D1 Then minor diameter =D1+ (R2—R1)
Readings may be taken at various positions in order to determine the taper and ovality.
(iii) Effective Diameter Measurements.
The effective diameter or the pitch diameter can be measured by . any one of the following
methods :
(i) The micrometer method
(ii) The one wire, two wires, or three wire or rod methods.
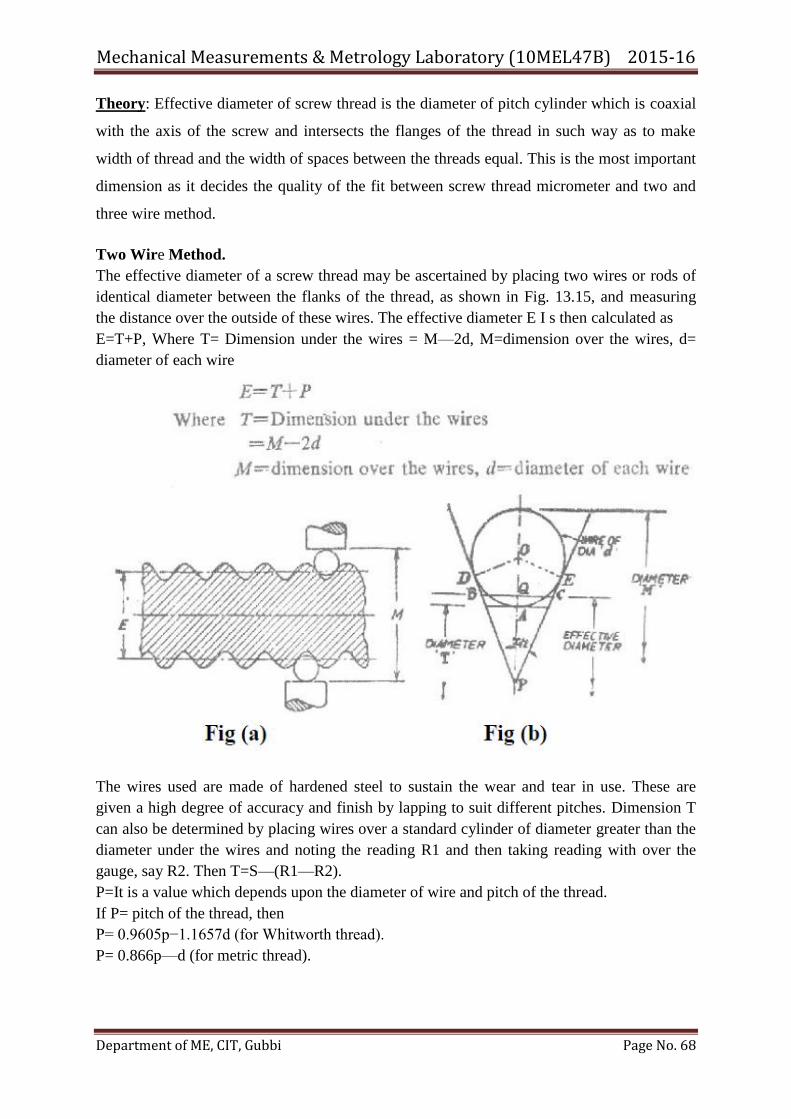
Mechanical Measurements & Metrology Laboratory (10MEL47B) 2015-16
Department of ME, CIT, Gubbi Page No. 68
Theory: Effective diameter of screw thread is the diameter of pitch cylinder which is coaxial
with the axis of the screw and intersects the flanges of the thread in such way as to make
width of thread and the width of spaces between the threads equal. This is the most important
dimension as it decides the quality of the fit between screw thread micrometer and two and
three wire method.
Two Wire Method.
The effective diameter of a screw thread may be ascertained by placing two wires or rods of
identical diameter between the flanks of the thread, as shown in Fig. 13.15, and measuring
the distance over the outside of these wires. The effective diameter E I s then calculated as
E=T+P, Where T= Dimension under the wires = M—2d, M=dimension over the wires, d=
diameter of each wire
The wires used are made of hardened steel to sustain the wear and tear in use. These are
given a high degree of accuracy and finish by lapping to suit different pitches. Dimension T
can also be determined by placing wires over a standard cylinder of diameter greater than the
diameter under the wires and noting the reading R1 and then taking reading with over the
gauge, say R2. Then T=S—(R1—R2).
P=It is a value which depends upon the diameter of wire and pitch of the thread.
If P= pitch of the thread, then
P= 0.9605p−1.1657d (for Whitworth thread).
P= 0.866p—d (for metric thread).
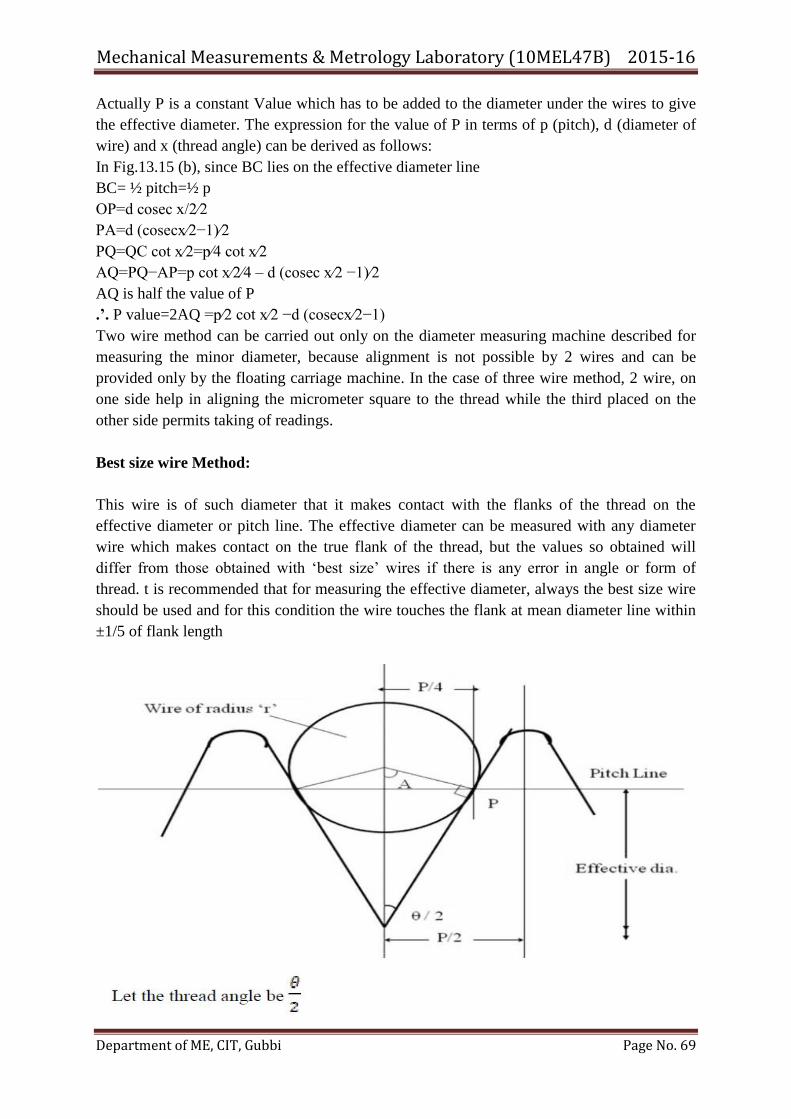
Mechanical Measurements & Metrology Laboratory (10MEL47B) 2015-16
Department of ME, CIT, Gubbi Page No. 69
Actually P is a constant Value which has to be added to the diameter under the wires to give
the effective diameter. The expression for the value of P in terms of p (pitch), d (diameter of
wire) and x (thread angle) can be derived as follows:
In Fig.13.15 (b), since BC lies on the effective diameter line
BC= ½ pitch=½ p
OP=d cosec x/2∕2
PA=d (cosecx∕2−1)∕2
PQ=QC cot x∕2=p∕4 cot x∕2
AQ=PQ−AP=p cot x∕2∕4 – d (cosec x∕2 −1)∕2
AQ is half the value of P
.‘. P value=2AQ =p∕2 cot x∕2 −d (cosecx∕2−1)
Two wire method can be carried out only on the diameter measuring machine described for
measuring the minor diameter, because alignment is not possible by 2 wires and can be
provided only by the floating carriage machine. In the case of three wire method, 2 wire, on
one side help in aligning the micrometer square to the thread while the third placed on the
other side permits taking of readings.
Best size wire Method:
This wire is of such diameter that it makes contact with the flanks of the thread on the
effective diameter or pitch line. The effective diameter can be measured with any diameter
wire which makes contact on the true flank of the thread, but the values so obtained will
differ from those obtained with ‗best size‘ wires if there is any error in angle or form of
thread. t is recommended that for measuring the effective diameter, always the best size wire
should be used and for this condition the wire touches the flank at mean diameter line within
±1/5 of flank length
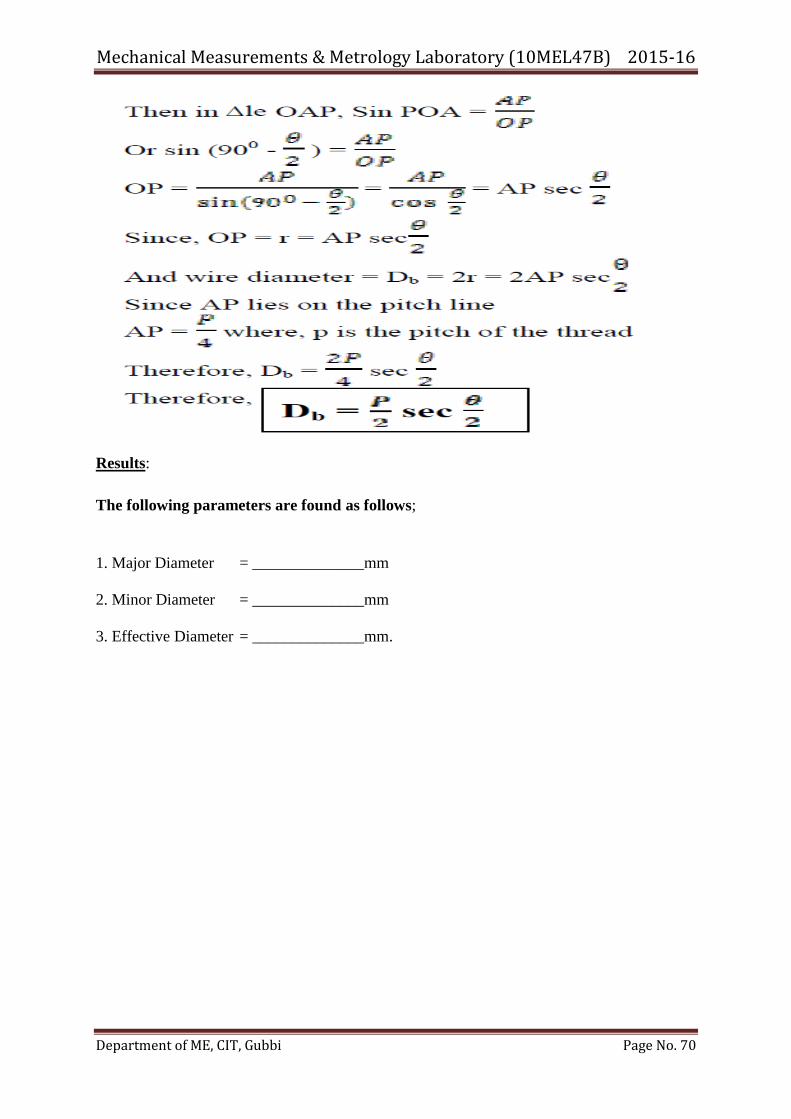
Mechanical Measurements & Metrology Laboratory (10MEL47B) 2015-16
Department of ME, CIT, Gubbi Page No. 70
Results:
The following parameters are found as follows;
1. Major Diameter = ______________mm
2. Minor Diameter = ______________mm
3. Effective Diameter = ______________mm.
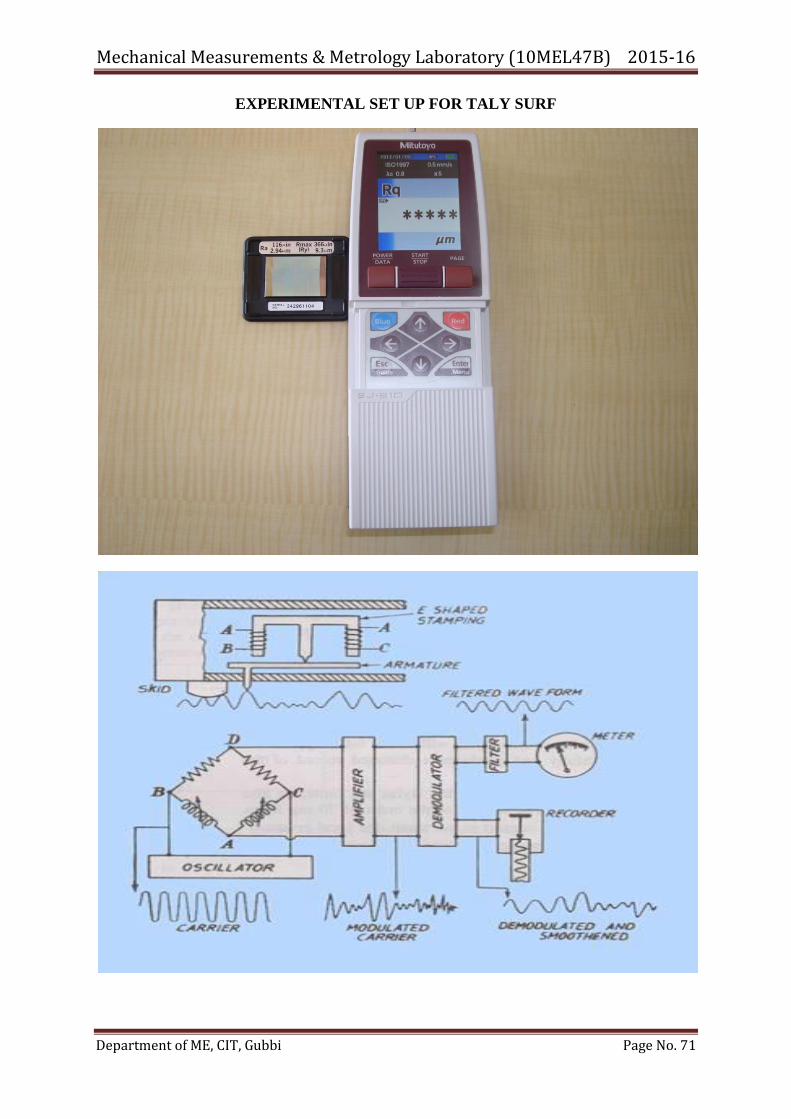
Mechanical Measurements & Metrology Laboratory (10MEL47B) 2015-16
Department of ME, CIT, Gubbi Page No. 71
EXPERIMENTAL SET UP FOR TALY SURF
Mechanical Measurements & Metrology Laboratory (10MEL47B) 2015-16
Department of ME, CIT, Gubbi Page No. 72
Experiment No. 11A: Date:
MEASUREMENT OF SURFACE ROUGHNESS (TALYSURF)
Aim: To measure surface roughness parameter as per ISO Standards
Apparatus: Mitituyo make surface roughness tester, Calibrated specimen, Surface plate,
Specimen
Procedure:
1. Connect Ac adopter to the measuring instrument & Switch on the power supply
2. Attach the drive detector unit & connect to all the cable connection as shown when mounting the
detector to the drive unit, take care not to apply excessive force to the drive unit.
3. Adjust or modify the measurement condition such as sample length, number samples, Standard
required for the measurement
4. Calibrate the instrument using standard calibration piece
5. Carefully place the detector on the work piece. Care should be taken to see that work piece &
detector are aligned properly
6. Press the start button to measure the work piece & result are displaced on the console
7. Press print button to take the print out.
Applications:
1. Taly surf is the dynamic electronic instrument used on the factory floor as well as
in the laboratory.
2. To find out the surface roughness of the machines & components.
3. To check the accuracy of the cast iron, granites used in workshops for checking
the surface finish & flatness.
Tabular column:
Sl. no Specimen Ra value Rz value Rq value
1
2
3
4
Results: Surface roughness checked for different specimens by Tally surf.
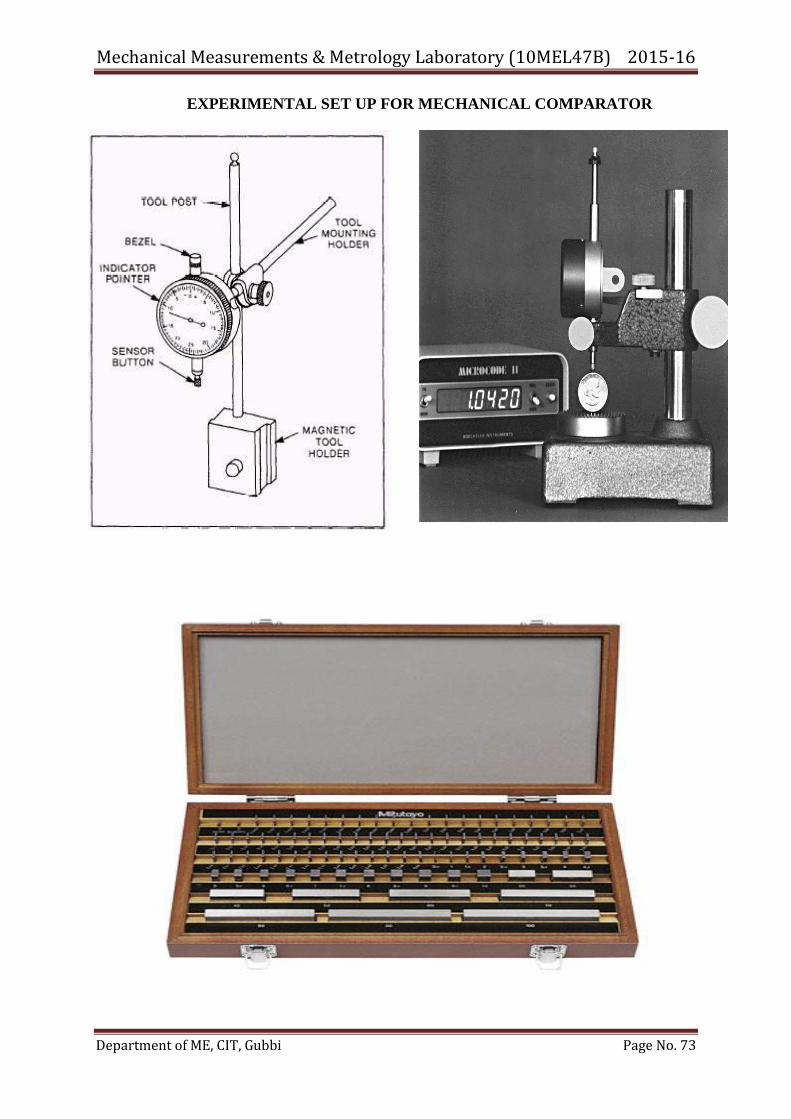
Mechanical Measurements & Metrology Laboratory (10MEL47B) 2015-16
Department of ME, CIT, Gubbi Page No. 73
EXPERIMENTAL SET UP FOR MECHANICAL COMPARATOR
Mechanical Measurements & Metrology Laboratory (10MEL47B) 2015-16
Department of ME, CIT, Gubbi Page No. 74
Experiment No. 11B: Date:
MEASUREMENT OF SURFACE ROUGHNESS USING MECHANICAL
COMPARATOR
Aim: To measure the surface roughness of the components by using mechanical comparator
(dial gauge) & also Acceptance/Rejections of the specimen test will be conducted.
To compare the dimensions of given mass produced product with designed tolerance standard
by using mechanical comparator.
Apparatus: 20 No‘s of product to be tested, Mechanical comparator with dial gauge
and slip gauges for setting standard.
Theory:
Comparator is the instrument used to compare the unknown dimension with one of the
reference standard known as designed specification. The purpose of comparator is to detect and
display the small difference between the unknown and the standard. The deviation in size is
detected as the displacement of sensing device. The important and essential function of the
instatement is to magnify the small input to displacement. The magnification required is greater
than 1000: 1. The relationship between the input and output affected by the readings in the
direction of input and this reveals that the movement should not have any backlash. The major
disadvantage of mechanical comparator is that, it is very difficult to recompute the arrangement for
the adjustment of magnification. Dial gauge is one of the Mechanical components which are used in
laboratories. It has contact tip, graduated circular scale, plunger and clamp. Dial gauge works on the
rack and pinion principle.
Applications:
1. Mechanical comparators are most widely used tools of dimensional measurements
in metal – working production.
2. These are instruments for comparative measurements where the linear movement
of a precision spindle is amplified and displayed on a dial or digital display.
3. Measurements of heights & levels by using combination of surface plate & dial
gauges. Use of measurement by accurate slip gauges
4. In mechanical industries, acceptance & rejections of the components will be
checked by the mechanical comparators.
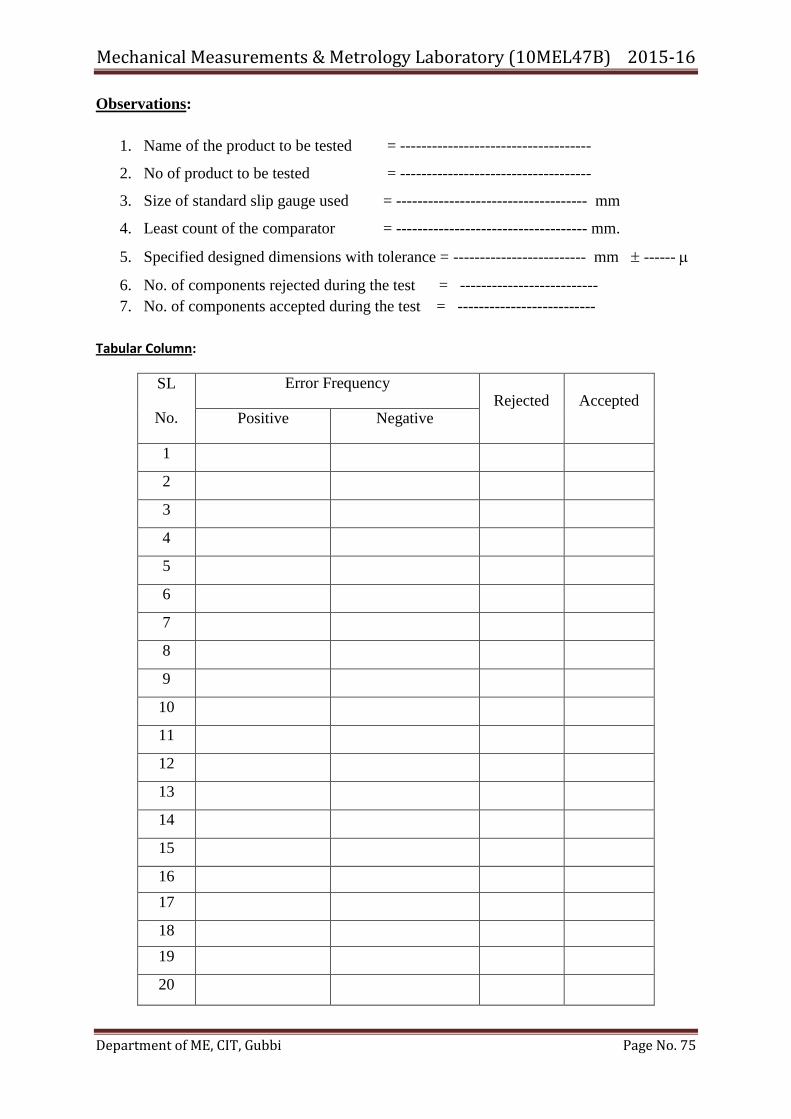
Mechanical Measurements & Metrology Laboratory (10MEL47B) 2015-16
Department of ME, CIT, Gubbi Page No. 75
Observations:
1. Name of the product to be tested = ------------------------------------
2. No of product to be tested = ------------------------------------
3. Size of standard slip gauge used = ------------------------------------ mm
4. Least count of the comparator = ------------------------------------ mm.
5. Specified designed dimensions with tolerance = ------------------------- mm ------
6. No. of components rejected during the test = --------------------------
7. No. of components accepted during the test = --------------------------
Tabular Column:
SL
No.
Error Frequency Rejected Accepted
Positive Negative
1
2
3
4
5
6
7
8
9
10
11
12
13
14
15
16
17
18
19
20
Mechanical Measurements & Metrology Laboratory (10MEL47B) 2015-16
Department of ME, CIT, Gubbi Page No. 76
Procedure
1. Clean the sensors of the comparator and the surface table of the comparator.
2. Note down the actual measurement of each product by micrometer.
3. Slip gauge of specified basic size is placed on the surfaces of comparator table and here slip gauge
serves as a setting standard have specified size.
4. Adjust the tolerance read needles to the specified size on either side of the zero reading by using
screw knobs provided on the comparator.
5. Adjust the comparator needle, which is reading actual dimension to zero reading by using
Corresponding knobs (vertical movement)
7. After initial adjustment of comparator remove the setting standard.
8. Place the given product for test in-between the sensors and surface of
Comparator table.
9. Note down the readings of dial indicator provided in comparator. If the readings are within the
tolerance needles the product can be accepted if it lies outside the tolerance Needle the product can be
rejected.
10. The product following within certain tolerance ranges are grouped together according to
Sequence of test and tabulated in the tabular column.
11. The above procedure is repeated for all products.
Results:
The given components are tested by mechanical comparator or a dial gauge by using slip
gauges as standards.
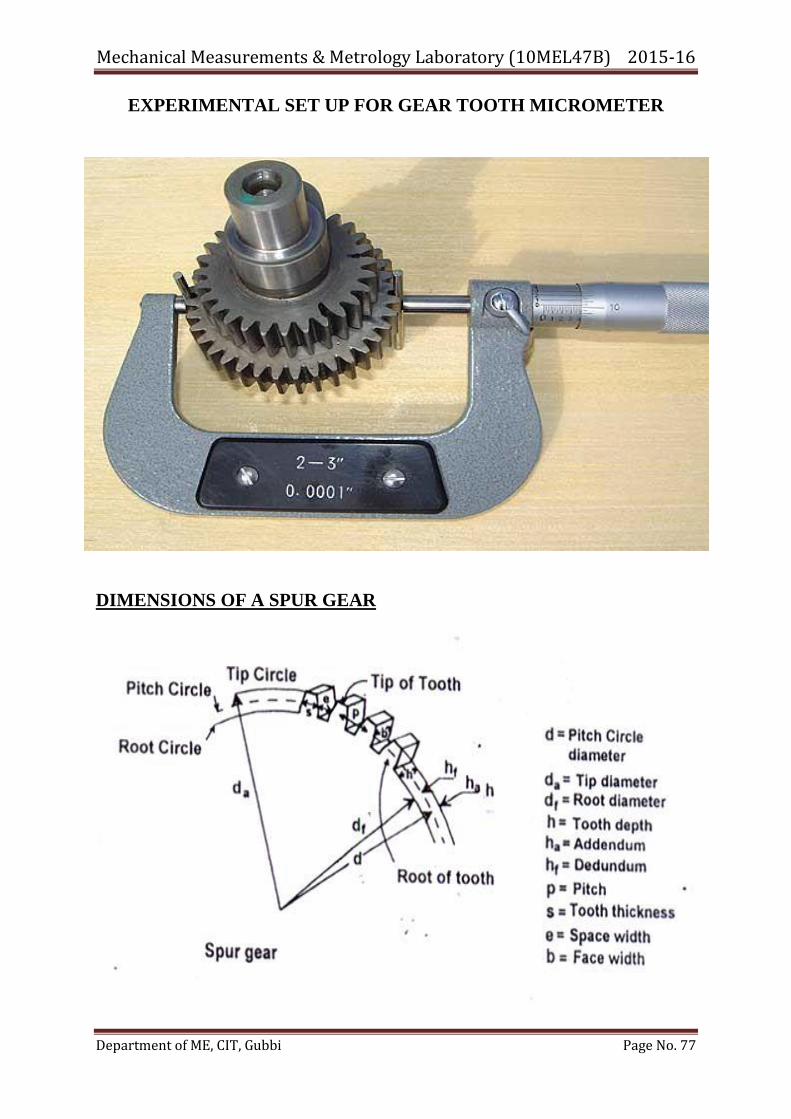
Mechanical Measurements & Metrology Laboratory (10MEL47B) 2015-16
Department of ME, CIT, Gubbi Page No. 77
EXPERIMENTAL SET UP FOR GEAR TOOTH MICROMETER
DIMENSIONS OF A SPUR GEAR
Mechanical Measurements & Metrology Laboratory (10MEL47B) 2015-16
Department of ME, CIT, Gubbi Page No. 78
Experiment No. 12: Date:
MEASUREMENT OF GEAR TOOTH PROFILE BY USING
GEAR TOOTH MICROMETER
Aim: To determine the actual and theoretical tooth thickness of a gear by using Gear tooth
micrometer.
Apparatus: Gear Tooth Micrometer, Spur gear preferably 50mm to 75 mm in dia. etc.
Theory:
The measurement of element of Spur gear depend on the geometrical principle of the
involutes gear that the distance between parallel lines embracing several teeth is constant and
is equal to the are on the base circle intersected by the extreme points.
The principle will naturally be strictly true only for a gear, which is perfect on tooth from,
pitch concentricity etc. Therefore select precision gear, preferably ground and known to have
only small errors in these elements. In measurements of gear tooth the following elements are
checked.
Pitch circle diameter: It is the diameter of the pitch circle. Which by pure rolling action
would produce the same motion as the toothed gear? The size of the gear usually specified
by Pitch circle diameter
Module: It is the ratio of the Pitch circle diameter in a millimetre to the number of teeth or it
is the length of the Pitch circle diameter per tooth. It is usually denoted by ‗m‘.
Addendum: It is the radial distance of the tooth from the pitch circle to the top or tip of the
tooth.
Dedendum: It is the radial distance of the tooth from the pitch circle to the bottom of the
tooth.
Tooth thickness: It is the width of the tooth measured along the pitch circle
Blank diameter: This is the diameter of the blank from which gear is cut.
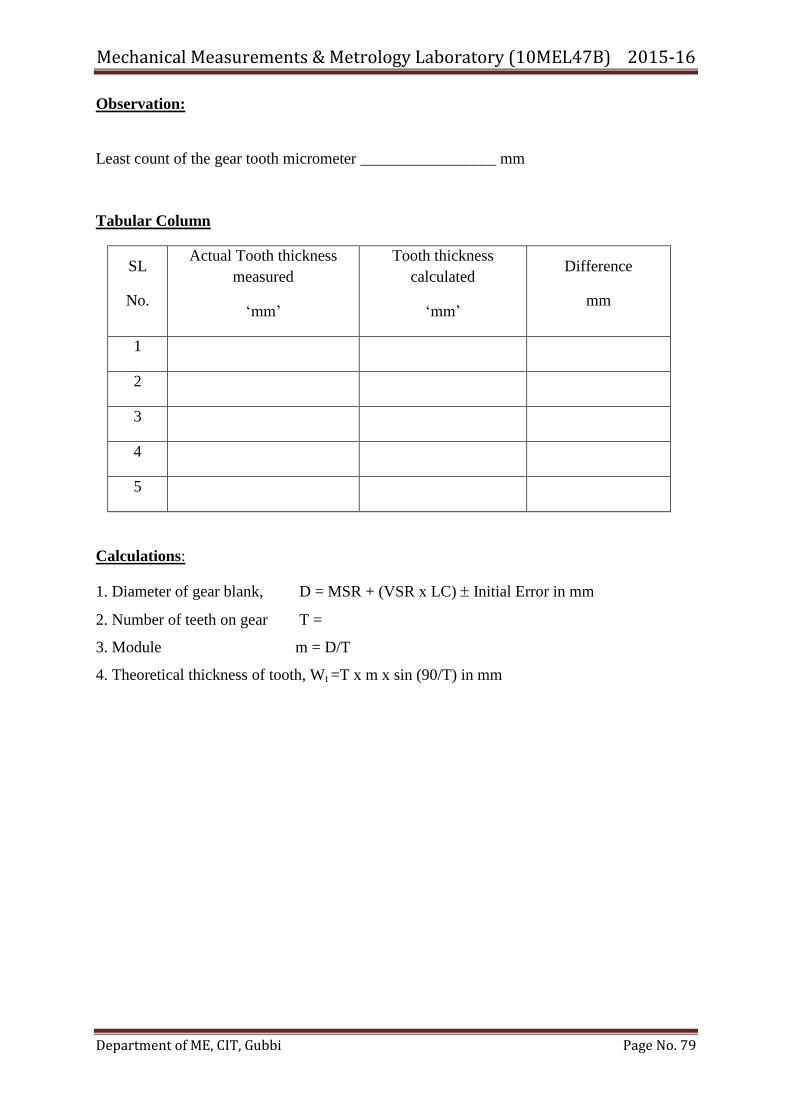
Mechanical Measurements & Metrology Laboratory (10MEL47B) 2015-16
Department of ME, CIT, Gubbi Page No. 79
Observation:
Least count of the gear tooth micrometer _________________ mm
Tabular Column
SL
No.
Actual Tooth thickness
measured
‗mm‘
Tooth thickness
calculated
‗mm‘
Difference
mm
1
2
3
4
5
Calculations:
1. Diameter of gear blank, D = MSR + (VSR x LC) Initial Error in mm
2. Number of teeth on gear T =
3. Module m = D/T
4. Theoretical thickness of tooth, Wt =T x m x sin (90/T) in mm
Mechanical Measurements & Metrology Laboratory (10MEL47B) 2015-16
Department of ME, CIT, Gubbi Page No. 80
Applications:
1. Gear tooth vernier is an instrument & is used for measuring pitch line tooth thickness. But
this does not give a very accurate result, so base tangent length method has been used to away
that difficulties by measuring the span of convenient number of teeth between the two
parallel planes, which are tangential to the opposite tooth flanks. The span length is a tangent
to the base circle. This distance is known as base tangent length.
2. Gear tooth micrometer
3. In finding out the dimensions of the gears & gear terminologies like pitch circle, addendum
& deddundum etc.
4. To find out the involute profiles of hypoidal gears, helical, bevel, warm & planetary gears.
Procedure:
1. Note down the least count of the gear tooth micrometer
2. Measure the diameter of gear blank using vernier calliper also count the number of teeth
on the gear blank.
3. Calculate the addendum of the gear tooth and fix the same dimension in gear tooth
micrometer
4. Measure the same parameters for different teeth.
5. Take the average of tooth thickness.
Results:
The actual and theoretical tooth thickness of a gear is calculated by using Gear tooth
micrometer.
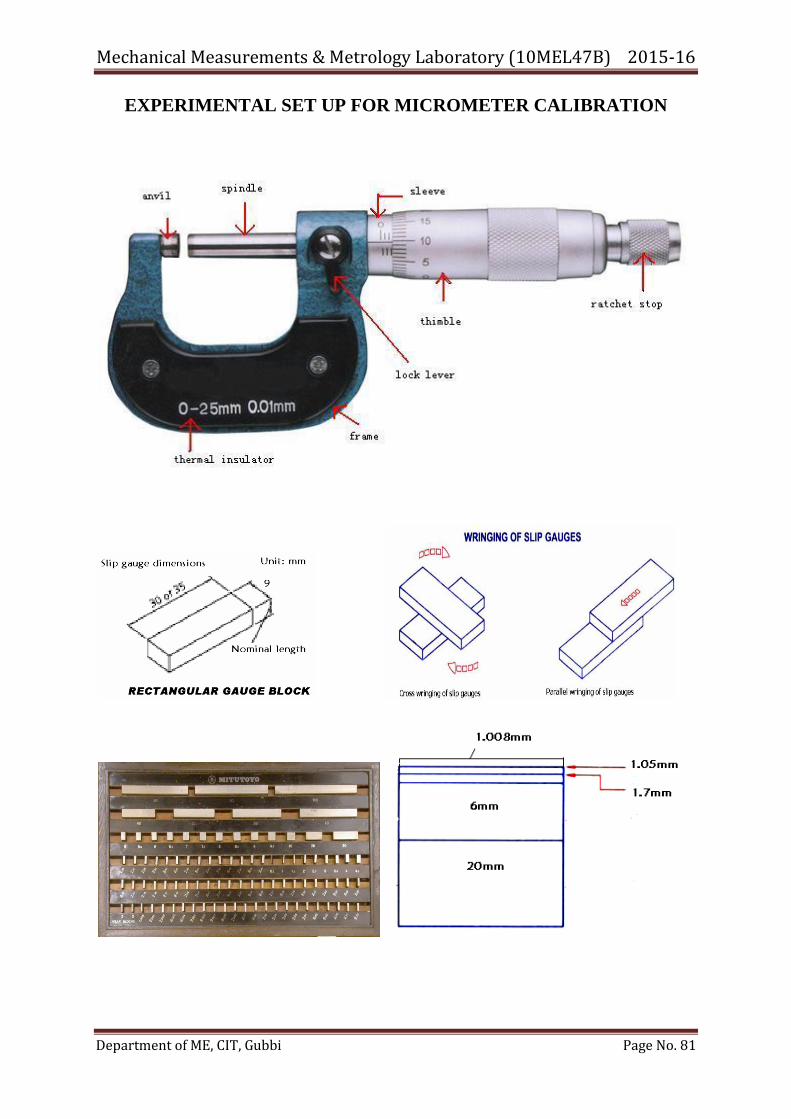
Mechanical Measurements & Metrology Laboratory (10MEL47B) 2015-16
Department of ME, CIT, Gubbi Page No. 81
EXPERIMENTAL SET UP FOR MICROMETER CALIBRATION
Mechanical Measurements & Metrology Laboratory (10MEL47B) 2015-16
Department of ME, CIT, Gubbi Page No. 82
Experiment No: 13 Date:
CALIBRATION OF MICROMETER USING SLIP GAUGES
Aim: To calibrate the micrometer using slip gauges
Apparatus: Micrometer, slip gauges
Objectives:
Students will be able to know 1. To know the use and working of slip gauges 2. To know the
classification and working of slip gauges
Theory: Slip gauges are end standards used in linear measurements. They are used in
workshop for work where a tolerance as low as 0.001mm is needed. Slip gauges were
invented by Swedish engineer, C.E. Johnson, so they are also called Johnson gauges. Slip
gauges are rectangular blocks, made of high grade steel, having cross section about 30mm
X10mm. These blocks are made into required sizes and hardened to resist wear and allowed
to stabilize so as to relieve internal stresses. This prevents occurrence of size and shape
variations. After hardening the blocks, measuring faces are carefully finished to fine degree
of surface finish, flatness and accuracy. This high grade surface finish is obtained by super
finishing process known as lapping.
Wringing of slip gauges:
The measuring face of the gauges is flat and it possesses high surface finish. If two slip
gauges are forced against each other on measuring faces, because of contact pressure, gauges
stick together and considerable force is required to separate these blocks. This is known as
wringing of slip gauges. Thus, wringing refers to condition of intimate and complete contact
and of permanent adhesion between measuring faces. Slip gauges are wrung to build desired
dimension. Slip gauges are wrung together by hand and no other external means. Figure
shows 1) Parallel wringing of slip gauges and 2) Cross wringing of slip gauges.
In cross wringing – the two slip gauges are first cleaned to remove dirt and then they are
placed together at right angles in the form of cross and then rotated through 90o, while being
pressed together. This method causes less rubbing of surfaces. Almost any dimension may be
built by suitable combination of gauges. Wringing phenomenon is purely due to surface
contact and molecular adhesion of metal of blocks. Hence, ―wringing is defined as the
property of measuring faces of gauge blocks of adhering, by sliding or pressing the gauge
against measuring faces of other gauge blocks or reference faces or datum surfaces without
the use of external means.‖
Uses/Applications of slip gauges
1. as a reference standard.
2. for verification and calibration of measuring apparatus.
3. for adjustment of indicating devices.
4. for direct measurement.
5. for setting of various types of comparators.
6. Micrometers are used to measure the small or fine measurements of length, width,
thickness and diameter of the job.
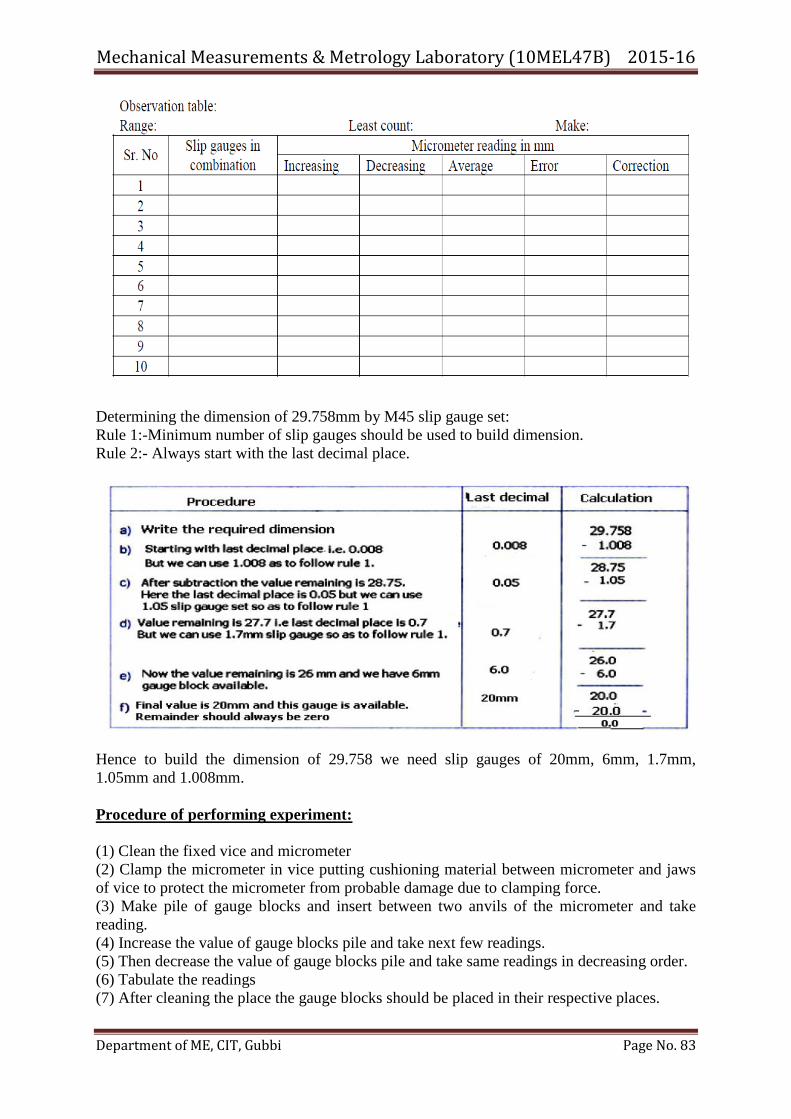
Mechanical Measurements & Metrology Laboratory (10MEL47B) 2015-16
Department of ME, CIT, Gubbi Page No. 83
Determining the dimension of 29.758mm by M45 slip gauge set:
Rule 1:-Minimum number of slip gauges should be used to build dimension.
Rule 2:- Always start with the last decimal place.
Hence to build the dimension of 29.758 we need slip gauges of 20mm, 6mm, 1.7mm,
1.05mm and 1.008mm.
Procedure of performing experiment:
(1) Clean the fixed vice and micrometer
(2) Clamp the micrometer in vice putting cushioning material between micrometer and jaws
of vice to protect the micrometer from probable damage due to clamping force.
(3) Make pile of gauge blocks and insert between two anvils of the micrometer and take
reading.
(4) Increase the value of gauge blocks pile and take next few readings.
(5) Then decrease the value of gauge blocks pile and take same readings in decreasing order.
(6) Tabulate the readings
(7) After cleaning the place the gauge blocks should be placed in their respective places.
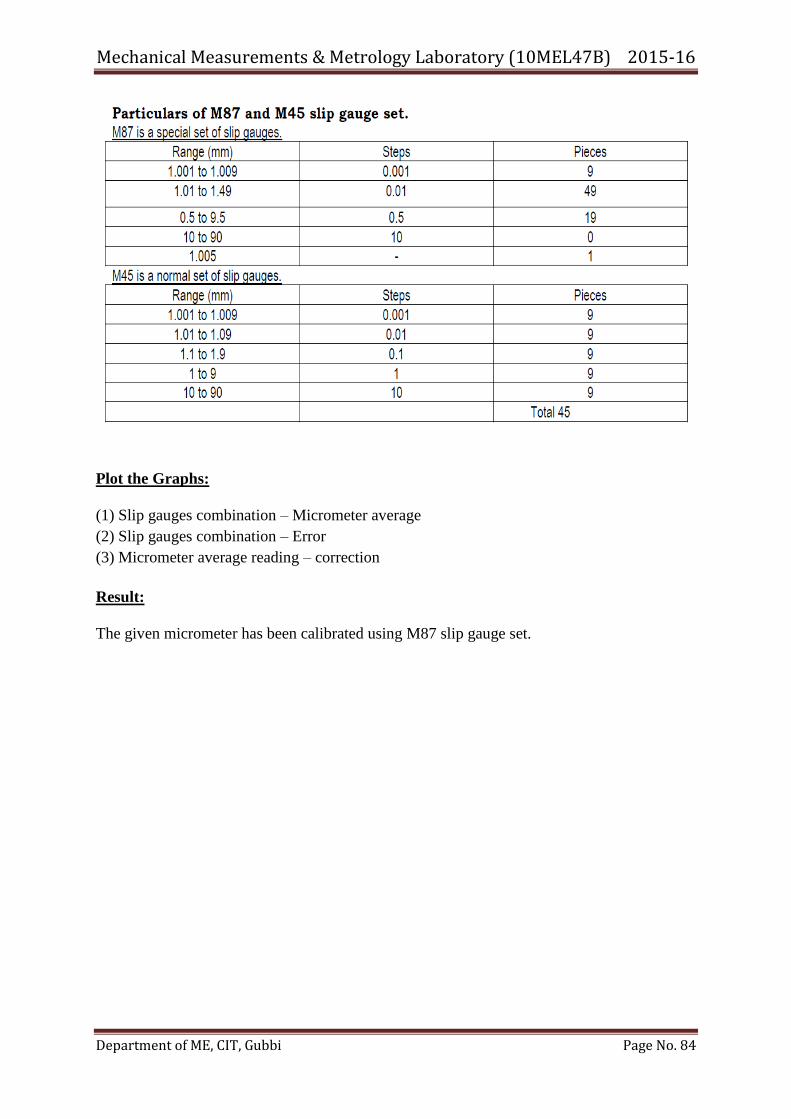
Mechanical Measurements & Metrology Laboratory (10MEL47B) 2015-16
Department of ME, CIT, Gubbi Page No. 84
Plot the Graphs:
(1) Slip gauges combination – Micrometer average
(2) Slip gauges combination – Error
(3) Micrometer average reading – correction
Result:
The given micrometer has been calibrated using M87 slip gauge set.
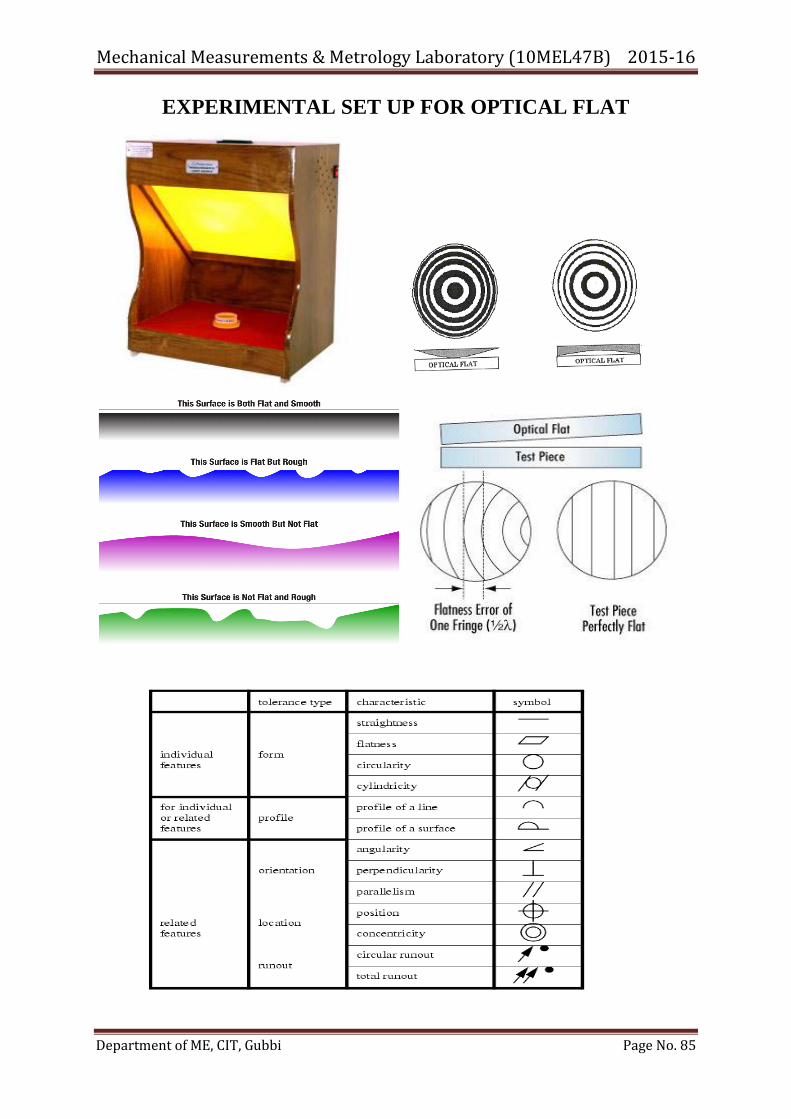
Mechanical Measurements & Metrology Laboratory (10MEL47B) 2015-16
Department of ME, CIT, Gubbi Page No. 85
EXPERIMENTAL SET UP FOR OPTICAL FLAT
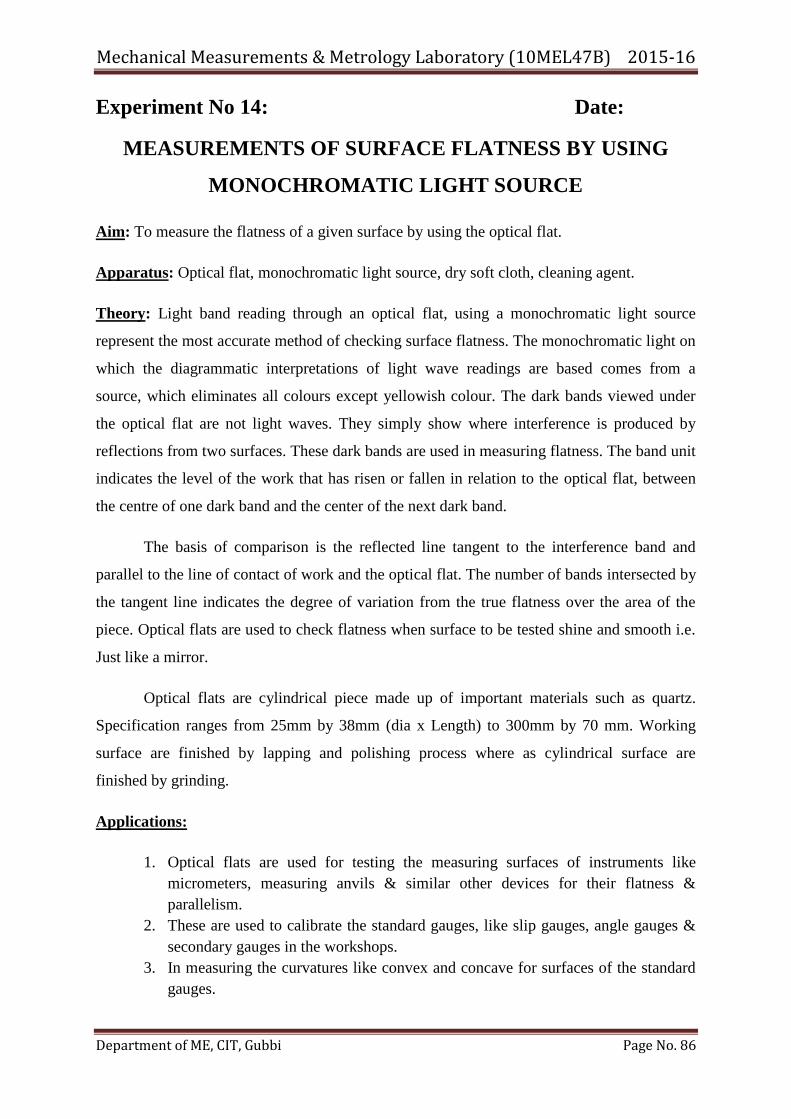
Mechanical Measurements & Metrology Laboratory (10MEL47B) 2015-16
Department of ME, CIT, Gubbi Page No. 86
Experiment No 14: Date:
MEASUREMENTS OF SURFACE FLATNESS BY USING
MONOCHROMATIC LIGHT SOURCE
Aim: To measure the flatness of a given surface by using the optical flat.
Apparatus: Optical flat, monochromatic light source, dry soft cloth, cleaning agent.
Theory: Light band reading through an optical flat, using a monochromatic light source
represent the most accurate method of checking surface flatness. The monochromatic light on
which the diagrammatic interpretations of light wave readings are based comes from a
source, which eliminates all colours except yellowish colour. The dark bands viewed under
the optical flat are not light waves. They simply show where interference is produced by
reflections from two surfaces. These dark bands are used in measuring flatness. The band unit
indicates the level of the work that has risen or fallen in relation to the optical flat, between
the centre of one dark band and the center of the next dark band.
The basis of comparison is the reflected line tangent to the interference band and
parallel to the line of contact of work and the optical flat. The number of bands intersected by
the tangent line indicates the degree of variation from the true flatness over the area of the
piece. Optical flats are used to check flatness when surface to be tested shine and smooth i.e.
Just like a mirror.
Optical flats are cylindrical piece made up of important materials such as quartz.
Specification ranges from 25mm by 38mm (dia x Length) to 300mm by 70 mm. Working
surface are finished by lapping and polishing process where as cylindrical surface are
finished by grinding.
Applications:
1. Optical flats are used for testing the measuring surfaces of instruments like
micrometers, measuring anvils & similar other devices for their flatness &
parallelism.
2. These are used to calibrate the standard gauges, like slip gauges, angle gauges &
secondary gauges in the workshops.
3. In measuring the curvatures like convex and concave for surfaces of the standard
gauges.
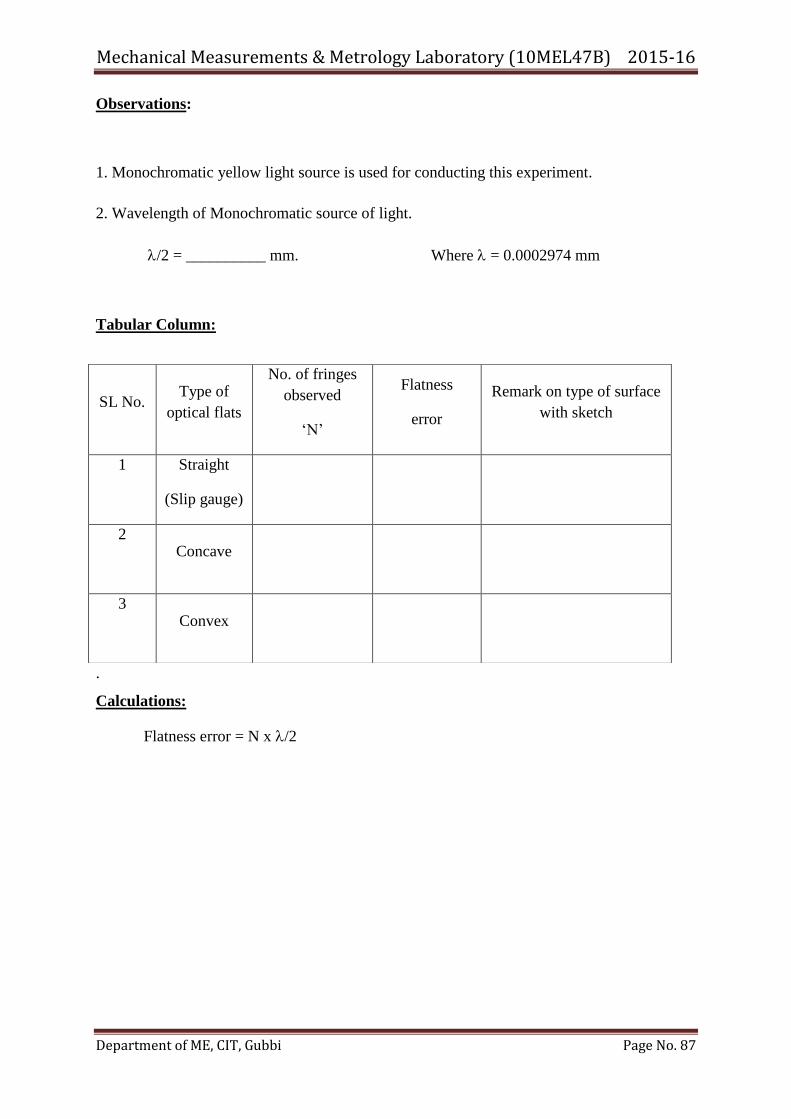
Mechanical Measurements & Metrology Laboratory (10MEL47B) 2015-16
Department of ME, CIT, Gubbi Page No. 87
Observations:
1. Monochromatic yellow light source is used for conducting this experiment.
2. Wavelength of Monochromatic source of light.
/2 = __________ mm. Where = 0.0002974 mm
Tabular Column:
.
Calculations:
Flatness error = N x /2
SL No. Type of
optical flats
No. of fringes
observed
‗N‘
Flatness
error
Remark on type of surface
with sketch
1
Straight
(Slip gauge)
2
Concave
3
Convex
Mechanical Measurements & Metrology Laboratory (10MEL47B) 2015-16
Department of ME, CIT, Gubbi Page No. 88
Procedure:
1. Clean the surface to be tested to become shiny and wipe if with dry clean cloth
2. Place the optical flat in between flatness of work piece to be tested and monochromatic
Sources of light i.e. on the work piece.
3. Both parts and flat must be absolutely clean and dry.
4. After placing optical flat over work piece switch on the monochromatic source of light and
Wait until getting yellowish or orange colour.
5. Apply slight pressure over optical and adjust until getting steady band approximately
parallel to the main edges.
6. Count the number of fringes obtained on the flat with the help of naked eye and
calculates the flatness error
Results:
Measured the flatness of a given surface by using the optical flats.
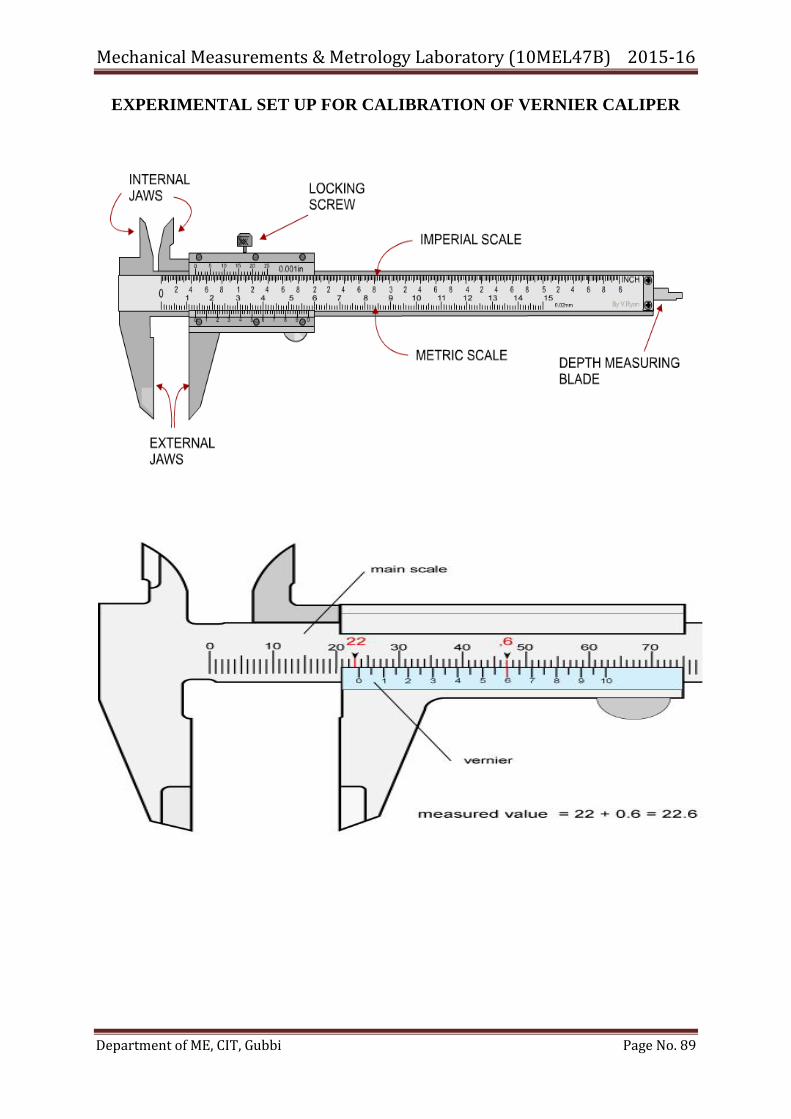
Mechanical Measurements & Metrology Laboratory (10MEL47B) 2015-16
Department of ME, CIT, Gubbi Page No. 89
EXPERIMENTAL SET UP FOR CALIBRATION OF VERNIER CALIPER
Mechanical Measurements & Metrology Laboratory (10MEL47B) 2015-16
Department of ME, CIT, Gubbi Page No. 90
ADDITIONAL EXPERIMENTS
Experiment No. 15: Date:
CALIBRATION OF VERNIER CALIPER AND MEASUREMENT OF
THE GIVEN COMPONENT
Aim : To calibrate and measure the given component by using vernier calliper.
Apparatus required: Slip gauges and Vernier Calliper.
Theory:
The Vernier Caliper is a precision instrument that can be used to measure internal and
external distances extremely accurately. Measurements are interpreted from the scale by the
user. This is more difficult than using a digital vernier caliper which has an LCD digital
display on which the reading appears. Manually operated vernier calipers can still be bought
and remain popular because they are much cheaper than the digital version. Also, the digital
version requires a small battery whereas the manual version does not need any power source.
The main use of the vernier caliper is to measure the internal and the external diameters of
an object. To measure using a vernier scale, the user first reads the finely marked "fixed"
scale (in the diagram). This measure is typically between two of the scale's smallest
graduations. The user then reads the finer vernier scale which measures between the smallest
graduations on the fixed scale providing much greater accuracy.
Example: On decimal measuring instruments, as in the diagram below, the indicating scale
has 10 graduations that cover the same length as 9 on the data scale. Note that the vernier
10th graduation is omitted.
The method to use a vernier scale or caliper with zero error is to use the formula: actual
reading = main scale + vernier scale − (zero error). Zero error may arise due to knocks that
cause the calibration at the 0.00 mm when the jaws are perfectly closed or just touching each
other.
When the jaws are closed and if the reading is 0.10mm, the zero error is referred to as
+0.10mm. The method to use a vernier scale or caliper with zero error is to use the formula
'actual reading = main scale + vernier scale − (zero error)' thus the actual reading is 19.00 +
0.54 − (0.10) = 19.44 mm
Positive zero error refers to the fact that when the jaws of the vernier caliper are just closed,
the reading is a positive reading away from the actual reading of 0.00mm. If the reading is
0.10mm, the zero error is referred to as +0.10 mm.
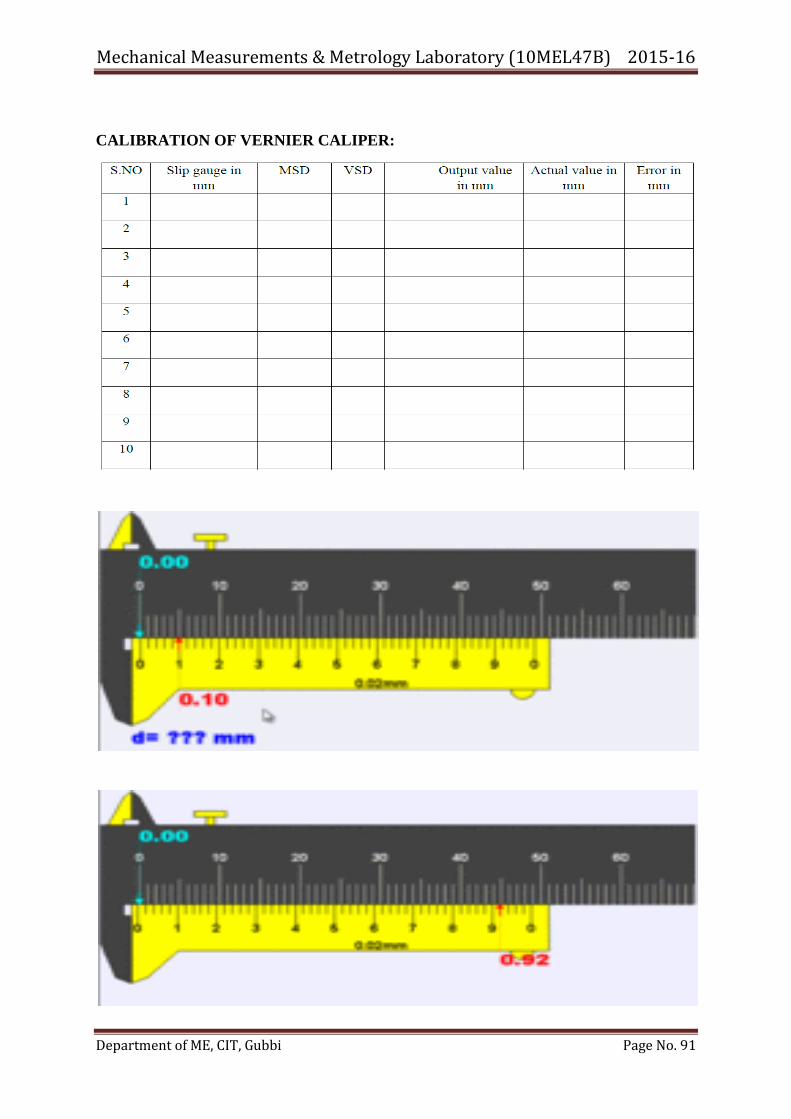
Mechanical Measurements & Metrology Laboratory (10MEL47B) 2015-16
Department of ME, CIT, Gubbi Page No. 91
CALIBRATION OF VERNIER CALIPER:
Mechanical Measurements & Metrology Laboratory (10MEL47B) 2015-16
Department of ME, CIT, Gubbi Page No. 92
When the jaws are closed and if the reading is −0.08mm, the zero error is referred to as −0.08
mm. The method to use a vernier scale or caliper with zero error is to use the formula 'actual
reading = main scale + vernier scale − (zero error)' thus the actual reading is 19.00 + 0.36 −
(−0.08) = 19.44 mm
Negative zero error refers to the fact that when the jaws of the vernier caliper are just
closed, the reading is a negative reading away from the actual reading of 0.00mm. If the
reading is 0.08mm, the zero error is referred to as −0.08mm.
Principle:
Vernier Calipers is the most commonly used instrument for measuring outer and inner
diameters. It works on the principle of Vernier Scale which is some fixed units of length (Ex:
49mm) divided into 1 less or 1 more parts of the unit(Ex: 49mm are divided into 50 parts).
The exact measurement with up to 0.02mm accuracy can be determined by the coinciding
line between Main Scale and Vernier Scale. Total Reading = M.S.R + L.C X V.C
Where:
M.S.R – Main Scale Reading
L.C – Least Count
V.C – Vernier Coincidence
Procedure:
Calibration
1. With the help of slip gauges as standard, calibrate the gauges.
2. Plot a graph of (i) STD Input vs Output and (ii) Standard Input vs Error .
Measurement
1. Place the work piece and the gauge appropriately and carry out the measurement of the job.
2. Prepare a report of the measurement and indicate the characteristics of the work pieces.
Result:
Calibrated the vernier calliper and measured the values of the given component.
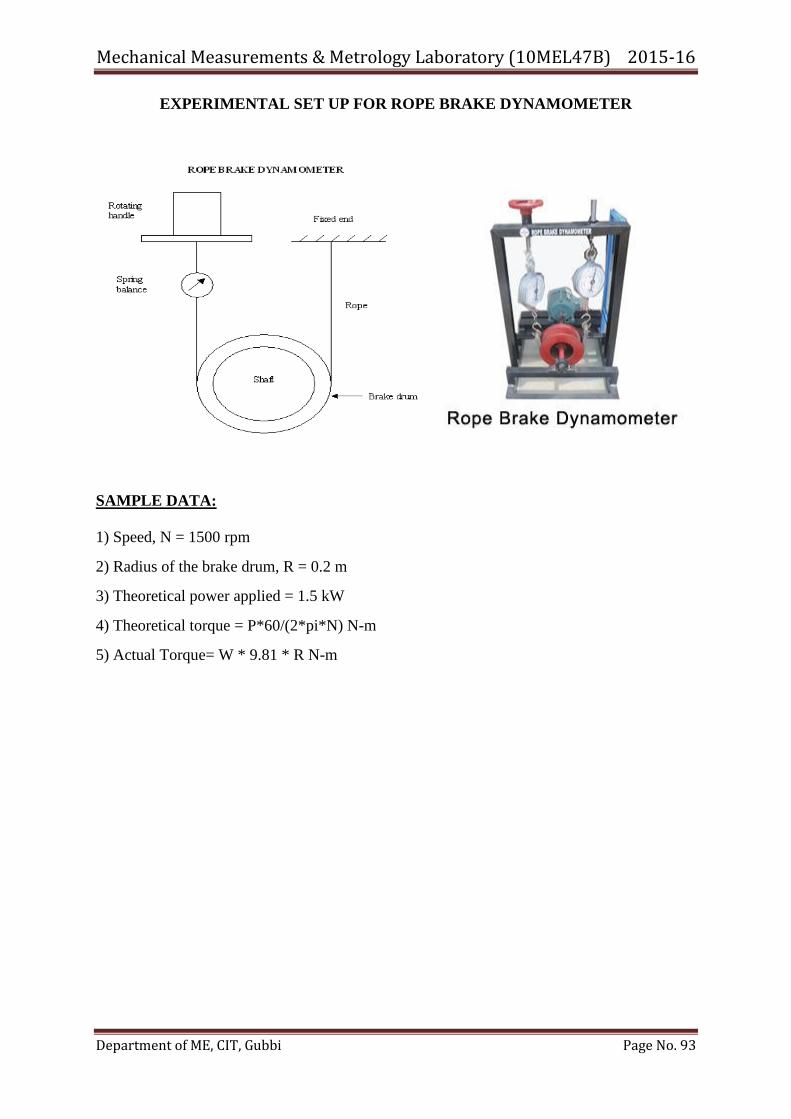
Mechanical Measurements & Metrology Laboratory (10MEL47B) 2015-16
Department of ME, CIT, Gubbi Page No. 93
EXPERIMENTAL SET UP FOR ROPE BRAKE DYNAMOMETER
SAMPLE DATA:
1) Speed, N = 1500 rpm
2) Radius of the brake drum, R = 0.2 m
3) Theoretical power applied = 1.5 kW
4) Theoretical torque = P*60/(2*pi*N) N-m
5) Actual Torque= W * 9.81 * R N-m
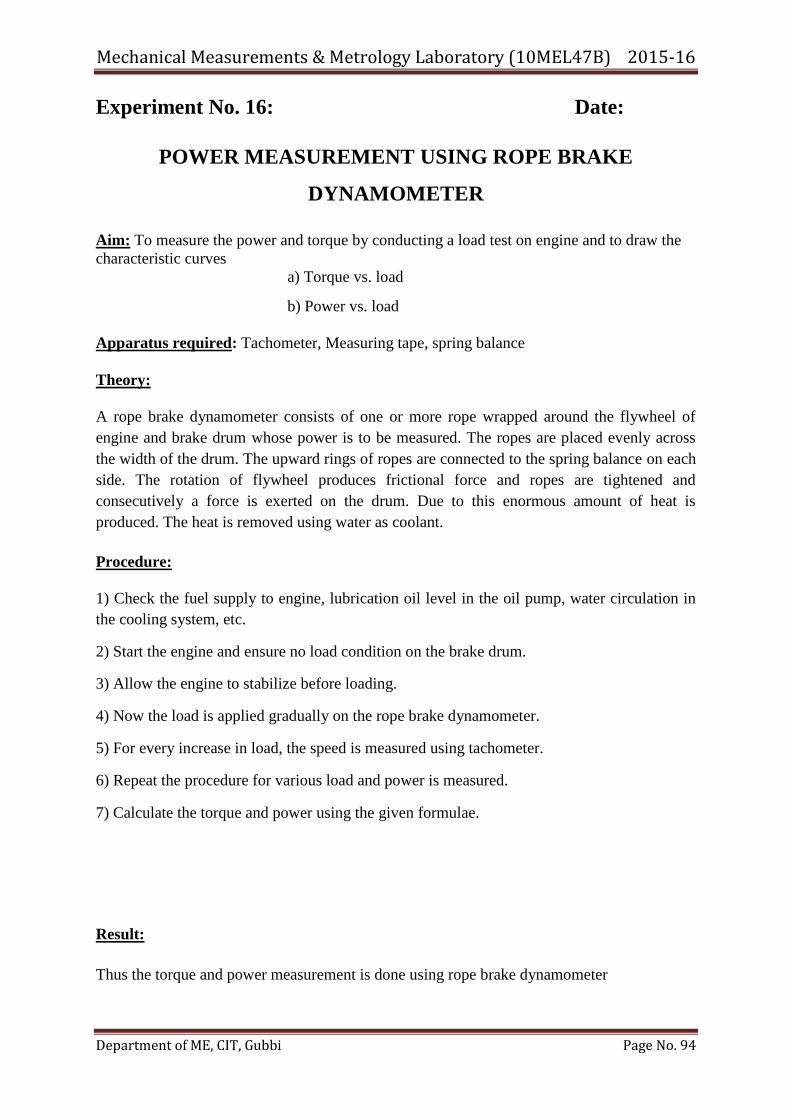
Mechanical Measurements & Metrology Laboratory (10MEL47B) 2015-16
Department of ME, CIT, Gubbi Page No. 94
Experiment No. 16: Date:
POWER MEASUREMENT USING ROPE BRAKE
DYNAMOMETER
Aim: To measure the power and torque by conducting a load test on engine and to draw the
characteristic curves
a) Torque vs. load
b) Power vs. load
Apparatus required: Tachometer, Measuring tape, spring balance
Theory:
A rope brake dynamometer consists of one or more rope wrapped around the flywheel of
engine and brake drum whose power is to be measured. The ropes are placed evenly across
the width of the drum. The upward rings of ropes are connected to the spring balance on each
side. The rotation of flywheel produces frictional force and ropes are tightened and
consecutively a force is exerted on the drum. Due to this enormous amount of heat is
produced. The heat is removed using water as coolant.
Procedure:
1) Check the fuel supply to engine, lubrication oil level in the oil pump, water circulation in
the cooling system, etc.
2) Start the engine and ensure no load condition on the brake drum.
3) Allow the engine to stabilize before loading.
4) Now the load is applied gradually on the rope brake dynamometer.
5) For every increase in load, the speed is measured using tachometer.
6) Repeat the procedure for various load and power is measured.
7) Calculate the torque and power using the given formulae.
Result:
Thus the torque and power measurement is done using rope brake dynamometer
Mechanical Measurements & Metrology Laboratory (10MEL47B) 2015-16
Department of ME, CIT, Gubbi Page No. 95
VIVA QUESTIONS WITH ANSWERS
1. What is metrology?
Metrology is the science of measurement. Metrology includes all theoretical and
practical aspects of measurement. Metrology is the process of making extremely precise
measurements of the relative positions and orientations of different optical and mechanical
components. Metrology is concerned with the establishment, reproduction, conservation
and transfer of units of measurement & their standards.
2. What are the objectives of metrology?
To provide accuracy at minimum cost.
Thorough evaluation of newly developed products, and to ensure that components are within the specified dimensions.
To determine the process capabilities. To assess the measuring instrument capabilities and ensure that they are adequate
for their specific measurements. To reduce the cost of inspection & rejections and rework. To standardize measuring methods. To maintain the accuracy of measurements through periodical calibration of the
instruments. To prepare designs for gauges and special inspection fixtures
3. What is calibration?
Calibration is the comparing of an unknown measurement device against equal or better
known standard under specified conditions. Every measuring system must be provable. The
procedure adopted to prove the ability of a measuring system to measure reliably is called
‘calibration’.
4. Give the importance of calibration. Assurance of accurate of measurements Ability to trace measurements to international standards International acceptance of test/calibration reports Consumer protection (legal metrology) Correct diagnosis of illness (medical reports) Meeting the requirements of ISO 9000 & 17025
5. What is a load cell?
A Load cell is a transducer that is used to convert a force into an electrical signal. This
conversion is indirect and happens in two stages. Through a mechanical arrangement, the
force being sensed deforms a strain gauge. The strain gauge measures the deformation
(strain) as an electrical signal, because the strain changes the effective electrical resistance
of the wire.
6. List the various linear measuring instruments.
a) Scale b) Vernier Calipers c) Height Gauge d) Micrometer etc.
Mechanical Measurements & Metrology Laboratory (10MEL47B) 2015-16
Department of ME, CIT, Gubbi Page No. 96
7. Define an error.
Error may be defined as the difference between the best measured or indicated value and
the true or actual value. No measurement can be made without errors at all times i.e. 100%
accurate measurements cannot be made at all the times. Classified in different ways, they
are: Systematic error, Random errors and illegitimate errors.
8. Define Standard with an example.
“Something that is set up & established by an authority as a rule of the measure of the
quantity, weight, extent, value or quality” Ex: A meter is a standard established by an
international organization for the measure of length.
9. Define measurements. Mention different methods of measurements.
Measurement is a process or an act of comparing a quantitatively an unknown magnitude
with a predefined standard. For Example, consider the measurement of a length of a bar.
We made use of a scale/ steel rule (i.e. a standard). It is a collection of quantitative data. A
measurement is a process of comparing a quantity with a standard unit. Since this
comparison cannot be perfect, measurements inherently include error. There are two
methods of measurement: 1) direct comparison with primary or secondary standard & 2)
indirect comparison through the use of calibrated system.
10. What is L.V.D.T? What is its application?
The linear variable differential transformer (LVDT) (also called just a differential
transformer) is a type of electromechanical transformer used to convert linear displacement
into electrical signal. Although the LVDT is a displacement sensor, many other physical
quantities can be sensed by converting displacement to the desired quantity via thoughtful
arrangements.
11. Explain the principle of working of a L.V.D.T
The LVDT converts a position or linear displacement from a mechanical reference (zero, or
null position) into a proportional electrical signal containing phase (for direction) and
amplitude (for distance) information.
12. What is Precision?
Precision of an instrument indicates its ability to reproduce a certain reading with a given
accuracy. It is the degree of agreement between repeated results.
13. Define sensitivity.
Sensitivity is the ratio of the magnitude of the output quantity (response) to the magnitude
of input quantity. Ex: 1 mV recorder might have a 10 cm scale. Its sensitivity would be a 10
cm/mV. Assuming that measurement is linear all across the scale.
14. Define Linearity.
A measuring system is said to be a linear if the output is linearly proportional to the input.
15. Define Repeatability.
Repeatability is defined as the ability of a measuring system to reproduce output readings
when the same input is applied to it consecutively under the same conditions & in the same
directions.
Mechanical Measurements & Metrology Laboratory (10MEL47B) 2015-16
Department of ME, CIT, Gubbi Page No. 97
16. Define Hysteresis.
An instrument is said to exhibit hysteresis when there is a difference in readings depending
on whether the value of the measured quantity is approached from higher value or from a
lower value. Hysteresis is a phenomenon which depicts different output effects when
loading and unloading.
17. Define Resolution or Discrimination.
Resolution is defined as the smallest increment of input signal that a measuring system is
capable of displaying or Measurement resolution which is the smallest change in the
underlying physical quantity that produces a response in the measurement.
18. Define Accuracy.
Accuracy of an instrument indicates the deviation of the reading from a known input.
19. Define least count.
It is the smallest difference between two indications that can be detected on the instrument
scale.
20. Define Readability & Threshold.
Readability indicates the closeness with which the scale of the instrument may be read. Ex:
an instrument with 30 cm scale has a higher readability than that of a 15 cm scale.
Threshold: If the instrument input is increased very gradually from zero, there will be some
minimum value of input below which no output change can be detected. This minimum
value defines the threshold of the instrument.
21. Define system response.
System response: Response of a system may be defined as the ability of the system to
transmit & present all the relevant information contained in the input signal & to exclude all
others. If the output is faithful to input, i.e. the output signals have the same phase
relationships as that of input signal, the system is said to have good System response. If
there is a lag or delay in output signal which may be due to natural inertia of the system, it is
known as ‘measurement lag’. “Rise time” is defined as the time taken for system to change
from 5% to 95% of its final value. It is measure of the speed of response of a measuring
system and a short rise time is desirable.
22. Define Discrepancy. The difference between two indicated values or results determined from a Supposedly fixed
time value.
23. True value ( vt ) or Actual value ( va )
It is the actual magnitude of the input signal to a measuring system which may be
approximated but never truly be determined.
24. Indicated value ( vi ) or Measured value ( vm )
The magnitude of the input signal indicated by a measuring instrument is known as a
indicated value.
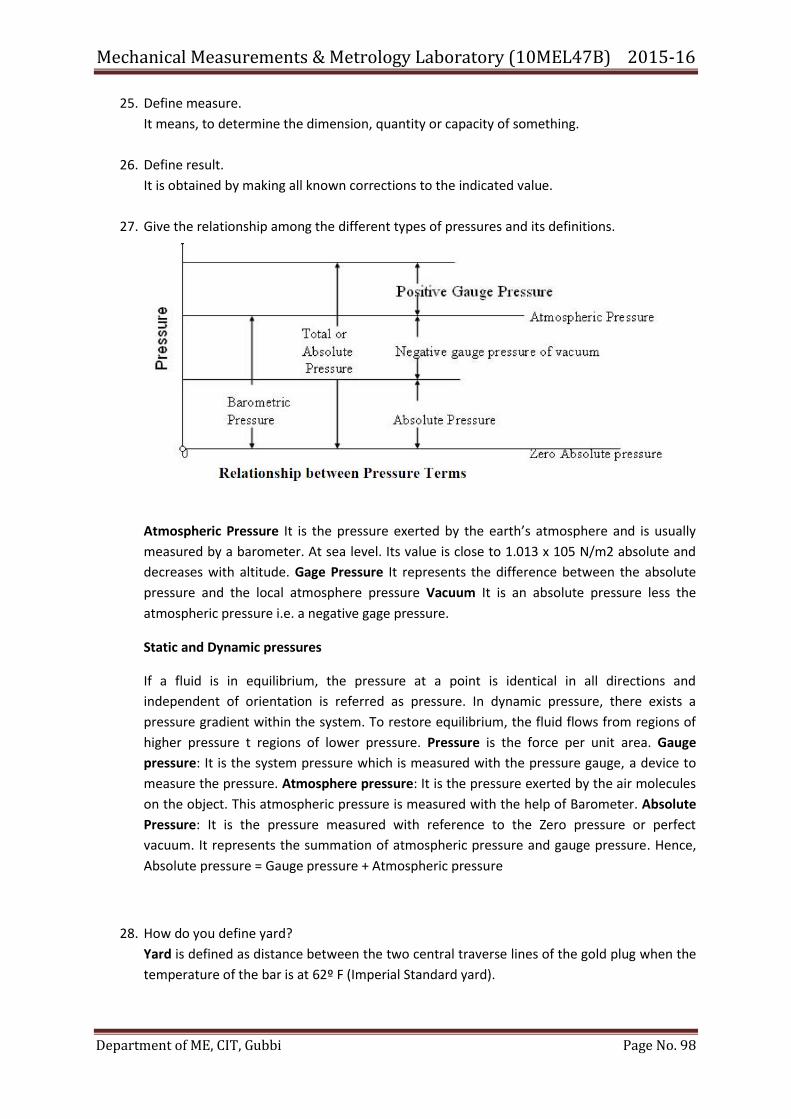
Mechanical Measurements & Metrology Laboratory (10MEL47B) 2015-16
Department of ME, CIT, Gubbi Page No. 98
25. Define measure.
It means, to determine the dimension, quantity or capacity of something.
26. Define result.
It is obtained by making all known corrections to the indicated value.
27. Give the relationship among the different types of pressures and its definitions.
Atmospheric Pressure It is the pressure exerted by the earth’s atmosphere and is usually
measured by a barometer. At sea level. Its value is close to 1.013 x 10⁵ N/m2 absolute and
decreases with altitude. Gage Pressure It represents the difference between the absolute
pressure and the local atmosphere pressure Vacuum It is an absolute pressure less the
atmospheric pressure i.e. a negative gage pressure.
Static and Dynamic pressures
If a fluid is in equilibrium, the pressure at a point is identical in all directions and
independent of orientation is referred as pressure. In dynamic pressure, there exists a
pressure gradient within the system. To restore equilibrium, the fluid flows from regions of
higher pressure t regions of lower pressure. Pressure is the force per unit area. Gauge
pressure: It is the system pressure which is measured with the pressure gauge, a device to
measure the pressure. Atmosphere pressure: It is the pressure exerted by the air molecules
on the object. This atmospheric pressure is measured with the help of Barometer. Absolute
Pressure: It is the pressure measured with reference to the Zero pressure or perfect
vacuum. It represents the summation of atmospheric pressure and gauge pressure. Hence,
Absolute pressure = Gauge pressure + Atmospheric pressure
28. How do you define yard?
Yard is defined as distance between the two central traverse lines of the gold plug when the
temperature of the bar is at 62º F (Imperial Standard yard).
Mechanical Measurements & Metrology Laboratory (10MEL47B) 2015-16
Department of ME, CIT, Gubbi Page No. 99
29. What is thermocouple? Where are they used?
If two dissimilar metals are joined, an emf exists which is a function of several factors
including the temperature. When junctions of this type are used to measure temperature,
they are called as thermocouples.
30. What are slip gauges?
Slip gauges a very accurately ground block of hardened steel used to measure a gap with
close accuracy: used mainly in tool-making and inspection.
31. What is Tolerance?
It is the difference between the upper limit and the lower limit of a dimension. It is
impossible to make anything to an exact size, therefore it is essential to allow a definite
tolerance. It is also the maximum permissible variation on every specified dimension.
32. What are Limits? The maximum and minimum permissible sizes within which the actual size of a
Component lies are called Limits.
33. Define fits. The relationship existing between two parts, shaft and hole, which are to be assembled, with
respect to the difference in their sizes is called fit.
34. What is Range?
Range represents the highest possible value that can be measured by an instrument or
Range is the difference between the largest & the smallest results of measurement.
35. What is loading effect?
Loading effect: The presence of a measuring instrument in a medium to be measured will
always lead to extraction of some energy from the medium, thus making perfect
measurements theoretically impossible. This effect is known as ‘loading effect’ which must
be kept as small as possible for better measurements. For ex, in electrical measuring
systems, the detector stage receives energy from the signal source, while the intermediate
modifying devices and output indicators receive energy from auxiliary source. The loading
effects are due to impedances of various elements connected in a system.
36. What is comparator?
Comparator is a precision instrument used for comparing dimensions of a part under test
with the working standards. It is an indirect type of instrument and used for linear
measurement. If the dimension is less or greater than the standard, then the difference will
be shown on the dial. It gives only the difference between actual and standard dimension of
the work piece.
37. Name the different types of comparator? Mechanical Comparator, Pneumatic Comparator, Optical Comparator, Electrical Comparator,
Electronic Comparator and Combined Comparator (ex: mechanical –optical comparator).
Mechanical Measurements & Metrology Laboratory (10MEL47B) 2015-16
Department of ME, CIT, Gubbi Page No. 100
38. What are advantages and disadvantages of mechanical comparator?
Advantages of Mechanical Comparator
1. They do not require any external source of energy.
2. These are cheaper and portable.
3. These are of robust construction and compact design.
4. The simple linear scales are easy to read.
5. These are unaffected by variations due to external source of energy such air, electricity
etc.
Disadvantages
1. Range is limited as the pointer moves over a fixed scale.
2. Pointer scale system used can cause parallax error.
3. There are number of moving parts which create problems due to friction, and
ultimately the accuracy is less.
4. The instrument may become sensitive to vibration due to high inertia.
39. What is a sine bar?
Sine bar is a high precision & most accurate angle measuring instrument. It is used for
measurement of an angle of a given job or for setting an angle. They are hardened and
precision ground tools for accurate angle setting. It can be used in conjunction with set of
angle gauges and dial gauge for measurement of angles and tapers from horizontal surface.
40. What is a sine center?
These are used in situations where it is difficult to mount the component on the sine bar. It
is basically used for conical work pieces. It is the extension of sine bars where two ends are
provided on which centers can be Clamped. These are useful for testing of conical work
centered at each end, up to 60°.
REFERENCES
TEXT BOOKS:
1. Mechanical Measurements, Beckwith Marangoni and Lienhard, Pearson
Education, 6th Ed., 2006.
2. Engineering Metrology, R.K. Jain, Khanna Publishers, 1994.
REFERENCE BOOKS:
1. Engineering Metrology, I.C. Gupta, Dhanpat Rai Publications, Delhi.
2. Mechanical Measurements, R.K. Jain Khanna Publishers, 1994
3. Industrial Instrumentation, Alsutko, Jerry. D. Faulk, Cengage Asia Pvt. Ltd.
2002.
4. Measurement Systems Applications and Design, Ernest O. Doebelin, 5th Ed.,
McGraw Hill Book Co.
5. Metrology & Measurement, Anand K. Bewoor & Vinay A. Kulkarni, Tata
McGraw Hill Pvt. Ltd., New Delhi