Mechanical and structural properties of polyvinyl … and Structural Properties of Polyvinyl Alcohol...
19
MECHANICAL AND STRUCTURAL PROPERTIES OF POLYVINYL ALCOHOL FIBRE REINFORCED CONCRETE (PVA-FRC) AMIN NOUSHINI MASTER OF ENGINEERING 2013
-
Upload
truongcong -
Category
Documents
-
view
215 -
download
0
Transcript of Mechanical and structural properties of polyvinyl … and Structural Properties of Polyvinyl Alcohol...
MECHANICAL AND STRUCTURAL PROPERTIES OF
POLYVINYL ALCOHOL FIBRE REINFORCED CONCRETE
(PVA-FRC)
AMIN NOUSHINI
MASTER OF ENGINEERING
2013
Mechanical and Structural Properties of
Polyvinyl Alcohol Fibre Reinforced Concrete
(PVA-FRC)
by
Amin Noushini
A thesis submitted for the fulfilment of the requirements for the degree of
Master of Engineering
School of Civil and Environmental Engineering
Faculty of Engineering and Information Technology University of Technology Sydney
2013

[ii]
CERTIFICATE OF AUTHORSHIP/ORIGINALITY
I certify that the work in this thesis has not previously been submitted for a degree nor
has it been submitted as part of requirements for a degree except as fully acknowledged
within the text.
I also certify that the thesis has been written by me. Any help that I have received in my
research work and the preparation of the thesis itself has been acknowledged. In
addition, I certify that all information sources and literature used are indicated in the
thesis.
_____________________________
Amin Noushini
Sydney, August 2013
[iii]
ACKNOWLAGEMENTS
This thesis would not have been completed without the guidance, advice and support of
a number of individuals whose contribution I would gratefully like to acknowledge. I
would specially like to express my gratitude to my supervisors, Professor Bijan Samali
and Dr Kirk Vessalas. Herein, I would like to express my deepest gratitude to Professor
Samali, who has been my principal supervisor for this research, not only because of his
invaluable guidance and expert advice throughout the research but also on account of
his strong support like a kind father during the last two years. The author would also
very much like to record his appreciation to Dr Vessalas for his valuable advice and
constant support from the commencement of this project to the end, much more than
just a co-supervisor.
I would also like to convey my thanks to University of Technology Sydney (UTS) Civil
Engineering Laboratories staff, specially the laboratories manager Mr Rami Haddad,
senior project engineer Mr Peter Brown and technical officer Mr David Dicker who
kindly helped me in project experimental stages.
Furthermore, I am obliged to many of my colleagues and friends who assisted me
during my studies. Special thanks must go to my dear friends and co-researchers, Mr
Rami Haddad, Ms Nassim Ghosni and Ms Negin Sharifi for their unfailing assistance
and support in this research work.
The support from the Centre for Built Infrastructure Research (CBIR) and assistance of
academics and researchers in the School of Civil and Environmental Engineering at
UTS, particularly Dr Hamid Valipour and Dr Nima Khorsandnia is highly
acknowledged.
Lastly, I would like to extend my love and gratitude to my dearest parents for their
support and encouragement. I want to sincerely thank them from the bottom of my heart
and acknowledge that without them none of this could have happened and I was not
able to achieve most of the things I have in my life.
Hereby, I would like to dedicate this thesis to my parents for being such great supports
in my life.
[iv]
LIST OF PUBLICATIONS BASED ON THIS THESIS
Journal Articles
1. Noushini, A., Samali, B., Vessalas, K. 2013, ‘Effect of Polyvinyl Alcohol (PVA)
Fibre on Dynamic and Material Properties of Fibre Reinforced Concrete’,
Construction and Building Materials, vol. 49, pp. 374-383
2. Noushini, A., Vessalas, K. and Samali, B. 2014, ‘Rheological Properties and
Compressive Strength Behaviour of Polyvinyl Alcohol Fibre-Reinforced Concrete’,
Australian Journal of Structural Engineering (AJSE), vol. 15, no. 1
3. Noushini, A., Vessalas, K., Samali, B., Arabian, G., ‘Drying Shrinkage Behaviour
of Fibre Reinforced Concrete Incorporating Polyvinyl Alcohol (PVA) Fibres and
Fly ash’, Magazine of concrete research – under review
4. Noushini, A., Vessalas, K., Samali, B., ‘Static Mechanical Properties of Polyvinyl
Alcohol Fibre Reinforced Concrete (PVA-FRC)’, Magazine of concrete research –
under review
5. Noushini, A., Samali, B., Vessalas, K., ‘Ductility and Damping Characteristics of
Polyvinyl Alcohol Fibre Reinforced Concrete Beam Elements’, composite
structures – under review
Conference Papers
1. Noushini, A., Vessalas, K., Ghosni, N., Samali, B. 2013, ‘Effect of Polyvinyl
Alcohol Fibre and Fly Ash on Flexural Tensile Properties of Concrete’, Proceeding
of the 22nd Australasian Conference on the Mechanics of Structures and Materials
(ACMSM 22), Sydney, Australia, pp. 1165-1170
2. Noushini, A., Samali, B., Vessalas, K. 2013, ‘Flexural Toughness and Ductility
Characteristics of Polyvinyl Alcohol Fibre Reinforced Concrete (PVA-FRC)’, VIII
International Conference on Fracture Mechanics of Concrete and Concrete
Structures (FraMCoS-8), Toledo, Spain, pp. 1110-1121
[v]
3. Noushini, A., Samali, B., Vessalas, K. 2013, ‘Effect of Polyvinyl Alcohol Fibre on
Dynamic Properties of Concrete Containing Fly Ash’, Composite Construction VII
(CCVII), Palm Cove, Queensland, Australia
4. Noushini, A., Samali, B., Vessalas, K. 2013, ‘Damping Properties of Polyvinyl
Alcohol Fibre Reinforced Concrete’, The Thirteenth East Asia-Pacific Conference
on Structural Engineering and Construction (EASEC-13), Sapporo, Japan
5. Noushini, A., Samali, B., Vessalas, K. 2013, ‘Influence of Polyvinyl Alcohol Fibre
Addition on Fresh And Hardened Properties of Concrete’, The Thirteenth East Asia-
Pacific Conference on Structural Engineering and Construction (EASEC-13),
Sapporo, Japan
6. Noushini, A., Vessalas, K., Samali, B. 2013, ‘Flexural and Tensile Characteristics of
Polyvinyl Alcohol Fibre Reinforced Concrete (PVA-FRC)’, The Thirteenth East
Asia-Pacific Conference on Structural Engineering and Construction (EASEC-13),
Sapporo, Japan
[vi]
ABSTRACT
Concrete is a brittle material that has low tensile strength and low strain capacity. In
fact, many deteriorations and failures in the concrete structures are due to the brittle
nature of this material (Hamoush et al. 2010). These disadvantages may be avoided by
adding short discontinuous fibres to plain concrete which has been a major motivation
for many research works in recent years (Wu & Sun 2003).
Fibres are added into a brittle-matrix composite to help improve three major aspects;
toughness, ductility and strength (tensile) (Arisoy 2002). Fibres tend to increase
toughness of the composite material by bridging the cracks and provide energy
absorption mechanism related to de-bonding and fibre pull-out. Furthermore, they can
increase the ductility of the composite by allowing multiple cracking. They may also
help increase the strength by transferring load and stresses across the cracks.
Advancement of fibre reinforced concretes (FRCs) started in the 1970s. By that time,
only glass fibre and steel fibre were investigated (Perumalsamy & Surendra 1992).
Synthetic fibres have become more attractive in recent years as reinforcements for
cementitious materials. This is due to the fact that they can provide inexpensive
reinforcement for concrete and if the fibres are further optimized, greater improvements
can be gained without increasing the reinforcement costs (Li et al. 1991; Wang et al.
1989). Moreover, unlike the steel fibre which is highly corrosive in nature, there is no
corrosion concern regarding synthetic fibres in concrete.
During the past 20 years (since early 1990s), polyvinyl alcohol (PVA) fibre has been
introduced in the production of cementitious composites (Li 1998; Redon et al. 2001;
Shen et al. 2008; Sun & Wu 2008). PVA fibres act greatly in a cement based matrix
with no coarse aggregates due to their surface formation and high strength (Li et al.
2001). The resulting composite, which exhibits a pseudo ductile behaviour, is called
engineered cementitious composites (ECC).
Although many research works have been performed to date on the properties of PVA
fibre reinforced ECC, there has not been much investigation on the mechanical and
structural characteristics of PVA fibre reinforced concrete. Accordingly, the objective of
this study is to experimentally observe the effects of adding PVA fibres to the
conventional concrete to assess its mechanical and structural properties.
[vii]
To achieve this aim, a comprehensive set of experiments were carried out to investigate
the effect of PVA micro fibre addition on mechanical and structural properties of
conventional concrete. Therefore, concrete mixes containing PVA fibres of varying
lengths (6 and 12 mm) in different fibre volume fractions ranging from 0.125% - 1%
were prepared and tested for their fresh and hardened properties. The optimum fibre
contents in terms of FRC performance were then selected to cast several concrete
beams. These beams have later been tested for 4-point monotonic and 3-point cyclic
flexure, to assess their structural properties. Hammer test was also conducted to evaluate
the dynamic characteristics of conventional and FRC specimens as well as concrete
beams.
[viii]
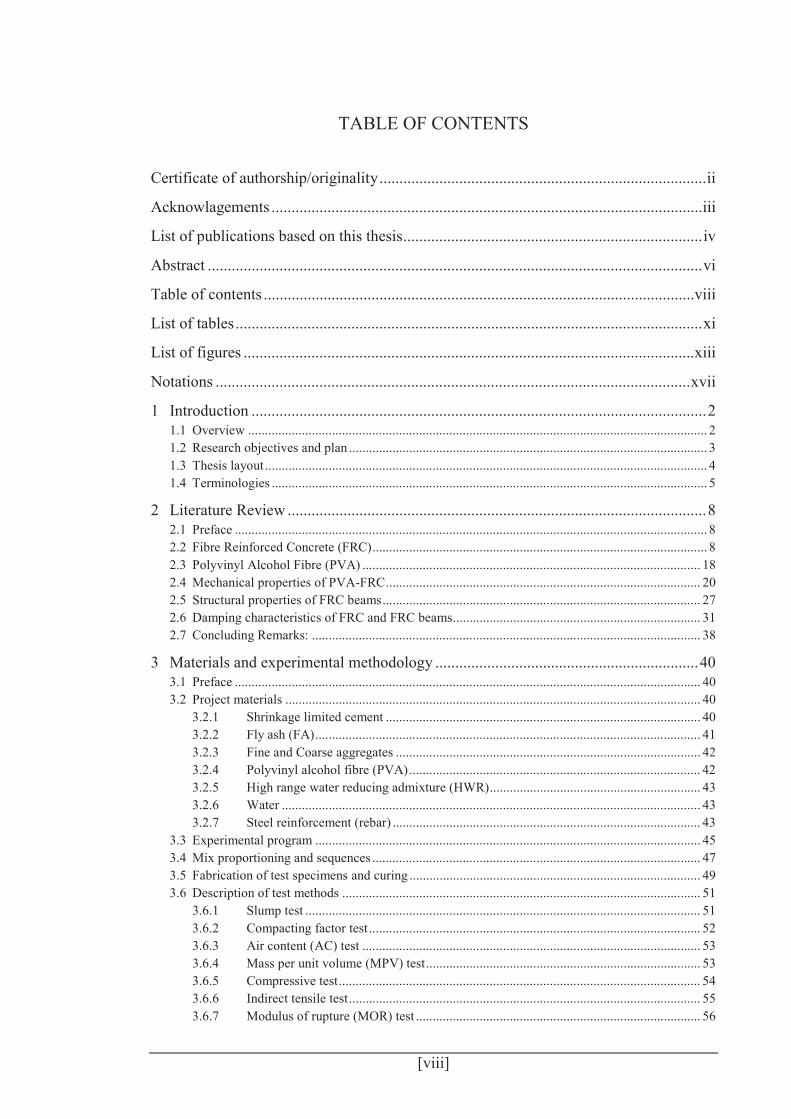
TABLE OF CONTENTS
Certificate of authorship/originality .................................................................................. ii
Acknowlagements ............................................................................................................ iii
List of publications based on this thesis ........................................................................... iv
Abstract ............................................................................................................................ vi
Table of contents ............................................................................................................ viii
List of tables ..................................................................................................................... xi
List of figures ................................................................................................................. xiii
Notations ....................................................................................................................... xvii
Introduction .................................................................................................................. 2 1 Overview ......................................................................................................................................... 2 1.1 Research objectives and plan ........................................................................................................... 3 1.2 Thesis layout .................................................................................................................................... 4 1.3 Terminologies .................................................................................................................................. 5 1.4
Literature Review ......................................................................................................... 8 22.1 Preface ............................................................................................................................................. 8 2.2 Fibre Reinforced Concrete (FRC) .................................................................................................... 8 2.3 Polyvinyl Alcohol Fibre (PVA) ..................................................................................................... 18 2.4 Mechanical properties of PVA-FRC .............................................................................................. 20 2.5 Structural properties of FRC beams ............................................................................................... 27 2.6 Damping characteristics of FRC and FRC beams.......................................................................... 31 2.7 Concluding Remarks: .................................................................................................................... 38
Materials and experimental methodology .................................................................. 40 33.1 Preface ........................................................................................................................................... 40 3.2 Project materials ............................................................................................................................ 40
3.2.1 Shrinkage limited cement .............................................................................................. 40 3.2.2 Fly ash (FA) ................................................................................................................... 41 3.2.3 Fine and Coarse aggregates ........................................................................................... 42 3.2.4 Polyvinyl alcohol fibre (PVA) ....................................................................................... 42 3.2.5 High range water reducing admixture (HWR) ............................................................... 43 3.2.6 Water ............................................................................................................................. 43 3.2.7 Steel reinforcement (rebar) ............................................................................................ 43
3.3 Experimental program ................................................................................................................... 45 3.4 Mix proportioning and sequences .................................................................................................. 47 3.5 Fabrication of test specimens and curing ....................................................................................... 49 3.6 Description of test methods ........................................................................................................... 51
3.6.1 Slump test ...................................................................................................................... 51 3.6.2 Compacting factor test ................................................................................................... 52 3.6.3 Air content (AC) test ..................................................................................................... 53 3.6.4 Mass per unit volume (MPV) test .................................................................................. 53 3.6.5 Compressive test ............................................................................................................ 54 3.6.6 Indirect tensile test ......................................................................................................... 55 3.6.7 Modulus of rupture (MOR) test ..................................................................................... 56
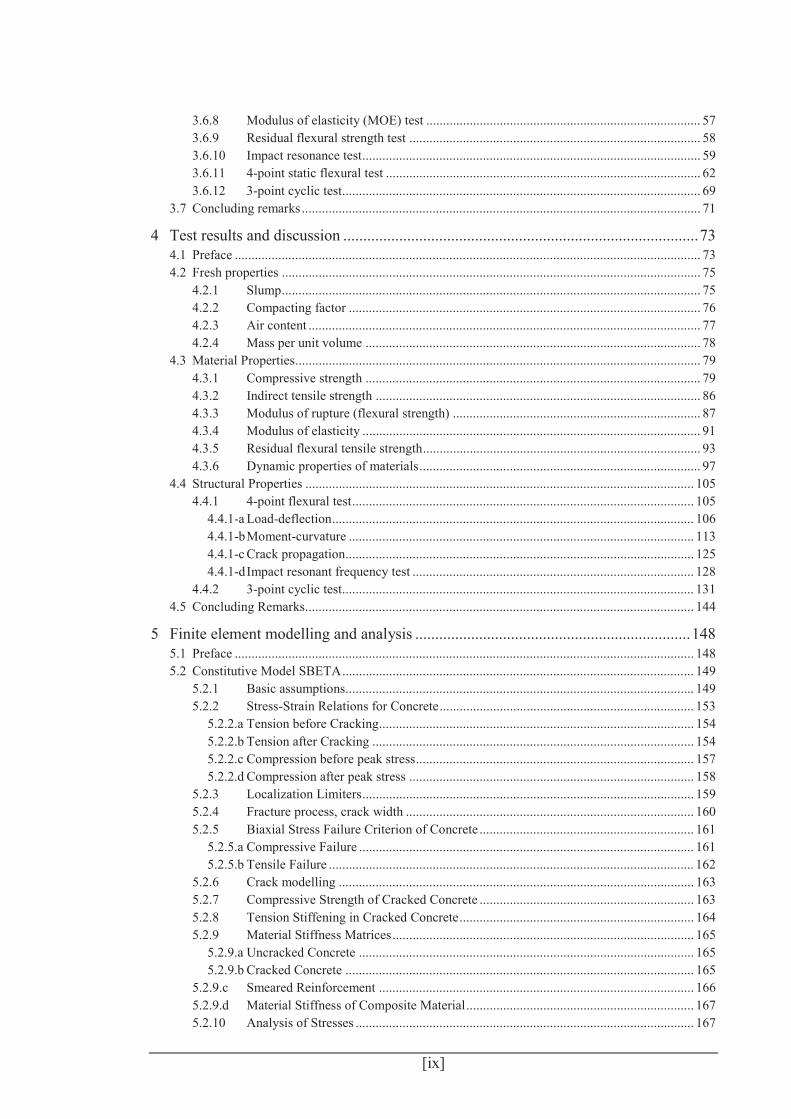
[ix]
3.6.8 Modulus of elasticity (MOE) test .................................................................................. 57 3.6.9 Residual flexural strength test ....................................................................................... 58 3.6.10 Impact resonance test ..................................................................................................... 59 3.6.11 4-point static flexural test .............................................................................................. 62 3.6.12 3-point cyclic test........................................................................................................... 69
3.7 Concluding remarks ....................................................................................................................... 71
Test results and discussion ......................................................................................... 73 44.1 Preface ........................................................................................................................................... 73 4.2 Fresh properties ............................................................................................................................. 75
4.2.1 Slump ............................................................................................................................. 75 4.2.2 Compacting factor ......................................................................................................... 76 4.2.3 Air content ..................................................................................................................... 77 4.2.4 Mass per unit volume .................................................................................................... 78
4.3 Material Properties ......................................................................................................................... 79 4.3.1 Compressive strength .................................................................................................... 79 4.3.2 Indirect tensile strength ................................................................................................. 86 4.3.3 Modulus of rupture (flexural strength) .......................................................................... 87 4.3.4 Modulus of elasticity ..................................................................................................... 91 4.3.5 Residual flexural tensile strength ................................................................................... 93 4.3.6 Dynamic properties of materials .................................................................................... 97
4.4 Structural Properties .................................................................................................................... 105 4.4.1 4-point flexural test ...................................................................................................... 105
4.4.1-a Load-deflection ............................................................................................................ 106 4.4.1-b Moment-curvature ....................................................................................................... 113 4.4.1-c Crack propagation........................................................................................................ 125 4.4.1-d Impact resonant frequency test .................................................................................... 128
4.4.2 3-point cyclic test......................................................................................................... 131 4.5 Concluding Remarks.................................................................................................................... 144
Finite element modelling and analysis ..................................................................... 148 55.1 Preface ......................................................................................................................................... 148 5.2 Constitutive Model SBETA ......................................................................................................... 149
5.2.1 Basic assumptions........................................................................................................ 149 5.2.2 Stress-Strain Relations for Concrete ............................................................................ 153
5.2.2.a Tension before Cracking.............................................................................................. 154 5.2.2.b Tension after Cracking ................................................................................................ 154 5.2.2.c Compression before peak stress ................................................................................... 157 5.2.2.d Compression after peak stress ..................................................................................... 158
5.2.3 Localization Limiters ................................................................................................... 159 5.2.4 Fracture process, crack width ...................................................................................... 160 5.2.5 Biaxial Stress Failure Criterion of Concrete ................................................................ 161
5.2.5.a Compressive Failure .................................................................................................... 161 5.2.5.b Tensile Failure ............................................................................................................. 162
5.2.6 Crack modelling .......................................................................................................... 163 5.2.7 Compressive Strength of Cracked Concrete ................................................................ 163 5.2.8 Tension Stiffening in Cracked Concrete ...................................................................... 164 5.2.9 Material Stiffness Matrices .......................................................................................... 165
5.2.9.a Uncracked Concrete .................................................................................................... 165 5.2.9.b Cracked Concrete ........................................................................................................ 165
5.2.9.c Smeared Reinforcement .............................................................................................. 166 5.2.9.d Material Stiffness of Composite Material .................................................................... 167 5.2.10 Analysis of Stresses ..................................................................................................... 167
[x]
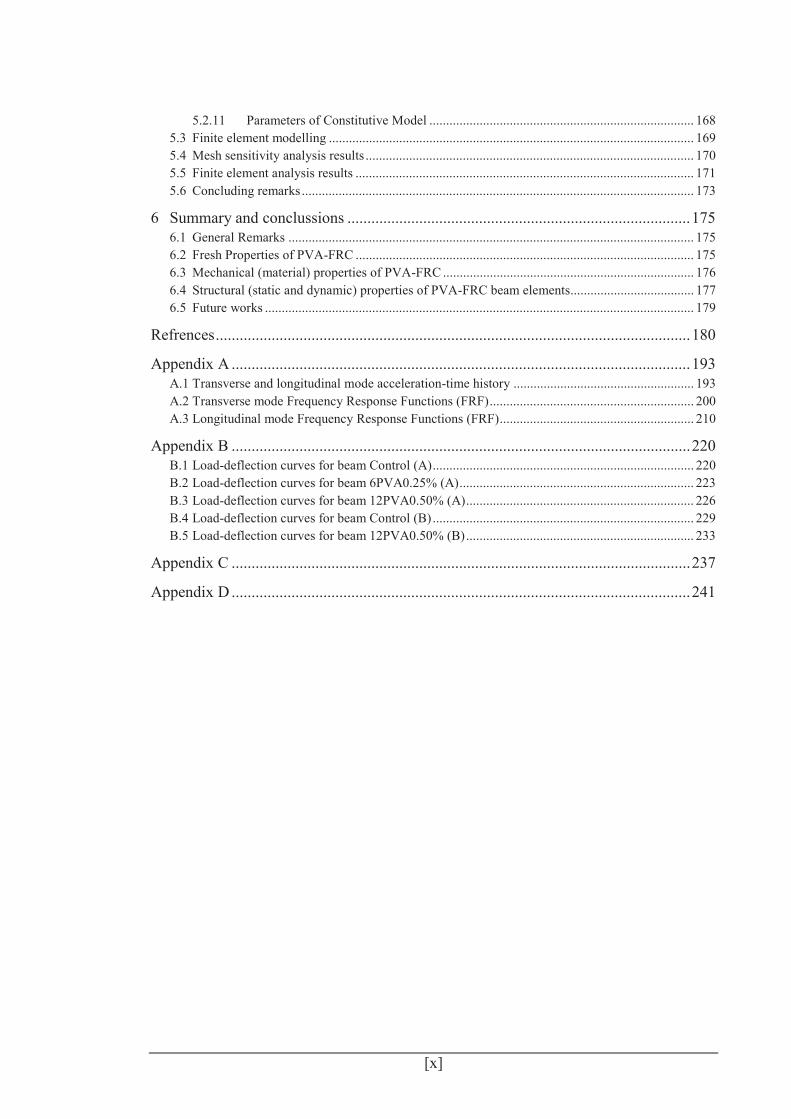
5.2.11 Parameters of Constitutive Model ............................................................................... 168 5.3 Finite element modelling ............................................................................................................. 169 5.4 Mesh sensitivity analysis results .................................................................................................. 170 5.5 Finite element analysis results ..................................................................................................... 171 5.6 Concluding remarks ..................................................................................................................... 173
Summary and conclussions ...................................................................................... 175 66.1 General Remarks ......................................................................................................................... 175 6.2 Fresh Properties of PVA-FRC ..................................................................................................... 175 6.3 Mechanical (material) properties of PVA-FRC ........................................................................... 176 6.4 Structural (static and dynamic) properties of PVA-FRC beam elements..................................... 177 6.5 Future works ................................................................................................................................ 179
Refrences ....................................................................................................................... 180
Appendix A ................................................................................................................... 193 A.1 Transverse and longitudinal mode acceleration-time history ...................................................... 193 A.2 Transverse mode Frequency Response Functions (FRF) ............................................................. 200 A.3 Longitudinal mode Frequency Response Functions (FRF).......................................................... 210
Appendix B ................................................................................................................... 220 B.1 Load-deflection curves for beam Control (A) .............................................................................. 220 B.2 Load-deflection curves for beam 6PVA0.25% (A) ...................................................................... 223 B.3 Load-deflection curves for beam 12PVA0.50% (A) .................................................................... 226 B.4 Load-deflection curves for beam Control (B) .............................................................................. 229 B.5 Load-deflection curves for beam 12PVA0.50% (B) .................................................................... 233
Appendix C ................................................................................................................... 237
Appendix D ................................................................................................................... 241
[xi]
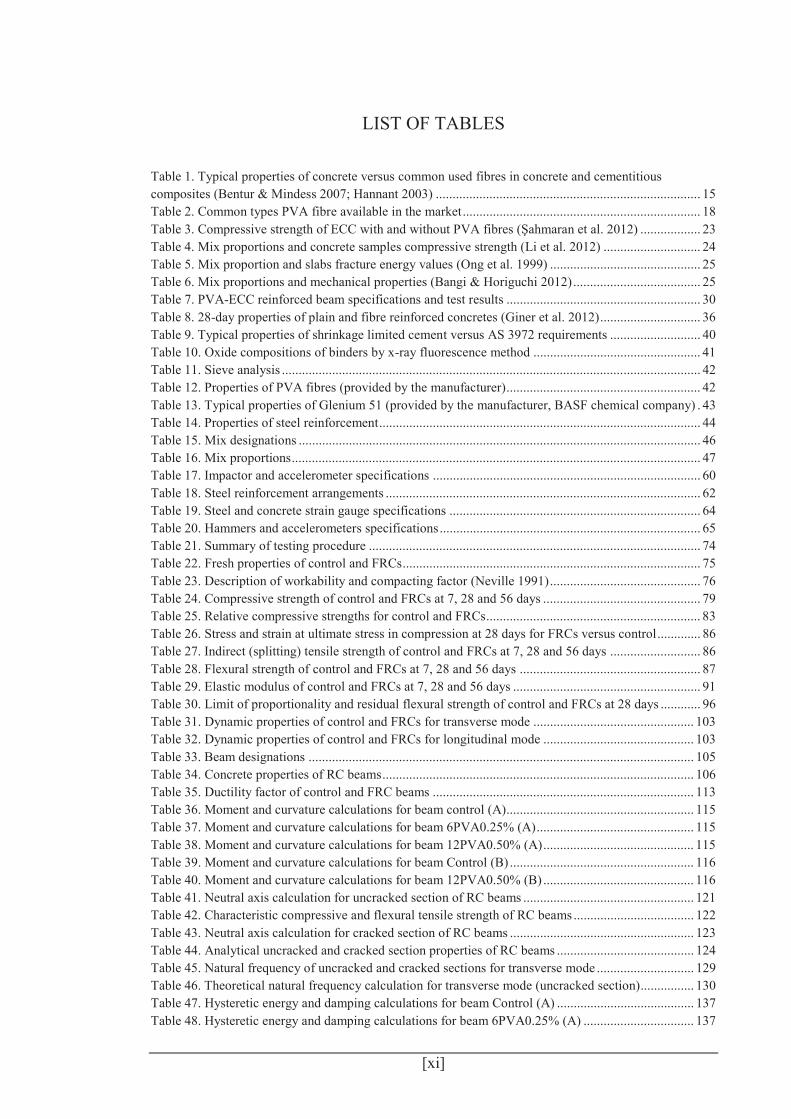
LIST OF TABLES
Table 1. Typical properties of concrete versus common used fibres in concrete and cementitious composites (Bentur & Mindess 2007; Hannant 2003) ............................................................................... 15 Table 2. Common types PVA fibre available in the market ....................................................................... 18 Table 3. Compressive strength of ECC with and without PVA fibres (Şahmaran et al. 2012) .................. 23 Table 4. Mix proportions and concrete samples compressive strength (Li et al. 2012) ............................. 24 Table 5. Mix proportion and slabs fracture energy values (Ong et al. 1999) ............................................. 25 Table 6. Mix proportions and mechanical properties (Bangi & Horiguchi 2012) ...................................... 25 Table 7. PVA-ECC reinforced beam specifications and test results .......................................................... 30 Table 8. 28-day properties of plain and fibre reinforced concretes (Giner et al. 2012) .............................. 36 Table 9. Typical properties of shrinkage limited cement versus AS 3972 requirements ........................... 40 Table 10. Oxide compositions of binders by x-ray fluorescence method .................................................. 41 Table 11. Sieve analysis ............................................................................................................................. 42 Table 12. Properties of PVA fibres (provided by the manufacturer).......................................................... 42 Table 13. Typical properties of Glenium 51 (provided by the manufacturer, BASF chemical company) . 43 Table 14. Properties of steel reinforcement ................................................................................................ 44 Table 15. Mix designations ........................................................................................................................ 46 Table 16. Mix proportions .......................................................................................................................... 47 Table 17. Impactor and accelerometer specifications ................................................................................ 60 Table 18. Steel reinforcement arrangements .............................................................................................. 62 Table 19. Steel and concrete strain gauge specifications ........................................................................... 64 Table 20. Hammers and accelerometers specifications .............................................................................. 65 Table 21. Summary of testing procedure ................................................................................................... 74 Table 22. Fresh properties of control and FRCs ......................................................................................... 75 Table 23. Description of workability and compacting factor (Neville 1991) ............................................. 76 Table 24. Compressive strength of control and FRCs at 7, 28 and 56 days ............................................... 79 Table 25. Relative compressive strengths for control and FRCs................................................................ 83 Table 26. Stress and strain at ultimate stress in compression at 28 days for FRCs versus control ............. 86 Table 27. Indirect (splitting) tensile strength of control and FRCs at 7, 28 and 56 days ........................... 86 Table 28. Flexural strength of control and FRCs at 7, 28 and 56 days ...................................................... 87 Table 29. Elastic modulus of control and FRCs at 7, 28 and 56 days ........................................................ 91 Table 30. Limit of proportionality and residual flexural strength of control and FRCs at 28 days ............ 96 Table 31. Dynamic properties of control and FRCs for transverse mode ................................................ 103 Table 32. Dynamic properties of control and FRCs for longitudinal mode ............................................. 103 Table 33. Beam designations ................................................................................................................... 105 Table 34. Concrete properties of RC beams ............................................................................................. 106 Table 35. Ductility factor of control and FRC beams .............................................................................. 113 Table 36. Moment and curvature calculations for beam control (A)........................................................ 115 Table 37. Moment and curvature calculations for beam 6PVA0.25% (A) ............................................... 115 Table 38. Moment and curvature calculations for beam 12PVA0.50% (A) ............................................. 115 Table 39. Moment and curvature calculations for beam Control (B) ....................................................... 116 Table 40. Moment and curvature calculations for beam 12PVA0.50% (B) ............................................. 116 Table 41. Neutral axis calculation for uncracked section of RC beams ................................................... 121 Table 42. Characteristic compressive and flexural tensile strength of RC beams .................................... 122 Table 43. Neutral axis calculation for cracked section of RC beams ....................................................... 123 Table 44. Analytical uncracked and cracked section properties of RC beams ......................................... 124 Table 45. Natural frequency of uncracked and cracked sections for transverse mode ............................. 129 Table 46. Theoretical natural frequency calculation for transverse mode (uncracked section)................ 130 Table 47. Hysteretic energy and damping calculations for beam Control (A) ......................................... 137 Table 48. Hysteretic energy and damping calculations for beam 6PVA0.25% (A) ................................. 137
[xii]
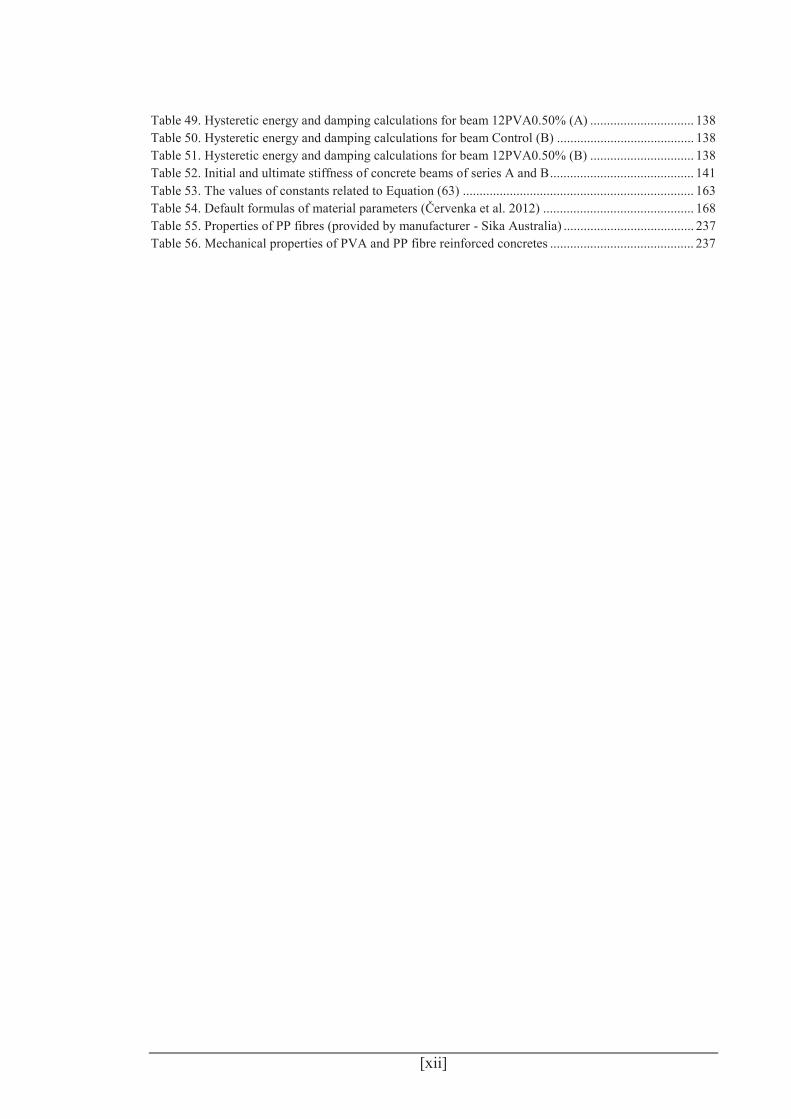
Table 49. Hysteretic energy and damping calculations for beam 12PVA0.50% (A) ............................... 138 Table 50. Hysteretic energy and damping calculations for beam Control (B) ......................................... 138 Table 51. Hysteretic energy and damping calculations for beam 12PVA0.50% (B) ............................... 138 Table 52. Initial and ultimate stiffness of concrete beams of series A and B ........................................... 141 Table 53. The values of constants related to Equation (63) ..................................................................... 163 Table 54. Default formulas of material parameters (Červenka et al. 2012) ............................................. 168 Table 55. Properties of PP fibres (provided by manufacturer - Sika Australia) ....................................... 237 Table 56. Mechanical properties of PVA and PP fibre reinforced concretes ........................................... 237
[xiii]
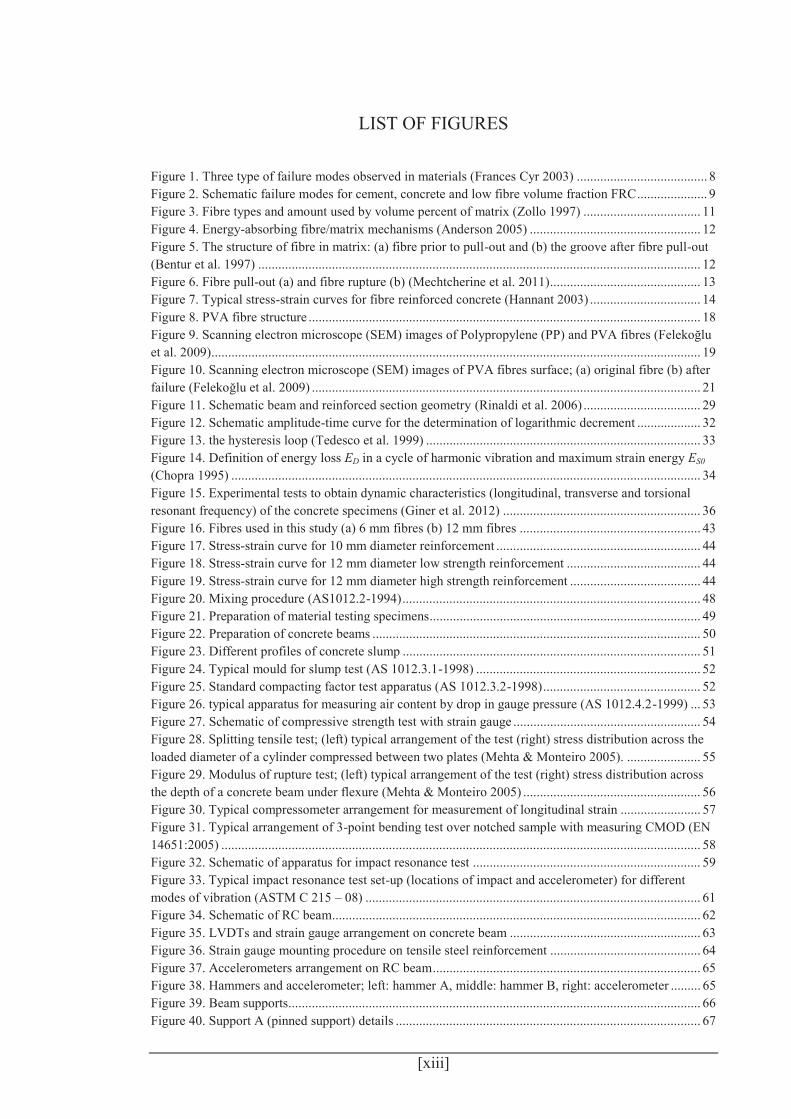
LIST OF FIGURES
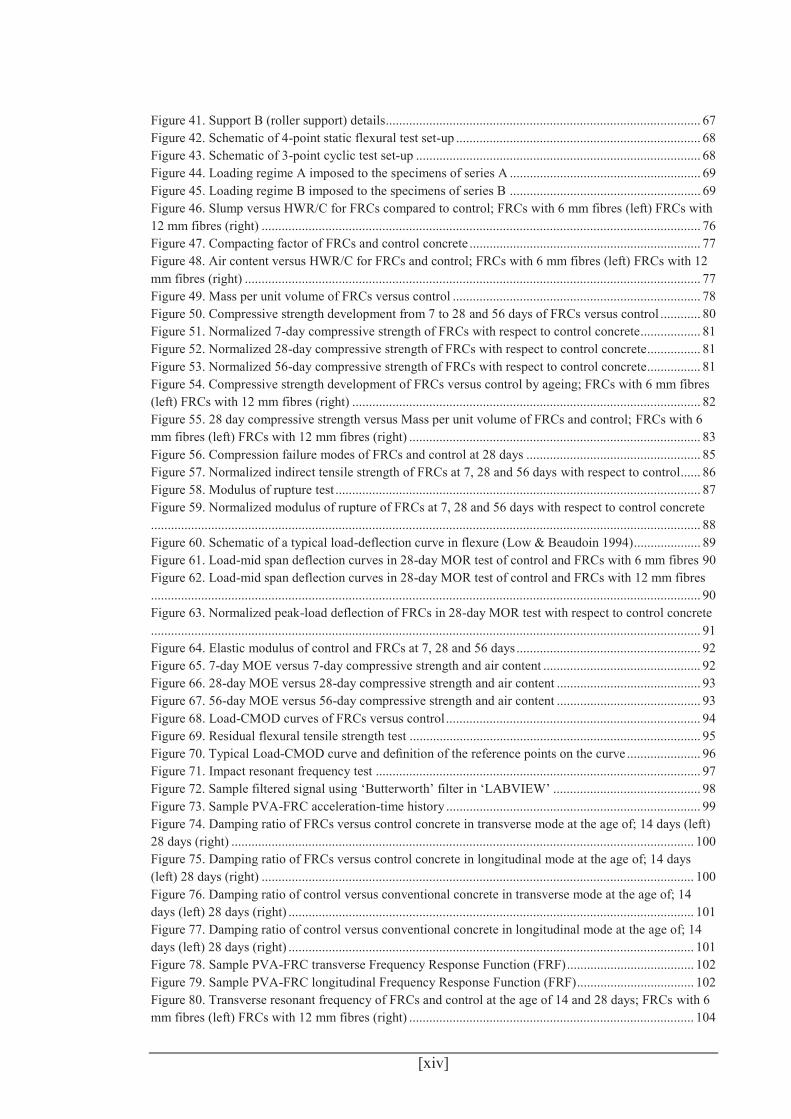
Figure 1. Three type of failure modes observed in materials (Frances Cyr 2003) ....................................... 8 Figure 2. Schematic failure modes for cement, concrete and low fibre volume fraction FRC ..................... 9 Figure 3. Fibre types and amount used by volume percent of matrix (Zollo 1997) ................................... 11 Figure 4. Energy-absorbing fibre/matrix mechanisms (Anderson 2005) ................................................... 12 Figure 5. The structure of fibre in matrix: (a) fibre prior to pull-out and (b) the groove after fibre pull-out (Bentur et al. 1997) .................................................................................................................................... 12 Figure 6. Fibre pull-out (a) and fibre rupture (b) (Mechtcherine et al. 2011)............................................. 13 Figure 7. Typical stress-strain curves for fibre reinforced concrete (Hannant 2003) ................................. 14 Figure 8. PVA fibre structure ..................................................................................................................... 18 Figure 9. Scanning electron microscope (SEM) images of Polypropylene (PP) and PVA fibres (Felekoğlu et al. 2009) .................................................................................................................................................. 19 Figure 10. Scanning electron microscope (SEM) images of PVA fibres surface; (a) original fibre (b) after failure (Felekoğlu et al. 2009) .................................................................................................................... 21 Figure 11. Schematic beam and reinforced section geometry (Rinaldi et al. 2006) ................................... 29 Figure 12. Schematic amplitude-time curve for the determination of logarithmic decrement ................... 32 Figure 13. the hysteresis loop (Tedesco et al. 1999) .................................................................................. 33 Figure 14. Definition of energy loss ED in a cycle of harmonic vibration and maximum strain energy ES0 (Chopra 1995) ............................................................................................................................................ 34 Figure 15. Experimental tests to obtain dynamic characteristics (longitudinal, transverse and torsional resonant frequency) of the concrete specimens (Giner et al. 2012) ........................................................... 36 Figure 16. Fibres used in this study (a) 6 mm fibres (b) 12 mm fibres ...................................................... 43 Figure 17. Stress-strain curve for 10 mm diameter reinforcement ............................................................. 44 Figure 18. Stress-strain curve for 12 mm diameter low strength reinforcement ........................................ 44 Figure 19. Stress-strain curve for 12 mm diameter high strength reinforcement ....................................... 44 Figure 20. Mixing procedure (AS1012.2-1994) ......................................................................................... 48 Figure 21. Preparation of material testing specimens................................................................................. 49 Figure 22. Preparation of concrete beams .................................................................................................. 50 Figure 23. Different profiles of concrete slump ......................................................................................... 51 Figure 24. Typical mould for slump test (AS 1012.3.1-1998) ................................................................... 52 Figure 25. Standard compacting factor test apparatus (AS 1012.3.2-1998) ............................................... 52 Figure 26. typical apparatus for measuring air content by drop in gauge pressure (AS 1012.4.2-1999) ... 53 Figure 27. Schematic of compressive strength test with strain gauge ........................................................ 54 Figure 28. Splitting tensile test; (left) typical arrangement of the test (right) stress distribution across the loaded diameter of a cylinder compressed between two plates (Mehta & Monteiro 2005). ...................... 55 Figure 29. Modulus of rupture test; (left) typical arrangement of the test (right) stress distribution across the depth of a concrete beam under flexure (Mehta & Monteiro 2005) ..................................................... 56 Figure 30. Typical compressometer arrangement for measurement of longitudinal strain ........................ 57 Figure 31. Typical arrangement of 3-point bending test over notched sample with measuring CMOD (EN 14651:2005) ............................................................................................................................................... 58 Figure 32. Schematic of apparatus for impact resonance test .................................................................... 59 Figure 33. Typical impact resonance test set-up (locations of impact and accelerometer) for different modes of vibration (ASTM C 215 – 08) .................................................................................................... 61 Figure 34. Schematic of RC beam.............................................................................................................. 62 Figure 35. LVDTs and strain gauge arrangement on concrete beam ......................................................... 63 Figure 36. Strain gauge mounting procedure on tensile steel reinforcement ............................................. 64 Figure 37. Accelerometers arrangement on RC beam ................................................................................ 65 Figure 38. Hammers and accelerometer; left: hammer A, middle: hammer B, right: accelerometer ......... 65 Figure 39. Beam supports........................................................................................................................... 66 Figure 40. Support A (pinned support) details ........................................................................................... 67
[xiv]
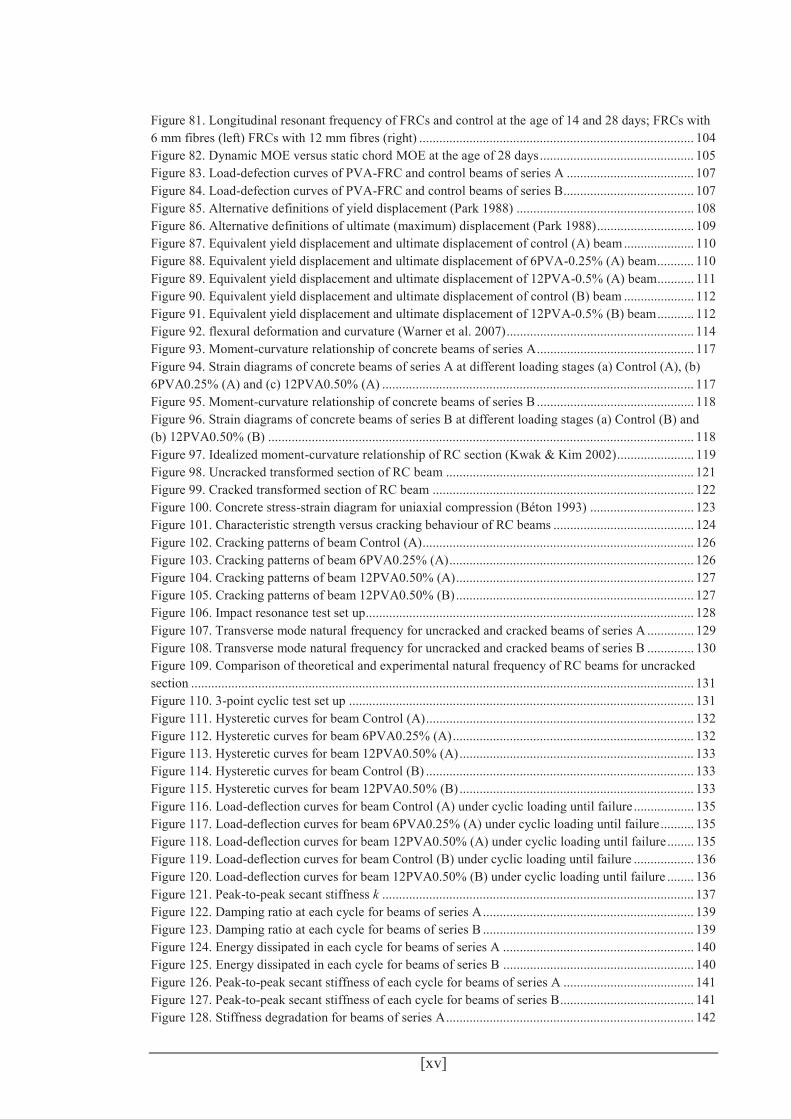
Figure 41. Support B (roller support) details.............................................................................................. 67 Figure 42. Schematic of 4-point static flexural test set-up ......................................................................... 68 Figure 43. Schematic of 3-point cyclic test set-up ..................................................................................... 68 Figure 44. Loading regime A imposed to the specimens of series A ......................................................... 69 Figure 45. Loading regime B imposed to the specimens of series B ......................................................... 69 Figure 46. Slump versus HWR/C for FRCs compared to control; FRCs with 6 mm fibres (left) FRCs with 12 mm fibres (right) ................................................................................................................................... 76 Figure 47. Compacting factor of FRCs and control concrete ..................................................................... 77 Figure 48. Air content versus HWR/C for FRCs and control; FRCs with 6 mm fibres (left) FRCs with 12 mm fibres (right) ........................................................................................................................................ 77 Figure 49. Mass per unit volume of FRCs versus control .......................................................................... 78 Figure 50. Compressive strength development from 7 to 28 and 56 days of FRCs versus control ............ 80 Figure 51. Normalized 7-day compressive strength of FRCs with respect to control concrete.................. 81 Figure 52. Normalized 28-day compressive strength of FRCs with respect to control concrete................ 81 Figure 53. Normalized 56-day compressive strength of FRCs with respect to control concrete................ 81 Figure 54. Compressive strength development of FRCs versus control by ageing; FRCs with 6 mm fibres (left) FRCs with 12 mm fibres (right) ........................................................................................................ 82 Figure 55. 28 day compressive strength versus Mass per unit volume of FRCs and control; FRCs with 6 mm fibres (left) FRCs with 12 mm fibres (right) ....................................................................................... 83 Figure 56. Compression failure modes of FRCs and control at 28 days .................................................... 85 Figure 57. Normalized indirect tensile strength of FRCs at 7, 28 and 56 days with respect to control ...... 86 Figure 58. Modulus of rupture test ............................................................................................................. 87 Figure 59. Normalized modulus of rupture of FRCs at 7, 28 and 56 days with respect to control concrete.................................................................................................................................................................... 88 Figure 60. Schematic of a typical load-deflection curve in flexure (Low & Beaudoin 1994) .................... 89 Figure 61. Load-mid span deflection curves in 28-day MOR test of control and FRCs with 6 mm fibres 90 Figure 62. Load-mid span deflection curves in 28-day MOR test of control and FRCs with 12 mm fibres.................................................................................................................................................................... 90 Figure 63. Normalized peak-load deflection of FRCs in 28-day MOR test with respect to control concrete.................................................................................................................................................................... 91 Figure 64. Elastic modulus of control and FRCs at 7, 28 and 56 days ....................................................... 92 Figure 65. 7-day MOE versus 7-day compressive strength and air content ............................................... 92 Figure 66. 28-day MOE versus 28-day compressive strength and air content ........................................... 93 Figure 67. 56-day MOE versus 56-day compressive strength and air content ........................................... 93 Figure 68. Load-CMOD curves of FRCs versus control ............................................................................ 94 Figure 69. Residual flexural tensile strength test ....................................................................................... 95 Figure 70. Typical Load-CMOD curve and definition of the reference points on the curve ...................... 96 Figure 71. Impact resonant frequency test ................................................................................................. 97 Figure 72. Sample filtered signal using ‘Butterworth’ filter in ‘LABVIEW’ ............................................ 98 Figure 73. Sample PVA-FRC acceleration-time history ............................................................................ 99 Figure 74. Damping ratio of FRCs versus control concrete in transverse mode at the age of; 14 days (left) 28 days (right) .......................................................................................................................................... 100 Figure 75. Damping ratio of FRCs versus control concrete in longitudinal mode at the age of; 14 days (left) 28 days (right) ................................................................................................................................. 100 Figure 76. Damping ratio of control versus conventional concrete in transverse mode at the age of; 14 days (left) 28 days (right) ......................................................................................................................... 101 Figure 77. Damping ratio of control versus conventional concrete in longitudinal mode at the age of; 14 days (left) 28 days (right) ......................................................................................................................... 101 Figure 78. Sample PVA-FRC transverse Frequency Response Function (FRF) ...................................... 102 Figure 79. Sample PVA-FRC longitudinal Frequency Response Function (FRF) ................................... 102 Figure 80. Transverse resonant frequency of FRCs and control at the age of 14 and 28 days; FRCs with 6 mm fibres (left) FRCs with 12 mm fibres (right) ..................................................................................... 104
[xv]
Figure 81. Longitudinal resonant frequency of FRCs and control at the age of 14 and 28 days; FRCs with 6 mm fibres (left) FRCs with 12 mm fibres (right) .................................................................................. 104 Figure 82. Dynamic MOE versus static chord MOE at the age of 28 days .............................................. 105 Figure 83. Load-defection curves of PVA-FRC and control beams of series A ...................................... 107 Figure 84. Load-defection curves of PVA-FRC and control beams of series B....................................... 107 Figure 85. Alternative definitions of yield displacement (Park 1988) ..................................................... 108 Figure 86. Alternative definitions of ultimate (maximum) displacement (Park 1988) ............................. 109 Figure 87. Equivalent yield displacement and ultimate displacement of control (A) beam ..................... 110 Figure 88. Equivalent yield displacement and ultimate displacement of 6PVA-0.25% (A) beam ........... 110 Figure 89. Equivalent yield displacement and ultimate displacement of 12PVA-0.5% (A) beam ........... 111 Figure 90. Equivalent yield displacement and ultimate displacement of control (B) beam ..................... 112 Figure 91. Equivalent yield displacement and ultimate displacement of 12PVA-0.5% (B) beam ........... 112 Figure 92. flexural deformation and curvature (Warner et al. 2007) ........................................................ 114 Figure 93. Moment-curvature relationship of concrete beams of series A ............................................... 117 Figure 94. Strain diagrams of concrete beams of series A at different loading stages (a) Control (A), (b) 6PVA0.25% (A) and (c) 12PVA0.50% (A) ............................................................................................. 117 Figure 95. Moment-curvature relationship of concrete beams of series B ............................................... 118 Figure 96. Strain diagrams of concrete beams of series B at different loading stages (a) Control (B) and (b) 12PVA0.50% (B) ............................................................................................................................... 118 Figure 97. Idealized moment-curvature relationship of RC section (Kwak & Kim 2002) ....................... 119 Figure 98. Uncracked transformed section of RC beam .......................................................................... 121 Figure 99. Cracked transformed section of RC beam .............................................................................. 122 Figure 100. Concrete stress-strain diagram for uniaxial compression (Béton 1993) ............................... 123 Figure 101. Characteristic strength versus cracking behaviour of RC beams .......................................... 124 Figure 102. Cracking patterns of beam Control (A) ................................................................................. 126 Figure 103. Cracking patterns of beam 6PVA0.25% (A) ......................................................................... 126 Figure 104. Cracking patterns of beam 12PVA0.50% (A) ....................................................................... 127 Figure 105. Cracking patterns of beam 12PVA0.50% (B) ....................................................................... 127 Figure 106. Impact resonance test set up.................................................................................................. 128 Figure 107. Transverse mode natural frequency for uncracked and cracked beams of series A .............. 129 Figure 108. Transverse mode natural frequency for uncracked and cracked beams of series B .............. 130 Figure 109. Comparison of theoretical and experimental natural frequency of RC beams for uncracked section ...................................................................................................................................................... 131 Figure 110. 3-point cyclic test set up ....................................................................................................... 131 Figure 111. Hysteretic curves for beam Control (A) ................................................................................ 132 Figure 112. Hysteretic curves for beam 6PVA0.25% (A) ........................................................................ 132 Figure 113. Hysteretic curves for beam 12PVA0.50% (A) ...................................................................... 133 Figure 114. Hysteretic curves for beam Control (B) ................................................................................ 133 Figure 115. Hysteretic curves for beam 12PVA0.50% (B) ...................................................................... 133 Figure 116. Load-deflection curves for beam Control (A) under cyclic loading until failure .................. 135 Figure 117. Load-deflection curves for beam 6PVA0.25% (A) under cyclic loading until failure .......... 135 Figure 118. Load-deflection curves for beam 12PVA0.50% (A) under cyclic loading until failure ........ 135 Figure 119. Load-deflection curves for beam Control (B) under cyclic loading until failure .................. 136 Figure 120. Load-deflection curves for beam 12PVA0.50% (B) under cyclic loading until failure ........ 136 Figure 121. Peak-to-peak secant stiffness k ............................................................................................. 137 Figure 122. Damping ratio at each cycle for beams of series A ............................................................... 139 Figure 123. Damping ratio at each cycle for beams of series B ............................................................... 139 Figure 124. Energy dissipated in each cycle for beams of series A ......................................................... 140 Figure 125. Energy dissipated in each cycle for beams of series B ......................................................... 140 Figure 126. Peak-to-peak secant stiffness of each cycle for beams of series A ....................................... 141 Figure 127. Peak-to-peak secant stiffness of each cycle for beams of series B........................................ 141 Figure 128. Stiffness degradation for beams of series A .......................................................................... 142
[xvi]
Figure 129. Stiffness degradation for beams of series B .......................................................................... 142 Figure 130. Discretization of a beam; numbers at the corners are node numbers, and the circled numbers are element numbers (Yeung 2008). ........................................................................................................ 148 Figure 131. Components of plane stress state (Červenka et al. 2012) ...................................................... 150 Figure 132. Components of plane strain state (Červenka et al. 2012) ...................................................... 150 Figure 133. Rotation of reference coordinate axes (Červenka et al. 2012) .............................................. 151 Figure 134. Concrete uniaxial stress-strain diagram (Červenka et al. 2012) ............................................ 153 Figure 135. Linear softening based on strain (Červenka et al. 2012) ....................................................... 156 Figure 136. Steel fiber reinforced concrete based on fracture energy (Červenka et al. 2012).................. 156 Figure 137. Steel fiber reinforced concrete based on strain (Červenka et al. 2012) ................................. 157 Figure 138. Compressive stress-strain diagram (Červenka et al. 2012) ................................................... 158 Figure 139. Softening displacement law in compression (Červenka et al. 2012) ..................................... 158 Figure 140. Definition of localization bands (Červenka et al. 2012) ....................................................... 160 Figure 141. Stages of crack opening (Červenka et al. 2012) .................................................................... 160 Figure 142. Biaxial failure function for concrete (Červenka et al. 2012) ................................................. 161 Figure 143. Tension-compression failure function for concrete (Červenka et al. 2012) .......................... 163 Figure 144. Compressive strength reduction of cracked concrete (Červenka et al. 2012) ....................... 164 Figure 145. RC beam schematic modelled in ATENA ............................................................................ 169 Figure 146. SBETA Material used in FE modelling ................................................................................ 169 Figure 147. Reinforcement model used in FE modelling ......................................................................... 170 Figure 148. FE modelling result of beam Control (A) ............................................................................. 171 Figure 149. FE modelling result of beam Control (A) ............................................................................. 172 Figure 150. FE modelling result of beam 6PVA0.25% (A) ..................................................................... 172 Figure 151. FE modelling result of beam 12PVA0.50% (A) ................................................................... 172 Figure 152. FE modelling result of beam Control (B) ............................................................................. 173 Figure 153. FE modelling result of beam 12PVA0.50% (B) ................................................................... 173 Figure 154. 18 mm monofilament PP fibres (left) and 19 mm fibrillated PP fibres (right) ..................... 237 Figure 155. 7-day compressive strength of PVA and PP-FRCs ............................................................... 238 Figure 156. 28-day compressive strength of PVA and PP-FRCs ............................................................. 238 Figure 157. 56-day compressive strength of PVA and PP-FRCs ............................................................. 239 Figure 158. 28-day modulus of rupture of PVA and PP-FRCs ................................................................ 239 Figure 159. 28-day modulus of elasticity of PVA and PP-FRCs ............................................................. 240 Figure 160. FE modelling results of beam element .................................................................................. 241
[xvii]
NOTATIONS
The symbols used in this thesis, including their definitions, are listed below.
As cross-sectional area of reinforcement
Asc cross-sectional area of compressive reinforcement
Ast cross-sectional area of longitudinal tensile reinforcement
b width of a rectangular cross-section
c distance from the extreme compression fibre to the neutral axis
d effective depth (the distance from the extreme fibre to the centroid of the tensile steels)
dʹ distance from the extreme compressive fibre to the centroid of the compression steels
df diameter of fibre
Ec static modulus of elasticity of concrete
Ef modulus of elasticity of fibre
Es modulus of elasticity of steel reinforcement
fc compressive strength of concrete – stress in concrete
f ʹc characteristic compressive (cylinder) strength of concrete
fct uniaxial tensile strength of concrete
fct.sp indirect (splitting) tensile strength of concrete
fct.f flexural strength (modulus of rupture) of concrete
fs stress in tension reinforcement
fy specified yield strength of steel reinforcement
fsy yield strength of steel reinforcement
fsu ultimate strength of steel reinforcement
Fu ultimate (maximum) load applied
[xviii]
h overall height of a rectangular cross-section
Ig second moment of area of the uncracked cross-section
Icr second moment of area of the cracked cross-section
Lf length of fibre
Mcr cracking moment
My yield moment
n modular ratio (Es/Ec)
Vf fibre volume fraction
εcu strain at peak stress (compression) of concrete
εcc concrete strain in compression
εts steel strain in tension
εs strain in tension reinforcement
εsy yield strain of steel reinforcement
εsu uniform strain at maximum stress, corresponding to the onset of necking
ρs longitudinal tension reinforcement ratio (Ast/bd)
ρʹs longitudinal compression reinforcement ratio (Asc/bd)
ξ damping ratio (percentage of critical damping)
δ logarithmic decrement
δy yield displacement of reinforced concrete beam
δu ultimate displacement of reinforced concrete beam
μ ductility factor
Øcr curvature corresponding to the cracking moment (Mcr)
Øy curvature corresponding to the yield moment (My)