MECHANICAL AND OPTICAL CHARACTERIZATION OF FORCE …
129
MECHANICAL AND OPTICAL CHARACTERIZATION OF FORCE INDUCED CHEMICAL REACTIONS IN SOLID STATE LINEAR POLYMERS BY BRETT A. BEIERMANN DISSERTATION Submitted in partial fulfillment of the requirements for the degree of Doctor of Philosophy in Materials Science and Engineering in the Graduate College of the University of Illinois at Urbana-Champaign, 2013 Urbana, Illinois Doctoral Committee: Professor Nancy Sottos, Chair and Director of Research Professor Paul Braun Professor Scott White Professor Jeffrey Moore Professor Jianjun Cheng
Transcript of MECHANICAL AND OPTICAL CHARACTERIZATION OF FORCE …

MECHANICAL AND OPTICAL CHARACTERIZATION
OF FORCE INDUCED CHEMICAL REACTIONS
IN SOLID STATE LINEAR POLYMERS
BY
BRETT A. BEIERMANN
DISSERTATION
Submitted in partial fulfillment of the requirements
for the degree of Doctor of Philosophy in Materials Science and Engineering
in the Graduate College of the
University of Illinois at Urbana-Champaign, 2013
Urbana, Illinois
Doctoral Committee:
Professor Nancy Sottos, Chair and Director of Research
Professor Paul Braun
Professor Scott White
Professor Jeffrey Moore
Professor Jianjun Cheng
ii
ABSTRACT
Traditionally, chemical reactions are driven by thermal, chemical, or electrical potential.
By linking force-sensitive chemical species (mechanophores) into polymer backbones,
mechanical force can drive chemical reactions. Mechanophores have been developed with
potential as damage sensing, self-healing, and self-reinforcing materials. This research
investigates the conditions for promoting mechanophore activation in bulk, linear polymers.
An optically active mechanophore is studied. The mechanophore, spiropyran (SP), reacts
to a merocyanine (MC) form under tensile force when linked into a polymer backbone. This
reaction is reversible and can be driven toward either SP or MC photochemically. Reaction of
SP to MC (activation) is accompanied by the emergence of a strong color change and
fluorescence signal. SP is incorporated into a polymer backbone by using the mechanophore as
an initiator for a living radical polymerization and growing polymer chains at two sites across the
SP molecule, thereby covalently bonding the mechanophore in the center of a polymer chain.
Polymer mechanics and mechanophore activation are characterized in both glassy and
elastomeric polymers. An experimental set-up is designed and implemented to simultaneously
measure stress, strain, fluorescence, and birefringence during tensile deformation of SP-linked
polymer samples. By varying the loading conditions and polymer mechanical properties,
mechanophore activation is examined as a function of the stress, polymer mobility, structure and
orientation of polymer chains.
In an elastomeric polymer, poly(methyl acrylate) (PMA), higher macroscopic stress leads
to higher degrees of SP activation at lower levels of deformation. By changing the polymer
architecture - increasing the number of polymer chains attached to the mechanophore - increased

iii
activation is demonstrated at relatively slow deformation rates. Activation energy for the
SP↔MC conversion is quantified for an elastomeric polymer based on the kinetics of the
reaction. The effect of varying stress on reaction rates and energy barriers is determined using a
combined experimental and theoretical approach.
Tensile deformation of SP-linked glassy polymers at room temperature (RT) does not
lead to detectable mechanophore activation. Increasing polymer chain mobility, either using a
plasticizing solvent or varying test temperature, leads to a range of thermomechanical properties
in which glassy SP-linked polymers can be activated by tensile deformation. Within this
favorable activation window, the strain to activation varies based on the stiffness of the polymer.
The minimum observed strain to activation is approximately 5%, coincident with the onset of
polymer yield.
The role of polymer chain alignment and mechanophore orientation are studied using
optical techniques. Polymer chain alignment is determined by measurement of birefringence.
Activation of mechanophores occurred when polymer chains reached a maximum alignment
implying that energy is most efficiently transferred to SP when the polymer chains are aligned in
the direction of force. Additionally, mechanophore orientation within the polymer backbone is
measured by polarized fluorescence measurements. Mechanophores oriented in the direction of
force activate preferentially when compared to those unaligned with the loading direction.
Polarized fluorescence measurements also provide insight on polymer mechanics and force on
polymer chains.
The force driven reaction of spiropyran mechanophores investigated in this dissertation
provides useful guidelines for development and characterization of future mechanochemically

iv
active material systems. Polymer architecture, mobility and molecular force transfer are critical
variables that control mechanophore activity in bulk polymers.

v
ACKNOWLEDGEMENTS
I want to acknowledge the mentors who have taken the time to support my curiosity and
interests, starting with my parents, who raised me to ask questions, and all of the other teachers
who have played a part in my life. Dr. Michael Keller introduced me to academic research and
was an outstanding mentor during my undergraduate studies. My thesis committee, specifically
Professors Scott White, Jeffrey Moore, Paul Braun, and Jianjun Cheng have provided guidance
which has allowed me to succeed in graduate school. Most of all I would like to acknowledge
the time, effort and interest my research advisor, Professor Nancy Sottos, has provided.
I’d like to thank all of the friends and colleagues within the AMS group who have helped
me with research and served as positive examples for growth and success. Douglas Davis and
Preston May provided materials and knowledge in the chemistry field, and without their help I
would not be where I am today. Sharlotte Kramer was an outstanding mentor who taught me
optical techniques and helped drive my research forward. Meredith Silberstein, Cassandra
Kingsbury and Corissa Lee were a consistent resource for intelligent conversation within my
field.
Finally I would like to acknowledge funding from the Army Research Office, and the
resources of the Beckman Institute and University of Illinois. I want to thank Greg Milner at the
Aerospace Engineering machine shop, and Scott Robinson at Beckman’s Imaging Technology
Group for their assistance over the years.
vi
TABLE OF CONTENTS
CHAPTER 1: INTRODUCTION ........................................................................................1
1.1 Mechanically Responsive Polymeric Materials .................................................1
1.2 Force-Induced Reaction of Spiropyran-Linked Polymers .................................5
1.3 Thermomechanical Behavior of Mechanochemically Active Polymers ...........6
1.4 Polymer Orientation Measurement ....................................................................8
1.5 Overview of Thesis Research ............................................................................9
CHAPTER 2: SYNTHESIS AND FUNDAMENTAL CHARACTERIZATION
OF SPIROPYRAN-LINKED POLYMERS ......................................................................11
2.1 Introduction ......................................................................................................11
2.2 Results ..............................................................................................................13
2.2.1 Synthesis of Linear Polymers by Living Radical Polymerizations ...13
2.2.2 Thermomechanical Properties of SP-Linked Polymers ....................17
2.2.3 SP Cleavage Experiments .................................................................19
2.2.4 Fluorescence Spectra of SP-Linked Polymers ..................................20
2.3 Conclusions ......................................................................................................23
CHAPTER 3: MECHANICAL AND OPTICAL CHARACTERIZATION
OF AN SP-LINKED ELASTOMER .................................................................................25
3.1 Introduction ......................................................................................................25
3.2 Experimental ....................................................................................................26
3.2.1 Materials ...........................................................................................26
3.2.2 Tensile Testing Protocol ...................................................................28
3.2.3 Combined Mechanical and Optical Experimental Setup ..................28
3.2.4 Birefringence and Fluorescence Measurement ................................32
3.3 Results and Discussion ....................................................................................34
3.3.1 Simultaneous Measurement of Stress, Birefringence and
Fluorescence .....................................................................................34
3.3.2 Deformation Rate Dependence in Linear Active SP-Linked PMA ...37
3.3.3 Deformation Rate Dependence in Difunctional Control
SP-Linked PMA .................................................................................39
3.3.4 Stress Relaxation Behavior of Active SP-Linked PMA .....................43
3.3.5 Stress Relaxation Behavior of Difunctional Control
SP-Linked PMA .................................................................................45
3.3.6 Effect of Mechanophore Architecture: SP Activation in Linear,
4-Arm, and 8-Arm SP ........................................................................46
3.4 Conclusions ......................................................................................................50
CHAPTER 4: EFFECT OF STRESS ON SP-MC REACTION KINETICS
AND ACTIVATION ENERGY ........................................................................................52
4.1 Introduction and Theory ..................................................................................52
4.2 Experimental Methods .....................................................................................55
4.2.1 SP-Linked PMA Samples and Treatment ..........................................55

vii
4.2.2 Combined Fluorescence Kinetics and Mechanical Testing ..............56
4.3 Results and Discussion ....................................................................................57
4.3.1 SP Reaction Kinetics with No Applied Load.....................................57
4.3.2 Effect of Applied Mechanical Load on SP Reaction Kinetics ...........60
4.4 Conclusions ......................................................................................................66
CHAPTER 5: SP ACTIVATION IN A GLASSY POLYMER: EFFECT OF
THERMOMECHANICAL BEHAVIOR .........................................................................67
5.1 Introduction ......................................................................................................67
5.2 Experimental Methods .....................................................................................68
5.2.1 Synthesis and Characterization ........................................................68
5.2.2 Sample Molding ................................................................................68
5.2.3 Mechanical Testing ...........................................................................69
5.3 Results and Discussion ....................................................................................71
5.3.1 Effect of Temperature on Mechanical Activation .............................71
5.3.2 SP Activation in MeOH Plasticized PMMA ......................................73
5.3.3 SP Activation in DBP Plasticized PMMA .........................................75
5.3.4 Creep Loading of SP-Linked PMMA ................................................77
5.4 Conclusions ......................................................................................................78
CHAPTER 6: FLUORESCENCE POLARIZATION MEASUREMENTS OF
MECHANOPHORE ORIENTATION ............................................................................80
6.1 Introduction ......................................................................................................80
6.2 Experimental Methods .....................................................................................81
6.2.1 SP-Linked Polymer Samples .............................................................81
6.2.2 Mechanical Testing ...........................................................................83
6.3 Results and Discussion ....................................................................................84
6.3.1 Alignment of Mechanophores with the Tensile Direction .................84
6.3.2 Role of Mechanophore Orientation in a SP-Linked Elastomer ........85
6.3.3 Orientation in a Mechanically-Activated Glassy Polymer ...............86
6.4 Summary and Conclusions ..............................................................................87
CHAPTER 7: MECHANOPHORE ACTIVATION IN POLYSTYRENE
THIN FILMS ....................................................................................................................89
7.1 Introduction ......................................................................................................89
7.2 Experimental Methods .....................................................................................90
7.2.1 SP-Linked Polystyrene ......................................................................90
7.2.2 Nd:YAG Shockwave Sample Preparation .........................................90
7.2.3 Mechanical Loading and Analysis ....................................................91
7.3 Results and Discussion ....................................................................................94
7.3.1 Shockwave Loading of Thin Films ....................................................94
7.4 Conclusions ......................................................................................................98

viii
CHAPTER 8: SUMMARY AND FUTURE WORK ......................................................100
8.1 Summary of Thesis Research .........................................................................100
8.2 Future Work ...................................................................................................101
8.2.1 Solid State Activation of New Mechanophores ...............................101
8.2.2 A Bio-Inspired Mechanochemical System:
Synthetic Mechanotransductive Channels ...............................................105
REFERENCES ................................................................................................................110
APPENDIX A: BULK SAMPLE DIMENSIONS .........................................................116
APPENDIX B: EMPIRICALLY DERIVED SP-LINKED PMA
FLUORESCENCE KINETICS ......................................................................................117
1
CHAPTER 1
INTRODUCTION
1.1 Mechanically Responsive Polymeric Materials
Traditionally, chemical reactions are driven by thermal, chemical, or electrical potential.
Applications of mechanical force can also cleave chemical bonds and form new chemical
species. In nature, mechanochemical processes are abundant, affecting processes such as bone
growth, wound healing [1], maintaining cell pressure [2] and transduction of sound waves for
hearing [3, 4]. Mechanochemistry in ceramics and metals has been studied throughout the
1900s. These processes typically involve milling, shearing or abrasion to achieve bond breakage
and re-formation. Similarly in polymer chains mechanical force via milling in the solid state or
sonication in solution state can cleave carbon-carbon bonds in polymer backbones [5-9]. These
methods are typically destructive and the chemical changes are not particularly selective [10-12].
In recent years, a novel method of mechanochemistry has been developed incorporating site-
specific force-responsive chemical moieties, or mechanophores, into polymer backbones [13-25].
The mechanophore approach promotes energy transfer, via mechanical force, to specific weak
bonds along the polymer backbone. A variety of advantageous chemical responses can be
achieved in response to applied force, such as color change, cross-linking and catalyst release.
The research presented in this dissertation investigates parameters influencing mechanochemical
response in bulk mechanophore-linked polymers.
Deformation of bulk polymeric materials requires the input of relatively large amounts of
energy. The polymer must overcome both the intermolecular resistance of individual chains
flowing past each other, and the configurational entropy change due to alignment of the polymer
2
chains [5, 26, 27]. Eventually, the energy input is sufficient to drive cleavage of a polymer
backbone, and polymer failure results [28]. By incorporating mechanophores into the polymer
backbone, this energy can facilitate an advantageous chemical change in the polymer system
prior to cleavage of the polymer backbone and bulk failure.
A number of approaches have previously been taken to mechanically stimulate an
advantageous response in solid state polymers, such as change in optical properties, cross-
linking, or change in pH. Color change is one desirable mechanically-stimulated response, to act
as visual sensors for stress, strain or damage in structural materials. To this end, Rubner et al.
demonstrated that strain-induced conformational changes and alignment of poly(acetylene) affect
the absorbance and therefore color of the bulk polymer [29]. Christoph Weder’s research group
similarly used conformational changes to vary the photoluminescent emission of eximers in
response to applied deformation of a host polymer [30, 31]. Other relevant functionalities of
force-stimulated response in polymer systems have been geared toward initiating a further
reaction, such as cross-linking of the polymer. Huck et al. have demonstrated the ability to alter
the pH state of polymer brushes based on applied deformation [32]. This change in pH -
particularly acid generation – has potential to initiate cross-linking reactions.
In 2008, Hickenboth et al. published seminal work indicating site-specific force-induced
chemical reaction of benzocyclobutene 4-member rings, covalently bonded into the center of
polymer backbones [13]. Force was applied to polymer chains in a dilute solution via sonication.
Sonication is known to cleave polymers of sufficient molecular weight along C-C bonds of the
polymer backbone. Benzocyclobutene units (mechanophores) were incorporated into a polymer
backbone, and under force the 4-member butane ring was selectively cleaved, and not the
polymer chains [13]. Subsequently a number of mechanophore chemistries have been covalently
3
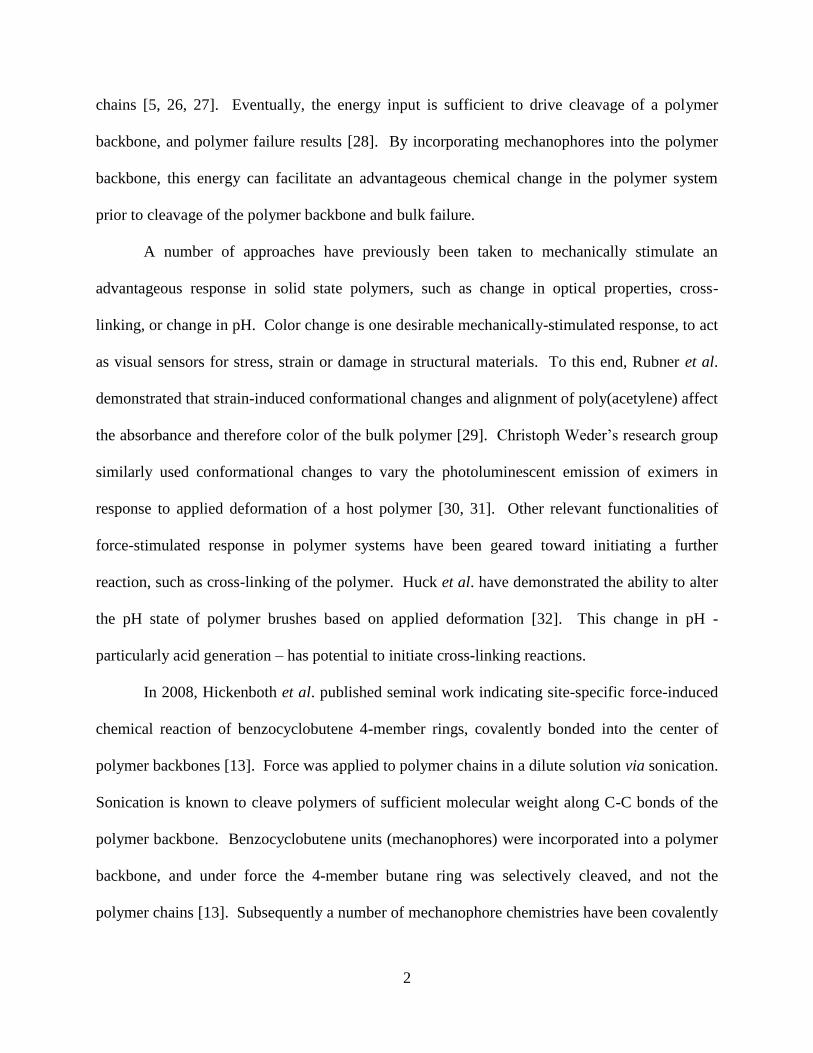
bonded into polymer chains and activated by sonication [14, 17, 19, 22-25]. Table 1.1 provides
an overview of mechanophore chemistries and functionalities developed since 2007.
The mechanophore functionalities demonstrated in solution have a broad range of
applicability. For example, a number of mechanophores are geared toward driving reactions
with mechanical force that are difficult or impossible to achieve by other methods. Examples
include cycloreversion of azide and alkyne moieties (“unclicking a click reaction”) [21] and
force-driven retro-Diels-Alder reactions [20]. Bielawski et al. as well as Sijbesma et al. have
demonstrated release of organometallic catalysts by mechanical force [22, 23, 25]. Catalyst-
releasing mechanophores have been used to stimulate additional reactions to alter mechanical,
optical or electronic properties of the material system.
Perhaps the most prominent method for achieving mechanophore reactivity is ring-
opening reactions. Ring-opening of 3, 4, 5, and 6 member cyclic structures have been driven by
an applied force [13, 14, 17, 18]. Ring-opening chemistries have been designed such that
activation is accompanied by favorable material changes, such as color change [14], radical
formation [17], and acid release [18]. Ring-opening chemistries are as yet the only
mechanophores which have shown mechanochemical activity in solid state polymers [15, 16,
18].
Solid state mechanochemical activation, as opposed to solution state, is a major step
toward applicability of mechanophores in commercial and/or structural polymeric materials. The
predominant goals for solid state mechanochemical functionality include color change for visual
stress or damage sensors, or cross-linking for adaptive mechanical properties (particularly
stiffness) with applied load. Research presented in this dissertation utilizes a spiropyran- (SP-)
4
Table 1.1. Overview of mechanophores developed since 2007. Force-sensitive bonds are labeled in red.
based mechanophore devised by Potisek et al.[14] Spiropyrans undergo a reversible
electrocyclic ring opening reaction (Fig 1.1), which is accompanied by a strong color change and
the emergence of a fluorescence signal. Ease of detection and reversibility make SP an ideal

5
probe for determining factors which influence mechanochemical reactions in bulk polymer
systems.
Figure 1.1. Mechanochemically active SP linked into a polymer backbone. a) Chemical structures of SP
(left) and MC (right). b) SP-linked poly(methyl acrylate) (PMA) driven toward the SP form with 532 nm
light (left) and toward the MC form with 385 nm light (right). c) SP-linked PMA driven toward the SP
form with 532 nm light (left) and mechanically activated to the MC form in the gauge section (right).
1.2 Force-Induced Reaction of Spiropyran-Linked Polymers
Spiropyrans are a class of molecules known since the 1950s to undergo a 6-π
electrocyclic ring-opening reaction to a vibrantly colored merocyanine (MC) form [33, 34].
Chemical structures for SP and expected MC form investigated in this dissertation are included
in Fig 1.1a. A fluorescence signal in the visible range accompanies the absorbance (i.e. color
change) of the MC form [35]. The particular absorption and fluorescence emission spectra of
MC depend on any attached side groups on the SP/MC molecule (for example, the attached
polymer chains are side groups) as well as the polarity of the surrounding environment [36, 37].
6
At room temperature with no external stimuli, both the SP and MC forms are effectively stable.
The transition between the two forms is reversibly photochromic: UV light (ca. 385 nm) drives
equilibrium toward the MC form, while visible (typically green) light promotes the SP species.
Images of a SP-linked polymer sample, driven toward the SP form and MC form with
appropriate light sources, are included in Fig 1.1b. The purple color of the UV-irradiated sample
indicates presence of the MC form.
Potisek et al. first devised a method to functionalize the SP molecule such that it can be
covalently bonded into a polymer backbone [14]. A number of publications have subsequently
achieved solid state mechanically-induced activation of SP in a variety of bulk polymers [15, 38-
40]. Fig 1.1c is a representative image of force-induced mechanochemical activation of a SP-
linked polymer (discussed in Chapter 3). However, many of the fundamental parameters
affecting mechanophore activation, such as stress, strain and polymer chain orientation have not
been fully explored. The thesis research presented in this dissertation combines mechanical and
optical measurements of SP-linked polymers to define the parameters promoting
mechanochemical activation of SP, which can be applied to emerging mechanophore
chemistries.
1.3 Thermomechanical Behavior of Mechanochemically Active Polymers
A fundamental topic of research for solid state mechanophore-linked polymers is the
interplay between stress, strain and activation. Although SP activation has been shown in a
number of different polymers [15, 38, 39], the relationship between polymer mechanics and
activation is not yet fully understood. In this dissertation, the mechanochemical response of SP-
linked polymers was monitored while varying parameters such as mechanical test protocol,
7
polymer chemistry, mechanophore structure, and thermomechanical response of a specific
polymer chemistry.
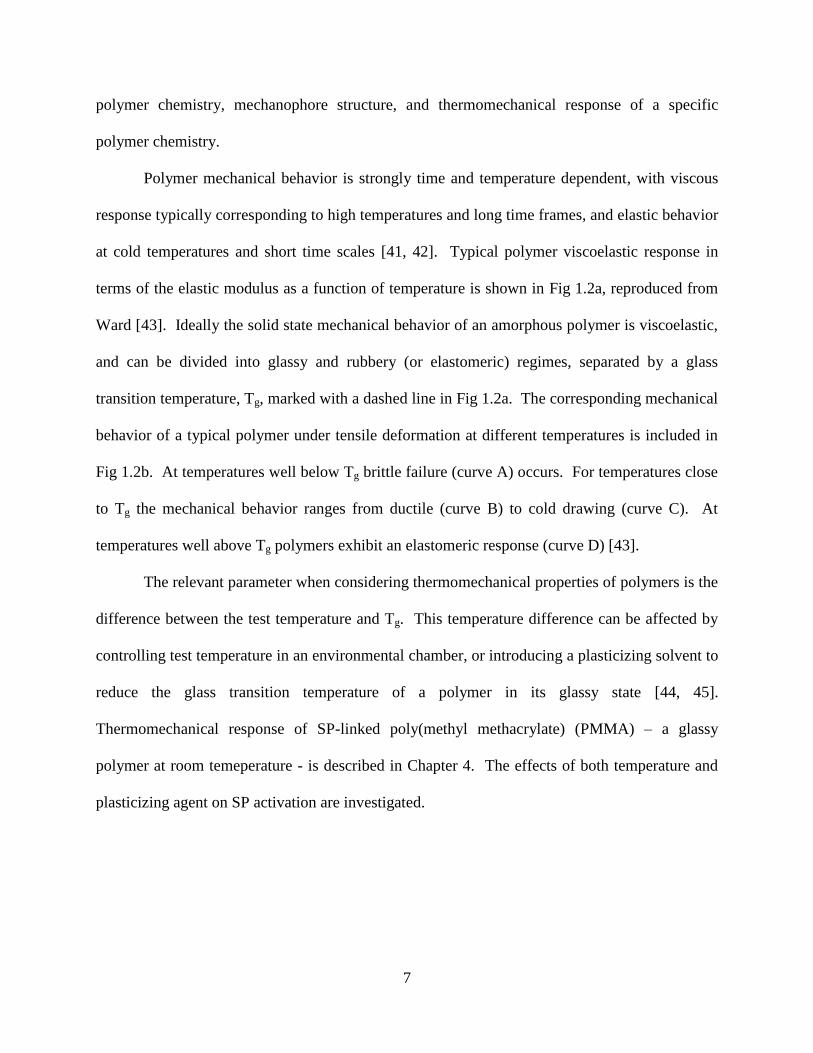
Polymer mechanical behavior is strongly time and temperature dependent, with viscous
response typically corresponding to high temperatures and long time frames, and elastic behavior
at cold temperatures and short time scales [41, 42]. Typical polymer viscoelastic response in
terms of the elastic modulus as a function of temperature is shown in Fig 1.2a, reproduced from
Ward [43]. Ideally the solid state mechanical behavior of an amorphous polymer is viscoelastic,
and can be divided into glassy and rubbery (or elastomeric) regimes, separated by a glass
transition temperature, Tg, marked with a dashed line in Fig 1.2a. The corresponding mechanical
behavior of a typical polymer under tensile deformation at different temperatures is included in
Fig 1.2b. At temperatures well below Tg brittle failure (curve A) occurs. For temperatures close
to Tg the mechanical behavior ranges from ductile (curve B) to cold drawing (curve C). At
temperatures well above Tg polymers exhibit an elastomeric response (curve D) [43].
The relevant parameter when considering thermomechanical properties of polymers is the
difference between the test temperature and Tg. This temperature difference can be affected by
controlling test temperature in an environmental chamber, or introducing a plasticizing solvent to
reduce the glass transition temperature of a polymer in its glassy state [44, 45].
Thermomechanical response of SP-linked poly(methyl methacrylate) (PMMA) – a glassy
polymer at room temeperature - is described in Chapter 4. The effects of both temperature and
plasticizing agent on SP activation are investigated.

8
Figure 1.2. Thermomechanical behavior of polymers revised from [43]. a) Representative stiffness
(elastic modulus) as a function of temperature, with glass transition temperature denoted. b) Load vs.
deformation for polymer with varied viscoelastic response, corresponding to the moduli labeled in a).
Mechanical behavior A is brittle, B is ductile, C corresponds to cold drawing and D is elastomeric.
1.4 Polymer Orientation Measurement
Previous publications have alluded to the importance of polymer chain alignment and
orientation in the direction of applied force for achieving mechanochemical reactions [38, 39].
The hypothesis for mechanical activation in bulk polymers is that linearly oriented polymer
chains, aligned in the direction of macroscopic stress, transfer force to the mechanophore more
efficiently than a randomly oriented chain.
A variety of methods can be used to monitor the alignment of polymer chains, including
x-ray diffraction, NMR, and birefringence [46, 47]. Of these methods, birefringence provides an
appealing optical method to be combined with mechanical testing, as it is non-destructive and
can be measured in situ. Birefringence in polymers is due to a difference in polarizability of the
bonds along the polymer backbone compared to perpendicular to the backbone [48]. As the
polymer chains orient in the draw direction, the anisotropic polarizability causes differing index
of refraction between principle axes, i.e. birefringence, which can be quantified optically. In this
dissertation, phase stepped photoelasticity was adopted for quantification of birefringence [49].
The change in birefringence is linearly proportional to the degree of polymer chain alignment
[47, 50].
9
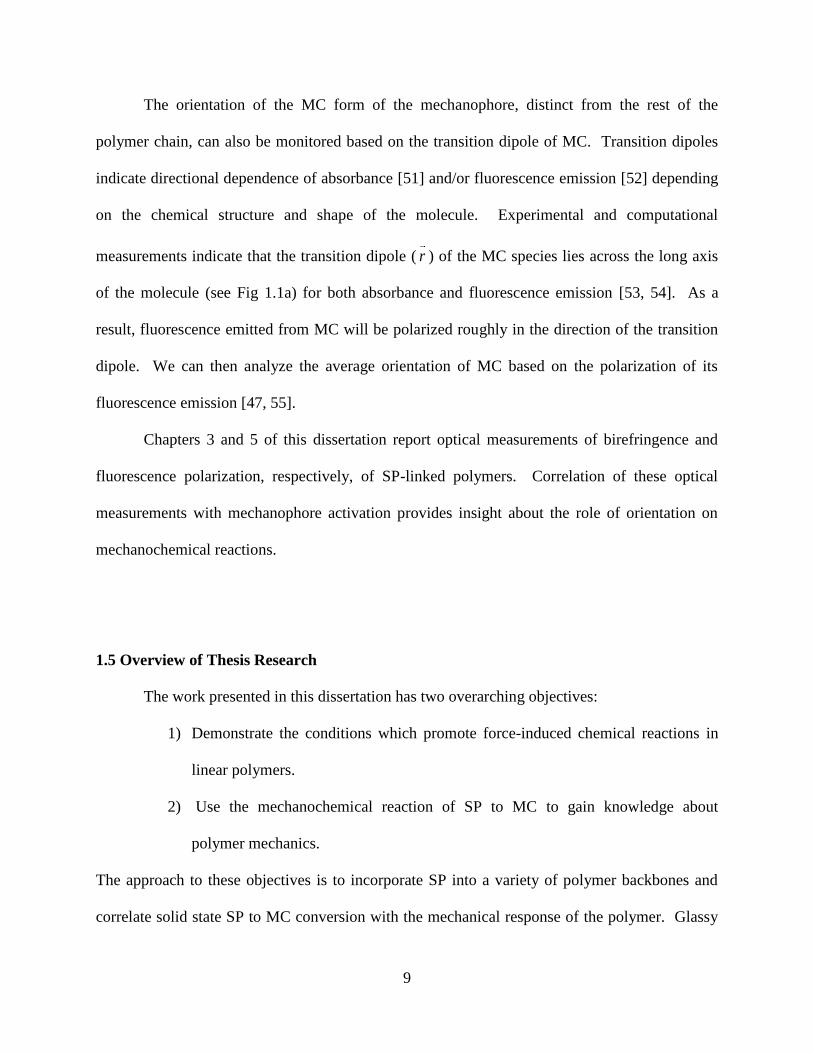
The orientation of the MC form of the mechanophore, distinct from the rest of the
polymer chain, can also be monitored based on the transition dipole of MC. Transition dipoles
indicate directional dependence of absorbance [51] and/or fluorescence emission [52] depending
on the chemical structure and shape of the molecule. Experimental and computational
measurements indicate that the transition dipole ( r ) of the MC species lies across the long axis
of the molecule (see Fig 1.1a) for both absorbance and fluorescence emission [53, 54]. As a
result, fluorescence emitted from MC will be polarized roughly in the direction of the transition
dipole. We can then analyze the average orientation of MC based on the polarization of its
fluorescence emission [47, 55].
Chapters 3 and 5 of this dissertation report optical measurements of birefringence and
fluorescence polarization, respectively, of SP-linked polymers. Correlation of these optical
measurements with mechanophore activation provides insight about the role of orientation on
mechanochemical reactions.
1.5 Overview of Thesis Research
The work presented in this dissertation has two overarching objectives:
1) Demonstrate the conditions which promote force-induced chemical reactions in
linear polymers.
2) Use the mechanochemical reaction of SP to MC to gain knowledge about
polymer mechanics.
The approach to these objectives is to incorporate SP into a variety of polymer backbones and
correlate solid state SP to MC conversion with the mechanical response of the polymer. Glassy
10
and elastomeric polymers were tested in tension with a range of loading conditions (varied strain
rate, stress relaxation, creep, etc.) in order to probe the mechanical response. Polymer structure
(polymer chemistry, molecular weight and mechanophore linkage) was also controlled and SP
activity was monitored.
A combined mechanical and optical experimental set-up has been developed to monitor
the mechanochemical response of SP-linked polymers in situ during tensile loading. SP
activation was quantified based on the fluorescence signal of the reacted MC form of the
mechanophore. Additional optical measurements, combined with fluorescence, correlated the
mechanochemical activation with alignment of the mechanophore and polymer.
The result of this research provides fundamental guidelines for promoting force-induced
chemical reactions of SP-linked polymers. The activation trends for SP-linked polymers provide
a reference for achieving bulk activation of emerging mechanophore chemistries. Moreover, SP
activation improves our understanding of polymer mechanics, specifically force on a polymer
chain subjected to tensile deformation.
11
CHAPTER 2
SYNTHESIS AND FUNDAMENTAL CHARACTERIZATION
OF SPIROPYRAN-LINKED POLYMERS
2.1 Introduction
Electrocyclic ring-opening of spiropyrans has been studied extensively since the 1950s
[33, 34, 56]. The spiropyran (SP) species contains a weak carbon-oxygen spiro bond which can
cleave to form a zwitterionic merocyanine (MC) form. Typically this reaction has been driven
photochemically or thermally. In 2001 Tipkin demonstrated mechanochemical conversion of
spiropyran (SP) molecules by grinding the small molecule with a mortar and pestle [57]. Potisek
et al. [14] later presented a chemical route for covalently bonding the molecule into a polymer
backbone such that force was transferred across the SP species, and SP to MC conversion was
driven with an applied tensile force. This chapter presents synthesis and characterization of
SP-linked polymers following the precedence of Potisek [14] and Davis et al. [15], as well as
additional SP-linked polymer chemistries.
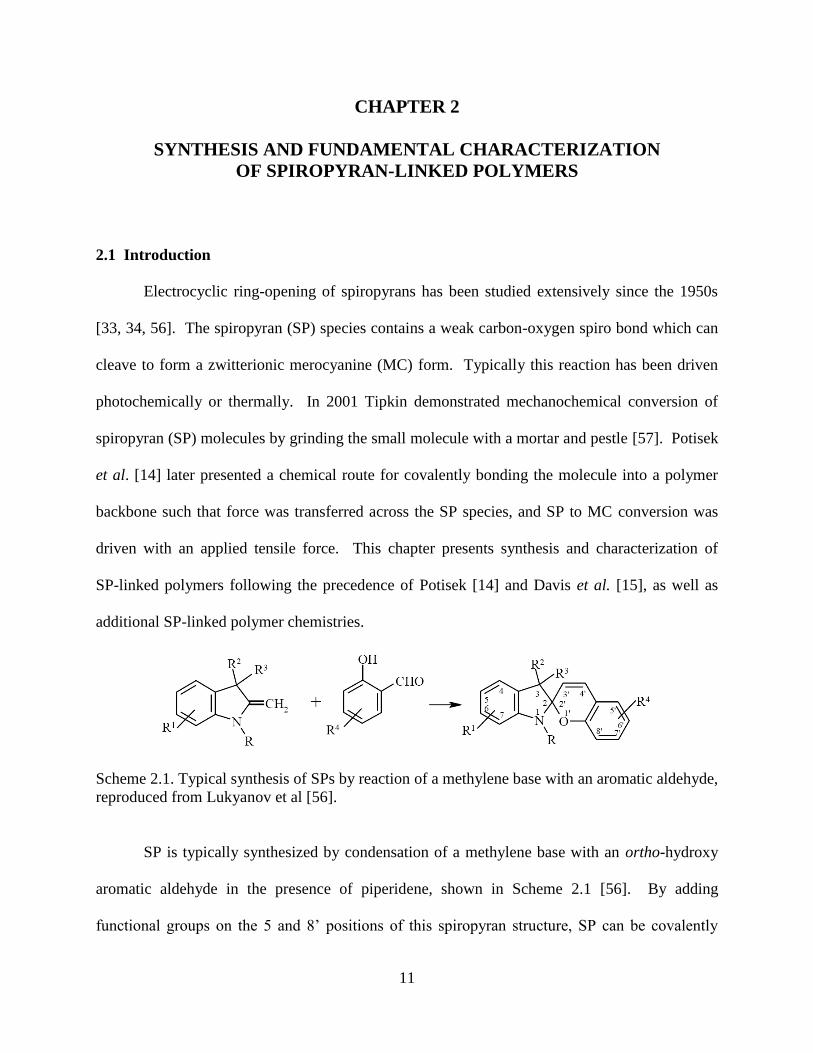
Scheme 2.1. Typical synthesis of SPs by reaction of a methylene base with an aromatic aldehyde,
reproduced from Lukyanov et al [56].
SP is typically synthesized by condensation of a methylene base with an ortho-hydroxy
aromatic aldehyde in the presence of piperidene, shown in Scheme 2.1 [56]. By adding
functional groups on the 5 and 8’ positions of this spiropyran structure, SP can be covalently
12
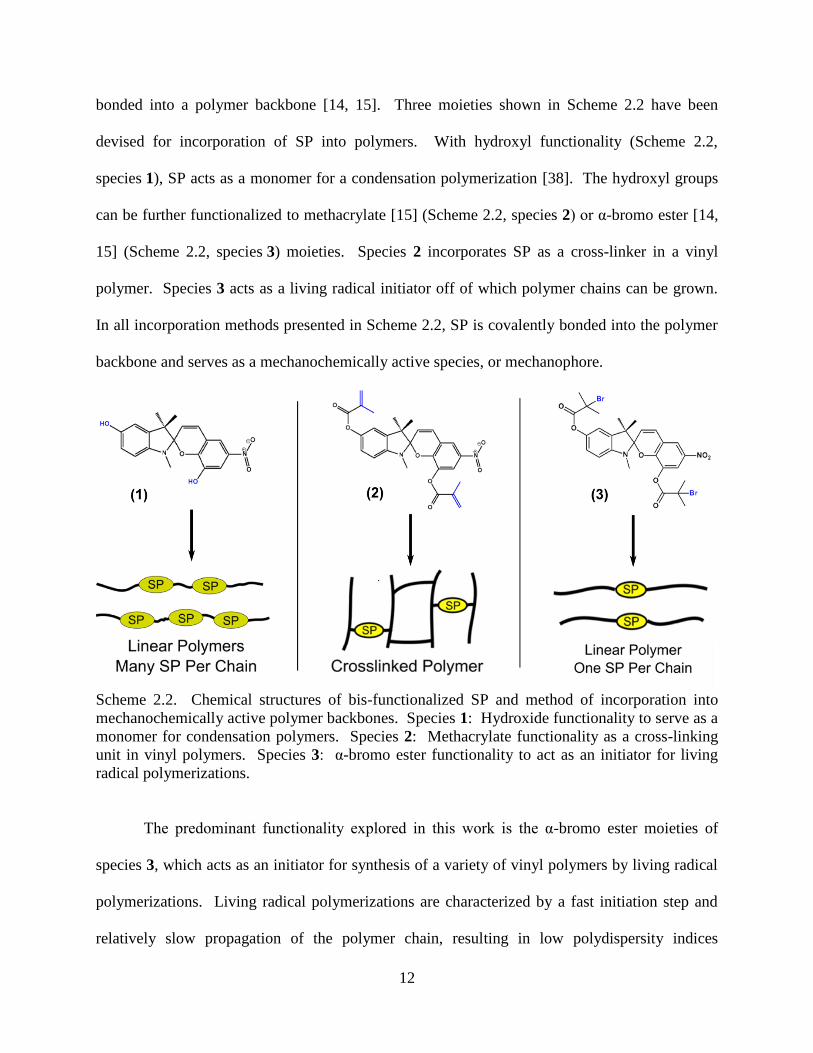
bonded into a polymer backbone [14, 15]. Three moieties shown in Scheme 2.2 have been
devised for incorporation of SP into polymers. With hydroxyl functionality (Scheme 2.2,
species 1), SP acts as a monomer for a condensation polymerization [38]. The hydroxyl groups
can be further functionalized to methacrylate [15] (Scheme 2.2, species 2) or α-bromo ester [14,
15] (Scheme 2.2, species 3) moieties. Species 2 incorporates SP as a cross-linker in a vinyl
polymer. Species 3 acts as a living radical initiator off of which polymer chains can be grown.
In all incorporation methods presented in Scheme 2.2, SP is covalently bonded into the polymer
backbone and serves as a mechanochemically active species, or mechanophore.
Scheme 2.2. Chemical structures of bis-functionalized SP and method of incorporation into
mechanochemically active polymer backbones. Species 1: Hydroxide functionality to serve as a
monomer for condensation polymers. Species 2: Methacrylate functionality as a cross-linking
unit in vinyl polymers. Species 3: α-bromo ester functionality to act as an initiator for living
radical polymerizations.
The predominant functionality explored in this work is the α-bromo ester moieties of
species 3, which acts as an initiator for synthesis of a variety of vinyl polymers by living radical
polymerizations. Living radical polymerizations are characterized by a fast initiation step and
relatively slow propagation of the polymer chain, resulting in low polydispersity indices
13
(PDIs) [58]. For the bis-functionalized SP (3) depicted in Scheme 2.2, low PDIs imply that
polymer chains grown on each side of the SP species will reach similar degrees of
polymerization, and SP will be centrally located in the polymer backbone. Single electron
transfer living radical polymerization (SET-LRP) yields low PDIs [58], and is effective for
synthesis of SP-linked poly(methyl acrylate) (PMA) [14, 15]. This chapter also explores SP as
an initiator for atom transfer radical polymerizations, pioneered by Matyjaszewski et al. [59].
ATRP is initiated by the same functional moieties in species 3, with a slight difference in the
catalytic mechanism distinguishing ATRP from SET-LRP [60]. ATRP provides a synthesis
route for additional SP-linked polymer systems, such as polystyrene (PS) and poly(methyl
methacrylate) (PMMA).
2.2 Results
2.2.1 Synthesis of Linear Polymers by Living Radical Polymerizations
Three types of polymers were synthesized by living radical polymerizations: active SP-
linked polymer, difunctional control SP-linked polymer, and plain polymer (without SP).
Chemical structures of each are shown in Scheme 2.3. SP-linked polymers were synthesized
using SP as a bis-functionalized initiator for the polymerization, i.e. polymer was grown at two
sites on the mechanophore and one SP unit was centrally located in each polymer chain. Active
SP structure 3a* was linked into the polymer (at the 5 and 8’ positions from scheme 2.1) to
synthesize active SP-linked polymer species 3b. This configuration promoted force transfer
across the weak carbon-oxygen spiro bond bridging the 2’ and 1’ positions in Scheme 2.1.
Species 3c is the desired force-driven (activated) MC product. Species 4a represents a control
* SP small molecules were synthesized by Douglas Davis and Preston May, UIUC Department of Chemistry
14
molecule containing SP, referred to as the difunctional control SP. Polymer chains were attached
to the 1 and 5 positions of the SP species (scheme 2.1) such that load is not transferred across the
force-sensitive spiro bond. Plain polymer without SP was synthesized using methyl-2-
bromopropionate (M2BP) (species 5a) as the initiator for polymerization. Relevant information
for polymer syntheses is shown in Table 2.1 and described in detail below.
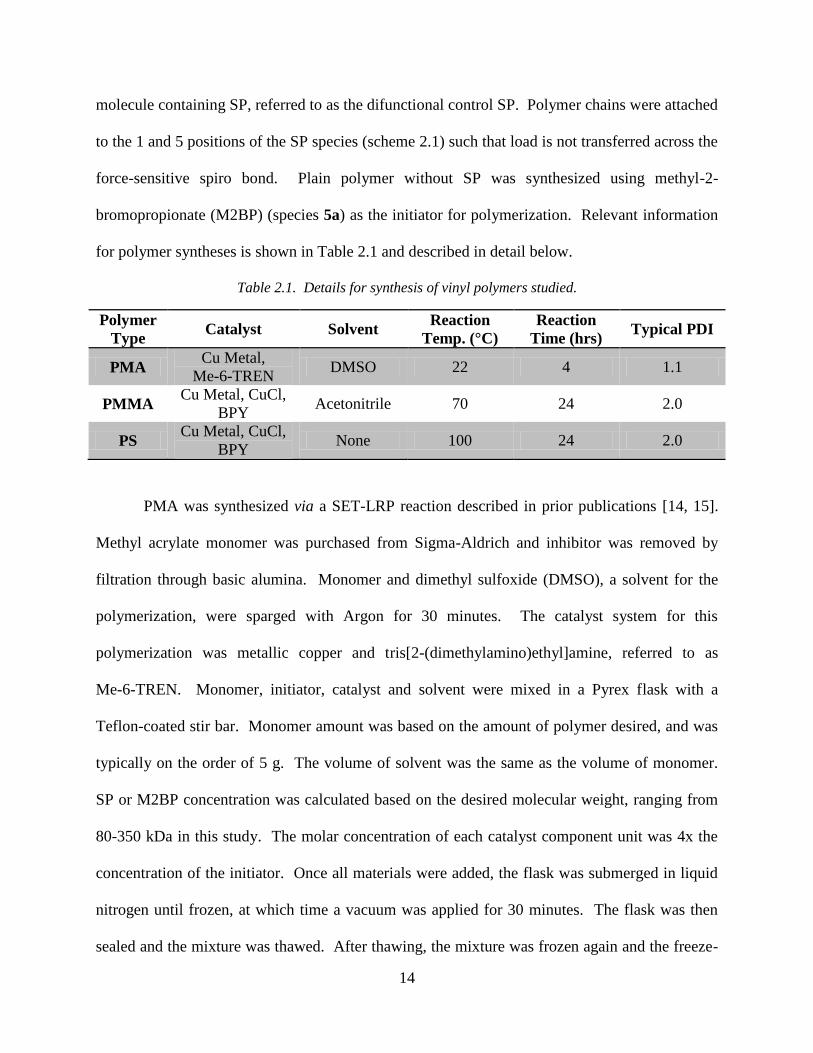
Table 2.1. Details for synthesis of vinyl polymers studied.
Polymer
Type Catalyst Solvent
Reaction
Temp. (°C)
Reaction
Time (hrs) Typical PDI
PMA Cu Metal,
Me-6-TREN DMSO 22 4 1.1
PMMA Cu Metal, CuCl,
BPY Acetonitrile 70 24 2.0
PS Cu Metal, CuCl,
BPY None 100 24 2.0
PMA was synthesized via a SET-LRP reaction described in prior publications [14, 15].
Methyl acrylate monomer was purchased from Sigma-Aldrich and inhibitor was removed by
filtration through basic alumina. Monomer and dimethyl sulfoxide (DMSO), a solvent for the
polymerization, were sparged with Argon for 30 minutes. The catalyst system for this
polymerization was metallic copper and tris[2-(dimethylamino)ethyl]amine, referred to as
Me-6-TREN. Monomer, initiator, catalyst and solvent were mixed in a Pyrex flask with a
Teflon-coated stir bar. Monomer amount was based on the amount of polymer desired, and was
typically on the order of 5 g. The volume of solvent was the same as the volume of monomer.
SP or M2BP concentration was calculated based on the desired molecular weight, ranging from
80-350 kDa in this study. The molar concentration of each catalyst component unit was 4x the
concentration of the initiator. Once all materials were added, the flask was submerged in liquid
nitrogen until frozen, at which time a vacuum was applied for 30 minutes. The flask was then
sealed and the mixture was thawed. After thawing, the mixture was frozen again and the freeze-

15
pump-thaw cycle was repeated 3x in order to minimize any dissolved gasses (oxygen and water
vapor) in the monomer which would inhibit radical polymerization. After the third freeze-pump
thaw cycle, the flask was placed under an argon atmosphere. A Schlenk line was used so that no
air was introduced into the system between pulling vacuum and adding argon. The mixture was
then submerged in a water bath at room temperature (approximately 22 °C) for 4 hours. The
product was a reddish brown viscous liquid or gel.
Scheme 2.3. Chemical structures and living radical polymerizations for mechanochemically
active SP-linked polymer (3a-c), difunctional control SP-linked polymer (4a-b), and plain
polymer (5b) without SP, initiated by methyl-2-bromopropionate (5a).
The product was dissolved into ca. 200 mL tetrahydrofuran (THF) and filtered three
times through silica powder and a coarse Buchner funnel to remove catalyst. Roto-Vap
equipment was used to evaporate off the majority of the remaining solvent. The solution was
16
reduced to approximately 20 mL volume using the Roto-Vap, and then dripped into methanol
(MeOH). Approximately 200 mL MeOH was used for every 5 mL polymer solution. Methanol
provided a solvent for THF but not for PMA, and the polymer crashed out of solution as a solid.
Solid PMA was collected in a flask and vacuum was applied to dry the polymer.
PMA was initially dried at room temperature, but the resulting polymer properties were
inconsistent between batches. 1H-NMR indicated the presence of residual THF accounting for
plasticizing and variability in properties. Plasticized difunctional control PMA described in
Chapter 3, dried at room temperature, contained approximately 3 wt% THF by NMR analysis.
All other polymers presented in this thesis were dried for 24 hours at 60 °C – above the boiling
point of THF. NMR analysis of the resulting polymer did not show traces of THF.
Poly(methyl methacrylate) and polystyrene were synthesized via atom transfer radical
polymerization (ATRP) described by Matyjaszewski [59, 61] and further studied by Wang et al.
[62]. The experimental procedure for the ATRP reaction was fundamentally the same as
SET-LRP, with different catalyst, solvent, reaction time and reaction temperatures, outlined in
Table 2.1. The ATRP catalyst system was copper powder (99%), CuCl (≥ 99%), and
2,2’-bipyridine (BPY) (≥ 99%), purchased from Sigma-Aldrich and used as received. All
catalyst components had concentration equal to 4x the molar concentration of initiator.
Monomer (with inhibitor removed by basic alumina), solvent (if applicable) and catalysts were
mixed and subjected to the same freeze-pump-thaw cycles described above. The polymerization
was allowed to run at elevated temperature for 24 hours. The resulting solid polymers were
dissolved into THF, filtered through silica powder, and dried for 24 hours at 60 °C.
Polymers were synthesized with near theoretical yield. The process of filtering and
drying led to some material loss, and approximately 60-70% of the monomer mass was

17
recovered as a dry polymer. Number average molecular weights of polymers typically agreed to
within 15% of theoretically predicted values assuming full consumption of the monomer. PDIs
were consistent from batch to batch for each polymer type. The PDI of SP-linked PMA
synthesized by a SET-LRP method was approximately 1.1, implying a centrally located
mechanophore. The PDIs of SP-linked PMMA and PS were approximately 2.0.
2.2.2 Thermomechanical Properties of SP-Linked Polymers
The glass transition temperatures (Tg) of the polymers studied were determined by
differential scanning calorimetry (DSC) using Mettler-Toledo model DSC821 equipment.
Sample temperature was ramped at 3 °C/min and a shoulder on the curve of heat flow vs.
temperature was taken as the Tg. Representative DSC curves are provided in Fig 2.1 for PMMA
polymer of the three structures shown in Scheme 2.3. The Tg values for each initiator type agree
to within ca. 2 °C. Glass transition temperatures from DSC analysis of each polymer type
studied in this thesis are presented in Table 2.2. Dynamic mechanical analysis (DMA) was used
to confirm the glass transition temperature of active SP-linked polymers using TA Instruments
RSA3 equipment, also at a ramp rate of 3 °C/min. A representative tan(δ) curve for active SP-
linked PMMA is also plotted in Fig 2.1. The Tg determined from the peak of the tan(δ)
temperature sweep is in close agreement with the DSC results.

18
Figure 2.1. Representative DSC curves of active SP-linked PMMA, difunctional control SP-
linked PMMA and plain PMMA. DMA analysis has been included for active SP-linked PMMA.
The glass transition of PMA occurred at a temperature of approximately 12 °C, and the
resulting polymer is elastomeric at room temperature. Tg of PMMA and PS were 127 °C and
105 °C, respectively, corresponding to glassy polymers. The Tg of each polymer was unchanged
by incorporation of SP. Thus the effect of SP incorporation on the thermomechanical properties
of the polymers studied was considered negligible. Polymers studied had molecular weights
greater than 80 kDa, and Tg for each polymer type was not affected by the molecular weight.
Table 2.2. Glass transition temperatures of polymers studied, as determined by DSC analysis.
Polymer SP Incorporation Tg (°C)
PMA
No SP (Plain) 12
Active SP-Linked 13
Difunctional Control SP-Linked 12
PMMA
No SP (Plain) 126
Active SP-Linked 127
Difunctional Control SP-Linked 129
PS
No SP (Plain) 104
Active SP-Linked 105
Difunctional Control SP-Linked 105
19
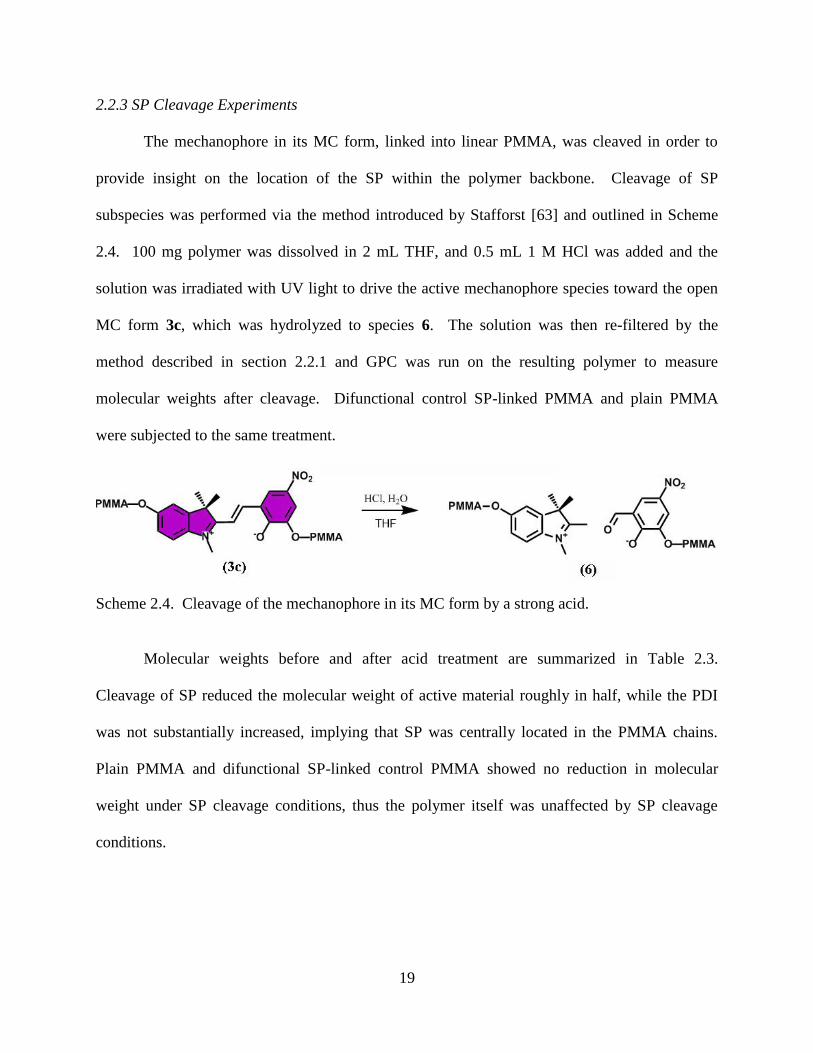
2.2.3 SP Cleavage Experiments
The mechanophore in its MC form, linked into linear PMMA, was cleaved in order to
provide insight on the location of the SP within the polymer backbone. Cleavage of SP
subspecies was performed via the method introduced by Stafforst [63] and outlined in Scheme
2.4. 100 mg polymer was dissolved in 2 mL THF, and 0.5 mL 1 M HCl was added and the
solution was irradiated with UV light to drive the active mechanophore species toward the open
MC form 3c, which was hydrolyzed to species 6. The solution was then re-filtered by the
method described in section 2.2.1 and GPC was run on the resulting polymer to measure
molecular weights after cleavage. Difunctional control SP-linked PMMA and plain PMMA
were subjected to the same treatment.
Scheme 2.4. Cleavage of the mechanophore in its MC form by a strong acid.
Molecular weights before and after acid treatment are summarized in Table 2.3.
Cleavage of SP reduced the molecular weight of active material roughly in half, while the PDI
was not substantially increased, implying that SP was centrally located in the PMMA chains.
Plain PMMA and difunctional SP-linked control PMMA showed no reduction in molecular
weight under SP cleavage conditions, thus the polymer itself was unaffected by SP cleavage
conditions.

20
Table 2.3. Molecular weight characterization of as-synthesized and SP-cleaved PMMA.
PMMA Type Synthesized
MN (kDa)
SP Cleaved
MN (kDa)
Synthesized
PDI
SP Cleaved
PDI
Plain 78 82 1.5 1.5
Active 260 123 2.0 2.1
Difunctional Control 185 181 2.0 2.0
2.2.4 Fluorescence Spectra of SP-Linked Polymers
The equilibrium of SP and MC can be driven toward either form by the appropriate
wavelength of light. Visible light - particularly green light with maximum absorbance near
λ = 550 nm - drives the molecule to its SP form, which is typically uncolored or slightly yellow.
Irriadiation with UV light at ca. 385 nm (UV-activation) promotes the MC form, which is
accompanied by a vibrant purple or red color from visible-range absorbance of the MC species.
In addition to a color change of the MC form, the MC form is known to fluoresce with broad
excitation and emission in the visible spectrum [35]. The locations of excitation and emission
peaks vary with the polarity of the environment [36], which in this case is solid polymer. The
research presented in this dissertation makes use of the fluorescence signal of the MC form as a
relative indicator of mechanophore activation.
SP-linked PMA was driven toward the MC form by UV light, and excitation and
emission peaks in the visible spectrum were taken by a Fluoromax Model 4 Spectrophotometer.
Fluorescence spectra are plotted in Fig 2.2. Excitation and emission peaks for UV-activated SP-
linked PMA were located at approximately 550 nm and 650 nm, respectively. The fluorescence
emission of samples driven toward the SP form using visible light was orders of magnitude
smaller than the UV activated case and was considered negligible. Fluorescence spectra of UV-

21
activated SP-linked PMA provided the basis for an experimental set-up combining mechanical
and fluorescence measurement described thoroughly in Chapter 3.
A 532 nm excitation source was selected for the combined mechanical and optical testing
set-up. This wavelength lies near the excitation peak for SP-linked PMA. MC fluorescence
emission was filtered to wavelengths greater than 575 nm and collected in situ (during
mechanical testing) on a hand-held Ocean Optics spectrometer, model HR2000+. Fluorescence
emission spectra under these excitation conditions are shown in Fig 2.3 for active SP-linked
PMA. A UV-activated case and a mechanically activated case are plotted for comparison. In the
mechanically activated case, mechanophore-linked polymer was first driven toward the SP form
using visible light, then a tensile force was applied to mechanically drive the SP to the
fluorescent MC form, and a spectrum was taken. The emission peak shifts to lower wavelengths
for mechanically activated SP-linked PMA (ca. 600 nm) when compared with the UV activated
case (650 nm). A possible explanation for the spectral shift is different isomeric configuration of
the MC species in the mechanically activated case compared to the UV activated case [37]. In
both cases, a strong fluorescence signal was detectable only after the application of a driving
force toward the MC form (mechanical or photochemical).
Excitation and emission spectra for mechanically activated SP-linked PMMA are
included in Fig 2.4. Irradiation with UV light was not sufficient to drive the mechanophore to
the MC form in glassy polymer systems, so the UV activated case was not analyzed. An
emission peak was located at ca. 620 nm for 532 nm excitation, thus the 532 nm light source
effectively excited MC fluorescence in this polymer system. Bulk SP-linked polystyrene was not
activated by either UV light or mechanical force, therefore spectra are not included. However,
mechanical deformation of SP-linked polystyrene thin films described in Chapter 6 led to the

22
emergence of a fluorescence signal when excited with 532 nm light. A similar fluorescence
signal was assumed for MC in a PS environment to that of MC in PMA and PMMA.
Figure 2.2. Excitation and emission spectra for UV-activated SP-linked PMA. Fluorescence
intensity has been normalized by the maximum fluorescence value for each spectrum.
Figure 2.3. Active SP-linked PMA fluorescence emission after UV irradiation and mechanical
activation. Fluorescence was excited with a 532 nm laser and collected at wavelengths greater
than 575 nm in situ using a hand-held spectrometer. Noise in the mechanically tested case was
due to low signal relative to the UV irradiated case. Fluorescence intensity has been normalized
by the maximum fluorescence value for each spectrum.

23
Figure 2.4. Excitation and emission spectra for mechanically activated SP-linked PMMA. The
sample was strained to failure at 90 °C and quenched at room temperature prior to fluorescence
measurement. Fluorescence intensity has been normalized by the maximum fluorescence value
for each spectrum.
2.3 Conclusions
Spiropyran has been covalently bonded into the center of a several different polymer
backbones using SP as an initiator for living radical polymerizations. Mechanochemically active
SP-linked linear PMA was synthesized with low PDIs by the SET-LRP method previously
described by Potisek [14] and Davis et al. [15]. Glassy SP-linked polymers (polystyrene and
PMMA) were synthesized via ATRP polymerizations. Controls containing SP and plain
polymer controls (without SP incorporated) have been synthesized for each polymer type.
Incorporation of SP had a negligible effect on thermomechanical behavior of polymers.
Fluorescence spectra were recorded for SP-linked PMA. After irradiation with visible
light such that the mechanophore was predominantly in its SP form, very little fluorescence was
detectable. When the mechanophore was driven to its MC form by UV irradiation (λ = 385 nm),
strong excitation and emission peaks were located at 550 nm and 650 nm, respectively. These
studies establish that a green light source is effective at exciting MC fluorescence, which can be
24
collected and quantified as a relative measure of mechanically-driven SP to MC conversion.
Fluorescence detection is shown to be feasible for a glassy mechanophore-linked polymer system
(SP-linked PMMA) as well.
25
CHAPTER 3
MECHANICAL AND OPTICAL CHARACTERIZATION
OF AN SP-LINKED ELASTOMER
3.1 Introduction
In a seminal publication by Davis et al.[15] force-induced chemical conversion of
spiropyran (SP) was demonstrated when the mechanophore was bonded into the backbone of
poly(methyl acrylate) (PMA), a linear elastomer. SP was activated to its merocyanine (MC)
form (chemical structures shown in Chapter 2) with applied tensile deformation. Activation was
detectable at strains on the order of hundreds of percent, i.e. stretch ratios greater than two times
the un-deformed sample length. SP activation was indicated visually by the emergence of purple
color in the gauge section of tensile specimens.
While SP activation has been demonstrated qualitatively in elastomeric PMA and other
polymers [38-40], many of the fundamental parameters influencing mechanophore activation,
such as stress, deformation and polymer chain orientation have not been fully explored. The
following chapter utilizes SP-linked PMA in its linear form as a model system to study
parameters which affect mechanochemical reactions.
In addition to a color change, the activation of SP to MC is accompanied by the
emergence of a fluorescence signal of the MC form described in Chapter 2. The fluorescence
signature can be utilized in order to quantify the activation of the mechanophore. In this chapter,
fluorescence detection is combined with tensile loading. The influence of key and controlling
parameters such as deformation rate, load times, and polymer architecture are investigated to
26
provide insight on the interplay between stress, deformation, and time in mechanochemical
reactions.
Recent publications have proposed that alignment of polymer chains in the direction of
macroscopic force promotes mechanochemical reactions [38, 39], but as yet polymer orientation
and activation have not been quantitatively correlated. This chapter combines mechanical and
fluorescence measurement with a third technique, birefringence, which provides a relative
measure of polymer chain alignment [50]. Photoelasticity was selected as an optical method for
calculation of birefringence, and this method could be added using the same light source as the
fluorescence excitation.
The trends established in this chapter serve as guides for development of new
mechanophore-linked polymers, particularly elastomeric systems. Optimal parameters for SP
activation in an elastomeric polymer are discussed.
3.2 Experimental
3.2.1 Materials
Linear mechanochemically active SP-linked PMA was synthesized using SP as an
initiator for a single electron transfer living radical polymerization (SET-LRP) described in
Chapter 2. Control PMA was synthesized with SP linked into the backbone such that force was
not transferred across the sensitive C-O spiro bond. This linkage will be referred to as
difunctional control SP-linked polymer throughout this dissertation. Active and difunctional
control SP chemical structures are included in the Scheme 2.3. Linear polymers synthesized had
polydispersity indices (PDIs) of below 1.2. Glass transition temperatures measured by
differential scanning calorimetry and confirmed by dynamic mechanical analysis (both at

27
temperature ramp rates of 3°C) were approximately 12 °C for active, SP-linked control, and
plain PMA without SP linked into the polymer backbone. The effect of SP incorproration on
polymer thermomechanical properties was considered negligible. Over the range of polymer
molecular weights considered in this study (Mn > 80 kDa) the thermomechanical properties were
essentially constant as well.
SP was also synthesized with a dendrimeric structure such that multiple α-bromo ester
functionalities were present at both attachment points of the mechanophore, as described by May
et al. [64]. Synthesis of the dendrimeric mechanophore structures was based off work by Ihre et
al. [65]. Multiple polymer chains (Fig 3.1) were then added to the SP molecule via the same
SET-LRP reaction described in Chapter 2. The aim of multiple polymer arms at each attachment
point was to magnify the force across the mechanophore. The three structures will be referred to
as linear, 4-arm and 8-arm SP-linked PMA. If not otherwise specified, active SP-linked PMA
refers to the linear configuration.
Figure 3.1. Representative structures of linear, 4-arm and 8-arm SP-linked PMA.
28
Active, difunctional control, and plain PMA samples were molded from dried pellets at
PMA was molded at a pressure of 200 psi at 150 °F (66 °C) for 10 minutes in a closed mold.
Approximate sample dimensions are shown in Appendix A.
3.2.2 Tensile Testing Protocol
All polymer samples in this study were tested in tension using a custom uniaxial load
frame from IMAC Motion Control Corporation. Two opposing screw driven actuators applied
an identical displacement to each side of polymer sample such that the center of the sample
remained in the field of view for optical studies. Load in the polymer sample was detected using
a 5-lb Honeywell Sensotec Load Cell (Model 31) attached to one of the actuators. Displacement
of the actuators was controlled through NI LabVIEW. The load frame was oriented horizontally
on an optical table.
Unless otherwise specified, samples were irradiated with green light (λ = 532 nm) for 10
minutes at RT prior to testing in order to drive the mechanophores predominantly to the SP form.
For monotonic tensile testing, the load frame was displacement-controlled and applied stretch
rates were 0.10 s-1
, 0.02 s-1
, or 0.004 s-1
. For stress relaxation testing, samples were loaded at a
relatively high deformation rate (0.10 s-1
) then held at a constant amount of deformation, and the
optical and mechanical response was monitored over time.
3.2.3 Combined Mechanical and Optical Experimental Setup
A novel mechanical and optical experimental set-up was developed to monitor in situ
activation of the mechanophore during tensile testing. Fluorescence was captured as a full field
image via a CCD camera and defined as average pixel intensity over the gauge section of the

29
sample. Birefringence was simultaneously detected with mechanical and fluorescence
measurements.
A schematic and photo of the full optical and mechanical setup are shown in Figs 3.2a
and 3.2b, respectively. A collimated circularly polarized incident light source was incident on a
polymer sample, which acted both as a monochromatic light source for photoelasticity
(birefringence measurement) and a excitation source for fluorescence of the activated MC form
of the mechanophore. After passing through the sample, the incident wavelength (λ = 532 nm)
was reflected at 90° for the photoelastic beam, while higher wavelengths (λ > 575) were passed
for collection of the fluorescence signal on a color CCD camera (AVT Stingray F504c). The
photoelastic beam was then separated into four identical beams using a two-dimensional
diffraction grating, and the resulting images were passed through polarization optics such that the
photoelastic state could be fully characterized. The birefringence signal was then captured as
four images in a single CCD (AVT Stingray F145b) and values for birefringence, Δn, were
calculated by phase stepping [49, 66]. Birefringence detection and polarization optics used in
these experiments are explained more thoroughly by Kramer et al. [67]. Full field fluorescence
and birefringence signals were simultaneously captured with the same field of view during
tensile testing of dog-bone shaped specimens (Fig 3.3).

30
Figure 3.2. Combined optical and mechanical setup shown as a) a schematic, and b) a
photographic image. The illustrated green beam represents the incident laser wavelength (532
nm) while the red beam represents fluorescence signal from MC present in the polymer. Only
two of the four diffracted beams for birefringence detection are indicated for image clarity.

31
Figure 3.3 Typical images for simultaneous capture of fluorescence and photoelasticity: a) Four
photoelastic beams (I1 upper left; I2 upper right; I3 lower left; and I4 lower right) for = 1.0; b)
fluorescence image for = 1.0 with the edges of the sample outlined in dashed white lines; c)
four photoelastic beams for = 9.0; and d) fluorescence image for = 9.0.
Birefringence and fluorescence images were taken at intervals of 1 s, 5 s, and 25 s
corresponding to deformation rates of 0.10 s-1
, 0.02 s-1
, or 0.004 s-1
, respectively. Constant
fluorescence imaging conditions (180 μW laser power, 800 ms exposure) were maintained unless
otherwise stated. Although 532 nm light drives the mechanophore equilibrium toward the SP
form, the laser power was selected so that photochemical conversion was considered negligible
when compared with the mechanical activation. A mechanical shutter between the laser and

32
sample blocked the laser between fluorescence images to further minimize conversion of MC
species to the SP form.
3.2.4 Birefringence and Fluorescence Measurement
The optical birefringence, Δn, of a polymer gives a relative measure of polymer chain
alignment with respect to a reference direction [50]. Here, the optical birefringence is
determined using phase-stepped photoelasticity. In a standard phase-stepped photoelastic setup,
two quantities, the isoclinic angle, θ, (the angle of principal optical axis) and the isochromatic
phase, δ, (the relative retardation of the polarized light through the polymer) can be extracted
from four different interference patterns [49, 66, 67]. The isochromatic phase is related to the
birefringence by following equation:
2
n
h
3.1
where λ is the wavelength of incident light (532 nm) and h is the thickness of the sample. Using
polarization optics oriented as described by Kramer et al. [67], the intensities of the four images
in Fig 3.3a and 3.3c are, from top left to bottom right,
1 0[1 sin( )cos(2 )]I I 3.2a
2 0[1 sin( )sin(2 )]I I 3.2b
3 0[1 sin( )sin(2 )]I I 3.2c
4 0[1 cos( )]I I 3.2d.
From these equations the isoclinic angle and isochromatic phase can be derived:
2 3
2 3 1
1arctan( )
2 2
I I
I I I
3.3
and

33
2 3 1
4 2 3
2arctan
cos(2 )[2 ( )]
I I I
I I I
3.4.
The pixel intensities were averaged over the gauge section of each image to determine
I1 - I4. The resulting isochromatic phase, δ, is “wrapped” with bounds of (-/2, /2], and had to
be “unwrapped” by adding the absolute value of the change in the phase whenever the phase
reaches its upper bound. The “unwrapped” phase could then be converted to a birefringence
value using Eq. 3.1.
Fluorescence was defined as the red channel intensity of the color images (representative
images are included in Fig 3.3b and 3.3d), averaged over pixels in the gauge section of the
sample. The field of view was kept constant for each fluorescence measurement. The thickness
corrected fluorescence was obtained by correcting for (i) the change in the number of SP in the
field of view of the camera due to the large thickness change during the course of each test, and
(ii) the variation in initial thickness between specimens. The stretch ratio in the thickness
direction, T, was assumed to be the same as the stretch ratio in the width direction,
w, since
both of those directions were unconstrained during the uniaxial loading. The material did not
exhibit incompressible behavior. The width stretch ratio was determined by optically measuring
the gauge section width in each image. Length stretch ratio was determined from crosshead
displacement. The thickness correction was applied by dividing the raw fluorescence intensity
by thickness stretch ratio, assuming λw =
T. Thickness corrected fluorescence was also
normalized by the initial intensity at λ = 1.
34
3.3 Results and Discussion
3.3.1 Simultaneous Measurement of Stress, Birefringence and Fluorescence
Active PMA samples were deformed at a constant deformation rate until failure and the
mechanical and optical response was measured. Images of a representative active SP-linked
PMA sample before and after testing are provided in Fig 1.1c. Stretch ratio (λ, defined as
instantaneous sample gauge length divided by un-deformed gauge length) and true stress (σtrue,
calculated based on optically measured sample width and assuming the width stretch ratio was
the same as the thickness stretch ratio) were determined from the sample thickness and measured
load. Representative data for a mechanochemically active sample tested at a stretch rate (dλ/dt)
of 0.02 s-1
are plotted in Fig 3.4. Stress increased consistently as a function of increasing stretch
ratio until failure, which typically occurred at a stretch ratio between 10 and 12. An increase in
slope of the stress vs. stretch ratio plot, i.e. hardening, occurred with increasing deformation.
Birefringence (Δn) had a negative value with respect to the tensile direction, agreeing with
previously published data by Saiz et al. [68]. This effect was likely due to bulky pendant
methacrylate groups on the PMA backbone. In figure 3.4, the birefringence was plotted in terms
of its relative magnitude (the Δn value multiplied by -103). The magnitude of Δn increased with
increasing stretch ratio, indicating alignment of the polymer backbone in the direction of loading,
and then leveled out at large stretch ratios as the polymer chains reached maximum alignment.
The intensity of the fluorescence signal (Ifl) was assumed proportional to the amount of activated
SP, i.e. MC, in the beam path. At room temperature (RT = 22 °C), a small amount of MC was
present in the specimen, which led to some fluorescence at a stretch ratio of 1.0 (λ = 1). During
the initial loading, the fluorescence signal decreased due to sample thinning (i.e. lower
mechanophore concentration in the fluorescence image field of view.) With increasing stretch

35
ratio, the fluorescence intensity began to increase indicating activation of SP to the fluorescent
MC form. The onset of activation was defined at the stretch ratio, λ*, at which the increase in SP
activation was significant enough that the slope of the raw fluorescence intensity vs. stretch ratio
having a positive value, as is marked by an arrow in Fig 3.4.
Figure 3.4. Simultaneously obtained stress, birefringence and raw fluorescence intensity vs.
stretch ratio for active SP-linked PMA under tensile deformation at a rate of 0.02 s-1
. The stretch
ratio at activation, λ*, is indicated by an arrow.
36
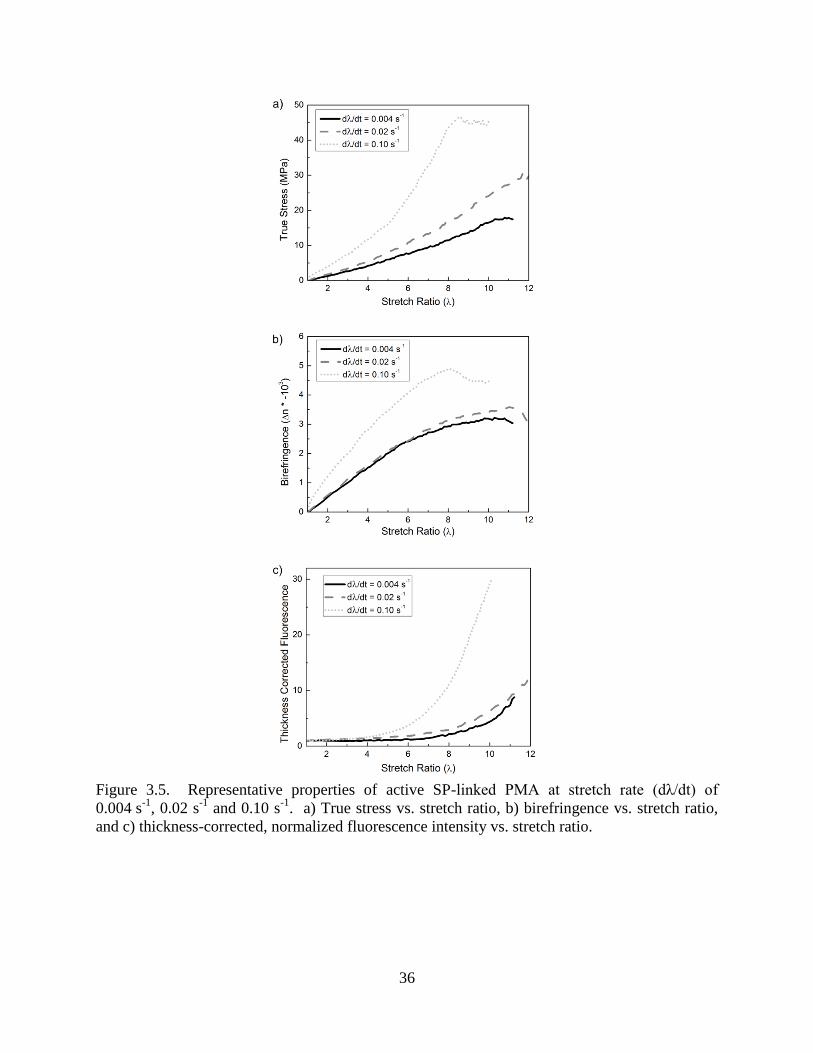
Figure 3.5. Representative properties of active SP-linked PMA at stretch rate (dλ/dt) of
0.004 s-1
, 0.02 s-1
and 0.10 s-1
. a) True stress vs. stretch ratio, b) birefringence vs. stretch ratio,
and c) thickness-corrected, normalized fluorescence intensity vs. stretch ratio.

37
3.3.2 Deformation Rate Dependence in Linear Active SP-Linked PMA
Active PMA samples were tested at stretch rates of 0.004 s-1
, 0.02 s-1
and 0.10 s-1
. The
resulting polymer behavior – stress, birefringence, and thickness corrected fluorescence – are
plotted in Fig 3.5 for representative samples at each stretch rate. The stress (Fig 3.5a) in the
polymer samples increased with increasing stretch rate as expected for an elastomeric material.
In virtually all samples hardening was observed with increasing stretch ratio. Birefringence (Fig
3.5b) also increased with increasing stretch rate. Birefringence values began to plateau at high
stretch ratios as the chains became maximally aligned in the direction of force. The fluorescence
intensity (Fig 3.5c) was adjusted for the number of mechanophores in the field of view and
normalized by the fluorescence value at ambient equilibrium (λ = 1) fluorescence intensity, as
described in section 3.2.4. For all stretch rates, rapid activation of SP at large stretch ratios
coincided with a plateau in the birefringence, during which polymer chains approached
maximum alignment and hardening. Increased birefringence and fluorescence were considerably
more apparent in the fastest testing rate (0.10 s-1
) when compared with middle and slowest
stretch rates (0.004 s-1
and 0.02 s-1
). The marked increase in fluorescence at higher stretch rates
coincided with an increase in load on the polymer samples. This finding implies that larger
macroscopic stress at higher stretch rate leads to greater force across the mechanophore and more
extensive ring opening of SP.
Figs 3.6a-c reveal the trend in stretch ratio, stress, and birefringence at the activation
point, as defined in section 3.3.1, averaged over three samples at each deformation rate. The
stretch value at activation, λ*, shows a marked decrease at the fastest deformation rate. The true
stress, σ*, shows an increasing trend, indicating that although macroscopic stress is positively
correlated to SP activation, the same macroscopic stress does not necessarily translate to the

38
same force and activation of SP at the molecular scale. Activation birefringence values, Δn*,
were similar between stretch rates, indicating that a similar degree of chain alignment was
present at the onset of SP activation, regardless of the stretch rate. Finally, the rate of change of
fluorescence intensity with respect to stretch ratio was averaged between stretch ratios of 8 and
9, where all samples showed an increasing fluorescence signal, but none had failed. The results
plotted in Fig 3.6d show a clear trend of greater rate of fluorescence change (i.e. SP activation)
with increasing deformation rates.
Figure 3.6. Activation points, defined at λ*, for active SP-linked PMA as a function of stretch
rate. a) Activation stretch, b) activation stress, c) activation birefringence, and d) average
activation rate (dIfl/dλ) between λ = 8 and λ = 9.

39
Polymers of various molecular weights (80 kDa – 360 kDa) were tested in tension at the
same stretch rates as described above to determine the effect of polymer chain length. Molecular
weights under 50 kDa were not tested because the samples lacked mechanical integrity for
tensile testing. The behavior of the fluorescence intensity with increasing stress was effectively
the same for all molecular weights. The activation stretch ratio, λ*, for varied molecular weight
(min. 3 samples per data point) is plotted in Fig 3.7. A linear fit is laid over the data for each
deformation rate, and shows essentially constant stretch to activation, indicated by the horizontal
slope of the fit lines, thus molecular weight (above ca. 80 kDa) did not have a detectable effect
on SP activation.
Figure 3.7. Activation stretch ratio, λ*, for active SP-linked PMA at various molecular weights
tested at deformation rates of 0.004 s-1
, 0.02 s-1
and 0.10 s-1
.
3.3.3 Deformation Rate Dependence in Difunctional Control SP-Linked PMA
Difunctional control SP-linked PMA was tested in tension at the same stretch rates as
mechanochemically active polymer. Stress, birefringence and fluorescence data are shown in
40
Fig 3.8. The mechanical and birefringence behavior were similar to the mechanochemically
active case. Despite being linked in a manner that should not transmit force across the
mechanophore, an increase in fluorescence signal (activation) was evident with increasing stretch
ratio. The extent of fluorescence increase was lower than the active case, but still showed
deformation rate dependence – higher deformation rate led to greater fluorescence.
The fluorescence increase in difunctional control PMA had a virtually identical
spectroscopic fluorescence peak as the active sample, and no fluorescence signal was present in
polymer without SP incorporated, providing evidence that fluorescence increase in the
difunctional control was due to SP ring opening.
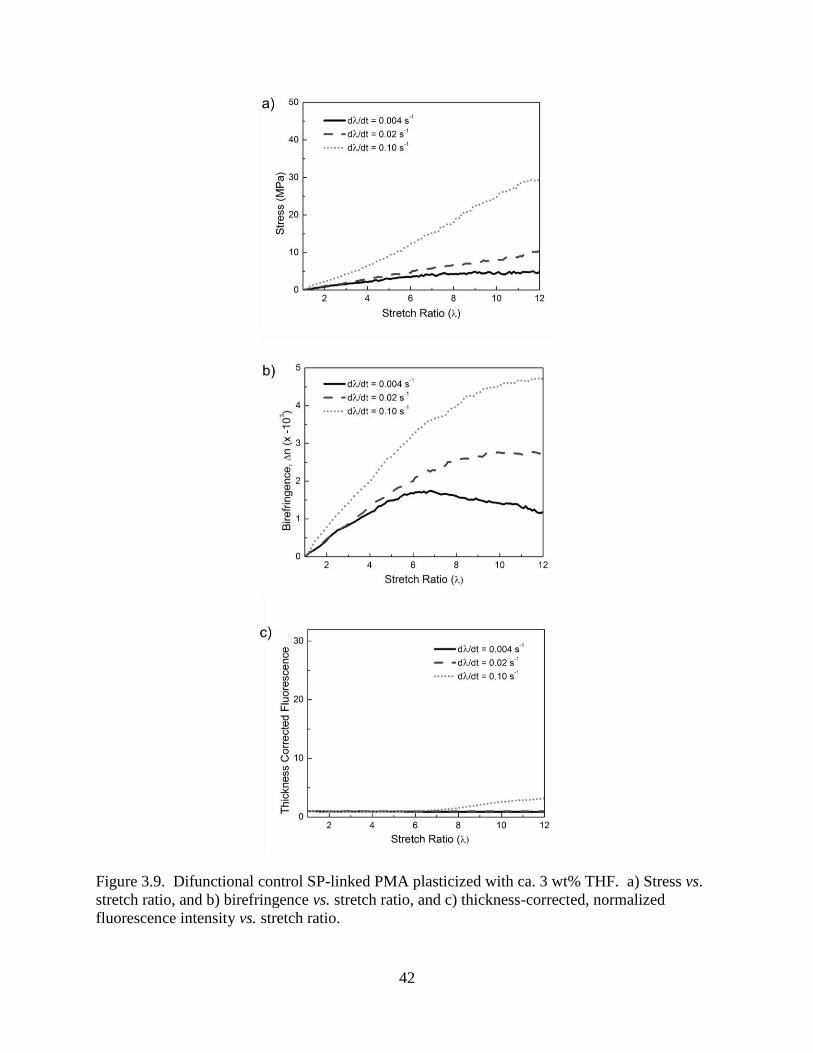
To further investigate the stress- and stretch-dependence of the fluorescence signal in the
control, a batch of difunctional control SP-linked PMA was (accidentally) plasticized with a
solvent (~3% tetrahydrofuran, THF) as described in section 2.2.1, such that the mechanical stress
was significantly lower in plasticized polymer. The stress, birefringence and fluorescence of
plasticized difunctional control samples are included in Fig 3.9. At the lower applied stresses in
the plasticized polymer, the control typically exhibited no fluorescence. For the highest
deformation rate, i.e. greatest stress, plasticized difunctional control SP-linked PMA showed a
slight amount of fluorescence increase. This finding indicated that fluorescence increase (and
presumably activation of the difunctional control SP) was a stress-induced process and not an
optical effect induced by deformation of the material. The control fluorescence and apparent SP
activation is discussed further in section 3.3.5.

41
Figure 3.8. Difunctional control SP-linked PMA loaded in tension at deformation rates of
0.004 s-1
, 0.02 s-1
and 0.10 s-1
. a) Stress vs. stretch ratio, and b) birefringence vs. stretch ratio,
and c) thickness-corrected, normalized fluorescence intensity vs. stretch ratio.
42
Figure 3.9. Difunctional control SP-linked PMA plasticized with ca. 3 wt% THF. a) Stress vs.
stretch ratio, and b) birefringence vs. stretch ratio, and c) thickness-corrected, normalized
fluorescence intensity vs. stretch ratio.

43
3.3.4 Stress Relaxation Behavior of Active SP-Linked PMA
Active SP-linked PMA samples were drawn to λ = 9, and the relaxation response of
stress, birefringence and activation were measured as a function of time. A representative case
deformed at a stretch rate of 0.10 s-1
is shown in Fig 3.10. The stress and birefringence during
the constant stretch ratio stage were fitted to exponential decay curves with effective time
constants (τeff) of 54 s and 83 s, respectively.
During stress relaxation, the fluorescence intensity in the polymer continued to increase,
indicating time dependence of the force-induced chemical reactions. Although macroscopic
deformation had stopped, stress in the system was sufficient to drive the reaction forward
without further deformation. The fluorescence reached a maximum as the stress decayed and
eventually decreased slightly over time due to the incident light source (λ = 532 nm) driving MC
to SP. The stress relaxation region in which fluorescence intensity was also increasing was fit to
an exponential curve. The effective time constant of the fluorescence increase was 53 s –
virtually the same as the effective stress relaxation time constant, τeff,σ – indicating a possible link
between the decay in activation rate and the decay in stress.

44
Figure 3.10. Stress relaxation, birefringence relaxation and thickness corrected fluorescence
intensity (activation) of active SP-linked PMA loaded and unloaded at a stretch rate of 0.10 s-1
.
The sample was unloaded at the same stretch rate as the loading segment by moving the
load frame crossheads together until the load was reduced to zero. During unloading the
fluorescence intensity decreased, showing some reversion of the MC to SP. After returning to
zero load, some fluorescence increase remained in the sample.
Effective time constants (τeff) measured from stress and birefringence relaxation
conditions (fitted to exponential decay for 400 s after the onset of relaxation) were between 50-
100 s at all loading rates. These relaxation time scales were similar to the test time for the fastest
deformation rate (dλ/dt = 0.10 s-1
). Slower deformation rates (dλ/dt = 0.004 s-1
and
dλ/dt = 0.02 s-1
) correspond to test times substantially longer than relaxation times
(ttest ~ 5-25 x τeff), and presumably polymer relaxation had a more pronounced effect. The

45
increase in stress, birefringence, and ultimately activation at the highest deformation rate (Fig
3.5) is attributed to less prominent effect of polymer chain relaxation for short test durations.
3.3.5 Stress Relaxation Behavior of Difunctional Control SP-Linked PMA
Difunctional control SP-linked PMA was subjected to stress relaxation loading conditions
similar to the active case presented in the previous section. The sample in Fig 3.11 was loaded at
a stretch rate of dλ/dt = 0.10 s-1
to a stretch ratio greater than 9, and then the deformation was
held constant. Load and fluorescence were monitored as a function of time. The fluorescence
signal increased during deformation, indicating activation of SP. In contrast to active samples,
the fluorescence signal did not continue to increase during the stress relaxation stage. The
fluorescence signal in the control decreased during relaxation, indicating that SP to MC
conversion had stopped proceeding forward, and was slowly reverted by the incident light
source.
Stress relaxation behavior indicates a differing mechanism for fluorescence increase (i.e.
activation) of difunctional control SP-linked PMA when compared to active polymer. Activation
of control SP during stretching may be due to a drag force in the polymer from solvent friction.
Polymer dynamics theory, based on of Rouse [69] and Zimm [70] models, typically assumes an
effect of solvent friction, ξ, which applies drag force on a flowing polymer chain [71, 72]. The
drag force is the product of a drag coefficient from polymer interaction with the solvent (in this
case other polymer chains), and the rate of polymer flow. Experimental data exhibits the
expected trends for drag force-induced activation of the control, with activation (fluorescence
increase) proportional to the deformation rate, and no activation during stress relaxation when

46
the rate of polymer flow (and therefore drag force) is negligibly small. THF-plasticized polymer
(refer to Fig 3.9) presumably had a smaller coefficient of solvent friction (ξPMA+THF < ξPMA) and
therefore the drag force was not sufficient to drive SP-MC conversion in the plasticized control
SP-linked polymer.
Figure 3.11. Stress relaxation and thickness corrected fluorescence of difunctional control SP-
linked PMA loaded at a stretch rate of 0.10 s-1
.
3.3.6 Effect of Mechanophore Architecture: SP Activation in Linear, 4-Arm, and 8-Arm SP
Multiple polymer arms were bonded to the mechanophore in the configurations shown
schematically in Fig 3.1. Each polymer in this section was synthesized with a total molecular
47
weight of approximately 250 kDa. Samples of 4- and 8-arm SP-linked PMA were tested at
stretch rates of 0.004 s-1
, 0.02 s-1
, and 0.10 s-1
and the fluorescence intensities as a function of
stretch ratio were compared to the behavior of linear PMA. Macroscopic stress at each
deformation rate was virtually the same for the different polymer architectures. Representative
plots of normalized fluorescence (the normalization calculation is described earlier in this
chapter) at each deformation rate are included in Fig 3.12. The fluorescence intensity of 4-arm
and 8-arm architectures increased at lower stretch ratios and reached greater magnitudes. The
increased activation was more pronounced at slow deformation rates (dλ/dt = 0.004 s-1
and
0.02 s-1
) than at the fastest deformation rate (dλ/dt = 0.10 s-1
).
Activation stretch ratios, λ*, were averaged for each mechanophore architecture and
deformation rate (minimum 3 samples per data point) and plotted in Fig 3.13. For linear SP-
linked PMA, λ* decreased with increasing deformation rate (described in section 3.3.3). In
contrast the 4- and 8-arm mechanophore structures were effectively unaffected by deformation
rate. The earlier onset of activation in the 4- and 8-arm structures was pronounced at slow
deformation rates. At the fastest deformation rate, the dendrimeric SP-linked structures showed
no statistically significant difference in activation behavior.

48
Figure 3.12. Representative normalized fluorescence curves for linear, 4-arm and 8-arm SP-
linked PMA tested in tension at deformation rates (dλ/dt) of a) 0.004 s-1
, b) 0.02 s-1
and
c) 0.10 s-1
.

49
In linear polymer, the stress effective relaxation time (τ ≈ 70 s) was similar to the time
scale for tensile testing at the fastest deformation rate (approximately 100s). At fast deformation
rates, higher forces were applied across each polymer chain with little effect of relaxation, and
activation was far more prominent. In the dendrimeric (4-arm and 8-arm) SP architectures, the
relaxation effect was not evident in the data at the slower deformation rates, possibly due to the
mechanophore being pinned by multiple polymer chains on each side. In such dendrimeric
mechanophore structures, all of the polymer chains would have to move in concert in order to
relieve the stress on the mechanophore subunit. Because of polymer chains attached at multiple
sites on the mechanophore, relaxation was not prominent in 4-arm and 8-arm SP structures, and a
higher degree of activation was evident in the solid state at low deformation rates.
Figure 3.13. Stretch ratio at the activation point, λ*, for linear and multi-arm SP-linked PMA
plotted as a function of deformation rate.
50
3.4. Conclusions
SP-linked poly(methyl acrylate) provided a model system for measuring the
mechanochemical response in an elastomeric polymer. Previous work by Davis et al. [15]
demonstrated mechanophore activation when linked into a PMA backbone under tensile
deformation via a color change. The work presented in this chapter provides a thorough
quantitative study of a SP-linked elastomer subjected to a tensile load, and the parameters which
affect mechanophore activation in an elastomeric polymer.
A novel experimental set-up was designed to simultaneously apply a mechanical load to
polymer samples and collect in situ optical measurements of fluorescence and polymer chain
alignment. The SP-to-MC conversion was quantified via the fluorescence signal of the MC
form, excited by a 532 nm laser and collected at λ > 575 nm. Birefringence provided a relative
measure of the polymer chain alignment, which was correlated to the mechanophore activation.
The findings indicate that rapid activation of SP occurred when birefringence began to plateau
and reach a maximum, thus when polymer chains were most aligned in the direction of
macroscopic force.
The effect of tensile deformation rate was studied and indicated that for increasing
deformation rate, the macroscopic stress in the polymer increased and a corresponding increase
in the rate and degree of activation ensued. Stress relaxation behavior of SP-linked PMA
indicated that SP activation is a time dependent process, and mechanochemical conversion will
continue at a constant deformation, provided that the stress remains sufficiently high (above ca.
10 MPa).
A difunctional SP-linked control was incorporated into the PMA backbone such that
force was not transferred across the sensitive C-O spiro bond of the mechanophore. In this
51
configuration, some amount of fluorescence increase, i.e. SP activation was detected in the
control under tension. The fluorescence increase was of smaller magnitude and did not continue
under stress relaxation conditions, indicating a different mechanism for activation in the control
case. Experimental evidence supports a theory of molecular friction acting to open the control
SP species to its MC form.
The SP molecule was designed with dendrimeric functionality, such that multiple
polymer arms could be attached to each side of the SP unit. The aim was to magnify the force
across the mechanophore. The result obtained from fluorescence measurement during tensile
deformation was improved activation of the dendrimeric structures when compared to a linear
structure at low deformation rates, when polymer relaxation effects dominated.
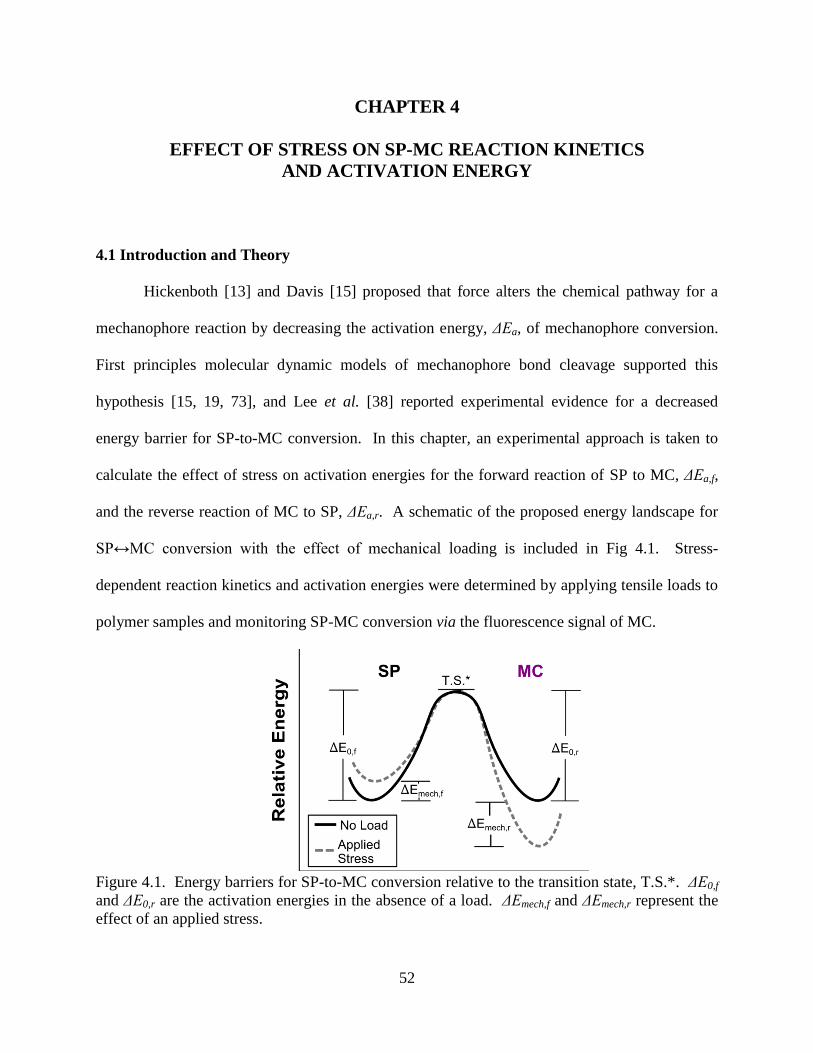
52
CHAPTER 4
EFFECT OF STRESS ON SP-MC REACTION KINETICS
AND ACTIVATION ENERGY
4.1 Introduction and Theory
Hickenboth [13] and Davis [15] proposed that force alters the chemical pathway for a
mechanophore reaction by decreasing the activation energy, ΔEa, of mechanophore conversion.
First principles molecular dynamic models of mechanophore bond cleavage supported this
hypothesis [15, 19, 73], and Lee et al. [38] reported experimental evidence for a decreased
energy barrier for SP-to-MC conversion. In this chapter, an experimental approach is taken to
calculate the effect of stress on activation energies for the forward reaction of SP to MC, ΔEa,f,
and the reverse reaction of MC to SP, ΔEa,r. A schematic of the proposed energy landscape for
SP↔MC conversion with the effect of mechanical loading is included in Fig 4.1. Stress-
dependent reaction kinetics and activation energies were determined by applying tensile loads to
polymer samples and monitoring SP-MC conversion via the fluorescence signal of MC.
Figure 4.1. Energy barriers for SP-to-MC conversion relative to the transition state, T.S.*. ΔE0,f
and ΔE0,r are the activation energies in the absence of a load. ΔEmech,f and ΔEmech,r represent the
effect of an applied stress.

53
The effect of stress on reaction kinetics and activation energy can be incorporated into
transition state theory [74]. According to the Eyring-Polanyi equation, a reaction rate constant,
k, is dependent on the activation energy ΔEa of the species following an Arrhenius agreement
[75, 76]:
exp( )b a
b
k T Ek
h k T
4.1
Variables kb and h are the Boltzman constant and Planck’s constant, respectively, and T is
temperature. Because SP-MC conversion is reversible, there is a forward rate constant, kf for
SPMC conversion, and a reverse rate constant, kr for MCSP conversion. These rate
constants correspond to activation energies, ΔEa,f and ΔEa,r, respectively.
Both ΔEa,f and ΔEa,r of SP/MC are assumed to be a linear combination of the inherent
thermal activation energy, ΔE0, the effect of the applied mechanical load, ΔEmech, and a
photochemical term, ΔEλ:
, 0, , ,( ) ( )a f f f mech fE E E P E 4.2a
, 0, , ,( ) ( )a r r r mech rE E E P E 4.2b
The photochemical effect is a function of the wavelength, λ, and power, P, of light incident on
the sample, and the mechanical effect is described in terms of the applied stress, σ.
Following from Ward [43], the dependence of activation energy on an applied stress is
assumed linear, thus
*mechE v 4.3
where v* is the activation volume, with units of m3. The activation volume can be intuitively be
described as the product of the volume of the species and the strain required for a mechanically-
54
induced transformation [77]. Combining Eqs. 4.1-4.3, the effect of stress on the forward and
reverse reaction rates follows [5, 26, 43, 78]:
,
0,
*exp( ) exp( )
b a f ff f
b b
k T E vk k
h k T k T
4.4a
,0,
*exp( ) exp( )
b a r rr r
b b
k T E vk k
h k T k T
4.4b,
where kσ=0,f and kσ=0,r represent the rate constants in the absence of an applied load.
Transition state theory effectively describes molecular-level mechanically induced
processes such as dislocation motion and polymer yielding, wherein the stress reduces the energy
barrier for molecular motion and flow [5, 26, 77, 79]. In biological systems, proteins have been
tethered to an atomic force microscope and deformed, and the rate of protein debonding [43, 80]
and unfolding [81] has been similarly described with the exponential relationship of Eq 4.4. In
this work, SP-linked polymers were subjected to various loading conditions and kinetics were
monitored to empirically determine the relationship between stress and reaction kinetics in a bulk
SP-linked polymer.
The conversion between SP and MC is first order and reversible. The reaction rate, in
terms of MC concentration, [MC], follows:
[ ][ ] [ ]f r
d MCk SP k MC
dt 4.5.
The kinetics of the reaction were investigated based on the measured fluorescence intensity as
described in Chapter 3. Fluorescence intensity, Ifl, was assumed proportional to the relative
concentration of MC:
max ,max
[ ]
[ ]
fl
fl
MC I
MC I 4.6

55
where [MCmax] represents 100% of the mechanophores in the MC form, Ifl, is the average
measured fluorescence intensity, and Ifl,max corresponds to the fluorescence intensity if all
mechanophores were in the MC form. In this study Ifl,max was assumed to be 10x the
fluorescence intensity of polymer samples in equilibrium with the 385 UV light incident on the
samples to drive equilibrium toward the MC form (Ifl,max = 10IUV). At this value of Ifl,max,
equilibirium slightly favors the SP form. A parametric study of the effect of Ifl,max is included in
Appendix B.
The relative proportion of mechanophores in the SP form is equal to:
max max
[ ] [ ]1
[ ] [ ]
SP MC
SP MC 4.7.
Combining Equations 4.5-4.7, the reaction kinetics is expressed in terms of the fluorescence
intensity:
,max
,max ,max
( / )(1 )
fl fl fl flf r
fl fl
d I I I Ik k
dt I I 4.8.
The results presented in this chapter establish a framework for understanding the relationship
between SP reaction kinetics and applied stress in a solid polymer, from which the change in the
energy barriers due to loading, ΔEmech,f and ΔEmech,r were calculated.
4.2 Experimental Methods
4.2.1 SP-Linked PMA Samples and Treatment
Mechanochemically active SP-linked PMA was synthesized and molded into dog-bone
shaped specimens as described in Chapter 3. The samples were subjected to lighting and
mechanical testing conditions described in Table 4.1. Prior to testing, samples were irradiated
for 30 minutes with either UV light (λUV = 385 nm) or green (G) light (λgreen = 532 nm) in order
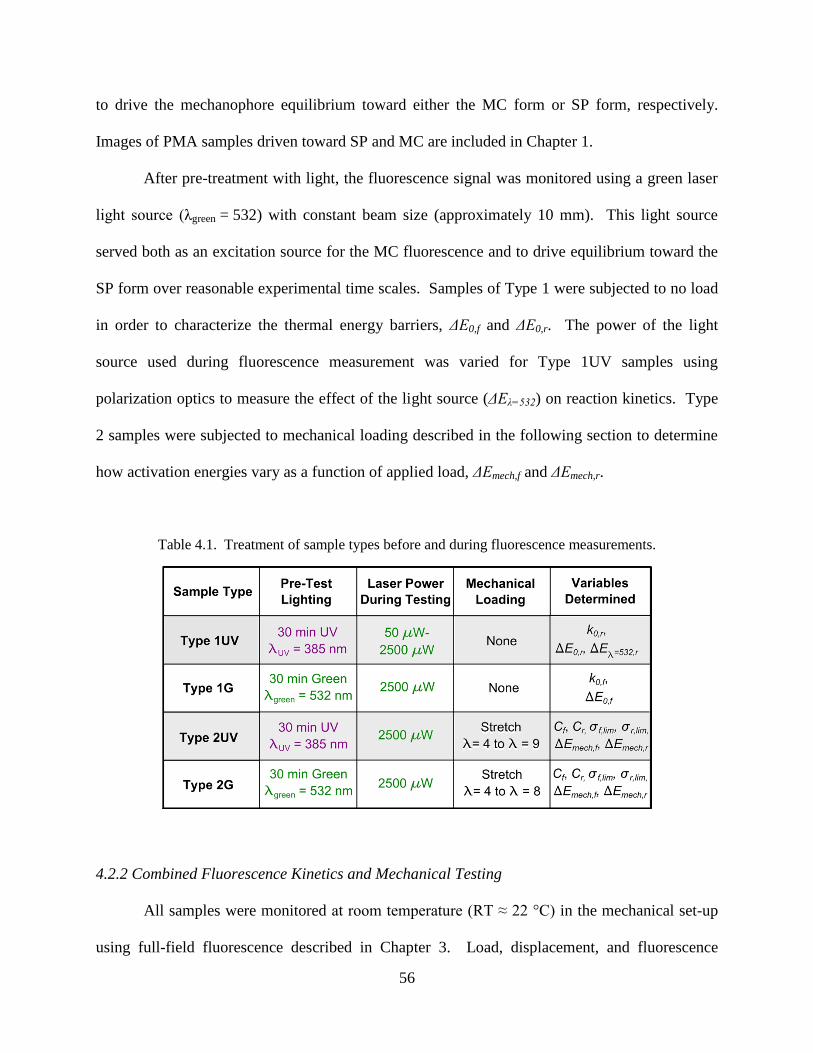
56
to drive the mechanophore equilibrium toward either the MC form or SP form, respectively.
Images of PMA samples driven toward SP and MC are included in Chapter 1.
After pre-treatment with light, the fluorescence signal was monitored using a green laser
light source (λgreen = 532) with constant beam size (approximately 10 mm). This light source
served both as an excitation source for the MC fluorescence and to drive equilibrium toward the
SP form over reasonable experimental time scales. Samples of Type 1 were subjected to no load
in order to characterize the thermal energy barriers, ΔE0,f and ΔE0,r. The power of the light
source used during fluorescence measurement was varied for Type 1UV samples using
polarization optics to measure the effect of the light source (ΔEλ=532) on reaction kinetics. Type
2 samples were subjected to mechanical loading described in the following section to determine
how activation energies vary as a function of applied load, ΔEmech,f and ΔEmech,r.
Table 4.1. Treatment of sample types before and during fluorescence measurements.
4.2.2 Combined Fluorescence Kinetics and Mechanical Testing
All samples were monitored at room temperature (RT ≈ 22 °C) in the mechanical set-up
using full-field fluorescence described in Chapter 3. Load, displacement, and fluorescence

57
intensity were measured over time for each sample. Fluorescence images were taken at image
periods between 5 s and 20 s. Laser power was controlled using polarization optics, and the light
was circularly polarized prior to incidence on the sample. Exposure was constant for all samples
except Type 1UV, in which the exposure was scaled inversely with laser power. Fluorescence
intensity, Ifl, for each image was defined as the red channel intensity with a constant field of
localized in the middle of the sample, corrected by a factor the thickness of the sample (see
Chapter 3 for details of thickness correction). Ifl was then normalized by a constant Ifl,max.
A mechanical load was applied to sample Types 2UV and 2G using stress relaxation
condition conditions (i.e. constant stretch ratio, λ) described in Chapter 3. Samples were loaded
to pre-defined stretch ratios at a deformation rate of dλ/dt = 0.1 s-1
, and the fluorescence intensity
was measured as a function of time after the deformation stopped (t = 0), coinciding with the
onset of relaxation. Stress relaxation was chosen because it allowed measurement of the
fluorescence change over long periods of time with no change in the sample thickness or
imaging conditions. The true stress, σ(t), was calculated at the time of each fluorescence image
based on the applied force and optically measured width of the sample as described in Chapter 3.
4.3 Results and Discussion
4.3.1 SP Reaction Kinetics with No Applied Load
The effect of incident 532 nm laser power on the SP↔MC reaction kinetics was
examined first using sample Type 1UV (see Table 4.1). After UV irradiation, MC form was
evidenced by a strong purple color and fluorescence intensity (IUV) in the samples. During
fluorescence measurement, the 532 nm laser exposure drove equilibrium toward SP and also
served as an excitation source for MC fluorescence excitation. Sample Type 1UV images are

58
included in Fig 4.2a. Evolution of fluorescence intensity (normalized by Ifl,max = 10IUV) is shown
in Fig 4.2b for various laser powers. At room temperature with no light incident on the sample,
the fluorescence signal was virtually constant over a span of days, indicating a relatively stable
MC form. With 532 nm light incident on the sample, the fluorescence intensity readily decayed
over time. Increasing laser power led to more rapid decay in the fluorescence signal. A single
exponential function was fit to the fluorescence data for each sample in Fig 4.2b and the
corresponding time constants, τ, are listed in Table 4.2.
Figure 4.2. Effect of 532 nm laser power on fluorescence decay and reaction kinetics. a) Type
1UV sample before and after testing. b) Decay of sample Type 1UV fluorescence intensity vs.
log of time at varied incident laser power. Exponential decay curves are fit to the experimental
data. c) Activation energies for the reverse reaction (ΔEa,r) with an exponential curve fitted to
the data. d) Fluorescence intensity of samples pre-treated with UV light (Type 1UV) and 532
nm light (Type 1G), exposed to 2500 μW laser exposure during fluorescence imaging.
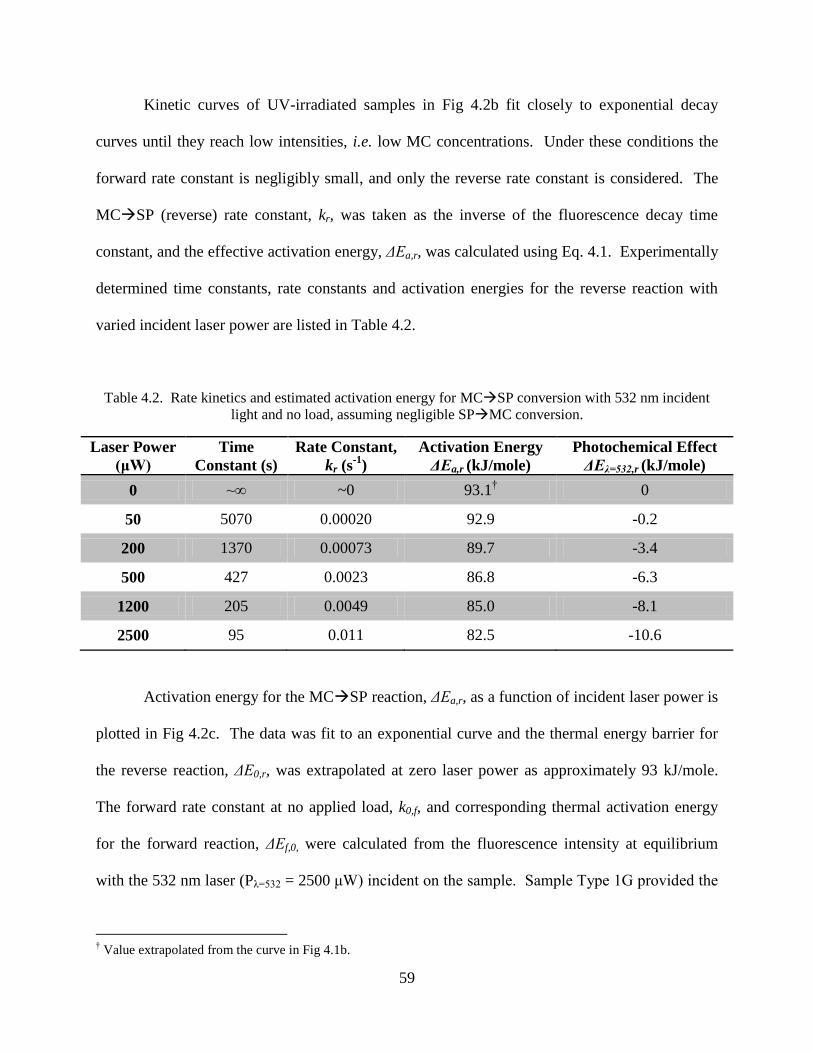
59
Kinetic curves of UV-irradiated samples in Fig 4.2b fit closely to exponential decay
curves until they reach low intensities, i.e. low MC concentrations. Under these conditions the
forward rate constant is negligibly small, and only the reverse rate constant is considered. The
MCSP (reverse) rate constant, kr, was taken as the inverse of the fluorescence decay time
constant, and the effective activation energy, ΔEa,r, was calculated using Eq. 4.1. Experimentally
determined time constants, rate constants and activation energies for the reverse reaction with
varied incident laser power are listed in Table 4.2.
Table 4.2. Rate kinetics and estimated activation energy for MCSP conversion with 532 nm incident
light and no load, assuming negligible SPMC conversion.
Laser Power
(μW)
Time
Constant (s)
Rate Constant,
kr (s-1
)
Activation Energy
ΔEa,r (kJ/mole)
Photochemical Effect
ΔEλ=532,r (kJ/mole)
0 ~∞ ~0 93.1† 0
50 5070 0.00020 92.9 -0.2
200 1370 0.00073 89.7 -3.4
500 427 0.0023 86.8 -6.3
1200 205 0.0049 85.0 -8.1
2500 95 0.011 82.5 -10.6
Activation energy for the MCSP reaction, ΔEa,r, as a function of incident laser power is
plotted in Fig 4.2c. The data was fit to an exponential curve and the thermal energy barrier for
the reverse reaction, ΔE0,r, was extrapolated at zero laser power as approximately 93 kJ/mole.
The forward rate constant at no applied load, k0,f, and corresponding thermal activation energy
for the forward reaction, ΔEf,0, were calculated from the fluorescence intensity at equilibrium
with the 532 nm laser (Pλ=532 = 2500 μW) incident on the sample. Sample Type 1G provided the
† Value extrapolated from the curve in Fig 4.1b.

60
equilibrium fluorescence intensity, Ifl,eq, plotted in Fig 4.2d. Representative fluorescence of
sample Type 1UV is included for comparison. Type 1G had constant fluorescence intensity,
indicating equilibrium, and dIfl/dt = 0. Substituting this value into Eq 4.8, the rate constant for
the forward reaction, kf, was calculated:
,
0,
,max ,
fl eqf r f
fl fl eq
Ik k k
I I
4.9
where kr corresponds to the reverse reaction rate at the test laser power. The SP form does not
absorb light in the green range, and it was assumed that the laser light did not affect the forward
reaction (ΔEλ=532,f = 0), therefore kf = k0,f. The calculated forward reaction rate with no applied
load was approximately 6 x 10⁻⁵
s-1
. The corresponding thermal activation energy for the forward
reaction calculated from Eq. 4.1 was ΔE0,f = 96 kJ/mole. These calculated thermal activation
energies for the forward and reverse reactions indicate a small preference for the SP form.
Activation energies for SP and MC have been calculated by the Martinez group at
Stanford University using molecular dynamics simulations. At no load, ΔE0,f and ΔE0,r are
approximately 110 kJ/mole and 97 kJ/mole respectively [82]. The experimentally derived
reverse activation energy is within approximately 3% of the molecular dynamics simulation,
while the activation energy for the forward reaction is lower than expected. This difference may
be due to the interaction of the mechanophore with the polymer matrix, which is not accounted
for in the simulations.
4.3.2. Effect of Applied Mechanical Load on SP Reaction Kinetics
Sample Types 2UV and 2G were subjected to mechanical loading with stress relaxation
conditions at various stretch ratios, λ. A 532 nm laser was applied incident on the sample at t = 0
coinciding with the onset of stress relaxation, again to drive the reaction toward the SP form and

61
simultaneously excite fluorescence. Incident laser power (Pλ=532 nm) of 2,500 μW was chosen
during mechanical testing such that the fluorescence decay (τfl ~ 95 s) and effective stress
relaxation time (τeff ~ 70 s) were similar. At this laser intensity and with no applied stress, the
rate constant of the reverse reaction (0.01 s-1
) was more than two orders of magnitude greater
than the forward rate constant (6 x 10⁻⁵
s-1
).
Evolution of fluorescence intensity is shown in Fig 4.3a and 4.3b for sample Types 2UV
and 2G, respectively. Deformed sample fluorescence intensity was normalized by the sample
thickness in the manner described in Chapter 3. The fluorescence signal for all samples was
then divided by the maximum value, Ifl,max, and the fluorescence intensities in Fig 4.3 are
presented in terms of the value Ifl / Ifl,max.
Figure 4.3. Normalized fluorescence intensity (Ifl / Ifl,max) over time after the onset of stress
relaxation at predefined stretch ratios, λ. a) Samples irradiated with UV light prior to testing. b)
Sample irradiated with green light prior to testing. Individual data points represent experimental
results, and curves correspond to calculated stress-dependent kinetics.
In Fig 4.3a the black data points corresponding to sample Type 1UV decayed
exponentially, indicating that the reverse reaction occurred with little effect from the forward
reaction. The fluorescence decay was detectably slower at applied stretch ratios of 5 and greater.

62
At stretch ratios of 8 and 9 the fluorescence intensity increased significantly above the intensity
after UV irradiation, confirming that not all of the mechanophores were driven to the MC form
by UV light and additional mechanically-induced SP-to-MC activation occurred.
As the applied stress relaxed, the decay rate of the fluorescence signal approached the
fluorescence decay rate with no applied load. The nature of the relationship between the reaction
rate and applied stress was investigated by plotting ΔIfl/Δt as a function of the stress, σ(t), at the
time of each fluorescence measurement for sample Types 2UV and 2G (Fig 4.4). The
relationship was approximated as bi-linear. At low stresses there was no detectable effect of
stress on the reaction rate, whereas above a threshold level near 10 MPa, the trend of ΔIfl/Δt was
linearly proportional to the applied stress.
Figure 4.4. Fluorescence change in active SP-linked PMA at various applied loads with bi-linear
fits overlayed. a) Sample Type 2UV. b) Sample Type 2G.
The reaction kinetics were empirically modeled based on trends shown in Fig 4.4, and
calculated based only on the macroscopic stress in the polymer samples. A bi-linear relationship
for both the forward and reverse rate constants was assumed:

63
, 0 ,lim
, 0 ,lim ,lim
for
( ) for
f f f
f f f f f
k k
k k C
4.10a
and
, 0 ,lim
, 0 ,lim ,lim
for
( ) for
r r r
r r r r r
k k
k k C
4.10b.
The forward and reverse rate constants, kf,σ=0 and kr,σ=0, at no applied load with test lighting
conditions (Pλ=532 nm = 2500 μW) were known following from section 4.3.1. Values for kr were
limited to only positive values, and assumed to be virtually zero when the calculated rate reaction
decreased below zero. Variables to be optimized were critical stress, σf,lim and σr,lim, above
which an effect of mechanical loading on the rate constant could be detected, and Cf and Cr
correlating applied stress and the change in reaction rate. Matlab software was used to iterate
values for the unknown variables (Cf, Cr, σf,lim and σr,lim) and calculate reaction kinetics using
only the stress in the sample, σ, by substituting the stress-dependent rate constants from Eqs.
4.10a and 4.10b into Eq 4.8. For each iteration, the calculated fluorescence kinetics were
compared to the data in Fig 4.3, and best fit values for the unknown variables were defined as
those with the smallest standard error between calculated and experimental kinetics. A detailed
description of the code to optimize kf(σ) and kr(σ) is included in Appendix B. Best fit curves for
the predicted fluorescence are plotted with the experimental data in Fig 4.3a and Fig 4.3b. The
average percent error between the experimental data and empirical predictions of all data points
in the best fit activation rates was below 6%.
The best fit rate constants for the forward and reverse reaction, kf and kr, are plotted as a
function of stress in Fig 4.5a. The forward reaction rate increased with applied stress, and the
reverse reaction rate decreased with increasing stress. The onset of a detectable change in the
kinetics of SP-MC conversion was at approximately σlim = 8 MPa, for both the forward and

64
reverse reactions. At stresses greater than 40 MPa the reverse rate constant was effectively zero.
The correlation factors Cf (8 x 10⁻⁵
MPa-1
s-1
) and Cr (3 x 10⁻⁴
MPa-1
s-1
) had similar magnitudes.
The effect of stress accelerating the forward reaction was comparable to the effect retarding the
reverse reaction.
Figure 4.5. Empirically derived parameters for kinetics of SP-MC conversion as a function of
applied stress. a) Reaction rates for the forward and reverse reactions, and b) activation energies
for the forward and reverse reactions at laser power of 2500 μW.
The bi-linear (Eq 4.10) trend describing the experimental data was determined
empirically from experimental data. Compared with the Eyring model (Eq 4.4), two differences
are apparent. In our model, a threshold of macroscopic stress (σlim) was required before a change
in the reaction rates and activation energies was detectable. This may be due to initial
deformation energy being applied to uncoiling and aligning polymer chains – an argument posed
and supported in the previous chapter – before the macroscopic stress translated to a tensile force
along the polymer chains. Additionally, an exponential agreement between reaction kinetics and
applied stress did not effectively describe the kinetics, overestimating the change in reaction
kinetics at large applied stress. If the exponential term of the Eyring model in Eq. 4.4 is
approximated as linear for small values of ΔEmech [43], e.g.:

65
, ,
0, 0, 0,
*exp( ) (1 ) (1 )
mech f mech f ff f f f
b b b
E E vk k k k
k T k T k T
4.11
then the reaction rate from the Eyring model follows the same trend observed in the experimental
data and simulated for σ > σlim. Equations 4.10a and 4.11 were combined and the activation
volume for the forward reaction, v*f, is 3.5 x 10⁻²⁶
m3, with a corresponding characteristic length
(d*f = v*1/3
f) of approximately 3 nm. The reverse reaction had an activation volume, v*r, of 9.5 x
10-29
m3, with a characteristic length scale, d*r , of 2 nm. The long axis of the SP and MC forms
have lengths of approximately 0.7 nm and 1.3 nm based on molecular modeling. Thus activation
volumes and characteristic length scales for both the forward and reverse direction are on the
same size scale as the SP molecule, as is expected for a stress-activated process [77].
Activation energies for the forward and reverse reactions were calculated from the rate
constants using Eq 4.1 and are plotted as a function of stress in Fig 4.5b. Even with a relatively
strong photochemical driving force for the reverse reaction applied by a 532 nm laser at
2500 μW, the forward reaction dominated at stresses over 35 MPa. If the photochemical effect
from the laser ΔEλ=532,r is subtracted, the activation energies, ΔEa, of both SP and MC correspond
to relatively stable species. Below a threshold stress of approximately 8 MPa, no change in
activation energy was detected. At high levels of stress (50 MPa) the energy barrier for
activation of SP to MC, ΔEmech,f, was decreased by approximately 12 kJ/mole. At stresses above
40 MPa, the reverse reaction (MCSP) was not detectable, and the activation energy, ΔEmech,r,
was not measured and presumed large.
The effect of stress on reaction kinetics described in this chapter applies to an elastomeric
polymer in which polymer chain mobility is relatively high and yield was virtually immediate.
In a glassy polymer system (described in the following chapter) polymer yield and flow is an
additional requirement for stress to affect reaction kinetics.
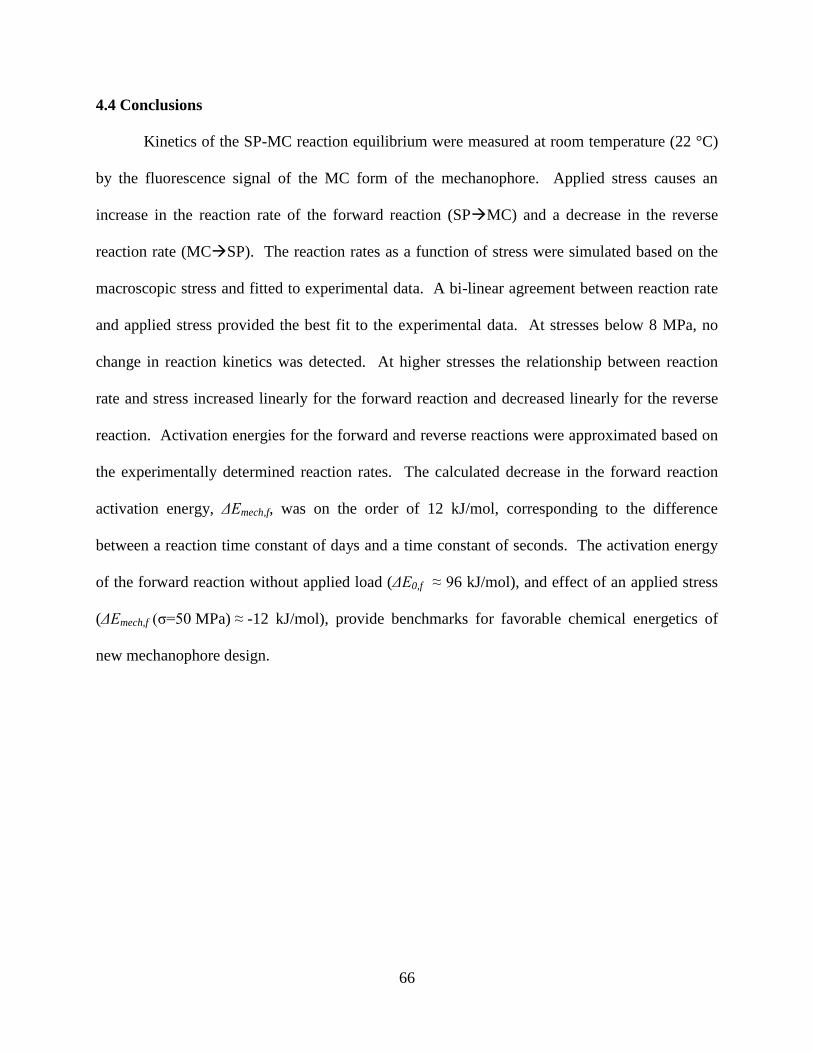
66
4.4 Conclusions
Kinetics of the SP-MC reaction equilibrium were measured at room temperature (22 °C)
by the fluorescence signal of the MC form of the mechanophore. Applied stress causes an
increase in the reaction rate of the forward reaction (SPMC) and a decrease in the reverse
reaction rate (MCSP). The reaction rates as a function of stress were simulated based on the
macroscopic stress and fitted to experimental data. A bi-linear agreement between reaction rate
and applied stress provided the best fit to the experimental data. At stresses below 8 MPa, no
change in reaction kinetics was detected. At higher stresses the relationship between reaction
rate and stress increased linearly for the forward reaction and decreased linearly for the reverse
reaction. Activation energies for the forward and reverse reactions were approximated based on
the experimentally determined reaction rates. The calculated decrease in the forward reaction
activation energy, ΔEmech,f, was on the order of 12 kJ/mol, corresponding to the difference
between a reaction time constant of days and a time constant of seconds. The activation energy
of the forward reaction without applied load (ΔE0,f ≈ 96 kJ/mol), and effect of an applied stress
(ΔEmech,f (σ=50 MPa) ≈ -12 kJ/mol), provide benchmarks for favorable chemical energetics of
new mechanophore design.

67
CHAPTER 5
SP ACTIVATION IN A GLASSY POLYMER:
EFFECT OF THERMOMECHANICAL BEHAVIOR‡
5.1 Introduction
SP has typically been incorporated into elastomeric or ductile polymers such as linear
poly(methyl acrylate) (PMA) or polyurethane (PU). SP activation in elastomeric polymers
occurs at relatively large deformations, on the order of hundreds of percent strain [38, 83]. In
this chapter SP is incorporated into a linear engineering polymer, poly(methyl methacrylate)
(PMMA), with the goal of imparting higher force to the mechanophore at low strains, and
achieving low-strain SP activation. As opposed to the elastomeric system described in
Chapter 3, PMMA fails at relatively small applied displacements. Therefore engineering strain
is used as the metric to define deformation as opposed to stretch ratio. Linear PMMA has a
relatively high glass transition temperature and exhibits brittle fracture at room temperature. At
higher temperatures approaching Tg, the yield stress decreases and PMMA exhibits the ability to
be drawn [5, 84]. The glass transition temperature of PMMA can also be reduced by plasticizing
with a dilute concentration of solvent, allowing yielding at lower temperatures [44, 45, 85].
Ductile mechanical response was elicited by testing at elevated temperature or after plasticizing
to achieve activation in SP-linked PMMA.
‡ The results presented in this chapter are published in: Beiermann, B.A., et al., Environmental effects on
mechanochemical activation of spiropyran in linear PMMA. Journal of Materials Chemistry, 2011.

68
5.2 Experimental Methods
5.2.1 Synthesis and Characterization
Linear PMMA was synthesized by an ATRP reaction described in Chapter 2. Active SP-
linked PMMA and difunctional control SP-linked PMMA were synthesized using SP as the free
radical initiator and linking the mechanophore into the polymer backbone. Plain SP-linked
PMMA was synthesized with no SP incorporated into the polymer. All polymers were glassy at
room temperature, with Tg of approximately 127 °C (refer to Table 2.2) regardless of SP
incorporation.
5.2.2 Sample Molding
Polymer powder was molded into tensile dog-bone samples via compression molding in a
closed mold. A pressure of 200 psi was applied to the mold at a temperature of 160 °C, for 10
minutes. The mold was then quenched in water. Samples were polished before testing, and SP-
linked polymer, held at 100 °C, was irradiated with a 530 nm diode lamp for 24 hours to drive
the active species toward the closed SP form. Sample dimensions are shown in Appendix A.
Thermal energy from molding at high temperature (160 °C) led to some ring opening.
Molded samples exhibited a red or orange appearance, indicating a combination of the
clear/yellow SP form and the purple MC form. Visible spectrum light, particular in the green
region of the visible range, is known to drive the MC isomer to the SP form [34]. However, at
room temperature, 532 nm light was not effective at reverting MC to SP. By irradiating with
532 nm light at 100 °C for 24 hours, the color faded to a clear or yellowish color indicating that
most MC had been driven to SP.
69
5.2.3 Mechanical Testing
Specimens were tested in tension over a range of temperatures, using an environmental
chamber to control temperature. The equipment used for temperature controlled mechanical
testing was TA Instruments RSA3, typically used for dynamic mechanical analysis. Prior to
testing, samples were equilibrated for 5 minutes at the desired test temperature under a small
tensile preload (0.1 N). The samples were then loaded in displacement control at a rate of 5
m/s. Initial gauge lengths varied between 5-7 mm.
Additional samples were plasticized solvents in order to reduce Tg. Dibutyl phthalate
(DBP) and methanol (MeOH) are documented plasticizers for PMMA and were used in this
research [44, 84, 85]. For methanol plasticizing, samples were soaked in methanol for
approximately 48 hours. A corresponding solvent uptake of 15-20 wt% was observed. At this
MeOH content, mechanical behavior was similar to unplasticized PMMA at 90 °C.
To plasticize PMMA with dibutlyl phthalate (DBP), 2 g dried polymer powder was
mixed with a defined amount of DBP and 100 mL MeOH for 24 hours. The methanol (boiling
point = 65 °C) was then driven off by drying the polymer at 80 °C for 24 hours, leaving only the
desired amount of DBP (boiling point = 344 °C). The glass transition temperature for each
polymer batch was determined by the peak of a tan(δ) curve from dynamic mechanical analysis,
ramped at 3 °C per minute. Glass transition temperatures peaks are plotted as a function of DBP
concentration in Fig 5.1. Polymer samples were molded into dog-bone shaped samples at
approximately 30 °C above Tg for each batch.
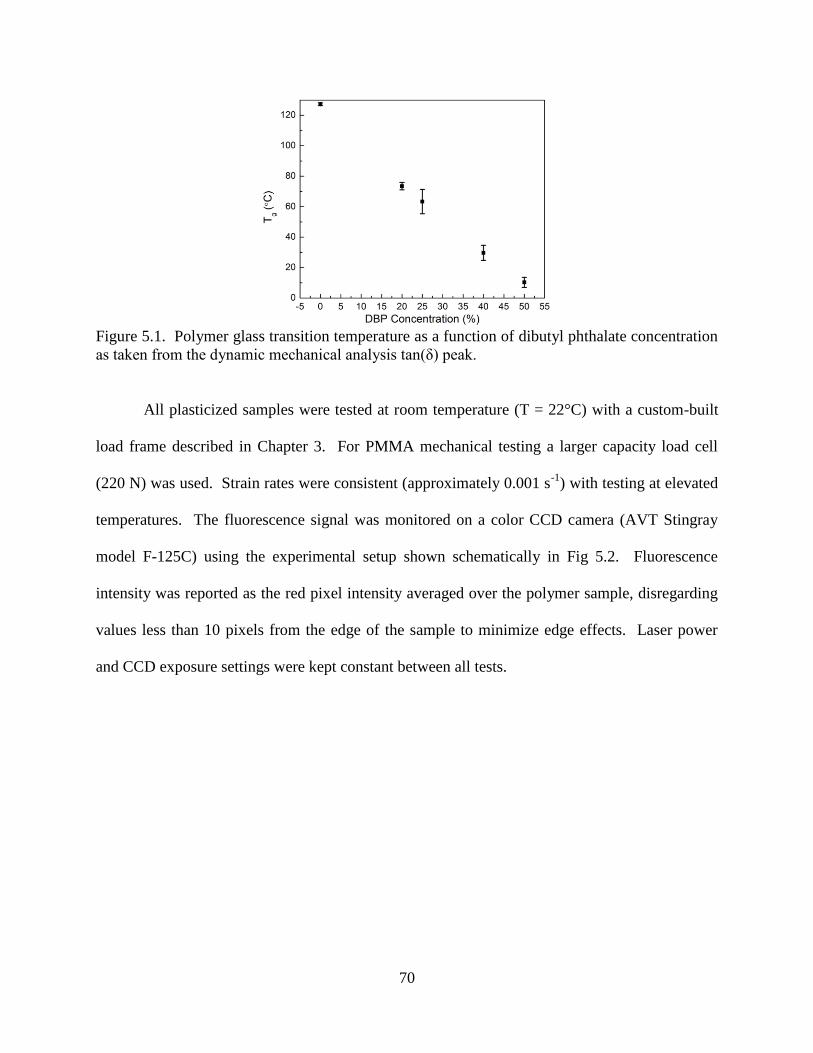
70
Figure 5.1. Polymer glass transition temperature as a function of dibutyl phthalate concentration
as taken from the dynamic mechanical analysis tan(δ) peak.
All plasticized samples were tested at room temperature (T = 22°C) with a custom-built
load frame described in Chapter 3. For PMMA mechanical testing a larger capacity load cell
(220 N) was used. Strain rates were consistent (approximately 0.001 s-1
) with testing at elevated
temperatures. The fluorescence signal was monitored on a color CCD camera (AVT Stingray
model F-125C) using the experimental setup shown schematically in Fig 5.2. Fluorescence
intensity was reported as the red pixel intensity averaged over the polymer sample, disregarding
values less than 10 pixels from the edge of the sample to minimize edge effects. Laser power
and CCD exposure settings were kept constant between all tests.

71
Figure 5.2. Experimental set-up for in situ fluorescence imaging of solvent-plasticized
specimens.
5.3 Results and Discussion
5.3.1 Effect of Temperature on Mechanical Activation
The stress-strain response of the active PMMA is shown in Fig 5.3a over a range of test
temperatures from 22°C to 120 °C. Specimens tested in tension at 22 °C and 80 °C failed in a
brittle manner (ult < 10%). No color change was detected in these specimens prior to failure,
and fluorescence imaging indicated no measurable activation at the fracture surface. At higher
temperatures of 90°C and 105°C, the yield stress dropped significantly and substantial plastic
flow was observed. Evidence of the mechanochemical reaction was visible as a purple color in
the sample at ca. 10% applied strain in samples tested at 90 °C. Color change appeared shortly
after yielding of the polymer, and was localized in the gauge section, coinciding with necking
and drawing. As strain increased, the color became more vibrant in the drawn section of
specimens tested at 90 °C and 105 °C. Qualitatively, samples tested at 90 °C exhibited more

72
intense color change than at 105 °C, presumably due to higher stress in the sample during the
drawing process. At a temperature of 120 °C, just below the glass transition, deformation was
dominated by viscous flow. Samples deformed over 100% strain at low stress and no color
change was observed. Representative images of samples tested at various temperatures are
included in Fig 5.3b.
Control samples were mechanically tested at 90 °C. Both plain PMMA (without SP
incorporated) and difunctional control SP-linked PMMA behaved mechanically similar to active
polymer, with no significant variation in yield stress, yield strain, or strain at failure.
Difunctional control samples tested at 90 °C did not exhibit a color change, indicating that the
color change in active samples was due to mechanically induced opening of SP, and not thermal
activation.

73
Figure 5.3. Effect of temperature on mechanochemical behavior of active SP-linked PMMA.
a) Mechanical response at various testing temperatures. b) Optical images of samples after
testing. Scale bar = 6 mm.
5.3.2 SP Activation in MeOH Plasticized PMMA
As molded PMMA specimens were plasticized with methanol by submerging samples in
the solvent to increase polymer mobility at RT (22 °C). Samples with 15-20% MeOH uptake by
mass exhibited similar mechanical behavior at RT compared to unplasticized samples at 90 °C.
Samples with < 15 wt% MeOH uptake exhibited brittle failure and no activation at RT. Samples
with > 20 wt% MeOH uptake showed significant nonuniformity and inconsistent mechanical
behavior. RT testing of plasticized PMMA allowed for in situ fluorescence imaging; a capability
which was prevented by the thermal control chamber used for high temperature testing of
unplasticized polymer.
Fluorometry in the visible range (see Chapter 2 for spectra) showed little fluorescence
signal for untested active samples, indicating that the mechanophore is predominantly in the SP
form. However, mechanically activated samples exhibited strong fluorescence, with broad
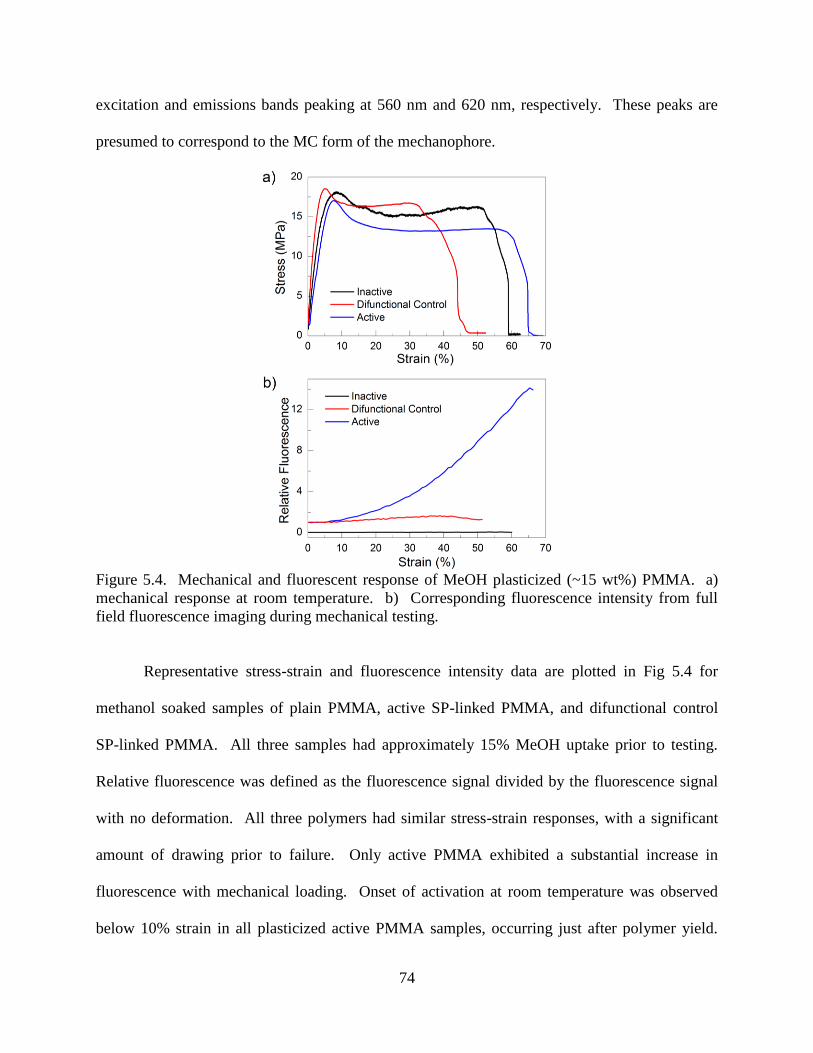
74
excitation and emissions bands peaking at 560 nm and 620 nm, respectively. These peaks are
presumed to correspond to the MC form of the mechanophore.
Figure 5.4. Mechanical and fluorescent response of MeOH plasticized (~15 wt%) PMMA. a)
mechanical response at room temperature. b) Corresponding fluorescence intensity from full
field fluorescence imaging during mechanical testing.
Representative stress-strain and fluorescence intensity data are plotted in Fig 5.4 for
methanol soaked samples of plain PMMA, active SP-linked PMMA, and difunctional control
SP-linked PMMA. All three samples had approximately 15% MeOH uptake prior to testing.
Relative fluorescence was defined as the fluorescence signal divided by the fluorescence signal
with no deformation. All three polymers had similar stress-strain responses, with a significant
amount of drawing prior to failure. Only active PMMA exhibited a substantial increase in
fluorescence with mechanical loading. Onset of activation at room temperature was observed
below 10% strain in all plasticized active PMMA samples, occurring just after polymer yield.

75
The fluorescence intensity continued to increase during drawing until failure. Plain PMMA
showed no measurable fluorescence intensity before or after loading, confirming that any
fluorescence is due to the incorporation of SP. The fluorescence signal present in the active and
difunctional control PMMA prior to testing was likely due trace remaining amounts of MC. A
slight change in the difunctional control fluorescence intensity was observed during loading, but
was considered negligible when compared with the active SP-linked polymer.
5.3.3 SP Activation in DBP Plasticized PMMA
Although plasticizing PMMA with MeOH effectively promoted ductile behavior of the
polymer, MeOH solvent wasn’t stable in the polymer and evaporated out of the sample in a time
scale of hours in air at room temperature. DBP has a high boiling point of approximately
340 °C, thus very low vapor pressure at room temperature , and provided a stable plasticizing
solvent. The polymer glass transition temperature of DBP plasticized PMMA could be measured
by dynamic mechanical analysis (Fig 5.1). Tg measurements of PMMA with DBP plasticizer
were consistent over a period of weeks.
Active SP-linked PMMA samples with varying DBP concentration were tested in tension
and the load and fluorescence were monitored in the same manner as the MeOH-plasticized
polymer. The true stress and fluorescence, normalized relative to the initial sample fluorescence,
were plotted as a function of strain. Representative curves at varied polymer Tg are included in
Fig 5.5a-d. At relatively high concentration of DBP corresponding to Tg near room temperature
(Fig 5.5a), the stress in the polymer sample was low and little or no activation was observable in
the fluorescence signal. For higher polymer Tg, the stresses were higher, and activation was
evident via marked increase in the fluorescence signal (Figs 5.5b-c). Room temperature testing

76
of DBP-plasticized PMMA with Tg above 80 °C (Fig 5.5d) resulted in brittle failure at high
stresses and no detectable activation.
Figure 5.5. Mechanical and raw fluorescence (normalized by the un-deformed fluorescence
signal) data for DBP-plasticized PMMA with Tg of a) 24 °C, b) 54 °C, c) 72 °C, and d) 80 °C.
Strain to activation was defined as when the slope of the fluorescence signal as a function
of strain begins to increase, as described in Chapter 3. Over the range of mechanical behavior at
which activation was detectable (Tg ≈ 30 °C to Tg ≈ 80°C), the strain to activation varied with
polymer Tg. Strains to activation are plotted as a function of the glass transition temperature in
Fig 5.6. With increasing Tg, polymer stiffness and macroscopic stress increased, and activation
occurred at lower strains. The minimum strain to activation was approximately 5% at a Tg of
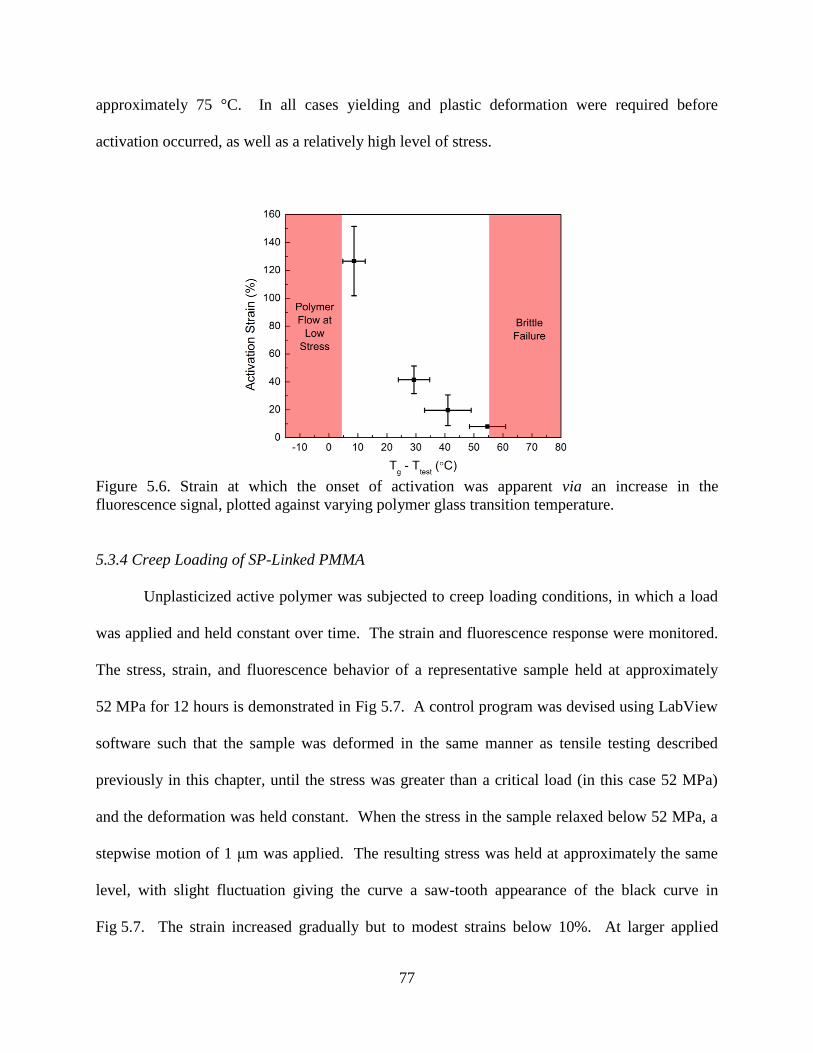
77
approximately 75 °C. In all cases yielding and plastic deformation were required before
activation occurred, as well as a relatively high level of stress.
Figure 5.6. Strain at which the onset of activation was apparent via an increase in the
fluorescence signal, plotted against varying polymer glass transition temperature.
5.3.4 Creep Loading of SP-Linked PMMA
Unplasticized active polymer was subjected to creep loading conditions, in which a load
was applied and held constant over time. The strain and fluorescence response were monitored.
The stress, strain, and fluorescence behavior of a representative sample held at approximately
52 MPa for 12 hours is demonstrated in Fig 5.7. A control program was devised using LabView
software such that the sample was deformed in the same manner as tensile testing described
previously in this chapter, until the stress was greater than a critical load (in this case 52 MPa)
and the deformation was held constant. When the stress in the sample relaxed below 52 MPa, a
stepwise motion of 1 μm was applied. The resulting stress was held at approximately the same
level, with slight fluctuation giving the curve a saw-tooth appearance of the black curve in
Fig 5.7. The strain increased gradually but to modest strains below 10%. At larger applied

78
loads, the sample failed at ca. 6% strain. The fluorescence signal was virtually constant as a
function of time. A slight initial increase was present in the fluorescence signal, but a similar
increase could be seen in the difunctional control SP-linked PMMA. Therefore no considerable
activation was detectable over long times with a relatively large loads applied by a creep loading
condition.
Figure 5.7. Creep behavior of active SP-Linked PMMA loaded to a stress of approximately
52 MPa.
5.4 Conclusions
SP can undergo a force driven reaction to the MC species when linked into a brittle
polymer backbone, such as PMMA. Both solvent-plasticized and temperature controlled PMMA
tensile testing revealed a specific range of polymer Tg and mechanical properties which promote
mechanochemical activation. A similar critical range of temperatures for mechanophore
activation may apply to emerging mechanophore systems in the solid state.
79
Activation of SP was achievable under conditions in which PMMA has sufficient
mobility to yield and draw at moderate stress. No activation occurred if the polymer was too
viscous and failed in a brittle manner, i.e. without a large degree of polymer flow. Relatively
high stress at low strain under creep loading conditions was not sufficient to drive SP activation
on a time scale greater than ten hours, further implicating the need for plastic deformation for
mechanochemical conversion. For polymer Tg near the tensile testing temperature, the stresses
were low and no significant activation was detectable, indicating a possible threshold of stress
for SP activation in PMMA.
Plasticizing with 15-20 wt% MeOH allows drawing and activation at RT. The onset of
activation was observed at strains below 10% in linear SP-linked PMMA. Dibutyl phthalate
acted as a stable plasticizing agent, allowing characterization of polymer Tg and control of
mechanical properties. By varying the concentration of DBP, the activation behavior of the
polymer could be affected. The strain to activation in DBP plasticized polymer was tunable
based on the polymer Tg, which could be controlled by the concentration of plasticizing agent.
The onset of detectable activation coincided with stresses in the polymer reaching ca. 10 MPa,
which agrees closely with the onset of an effect on reaction kinetics in the elastomeric polymer
system described in section 3.3.6.
In comparison with other linear, moldable polymers, the onset of activation for the linear
PMMA was achieved at orders of magnitude lower strain levels. A mechanochemical system
acting at such low strains could be applied to structural applications as a deformation sensor. We
show a range of activation onsets from strains of ca. 5% to greater than 100%, corresponding to
varied Tg, indicating versatility of this system, which could be applied to a variety of different
structural load bearing applications.

80
CHAPTER 6
FLUORESCENCE POLARIZATION MEASUREMENTS OF
MECHANOPHORE ORIENTATION§
6.1 Introduction
The birefringence measurements presented in Chapter 3 quantify the average orientation
of polymer chains under tensile deformation. A second optical technique, fluorescence
polarization measurement, can be applied to quantify the orientation of the mechanophore
subunits within the polymer backbone. As described in the Chapter 1, a fluorescent molecule
emits photons polarized in the direction of a transition dipole. The transition dipole, ( r ), of
merocyanine (MC) fluorescence has directionality roughly across the long axis of the molecule
(see Fig 1.2) [53, 54]. The spiropyran (SP) form has virtually no fluorescence signal and does not
contribute to this measurement. MC fluorescence polarization can be analyzed by adding a
linear polarizer to the mechanical/optical set-up described in Chapter 3, between the sample and
the CCD detector. The modified set-up for measuring MC orientation is shown in Fig 6.1.
Degree of orientation in general terms is evaluated by an order parameter, S, based on the
second order Legendre polynomial, P2 [47]:
2
2cos ( 1
2P S
6.1,
where β is the angle between a laboratory frame (the tensile direction) and a component director
(the dominant MC transition dipole). Order parameter values vary between 0 (random
distribution) and 1 (perfectly aligned) in this study. An order parameter can be derived from
§ The results presented in this chapter are published in: Beiermann, B.A., et al., Role of Mechanophore
Orientation in Mechanochemical Reactions. ACS Macro Letters, 2011.

81
Eq. 6.1 based on the measured fluorescence intensities with the analyzing polarizer oriented
parallel and perpendicular to the tensile direction [52, 86, 87]:
( )
( 2 )
I IS
I I
6.2
where 𝐼 and 𝐼 denote the total fluorescence intensity with the polarizer parallel and
perpendicular to the tensile direction, respectively. Eq. 6.2 assumes that the mechanophore is
rotationally fixed during measurement. MC orientation has been correlated with mechanophore
activation to provide information on the nature of orientation and force transfer at the
mechanophore level.
Figure 6.1. Experimental set-up for analysis of polarized fluorescence emission.
6.2 Experimental Methods
6.2.1 SP-Linked Polymer Samples
SP was linked into linear poly(methyl acrylate) (PMA) and poly(methyl methacrlyate)
(PMMA) backbones. Relevant details for each polymer type are listed in Table 6.1. PMMA was
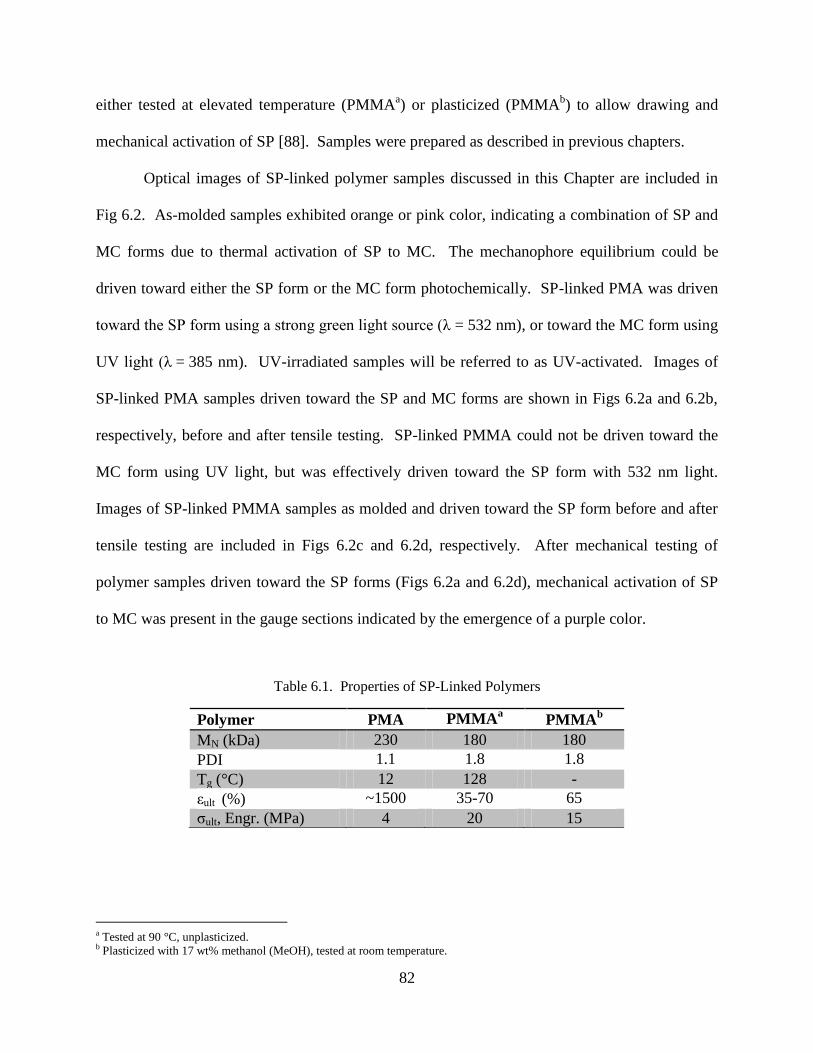
82
either tested at elevated temperature (PMMAa) or plasticized (PMMA
b) to allow drawing and
mechanical activation of SP [88]. Samples were prepared as described in previous chapters.
Optical images of SP-linked polymer samples discussed in this Chapter are included in
Fig 6.2. As-molded samples exhibited orange or pink color, indicating a combination of SP and
MC forms due to thermal activation of SP to MC. The mechanophore equilibrium could be
driven toward either the SP form or the MC form photochemically. SP-linked PMA was driven
toward the SP form using a strong green light source (λ = 532 nm), or toward the MC form using
UV light (λ = 385 nm). UV-irradiated samples will be referred to as UV-activated. Images of
SP-linked PMA samples driven toward the SP and MC forms are shown in Figs 6.2a and 6.2b,
respectively, before and after tensile testing. SP-linked PMMA could not be driven toward the
MC form using UV light, but was effectively driven toward the SP form with 532 nm light.
Images of SP-linked PMMA samples as molded and driven toward the SP form before and after
tensile testing are included in Figs 6.2c and 6.2d, respectively. After mechanical testing of
polymer samples driven toward the SP forms (Figs 6.2a and 6.2d), mechanical activation of SP
to MC was present in the gauge sections indicated by the emergence of a purple color.
Table 6.1. Properties of SP-Linked Polymers
Polymer PMA PMMAa PMMA
b
MN (kDa) 230 180 180
PDI 1.1 1.8 1.8
Tg (°C) 12 128 -
εult (%) ~1500 35-70 65
σult, Engr. (MPa) 4 20 15
a Tested at 90 °C, unplasticized. b Plasticized with 17 wt% methanol (MeOH), tested at room temperature.
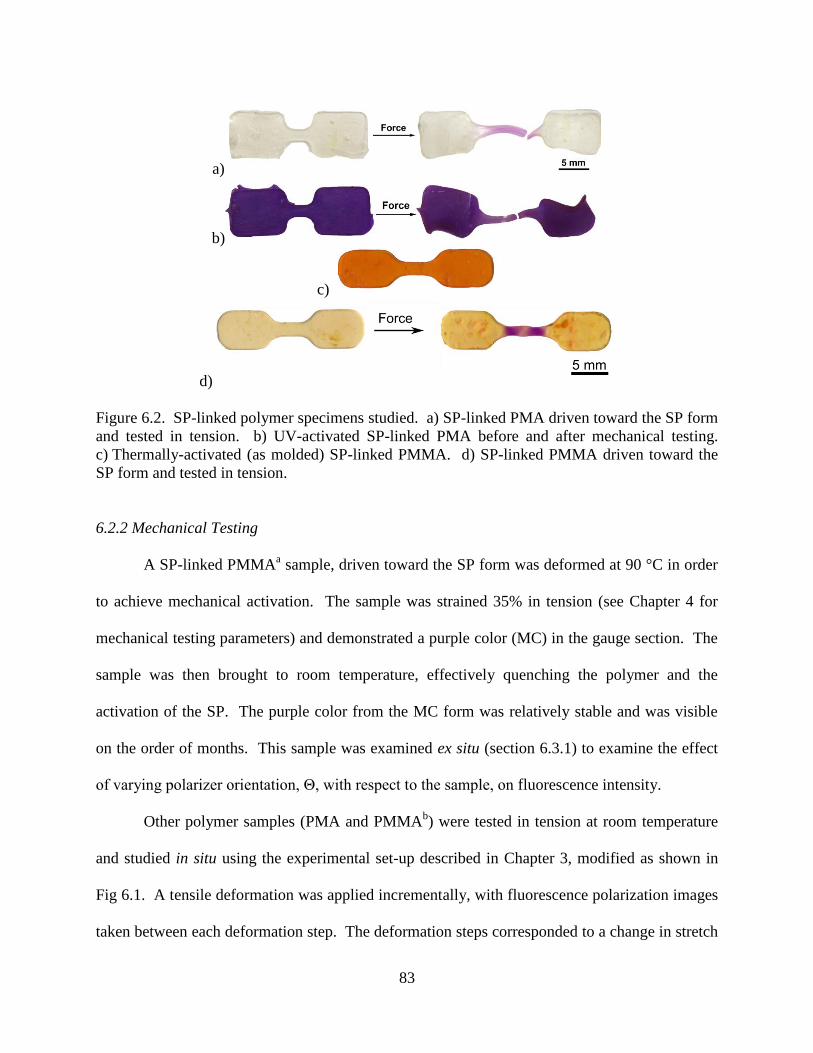
83
a)
b)
c)
d)
Figure 6.2. SP-linked polymer specimens studied. a) SP-linked PMA driven toward the SP form
and tested in tension. b) UV-activated SP-linked PMA before and after mechanical testing.
c) Thermally-activated (as molded) SP-linked PMMA. d) SP-linked PMMA driven toward the
SP form and tested in tension.
6.2.2 Mechanical Testing
A SP-linked PMMAa sample, driven toward the SP form was deformed at 90 °C in order
to achieve mechanical activation. The sample was strained 35% in tension (see Chapter 4 for
mechanical testing parameters) and demonstrated a purple color (MC) in the gauge section. The
sample was then brought to room temperature, effectively quenching the polymer and the
activation of the SP. The purple color from the MC form was relatively stable and was visible
on the order of months. This sample was examined ex situ (section 6.3.1) to examine the effect
of varying polarizer orientation, Θ, with respect to the sample, on fluorescence intensity.
Other polymer samples (PMA and PMMAb) were tested in tension at room temperature
and studied in situ using the experimental set-up described in Chapter 3, modified as shown in
Fig 6.1. A tensile deformation was applied incrementally, with fluorescence polarization images
taken between each deformation step. The deformation steps corresponded to a change in stretch
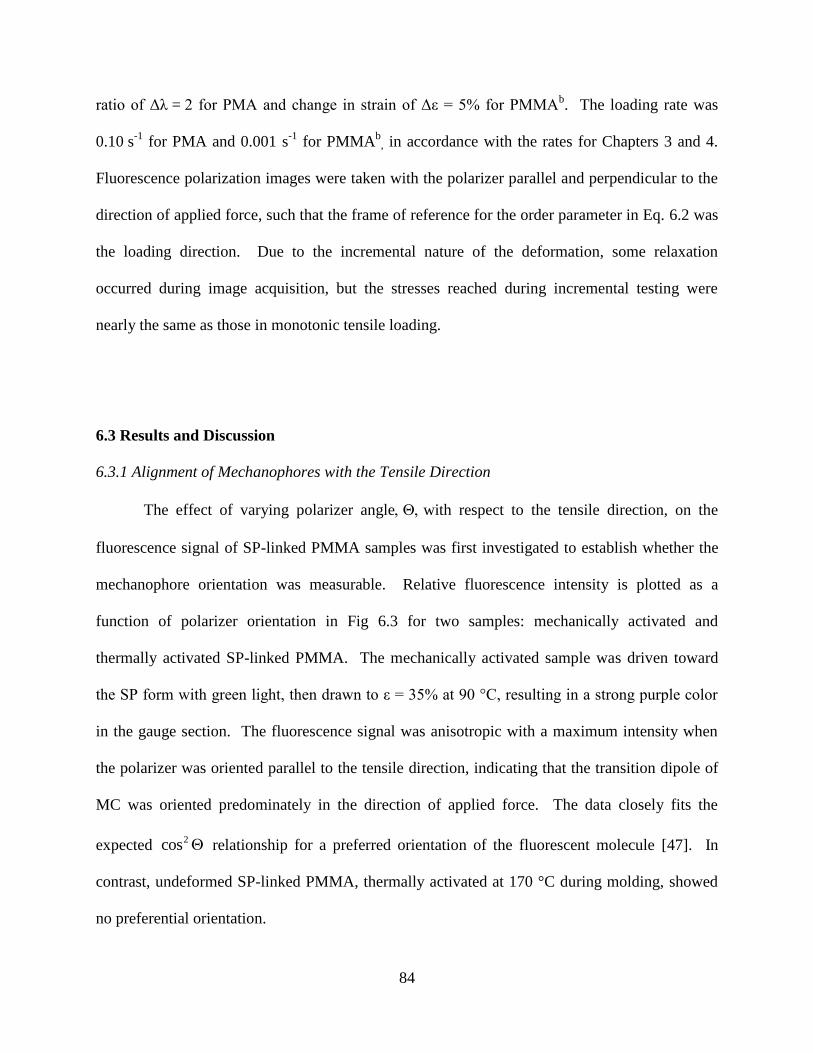
84
ratio of Δλ = 2 for PMA and change in strain of Δε = 5% for PMMAb. The loading rate was
0.10 s-1
for PMA and 0.001 s-1
for PMMAb
, in accordance with the rates for Chapters 3 and 4.
Fluorescence polarization images were taken with the polarizer parallel and perpendicular to the
direction of applied force, such that the frame of reference for the order parameter in Eq. 6.2 was
the loading direction. Due to the incremental nature of the deformation, some relaxation
occurred during image acquisition, but the stresses reached during incremental testing were
nearly the same as those in monotonic tensile loading.
6.3 Results and Discussion
6.3.1 Alignment of Mechanophores with the Tensile Direction
The effect of varying polarizer anglewith respect to the tensile direction, on the
fluorescence signal of SP-linked PMMA samples was first investigated to establish whether the
mechanophore orientation was measurable. Relative fluorescence intensity is plotted as a
function of polarizer orientation in Fig 6.3 for two samples: mechanically activated and
thermally activated SP-linked PMMA. The mechanically activated sample was driven toward
the SP form with green light, then drawn to ε = 35% at 90 °C, resulting in a strong purple color
in the gauge section. The fluorescence signal was anisotropic with a maximum intensity when
the polarizer was oriented parallel to the tensile direction, indicating that the transition dipole of
MC was oriented predominately in the direction of applied force. The data closely fits the
expected 2cos relationship for a preferred orientation of the fluorescent molecule [47]. In
contrast, undeformed SP-linked PMMA, thermally activated at 170 °C during molding, showed
no preferential orientation.
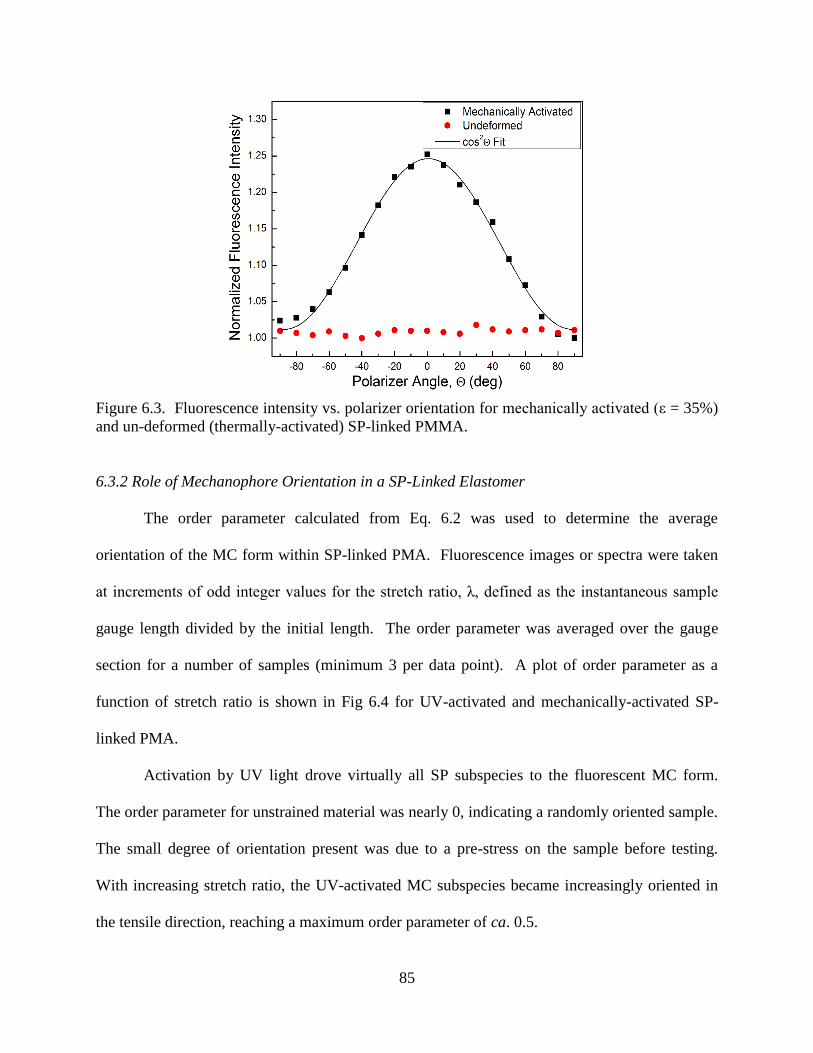
85
Figure 6.3. Fluorescence intensity vs. polarizer orientation for mechanically activated (ε = 35%)
and un-deformed (thermally-activated) SP-linked PMMA.
6.3.2 Role of Mechanophore Orientation in a SP-Linked Elastomer
The order parameter calculated from Eq. 6.2 was used to determine the average
orientation of the MC form within SP-linked PMA. Fluorescence images or spectra were taken
at increments of odd integer values for the stretch ratio, λ, defined as the instantaneous sample
gauge length divided by the initial length. The order parameter was averaged over the gauge
section for a number of samples (minimum 3 per data point). A plot of order parameter as a
function of stretch ratio is shown in Fig 6.4 for UV-activated and mechanically-activated SP-
linked PMA.
Activation by UV light drove virtually all SP subspecies to the fluorescent MC form.
The order parameter for unstrained material was nearly 0, indicating a randomly oriented sample.
The small degree of orientation present was due to a pre-stress on the sample before testing.
With increasing stretch ratio, the UV-activated MC subspecies became increasingly oriented in
the tensile direction, reaching a maximum order parameter of ca. 0.5.

86
Prior to testing, mechanically activated samples were irradiated with visible light to drive
any MC form to the closed SP form. Because the SP form has virtually no fluorescence signal,
the order parameter remained undefined until the samples began to exhibit a detectable
fluorescence (i.e. activation). The onset of mechanical activation occurred well before polymer
failure. The order parameter for mechanically activated samples was significantly higher than in
the UV-activated case, indicating that SP subspecies which were more aligned with the tensile
force activated preferentially.
Figure 6.4. Average MC order parameter as a function of stretch ratio, λ, for UV activated and
mechanically activated SP-linked PMA. Error bars represent the standard deviation between 3
samples of each type.
6.3.3 Orientation in a Mechanically-Activated Glassy Polymer
While SP-linked PMA exhibited a relatively consistent degree of fluorescence anisotropy
throughout the gauge section, activation and degree of orientation were highly localized in SP-
linked PMMA. SP-linked PMMA was plasticized with MeOH (17 wt% uptake). A region of

87
interest (ROI) was monitored for MeOH-plasticized SP-linked PMMA, which was driven to the
SP form using visible light prior to testing. The sample was tested in tension with increments of
5% strain between fluorescence measurements (Table 6.2). After the polymer yielded and began
to draw, the fluorescence increased with increasing strain. When the fluorescence signal was
sufficient to define an order parameter, the order parameter initially demonstrated relatively high
values (0.4-0.5), again indicating that the mechanophores oriented in the direction of force are
preferentially reacting. Both fluorescence and order parameter were spatially heterogeneous and
localized across the ROI. After failure, the order parameter dropped to levels below 0.1 near the
failure surface. The same trend was evident in unplasticized SP-linked PMMA samples tested at
elevated temperature (90 °C), and examined ex situ. The authors hypothesize that this decrease
in order parameter at failure, particularly near the failure surface, indicates significant polymer
recoil and relaxation.
6.4 Summary and Conclusions
Fluorescence anisotropy of MC enabled measurement of the orientation of subspecies
covalently bonded into bulk polymers under tensile load. In situ testing of mechanophore-linked
PMA revealed increasing overall mechanophore orientation with increasing strain.
Mechanophores aligned along the tensile direction were shown to be preferentially activated by
force. We provide evidence suggesting substantial relaxation of polymer chains at failure in SP-
linked PMMA. Results indicate that MC fluorescence polarization may provide an effective
molecular probe to study the full-field orientation of polymer chains during deformation and
failure.

88
Table 6.2. Fluorescence images and calculated order parameter in the gauge section of SP-Linked
PMMA under tensile deformation.a
a Fluorescence images taken with polarizer oriented parallel to tensile force. Approximate sample edges have been
artificially outlined in white.

89
CHAPTER 7
MECHANOPHORE ACTIVATION IN POLYSTYRENE THIN FILMS
7.1 Introduction
Mechanophore activation was investigated for thin films on a rigid substrate using a high
strain rate loading criteria. Thin films exhibit different mechanical behavior when compared to
bulk polymers. Glassy polymers in thin films such as polystyrene can deform plastically, while
large-scale plastic deformation in bulk glassy polymers is typically preceded by brittle failure
[89].
Mechanochemically active polymer thin film behavior was probed using a laser-induced
stress wave technique first introduced by Stephens and Vossen [90], and further developed by
Gupta et al. [91] and Wang et al.[92]. In this method a high energy laser pulse is incident on an
absorbing surface, which converts laser energy into a high amplitude compressive stress pulse,
and is ultimately transferred to a tensile stress pulse on a film at a free surface (see Fig 7.1a).
Strain rates measured by this test method are typically on the order of 107-10
8 s
-1 [91, 93-95].
This test method provides a means to probe mechanophore behavior at large applied stresses
over very high strain rates, and can be applied toward ballistic or shockwave damage-responsive
materials.

90
Figure 7.1. High strain rate shockwave loading of mechanophore-linked polymer films.
a) Experimental set-up for laser spallation technique. b) Schematic of samples tested with layer
thicknesses labeled.
7.2 Experimental Methods
7.2.1 SP-Linked Polystyrene
Active SP-linked polystyrene (PS) was synthesized by an ATRP polymerization as
described in Chapter 2. Difunctional control SP-linked PS and plain PS were synthesized by the
same method, and all molecular weights were approximately 200 kDa. After synthesis, the
polymer was dried at 60 °C for 24 hours, then redissolved into tetrahydrofuran (THF) for thin
film preparation by spin coating. Polymer concentration in THF was 50 mg/mL for all samples.
7.2.2 Nd:YAG Shockwave Sample Preparation
Substrates for Nd:YAG laser-induced shockwave loading consisted of a fused silica
wafer (1” diameter, 1.5 mm thick) with an aluminum layer (400 nm thick) deposited on one side
via electron beam deposition, and a 1 μm sodium silicate (water glass, spin coated at 3000 rpm)
layer deposited by spin coating from solution on top of the aluminum. Finally a test film was
formed on the opposite side of the substrate. Mechanochemically active polymer films were
deposited by spin coating the polymer/THF solution with a 5 s ramp to 1500 rpm for 60 s. After

91
film deposition the sample was held under vacuum for 30 minutes to remove residual solvent.
Polymer film thickness was on average 1.1 μm thick as determined by stylus profilometry.
Additional calibration samples were produced with aluminum (200 nm thick) instead of polymer
as the test film. Sample geometry is diagrammed in Fig 7.1b.
7.2.3 Mechanical Loading and Analysis
A neodymium doped yttrium aluminum garnet (Nd:YAG) laser pulse (New Wave
Tempest) was incident on substrates as described in the previous section. The substrate
converted the laser pulse to a mechanical pulse in the fused silica and ultimately in the sample
film. Fig 7.1a schematically shows the laser incident on the water glass/aluminum side of the
substrate, wherein aluminum acts as the energy absorbing layer to convert the laser energy to a
mechanical pulse, and the water glass served as a confining layer to prevent rapid expansion of
the aluminum layer. The relatively thick fused silica layer (1.5 mm) separated the test film from
thermal effects of the laser impact.
Interferometric analysis was used to measure the displacement and calculate the stress
state in the substrate and film. Because polymer films of interest were not highly reflective (i.e.
not suited for interferometry), stress profiles were measured using reflective calibration samples.
A thin aluminum layer (200 nm) served as the calibration test film. Displacement of the test film
was monitored using the interferometric fringe pattern of a 532 nm laser incident on the surface
using the following relationship [92, 93]:
0 ( )( )
2
n tu t
7.1
92
where u is the displacement, λ0 is the wavelength of the laser used for interferometry
(λ0 = 532 nm), and n is the number of fringes. Figs 7.2a and 7.2b demonstrate representative
fringe patterns and the resultant displacements of calibration samples at three laser fluences.
The stresses in the substrate, σsub, and applied stress at the interface between the substrate
and a thin film, σint, were calculated based on the displacement, u, of the free surface [92]:
1( )
2sub sub
uc
t
7.2a
2
int2
( ) film
uh
t
7.2b
where ρ is the density of the substrate or film, c is the wave speed for acoustic propagation in
fused silica, and h is the thickness of the film.
Stresses in the substrate and at the substrate-film interface were measured at different
levels of laser fluence (energy per area), varied by incrementally adjusting the energy of the
Nd:YAG laser while keeping the spot size constant. Typical stress profiles of calibration
samples as a function of time at three laser fluences are included in Fig 7.2c-d. The duration of
each pulse was on the order of 10 ns. The difference in thickness and stiffness between the
aluminum calibration films and the mechanochemically active polymer films was accounted for
in the calculation of stress in the polymer films [92]. Aluminum calibration films and polymer
films were tested over the same range of laser fluences at a number of sites along the same film
and the film was rastered between laser pulses and one measurement was taken at each laser
fluence studied. Separation between impact sites along the sample was greater than 3x the radius
of the laser beam.

93
Figure 7.2. Experimental data and stress analysis as a function of time for calibration samples
tested at laser fluences of 20.2 mJ/mm2, 34.8 mJ/mm
2, and 53.1 mJ/mm
2. a) Interferometric
fringe pattern for calibration samples. b) Displacement as a function of time at the calibration
test film’s free surface. c) Stress in the fused silica substrate. d) Tensile stress applied at the
interface between the substrate and the aluminum calibration test film.
Tested polymer films were imaged ex situ at various stress levels and analyzed optically
and under fluorescence microscopy with 532 nm excitation light and collection at λ > 575 nm.
The field of view, incident light intensity, and fluorescence exposure were kept constant for all
imaging. Average fluorescence intensity of each data point – a measure of SP activation [40,
88] - was quantified by the average red pixel intensity over the entire image field of view. The
field of view was of the same size for each impact site and fluorescence measurement.

94
7.3 Results and Discussion
Bulk SP-linked PS was molded into dog-bone specimens (ca. 0.6 mm thick) and tested in
tension. The samples deformed elastically at room temperature and failed at stress of ca.
60 MPa. Failure proceeded in a brittle manner, similar to room temperature failure of PMMA
described in Chapter 4. Brittle failure does not typically promote conversion of SP to its
activated MC form [15, 40, 88]. Previous success activating mechanochemical species in glassy
polymers required plasticizing the polymer or changing the test temperature to allow plastic
deformation [88]. This study instead utilized thin films of mechanochemically active polymer
(as opposed to bulk material) and a novel shockwave loading method as a means for inducing
large stresses and deformation in a glassy polymer system.
7.3.1 Shockwave Loading of Thin Films
Calibration samples with reflective aluminum as the test film were used to measure the
stress of the shockwave through the substrate, following from Wang et al. [93]. The stress pulse
induced by the Nd:YAG laser through the substrate (Fig 7.2c) was compressive, lasting
approximately 10-20 ns. The intensity and duration of the laser pulse increased with increasing
input laser power. Substrate stresses in this work reached values of nearly 1 GPa. The stress
applied at the substrate-film interface (Fig 7.2d) was calculated based on the substrate stress and
material properties as described in by Eq. 7.2a-b. Stresses on the films were greater than 200
MPa using this technique, applied at strain rates on the order of 108
s-1
.
Thin films of polystyrene were subjected to mechanical loading in the same manner as
the calibration samples. Calculated stresses were adjusted to account for differing material

95
properties between aluminum and polymer test films. Three sample types were investigated:
plain polystyrene without SP linked into the backbone, difunctional SP-linked control, and
mechanochemically active SP-linked PS. All sample films were spin-coated under the same
conditions, and average film thicknesses were 1.1 μm, 1.0 μm and 1.1 μm, respectively.
Mechanical behavior of the three materials was virtually identical.
Representative optical, profilometry and fluorescence images for films loaded at
interfacial stresses of 166 MPa, 186 MPa, and 216 MPa are shown in Fig 7.3. In the optical
images, dark coloring of the background occurred where the laser was incident on the aluminum
film. Light areas and coloration indicated polymer film delamination from the surface and
deformation out of the plane of the image. The zone of deformation is roughly circular, in
accordance with the laser beam shape.
At loading of approximately 160 MPa, the polymer film began to delaminate and deform
off of the silica substrate (Fig 7.3a). Figures 7.3b-c show the increasing delamination zone with
increasing interfacial stress (186 MPa and 216 MPa, respectively). The color present in the
optical images owes to elevation variation of the film off of the substrate and resultant
interference of visible light.
The film elevation was characterized by optical profilometry (Figs 7.3d-f) after loading at
varied stresses. Elevation changes in the film (10-100 nm) were measured at an interfacial stress
above approximately 160 MPa, indicating delamination of the film off of the substrate. Below
this stress level (σint < 160 MPa) the film height was effectively uniform. At higher stresses,
fold-like features with elevation on the order of microns were present, as well as film cracking
due to bulging strain of the film.

96
Figure 7.3. Images of active SP-linked PS films under Nd:YAG-induced shockwave loading at
interfacial tensile stress levels of 166 MPa, 186 MPa, and 216 MPa, from left to right.
a-c) Optical images of polymer films. d-f) Corresponding profilometry. g-i) Fluorescence
images indicating SP activation.
Activation of SP was indicated by fluorescence signal from the MC form. Fluorescence
signal was not detectable in the polymer films prior to testing, implying that the mechanophore
was predominantly in the SP form. SP activation was evident at applied stress greater than 180
MPa (Figs 7.3h-i) in which film deformation and delamination was observed. Film delamination
without detectable SP activation occurred at a range of interfacial stresses between
σint ≈ 160 MPa and σint ≈ 175 MPa. The delamination area, maximum film elevation and amount
of activation increased with increasing stress. SP activation was quantified by analyzing the
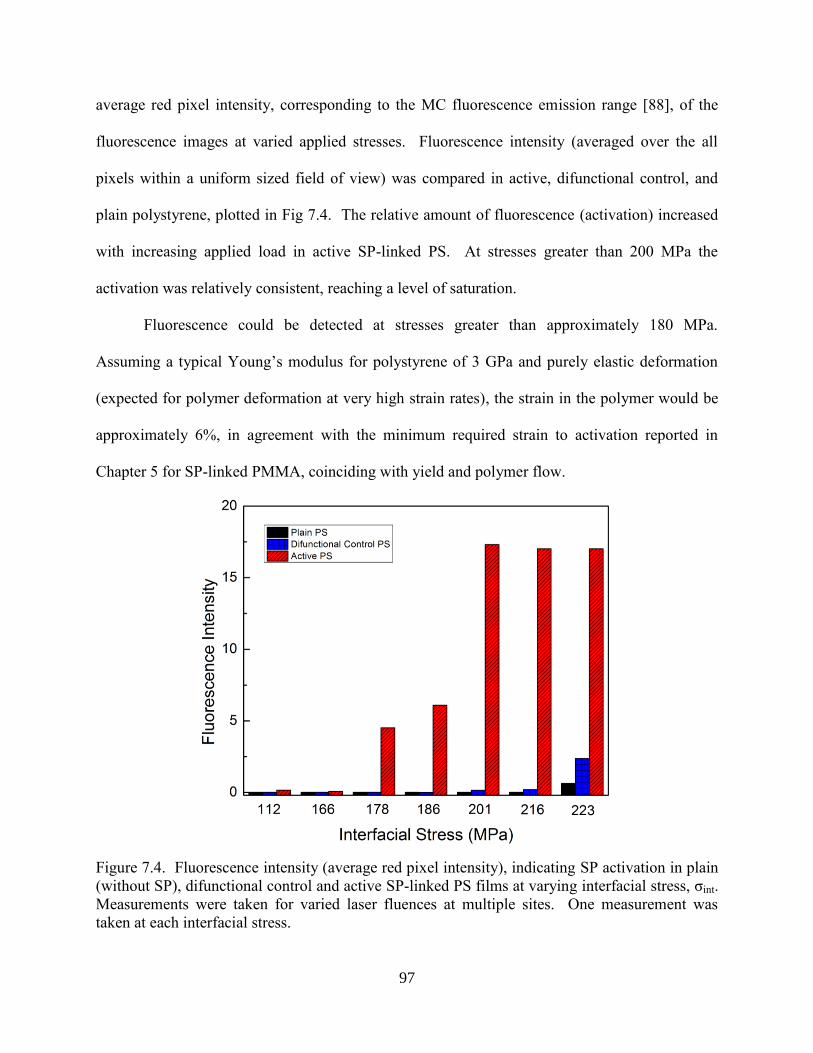
97
average red pixel intensity, corresponding to the MC fluorescence emission range [88], of the
fluorescence images at varied applied stresses. Fluorescence intensity (averaged over the all
pixels within a uniform sized field of view) was compared in active, difunctional control, and
plain polystyrene, plotted in Fig 7.4. The relative amount of fluorescence (activation) increased
with increasing applied load in active SP-linked PS. At stresses greater than 200 MPa the
activation was relatively consistent, reaching a level of saturation.
Fluorescence could be detected at stresses greater than approximately 180 MPa.
Assuming a typical Young’s modulus for polystyrene of 3 GPa and purely elastic deformation
(expected for polymer deformation at very high strain rates), the strain in the polymer would be
approximately 6%, in agreement with the minimum required strain to activation reported in
Chapter 5 for SP-linked PMMA, coinciding with yield and polymer flow.
Figure 7.4. Fluorescence intensity (average red pixel intensity), indicating SP activation in plain
(without SP), difunctional control and active SP-linked PS films at varying interfacial stress, σint.
Measurements were taken for varied laser fluences at multiple sites. One measurement was
taken at each interfacial stress.

98
Plain PS, without SP incorporated into the polymer backbone, demonstrated no
detectable fluorescence. The fluorescence signal of difunctional control SP-linked PS was also
negligible when compared with the active polymer. Films of active SP-linked poly(methyl
acrylate), an elastomeric polymer, were tested at the same laser fluences, and showed no
detectable fluorescence signal ex situ, indicating that a glassy polymer is more effective than an
elastomer at converting SP to MC under this loading condition.
7.4 Conclusions
Mechanochemical activation has been demonstrated in SP-linked polystyrene thin films.
SP activation was detectable via a fluorescence signal in the polymer film. Mechanochemically
active polymer films have potential as coatings to structural, load bearing applications, in which
the film can indicate a level of deformation or yielding of the structure.
The mechanochemical activation presented in this work elucidates a fundamental
difference in mechanical behavior of polymer thin films vs. bulk material. Namely the reduced
bending moment and lower flaw sensitivity allow for plastic deformation and subsequent
activation of the film, while bulk samples exhibited brittle failure and no mechanophore
conversion. The thin film plastic deformation allows mechanophore activation in glassy thin
films even under high loading rates (dε/dt = 108
s-1
).
A novel experimental test protocol has been implemented to impart force on a polymer
film sample and achieve a chemical response. The shock wave loading experiment subjects the
film to high stresses (100s of MPa) over very short duration (~10 ns), leading to a particularly
high deformation rate - on the order of 108
s-1
. Such an approach can be applied to emerging

99
mechanochemical systems requiring large stresses which cannot be achieved by conventional
loading methods.
100
CHAPTER 8
SUMMARY AND FUTURE WORK
8.1 Summary of Thesis Research
SP was covalently bonded into both glassy and elastomeric linear polymer backbones.
Mechanochemical conversion of SP to MC was studied under tensile loading using a novel
combined mechanical and optical test system. The thermomechanical dependence of SP
activation was investigated using a variety of loading conditions and polymer properties.
Experimental results indicate two requirements prior to detectable SP activation: 1) Yielding
and plastic deformation, i.e. polymer flow, and 2) a threshold of macroscopic stress.
The onset of SP activation in an elastomeric polymer, SP-linked PMA, was observed at
deformation greater than 100% (stretch ratios greater than 2), and the onset and degree of
activation were strongly deformation rate dependent. Faster deformation rate led to higher
macroscopic stress, which in turn caused greater activation at lower stretch ratios.
SP activation in glassy polymers (PMMA and PS) occurred only for a range of
mechanical properties corresponding to a ductile response at significant stress. The mechanical
response of SP-linked PMMA was altered through both temperature control and polymer
plasticizing. Activation trends were similar for both methods. The strain at which SP activation
was detectable in PMMA could be controlled by the plasticizer content, and a minimum strain to
activation was approximately 5%, coinciding with the onset of yielding.
Activation of glassy SP-linked PS was demonstrated in thin film coatings on substrates.
A thin film testing protocol applied stresses with magnitude on the order of hundreds of MPa by
101
an acoustic mechanical pulse. Such stress levels are not attainable under quasi-static polymer
tensile testing methods, and apply to ballistic and/or shockwave loading conditions.
The optical and mechanical techniques developed for this work provide insight on the
nature of polymer deformation and force on a polymer chain. Birefringence and fluorescence
polarization measurements presented in Chapters 3 and 6, respectively, quantify the orientation
of polymer chains and mechanophores in the direction of applied force. At large deformations in
an elastomeric polymer, rapid activation of the mechanophore occurs when alignment reaches a
maximum level, implying large force across the polymer backbones at maximum alignment.
Collaborative computational work is currently under way to model the force on polymer chains
and compare with the experimental results in Chapter 3, thereby further defining the force
experienced by polymer chains at the molecular level [96]. Fluorescence polarization studies of
glassy polymer failure demonstrated a region of polymer relaxation and recoil within
approximately 500 μm of the failure surface. The combined optical and mechanical techniques
can be applied to various polymer systems and loading conditions to further explore the
mechanics of polymer deformation.
8.2 Future Work
8.2.1 Solid State Activation of New Mechanophores
The fundamental trends for mechanophore activation have been explored in virtually all
relevant polymer systems using a single mechanophore (SP). SP activation in amorphous linear
polymers has been thoroughly characterized in this dissertation. Cross-linked polymer systems,
using SP as a cross-linking unit, were investigated by Kingsbury et al. [15, 40]. Semi-crystalline
102
polymers are currently being explored by coworkers at UIUC. The question remains whether
these trends translate to other mechanophores.
An appealing mechanophore system has been developed by Professor Stephen Craig’s
group at Duke University [17]. The mechanophore can be easily synthesized by functionalizing
a double bond in a polymer backbone with bromoform to create a strained 3-member ring
referred to as a gem-dibromocyclopropane (g-DBC, Fig 8.1a). Sonication of polybutadiene
functionalized with g-DBC results in the rearrangement product [17] in Fig 8.1a. Lenhardt et al.
reported solid state g-DBC ring-opening and rearrangement under pressure applied in a confined
environment via a pellet press. Activation was seen at pressures as low as 36 MPa [16].
Polybutadiene was functionalized with the mechanophore (45 mole% conversion of
double bonds by 1H-NMR) in house to reproduce the results of the Craig group and attempt to
apply SP activation trends to g-DBC. At an applied pressure of 120 MPa via a pellet press,
mechanophore activation was confirmed by the emergence of peaks in the 1H-NMR at 4.6 ppm
and 6.1 ppm, corresponding to the rearrangement product of g-DBC. An NMR spectrum for
pressure-activated product is included in Fig 8.1b. In contrast, no activation was detected in
solvent-cast g-DBC linked polymer after tensile testing. Room temperature testing led to
stresses lower than 1 MPa at failure. In order to increase stress in the polymer, the test
temperature was controlled using an environmental chamber, following from the results in
Chapter 5. The glass transition temperature of the in-house synthesized polymer was measured
(by dynamic mechanical analysis) to be approximately -10 °C. Samples were tested in tension at
temperatures of 30 °C to 40 °C below the Tg (-40 °C to -50 °C). These temperatures maximized
stress while still promoting yield and draw of the polymer. Stress-strain curves in Fig 8.1c show
that the macroscopic stress reached levels greater than 45 MPa during tensile testing at -50 °C.

103
NMR of this sample after tensile testing, included in Fig 8.1b, demonstrated no detectable
activation of the mechanophore.
Figure 8.1 Mechanical testing of g-DBC-linked polybutadiene. a) Chemical synthesis and ring-
opening rearrangement of the g-DBC mechanophore. b) Region of interest of mechanophore-
linked polymer 1H-NMR spectrum after compression with a pellet press and tensile testing.
g-DBC rearrangement product peaks are expected at 6.1 and 4.6 ppm. c) Stress-strain curves for
tensile testing at varied temperatures.
The stresses reached during tensile testing of g-DBC-linked polybutadiene at -50 °C were
higher than the analogous pressures required to detect activation of g-DBC in a pellet press
(~36 MPa). Applied stresses were far higher than an apparent threshold of ring opening in SP-
linked polymers (~10 MPa). The lack of g-DBC activation at -50 °C may be due to low
temperature testing, since reaction rate follows an Arrhenius agreement and can be drastically
reduced at low temperatures. A future avenue for exploration of this system would involve

104
incorporation of g-DBC into polymer with higher stiffness backbones containing double bonds
and achieving comparable stresses in tension at room temperature. This work is currently under
way in collaboration with Duke University.
A similar mechanophore developed by Diesendruck et al. undergoes a 3-member ring
opening reaction, but promotes a pathway for acid generation. This mechanopohre has also
shown activation in the solid state by application of large pressures. The polymer was brittle at
room temperature, and required plasticizing with MeOH before activation was detectable [18].
Plasticizer-mediated activation of this mechanophore system provides supporting evidence of a
requirement of polymer yield and flow for force-induced chemical reactions in mechanophore
systems other than SP. Proposed future work for this mechanophore system involves synthesis
of tensile specimens with varying mechanical properties, controlled by plasticizer content.
Various mechanophores, described in Chapter 1, have demonstrated mechanochemical
activation in solution but have not been explored in solid state. For example, the Sijbesma [23]
and Bielawski [25] research groups have demonstrated mechanically-triggered release of
coordination catalysts which can initiate polymerization reactions. A hybrid system could be
developed based on the self-healing concepts of the Autonomic Materials Systems research
group (UIUC), utilizing either a microcapsule or microvascular system embedded in a catalyst-
releasing mechanophore-linked polymer [97]. Mechanical stimuli could release liquid monomer
from a microcapsule or microvascular network and simultaneously mechanochemically release
catalyst to cure the monomer, heal cracking and/or stiffen the polymer.
Another exciting mechanophore developed by Bielawski et al. demonstrated a force-
driven retro Diels-Alder reaction, cleaving a 6-member ring to release a diene and an olefin
dienophile [20]. Wudl and colleagues reported a similar self-healing chemistry in which 6-
105
member rings - products of a forward Diels-Alder reaction - were incorporated into a polymer as
cross-linking units. The Diels-Alder products could be cleaved at 120 °C, and cross-links were
re-formed at new sites by simply cooling to room temperature [98]. The Bielawski system forms
similar “living” functional groups (Diels-Alder reactants), available as new cross-linking units,
simply under mechanical force. A self-healing system utilizing this chemistry would not require
incorporation of additional phases (microcapsules or microchannels) and could autonomically re-
bond cross-links without intervention of temperature or other stimuli. With a variety of current
and emerging mechanophore chemistries demonstrating activation in the solution state,
implementation to solid state remains an active area of research.
8.2.2 A Bio-Inspired Mechanochemical System: Synthetic Mechanotransductive Channels
The foundations of for a novel mechanically-stimulated, chemically active system have
been developed with inspiration from mechanotransductive channels in biological systems.
Mechanotransductive channels provide a mechanism for release of ions across cell membranes,
and control processes such as maintaining cell pressure and transduction of sound waves for
hearing [2-4, 99]. Fig 8.2 shows two mechanisms which are proposed for mechanically-induced
opening of mechanotransductive channels in cell membranes. The first mechanism (Fig 8.2a) is
a simple stretch-induced opening, which can be triggered by high internal cell pressure. The
second mechanism (Fig 8.2b) is a tethered approach in which deflection of the cell relative to
other attached (tethered) cells triggers opening of a channel and release of ions. An interesting
application of this latter mechanism is mammalian hearing, in which hair cells in the ear are

106
tethered to each other and deflection in response to sound waves, triggering release of calcium
ions which are interpreted by the brain as sound [100].
Figure 8.2. Mechanisms for mechanotransductive channel opening. a) Stretch active cell
membrane. b) Spring-like tether model. Image reproduced from Lumpkin et al. [2].
A proposed synthetic approach to mechanotransductive channels is depicted
schematically in Fig 8.3. Channels of an active liquid phase are separated from a solid polymer
matrix by a synthetic membrane. The strain to failure of the membrane is selected to be lower
than the strain to failure of the matrix, such that the membrane ruptures and releases active liquid
into the matrix prior to ultimate failure of the system. The active liquid, when diffused into the
matrix, could trigger functionality similar to mechanophores under development, e.g. color
change for mechanical sensors or cross-linking for reinforcement of the polymer. To achieve a
color change, a solvent and dye can serve as the active liquid. Cross-linking for reinforcement of
the polymer could be achieved using pendant epoxide groups on a linear polymer backbone, such
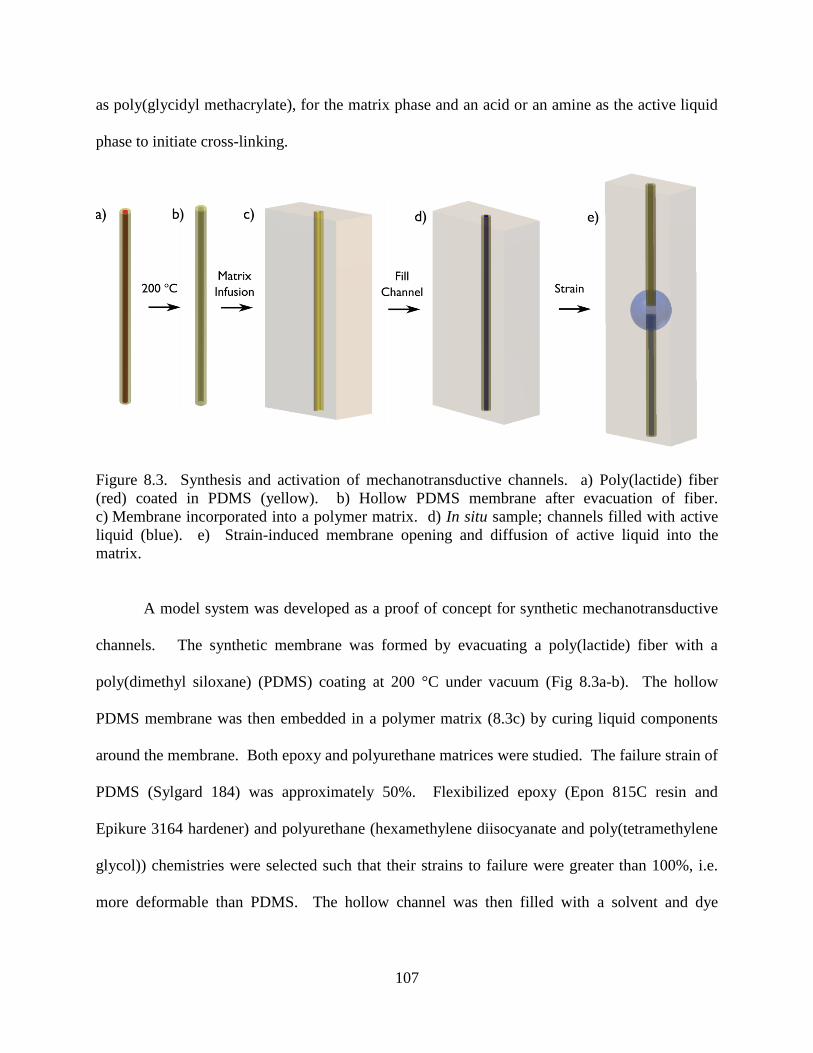
107
as poly(glycidyl methacrylate), for the matrix phase and an acid or an amine as the active liquid
phase to initiate cross-linking.
Figure 8.3. Synthesis and activation of mechanotransductive channels. a) Poly(lactide) fiber
(red) coated in PDMS (yellow). b) Hollow PDMS membrane after evacuation of fiber.
c) Membrane incorporated into a polymer matrix. d) In situ sample; channels filled with active
liquid (blue). e) Strain-induced membrane opening and diffusion of active liquid into the
matrix.
A model system was developed as a proof of concept for synthetic mechanotransductive
channels. The synthetic membrane was formed by evacuating a poly(lactide) fiber with a
poly(dimethyl siloxane) (PDMS) coating at 200 °C under vacuum (Fig 8.3a-b). The hollow
PDMS membrane was then embedded in a polymer matrix (8.3c) by curing liquid components
around the membrane. Both epoxy and polyurethane matrices were studied. The failure strain of
PDMS (Sylgard 184) was approximately 50%. Flexibilized epoxy (Epon 815C resin and
Epikure 3164 hardener) and polyurethane (hexamethylene diisocyanate and poly(tetramethylene
glycol)) chemistries were selected such that their strains to failure were greater than 100%, i.e.
more deformable than PDMS. The hollow channel was then filled with a solvent and dye
108
combination (dimethyl sulfoxide and bromophenol blue) which diffuses into both epoxy and
polyurethane matrices (8.3d).
Tensile testing resulted in PDMS membrane rupture at strains as low as 50% in both
polymer matrices. Subsequent diffusion of the dye and solvent into the matrix was visually
detectable. A representative sample with an epoxy matrix is shown before and after tensile
testing in Fig 8.4. The sample was held at a constant strain of 180% for 4 hours after testing, and
diffusion of the active liquid continued over time (Fig 8.4d).
The synthetic mechanotransductive channels studied so far have potential in quasi-static
loading conditions as strain or damage indicators. New active liquid and matrix chemistries
could lead to materials which adapt their mechanical properties in response to deformation. An
ideal system would provide flexibility at small deformations, but cross-link and stiffen prior to
failure and maintain mechanical integrity of the system at large applied loads. Although this
mechanism for mechanically-triggered chemical response differs from the mechanophore
approach discussed throughout this thesis dissertation, synthetic mechanotransductive channels
offer a novel bio-inspired approach toward similar advantageous material response.
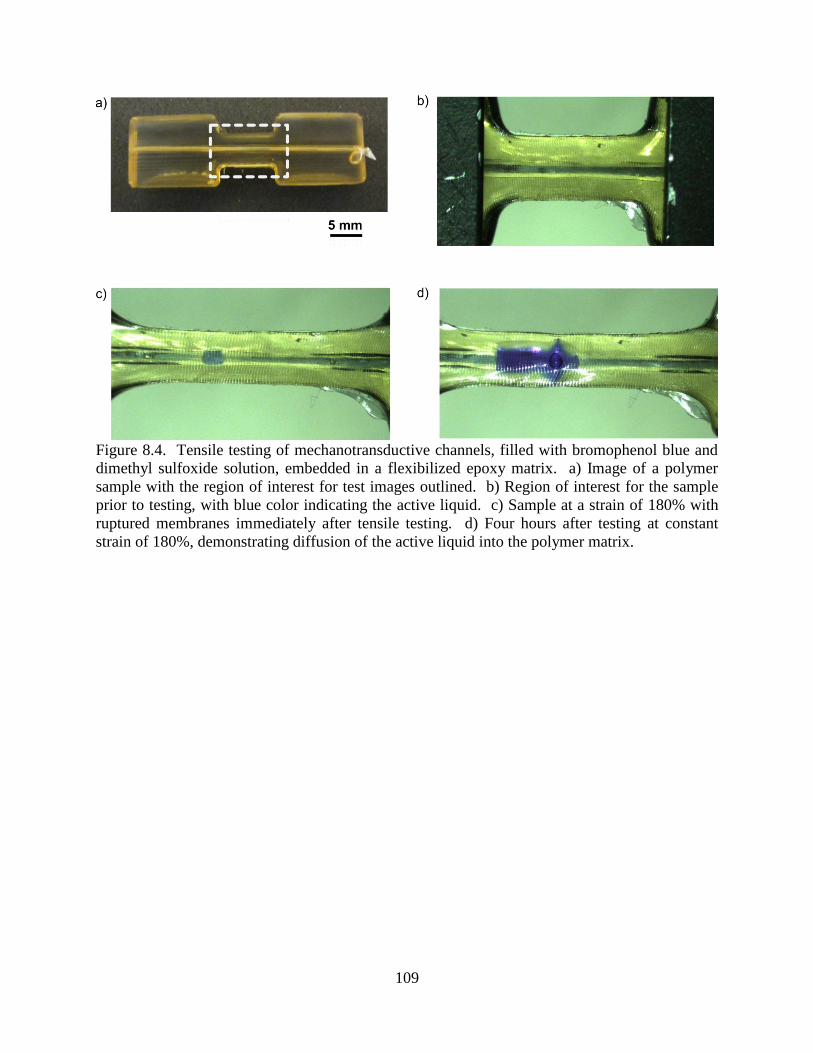
109
Figure 8.4. Tensile testing of mechanotransductive channels, filled with bromophenol blue and
dimethyl sulfoxide solution, embedded in a flexibilized epoxy matrix. a) Image of a polymer
sample with the region of interest for test images outlined. b) Region of interest for the sample
prior to testing, with blue color indicating the active liquid. c) Sample at a strain of 180% with
ruptured membranes immediately after tensile testing. d) Four hours after testing at constant
strain of 180%, demonstrating diffusion of the active liquid into the polymer matrix.
110
REFERENCES
1. Norman, J.J., et al., Microsystems for biomechanical measurements. Pediatric Research,
2008. 63(5): p. 576-583.
2. Lumpkin, E.A. and M.J. Caterina, Mechanisms of sensory transduction in the skin.
Nature, 2007. 445(7130): p. 858-865.
3. Kung, C., A possible unifying principle for mechanosensation. Nature, 2005. 436(7051):
p. 647-654.
4. Phillips, K.R., A. Biswas, and J.L. Cyr, How hair cells hear: the molecular basis of hair-
cell mechanotransduction. Current Opinion in Otolaryngology & Head and Neck
Surgery, 2008. 16(5): p. 445-451.
5. Kauzmann, W. and H. Eyring, The Viscous Flow of Large Molecules. Journal of the
American Chemical Society, 1940. 62(11): p. 3113-3125.
6. Staudinger, H., Über Isopren und Kautschuk, 20. Mitteil.: Über die Kolloidnatur von
Kautschuk, Guttapercha und Balata. Berichte der deutschen chemischen Gesellschaft (A
and B Series), 1930. 63(4): p. 921-934.
7. Zhurkov, S.N., et al., Polymer Bonds Under Mechanical Stress Investigated By Infrared
Spectroscopy. Doklady Akademii Nauk Sssr, 1967. 176(3): p. 623-&.
8. Zhurkov, S.N., E.E. Tomashevskii, and A.Y. Savostin, Mechanism Behind Breakdown of
Polymers Investigated by Means of Electron Spin Resonance. Doklady Akademii Nauk
Sssr, 1964. 159(2): p. 303-&.
9. Zhurkov, S.N. and V.E. Korsukov, Atomic Mechanism of Fracture of Solid Polymers.
Journal of Polymer Science Part B-Polymer Physics, 1974. 12(2): p. 385-398.
10. Kaupp, G., Mechanochemistry: the varied applications of mechanical bond-breaking.
Crystengcomm, 2009. 11(3): p. 388-403.
11. Zhang, Q. and F. Saito, A review on mechanochemical syntheses of functional materials.
Advanced Powder Technology, 2012. 23(5): p. 523-531.
12. Molchanov, V.V. and R.A. Buyanov, Mechanochemistry of catalysts. Russian Chemical
Reviews, 2000. 69(5): p. 435-450.
13. Hickenboth, C.R., et al., Biasing reaction pathways with mechanical force. Nature, 2007.
446(7134): p. 423-427.
14. Potisek, S.L., et al., Mechanophore-linked addition polymers. Journal of the American
Chemical Society, 2007. 129(45): p. 13808-+.
15. Davis, D.A., et al., Force-induced activation of covalent bonds in mechanoresponsive
polymeric materials. Nature, 2009. 459(7243): p. 68-72.
16. Lenhardt, J.M., et al., Characterizing the mechanochemically active domains in gem-
dihalocyclopropanated polybutadiene under compression and tension. Journal of
Materials Chemistry, 2011. 21: p. 8454-8459.
17. Lenhardt, J.M., A.L. Black, and S.L. Craig, gem-Dichlorocyclopropanes as Abundant
and Efficient Mechanophores in Polybutadiene Copolymers under Mechanical Stress.
Journal of the American Chemical Society, 2009. 131(31): p. 10818-+.
18. Diesendruck, C.E., et al., Proton-Coupled Mechanochemical Transduction: A
Mechanogenerated Acid. Journal of the American Chemical Society, 2012. 134(30): p.
12446-12449.
19. Kryger, M.J., et al., Masked Cyanoacrylates Unveiled by Mechanical Force. Journal of
the American Chemical Society, 2010. 132(13): p. 4558-+.

111
20. Wiggins, K.M., et al., Mechanically Facilitated Retro 4+2 Cycloadditions. Journal of the
American Chemical Society, 2011. 133(18): p. 7180-7189.
21. Brantley, J.N., K.M. Wiggins, and C.W. Bielawski, Unclicking the Click: Mechanically
Facilitated 1,3-Dipolar Cycloreversions. Science, 2011. 333(6049): p. 1606-1609.
22. Paulusse, J.M.J. and R.P. Sijbesma, Selectivity of mechanochemical chain scission in
mixed palladium(II) and platinum(II) coordination polymers. Chemical Communications,
2008(37): p. 4416-4418.
23. Piermattei, A., S. Karthikeyan, and R.P. Sijbesma, Activating catalysts with mechanical
force. Nature Chemistry, 2009. 1(2): p. 133-137.
24. Wiggins, K.M., et al., Mechanical Reconfiguration of Stereoisomers. Journal of the
American Chemical Society, 2010. 132(10): p. 3256-+.
25. Tennyson, A.G., K.M. Wiggins, and C.W. Bielawski, Mechanical Activation of Catalysts
for C-C Bond Forming and Anionic Polymerization Reactions from a Single
Macromolecular Reagent. Journal of the American Chemical Society, 2010. 132(46): p.
16631-16636.
26. Haward, R.N. and G. Thackray, The Use of a Mathematical Model to Describe
Isothermal Stress-Strain Curves in Glassy Thermoplastics. Proceedings of the Royal
Society of London. Series A. Mathematical and Physical Sciences, 1968. 302(1471): p.
453-472.
27. Kontou, E. and G. Spathis, Structural rearrangements during yielding of glassy polymers.
Polymer Engineering and Science, 1998. 38(9): p. 1443-1449.
28. Beyer, M.K. and H. Clausen-Schaumann, Mechanochemistry: The mechanical activation
of covalent bonds. Chemical Reviews, 2005. 105(8): p. 2921-2948.
29. Nallicheri, R.A. and M.F. Rubner, Investigations of the mechanochromic behavior of
poly(urethane diacetylene) segmented copolymers. Macromolecules, 1991. 24(2): p. 517-
525.
30. Weder, C., Mechanoresponsive Materials. Journal of Materials Chemistry, 2011. 21(23):
p. 8235-8236.
31. Crenshaw, B.R., et al., Deformation-induced color changes in mechanochromic
polyethylene blends. Macromolecules, 2007. 40(7): p. 2400-2408.
32. Azzaroni, O., et al., Mechanically induced generation of counterions inside surface-
grafted charged macromolecular films: Towards enhanced mechanotransduction in
artificial systems. Angewandte Chemie-International Edition, 2006. 45(44): p. 7440-
7443.
33. Hirshberg, Y., Reversible Formation and Eradication of Colors by Irradiation at Low
Temperatures. A Photochemical Memory Model. Journal of the American Chemical
Society, 1956. 78(10): p. 2304-2312.
34. Hirshberg, Y., E.B. Knott, and E. Fischer, Environmental Influences and the Colour of
Some Merocyanines. Journal of the Chemical Society, 1955: p. 3313-3321.
35. Zhang, S., et al., Photochromism of Spiropyran in Ionic Liquids: Enhanced Fluorescence
and Delayed Thermal Reversion. The Journal of Physical Chemistry B, 2009. 113(17): p.
6012-6019.
36. Reichardt, C., Solvatochromic Dyes as Solvent Polarity Indicators. Chemical Reviews,
1994. 94(8): p. 2319-2358.
112
37. Tyer, N.W. and R.S. Becker, Photochromic spiropyrans. I. Absorption spectra and
evaluation of the .pi.-electron orthogonality of the constituent halves. Journal of the
American Chemical Society, 1970. 92(5): p. 1289-1294.
38. Lee, C.K., et al., Force-Induced Redistribution of a Chemical Equilibrium. Journal of the
American Chemical Society, 2010. 132(45): p. 16107-16111.
39. O'Bryan, G., B.M. Wong, and J.R. McElhanon, Stress Sensing in Polycaprolactone Films
via an Embedded Photochromic Compound. ACS Applied Materials & Interfaces, 2010.
2(6): p. 1594-1600.
40. Kingsbury, C.M., et al., Shear activation of mechanophore-crosslinked polymers. Journal
of Materials Chemistry, 2011. 21: p. 8381-8388.
41. Tobolsky, A.V., Stress Relaxation Studies of the Viscoelastic Properties of Polymers.
Journal of Applied Physics, 1956. 27(7): p. 673-685.
42. Williams, M., R. Landel, and J. Ferry, The Temperature Dependence of Relaxation
Mechanisms in Amorphous Polymers and Other Glass-forming Liquids. Journal of the
American Chemical Society, 1955. 77(14): p. 3701-3707.
43. Ward, I.M., Mechanical Properties of Solid State Polymers. 2nd ed, ed. J.W. Sons. 1971,
Great Britain: John Wiley and Sons Ltd.
44. Brazel, C.S., et al., Plasticizing effects of imidazolium salts in PMMA: High and low
temperature stable flexible engineering materials. Abstracts of Papers of the American
Chemical Society, 2002. 224: p. 074-IEC.
45. Konczol, L., et al., Interference Microscopic Studies on Welded PMMA Samples.
Kunststoffe-German Plastics, 1982. 72(1): p. 46-51.
46. Retting, W., Generation and Relaxation of the Molecular-Orientation during Hot-
Stretching of Amorphous Thermoplastics. Colloid and Polymer Science, 1979. 257(7): p.
689-710.
47. Vangurp, M., The Use of Rotation Matrices in the Mathematical Description of
Molecular Orientations in Polymers. Colloid and Polymer Science, 1995. 273(7): p. 607-
625.
48. Arruda, E.M. and P.A. Przybylo, AN INVESTIGATION INTO THE 3-DIMENSIONAL
STRESS-BIREFRINGENCE-STRAIN RELATIONSHIP IN ELASTOMERS. Polymer
Engineering and Science, 1995. 35(5): p. 395-402.
49. Patterson, E.A. and Z.F. Wang, Simultaneous observation of phase-stepped images for
automated photoelasticity. Journal of Strain Analysis for Engineering Design, 1998.
33(1): p. 1-15.
50. Hermans, P.H. and J. Booys, Beiträge zur Kenntnis des Deformationsmechanismus und
der Feinstruktur der Hydratzellulose. Kolloid-Zeitschrift, 1939. 88(1): p. 73-78.
51. White, D.L. and G.N. Taylor, New Absorptive Mode Reflective Liquid-Crystal Display
Device. Journal of Applied Physics, 1974. 45(11): p. 4718-4723.
52. Grabchev, I. and J.M. Chovelon, Photophysical and photochemical properties of green
fluorescent liquid crystalline systems. Zeitschrift Fur Naturforschung Section a-a Journal
of Physical Sciences, 2003. 58(1): p. 45-50.
53. Unuma, Y. and A. Miyata, Light-Induced Molecular Orientation in Langmuir-Blodgett
Films of Spiropyran. Thin Solid Films, 1989. 179: p. 497-502.
54. Bletz, M., et al., Ground- and first-excited-singlet-state electric dipole moments of some
photochromic spirobenzopyrans in their spiropyran and merocyanine form. Journal of
Physical Chemistry A, 2002. 106(10): p. 2232-2236.

113
55. Bauman, D., H. Moryson, and E. Wolarz, Study of Nematic Order in Guest-Host
Mixtures by Polarized Optical Spectroscopy. Journal of Molecular Structure, 1994. 325:
p. 169-175.
56. Lukyanov, B.S. and M.B. Lukyanova, Spiropyrans: Synthesis, Properties, and
Application. (Review). Chemistry of Heterocyclic Compounds, 2005. 41(3): p. 281-311.
57. Tipikin, D.S., Mechanochromism of organic compounds by the example of spiropyran.
Zhurnal Fizicheskoj Khimii, 2001. 75(10): p. 1876-1880.
58. Lligadas, G. and V. Percec, Synthesis of perfectly bifunctional polyacrylates by single-
electron-transfer living radical polymerization. Journal of Polymer Science Part a-
Polymer Chemistry, 2007. 45(20): p. 4684-4695.
59. Matyjaszewski, K., et al., Controlled/"living" atom transfer radical polymerization of
methyl methacrylate using various initiation systems. Macromolecules, 1998. 31(5): p.
1527-1534.
60. Percec, V., et al., Ultrafast synthesis of ultrahigh molar mass polymers by metal-
catalyzed living radical polymerization of acrylates, methacrylates, and vinyl chloride
mediated by SET at 25 degrees C. Journal of the American Chemical Society, 2006.
128(43): p. 14156-14165.
61. Matyjaszewski, K., T.E. Patten, and J. Xia, Controlled/“Living” Radical Polymerization.
Kinetics of the Homogeneous Atom Transfer Radical Polymerization of Styrene. Journal
of the American Chemical Society, 1997. 119(4): p. 674-680.
62. Wang, T.L., et al., The effect of initiators and reaction conditions on the polymer
syntheses by atom transfer radical polymerization. Journal of Polymer Research, 2005.
12(2): p. 67-75.
63. Stafforst, T. and D. Hilvert, Kinetic characterization of spiropyrans in aqueous media.
Chemical Communications, 2009(3): p. 287-288.
64. May, P., Architechture dependent force-driven chemical reactions in solution and in
bulk. Journal of the American Chemical Society, 2013. In Preparation.
65. Ihre, H., O.L. Padilla De Jesús, and J.M.J. Fréchet, Fast and Convenient Divergent
Synthesis of Aliphatic Ester Dendrimers by Anhydride Coupling. Journal of the American
Chemical Society, 2001. 123(25): p. 5908-5917.
66. Barone, S., G. Burriesci, and G. Petrucci, Computer aided photoelasticity by an optimum
phase stepping method. Experimental Mechanics, 2002. 42(2): p. 132-139.
67. Kramer, S., et al., Simultaneous Observation of Phase-Stepped Images for Photoelasticity
Using Diffraction Gratings. Experimental Mechanics, 2013: p. 327-332.
68. Saiz, E., E. Riande, and J.E. Mark, Birefringence in poly(methyl acrylate) networks in
elongation. Macromolecules, 1984. 17(4): p. 899-902.
69. Rouse, J.P.E., A Theory of the Linear Viscoelastic Properties of Dilute Solutions of
Coiling Polymers. The Journal of Chemical Physics, 1953. 21(7): p. 1272-1280.
70. Zimm, B.H., Dynamics of Polymer Molecules in Dilute Solution - Viscoelasticity, Flow
Birefringence and Dielectric Loss. Journal of Chemical Physics, 1956. 24(2): p. 269-278.
71. Soranno, A., et al., Quantifying internal friction in unfolded and intrinsically disordered
proteins with single-molecule spectroscopy. Proceedings of the National Academy of
Sciences, 2012. 109(44): p. 17800-17806.
72. Hagen, S.J., Solvent Viscosity and Friction in Protein Folding Dynamics. Current Protein
& Peptide Science, 2010. 11(5): p. 385-395.

114
73. Ong, M.T., et al., First Principles Dynamics and Minimum Energy Pathways for
Mechanochemical Ring Opening of Cyclobutene. Journal of the American Chemical
Society, 2009. 131(18): p. 6377-+.
74. Haring, M.M., The Theory of Rate Processes (Glasstone, Samuel; Laidler, Keith J.;
Eyring, Henry). Journal of Chemical Education, 1942. 19(5): p. 249.
75. Evans, M.G. and M. Polanyi, Some applications of the transition state method to the
calculation of reaction velocities, especially in solution. Transactions of the Faraday
Society, 1935. 31(0): p. 875-894.
76. Eyring, H.P., M., Uber Einfache Gasreaktionen. Zeitschrift fur Physikalische Chemie B,
1931(12): p. 298-311.
77. Li, J., The mechanics and physics of defect nucleation. Mrs Bulletin, 2007. 32(2): p. 151-
159.
78. Bell, G., Models for the specific adhesion of cells to cells. Science, 1978. 200(4342): p.
618-627.
79. Hoffman, J.D., G. Williams, and E. Passaglia, Analysis of the α, β, and γ relaxations in
polychlorotrifluoroethylene and polyethylene: Dielectric and mechanical properties.
Journal of Polymer Science Part C: Polymer Symposia, 1966. 14(1): p. 173-235.
80. Merkel, R., et al., Energy landscapes of receptor-ligand bonds explored with dynamic
force spectroscopy. Nature, 1999. 397(6714): p. 50-3.
81. Pope, L.H., et al., Force-induced melting of a short DNA double helix. European
Biophysics Journal with Biophysics Letters, 2001. 30(1): p. 53-62.
82. Cremar, L., Insights for Designing Mechanochromic Spiropyrans from First Principles
Dynamics and Minimum Energy Pathways, in Department of Chemistry2012, Stanford
University: Palo Alto, CA.
83. Davis, D.A., et al., Nature, 2009. 459: p. 68.
84. Bauwensc.C, J.C. Bauwens, and G. Homes, Tensile Yield-Stress Behavior of Glassy
Polymers. Journal of Polymer Science Part A-2-Polymer Physics, 1969. 7(4): p. 735-742.
85. Hsieh, H.C., T.J. Yang, and S. Lee, Crack healing in poly(methyl methacrylate) induced
by co-solvent of methanol and ethanol. Polymer, 2001. 42(3): p. 1227-1241.
86. Baur, G., A. Stieb, and G. Meier, Polarized Fluorescence of Dyes Oriented in Room-
Temperature Nematic Liquid-Crystals. Molecular Crystals and Liquid Crystals, 1973.
22(3-4): p. 261-269.
87. Damerau, T. and M. Hennecke, Determination of Orientational Order Parameters of
Uniaxial Films with a Commercial 90-Degrees-Angle Fluorescence Spectrometer.
Journal of Chemical Physics, 1995. 103(14): p. 6232-6240.
88. Beiermann, B.A., et al., Environmental effects on mechanochemical activation of
spiropyran in linear PMMA. Journal of Materials Chemistry, 2011. 21: p. 8443-8447.
89. Brady, T.E. and G.S.Y. Yeh, Yielding Behavior of Glassy Amorphous Polymers. Journal
of Applied Physics, 1971. 42(12): p. 4622-4630.
90. Stephens, A.W. and J.L. Vossen, Measurement of Interfacial Bond Strength by Laser
Spallation. Journal of Vacuum Science & Technology, 1976. 13(1): p. 38-39.
91. Pronin, A.N. and V. Gupta, Measurement of thin film interface toughness by using laser-
generated stress pulses. Journal of the Mechanics and Physics of Solids, 1998. 46(3): p.
389-410.
92. Wang, J.L., R.L. Weaver, and N.R. Sottos, A parametric study of laser induced thin film
spallation. Experimental Mechanics, 2002. 42(1): p. 74-83.

115
93. Wang, J.L., N.R. Sottos, and R.L. Weaver, Tensile and mixed-mode strength of a thin
film-substrate interface under laser induced pulse loading. Journal of the Mechanics and
Physics of Solids, 2004. 52(5): p. 999-1022.
94. Kandula, S.S.V., et al., Dynamic delamination of patterned thin films. Applied Physics
Letters, 2008. 93(26).
95. Tran, P., et al., Dynamic delamination of patterned thin films: a numerical study.
International Journal of Fracture, 2010. 162(1-2): p. 77-90.
96. Silberstein, M., Modeling Mechanophore Activation within a Viscous Rubbery Network.
Journal of the Mechanics and Physics of Solids, 2013. Submitted.
97. Caruso, M.M., et al., Mechanically-Induced Chemical Changes in Polymeric Materials.
Chemical Reviews, 2009. 109(11): p. 5755-5798.
98. Chen, X., et al., A Thermally Re-mendable Cross-Linked Polymeric Material. Science,
2002. 295(5560): p. 1698-1702.
99. Gillespie, P.G. and R.G. Walker, Molecular basis of mechanosensory transduction.
Nature, 2001. 413(6852): p. 194-202.
100. Breneman, K.D., W.E. Brownell, and R.D. Rabbitt, Hair Cell Bundles: Flexoelectric
Motors of the Inner Ear. Plos One, 2009. 4(4).

116
APPENDIX A
BULK SAMPLE DIMENSIONS
Polymer samples were molded in closed molds with dimensions shown in Fig A1. Two
parallel plates heated to the temperature above the polymer Tg applied a pressure to the closed
mold. Poly(methyl acrylate) (Tg = 12 °C) was molded at 71 °C (160 °F) for ten minutes at
applied pressure of approximately 0.4 MPa (60 psi). Samples were then allowed to cool at room
temperature for one hour before removing from the mold. Poly(methyl methacrylate)
(Tg = 127 °C) was molded at temperature of 140 °C (285 °F) for 20 minutes at a pressure of
1.4 MPa (200 psi).
Figure A1. Sample dimensions for a) SP-linked PMA and b) SP-linked PMMA. All dimensions
are in mm.
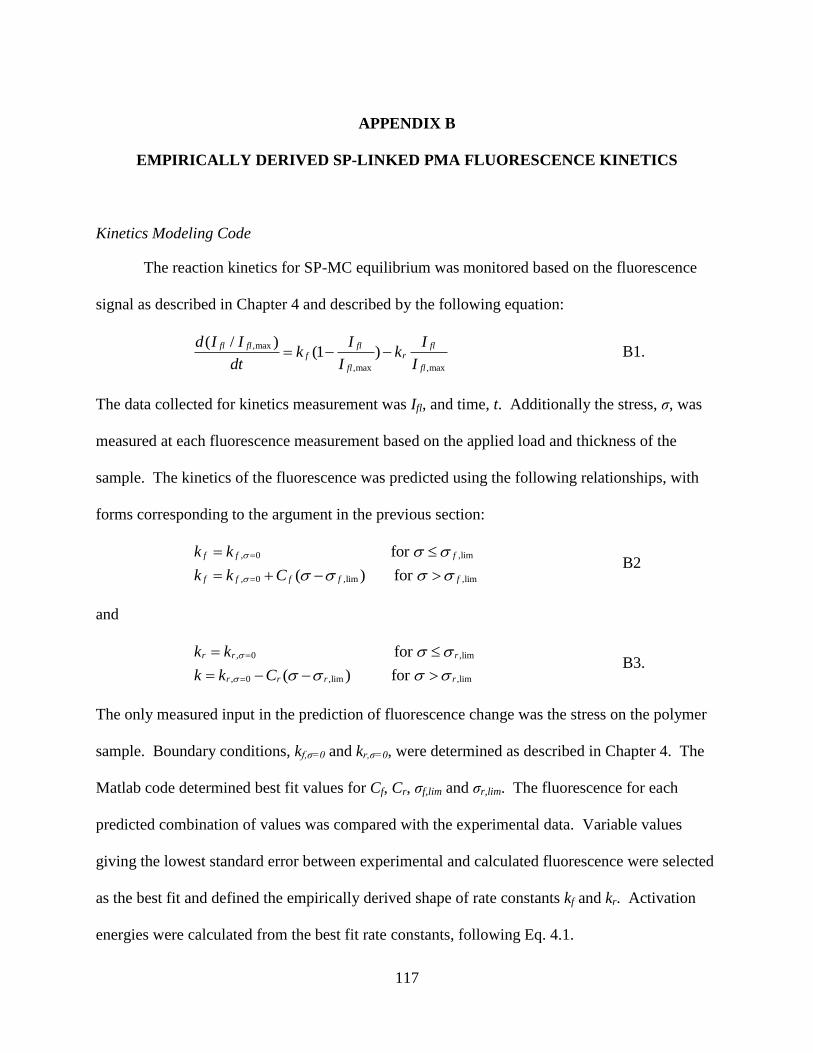
117
APPENDIX B
EMPIRICALLY DERIVED SP-LINKED PMA FLUORESCENCE KINETICS
Kinetics Modeling Code
The reaction kinetics for SP-MC equilibrium was monitored based on the fluorescence
signal as described in Chapter 4 and described by the following equation:
,max
,max ,max
( / )(1 )
fl fl fl flf r
fl fl
d I I I Ik k
dt I I B1.
The data collected for kinetics measurement was Ifl, and time, t. Additionally the stress, σ, was
measured at each fluorescence measurement based on the applied load and thickness of the
sample. The kinetics of the fluorescence was predicted using the following relationships, with
forms corresponding to the argument in the previous section:
, 0 ,lim
, 0 ,lim ,lim
for
( ) for
f f f
f f f f f
k k
k k C
B2
and
, 0 ,lim
, 0 ,lim ,lim
for
( ) for
r r r
r r r r
k k
k k C
B3.
The only measured input in the prediction of fluorescence change was the stress on the polymer
sample. Boundary conditions, kf,σ=0 and kr,σ=0, were determined as described in Chapter 4. The
Matlab code determined best fit values for Cf, Cr, σf,lim and σr,lim. The fluorescence for each
predicted combination of values was compared with the experimental data. Variable values
giving the lowest standard error between experimental and calculated fluorescence were selected
as the best fit and defined the empirically derived shape of rate constants kf and kr. Activation
energies were calculated from the best fit rate constants, following Eq. 4.1.
118
The Matlab code contained two fundamental components: a loop to cycle through
attempts at values for variables Cf, Cr, σf,lim and σr,lim (Fig B1), and loops to calculate the
fluorescence intensity at each data point for every sample (using the values Cf, Cr, σf,lim and σr,lim)
and compare the prediction with experimental data (Fig B1). The latter loops for each sample
were nested within the loop cycling through variable values. A standard error was averaged over
each data point for each combination of attempted variable values. The values for Cf, Cr, σf,lim
and σr,lim corresponding to minimum error were inserted into Eqs. B2 and B3, predicting the
response of the SP-MC kinetics to applied stress (Fig 4.4).
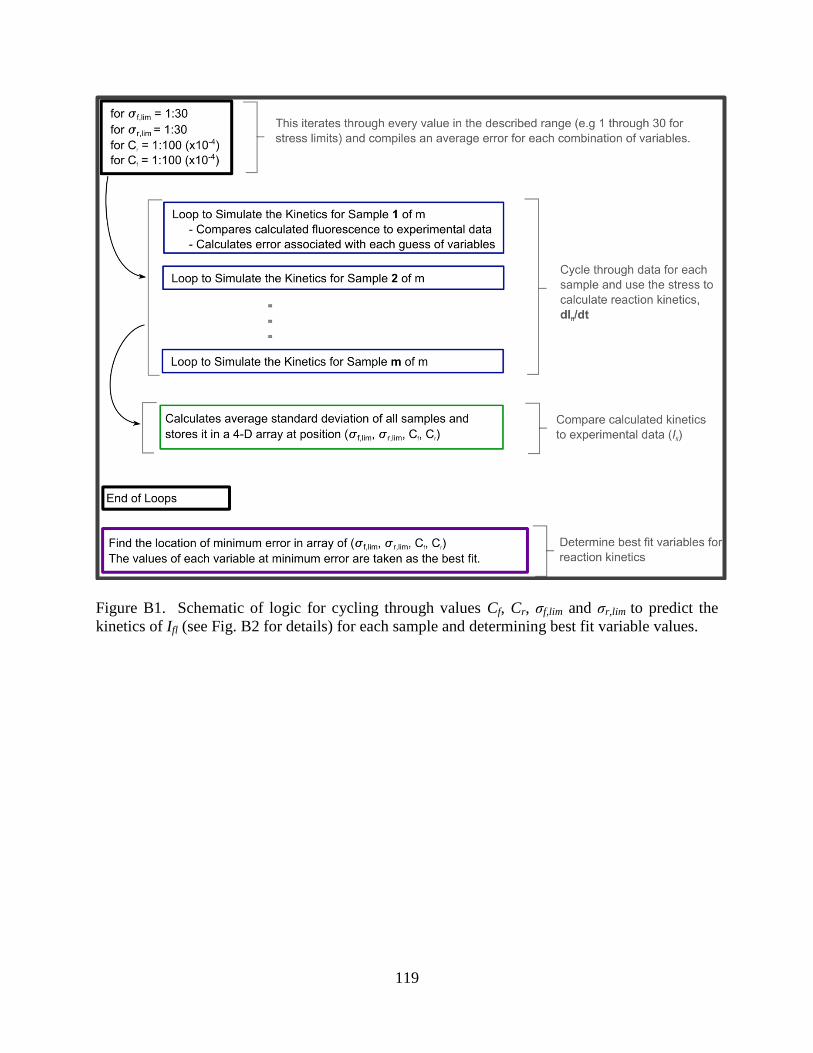
119
Figure B1. Schematic of logic for cycling through values Cf, Cr, σf,lim and σr,lim to predict the
kinetics of Ifl (see Fig. B2 for details) for each sample and determining best fit variable values.

120
Figure B2. Schematic logic to compute a predicted Ifl over time (kinetics) based on the stress in
the sample for each attempted value of Cf, Cr, σf,lim and σr,lim. The fluorescence intensity was
compared to the experimental values to calculate a standard deviation for each data point.
Effect of Varying Imax
Eq. B1 includes a normalization constant, Ifl,max, which corresponds to the theoretical
intensity of the sample if all mechanophores were in the fluorescent MC form. This constant
was not been determined experimentally and was assumed to be twice the average value of the
UV-irradiated sample fluorescence intensity, IUV. A parametric study was carried out using a

121
variety of values of Ifl,max. Varying the normalization constant did not have a significant effect on
the average error of the empirically fit kinetics data, but it did have an effect on calculated rate
constants and activation energies. Fig B3 demonstrates the influence of varying Ifl,max with
respect to IUV on the behavior of the SP-to-MC conversion. Ultimately, the change in activation
energy for SP-to-MC conversion due to applied stress, ΔEf,mech remained constant regardless of
Ifl,max.
Figure B3. Effect of varying Ifl,max. a) Forward rate constant. b) Activation energy for the
forward reaction, ΔEa,f.