Measuring Impact of Pharmaceutical Marketing Via Social Media and Online Video

Company Conf ident ia l – For Internal Use OnlyCopyright © SAS Inst itute Inc. A l l r ights reserved.
Measuring Marketing ImpactThe Analytical Marketer
Søren Borg
Company Conf ident ia l – For Internal Use OnlyCopyright © SAS Inst itute Inc. A l l r ights reserved.
MarketingWOMBAT CX & $

Company Conf ident ia l – For Internal Use OnlyCopyright © SAS Inst itute Inc. A l l r ights reserved.
Agenda• SAS?• Marketing’s Transformation• Our Approach• Examples from the Journey• Current / Next step• Advice

Company Conf ident ia l – For Internal Use OnlyCopyright © SAS Inst itute Inc. A l l r ights reserved.
SAS InstituteThe Power to Know
41 Years of Growth
Analysts RanksSAS as a Leader

Company Conf ident ia l – For Internal Use OnlyCopyright © SAS Inst itute Inc. A l l r ights reserved.
5
Marketing’s Transformation

Company Conf ident ia l – For Internal Use OnlyCopyright © SAS Inst itute Inc. A l l r ights reserved.
Change and Transformation
2017: Trends in Marketing
*Forbes, Forrester, SocialmediaToday
Influence
Customer Experience balanced with Growth
Artificial Intelligence, Machine Learning, Deep Learning…
The Internet of Things (IoT)
Influencer Marketing, Storytelling, Brand Purpose
Beyond Campaign to Engagement
Chatbots, Mobile, Video, Programmatic Advertising
GDPR– General Data Protection Regulation
Opportunity
The Marketing Channel & DeviceExplosion

Company Conf ident ia l – For Internal Use OnlyCopyright © SAS Inst itute Inc. A l l r ights reserved.
Decision Journey Evolution
Research
57 %of the purchase decision is complete before a customer even calls a supplier.* Forrester
Self DirectedDigital
67 %of the buyer’s journey is now done digitally*Sirius Decision

Company Conf ident ia l – For Internal Use OnlyCopyright © SAS Inst itute Inc. A l l r ights reserved.
Change of Focus
Channel
CustomerChannel
Company Conf ident ia l – For Internal Use OnlyCopyright © SAS Inst itute Inc. A l l r ights reserved.
9
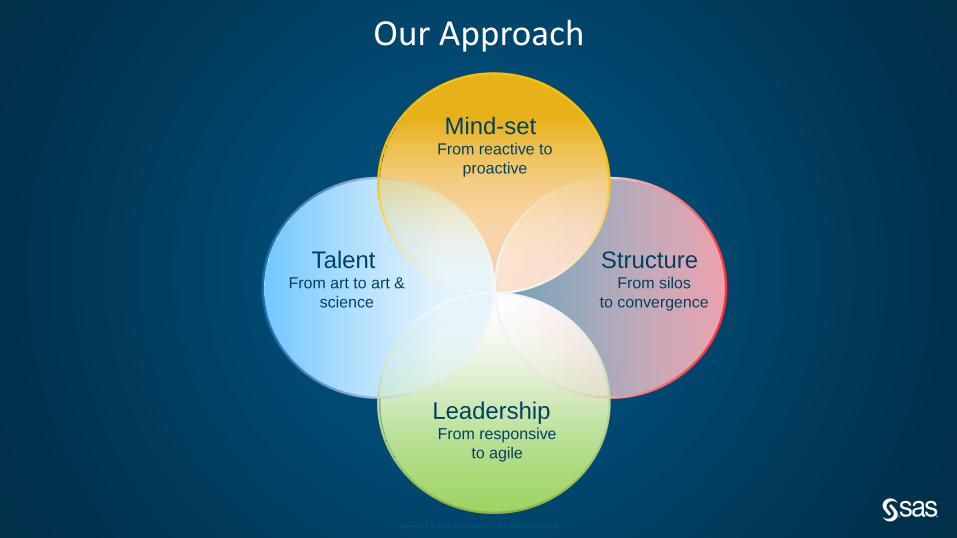
Our Approach
Copyright © SAS Inst itute Inc. A l l r ights reserved.
Mind-setFrom reactive to
proactive
TalentFrom art to art &
science
StructureFrom silos
to convergence
LeadershipFrom responsive
to agile
Our Approach
Copyright © SAS Inst itute Inc. A l l r ights reserved.
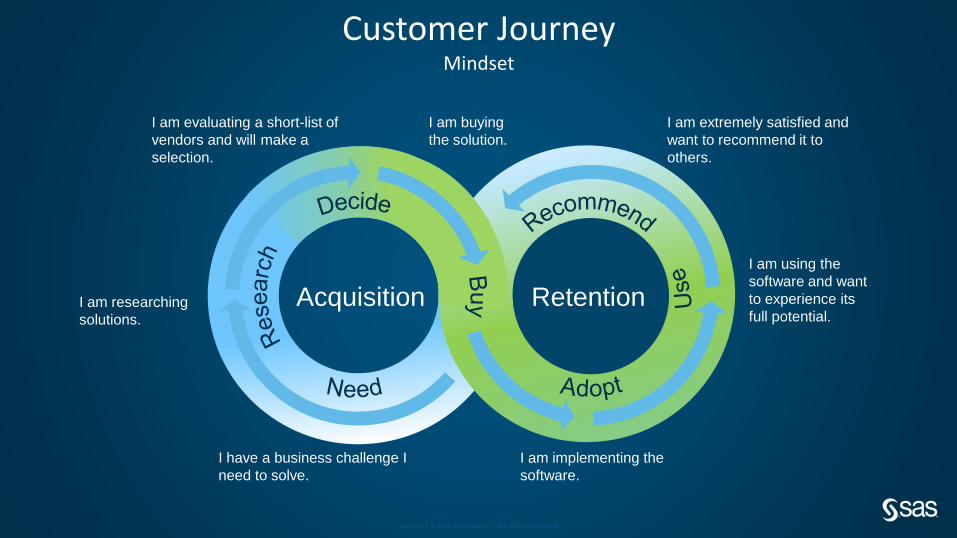
Customer JourneyMindset
Acquisition Retention
I am evaluating a short-list of
vendors and will make a
selection.
I am buying
the solution.
I am extremely satisfied and
want to recommend it to
others.
I am using the
software and want
to experience its
full potential.
I am implementing the
software.
I have a business challenge I
need to solve.
I am researching
solutions.

Copyright © SAS Inst itute Inc. A l l r ights reserved.
Navigating The Complex Customer JourneyMindset
Ever-increasing level of contact points for customer interaction
Situation
Modern analytical tools that translate key metrics into actionable insightsSo
luti
on
Consistent messaging across all contact points in the customer journey
Ch
alle
nge
Ability to react fast, test and implement activities
Desired Outcome

Copyright © SAS Inst itute Inc. A l l r ights reserved.
Marketing Functional FrameworkStructure
Go-to-MarketMarketing Shared
Services
Alignment and
Collaboration
Communications
Content Marketing
Digital Marketing and Social Media
Reference Development & Mgmt.
Marketing Sciences, Operations,
Reporting and Analytics
Logistic & Event Planning
Customer Contact Center Customer

Copyright © SAS Inst itute Inc. A l l r ights reserved.
✓Social Media Savvy
✓Storytelling Style
✓Process Design Skills
✓Data & Analytics Knowledge
✓Collaboration & Exceptional Communication
✓Creativity & Curiosity
New Roles and SkillsTalent
Marketing Sciences
• Data Visualization Analyst
• Segmentation Analyst
• Data Scientist or Architect
Go To Market
• Client Manager
• Orchestrator
• Social Media Marketers
Shared Services
• IT Business Partner
• Content Marketer
• Digital Marketing Specialty

Company Conf ident ia l – For Internal Use OnlyCopyright © SAS Inst itute Inc. A l l r ights reserved.
S P O N S O R
M E M B E R
Active & Accountable Champion
Domain Expert & Trusted Advisor Advocate & Inspire
Competency Center & Network ModelsTalent
L E A D

Copyright © SAS Inst itute Inc. A l l r ights reserved.
Governed Strategy for Reporting & Visualization
Standard Reports Drill Down Statistical Prediction
What does an Analytical Leader Look like?Leadership
Change Agent Technically Savvy Storyteller
Decisive Risk Taker Authentic

Company Conf ident ia l – For Internal Use OnlyCopyright © SAS Inst itute Inc. A l l r ights reserved.
17
Examples from our JourneyReport on the Past Analyze the Present Predict the Future

Copyright © SAS Inst itute Inc. A l l r ights reserved.
Title: Customer ‘Best Friend’ Analysis
What: Scores and Analyzes customer
behaviors and determines which
behaviors are most highly correlated.
Value:
• Groups customers engagement
categories and identifies trends.
• Keep your best friends and find
more of them.
• Identifies opportunity for cross-
promotion and service offerings.
Customer Retention & Loyalty
Copyright © SAS Inst itute Inc. A l l r ights reserved.
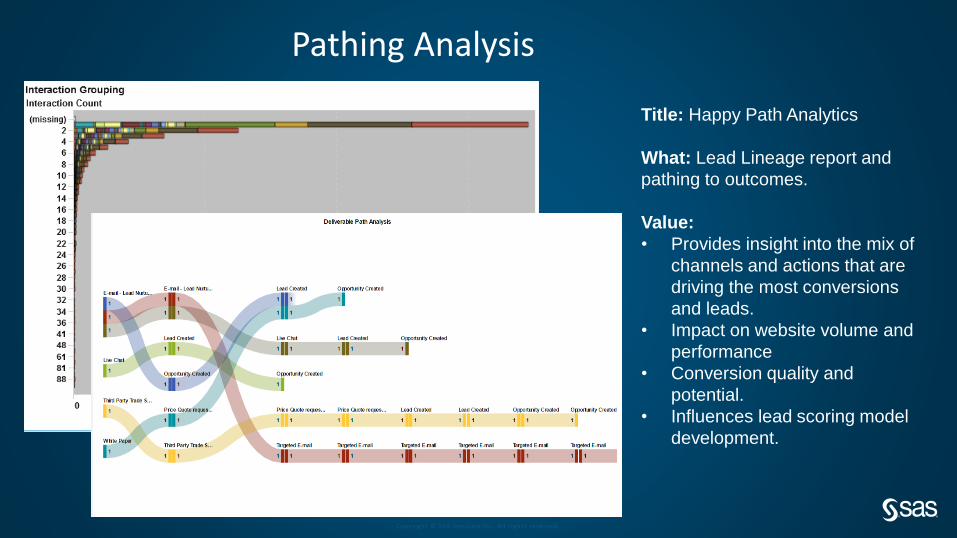
Title: Happy Path Analytics
What: Lead Lineage report and
pathing to outcomes.
Value:
• Provides insight into the mix of
channels and actions that are
driving the most conversions
and leads.
• Impact on website volume and
performance
• Conversion quality and
potential.
• Influences lead scoring model
development.
Pathing Analysis

Copyright © SAS Inst itute Inc. A l l r ights reserved.
Quality over Quantity
# Leads# New Direct
Opportunity
# New Direct/
# Leads # Leads
# New Direct
Opportunity
# New Direct/
# Leads
41,347 1,490 3.60% 28,470 1,360 4.78%
Before After
Title: Lead Scoring Analysis
What: Scored leads versus
business rules based lead passing.
Value:
• Allows us to evaluate the
quality of our journey or
behavior based marketing
• Monitors quality output as
compared to a volume based
approach

Copyright © SAS Inst itute Inc. A l l r ights reserved.
Title: Digital Footprint
What: Reports on the Customer’s
Digital Behavior (web page views,
online and offline registrations,
emails sent and clicked).
Value:
• Provides real-time insight into
customer behavior to both
sales and marketing.
• Data is also used to improve
lead scoring models.
Digital footprint
Copyright © SAS Inst itute Inc. A l l r ights reserved.
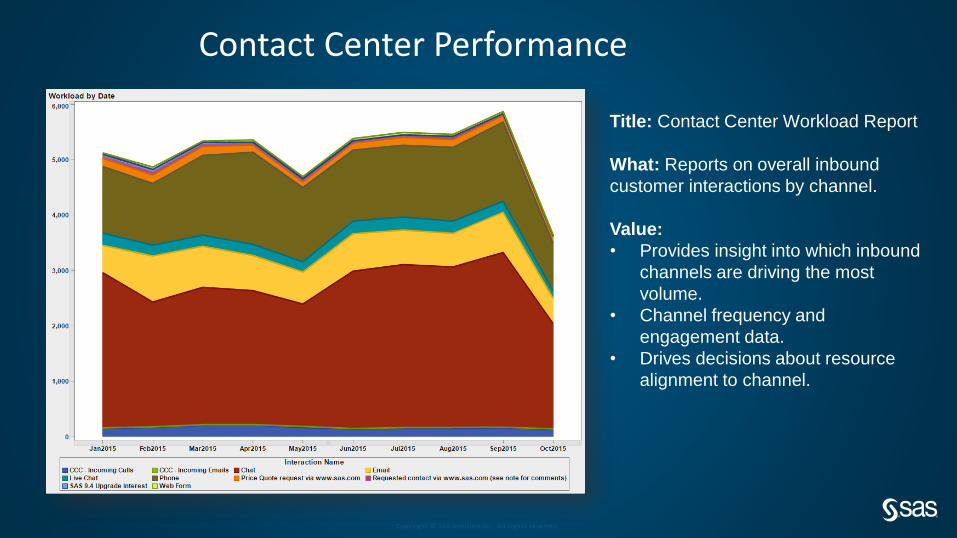
Title: Contact Center Workload Report
What: Reports on overall inbound
customer interactions by channel.
Value:
• Provides insight into which inbound
channels are driving the most
volume.
• Channel frequency and
engagement data.
• Drives decisions about resource
alignment to channel.
Contact Center Performance

Copyright © SAS Inst itute Inc. A l l r ights reserved.
Pipeline and Revenue Impact
What: Reports on lead flow and pipeline impact.
Value: Provides insight into marketing’s impact
on pipeline and revenue across segments.
• Are we tracking to our overall pipeline and
revenue impact goals.
• Overall return on marketing investment.
Lead Distribution Across Sales

Copyright © SAS Inst itute Inc. A l l r ights reserved.
Current SituationOne truth

Company Conf ident ia l – For Internal Use OnlyCopyright © SAS Inst itute Inc. A l l r ights reserved.
25
Current StepAttribution

Company Conf ident ia l – For Internal Use OnlyCopyright © SAS Inst itute Inc. A l l r ights reserved.
Atrribution Modelling

Company Conf ident ia l – For Internal Use OnlyCopyright © SAS Inst itute Inc. A l l r ights reserved.
Econsultancy: Digital cream 2014 – attribution modeling
Methods Effect
Company Conf ident ia l – For Internal Use OnlyCopyright © SAS Inst itute Inc. A l l r ights reserved.
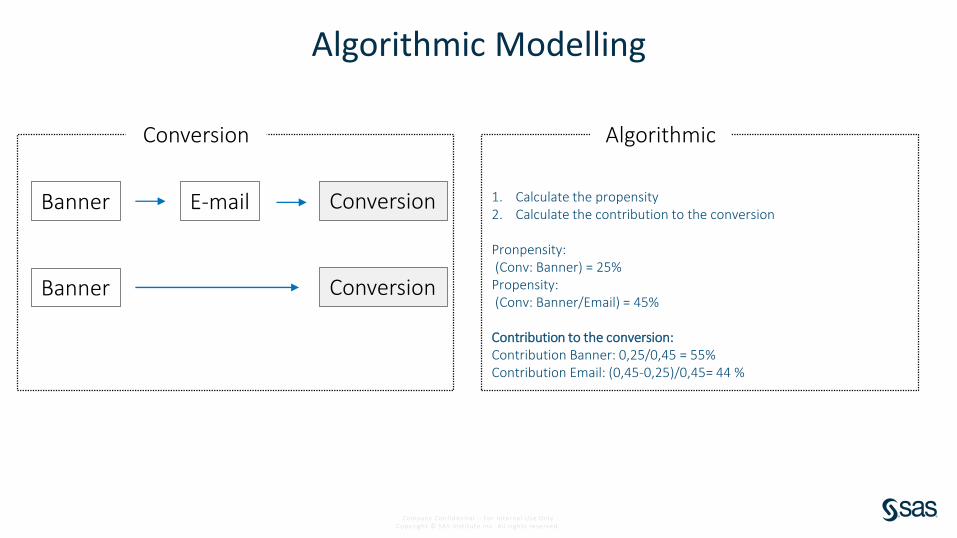
Algorithmic Modelling
Conversion Algorithmic
1. Calculate the propensity2. Calculate the contribution to the conversion
Pronpensity:(Conv: Banner) = 25%
Propensity:(Conv: Banner/Email) = 45%
Contribution to the conversion: Contribution Banner: 0,25/0,45 = 55% Contribution Email: (0,45-0,25)/0,45= 44 %
Banner E-mail Conversion
Banner Conversion

Company Conf ident ia l – For Internal Use OnlyCopyright © SAS Inst itute Inc. A l l r ights reserved.
Atrribution Modelling
Benefits
Understand the customer journeys of new and existing customers
Provide evidence that a channel is important even if it doesn’t look like it.
Understand the quality of engagements at certain stages in the funnel
Understand the value of multiple channels for multiple conversions
Marketing is able to better obtain budget due to accountability
Requirements
Need to create models for most occuring combinations of channels/segments/... (customer journeys)
Need analytical software to create and maintain a huge amount of models
Need of granular customer data (marketing touch points)
Company Conf ident ia l – For Internal Use OnlyCopyright © SAS Inst itute Inc. A l l r ights reserved.
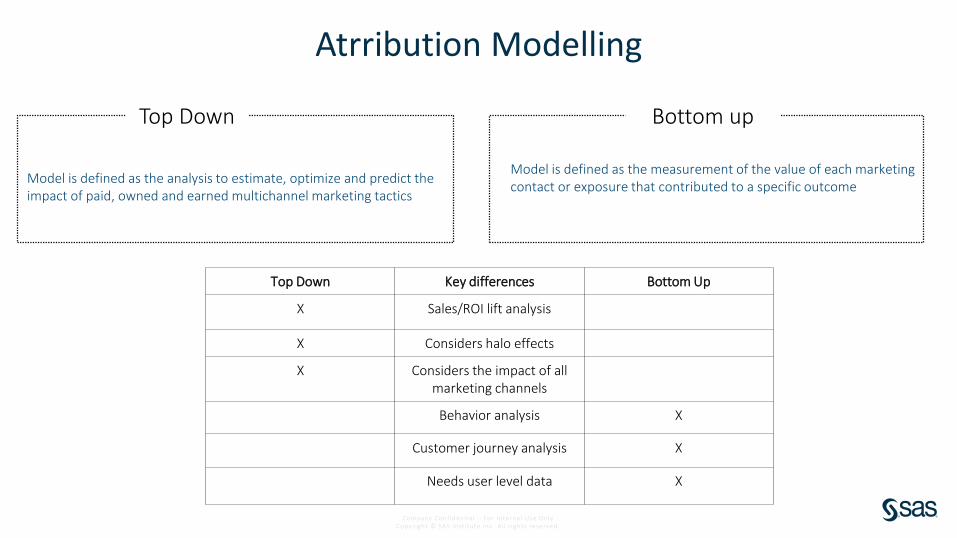
Atrribution Modelling
Top Down
Model is defined as the analysis to estimate, optimize and predict the impact of paid, owned and earned multichannel marketing tactics
Bottom up
Model is defined as the measurement of the value of each marketing contact or exposure that contributed to a specific outcome
Top Down Key differences Bottom Up
X Sales/ROI lift analysis
X Considers halo effects
X Considers the impact of all marketing channels
Behavior analysis X
Customer journey analysis X
Needs user level data X

Company Conf ident ia l – For Internal Use OnlyCopyright © SAS Inst itute Inc. A l l r ights reserved.
31
Advice

Company Conf ident ia l – For Internal Use OnlyCopyright © SAS Inst itute Inc. A l l r ights reserved.
No Destination
Be CuriousTake Risks and FailLead the changeOvercommunicate
Where to start
Evaluate Your Analytical Status
Build and Nurture Relationships
Embrace and Inspire Change
Inspiration
IncludingJob descriptions

Copyright © SAS Inst itute Inc. A l l r ights reserved.
“For Marketers, analytics is the basis of our storytelling and brings life to the data.”
-Adele Sweetwood

sas.com
Company Conf ident ia l – For Internal Use OnlyCopyright © SAS Inst itute Inc. A l l r ights reserved.
Thank [email protected] ||linkedin.com/in/sorenvborg