MEASURING - World Bank
34
MEASURING the Real Size of the WORLD ECONOMY The Framework, Methodology, and Results of the International Comparison Program—ICP
Transcript of MEASURING - World Bank
MEASURINGthe Real Size of theWORLD ECONOMYThe Framework, Methodology, and Results ofthe International Comparison Program—ICP
THE WORLD BANK


MEASURINGthe Real Size of theWORLD ECONOMYThe Framework, Methodology, and Results ofthe International Comparison Program—ICP
THE WORLD BANK
MEASURINGthe Real Size of theWORLD ECONOMYThe Framework, Methodology, and Results ofthe International Comparison Program—ICP
THE WORLD BANK

© 2013 International Bank for Reconstruction and Development / The World Bank1818 H Street NW, Washington DC 20433Telephone: 202-473-1000; Internet: www.worldbank.org
Some rights reserved1 2 3 4 16 15 14 13
This work is a product of the staff of The World Bank with external contributions. Note that The World Bank does not necessarily own each component of the content included in the work. The World Bank therefore does not warrant that the use of the content contained in the work will not infringe on the rights of third parties. The risk of claims resulting from such infringement rests solely with you.The findings, interpretations, and conclusions expressed in this work do not necessarily
reflect the views of The World Bank, its Board of Executive Directors, or the governments they represent. The World Bank does not guarantee the accuracy of the data included in this work. The boundaries, colors, denominations, and other information shown on any map in this work do not imply any judgment on the part of The World Bank concerning the legal status of any territory or the endorsement or acceptance of such boundaries.Nothing herein shall constitute or be considered to be a limitation upon or waiver of the
privileges and immunities of The World Bank, all of which are specifically reserved.
Rights and Permissions
This work is available under the Creative Commons Attribution 3.0 Unported license (CC BY 3.0) http://creativecommons.org/licenses/by/3.0. Under the Creative Commons Attribution license, you are free to copy, distribute, transmit, and adapt this work, including for commercial purposes, under the following conditions:
Attribution—Please cite the work as follows: World Bank. 2013. Measuring the Real Size of the World Economy: The Framework, Methodology, and Results of the International Comparison Program —ICP. Washington, DC: World Bank. DOl:10.1596/978-0-8213-9728-2). License: Creative Commons Attribution CC BY 3.0
Translations—If you create a translation of this work, please add the following disclaimer along with the attribution: This translation was not created by The World Bank and should not be con-sidered an official World Bank translation. The World Bank shall not be liable for any content or error in this translation.All queries on rights and licenses should be addressed to the Office of the Publisher, The
World Bank, 1818 H Street NW, Washington, DC 20433, USA; fax: 202-522-2625; e-mail: [email protected].
ISBN (paper): 978-0-8213-9728-2ISBN (electronic): 978-0-8213-9731-2doi: 10.1596/978-0-8213-9728-2
Cover design: Jomo Tariku, The World Bank.

Contents
Preface ix
Acknowledgments xi
Contributing Authors xiii
Executive Summary xvFrederic A. Vogel
Introduction: Reshaping the World 1Angus S. Deaton
1 The Framework of the International Comparison Program 13D. S. Prasada Rao
2 Governance Structure of ICP 2005 47Paul McCarthy
3 National Accounts Framework for International Comparisons: GDP Compilation and Breakdown Process 59
Paul McCarthy
4 Computation of Basic Heading PPPs for Comparisons within and between Regions 93
D. S. Prasada Rao
v

vi Measuring the real size of the World econoMy
5 Methods of Aggregation above the Basic Heading Level within Regions 121
W. Erwin Diewert
6 Methods of Aggregation above the Basic Heading Level: Linking the Regions 169
W. Erwin Diewert
7 The ICP Survey Framework 197Frederic A. Vogel
8 The Ring Comparison: Linking the Regions 225Frederic A. Vogel
9 Validation of ICP Regional Prices and Basic Heading PPPs 245David Roberts
10 Validation of Basic Heading and Aggregated PPPs: When Does Validation End and Estimation Begin? 279
Frederic A. Vogel
1 1 Health and Education 301Derek Blades
12 Dwelling Services 319Alan Heston
13 Construction 343Paul McCarthy
14 Machinery and Equipment 369Derek Blades
15 Government Services 393Derek Blades
16 Government Services: Productivity Adjustments 413Alan Heston
17 Reference PPPs 441Derek Blades and Yuri Dikhanov
18 Extrapolating PPPs and Comparing ICP Benchmark Results 473Paul McCarthy
19 Results and Empirical Analysis, ICP 2005 507Yuri Dikhanov and Frederic A. Vogel
viiContents
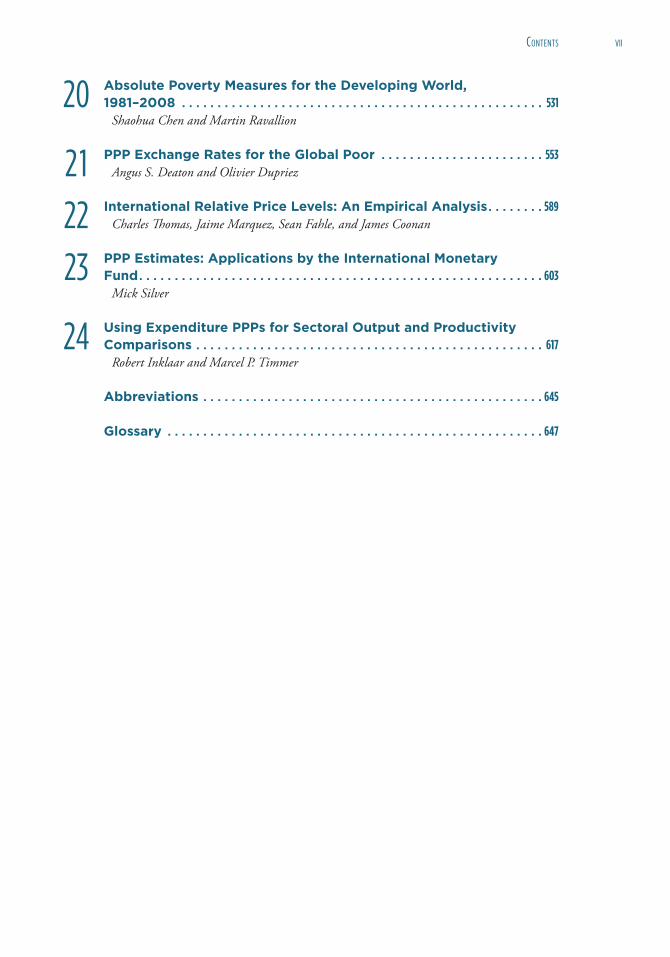
20 Absolute Poverty Measures for the Developing World, 1981–2008 531
Shaohua Chen and Martin Ravallion
21 PPP Exchange Rates for the Global Poor 553Angus S. Deaton and Olivier Dupriez
22 International Relative Price Levels: An Empirical Analysis 589Charles Thomas, Jaime Marquez, Sean Fahle, and James Coonan
23 PPP Estimates: Applications by the International Monetary Fund 603
Mick Silver
24 Using Expenditure PPPs for Sectoral Output and Productivity Comparisons 617
Robert Inklaar and Marcel P. Timmer
Abbreviations 645
Glossary 647

Preface
The International Comparison Program (ICP) has become not only the largest international statistical program in the world, but also the most complex. The first coordinated attempt to
produce purchasing power parities was carried out from 1967 to 1970; it was based on 10 coun-tries. In the years leading up to 2005, six rounds of the ICP were conducted, each with more coun-tries and each with improved methodology. The 2005 ICP included 100 countries from Africa, the Asia-Pacific, the Commonwealth of Independent States, South America, and Western Asia, plus 46 countries from the comparison conducted by Eurostat (the statistical office of the European Union) and the Organisation for Economic Co-operation and Development. The 2005 ICP stands on the shoulders of those who developed the theory and methodology used in previous rounds.
The lessons learned from previous ICP rounds led to the development of several significantly new and improved methods for the 2005 ICP. The subsequent analysis of the 2005 data set the stage for additional improvements to the 2011 ICP.
This volume is a comprehensive review of the statistical theory and methods underlying the estimation of PPPs and real expenditures, the choices made for the 2005 ICP round, and the lessons learned that led to improvements in the 2011 ICP. Disclosing the theory, concepts, and methods underlying estimates enhances the transparency of the 2011 ICP process. This allows interested stakeholders and users to fully understand the strengths, limitations, and assumptions underlying the estimates. This volume also contains several chapters about uses of the data from the 2005 ICP. These uses are significant because they expand the boundaries of the needs served by the ICP to encompass poverty estimation and analysis of the global economic situation.
Worldwide, no other statistical program requires so much cooperation among national, regional, and international organizations. The ICP greatly depends on the overwhelming support received from national statistical offices. They assume the effort of and responsibility for provid-ing the prices and other measures underlying all components of the gross domestic product and breaking it down into subaggregates.
ix
x Measuring the real size of the World econoMy
On behalf of the World Bank and the ICP Executive Board, I thank all who have contrib-uted to this volume. It is not possible to give credit in this limited space to all of the individuals responsible for its successful completion. Many are listed in the acknowledgments section that follows. Here I highlight the contributions of two special groups. Much of the material presented is based on the wholehearted discussions of the ICP’s Technical Advisory Group, which included many of the authors. The Global Office team, which is located in the World Bank, provided the means for the expert data analysis underlying many of the chapters and championed completion of the book.
Finally, to everyone involved in producing this book, thanks very much for a job well done.
Shaida Badiee, DirectorDevelopment Data Group, World Bank

Acknowledgments
This report by the International Comparison Program (ICP), Measuring the Real Size of the World Economy, was prepared by the World Bank, with contributions from the leading inter-
national experts in the fields of economics and statistics on international comparisons. The con-tributors and their affiliations are listed separately.
This volume was prepared under the aegis of the Bank’s Development Data Group, which is led by Shaida Badiee, director, and Grant Cameron, manager. The global manager of the Interna-tional Comparison Program is Michel Mouyelo-Katoula. The effort to prepare the ICP book was guided and overseen by Frederic A. Vogel. The book was edited by Sabra Ledent. Virginia Romand assisted with the coordination effort. Jomo Tariku and Virginia Romand steered the book through production.
The World Bank is grateful for the efforts of the authors, who contributed ground-breaking analysis and results describing complicated methodology in a transparent fashion. Members of the ICP Global Office provided valuable input about the scope and content of the book, and special mention is made of Nada Hamadeh, who helped manage the overall project. Other members of the ICP Global Office are recognized in the chapters in which they provided the computations and other input. Individual mention is also made of D. S. Prasada Rao at the University of Queensland, Australia, for his suggestion that the World Bank publish a book about the ICP and for his early input into the development of the scope and content of many of the chapters.
xi


Contributing Authors
Derek Blades, World Bank consultant and former staff member, Organisation for Economic Co-operation and Development, Paris
Shaohua Chen, Senior Statistician, Development Research Group, World Bank
James Coonan, U.S. Federal Reserve Board
Angus S. Deaton, Dwight D. Eisenhower Professor of International Affairs and Professor of Eco-nomics and International Affairs, Woodrow Wilson School of Public and International Affairs, Princeton University
W. Erwin Diewert, Professor, Department of Economics, University of British Columbia
Yuri Dikhanov, Senior Economist/Statistician, Development Data Group, World Bank
Olivier Dupriez, Lead Statistician, Development Data Group, World Bank
Sean Fahle, University of California, Los Angeles
Alan Heston, Professor Emeritus, Department of Economics, University of Pennsylvania
Robert Inklaar, Groningen Growth and Development Centre, Faculty of Economics and Business, University of Groningen
Jaime Marquez, U.S. Federal Reserve Board
Paul McCarthy, consultant, International Comparison Program, World Bank
D. S. Prasada Rao, Professor and ARC Professorial Fellow, School of Economics, University of Queensland, Australia
Martin Ravallion, Director, Development Research Group, World Bank
xiii

xiv Measuring the real size of the World econoMy
David Roberts, World Bank consultant and former staff member, Statistics Directorate, Organisa-tion for Economic Co-operation and Development, Paris
Mick Silver, Statistics Department, International Monetary Fund
Charles Thomas, U.S. Federal Reserve Board
Marcel P. Timmer, Groningen Growth and Development Centre, Faculty of Economics and Busi-ness, University of Groningen
Frederic A. Vogel, International Comparison Program, World Bank, and former Global Manager, ICP

Executive Summary
In its 2005 round, the International Comparison Program (ICP) became the largest and most complex international statistical program in the world. One hundred and forty-six countries
and economies provided the thousands of prices and related measures used to estimate purchas-ing power parities (PPPs) in order to deflate national gross domestic product (GDP) expenditures into a common global currency. The resulting PPPs and volume indexes make possible sound comparisons between countries that are based on economic and statistical theory. Each successive round of the ICP since its launch in the 1960s has involved more countries and more innovations in methodology. The results of each round provided the building blocks for the new theory and methods introduced in the next rounds.
This book describes the challenges faced by the 2005 round of the ICP, the new theories and methods developed to address those problems, and the lessons learned that can be applied to future rounds of the ICP. This book has been prepared to ensure complete transparency in the theory and methods used and the problems encountered. Much of the analysis presented by the authors of the chapters was made possible by giving them access to a data file containing the basic heading PPPs and expenditures for the 146 participating countries.
The book refers to six geographic regions of the world. The five geographic ICP regions in 2005 were Africa, Asia-Pacific, Commonwealth of Independent States (CIS), South America, and Western Asia. Although Eurostat (the statistical office of the European Union) and the Organisa-tion for Economic Co-operation and Development (OECD) jointly conduct their own PPP pro-gram, the Eurostat-OECD and ICP programs are coordinated so that all are included in the global results. For the purposes of this book, the Eurostat-OECD comparison is considered as the sixth region. In a similar fashion, the ICP includes both countries and economies. The term countries as used throughout this book refers to both.
FrederiC A. vogel
xv

xvi Measuring the real size of the World econoMy
What Is a Purchasing Power Parity?In its simplest form, a PPP is a price ratio. PPPs for the total consumption aggregate of the GDP, for example, are built up from comparisons of the prices of products purchased by households. To ensure that comparable products are being priced, the characteristics of each product must be care-fully defined.
This summary relies on the data example in table 1 to explain the concepts and methods used in the ICP. The table shows examples1 of prices for three products and four countries for the rice basic heading. The PPP between the Arab Republic of Egypt and the United Kingdom for prepacked long grain rice is the average price in Egypt in its national currency (Egyptian pound or LE) divided by the average price in U.K. pounds sterling (£). The price ratio 7.54 means that LE 7.54 is the cost of an amount of long grain rice in Egypt that would cost £1.0 in the United Kingdom. Likewise, LE 3.30 is the cost of the same quantity of long grain rice sold loose that would cost £1.0 in the United Kingdom.
As table 1 illustrates, the relative prices (product PPPs) differ by product. Therefore, the product PPPs are averaged to arrive at a PPP for the rice basic heading. The simple geometric mean is the bilateral PPP. In practice, multilateral PPPs are computed, and this computation takes into account the relative prices between all of the countries as a group. More will be said about this in the sections that follow.
Because there are no weights reflecting the quantities of each product purchased, the basic heading PPPs are computed with products and countries treated equally. However, expenditures are available for each basic heading, and thus they are used as weights when averaging basic heading PPPs to major aggregates such as food. The PPPs for the major aggregates are then averaged to the GDP, again using weights. Table 2 shows PPPs for selected basic headings in the food aggregate and the average PPP for food. The food PPP means that LE 4.22 is the cost of an amount of food in Egypt that would cost £1.0 in the United Kingdom. More important, the expenditures in Egyptian pounds for the food aggregate of the GDP in Egypt can be converted to the U.K. currency by dividing it by the PPP, or 4.22. The food expenditures in the other countries can also be converted to the U.K. pound by dividing them by their respective PPPs.
Table 1 Prices of Products in Rice Basic Heading and Their Ratios to U.K. Prices for Selected Countries
Rice basic heading
Egypt, Arab Rep /United Kingdom
Estonia/ United Kingdom
Philippines/ United Kingdom United Kingdom
National price
PPP to U K
National price
PPP to U K
National price
PPP to U K
National price PPP
Long grain, prepacked
5.51 7.54 11.59 15.87 32.73 44.83 .73 1.00
Long grain, loose 3.47 3.30 23.35 22.23 1.05 1.00
Basmati 5.69 5.69 45.68 20.48 2.23 1.00
Geometric mean—bilateral PPP
5.22 18.02 31.56 1.00
Multilateral PPP 4.80 19.98 33.36 1.00
Exchange rate 10.12 22.78 90.87
Source: ICP 2005.

xviiExEcutivE Summary
Another important measure is the price level index (PLI), which is simply the PPP divided by the exchange rate. PLIs that are less than 1.0 mean the products or aggregates are relatively cheap. The PLI is also a measure of the ratio of nominal expenditures (based on the exchange rate) to real expenditures based on PPPs. The price level indexes for food shown in table 2 indicate that food is relatively cheap in Egypt, Estonia, and the Philippines, and also that the nominal expenditures for food in those countries would be 0.42, 0.64, and 0.52 of the real expenditures, respectively.
The PPP for the GDP is based on the prices collected for about 1,000 products plus mea-surements for other aggregates such as housing, government, and construction that are used to first estimate basic heading PPPs and then average them to the GDP. The PPPs at each level of aggregation and for the GDP are simply a form of exchange rate to calibrate expenditures in national currencies to a common currency. While simple to say, the resulting PPPs are based on the very complex statistical and economic theories presented in detail in chapters 4, 5, and 6 and summarized here in a later section.
Uses of PPPsThe PPP-based expenditures allow direct comparisons of indicators of well-being, such as expendi-tures per capita, because they are now in a common currency. Similar comparisons can be made for other aggregates such as health, education, housing, government, and GDP. The PPPs for household consumption are the main input for estimation of the international poverty line, which is a main driver of international development efforts. Countries with different rates of economic growth can compare their price levels and per capita expenditures to guide their development policies. PPP-based expenditures allow comparisons across countries for different sectors. For example, the 2005 ICP showed that China accounted for 29 percent of global real expenditures on construction.
A major use of PPPs is for poverty assessments (see chapters 20 and 21). National poverty assessments differ by country because purchasing power differs. Therefore, an international poverty line is established using PPPs to hold the real value constant across countries. The international poverty line of $1.25 in international dollars is translated to the national level using PPPs. House-hold survey data are then used to determine the number of people living with per capita consump-tion below the poverty line.
Table 2 PPPs for Selected Basic Headings and Countries (UK = 1.00)
Basic heading
Basic heading PPPs (UK = 1 00)
Egypt, Arab Rep /United Kingdom
Estonia/ United Kingdom
Philippines/ United Kingdom United Kingdom
Rice 4.80 19.98 33.36 1.00
Other cereals 7.12 18.46 95.28 1.00
Bread 6.80 15.98 60.73 1.00
Beef and veal 4.60 10.60 31.22 1.00
. . . 29 basic headings
Food aggregate PPP 4.22 14.67 47.32 1.00
Exchange rate 10.12 22.78 90.87 1.00
Price level index 0.42 0.64 0.52
Source: ICP 2005.
xviii Measuring the real size of the World econoMy
The U.S. Federal Reserve Board uses PPP-based data on the GDP and aggregates to under-take an empirical analysis of international price levels (see chapter 22).
The International Monetary Fund (IMF) uses PPP-based GDP to determine the quota subscriptions of member countries (see chapter 23). The quota not only determines the financing each country must provide to the IMF, but also determines the amount of financing a country can obtain from the IMF and largely determines its voting power in IMF decisions. The IMF also uses PPP-based GDP numbers in its World Economic Outlook, which provides estimates of regional and world output and growth.
Other organizations and researchers use PPPs for international comparisons of output and productivity at the sector level (agriculture, manufacturing, and services). These comparisons pro-duce useful complements to comparisons of GDP or expenditure categories (see chapter 24).
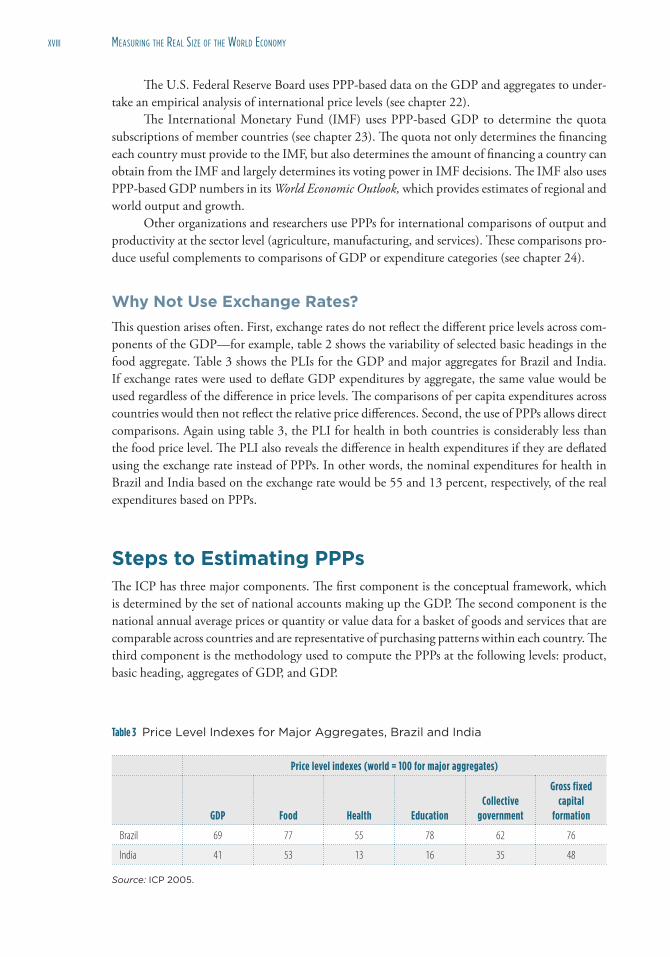
Why Not Use Exchange Rates?This question arises often. First, exchange rates do not reflect the different price levels across com-ponents of the GDP—for example, table 2 shows the variability of selected basic headings in the food aggregate. Table 3 shows the PLIs for the GDP and major aggregates for Brazil and India. If exchange rates were used to deflate GDP expenditures by aggregate, the same value would be used regardless of the difference in price levels. The comparisons of per capita expenditures across countries would then not reflect the relative price differences. Second, the use of PPPs allows direct comparisons. Again using table 3, the PLI for health in both countries is considerably less than the food price level. The PLI also reveals the difference in health expenditures if they are deflated using the exchange rate instead of PPPs. In other words, the nominal expenditures for health in Brazil and India based on the exchange rate would be 55 and 13 percent, respectively, of the real expenditures based on PPPs.
Steps to Estimating PPPsThe ICP has three major components. The first component is the conceptual framework, which is determined by the set of national accounts making up the GDP. The second component is the national annual average prices or quantity or value data for a basket of goods and services that are comparable across countries and are representative of purchasing patterns within each country. The third component is the methodology used to compute the PPPs at the following levels: product, basic heading, aggregates of GDP, and GDP.
Table 3 Price Level Indexes for Major Aggregates, Brazil and India
Price level indexes (world = 100 for major aggregates)
GDP Food Health EducationCollective
government
Gross fixed capital
formation
Brazil 69 77 55 78 62 76
India 41 53 13 16 35 48
Source: ICP 2005.

xixExEcutivE Summary
These three components are carried out under a governance structure whereby countries are grouped into regions with a regional coordinator. The ICP Global Office in the World Bank provides the overall coordination of the program across the regions and also the coordination with the Eurostat-OECD comparison (see chapter 2).
Figure 1 is an overview of the different steps required to produce estimates of PPPs. The starting point is the GDP. The best practice in the measurement of economic activities is the System of National Accounts 1993, which forms the basis of the ICP (see chapter 3). The breakdown of the GDP expenditures into 155 basic headings forms the building blocks to estimate PPPs. The basic
Figure 1 Main Components of the International Comparison Program
Source: ICP.Note: GEKS = Gini-Éltetö-Köves-Szulc.
Data validation and estimation of BH PPPs
GDP—155basic headings
Overview of the ICP
Basic heading (BH)expenditures innational currencies
Construction,equipmentprices/costs
ReferencePPPs for
imputed BHs
Productivityadjustment
Governmentsalaries
Health andeducation
Comparison-resistant BHs:global specifications
Dwellingrents andquantities
Between-regionBH PPPs: linkingfactors
BH PPP in globalcurrency
Within-regionBH PPPs
BHweights
Aggregated PPPsin regional currency
BHweights
2005—GEKS aggregated linking factors used to calibrateeach level to the global currency and retain fixity ofregional results
2011—Global GEKS aggregation: distribute to regionsto retain fixity of regional results
BH PPP in globalcurrency =between-regionPPP × within-region PPP
Between-regionBH PPPs: linkingfactors
Within-regionBH PPPs
National annualaverage prices:regional validation
National annualaverage prices:global validation
Ring productlist: pricecollection
Regional productlists: pricecollection
BHs with prices from market surveys
Governance—five ICPregions and Eurostat-OECD comparison
BH PPP in globalcurrency =between-regionPPP × within-region PPP
Direct estimatesfor some BHsinstead oflinking factors
xx Measuring the real size of the World econoMy
heading represents the categories into which individual products are grouped for pricing purposes; it is the lowest level for which expenditure estimates (breakdown of the GDP) are required. Use of the GDP as the main element of the conceptual framework of the ICP means that the prices to be collected must be consistent with the underlying values in the national accounts. The prices must be national annual averages and basically represent purchaser prices that include taxes and other costs.
Basic headings fall into three main categories. The first category is those basic headings containing products consumers purchase in various markets. Prices for these basic headings are obtained by means of market surveys. The second category is made up of the basic headings that are “comparison-resistant” because of the difficulties encountered in collecting data to estimate PPPs. These include the basic headings grouped into dwelling rents, health, education, government, construction, and equipment. The third category is those basic headings in which the prices either are not available or are too expensive to obtain. Therefore, their PPPs are imputed using PPPs from other basic headings (reference PPPs).
Some Basic Concepts Underlying the Estimation of PPPs The previous section outlined the steps taken to collect and validate the data used for estimation of PPPs. This section reviews some basic concepts underlying the estimation of PPPs, which is the subject of the next section.
There are many ways in which the basic heading PPPs can be computed using the relative product prices or simply the product PPPs—each has strengths and weaknesses. Many methods can be used as well to average the basic heading PPPs to aggregates and then to the GDP.
The first step is estimation of the basic heading PPPs. The bilateral PPP between any coun-try and the United Kingdom is simply the geometric mean of the product PPPs, which, as shown in table 1, equals 18.02 for Estonia. Also, the PPP between any two countries can be computed directly. For example, the geometric mean of the price ratios between Egypt and Estonia is 0.243. The PPP between Egypt and Estonia can also be measured indirectly by the ratio of their respec-tive PPPs to the United Kingdom as the base, or 5.22/18.02 = 0.289. One could also compute the PPP between Egypt and Estonia indirectly by dividing the PPP for Egypt and the Philippines by the PPP for Estonia and the Philippines. If n countries are in the comparison, a PPP can be obtained directly between any two countries, and n – 1 PPPs between the same two countries can be obtained indirectly through the base country.
In each case, one will get different answers. The section that follows reveals that the one way to estimate multilateral PPPs between any two countries is to take the geometric mean of the direct and indirect PPPs. In table 1, the PPP for Egypt to the United Kingdom goes from 5.22 (bilateral) to 4.80 when the multilateral estimate is computed. This means that the PPPs between any two countries are affected by their respective PPPs with each other country. This also means that the PPPs between any two countries can change if the mix of countries included in the computations changes. As illustrated in table 1, not all countries price every product. And as shown in the sec-tions that follow, there are many ways to estimate basic heading PPPs. These methods would all provide about the same answer if every country priced every item.
The choice of methods is based on several properties. Multilateral PPPs are computed so that the results satisfy two basic properties—transitivity and base country invariance. Transitivity simply means that the PPP between any two countries should be the same whether it is computed

xxiExEcutivE Summary
directly or indirectly through a third country. The second requirement is that the PPPs be base country–invariant, which means that the PPPs between any two countries should be the same regardless of the choice of base country. A simple solution is to use the geometric mean of the direct and indirect PPPs.
The basic heading PPPs shown in table 1 are essentially averages of the relative prices with no weights taken into account, which means that every product is treated equally. However, in reality expenditure shares for each would not be equal. For example, the prices for long grain rice sold loose are cheaper than the prices for Basmati. It is likely that in Egypt and the Philippines long grain rice sold loose is purchased in much greater quantities than long grain prepacked and Basmati, and that in Estonia and the United Kingdom prepacked long grain is the most popular of the two kinds. Because products with the greatest expenditures are likely to have the lowest prices, it would improve the quality of the estimates if some form of weighting could be introduced. This brings in the concept of representativity used by the Eurostat-OECD and CIS regions in the 2005 ICP and attempted in the other regions.
A representative product is one that is purchased frequently by households and has a price level consistent with all products in the basic heading. This classification can be used in applying a form of weighting in the estimation of basic heading PPPs, as shown in chapter 4. Most coun-tries in the ICP regions had difficulty applying the concept, especially the meaning of price level. To simplify the classification of products for its 2011 round, the ICP adopted a simpler concept, importance. Each country is asked to use expert judgment to determine which product(s) would have the largest expenditure shares. This will allow the introduction of simple weights for the products deemed important and used to estimate basic heading PPPs.
Weights based on basic heading expenditures are used in the methodology to average a group of basic headings to an aggregate level. The food aggregate, for example, contains 29 basic headings. In table 2, for the column of basic heading PPPs between, say, Egypt and the United Kingdom, there are two sets of weights: the expenditure shares for Egypt and those for the United Kingdom. Another basic concept that determines the choice of index method is that countries be treated equally. Therefore, the basic heading PPPs are first averaged using Egypt’s weights (Laspey-res index), and are then averaged using the United Kingdom’s weights (Paasche index). Each index provides a PPP between Egypt and the United Kingdom, and therefore the geometric mean is taken. The result is a Fisher index. As discussed in chapter 5, this is a superlative multilateral index that is consistent with economic comparisons of utility across countries. For each pair of countries, the multilateral PPP is the geometric mean of the direct and indirect Fisher indexes. This method was used for the 2005 ICP even though it does not satisfy the additivity requirement.
Additivity means that, for example, the expenditures for each food basic heading (in national currency) divided by the respective PPPs should add to the sum of food expenditures (in national currency) divided by the aggregated food PPP. The addition of major aggregate expenditures in PPP terms to the GDP should equal the real expenditures obtained by dividing GDP expenditures (in national currency) by the aggregated PPP for the GDP. However, the requirement that countries be treated symmetrically produces results that are not additive. Because the nonadditive method was used for the 2005 ICP, the real world GDP was about 2 percent smaller than the GDP obtained by the summation of the aggregate real expenditures. These differences were many times larger at the national level. However, at each level of aggregation the results were consistent with economic comparisons of utility and also minimized the differences between the bilateral and multilateral PPPs.
Additive methods can be used, but they have the disadvantage of giving more weight to the relative prices of the larger, more developed countries. As a result, the real expenditures for poor countries become larger and move further away from the bilateral PPPs.

xxii Measuring the real size of the World econoMy
Fixity is another concept that determines the methodology used. This means that the rela-tive volume (ratio of real expenditures) between any pair of countries in a region remains the same after the region has been combined with other countries or regions. This concept is critical when a region prepares its results, which are then later converted from a regional currency to the global currency.
Estimating PPPs—Within RegionsAs depicted in figure 1, the PPPs between countries within a region are estimated in two steps. The first step is to estimate the basic heading PPPs. The next step is to average or, using ICP jargon, to aggregate the basic heading PPPs for each country to higher aggregates and the GDP using expen-diture weights. The basic requirement for each stage of aggregation is that the resulting PPPs are transitive and base country–invariant, as defined earlier.
From Product PPPs to the Basic Heading
This section provides a brief overview of the material presented in chapter 4 and builds off table 1 in this executive summary. The bilateral PPPs for each country shown in table 1 are a form of a Jevons index. If the table is full—that is, if every country priced every item—then the bilateral PPPs would be transitive and base country–invariant.
In practice, not every country can price every item. Two basic methods are used in the ICP to calculate basic heading PPPs. The first approach is based on the Jevons index and the Gini-Éltetö-Köves-Szulc (GEKS) method, which turns the bilateral PPPs into multilateral PPPs to make them transitive and base country–invariant. The GEKS method is based on averaging the direct PPPs between any two countries with the n – 1 PPPs that can be obtained indirectly. The other method uses a regression model known as the Country Product Dummy (CPD), which directly estimates PPPs that are transitive and base country–invariant in one step.
As noted earlier, both methods treat every product equally regardless of their relative expen-ditures. For that reason, the concepts of representativity and importance were introduced.
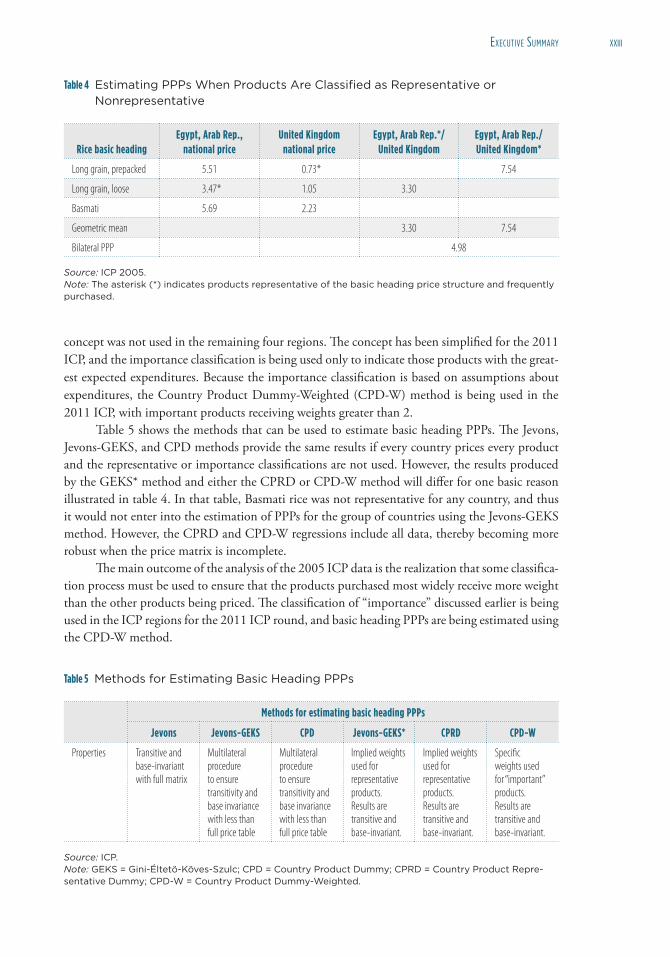
Table 4 repeats the data shown in table 1 for Egypt and the United Kingdom with represen-tative products indicated. Long grain rice, prepacked, is representative of the basic heading in the United Kingdom, whereas long grain rice sold loose is representative in Egypt. There are two ways to compute basic heading PPPs using this information. The PPP between Egypt and the United Kingdom is computed first using only products representative of Egypt, and then again using only products representative of the United Kingdom. The bilateral PPP between Egypt and the United Kingdom is then the geometric mean of these two PPPs. Basmati is not considered representative in either country, even though prices were provided. Thus those prices are not used in the price comparison for either country. These bilateral PPPs are made transitive and base country–invari-ant using the GEKS* method. This method is used by the Eurostat-OECD comparison and the CIS region. The GEKS method becomes the GEKS* method when the representativity variable is introduced.
The other regions in the 2005 ICP attempted to use the Country Product Representative Dummy (CPRD) method, with representativity included as another variable in the regression. However, the countries were not able to consistently provide the representativity coding because the concept required judgment about both price levels and relative expenditures. Therefore, the
xxiiiExEcutivE Summary
concept was not used in the remaining four regions. The concept has been simplified for the 2011 ICP, and the importance classification is being used only to indicate those products with the great-est expected expenditures. Because the importance classification is based on assumptions about expenditures, the Country Product Dummy-Weighted (CPD-W) method is being used in the 2011 ICP, with important products receiving weights greater than 2.
Table 5 shows the methods that can be used to estimate basic heading PPPs. The Jevons, Jevons-GEKS, and CPD methods provide the same results if every country prices every product and the representative or importance classifications are not used. However, the results produced by the GEKS* method and either the CPRD or CPD-W method will differ for one basic reason illustrated in table 4. In that table, Basmati rice was not representative for any country, and thus it would not enter into the estimation of PPPs for the group of countries using the Jevons-GEKS method. However, the CPRD and CPD-W regressions include all data, thereby becoming more robust when the price matrix is incomplete.
The main outcome of the analysis of the 2005 ICP data is the realization that some classifica-tion process must be used to ensure that the products purchased most widely receive more weight than the other products being priced. The classification of “importance” discussed earlier is being used in the ICP regions for the 2011 ICP round, and basic heading PPPs are being estimated using the CPD-W method.
Table 4 Estimating PPPs When Products Are Classified as Representative or Nonrepresentative
Rice basic headingEgypt, Arab Rep ,
national priceUnited Kingdom national price
Egypt, Arab Rep */ United Kingdom
Egypt, Arab Rep / United Kingdom*
Long grain, prepacked 5.51 0.73* 7.54
Long grain, loose 3.47* 1.05 3.30
Basmati 5.69 2.23
Geometric mean 3.30 7.54
Bilateral PPP 4.98
Source: ICP 2005.Note: The asterisk (*) indicates products representative of the basic heading price structure and frequently purchased.
Table 5 Methods for Estimating Basic Heading PPPs
Methods for estimating basic heading PPPs
Jevons Jevons-GEKS CPD Jevons-GEKS* CPRD CPD-W
Properties Transitive and base-invariant with full matrix
Multilateral procedure to ensure transitivity and base invariance with less than full price table
Multilateral procedure to ensure transitivity and base invariance with less than full price table
Implied weights used for representative products. Results are transitive and base-invariant.
Implied weights used for representative products. Results are transitive and base-invariant.
Specific weights used for “important” products. Results are transitive and base-invariant.
Source: ICP.Note: GEKS = Gini-Éltetö-Köves-Szulc; CPD = Country Product Dummy; CPRD = Country Product Repre-sentative Dummy; CPD-W = Country Product Dummy-Weighted.
xxiv Measuring the real size of the World econoMy
From Basic Headings to Major Aggregates to the GDP
Chapter 5 is an extensive review of the different methods used to aggregate basic heading PPPs to the GDP and their properties. Because expenditure weights are available for each country, the input to the estimation process is a matrix of 155 basic heading PPPs by country in the region and another matrix of basic heading expenditures in national currencies.
Chapter 5 examines three methods. The method used in five of the six regions was the GEKS. The basic heading PPP between any two countries has two weights, one for each country. Therefore, two weighted averages of basic heading PPPs are computed to estimate the GDP basic heading, using the weights for each country in turn. The Fisher indexes, the geometric mean of these weighted averages, are then made transitive and base country–invariant using the GEKS process described earlier. The GEKS method has the property that each country is treated in a symmetric way. One disadvantage is that the results are not additive.
The ICP has used two additive methods—Geary-Khamis (GK) and Iklé-Dikhanov-Balk (IDB)—but the results are not consistent with economic comparisons of utility across countries. In addition, large countries have a greater impact on the final results. If large countries have higher prices, then the impact is to raise the price levels of the poorer, smaller countries. The IDB method, however, has a smaller large-country effect. In the 2005 ICP, the GEKS method was used in every region except Africa. There, the IDB method was used because it was important that results be additive (see chapter 5 for an extensive review of its properties).
A problem with the GEKS method is that countries at very different stages of development with very different relative prices are given the same weight as countries with similar stages of devel-opment and relative prices. Therefore, chapter 5 examines the minimum spanning tree approach, which builds up the multilateral set of comparisons starting with bilateral comparisons with countries very similar in structure. This method offers considerable promise for the future, but still contains some arbitrary aspects, suggesting that further analysis and research are needed. The 2011 round of the ICP is thus mainly using the GEKS method to aggregate basic heading PPPs to the GDP.
From Within-Region to Global Basic Heading PPPsAs indicated in figure 1, at this stage there is a set of PPPs and related indexes for each of the six regions, each in the currency of one of the countries in the region. The PPPs for each level of aggregation and the GDP in each region are transitive and base country–invariant. However, at this stage it is not possible to compute the PPPs between two countries in different regions. Therefore, the final step is to convert the within-region PPPs to a common global currency. The requirements remain the same, which means that the concepts of transitivity and base country invariance apply to the global results. In addition, there must be adherence to the principle of fixity. This simply means that the relative volumes between any two countries shown in the regional comparison remain the same after they are converted to a common global currency. This concept applies at every level of aggregation from the basic heading to the GDP.
A new method introduced for the 2005 ICP meets all of these requirements and is described in chapters 6 and 8. Two sets of PPPs are required for each basic heading to convert regional PPPs to a common global currency. The first set is the within-region PPPs by country for each region. The second set is six between-region PPPs or linking factors for each basic heading, with one region serving as the base and with the between-region PPP equal to 1.0.

xxvExEcutivE Summary
In the 2005 ICP, the between-region PPPs for household consumption were based on separate prices (the Ring list, which is described shortly) collected by 18 countries: six African countries, four countries in the Asia-Pacific region, four Eurostat-OECD countries, and two countries each from the Western Asia and South America regions. For each of these there was a set of Ring product prices for each basic heading and its within-region PPP in a regional currency. These Ring prices for each country were converted to the currency of the regional base country by dividing each country’s basic heading Ring prices by its within-region PPP from the regional comparison. For each basic heading, there was a set of five2 prices, each in the currency of a regional base country. A CPD model that treated each set of regional prices as a country provided a set of PPPs for each region that reflected the relative prices (between-region PPPs or linking factors) for each basic heading. These linking factors were transitive and base country–invariant.
Chapters 11–16 describe the process undertaken to link the health, education, government, construction, and machinery and equipment basic headings. Because the same set of specifications was used for every region, the between-region PPPs were computed from the same data used for the regional comparisons for all basic headings except dwelling rents. The between-region PPPs for dwelling rents were computed using quantities of housing for a large number of countries within each region. Even though each region used different methods to estimate within-region housing PPPs, they were linked using the quantity method.
The basic heading linking factors for each region were scalars used to convert the within-region basic heading PPPs to the global currency. Because the within-region basic heading PPP for each country was multiplied by the same between-region basic heading scalar, the fixity principle was met. The outcome was a matrix of 146 countries and 155 basic heading PPPs that satisfied the transitivity and base country requirements, all relating to the same base country.
The 2011 ICP methodology is similar, but improvements are being made to the linking and aggregation. Instead of only selected countries pricing a large Ring list, all countries will price a smaller set of global core products. Analysis of the 2005 results revealed that the between-country variability was greater than the variability in product level prices. In other words, the optimum design calls for more countries to price fewer products for linking purposes. Therefore, a set of global core products was defined and will be part of the regional price comparisons as well. The prices for these core products from all countries are being used in the same two-step process described earlier: first estimate between-region basic heading PPPs and then use those as scalars to convert the within-region PPPs to the global currency.
In the 2005 ICP, the representativity concept was not used for the Ring prices. However, because of the diversity of economies across the world, it will be essential that the importance clas-sification be applied to all of the prices in the set of global core products. Although countries will be able to price a large number of the core items, it is very unlikely that all countries will have the same price levels or the same relative expenditures. Products that are common in some countries may be found only in boutiques with higher prices in other countries; the importance classification is needed to prevent an upward bias in the price levels used to estimate the between-region PPPs. The importance classified will be used on both the regional and core prices. The between-region PPPs will be computed using the CPD-W method.
Aggregating (Averaging) Global PPPs to Higher Aggregates and the GDP At this stage in the 2005 ICP, there was a matrix of five regional linking factors for each of the 155 basic headings and the summation of national expenditures to a total for each region in the
xxvi Measuring the real size of the World econoMy
currency of the regional base country. In the 2005 ICP, the between-region basic heading PPPs or linking factors were aggregated to the GDP and other aggregates using the GEKS method. Just as at the basic heading level, the aggregated linking factors at each level times the within-region PPP for each country at the same aggregated level converted the regional PPP to the global currency. This step preserved fixity at all levels of aggregation. Later analysis, however, showed that the link-ing factors at the aggregated level were not base country–invariant—that is, they were dependent on the choice of regional base country.
For this reason, a global aggregation is being used for the 2011 ICP. The input will be the outcome of the linking at the basic heading level, which will provide a matrix of 155 basic head-ing PPPs for 180-plus countries and another for expenditures. A global GEKS aggregation of the entire matrix will directly estimate a set of PPPs to a global base country at every level of the GDP breakdown and the GDP. The resulting expenditures for each country in the global currency will be summed to regional totals. These regional totals can be distributed to each country within a region to ensure that fixity is maintained with the within-region results.
Basic Headings with Prices Collected from Market SurveysThese basic headings account for about 100 out of the total of 155 basic headings and for about 60 percent of the world GDP (see chapters 7 and 8). Each region determines the products to be priced in these basic headings and prepares their specifications using structured product definitions—a new method introduced for the 2005 ICP that provides a systematic and consistent way to describe products. Under the regional concept, the goods and services to be priced can be chosen as those the most representative of a region’s countries. Although this approach provides the best compari-son between countries in the same region, say India and Indonesia, it is not possible to compare either with Brazil or the United States. For that reason, a method coined the “Ring” was adopted for the 2005 ICP.
The Ring concept involved creating a list of products that represented a composite of what was priced in each region. Eighteen countries representing the geographic ICP regions and the Eurostat-OECD program (this group included one economy, Hong Kong SAR, China) priced the set of Ring products in addition to the products in their regional list. National annual aver-age prices were provided by all countries for their regional products, and the Ring countries also provided prices for the Ring products. The prices from the regional lists were used by each region to compute within-region basic heading PPPs for its countries. These within-region basic heading PPPs were used to deflate the Ring prices into five sets of regional prices that were then used to estimate between-region PPPs. These between-region PPPs were in effect scalars that calibrated each country’s within-region basic heading PPPs to a common global currency.
Data ValidationPrices and other measurements are first validated at the national level (see chapters 9 and 10). This review ensures that the same products were priced across the different outlets over the country. The validation then moves to the regional and global levels where the main goal is to ensure the same products were priced across countries. In the 2005 ICP, the validation at these levels was carried out by first putting the prices in each basic heading into a common currency using PPPs. Two methods were used: the Quaranta tables from the Eurostat-OECD comparison and the Dikhanov tables derived by the World Bank. The Quaranta tables incorporate both exchange rates and PPPs in the identification of outliers. The Dikhanov tables allow the validation to be across basic head-

xxviiExEcutivE Summary
ings in addition to the within–basic heading review. Both methods involve an iterative process because the basic heading PPPs will change as prices that are outliers are checked by the respective countries and are either revised or removed. For the 2005 ICP, the data validation of the regional prices was conducted region by region, whereas the Global Office validated the prices from the Ring price survey.
Because the regions published their results first, the within-region basic headings had to be taken “as is” for the estimation of linking factors and the global aggregation. Analysis since then indicates that the regional basic heading PPPs should be subjected to additional review when the global linking factors are being validated and estimated (see chapters 9 and 10). A major outcome is that the regional results will remain open for review until the global results have been finalized.
Comparison-Resistant Basic HeadingsA common feature of the comparison-resistant basic headings is that global specifications for pric-ing or data collection are defined, whereas each region prepares its own lists of products for which prices are collected in market surveys.
Health and EducationThe difficulty with comparing health and education across countries is that countries have different arrangements for providing their citizens with health and education goods and services (see chapter 11). In the majority of countries, health and education are provided by a mix of government-run and private services. PPPs for the health aggregate therefore include seven basic headings in household consumption and 12 basic headings in individual consumption by government aggre-gate. For education, there is one basic heading in household consumption, but six basic headings in individual consumption expenditures by government. Prices are collected for pharmaceuti-cal products, therapeutic appliances and equipment, outpatient and hospital services, and other medical products for household consumption health basic headings. The same prices are used for the basic headings under government health benefits. For the government basic headings for the production of health and education services, it has been assumed that the comparative value of the government output is equal to input costs as measured by employee compensation. The problem with the traditional method of using government compensation to estimate PPPs is exacerbated by developments in the use of technologies; that method ignores the productivity gains from the use of technology.
For the 2005 ICP, prices were collected for products and services purchased by consumers for health and private education, and average salaries were obtained for a selection of occupations for certain health and education basic headings. For the first time, productivity adjustments were used in three ICP regions to adjust the compensation PPPs for differences in productivity across countries.
Dwelling Rents for Owner-Occupied HouseholdsHousehold dwelling expenditures consist of market-rented housing and imputations for non-market rents and owner-occupied housing (see chapter 12). The imputations complicate both the preparation of the national accounts and the estimation of PPPs for housing. Therefore, it is difficult to compare housing across countries because of the varying mix of rental versus owner-occupied dwellings. In the 2005 ICP, PPPs for dwellings were computed three different ways. Where there was a large rental market, rental surveys provided average rental rates by size and type of housing—these were also used to estimate PPPs for owner-occupied dwellings. However,
xxviii Measuring the real size of the World econoMy
in many countries the rental market is not sufficient to provide data to impute PPPs for owner-occupied housing. The preferred method in this case is to derive PPPs based on the relationship provided by expenditures = prices × quantities. Here prices = expenditures/quantities. Therefore, an indirect PPP is the ratio of the derived prices between countries. This is called the quantity approach because total housing quantities such as number of structures, rooms, and square foot-age from housing surveys and censuses are used as the quantity measure after the quantities are adjusted for quality. This method was used in some of the Eurostat-OECD countries and in the CIS and South America regions because the rental market was too small to provide rents to impute for owner-occupied housing. Because there was a similar lack of a rental market in Africa and Asia, the quantity method was also attempted in the Africa and Asia-Pacific regions, but it produced implausible results. Therefore, PPPs were imputed for countries in the Africa and Asia-Pacific regions using the PPP for individual consumption expenditures by households (excluding housing), which means that the housing PPP probably does not reflect the true volume of housing services in those countries.
Data users, especially those undertaking poverty analysis, were very critical of the method used in the Africa and Asia-Pacific regions. Therefore, in the 2011 ICP round efforts are being redoubled to enable all countries to base dwelling PPPs on a combination of dwelling rents and quantities. Chapter 12 explains in detail how the within-region dwelling PPPs were linked in the 2005 ICP using a set of quantity data representing each region.
ConstructionThe comparison of construction across countries depends on the concept of comparability, just as for any other component of the ICP (see chapter 13). Construction poses special problems because most construction outputs are unique. No two office buildings in different countries are identical, nor are the bridges, highways, and dams. One method of making comparisons is based on comparing input prices. Inputs are materials, labor, and equipment hire, each of which can be described so that the resulting costs are comparable between countries. The main problem with using input costs is that productivity, profits, and overhead costs are assumed to be the same rela-tive size in each country.
Output pricing involves creating a model building or civil engineering project with detailed specifications describing the final product. Construction professionals in each country are asked to quote a price for the construction output. This output price takes into account differences in productivity and other components such as profits and overhead. The disadvantage is that it is very costly to create the model projects and then to have them priced in each country. This method was used in the Eurostat-OECD comparison, but it was considered too costly to use in the ICP regions.
In the 2005 ICP, construction was compared using an approach called the basket of con-struction components. It involved collecting prices for a range of major construction components and basic inputs that were common across countries. Detailed specifications were prepared for components such as a column footing and the cost of labor, materials, and equipment. Basic input costs such as a fixed quantity of cement or an amount of reinforcing steel were also obtained. Because the component prices included labor, materials, and equipment, they met the requirement for output prices (still excluding profits and overhead). The problem was that a complex set of weights was required to combine the construction components, and most countries had difficulty providing them.
For the 2011 ICP, 38 different kinds of materials, 7 types of labor, and 5 types of equip-ment will be priced based on detailed specifications. PPPs will be computed for each of these three components within each of the three basic headings. Each country will furnish weights indicating

xxixExEcutivE Summary
the relative shares of materials, labor, and equipment for the residential buildings, nonresidential buildings, and civil engineering basic headings to aggregate the three component PPPs to the respective basic heading PPPs.
Machinery and EquipmentThe procedure used for pricing machinery and equipment in the 2005 ICP was similar to that used for household goods and services (see chapter 14). Structured product descriptions were developed for different kinds of equipment and then used as the basis for product specifications, so that comparable products could be priced across countries. The major difference was that the product specifications were very technical and dealt with combinations of characteristics such as torque, power, and lifting capacity. As a result, outside experts had to be brought in to assist countries with price collection to ensure that the products purchased were comparable across countries.
In addition, a set of 108 products was defined at the global level because of the difficulty in describing the price-determining characteristics. These products were used in the price collection for the ICP regions. Some equipment goods are unique because they are designed for a specific location or purpose. Examples are sea vessels, oil platforms, and power plants. No attempt was made to price these items; pricing was confined to the standard, generally mass-produced items. The set of global specifications prepared for 2005 has been updated for use in the 2011 ICP.
Government ServicesAs described earlier, in the 2005 ICP government services were compared by using government compensation as a measure of the value of output (see chapter 15). Detailed specifications were prepared describing 50 different government occupations in terms of the work done. For each, annual salaries were obtained that reflected gross salaries and wages that included payments for benefits and employee contributions for insurance and pensions. These salaries for each occupa-tion and country were treated as national annual average prices, and PPPs were computed accord-ingly. Also as described earlier, the average salaries were adjusted for productivity in the Africa, Asia-Pacific, and Western Asia regions. Because this was the first time productivity adjustments were made, chapter 16 is devoted to this issue. The adjustments were needed because the very low salaries in some countries would have resulted in implausible levels of real expenditures. The assumption underlying the productivity adjustments was that the output per worker was likely to increase with more capital per worker.
The issue for the 2011 round is whether to make adjustments for productivity or to find output measures such as numbers of health care workers or other health outputs and numbers of students and test scores for education that are comparable across countries for the estimation of PPPs. The situation becomes even more complex if different methods are used across regions, because the PPPs will have to be linked. One of the outcomes of the debate is that all countries will furnish compensation data for the same set of occupations. These will be used in a global aggrega-tion to the basic heading and aggregates that in one run will provide regional and global PPPs and real expenditures. If a region prefers to use a different method to estimate within-region PPPs, it can do so, and the regional share of the world expenditures from the global aggregation will be distributed to its countries to maintain within-region fixity.
Basic Headings for Which PPPs Were ImputedPPPs were imputed for different reasons (see chapter 17). One was that no good measures were available for comparing government basic headings such as intermediate services, gross operating

xxx Measuring the real size of the World econoMy
surplus, net taxes on production, and receipts from sales. Household consumption also contained basic headings for narcotics, prostitution, games of chance, and animal-drawn vehicles, which would be difficult to price. Moreover, some regions had found it difficult to define price-determin-ing characteristics for basic headings such as repair of furniture and appliances and maintenance of major durables and household services.
The basic heading PPPs used to impute for those that were missing were called “reference” PPPs. For example, the reference PPPs for intermediate consumption for government health services were PPPs for individual consumption expenditures by households (excluding health, education, and other basic headings imputed using reference PPPs). At the global level, the imputed PPPs accounted for 14 percent of the global real expenditures. Countries with low government expenditures had smaller amounts from imputation; those with high government expenditures had much larger amounts. The Africa and Asia regions had higher levels because they imputed PPPs for owner-occupied housing. One outcome of this review was to set stricter standards on when PPPs would be imputed and to increase efforts to directly estimate PPPs for dwellings.
Imputing PPPs for Missing Countries and Extrapolating PPPs between BenchmarksThe 2005 ICP covered 146 countries, and therefore PPPs were not available for about 65 other economies for a variety of reasons, ranging from resources to country interest (see chapter 18). Data users, however, requested a complete database, and so PPPs were imputed for the missing economies. For these economies, PPPs were imputed using a model based on benchmark data. The model imputed PLIs based on GDP per capita in U.S. dollars, imports and exports as shares of GDP, and an age dependency ratio as explanatory variables.
This process provided a database of PPPs to the U.S. dollar for 180-plus countries for 2005. However, many data users want PPPs for succeeding years. Therefore, PPPs are extrapolated for-ward and published each year in the World Bank’s World Development Indicators. These extrapo-lations are based on GDP deflators. The problem is that the extrapolated PPPs will differ from the new benchmark PPPs. The challenge is explaining to data users why consumer price index price changes and GDP growth rates are not consistent with the changes in PPPs between bench-marks. Chapter 18 provides an in-depth look at the reasons the two data series will not always be consistent.
Chapter 19 is an overview of the main results from ICP 2005 plus an empirical analysis to show how results would differ using different indexing methods. Specifically, additive results from the GK and IDB methods are compared with the nonadditive GEKS results. This comparison confirms that the additive methods increase the real size of poor countries’ GDPs relative to those of richer countries.
Chapters 20 and 21 reflect the work of poverty experts who use PPPs to construct inter-nationally comparable poverty lines. Chapter 20 presents the methods used by the World Bank to determine the international poverty line ($1.25 international dollars per day) and the number of people living below those levels. Chapter 21 explores how the recalculation of PPPs using the expenditure patterns of those at the poverty line compares with those based on the entire popula-tion. The underlying theory of poverty-weighted PPPs is presented, along with the methodology developed for the analysis.

xxxiExEcutivE Summary
Chapter 22 provides an analysis of international price levels, especially the relationship between the cross-country price levels and income levels. It shows that this relationship is sensitive to whether products are tradable.
The International Monetary Fund is a major user of PPPs. Chapter 23 describes in detail how the IMF uses PPPs to determine membership quotas and in the analysis it publishes in its World Economic Outlook report. Chapter 24 concludes this volume by further expanding on the use of PPPs; it describes the adjustments needed to convert expenditure-based PPPs into output PPPs by sector such as agriculture, manufacturing, and services.
ConclusionAlthough the 2005 round of the ICP was a vast improvement over previous rounds because of the significant effort made to improve methodologies, much was also learned that has been taken for-ward to the 2011 round. A brief review of lessons learned and improvements being made follows:
•• National accounts. More attention is being paid to the national accounts, starting with the national estimates of GDP and then the breakdown to the 155 basic headings. The comparisons between countries are based on volume indexes and per capita measures—a perfectly good PPP is of no use if the GDP it converts is of weak quality. Therefore, a concerted effort is being made from the beginning to improve national accounts and make them more consistent between countries.
•• From Ring list to global core products. The most significant change is moving from the use of a Ring list priced by a few countries for linking to the development of a set of global core products that will be priced by all countries. This change will greatly improve estima-tion of the between-region linking factors used as scalars to convert within-region PPPs to the global currency. It also carries with it adoption of the principle of “importance” to classify products in order to give more weight to those most widely consumed in each country.
•• Difficult-to-compare basic headings. Considerable effort is going into improving the esti-mates of PPPs for the difficult-to-compare basic headings.
•• Dwelling rent PPPs. Because of the criticism from data users that dwelling rent PPPs were imputed in Africa and Asia, efforts are being redoubled to ensure that direct PPPs are provided for both regional and global comparisons. The use of output measures for health and education are also being explored.
•• Productivity adjustments. The issue of productivity adjustments for government services is being addressed. In the 2005 ICP, productivity adjustments were not used in every region, making it difficult to compare results between countries in different regions. A significant improvement for the 2011 ICP is using a global aggregation of government compensation across all countries that is adjusted for productivity differences.
•• Construction. The methodology for construction is being simplified so that countries can carry out data collection without having to engage expert consultants.
•• Data validation. Greater attention is being given to data validation at the basic head-ing level and above for both the regional and core comparisons. A major change is that regional PPPs will be open for review while the core prices and PPPs are being validated, because the within-region PPPs are an input in the estimation of linking factors.

xxxii Measuring the real size of the World econoMy
NOTES
1. The prices used here were taken from various sources for illustrative purposes.2. The linking factors for the CIS region were based on the PPPs for the Russian Federation
from the Eurostat-OECD comparison. Russia also priced the CIS products and was the base country for the region.

xxxiiiExEcutivE Summary

xxxiv Measuring the real size of the World econoMy