Measuring the Shadow Economy - DEF CON · –Trading stolen information –Identity theft...
24
Measuring and Integrating the Shadow Economy: A Sector-Specific Approach Brian K. Edwards, Ph.D. Silvio J. Flaim, Ph.D. Los Alamos National Laboratory June 30, 2008
Transcript of Measuring the Shadow Economy - DEF CON · –Trading stolen information –Identity theft...
Measuring and Integrating the Shadow Economy:
A Sector-Specific Approach
Brian K. Edwards, Ph.D.Silvio J. Flaim, Ph.D.
Los Alamos National LaboratoryJune 30, 2008

2
Overview• Scope of shadow economic activity• Size of shadow economy in the United States
and other countries• Why shadow economies exist• Adding a shadow information sector to
simplified version of the official economy• Shadow-official economy interactions• Benefits and burdens of shadow economic
activity
3
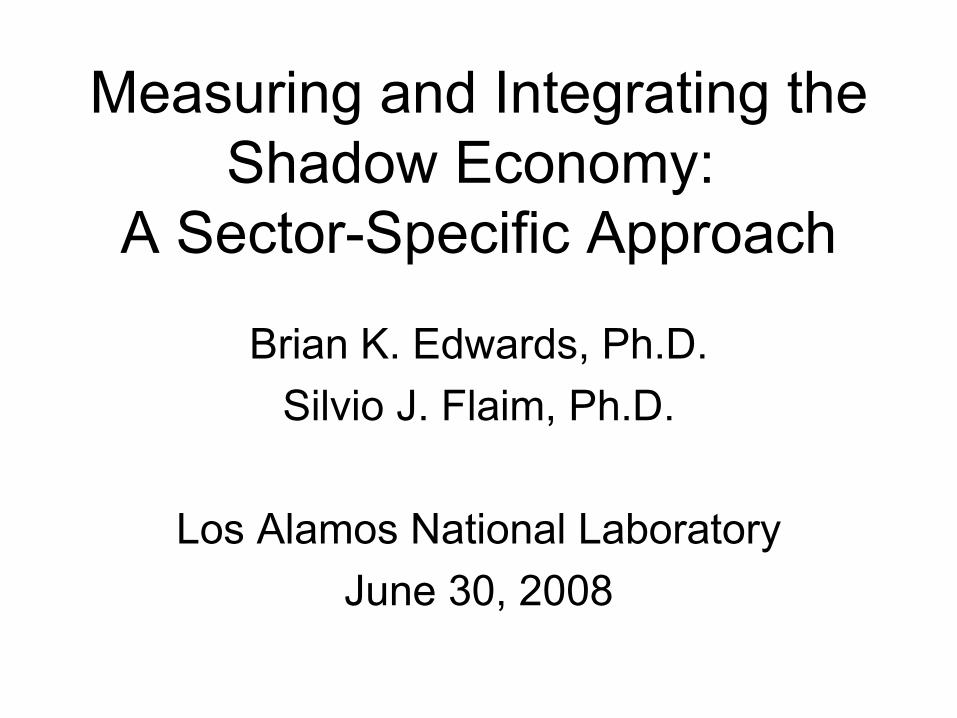
The Scope of Shadow Economy Activity
All do-it-yourself work and neighbor help
Barter of legal goods and services
Employee discounts, fringe benefits
Income from self-employment; Wages, salaries and assets from unreported work related to legal services and goods
Legal Activities in the Shadow Economy
Tax AvoidanceTax EvasionTax AvoidanceTax Evasion
Nonmonetary TransactionsMonetary Transactions
Adapted from Schneider and Enste (2000).
Barter: stolen goods, smuggling, etc. Produce or growing drugs for own use.Theft for own use.
Trade in stolen goods; drug dealing and manufacturing; prostitution, gambling, smuggling (international and inter-state) and fraud.Counterfeiting.Computer system hacking; trading stolen information; identity theft; spamming (?)
Illegal Activities

4
Measuring the Shadow Economy
• Virtually all previous studies on measuring the size of the shadow economy focus on the aggregate shadow economy, usually expressed in terms of the size of the official economy.
• Little or no work attempting to estimate the size of specific shadow economy sectors within the context of the rest of the legal economy.
5
Shadow Economy in US
• Schneider and Enste (2000) estimate the total US shadow economy at between 8 and 10 percent of US GDP, or from $1 to $1.4 trillion.
• Evidence on the size of specific sectors of the shadow economy in the US is largely anecdotal, and does not attempt to analyze how the shadow economy is linked to the official economy.
6
International Comparisons• Estimates of the aggregate shadow
economies of different countries vary widely.• Some examples:
– The shadow economies of Thailand, Nigeria, and Egypt amount to about 70 percent of their respective GDP.
– The shadow economies of Guatemala, Mexico, Panama, and Peru amount to 40 to 60 percent of their respective GDP.
– The shadow economies of the Philippines, Sri Lanka, Malaysia, and South Korea amount to 30 to 50 percent of their respective GDP.
7
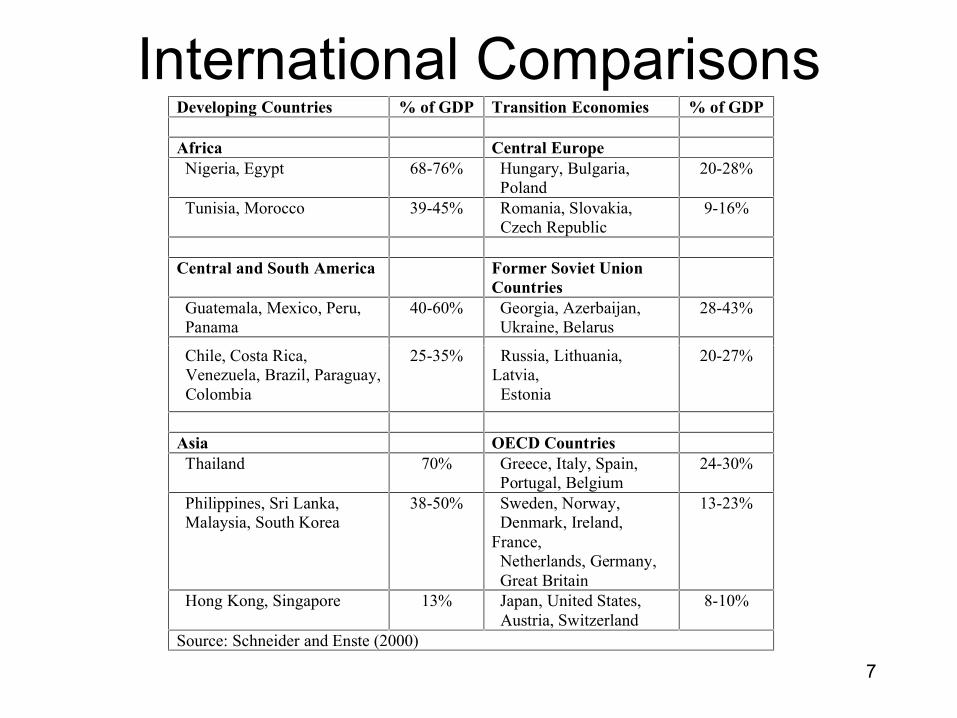
International ComparisonsDeveloping Countries % of GDP Transition Economies % of GDP Africa Central Europe Nigeria, Egypt 68-76% Hungary, Bulgaria,
Poland 20-28%
Tunisia, Morocco 39-45% Romania, Slovakia, Czech Republic
9-16%
Central and South America Former Soviet Union
Countries
Guatemala, Mexico, Peru, Panama
40-60% Georgia, Azerbaijan, Ukraine, Belarus
28-43%
Chile, Costa Rica, Venezuela, Brazil, Paraguay, Colombia
25-35% Russia, Lithuania, Latvia, Estonia
20-27%
Asia OECD Countries Thailand 70% Greece, Italy, Spain,
Portugal, Belgium 24-30%
Philippines, Sri Lanka, Malaysia, South Korea
38-50% Sweden, Norway, Denmark, Ireland, France, Netherlands, Germany, Great Britain
13-23%
Hong Kong, Singapore 13% Japan, United States, Austria, Switzerland
8-10%
Source: Schneider and Enste (2000)

8
Why Shadow Economies Exist• Analysis by Becker (1968) and others suggests that
people engage in shadow economic activity for financial/economic gain, and weigh expected gains with expected costs (factoring in risk) in ways not inconsistent with the predictions of traditional economic theory.
• Some incentive areas include:– Burden of taxes and social insurance contributions– Intensity of regulation– Social transfers– Labor market regulation– Public Sector Services

9
Incentive Issues• Burden of taxes and social insurance contributions
– Differences between total cost of labor in the official economy and after-tax labor earnings provides an incentive to sell labor in the shadow economy.
– Loayza (1997) estimated the size of the shadow economies of 14 Latin American countries and found that greater tax burdens and labor market restrictions increased the size of the shadow economies of those countries.
• Intensity of regulation– Increased regulation reduces individuals’ choices in the
official economy.– Shifting regulatory costs to employees provides incentives
for workers to supply labor to the shadow economy.
10
Incentive Issues (continued)• Social transfers
– The social welfare system can increase the marginal tax rate, thereby reducing incentives to work in the official economy.
– This system can also provide disincentives for individuals receiving welfare payments to seek work in the official economy.
• Labor market regulation– Overregulation and labor costs in the official labor market
are driving forces for the shadow economy (Schneider and Enste, 2000).
– Forced reductions in working hours contrary to employee preferences increases the potential hours they can work in the shadow economy.
11
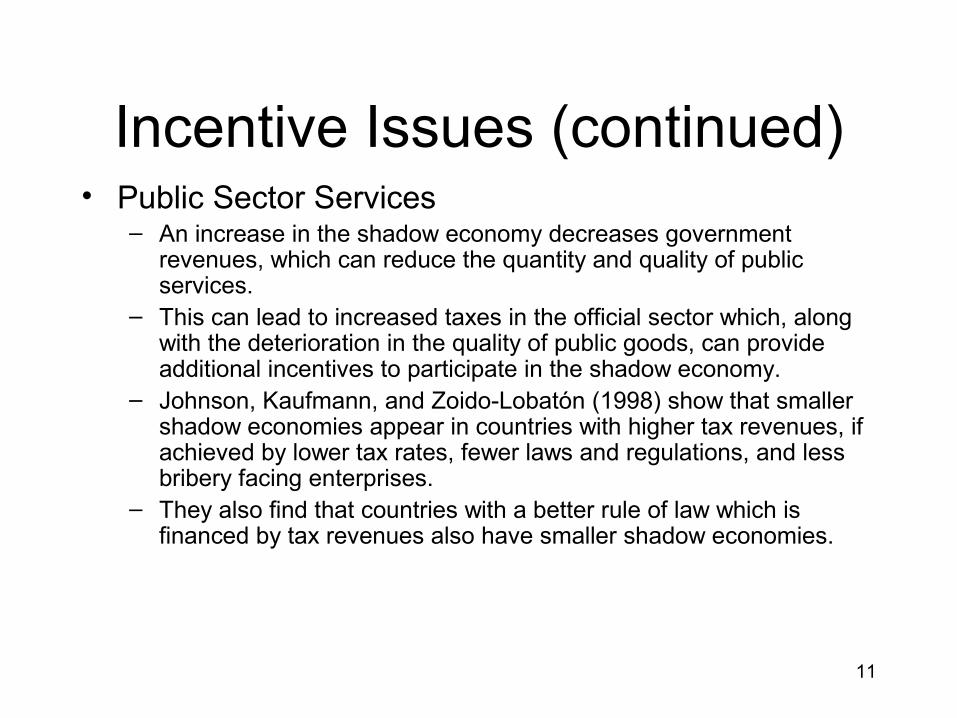
Incentive Issues (continued)• Public Sector Services
– An increase in the shadow economy decreases government revenues, which can reduce the quantity and quality of public services.
– This can lead to increased taxes in the official sector which, along with the deterioration in the quality of public goods, can provide additional incentives to participate in the shadow economy.
– Johnson, Kaufmann, and Zoido-Lobatón (1998) show that smaller shadow economies appear in countries with higher tax revenues, if achieved by lower tax rates, fewer laws and regulations, and less bribery facing enterprises.
– They also find that countries with a better rule of law which is financed by tax revenues also have smaller shadow economies.

12
Shadow-Official Economy Links
• Previous work that attempts to link the official and shadow economies are macroeconomic.
• For example:– Houston (1987) develops a business cycle model
that includes tax and monetary policy linkages.– Adam and Ginsburg (1985) focus on the
implications of the shadow economy on official growth.
13
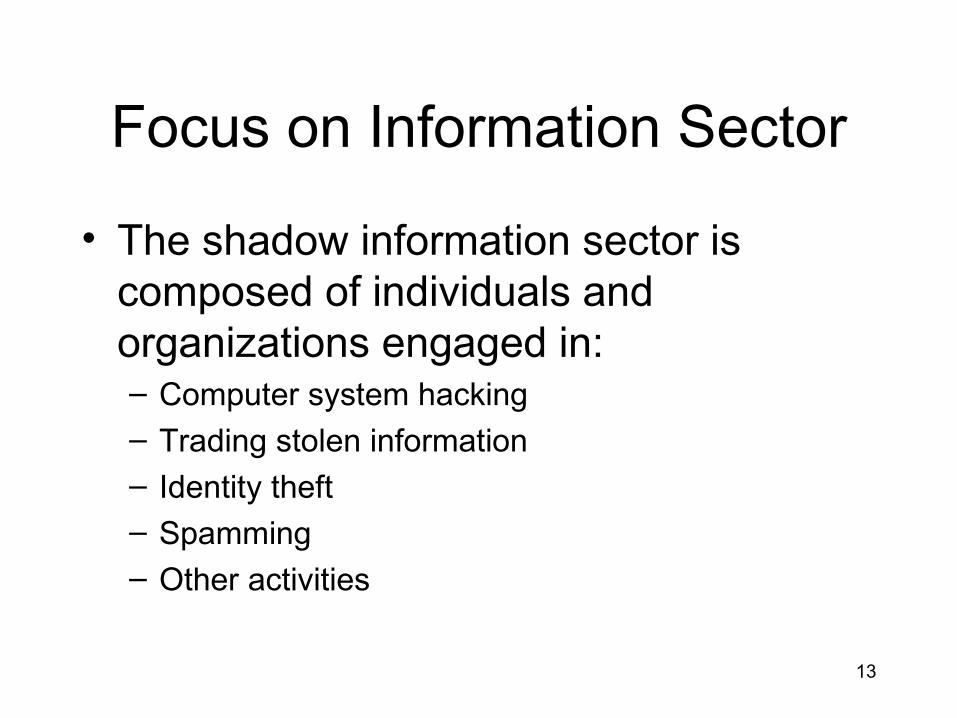
Focus on Information Sector
• The shadow information sector is composed of individuals and organizations engaged in:– Computer system hacking – Trading stolen information– Identity theft– Spamming– Other activities
14
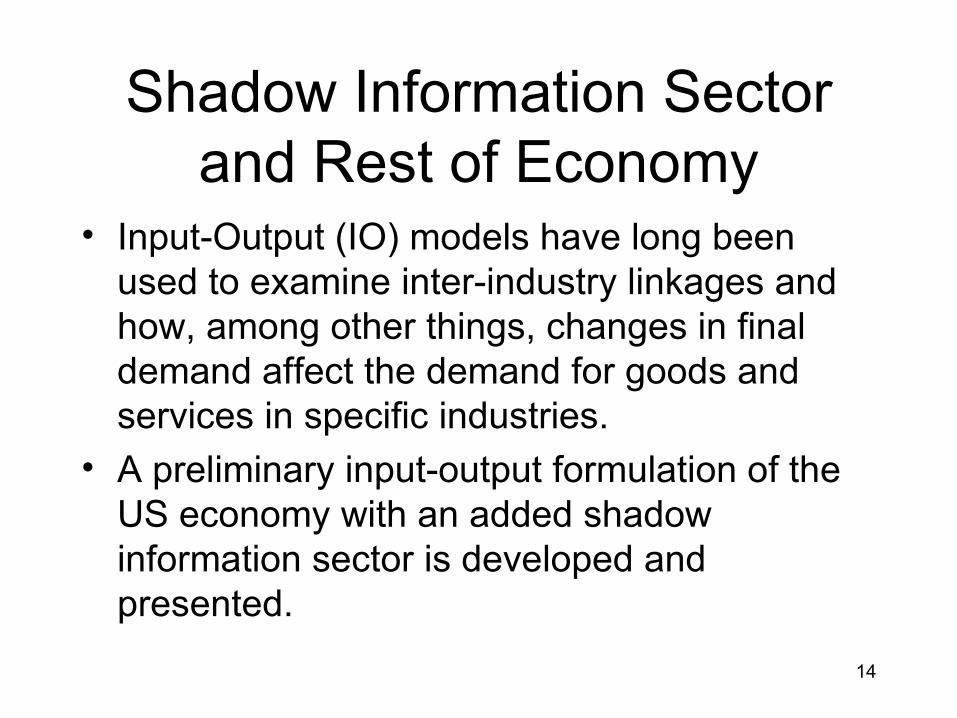
Shadow Information Sector and Rest of Economy
• Input-Output (IO) models have long been used to examine inter-industry linkages and how, among other things, changes in final demand affect the demand for goods and services in specific industries.
• A preliminary input-output formulation of the US economy with an added shadow information sector is developed and presented.
15
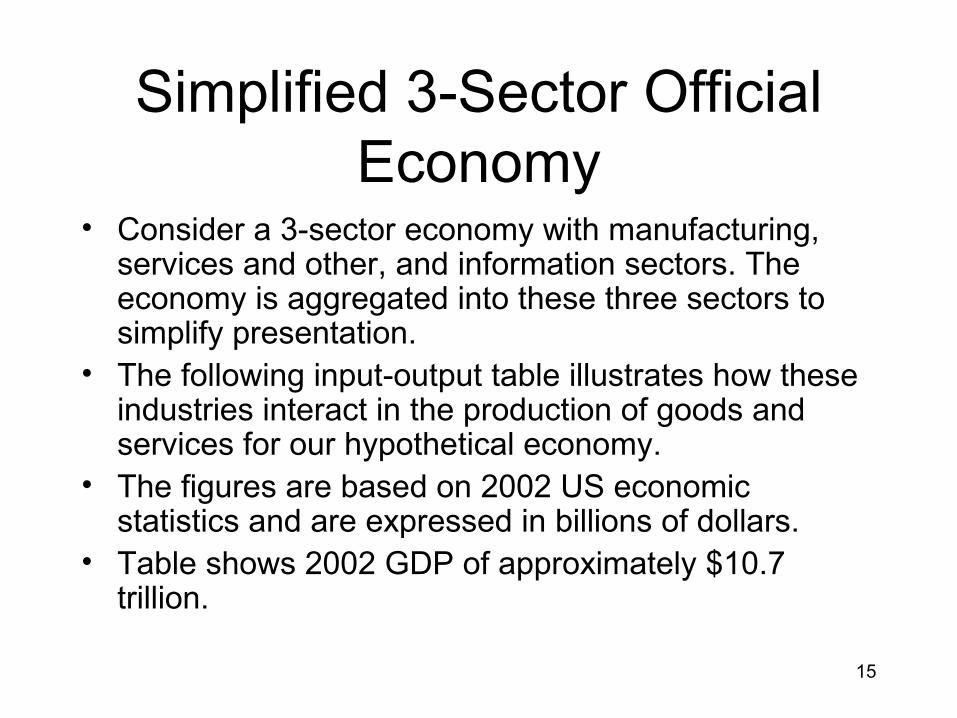
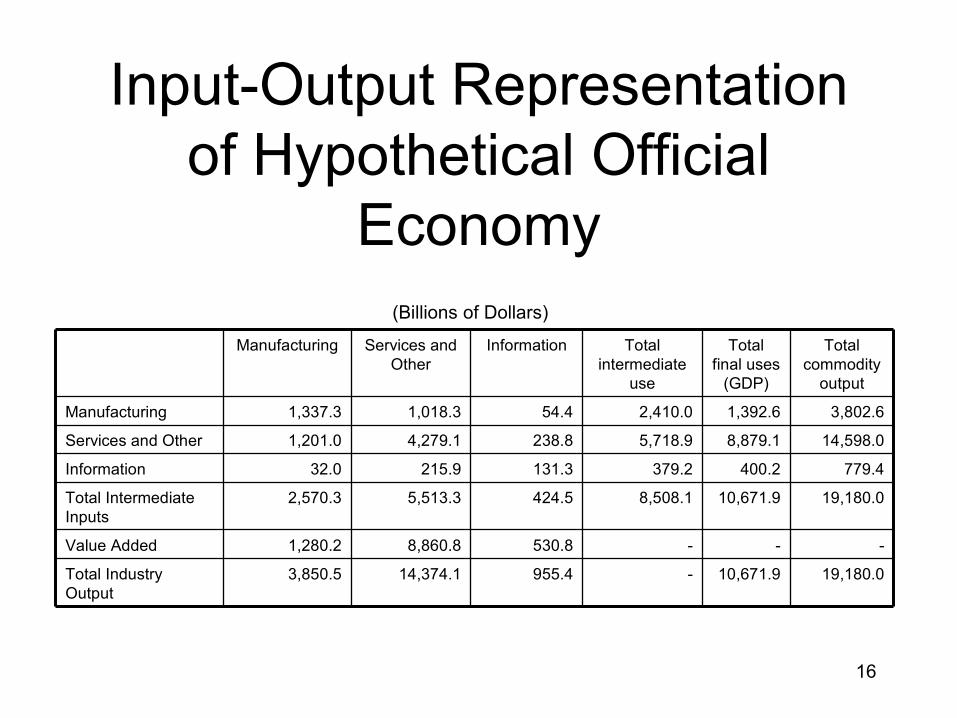
Simplified 3-Sector Official Economy
• Consider a 3-sector economy with manufacturing, services and other, and information sectors. The economy is aggregated into these three sectors to simplify presentation.
• The following input-output table illustrates how these industries interact in the production of goods and services for our hypothetical economy.
• The figures are based on 2002 US economic statistics and are expressed in billions of dollars.
• Table shows 2002 GDP of approximately $10.7 trillion.
16
Input-Output Representation of Hypothetical Official
Economy
19,180.010,671.9-955.414,374.13,850.5Total Industry Output
---530.88,860.81,280.2Value Added
19,180.010,671.98,508.1424.55,513.32,570.3Total Intermediate Inputs
779.4400.2379.2131.3215.932.0Information
14,598.08,879.15,718.9238.84,279.11,201.0Services and Other
3,802.61,392.62,410.054.41,018.31,337.3Manufacturing
Total commodity
output
Total final uses
(GDP)
Total intermediate
use
InformationServices and Other
Manufacturing
(Billions of Dollars)

17
Simplified 4-Sector Economy with Shadow Information Sector
• Now consider two versions of the economy with an additional shadow information sector that accounts for either 1 or 3 percent of official information sector output.
• In constructing this table, we do not change the other inter-industry transactions, even though these would likely change given the overall reconstitution of economic activity that would occur.
• The 1 to 3 percent range comes from the OECD report Measuring the Non-Observed Economy: A Handbook (2002) and are based on their lower- and upper-bound estimates of the size of the hacker economy in developed countries.
• For the 1-percent case, the following input-output table illustrates how industries interact in the production of goods and services.

18
Economy with Hacker Sector: 1-Percent Case
(Billions of Dollars)
19,302.910,784.89,261.011.5962.014,464.93,863.6Total Industry Output
742.85.3536.18,949.51,293.0Value Added
19,302.910,784.88,518.26.2425.95,515.52,570.6Total Intermediate Inputs
11.96.25.82.01.32.20.3Shadow Information Sector
784.7404.2380.51.3131.3215.932.0Information
14,689.28,967.95,721.32.4238.84,279.11,201.0Services and Other
3,817.11,406.52,410.60.554.41,018.31,337.3Manufacturing
Total commodity
output
Total final uses
(GDP)
Total intermediate
use
Shadow Information
Sector
InformationServices and Other
Manufacturing

19
Discussion: 1-Percent Case• This hypothetical example shows possible interactions
between the official and shadow economies.• 2002 GDP is higher by a little over one percent ($10.75
trillion) since we now include an an additional sector in the GDP calculation which were are now measuring.
• This example only shows addition of shadow information sector. Other shadow sectors could be added.
• This example does not show other kinds of burdens imposed on the economy, such as additional spending by firms to monitor and prevent hacking activity.
• Spending by firms to offset hacking would show up as higher expenditures by industries on output produced by the official information sector and possibly on other sectors.

20
Economy with Hacker Sector: 3-Percent Case
(Billions of Dollars)
19,549.011,010.79,291.734.6975.314,646.43,889.9Total Industry Output
753.515.9546.89,126.71,318.6Value Added
19,549.011,010.78,538.218.7428.55,519.82,571.2Total Intermediate Inputs
36.118.717.46.03.96.51.0Shadow Information Sector
795.4412.2383.23.9131.3215.932.0Information
14,871.59,145.55,726.07.2238.84,279.11,201.0Services and Other
3,846.11,434.42,411.61.654.41,018.31,337.3Manufacturing
Total commodity
output
Total final uses (GDP)
Total intermediate
use
Shadow Information
Sector
InformationServices and Other
Manufacturing
21
Discussion: 3-Percent Case• 2002 GDP is higher by a little over three percent ($11.01 trillion)
since we now include an an additional sector in the GDP calculation which were are now measuring.
• These examples, though largely hypothetical, give us some sense of how adding a shadow information sector would affect the national income and product accounts using the IO framework.
• We could also add additional shadow components of other industries. Illegal drug manufacturing would, for example require additional shadow agricultural and shadow manufacturing sectors (as well as possible wholesale and retail sectors).

22
Employment in the Hacker Economy
• According to the US Bureau of Labor Statistics (BLS), 2007 employment in the entire information industry was a little over 3 million persons, which is somewhat less than the 3.4 million employed in 2002.
• If we apply the one percent figure that was used above to estimate the size of the shadow economy, we get an estimate of 2002-shadow information industry employment of 33,950 persons.
• The higher-end estimate of 3 percent of information industry output to estimate employment in the shadow information sector yields a 2002 estimate of a 101,850 persons, but the same caveats apply.
• However, this estimate must be treated with caution; a better method of estimating employment might be to develop estimates from the bottom-up, i.e., based on estimates of employment in each of part of the shadow information sector and then combining these estimates.

23
Summary and Conclusions• One complication associated with developing reliable and stable
estimates of the size of the hacker economy is that it is a sector that is in a continual state of flux; it changes as innovations occur in a highly innovative industry and the kinds of innovations that occur in the information sector are particularly difficult to forecast or foresee.
• More detailed information on the different hacker activities could be obtained with additional research and these estimates could be integrated into the broader economic framework discussed here.
• Progress on this front would also make measuring the burden that the various forms of hacking cause to the overall economy and to individual industries possible.
• Additional analysis can include applying using the methodology developed here and refined further to other countries and using those comparisons to adjust estimates of trade between countries. This is not only important for improving the quality of information about comparative economic activity between countries, but could also see application in analyzing vulnerabilities to the US economy that result from hacker activity in foreign countries.

24
Selected References• Adam, Markus C. and Victor Ginsburg. 1985. “The Effects of Irregular Markets
on Macroeconomic Policy: Some Findings for Belgium,” European Economic Review, 29:1, pp. 15-33.
• Becker, Gary S. 1968. “Crime and Punishment: An Economic Approach.” Journal of Political Economy. 76, no. 2 (March/April), pp. 169-217.
• Houston, John F. 1987. “Estimating the Size and Implications of the Underground Economy,” Working Paper 87-9, Federal Reserve Bank Philadelphia.
• Johnson, Simon; Daniel Kaufmann, and Pablo Zoido-Lobatón. 1998. “Regulatory Discretion and the Unofficial Economy,” American Economic Review, 88:2, pp. 387-92.
• Loayza, Norman V. 1997. “The Economics of the Informal Sector: A Simple Model and Some Empirical Evidence from Latin America.” World Bank Policy Research Department Working Paper 1727.
• Organization for Economic and Cooperation and Development (OECD). 2002. Measuring the Non-Observed Economy: A Handbook. Paris, France.
• Schneider, Frederick and Dominick H. Enste. 2000. “Shadow Economies: Size, Causes, and Consequences,” Journal of Economic Literature, Vol. XXXVIII (March), 77-114.
• United Nations. 1999. Handbook of Input-Table Compilation and Analysis. New York.